Article

Experimental Study on Factors Influencing the Strength Distribution of In Situ Cemented Tailings Backfill

1
BGRIMM Technology Group, Institute of Mining Engineering, Beijing 100160, China
2
National Center for International Joint Research on Green Metal Mining, Beijing 100160, China
*
Author to whom correspondence should be addressed.
Metals 2021, 11(12), 2059; https://doi.org/10.3390/met11122059
Submission received: 16 November 2021 / Revised: 16 December 2021 / Accepted: 16 December 2021 / Published: 20 December 2021
(This article belongs to the Special Issue Green Low-Carbon Technology for Metalliferous Minerals)

Abstract

:
Previous studies have found that the strength of in situ cemented tailings backfill usually presents an S-shaped distribution, which decreases first, then increases, and decreases thereafter along the direction of slurry flow. In this study, to explore the factors determining the distribution, a similar model test of cemented tailings backfill was carried out. The distribution law of grain size composition and the cement content of backfill materials along the flow direction were experimentally studied, and the comprehensive factor influencing the strength distribution was analyzed. The results show that, firstly, near the feeding point, there are more coarse particles, whereas the content of fine particles is higher farther away. The measured maximum median particle size can be more than three times the minimum value. Secondly, the cement content increases gradually along the flow direction and reaches the peak at the end of the model, which can be more than twice the minimum value, indicating that the degree of segregation is significant. Thirdly, the strength distribution of cemented backfills is comprehensively determined by both the particle size distribution (PSD) and the cement content. The maximum value appears neither at the point with peak median particle size, nor at the point with the highest cement content. Lastly, there is a strong linear correlation between the strength of cemented backfills and the strength factor (SF), which is defined as the product of the uniformity coefficient and cement content of filling materials, indicating that the SF can be used to quantitatively reflect the comprehensive effects of PSD and cement content on the strength. As SF is a comprehensive quantitative index reflecting the distribution of strength, it will be further studied in later research to acquire more experimental results of the relationship between sample strength and SF, which will be meaningful for the quality evaluation of in situ cemented backfills, and the optimization of backfill system.

1. Introduction

Mining with backfill can effectively utilize the solid wastes of mines to prepare backfill slurries/pastes and backfill them into mined out voids, such that the purposes of waste management, stope backfilling, and surface subsidence control can be achieved [1,2,3]. Cemented tailings backfill (CTB) is a widely applied backfill method in China. The backfill slurry of CTB mainly consists of tailings, cementitious materials (commonly cements), water, and other additives (such as flocculants or plasticizers) [4,5]. Once all the ingredients are well mixed, the prepared backfill slurries are transported and backfilled into stopes through pipelines. Therefore, to guarantee the flowability and transportability of slurries, the solid content of slurries should be suitable, and all backfill materials should be suspended in and move with the slurries [4,6,7]. When backfill slurries are placed into a stope, because of the gravity acting on solid materials and the influence of the environment, the materials will flow along the stope and form a slop shape, whereas, along the settling direction, the suspended solid materials will segregate and be rearranged as a function of the material properties. The flowing and segregation of suspended materials will absolutely lead to inhomogeneities of the backfill body after cement hydration, thus affecting the strength distribution of CTB in the stope [8,9,10]. This inhomogeneous strength distribution of CTB will have adverse impacts on the further analysis of the stability of cemented backfills, as it is commonly treated as a homogeneous material [11,12]; it may even result in hidden hazards, thereby endangering safe production in the mine. Thus, to adequately evaluate the inhomogeneities and control the related hazards, it is important to study the principles and factors affecting the flowing and segregation mediating the inhomogeneous strength distribution of CTB.
There have been some studies focusing on the inhomogeneous strength distribution of CTB. By drilling coring holes to obtain in situ samples, Le [13] and Thompson [14] directly studied the inhomogeneities of CTB including the strength distribution, permeability, porosity, and pore water pressure. Similarly, Gan [15] and Wei [16] obtained in situ CTB cores from a mine and systematically studied the strength distribution of cores along the flowing direction. They all experimentally proved that the strength of in situ CTB is not a fixed value but varies along with the flowing and settling direction. In addition to drilling in situ CTB cores, similar model tests are accepted as a valuable study method. Ghirian [17,18] built a wooden cube model with the same size ratio as a real mine and used the prepared tailings paste to backfill the model to simulate and analyze the backfilling process. The flume model [8,19,20,21] has also been widely utilized to simulate and test the flowing process of backfill slurries. By launching flume tests, Xu [22] studied the strength distribution of CTB along the flowing direction and found that the strength did not vary linearly; instead, the distribution commonly has three phases, namely it decreased first, then increased to a certain value, and decreased thereafter to the end, presenting an S-shaped distribution. Lu [23] and Li [24] carried out tailings flume tests and identified a similar S-shaped distribution of strength. Shi [25] tested and compared the uniaxial compressive strength (UCS) of a series of backfill cores obtained from a copper mine and concluded that, for real backfilled stopes, along the flowing direction, there is also an S-shaped fluctuation of the strength distribution.
The aforementioned studies uncovered a non-linear distribution of CTB strength, but few researchers have explored the reasons for and mechanism of this distribution. Li [26,27] discussed and attributed this distribution mainly to the inhomogeneities of cement content. However, as a result of settling and segregation, the particle size distribution (PSD) of tailings will also vary dramatically, as revealed in the study by Yilmaz [28], which found that, near the feeding point, the content of coarse tailings is much higher than that of fine tailings, and vice versa. Wu [29] pointed out that the inhomogeneous distribution of tailings PSD can affect the microstructure of cemented paste backfill (CPB) and, thus, its strength; when the PSD matches the Talbol theoretic curve, the strength reaches its peak. Fall [30] and Ke [31] studied the effects of fine tailings on the hydration of cement and found that the increase in fine tailings content may have a negative impact on strength development. Furthermore, Yilmaz [32,33] described how the pore structures and porosities of cemented backfills can affect the structural response in UCS tests and, therefore, the strength. Therefore, it can be concluded that the inhomogeneous strength distribution is a result of various factors, including the distribution of cement content, tailings PSD, and porosity.
Taking into account the above research results, in this study, to quantitatively analyze the S-shaped distribution of CTB strength, a flume model test was carried out, and both the cement content and the tailings PSD of samples obtained along the slurry flowing direction were determined. By comparing and analyzing the experimental results, the reasons for the S-shaped distribution of CTB are discussed, and a relatively effective parameter is fitted to describe the comprehensive influences of backfill materials on the strength distribution.

2. Experimental Program

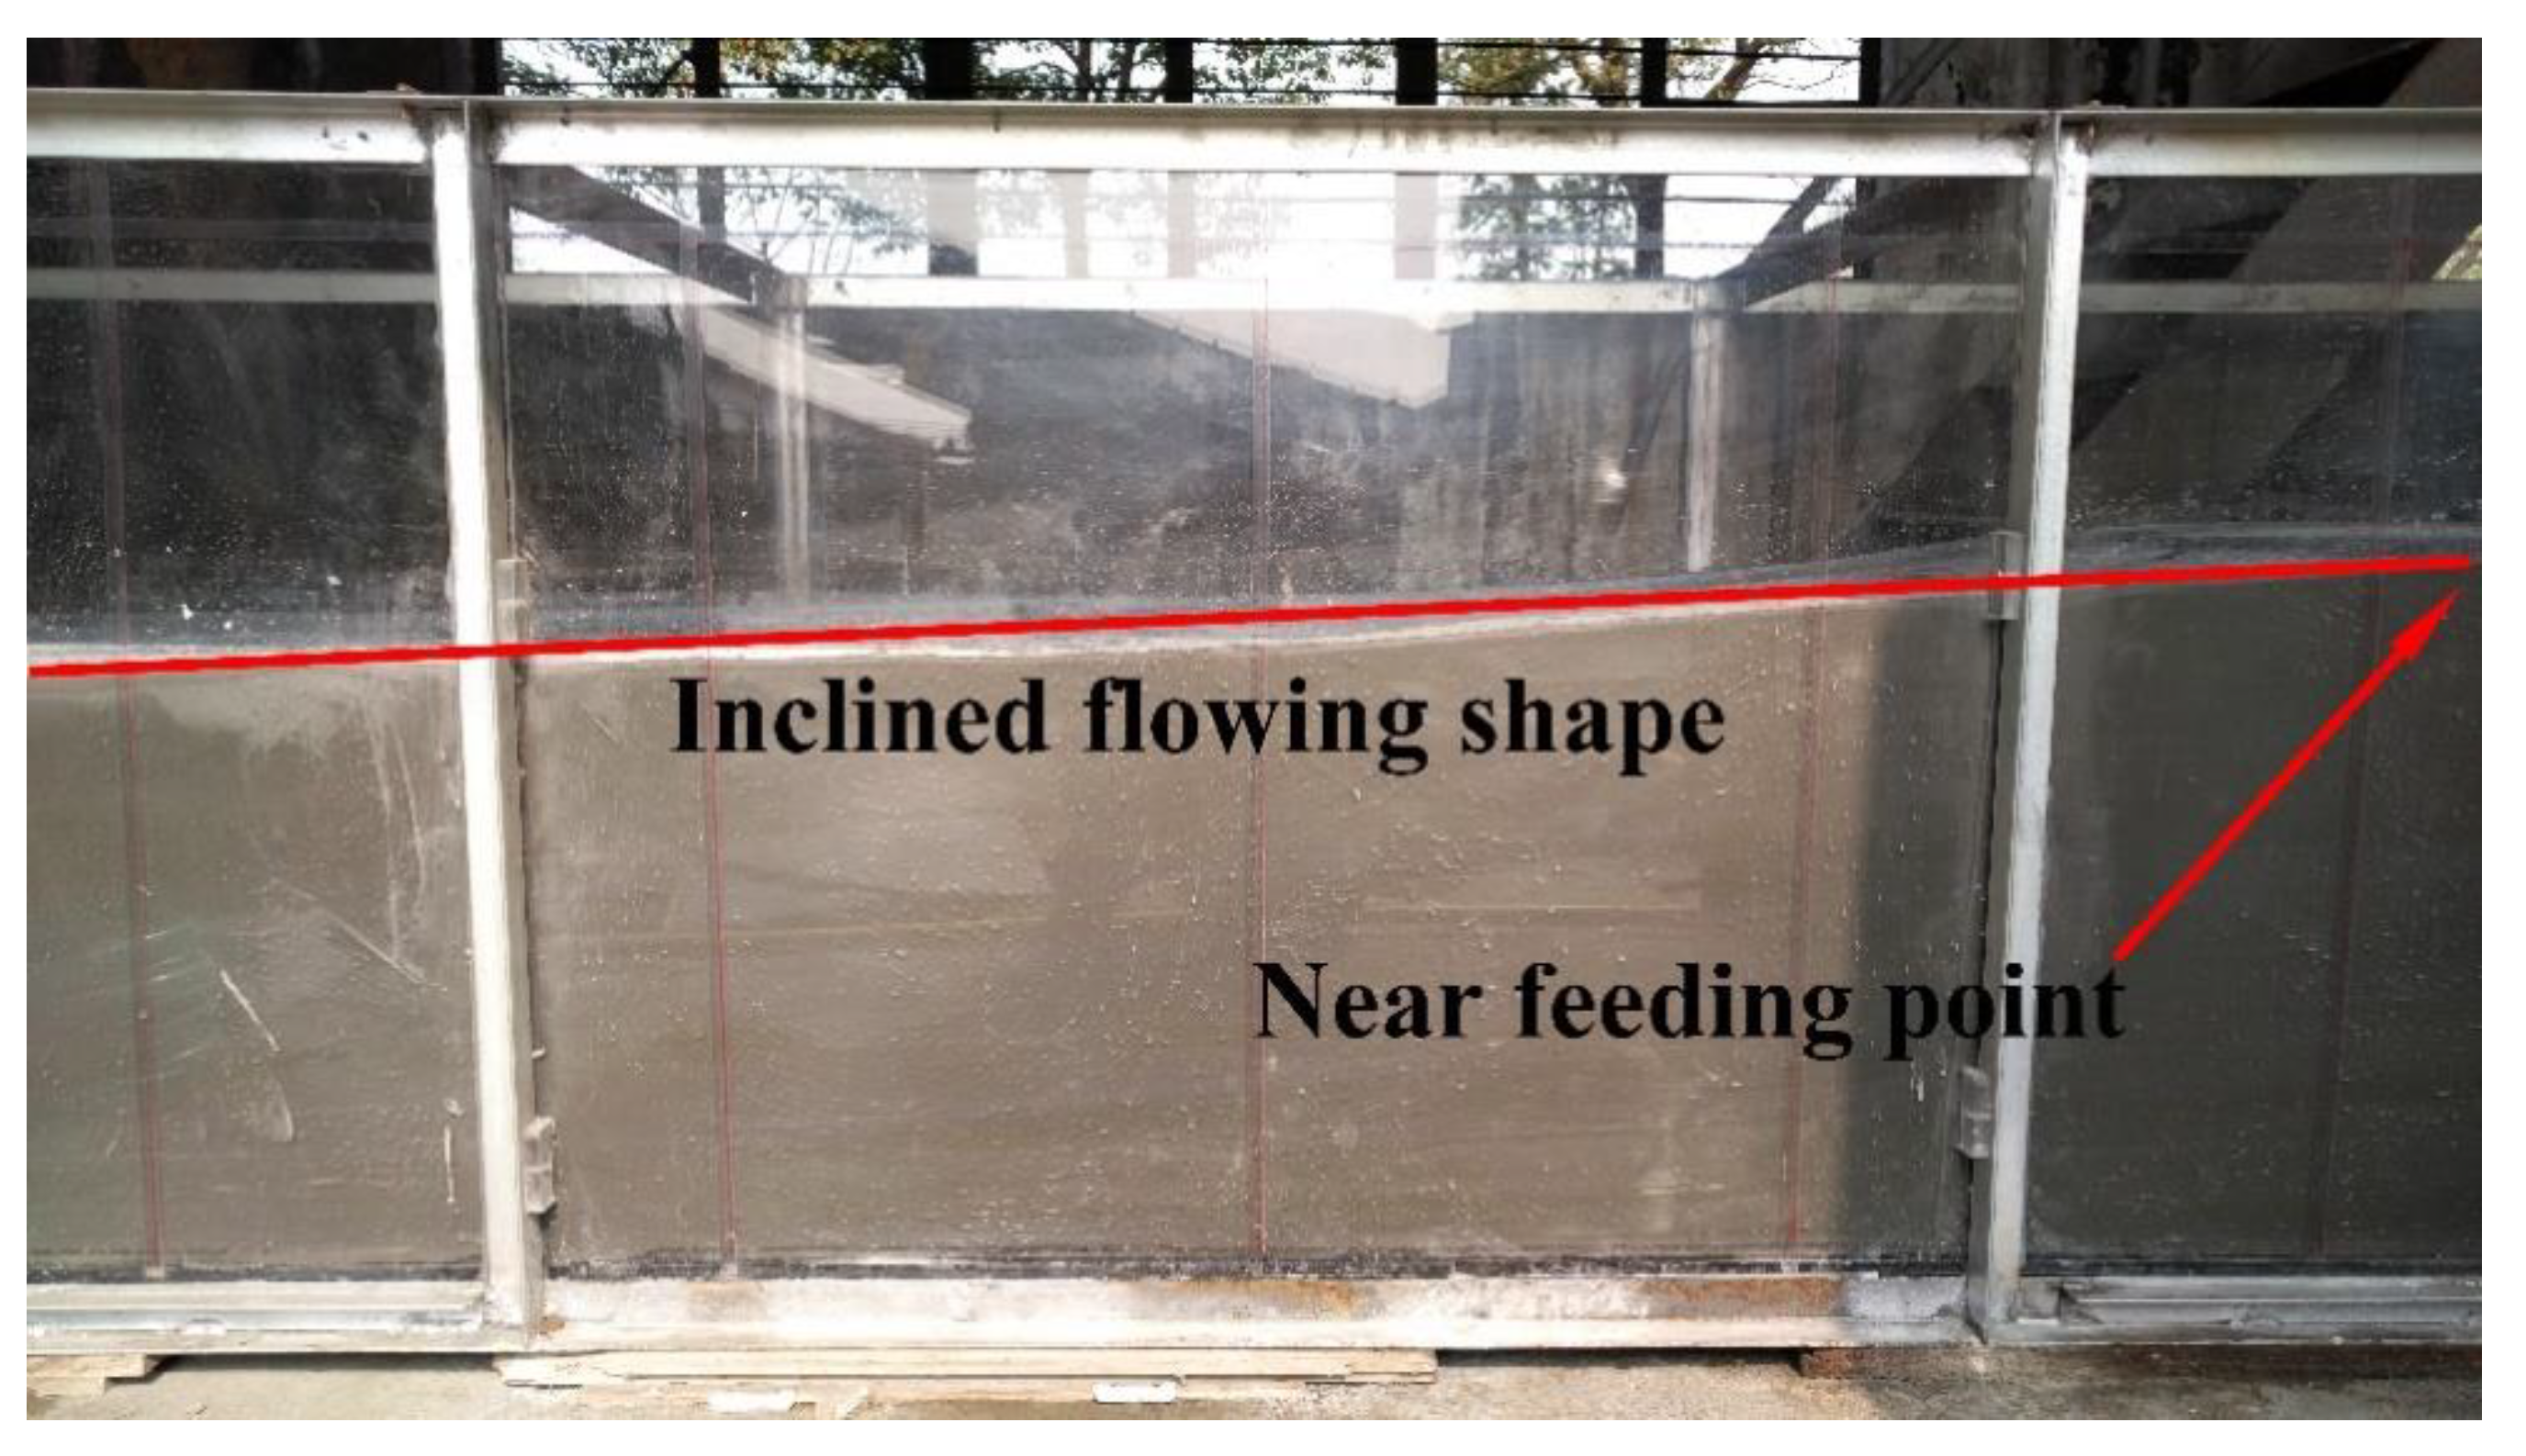
2.1. Design of Flume Model Test System

The flume model, with reference to the measured size of a real stope (50 m × 15 m, L × W), was designed as 3.3 m × 1 m × 0.8 m (L × W × H), using a 15-fold reduction. A picture of the flume model is shown in Figure 1a.
In addition to the flume model, the test system consisted of a small silo and a tailings mixer. The tailings slurries were supplied by a mineral processing plant and transported through pipelines into the small silo. Then, the settled tailings in the silo were pumped into the mixer along with cement to prepare backfill slurries. After mixing, the backfill slurries were fed into the flume model to simulate the backfilling process. The test system is shown in Figure 1b.
To simulate the real backfilling and slurry flowing process, the feeding rate was set to match the similarity criterion [34,35,36]. The backfill rate of the reference mine is 200 m3/h (similar to a real mine backfilling system), and the transport pipeline is a steel pipe DN100 (diameter 100 mm). During the backfilling process, the slurries are mainly affected by gravity. Therefore, the feeding rate of the flume model was calculated accordingly, yielding a value of 3.82 L/min.

2.2. Materials Used

This study mainly focuses on the simulation of the real backfilling process, while testing and analyzing the influence factors of the non-linear CTB strength distribution. Therefore, the ingredients were similar to the reference mine, including tailings, binders, and mixing water, with no other additives or aggregates.
The tailings utilized were unclassified and obtained from the reference mine. The tailings samples were dried at 105 °C first for 24 h, and then grained to match the sample requirements of components analysis. The chemical properties of the tailings were tested using an ICP-OES (inductively coupled plasma emission spectrometer). The brand of this apparatus was Agilent 725-ES from Agilent company Santa Clara, California, America, and the detection limit of each element was under 0.01 ppm. This apparatus is widely utilized in the chemical component analysis of solid materials (including tailings) [37,38].
The test results are presented in Table 1.
As shown in Table 1, the main component of the tailings was SiO2 (41.4 wt.%), whereas the content of SO3 was less than 4 wt.%, indicating that the sulfate effects could be neglected [39]. Therefore, the tailings were suitable for backfilling.
The initial PSD of the tailings was monitored using a laser particle size analyzer (Mastersizer 2000 series from Malvern company, Worcestershire, United Kingdom), and the results are presented in Figure 2 and Table 2.
From Figure 2, it can be found that the diameters of more than 40% of the tailings were smaller than 20 μm, indicating several fine particles. Moreover, as shown in Table 2, the D10 and D60 values of tailings were 2.47 and 37.61 μm, respectively; thus, the coefficient of uniformity (Cu), i.e., the quotient of D60 and D10, was approximately 15.22 (much larger than 5), indicating a large disparity between coarse and fine tailings.
The binder used in this study was PO 42.5 Portland cement, which is the binder typically used in the reference mine. As the chemical effect of mixing water was not the topic of this study and the consumption of water was large in this flume test, tap water was used to prepare the slurries.

2.3. Mix Recipes and Feeding Method

The mix recipes of slurries were in line with the bottom layer backfill recipe of the reference mine. The solid content of slurry was 70 wt.%, and the cement content was 20% of the total solid mass. This cement content is much higher than ordinary, because it is only used for the bottom layer to guarantee the safety of bulkheads. In this study, a higher cement content would allow for a larger difference in CTB strength distribution to be derived, which is beneficial for testing and analysis.
The supply rate was calculated as 3.82 L/min. As shown in Figure 1b, the mixer was placed at a higher position than the flume model, and the prepared backfill slurries flowed via pipes to the feeder due to gravity. To ensure relatively stable feeding, there was a large funnel at the end of the pipes to balance the supply and feeding rate. After passing through the funnel, the backfill slurries flowed into the flume model to simulate the real backfilling process. The test continued until the tailings in the silo were used up.

2.4. Testing and Monitoring

2.4.1. Sampling Scheme

To evaluate the changes in properties along the flowing direction, three rows of samples, parallel to the slurry flow direction, were evenly arranged and obtained. Each sample was labeled with the row number and sampling hole number; for example, 2-1 denotes that the sample was derived from the first sampling hole of row 2. The details of the sampling hole positions and intervals are illustrated in Figure 3.
As plotted in Figure 3, row 2 was set at the center of model, whereas rows 1 and 3 were placed on either side of row 2 with the identical interval of 0.2 m. Nine sampling holes were drilled evenly in row 2 with an interval of 0.4 m. The cement content, PSD, and UCS of these samples were tested and recorded. By contrast, five sampling holes were drilled evenly in row 1 and row 3 with an interval of 0.8 m. The cement content of these samples was tested and recorded. By comparing the measured results of samples at the same distance from the feeding point but in different rows, the reliability and stability of the testing method and results could be rechecked and ensured.

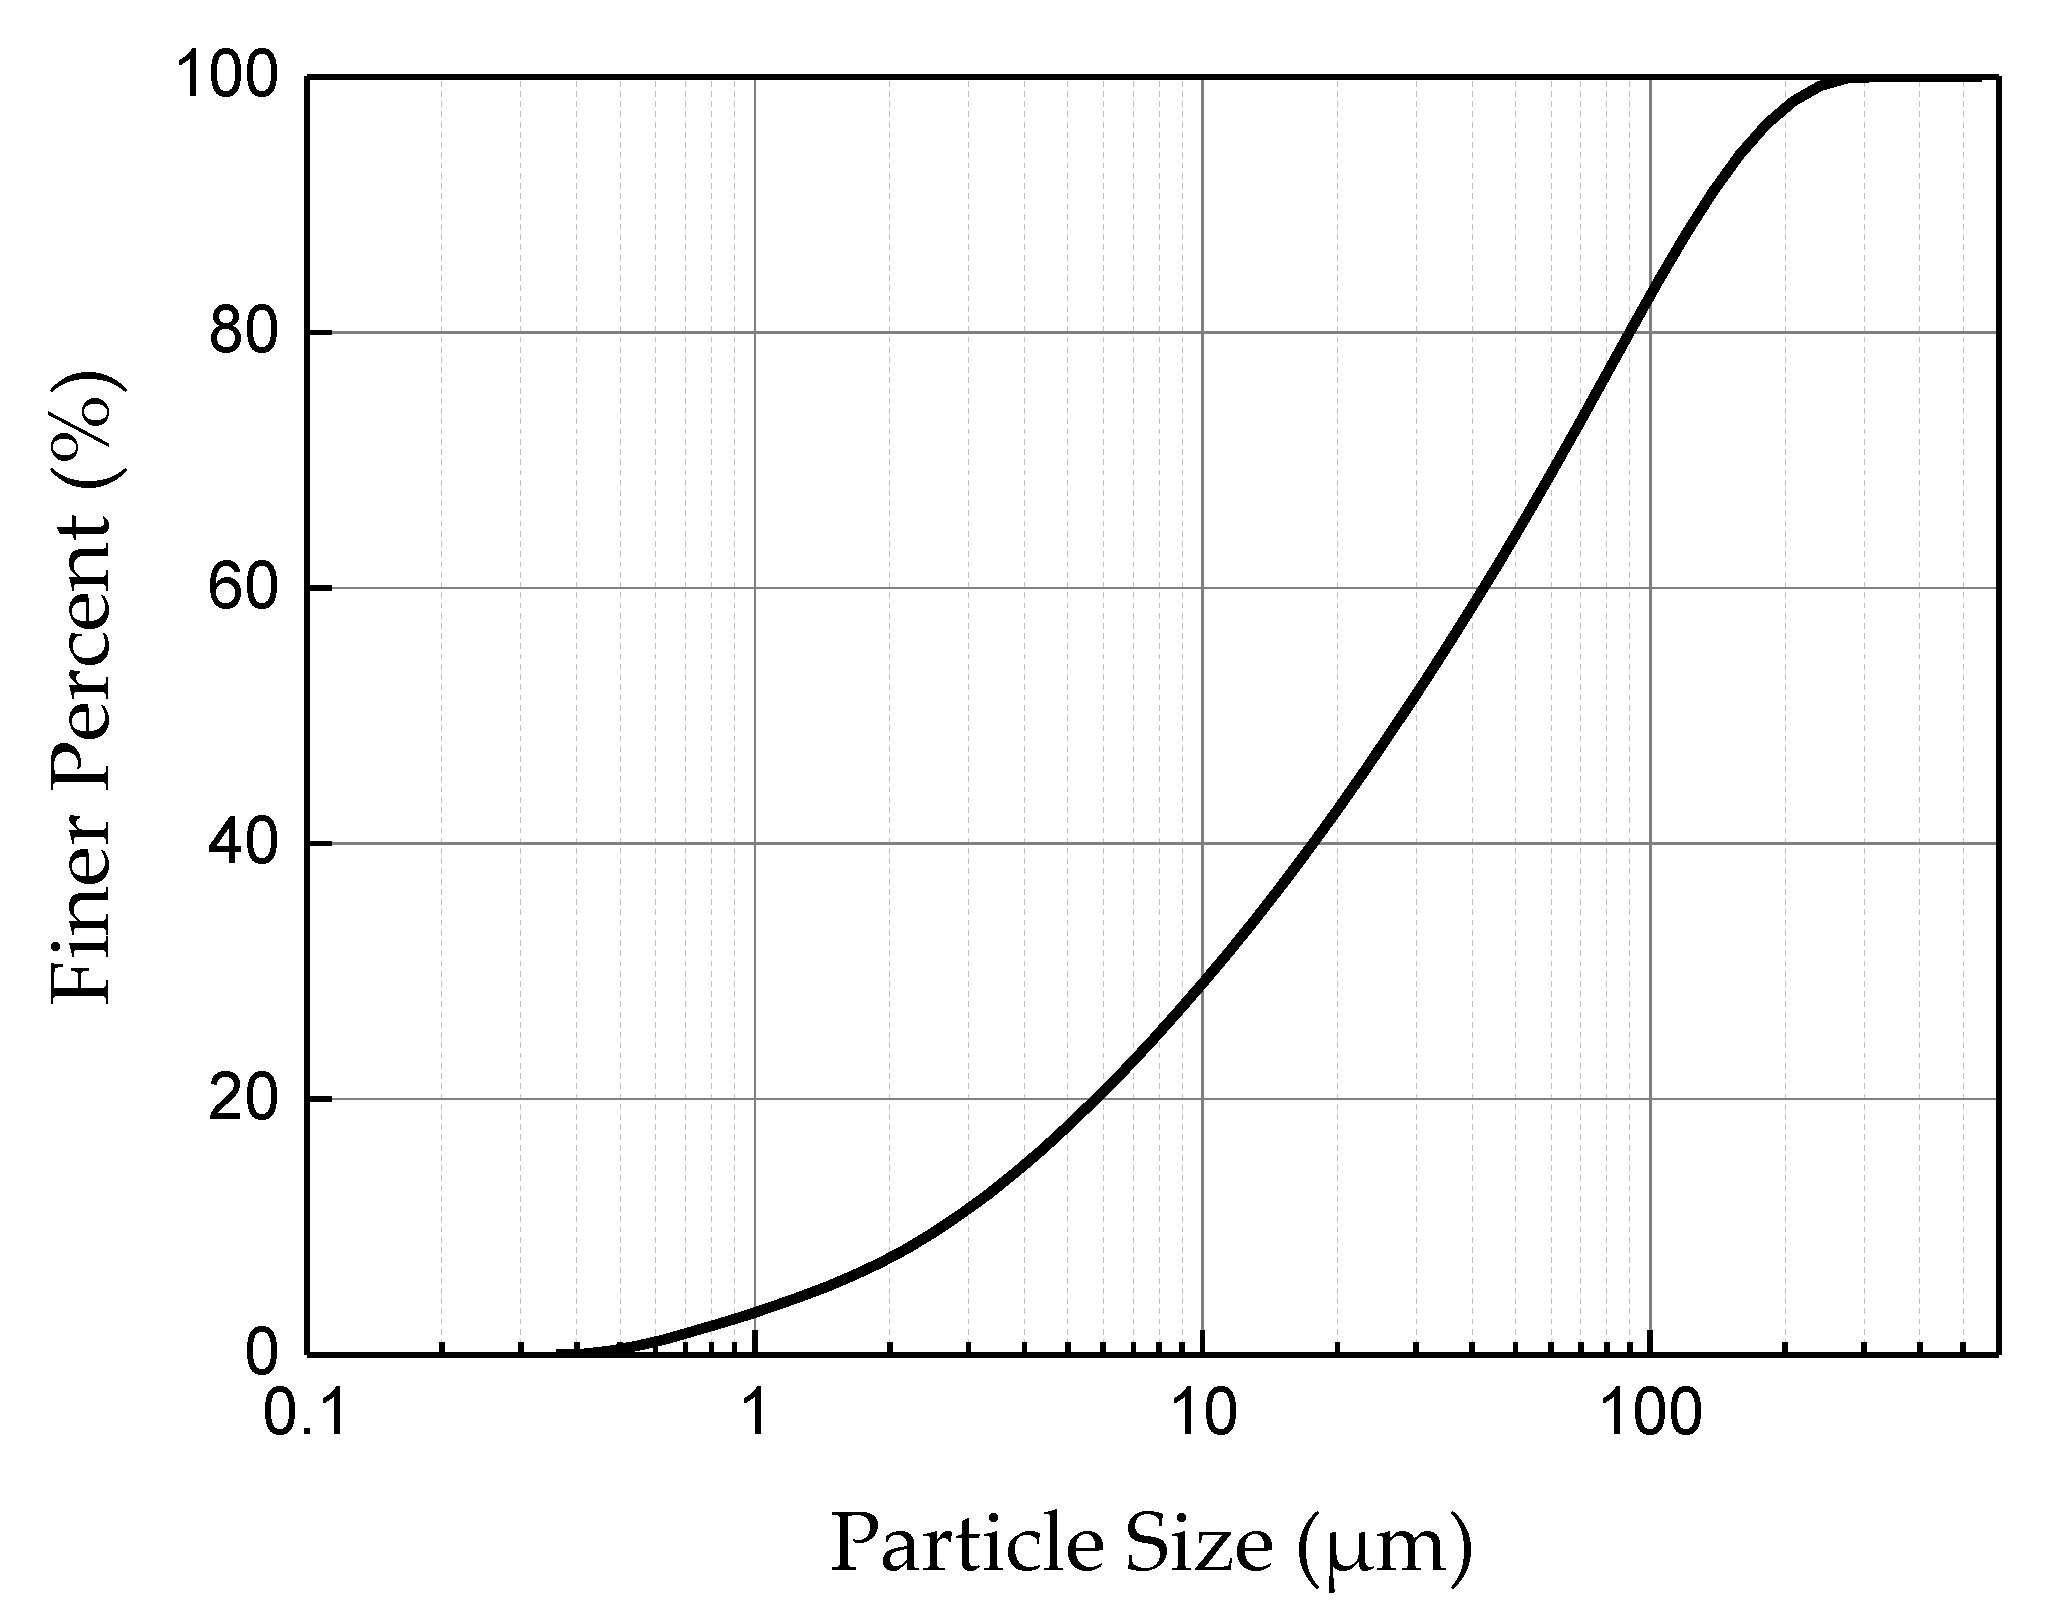
2.4.2. Particle Size Distribution (PSD) Monitoring

Because of the addition of cement, the sampling process needed to be quick, and some pretreatments were applied to prevent cement hydration. Once the flowing of slurries was completed, samples were quickly taken from the nine positions in row 2 (see Figure 3). To prevent cement hydration, the nine samples were soaked in absolute ethanol for 12 h. Subsequently, the samples were placed in a drying oven at 105 °C for 24 h. Thereafter, the PSD of each sample was monitored using a laser particle size analyzer.

2.4.3. Cement Content Monitoring

The cement content of each sample was monitored via titration with EDTA-2Na, which is a standard cement content test method for cement-based materials [40]. It is a chemical measurement method, using 10 wt.% NH4Cl solution to react with Ca(OH)2, the main hydration product of cement, thus generating CaCl2. Then, using an EDTA-2Na standard solution, the amount of Ca2+ produced from the dissolution of CaCl2 could be titrated and measured, thereby reflecting the cement content of the sample. Chen [41] experimentally proved the applicability of this method for the cement content measurement of CTB.
Once the flowing of slurries was completed, nine samples were taken from row 2 and five samples were taken from rows 1 and 3 at the designated positions. Each sample was more than 300 g. The samples derived from row 2 were tested to evaluate the effects of cement distribution on the UCS, whereas the measurement results of samples from rows 1 and 3 were used to validate the reliability of this test method.

2.4.4. Uniaxial Compressive Strength (UCS) Testing

One day (24 h) after the flume test was completed, nine sampling cores from row 2 were drilled, and each core was machined into at least two specimens (diameter 5 × length 10 cm). Thereafter, the derived specimens were placed in a curing room at 25 ± 5 °C and a relative humidity of 95% ± 5% for 60 days. After curing, the UCS of each sample was measured using an HM-5030 uniaxial loader. The load cell of this apparatus has a measurement range of 0–50 kN and an accuracy of ±0.01 kN, thus meeting the UCS testing accuracy requirements.

3. Results and Discussion

3.1. Strength Distribution of Cemented Tailings Backfill (CTB)

The flume test was carried out following the proposed scheme, and the final profile of backfill slurries is presented in Figure 4. Backfill materials gathered in greater abundance near the feeding point in contrast to the far end, resulting in an inclined shape.
As a result of the inclined shape, the sampling cores near the feeding point were longer than those obtained at the far end, whereby even the shortest core could be machined into two standard specimens, thus fulfilling the requirements of UCS testing. The specimens obtained and the UCS testing process are presented in Figure 5.
The UCS of each specimen was tested and collected, which can be seen in Table 3. Using the position of the feeding point as the origin, the distance from the sampling point to the feeding point as the abscissa value, and the derived UCS as the ordinate value, the distribution of strength along the flowing direction is plotted in Figure 6.
Figure 6 shows that, along the flowing direction, the minimum and maximum values appeared at 0.8 m and 2.4 m away from the feeding points, i.e., 2.40 MPa and 4.13 MPa, respectively. Furthermore, it can also be seen that the values fluctuated along the flowing direction, decreasing first, then increasing for a while, and decreasing thereafter, resulting in an S-shaped UCS distribution, consistent with the aforementioned results in the literature.

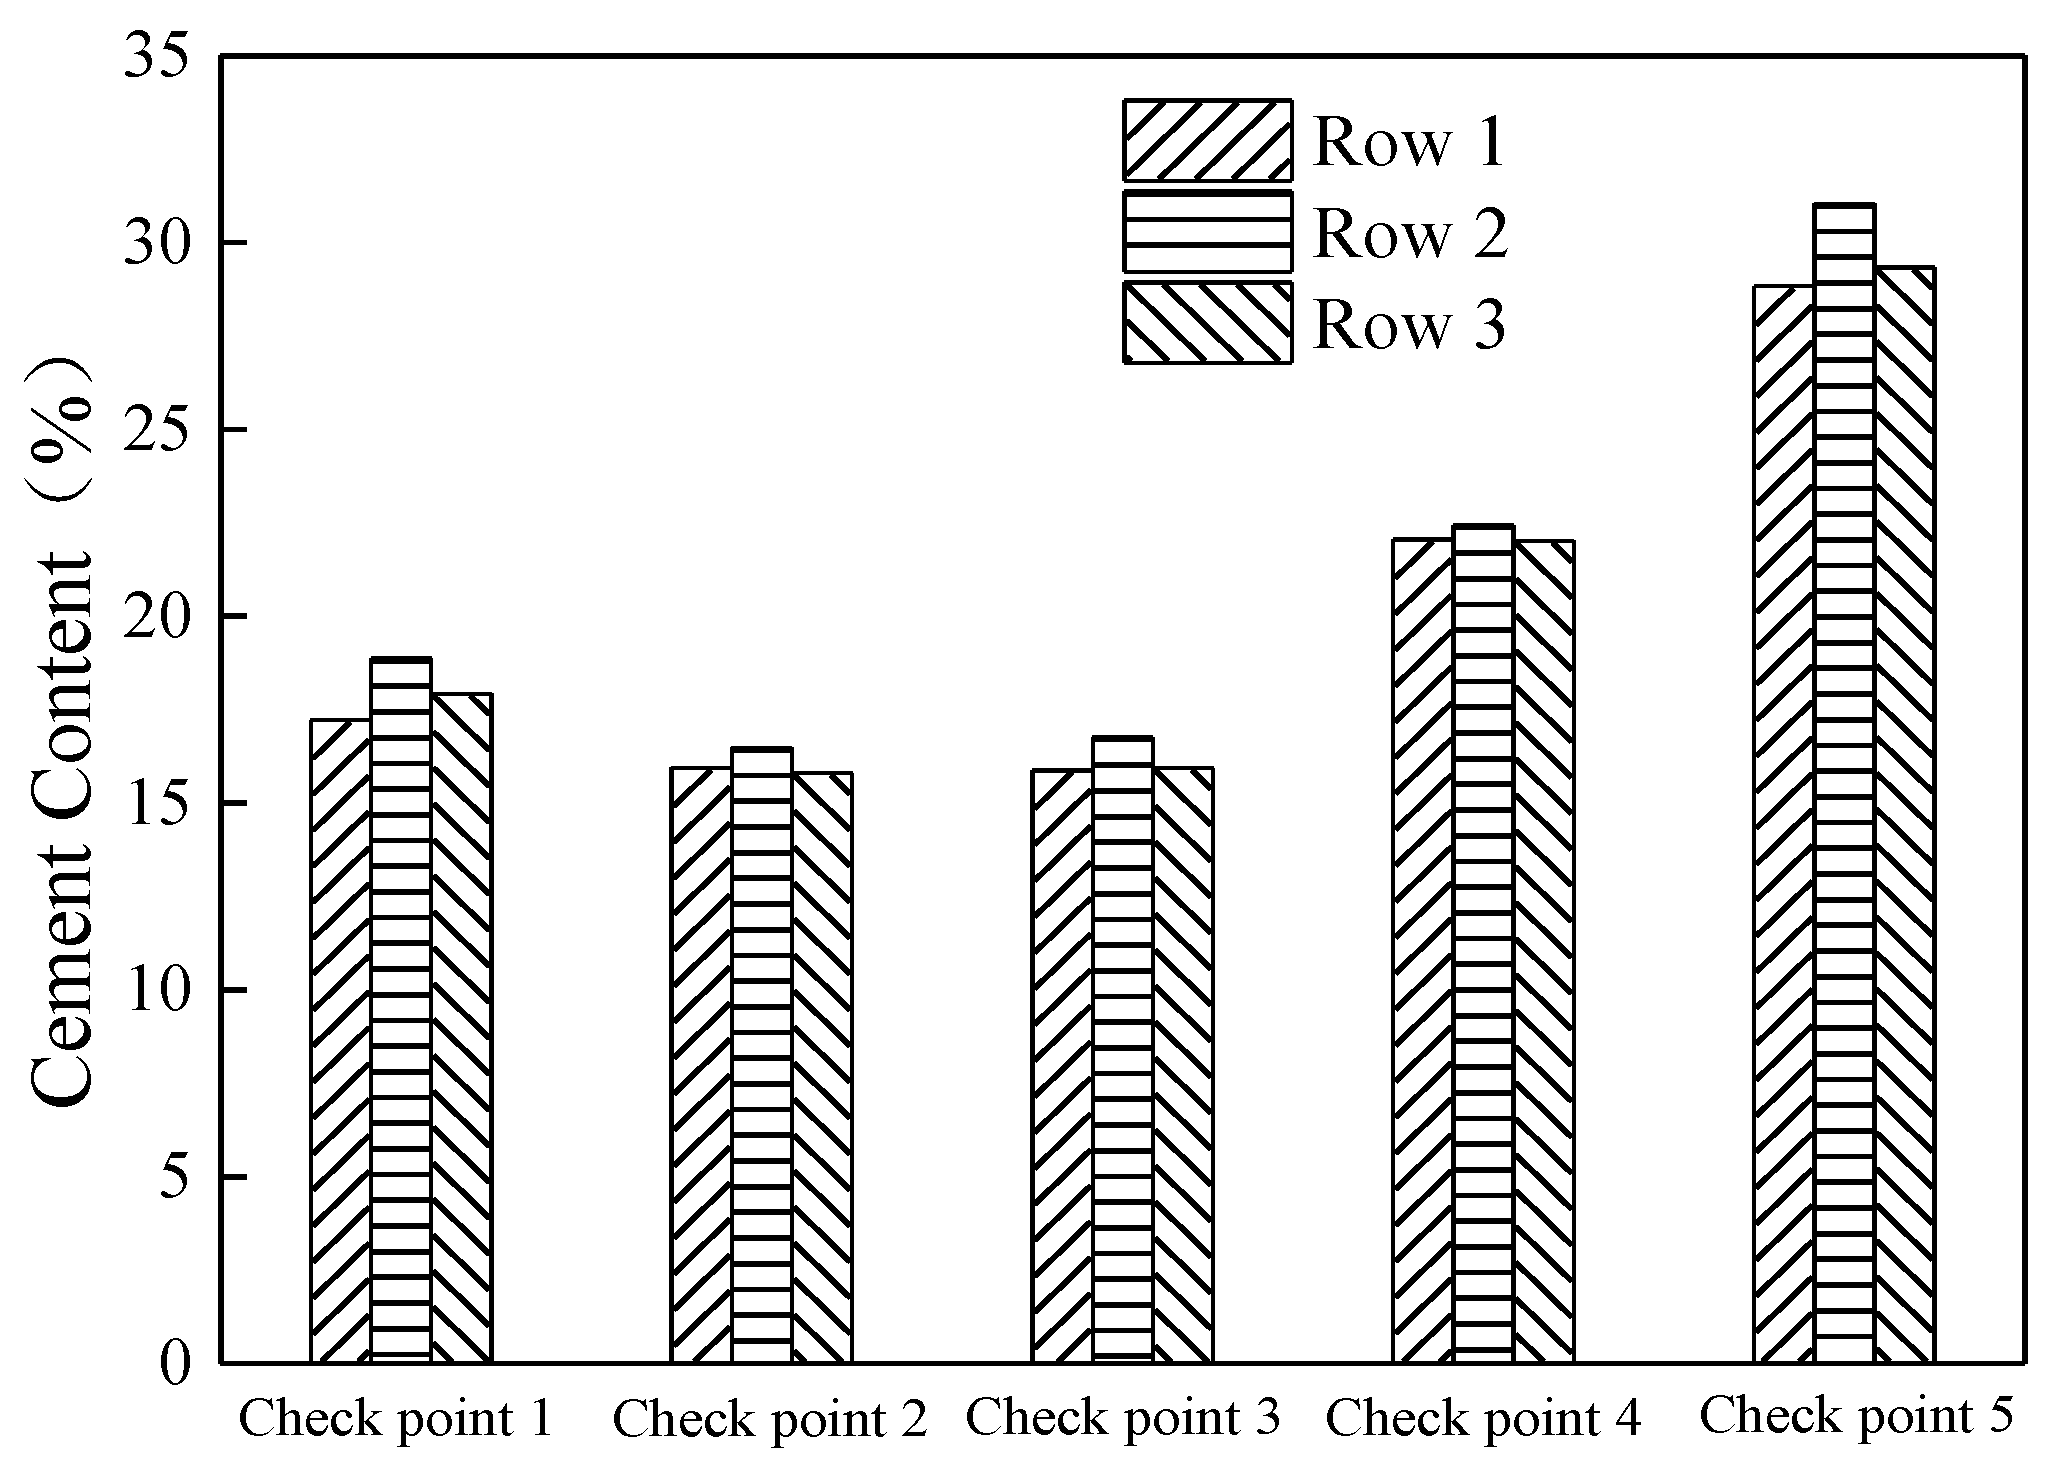
3.2. Cement Content Distribution of CTB

The cement contents of sampling cores from all three rows were tested. Firstly, to check the consistency of the recorded results, the values of the corresponding positions in different rows are plotted and compared in Figure 7.
It can be obviously observed from Figure 7 that there were no significant differences among the values in different rows at any point. Moreover, the maximum discrepancy rate was less than 2%, demonstrating the consistency and reliability of the recorded cement contents.
Therefore, using the recorded results in row 2, see the values in Table 4, Figure 8 shows the UCS and cement contents of the nine samples as a function of the distance from the feeding point.
Figure 8 indicates that, along the flowing direction, except for the fourth sample, the cement contents basically decreased first and then increased. The abnormal value of the fourth sample may be attributed to the turbulence of slurry flowing. In addition to the distribution, the figure shows that the peak value, located at the far end, was over 31%, which is much higher than the design value (20%). In contrast, the cement contents within 2 m of the origin were all lower than 20%, and the minimum value was 16.48% (almost half of the peak value). The main reason for the above phenomenon is that the cement particle sizes were much smaller compared to the tailings, thus being transported with the slurry flow, resulting in accumulation to the far end of the test model.
In terms of the relationship between UCS and cement content, it is well accepted that, for CTB with a fixed material content, a higher cement content results in a greater UCS. However, Figure 8 shows that the distribution of UCS differed from that of the cement content. The peak value of UCS appeared 2.4 m from the origin, with a cement content of ~22%, i.e., only 2% higher than the designed content. Moreover, to the far end with the peak cement content, the UCS was also not the highest. This demonstrates that the UCS of CTB in a stope is not only determined by the cement content, as discussed in previous studies [29,30,31]; some other properties, such as the PSD of tailings or pore structures can also affect the strength.

3.3. Particle Size Distribution of Tailings

As explained above, cement has more fine particles than tailings and is transported farther during flowing, resulting in more cement accumulating to the far end of the testing model. Obviously, for tailings particles, there would also be an inhomogeneous distribution of particle size, as described in previous studies [29,30]; this inhomogeneous PSD of tailings affects the pore structure of CTB and, thus, influences the UCS.
To evaluate these effects, using the proposed sampling scheme, the PSD of the samples in row 2 was monitored; then, to quantitatively describe and compare the features of the PSD, the median particle size (d50) of each sample was selected as the representative parameter for further study, which has been presented in Table 5. Figure 9 shows the change in median sample size along the flowing direction, along with the UCS of corresponding samples.
From the figure, it can be found that, along the flowing direction, the median particle sizes increased first and then decreased gradually to the minimum value. This trend is mainly attributed to the impediment of particles, particularly coarse particles, due to their collisions and settling, leading to quicker sedimentation. Accordingly, more coarse particles will accumulate during slurry flow, resulting in an increase in median size. Upon the coarse particles settling, the content of fine particles will increase, leading to a decrease in median size to the far end.
However, as shown in the figure, the distribution of UCS did not match that of median particle size. For instance, at a distance of 0–0.8 m, the median sizes increased from ~60 to 100 μm, whereas the values of UCS decreased from ~3.6 MPa to 2.3 MPa. At a distance of 1.6–2.4 m, the median sizes decreased gradually from the peak value to around 62 μm. On the contrary, the UCS values increased from around 2.9 MPa to the peak value. This discrepancy is somewhat inconsistent with previous research conclusions [29,30], which argued that coarse particles can help to increase the strength. Moreover, these findings also indicate that, unlike lab samples, for CTB in stopes, due to material segregation caused by slurry flowing, the inhomogeneous distribution of cement content and the PSD of tailings both comprehensively determine the UCS of CTB.

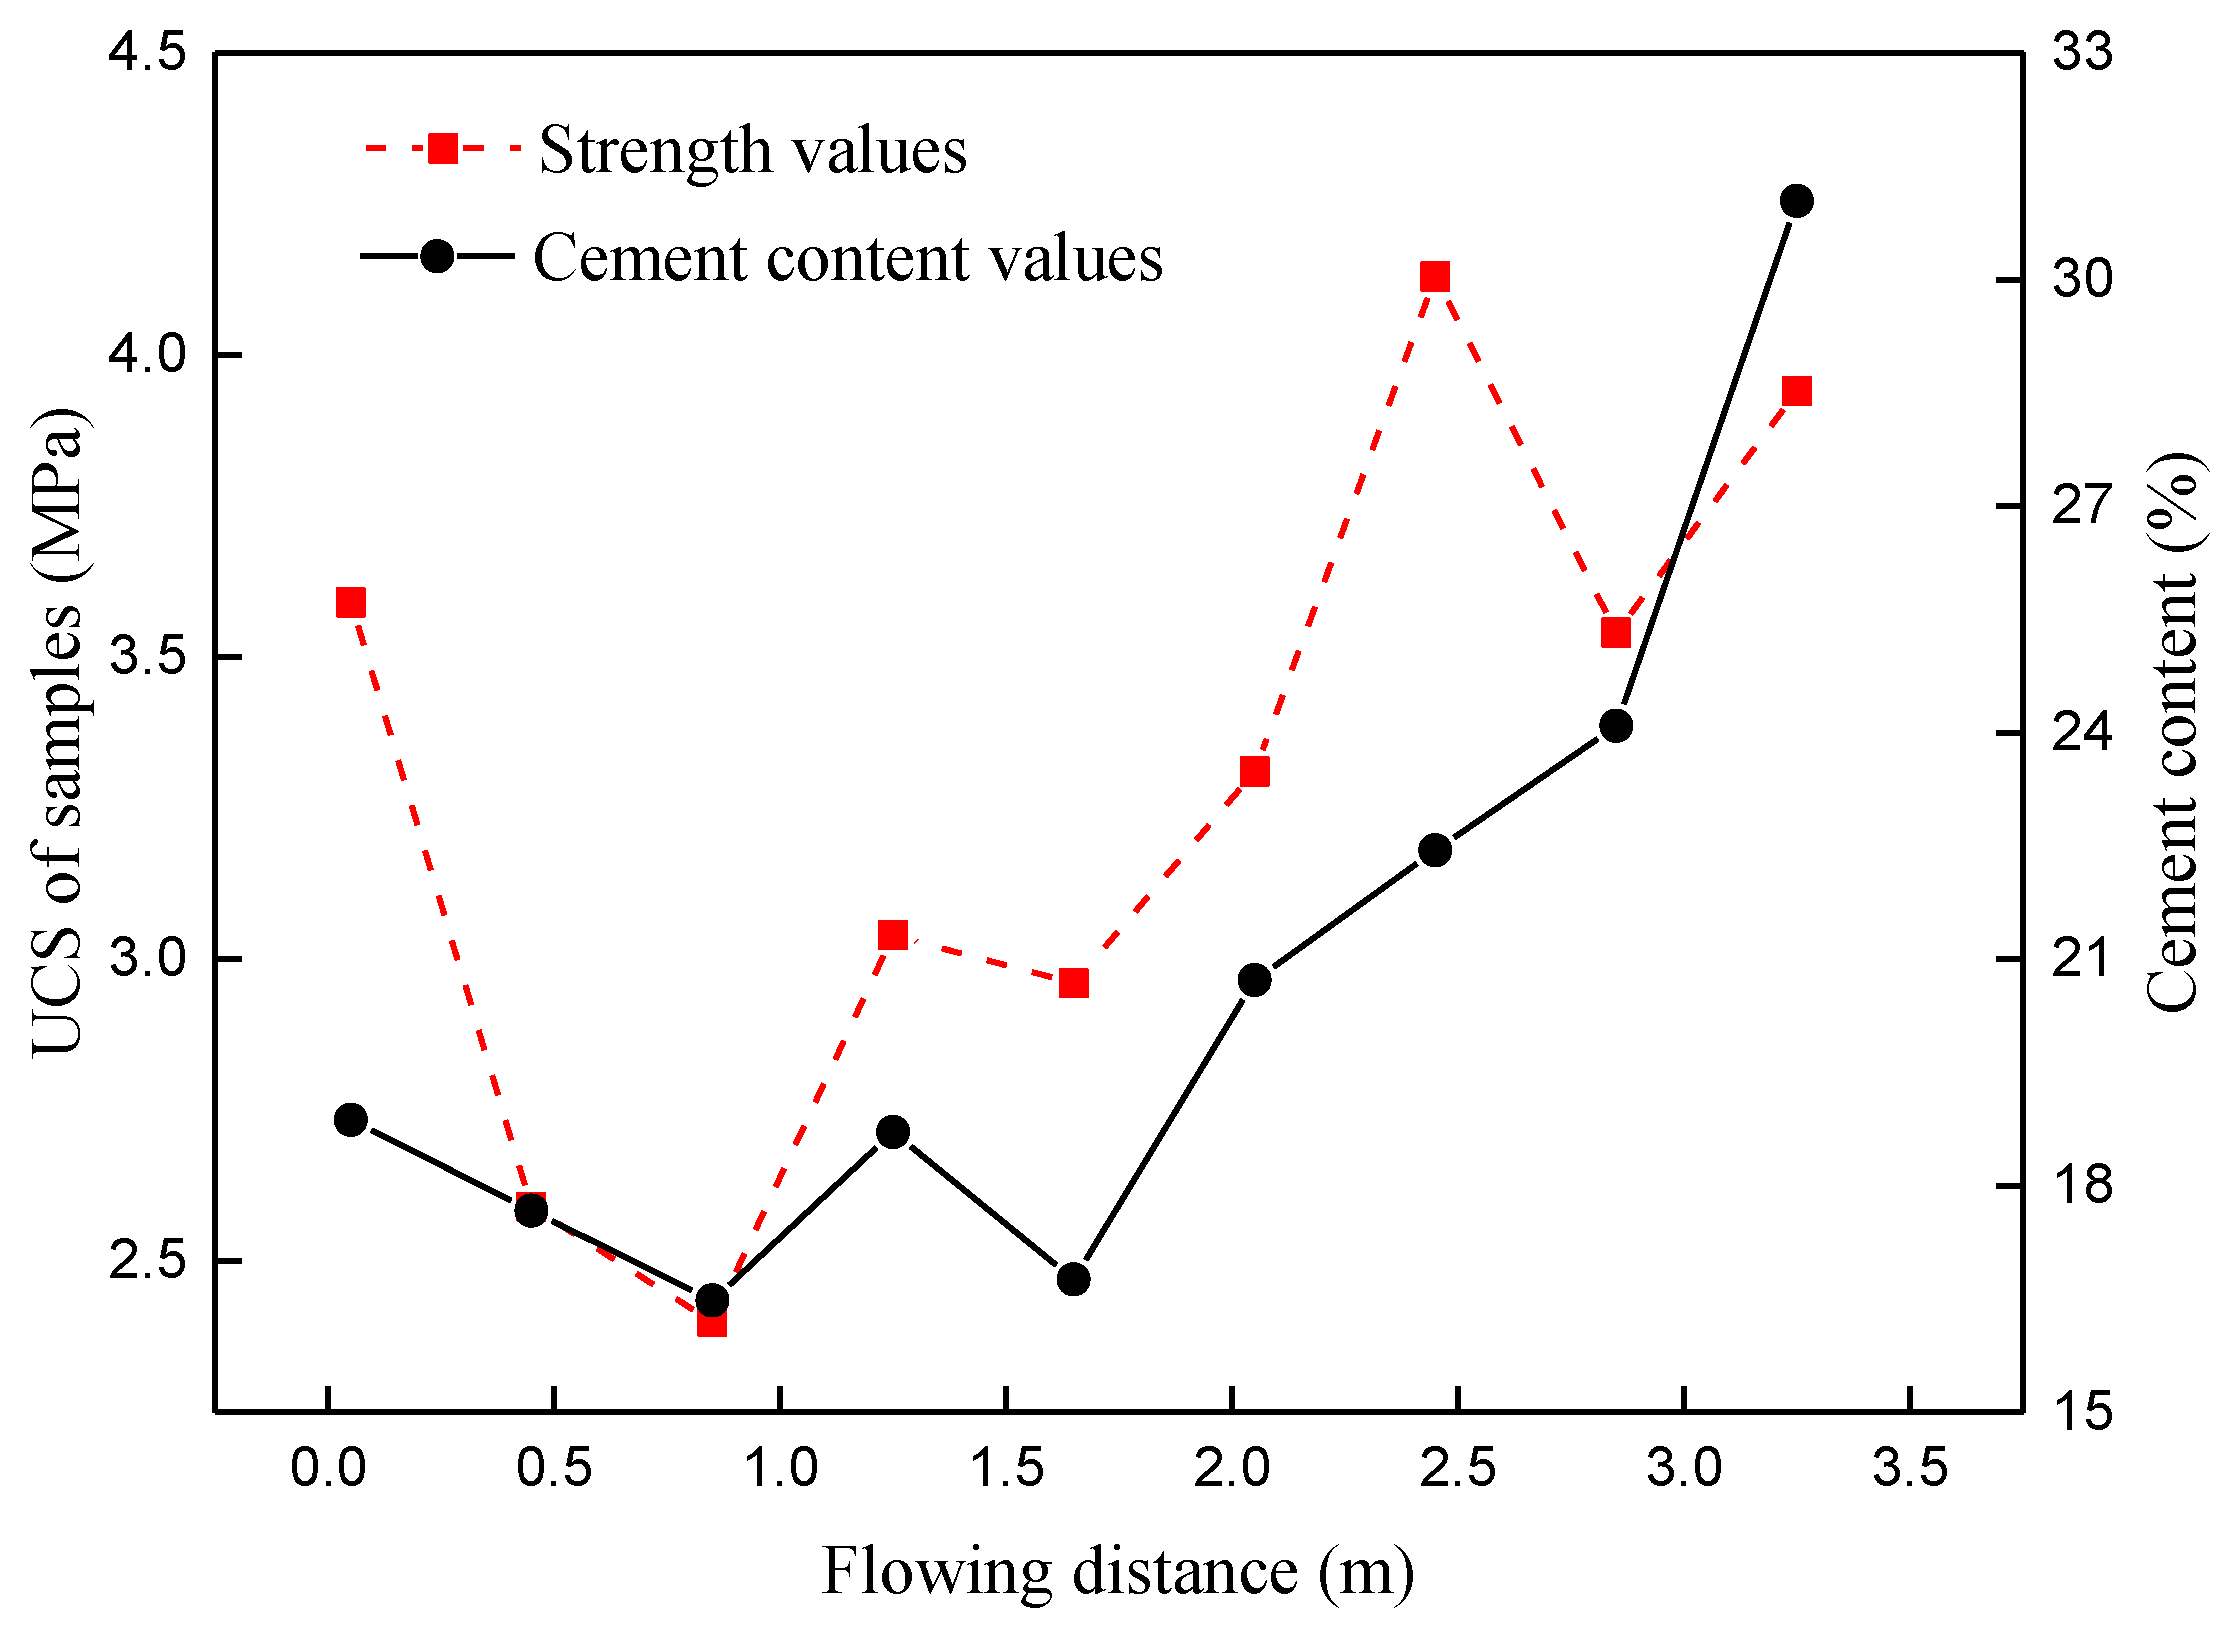
3.4. Analysis of the Comprehensive Influence Factor of Strength Distribution

As discussed above, the strength distribution of CTB in stopes is comprehensively affected by both the distribution of cement content and the particle size of tailings. In fact, according to the relevant strength theories of concrete [42], some researchers [43,44,45] have pointed out that tailings particles in cemented backfill mainly constitute the framework of inner structures, whereas hydration products are introduced into the framework to strengthen the structure of the cemented body. Accordingly, when comparing the values in Figure 8 and Figure 9, it can be found that, at the distance with the peak median particle size, the corresponding cement content was only 18%, which is less than the designed cement content, thus leading to a decrease in hydration products and weak connections of the tailings particles in the structure, resulting in a decrease in UCS. Similarly, at the far end, the cement content reached its peak, whereas the median particle size was the minimum, thus affecting the framework structure and leading to a decrease in UCS.
In studies of the soil mechanism [46] and mine backfill (e.g., [1]), the uniformity coefficient (Cu) of tailings was commonly utilized to comprehensively describe the distribution of fine and coarse particles. It is well accepted that the Cu can affect the compactness of the framework of a cemented body, whereby, for higher Cu, fine particles can more easily enter the pores resulting from the accumulation of coarse particles, leading to a more compact framework. Moreover, when the Cu matches the Talbot curve [42,46,47], the most compact structure is formed. Therefore, this coefficient can be used as a quantitative index to evaluate the particle distribution.
Taking into account the above analysis, for a given CTB sample, the cement content can directly reflect the hydration effect, and Cu can be used to evaluate its framework. Therefore, the product of the two parameters can be defined as the comprehensive influencing factor of strength distribution, expressed as:
SF = Cc × Cu
where SF is the strength factor, and Cc is the cement content.
Equation (1) and the testing results from samples in row 2 were used to derive the SF, and the results are presented in Table 6.
A comparison chart is plotted in Figure 10 to further demonstrate the relationship between SF and CTB strength as a function of the UCS.
As shown in the figure, the linear correlation coefficient (R2) of the two parameters was >0.8, indicating a strong linear relationship between SF and UCS. This also experimentally proves that the strength of CTB is comprehensively determined by the distribution of hydration products and the structural framework. Moreover, as the SF can linearly reflect the UCS of CTB to a certain extent, combined with the flume test and in situ coring, analyses of the variation and distribution of SF values can be used in the future as a more effective method to evaluate the quality of the backfill body. In addition to reflecting the strength fluctuation, the SF value can indicate the cement content and tailings PSD. Thus, any decrease in SF can be investigated to determine the cause, allowing the development of a targeted strategy. This is very meaningful for the optimization of backfill processes in a mine.

4. Conclusions

(1)
During the flow of backfill slurries in stopes, solid materials settle and become redistributed. With respect to tailings, coarse particles have a larger flowing resistance and are deposited near the feeding point, leading to the median sizes of particles increasing first and then decreasing thereafter. The peak value of median size can be more than three times that of the minimum value.
(2)
In contrast to tailings, cement commonly consists of fine particles, facilitating flow to the far end of the stope with backfill water. Accordingly, the experimental results showed that the cement content of CTB first decreased and then increased to the peak at the farthest point. The maximum cement content can be around two times that of the minimum value.
(3)
The strength of CTB is comprehensively determined by the distribution of cement content and tailings particles. At the distance with the peak median particle size, the cement content is relatively low, thus reducing the strength. At the distance with maximum cement content, the median size is minimum, thus also reducing the strength. Due to the comprehensive influence of both factors, CTB presents an S-shaped strength distribution.
(4)
It was experimentally proven that the SF (strength factor) defined in this study has a strong linear relationship with the UCS; thus, it can be used as a quantitative parameter to reflect the comprehensive effect of cement content and tailings distribution on strength. Thus, any decrease in SF can be investigated to determine the cause, allowing the development of a targeted strategy.
As discussed above, the SF defined in this study can reflect the comprehensive influences of CTB properties on the UCS. It is still an initial analysis of this index, and the data obtained in this study still remain limited. Thus, to further enrich the research content and form a more practical method of quality evaluation of CTB, more experimental studies focusing on the relationship between SF and UCS of CTB will be launched in future research.

Author Contributions

Conceptualization and methodology, X.P.; investigation, X.C.; writing—original draft preparation, X.P.; writing—review and editing, L.G. and G.L.; visualization, X.C.; supervision, X.Y.; project administration, L.G. All authors have read and agreed to the published version of the manuscript.

Funding

This research was funded by the National Key Research and Development Program of China, grant number 2018YFE0123000. The APC was funded by the Key Research Fund of BGRIMM, grant number 02-1911.

Data Availability Statement

All data, models, or code supporting the findings of this study are available from the corresponding author upon reasonable request.

Acknowledgments

The authors would like to acknowledge the Anqing Copper Mine of China for providing tailings, binders, and process water. We would also like to thank Ming Wei from Tongling Nonferrous Metals Corporation, China for his technical support.

Conflicts of Interest

The authors declare no conflict of interest.

References

  1. Belem, T.; Benzaazoua, M. An overview on the use of paste backfill technology as a ground support method in cut-and-fill mines. In Proceedings of the 5th International Symposium on Ground Support in Mining and Underground Construction, Perth, Australia, 28–30 September 2004; Villaescusa, Potvin, Ed.; Tayler & Francis Group: London, UK, 2004; pp. 637–650. [Google Scholar]
  2. Sheshpari, M. A review of underground mine backfilling methods with emphasis on cemented paste backfill. Electron. J. Geotech. Eng. 2015, 20, 5183–5208. [Google Scholar]
  3. Yang, X.C.; Guo, L.J.; Xu, W.Y.; Yang, C.; Hou, G.Q.; Li, Z.N.; Shi, C.X.; Li, W.C.; Liu, G.S.; Peng, X.P.; et al. Introduction. In Comprehensive Utilization Technology of Tailings and Waste Rocks, 1st ed.; Ceng, K.F., Liu, M.H., Eds.; Chemical Industry Press: Beijing, China, 2018; pp. 1–3. [Google Scholar]
  4. Huang, Y.C. Introduction. In Theory and Technology of Mine Backfill, 1st ed.; Qin, X.Y., Ed.; Metallurgical Industry Press: Beijing, China, 2014; pp. 7–9. [Google Scholar]
  5. Yang, L.; Yilmaz, E.; Li, J.; Liu, H.; Jiang, H. Effect of superplasticizer type and dosage on fluidity and strength behavior of cemented tailings backfill with different solid contents. Constr. Build. Mater. 2018, 187, 290–298. [Google Scholar] [CrossRef]
  6. Liu, L.; Fang, Z.Y.; Wu, Y.P.; Lai, X.P.; Wang, P.; Song, K.I. Experimental investigation of solid-liquid two-phase flow in cemented rock-tailings backfill using Electrical Resistance Tomography. Constr. Build. Mater. 2018, 175, 267–276. [Google Scholar] [CrossRef]
  7. Cao, S.; Yilmaz, E.; Song, W. Evaluation of viscosity, strength and microstructural properties of cemented tailings backfill. Minerals 2018, 8, 352. [Google Scholar] [CrossRef] [Green Version]
  8. Fitton, T.G.; Chryss, A.G.; Bhattacharya, S.N. Tailings beach slope prediction: A new rheological method. Int. J. Min. Reclam. Environ. 2006, 20, 181–202. [Google Scholar] [CrossRef]
  9. Cao, S.; Song, W.D.; Xue, G.L.; Wang, Y.; Zhu, P.-R. Tests of strength reduction of cemented tailings filling considering layering character. Rock Soil Mech. 2015, 36, 2869–2876. [Google Scholar]
  10. Béket Dalcé, J.; Li, L.; Yang, P. Experimental study of uniaxial compressive strength (UCS) distribution of hydraulic backfill associated with segregation. Minerals 2019, 9, 147. [Google Scholar] [CrossRef] [Green Version]
  11. Cui, L.; Fall, M. Multiphysics modeling and simulation of strength development and distribution in cemented tailings backfill structures. Int. J. Concr. Struct. Mater. 2018, 12, 25. [Google Scholar] [CrossRef]
  12. Lu, G.D.; Fall, M. A coupled chemo-viscoplastic cap model for simulating the behavior of hydrating cemented tailings backfill under blast loading. Int. J. Numer. Anal. Methods Geomech. 2016, 40, 1123–1149. [Google Scholar] [CrossRef]
  13. Le, R.K.; Bawden, W.F.; Grabinsky, M.F. Field properties of cemented paste backfill at the Golden Giant mine. Min. Technol. 2005, 114, 65–80. [Google Scholar]
  14. Thompson, B.D.; Bawden, W.F.; Grabinsky, M.F. In-situ measurements of cemented paste backfill at the Cayeli Mine. Can. Geotech. J. 2012, 49, 755–772. [Google Scholar] [CrossRef]
  15. Gan, D.Q.; Shen, M.F.; Sun, G.H.; Liu, Z.; He, S. Experimental Study on Strength Distribution of Filling Body in Metal Mine. Met. Mine 2016, 45, 32–35. [Google Scholar]
  16. Wei, X.M.; Guo, L.J.; Li, Z.N. Study on the strength difference of cemented backfill based on macro-micro coupling analysis. China Min. Mag. 2018, 6, 95–99. [Google Scholar]
  17. Ghirian, A.; Fall, M. Coupled thermo-hydro-mechanical-chemical behaviour of cemented paste backfill in column experiments. Part I: Physical, hydraulic and thermal processes and characteristics. Eng. Geol. 2013, 164, 195–207. [Google Scholar] [CrossRef]
  18. Ghirian, A.; Fall, M. Coupled thermo-hydro-mechanical-chemical behaviour of cemented paste backfill in column experiments. Part II: Mechanical, chemical and microstructural processes and characteristics. Eng. Geol. 2014, 170, 11–23. [Google Scholar] [CrossRef]
  19. Kwak, M.; James, D.F.; Klein, K.A. Flow behavior of tailings paste for surface disposal. Int. J. Miner. Process. 2005, 77, 139–153. [Google Scholar] [CrossRef]
  20. Deschamps, T.; Benzaazoua, M.; Bruno, B.; Aubertin, M. Laboratory study of surface paste disposal for sulfidic tailings: Physical model testing. Miner. Eng. 2011, 24, 794–806. [Google Scholar] [CrossRef]
  21. Azimi, A.H.; Zhu, D.Z.; Rajaratnam, N. Experimental study of subaqueous sand deposition from slurry wall jets. J. Eng. Mech. 2014, 140, 296–314. [Google Scholar] [CrossRef]
  22. Xu, W.Y.; Yang, X.C.; Guo, L.J. Experimental Research on Inhomogeneous Simulation of Fill body. Met. Mine 2011, 5, 18–22. [Google Scholar]
  23. Lu, H.J.; Liang, P.; Gan, D.Q.; Zhang, S.L. Research on flow sedimentation law of filling slurry and mechanical characteristics of backfill body. Rock Soil Mech. 2017, 38, 263–270. [Google Scholar]
  24. Li, W.C.; Guo, L.J.; Chen, X.Z.; Li, Z.N.; Li, X. Similarity Simulation Experiment on Strength Distribution in Three-Dimensional Spatial of Cemented Tailing Backfill. Gold Sci. Technol. 2018, 26, 528–534. [Google Scholar]
  25. Shi, C.X.; Guo, L.J.; Chen, X.Z. Experimental Study on the Law of Flow and Segregation of Filing Slurry in Stope. Gold Sci. Technol. 2018, 26, 520–527. [Google Scholar]
  26. Li, W.C.; Guo, L.J.; Xu, W.Y. Exploratory study on early strength in-situ monitoring of cemented tailing backfill sample. China Min. Mag. 1991, 27, 139–143. [Google Scholar]
  27. Li, W.C.; Fall, M. Strength and self-desiccation of slag-cemented paste backfill at early ages: Link to initial sulphate concentration. Cem. Concr. Compos. 2018, 89, 160–168. [Google Scholar] [CrossRef]
  28. Yilmaz, E.; Benzaazoua, M.; Bussière, B.; Pouliot, S. Influence of disposal configurations on hydrogeological behavior of sulphidic paste tailings: A field experimental study. Int. J. Miner. Process. 2014, 131, 12–25. [Google Scholar] [CrossRef]
  29. Wu, J.; Feng, M.; Chen, Z.; Mao, X.; Han, G.; Wang, Y. Particle size distribution effects on the strength characteristic of cemented paste backfill. Minerals 2018, 8, 322. [Google Scholar] [CrossRef] [Green Version]
  30. Fall, M.; Benzaazoua, M.; Ouellet, S. Experimental characterization of the influence of tailings fineness and density on the quality of cemented paste backfill. Miner. Eng. 2005, 18, 41–44. [Google Scholar] [CrossRef]
  31. Ke, X.; Zhou, X.; Wang, X.; Wang, T.; Hou, H.; Zhou, M. Effect of tailings fineness on the pore structure development of cemented paste backfill. Constr. Build. Mater. 2016, 126, 345–350. [Google Scholar] [CrossRef]
  32. Yilmaz, E.; Benzaazoua, M.; Belem, T.; Bussière, B. Effect of curing under pressure on compressive strength development of cemented paste backfill. Miner. Eng. 2009, 22, 772–785. [Google Scholar] [CrossRef]
  33. Yilmaz, E.; Belem, T.; Benzaazoua, M. Effects of curing and stress conditions on hydromechanical, geotechnical and geochemical properties of cemented paste backfill. Eng. Geol. 2014, 168, 23–37. [Google Scholar] [CrossRef]
  34. Yin, G.Z.; Jing, X.F.; Wei, Z.A.; Li, X.S. Study of model test of seepage characteristics and field measurement of coarse and fine tailings dam. Chin. J. Rock Mech. Eng. 2010, 29, 3710–3718. [Google Scholar]
  35. Yin, G.Z.; Li, G.; Wei, Z.A.; Wan, L.; Shui, G.; Jing, X. Stability analysis of a copper tailings dam via laboratory model tests: A Chinese case study. Miner. Eng. 2011, 24, 122–130. [Google Scholar] [CrossRef]
  36. Ma, W.; Iaconangelo, C.; de la Torre, J. Model similarity, model selection, and attribute classification. Appl. Psychol. Meas. 2016, 40, 200–217. [Google Scholar] [CrossRef]
  37. Bech, J.; Roca, N.; Tume, P.; Ramos-Miras, J.; Gil, C.; Boluda, R. Screening for new accumulator plants in potential hazards elements polluted soil surrounding Peruvian mine tailings. Catena 2016, 136, 66–73. [Google Scholar] [CrossRef]
  38. Demir, F.; Derun, E.M. Modelling and optimization of gold mine tailings based geopolymer by using response surface method and its application in Pb2+ removal. J. Clean. Prod. 2019, 237, 117766. [Google Scholar] [CrossRef]
  39. Li, W.C.; Fall, M. Sulphate effect on the early age strength and self-desiccation of cemented paste backfill. Constr. Build. Mater. 2016, 106, 296–304. [Google Scholar] [CrossRef]
  40. Chen, X.Z.; Yang, X.C.; Guo, L.J.; Peng, X. Experimental Study on the Determination of Cement Content in Cemented Tailings Backfill. Nonferrous Met. Eng. 2018, 8, 69–74. [Google Scholar]
  41. Chen, X.Z.; Yang, X.C.; Guo, L.J. Effect of Curing Age on the Determination of Cement Content in Cemented Tailings Backfill by EDTA Titration Method. Nonferrous Met. Eng. 2019, 9, 93–99. [Google Scholar]
  42. Mehta, P.K.; Monteiro, P.J. The microstructures of concrete. In Concrete: Microstructure, Properties, and Materials, 4th ed.; Ouyang, D., Ed.; China Building Materials Industry Press: Beijing, China, 2016; pp. 21–35. [Google Scholar]
  43. Kesimal, A.; Yilmaz, E.; Ercikdi, B.; Alp, I.; Deveci, H. Effect of properties of tailings and binder on the short and long-term strength and stability of cemented paste backfill. Mater. Lett. 2005, 59, 3703–3709. [Google Scholar] [CrossRef]
  44. Xu, W.B.; Pang, W.D.; Ding, M. Experiment on evolution of microstructures and long-term strength model of cemented backfill mass. J. Cent. South Univ. (Sci. Technol.) 2015, 46, 2333–2341. [Google Scholar]
  45. Liu, L.; Fang, Z.Y.; Qi, C.C.; Zhang, B.; Guo, L.; Song, K.I. Experimental investigation on the relationship between pore characteristics and unconfined compressive strength of cemented paste backfill. Constr. Build. Mater. 2018, 179, 254–264. [Google Scholar] [CrossRef]
  46. Li, G.X.; Zhang, B.Y.; Yu, Y.Z. The Physical properties and engineering classification of soil. In Soil Mechanics, 2nd ed.; Qin, N., Ed.; Tsinghua University Press: Beijing, China, 2013; pp. 8–10. [Google Scholar]
  47. Talbot, A.N.; Brown, H.A.; Richart, F.E. The Strength of Concrete: Its Relation to the Cement, Aggregates and Water; University of Illinois at Urbana Champaign: Urbana Champaign, IL, USA, 1923. [Google Scholar]
Figure 1. Diagram of the flume model test system. (a) Picture of the flume model; (b) the components of the test system.
Metals 11 02059 g001
Figure 2. Particle size distribution (PSD) of the tailings used in the study.
Metals 11 02059 g002
Figure 3. Illustration of sampling scheme of model test from top view.
Metals 11 02059 g003
Figure 4. The final profile of backfill slurries after flowing in the test model.
Metals 11 02059 g004
Figure 5. The cemented tailings backfill (CTB) specimens drilled from different areas after the flume test. (a) The specimens obtained; (b) the uniaxial compressive strength (UCS) testing process; (c) the specimen after failure.
Metals 11 02059 g005
Figure 6. The strength distribution of backfill samples along the flowing direction.
Metals 11 02059 g006
Figure 7. Verification chart of the cement contents of sampling cores in different rows.
Metals 11 02059 g007
Figure 8. Comparison chart of the cement contents and UCS of samples in row 2 along the flowing direction.
Metals 11 02059 g008
Figure 9. Comparison chart of the median particle sizes and UCS of samples in row 2 along the flowing direction.
Metals 11 02059 g009
Figure 10. Comparison chart of the strength factor (SF) values and UCS of samples in row 2.
Metals 11 02059 g010
Table 1. Chemical components of tailings.
MineralCaOSiO2Al2O3MgOFeOMnOSO3Other
Content (wt.%)4.241.410.411.521.30.22.18.9
Table 2. PSD data of tailings.
D10 (μm)D30 (μm)D50 (μm)D60 (μm)D90 (μm)
2.4710.1425.4337.61117.18
Table 3. The obtained mean UCS values of samples in row 2.
No.2-12-22-32-42-52-62-72-82-9
Mean UCS
(MPa)
3.582.592.403.042.963.314.133.543.94
Table 4. The cement content values obtained for samples in row 2.
No.2-12-22-32-42-52-62-72-82-9
Mean cement content (wt%)18.8717.6716.4818.7116.7620.7222.4424.0931.04
Table 5. The median particle size of samples in row 2.
No.2-12-22-32-42-52-62-72-82-9
Median particle size (μm)59.8594.26104.35106.10129.1877.6063.9267.2039.83
Table 6. The obtained SF values of samples in row 2.
No.2-12-22-32-42-52-62-72-82-9
SF (%)2.5611.9651.8702.4532.5422.8453.0862.9683.452
Publisher’s Note: MDPI stays neutral with regard to jurisdictional claims in published maps and institutional affiliations.

