Article

Linking In Situ Melt Pool Monitoring to Melt Pool Size Distributions and Internal Flaws in Laser Powder Bed Fusion

Department of Industrial and Material Science, Chalmers University of Technology, Rännvägen 2, SE-412 96 Gothenburg, Sweden
*
Author to whom correspondence should be addressed.
Metals 2021, 11(11), 1856; https://doi.org/10.3390/met11111856
Submission received: 24 September 2021 / Revised: 12 November 2021 / Accepted: 16 November 2021 / Published: 18 November 2021

Abstract

:
In situ monitoring of the melt pools in laser powder bed fusion (LPBF) has enabled the elucidation of process phenomena. There has been an increasing interest in also using melt pool monitoring to identify process anomalies and control the quality of the manufactured parts. However, a better understanding of the variability of melt pools and the relation to the incidence of internal flaws are necessary to achieve this goal. This study aims to link distributions of melt pool dimensions to internal flaws and signal characteristics obtained from melt pool monitoring. A process mapping approach is employed in the manufacturing of Hastelloy X, comprising a vast portion of the process space. Ex situ measurements of melt pool dimensions and analysis of internal flaws are correlated to the signal obtained through in situ melt pool monitoring in the visible and near-infrared spectra. It is found that the variability in melt pool dimensions is related to the presence of internal flaws, but scatter in melt pool dimensions is not detectable by the monitoring system employed in this study. The signal intensities are proportional to melt pool dimensions, and the signal is increasingly dynamic following process conditions that increase the generation of spatter.

1. Introduction

Laser powder bed fusion (LPBF) is an additive manufacturing technology that consists of iteratively spreading a thin layer of powder on a build platform and selectively melting regions of the powder bed by means of a laser source until an entire component is built. The melt pool formed upon the interaction of the laser with the substrate and powder bed is the basic unit of this manufacturing process; thus, fundamental research in LPBF has the investigation of the melt pool as a starting point [1,2]. Analysis of the melt pool has unveiled the physical phenomena governing the process [3,4] and has been used in a technological perspective, for example, to determine the processability of different alloys [5].
The fusion mode and process parameters determine melt pool geometry. In conduction fusion, the energy is deposited on the surface of the piece and transferred to its interior by conduction [6], resulting in melt pools with semicircular cross-sections. If electron beams or lasers are used as the energy source, as is the case for LPBF, higher energy densities are attainable [6], causing some alloying elements to evaporate. A vapor cavity of the shape of a keyhole is formed as a result of the recoil force of vapor in the liquid metal [7], leaving a depression in the melt pool cross-section. Melt pool geometries have been mapped in the LPBF process space, both by measurements on cross-sections of single tracks [8,9], and by direct observation of melt pool by in situ high-speed, high-energy X-ray imaging [10], experimentally showing that the key process parameters determining melt pool dimensions are laser power and scan speed. Other factors such as shield gas flow rate [11] and the defocusing distance [12,13] also influence melt pool geometry and can even alter the fusion mode.
There has been an increasing interest in using melt pool data for the detection and prediction of flaws. Two trends are identified in the literature: ex situ measurement of melt pool dimensions to predict lack of fusion flaws and in situ monitoring of melt pools to predict single track flaws. Process monitoring of single tracks utilizing high-speed cameras [14,15] and inline coherent imaging [16], for example, have been used to identify conditions such as balling, continuous tracks and keyhole porosity. Other studies prioritized identifying signal deviations coupled to keyhole pores [17,18]. The ex situ measurement of melt pool dimensions to predict lack of fusion flaws is justified by the fundamental origin of such flaws, which is the incomplete overlap of adjacent melt pools. Melt pool dimensions were linked to the incidence of lack of fusion through the proposal of a geometrical model based on the overlap ratio of melt pools [19]. In addition, the enlargement of melt pools resulting from usage of higher laser power and its impact on the reduction of the lack of fusion content was verified in [20].
Still, for the melt pool dimensions to be coupled to internal flaws, melt pool fluctuations [21] must be contemplated, as even local dimensional variations can cause local insufficient overlaps. The melt pool variability was considered on the mapping of flaws inherent to single tracks [22] and when studying the variability of single track dimensions under constant energy input [23]. Nonetheless, the analysis of single tracks cannot capture all mechanisms present in multi-track and multilayer builds [1]; hence, direct correspondence to bulk discontinuities in a three-dimensional part cannot be inferred. Furthermore, considering that the goal of in situ monitoring is quality assurance, both flaw types, lack of fusion and pore, must be detectable. Since the literature in melt pool monitoring is greatly limited to the analysis of single tracks, only the detection of keyhole porosity can be directly translated to multilayer builds. Conversely, the study of melt pool dimensions coupled to flaws in multilayered build is largely limited to the assessment of lack of fusion. Both flaw types can be systematically created by modifying process parameters, hence enabling an integrated study of their detectability coupled to melt pool data.
This study hence aims to collectively address melt pool variability, its influence on the formation of internal flaws in multilayer builds in both conduction and keyhole fusion, and the detectability of such flaws through melt pool monitoring. For that, 72 Hastelloy X specimens were manufactured with laser power, scan speed, and layer thickness values selected to comprise a vast portion of the process parameter space. Measurements of the melt pool dimensions, analysis of the internal flaws, and in situ monitoring were conducted for each experimental point. The melt pool data were linked to the incidence of flaws considering the variation of each factor separately and considering the fusion mode, keyhole or conduction.

2. Materials and Methods

The powder used in this study is EOS NickelAlloy HX, with composition corresponding to UNS N06002. All manufacturing was performed in an EOS M290 machine (Electro Optical Systems GmbH, Krailling, Germany), equipped with a ytterbium fiber laser of the maximum nominal power of 400 W and focused beam diameter of 100 μm, in an argon atmosphere with an oxygen concentration less than 0.10%. Each set of parameters defined in this study was used in the production of cylinder-shaped specimens of diameter 10 mm and height 20 mm, carefully positioned on the build platform to avoid redeposition of process byproducts on the laser-exposed area. All specimens were manufactured with a stripe exposure strategy, with a stripe width of 10 mm. No particular parameters were assigned to contour and upskin regions. The laser power and scan speed were systematically varied to cover a comprehensive range of the process parameter space available in the hardware used. The resulting combination of parameters is indicated in Table 1. Manufacturing was performed at a fixed value of hatch distance, 100 µm, and layer thicknesses of 20 µm, 40 µm, and 80 µm.
All specimens were sectioned along the build direction and transverse to the upmost scanning tracks, resulting in a metallography sample size of about 20 mm × 10 mm. The specimens were prepared by standard metallographic procedures, namely, plane grinding with 320-grit sandpaper, followed by fine grinding with 9 µm diamond suspension on a Struers MD-Largo surface and finally colloidal silica polishing. The specimens were then fully imaged in the unetched condition using the stitching tool in Zeiss Axioscope 7 light optical microscope at 50× magnification, yielding detectable features down to 0.88 µm, the size of a pixel. The resulting images were processed by an image analysis algorithm that returns the properties of each contiguous region in the binarized image (internal flaws). Among the quantities measured are the flaw length, also referred to as flaw size in this study, and the area fraction of flaws, referred to as the volume fraction of flaws, assuming that the area is representative of the bulk.
Posteriorly, the specimens were electrolytically etched in a solution of 5 g oxalic acid mixed with 95 mL reagent grade HCl at 6 V. Light optical microscopy (LOM), performed with a Zeiss Axioscope 7 (Carl Zeiss Microscopy GmbH, Jena, Germany) was used to reveal the location of flaws in relation to the melt pool boundaries. Scanning electron microscopy (SEM) using an LEO Gemini 1550 (Carl Zeiss Microscopy GmbH, Jena, Germany) was employed for further morphological details of the characteristic discontinuities at their specific locations. Light optical microscopy was used to measure melt pool depth and width on the topmost layers of each specimen, as per Figure 1. A minimum of 30 melt pools was measured for each set of parameters.
Melt pool monitoring was performed during the entire build process utilizing EOSTATE Melt Pool monitoring (Electro Optical Systems GmbH, Krailling, Germany). The setup consists of a photodiode mounted on-axis, coaxially with the laser beam, with bandwidth 450 nm–850 nm, i.e., in the visible and near-infrared spectra. The signal is acquired in the time domain at 60 kHz but is also translated to spatial coordinates, allowing enhanced data visualization. Signal processing was performed in the time domain within windows comprising 600 data points. The signal intensity characteristic is computed as the moving average within this window, while the signal dynamic characteristic is the signal variation within this window, computed as the raw signal minus the moving average.

3. Results and Discussion

The LPBF process is mapped for Hastelloy X considering fusion modes and volume fraction of internal flaws. The results are summarized in Table 1, in which the transition between fusion modes is represented by a dashed line. The melting modes are determined based on melt pool geometry: process parameters that generate semicircular melt pools operate in conduction mode (Figure 1A), and process parameters that generate melt pools with depression operate in keyhole mode (Figure 1B). Even though more specific regime classifications based on melt pool morphologies have been listed in the welding literature [24], in this study, the classification is limited to the broader categories of keyhole and conduction. In Figure 1, the measurement of melt pools depths and widths are schematized for both fusion modes. Further quantitative data on internal flaw sizes are available in Table A1 (Appendix A).

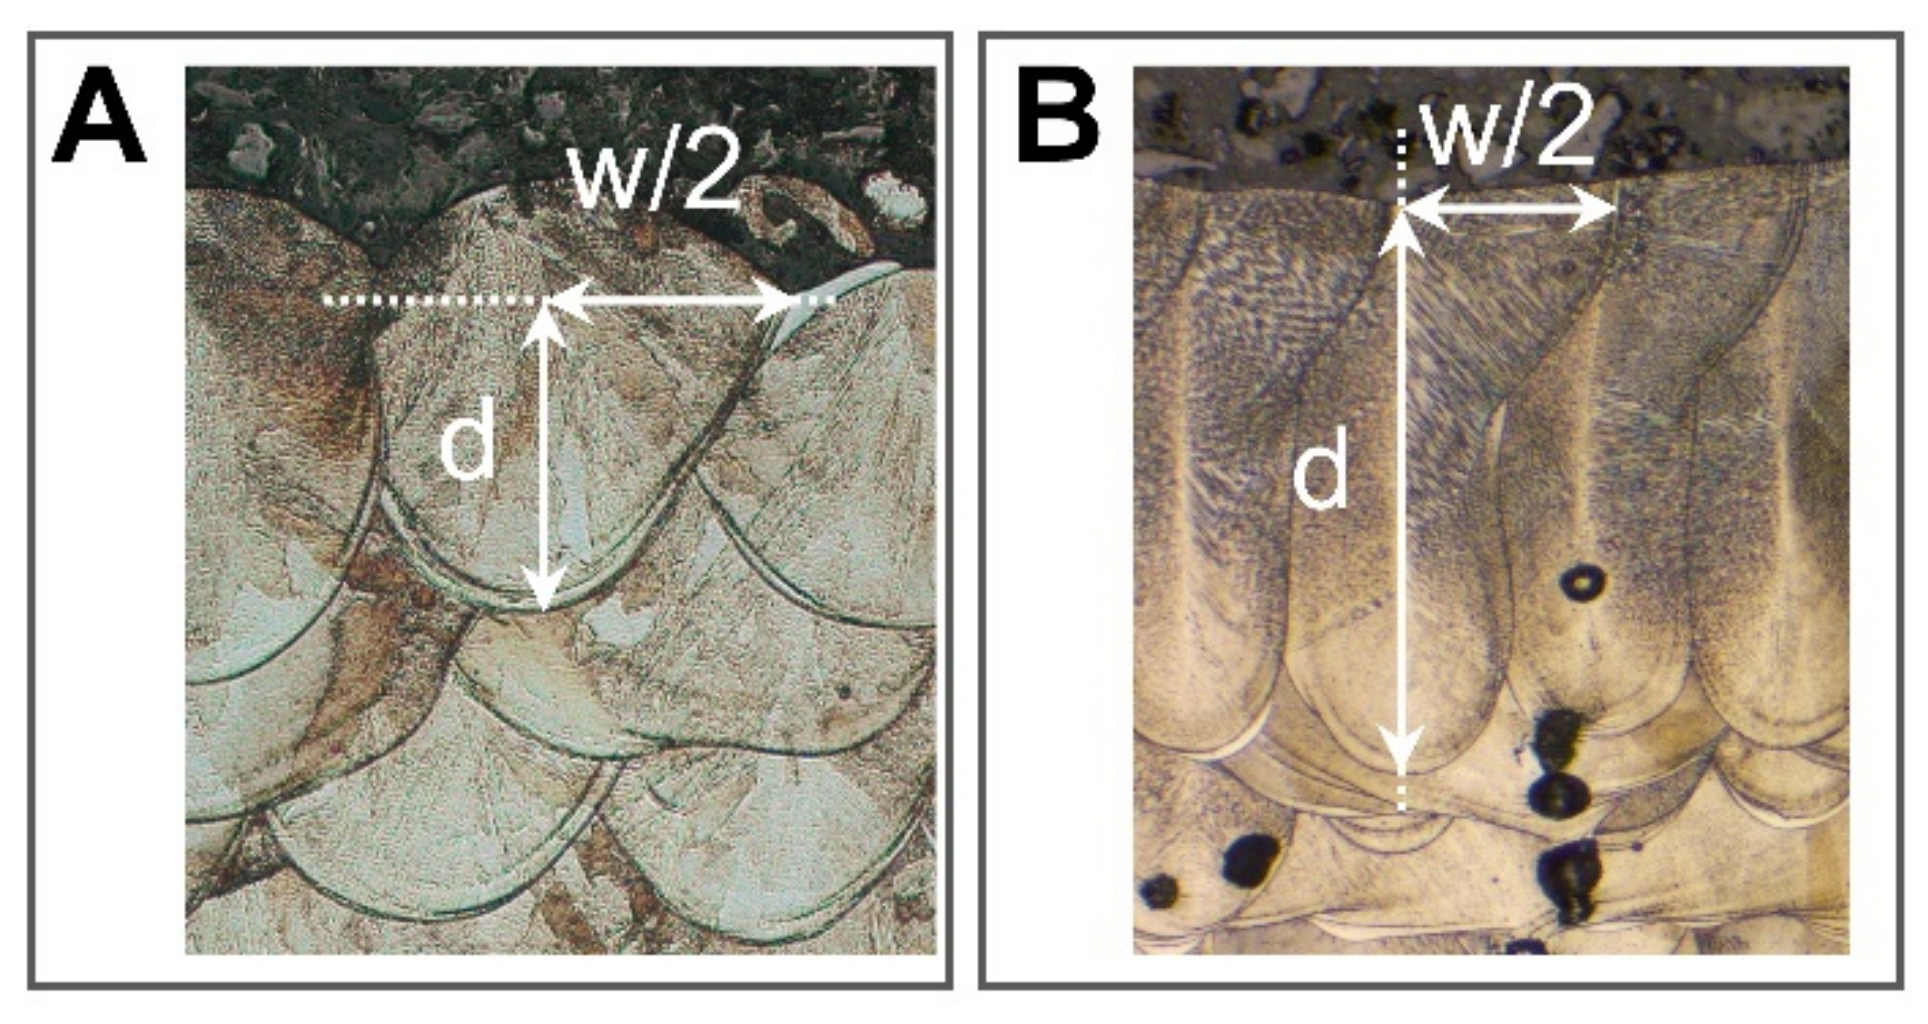
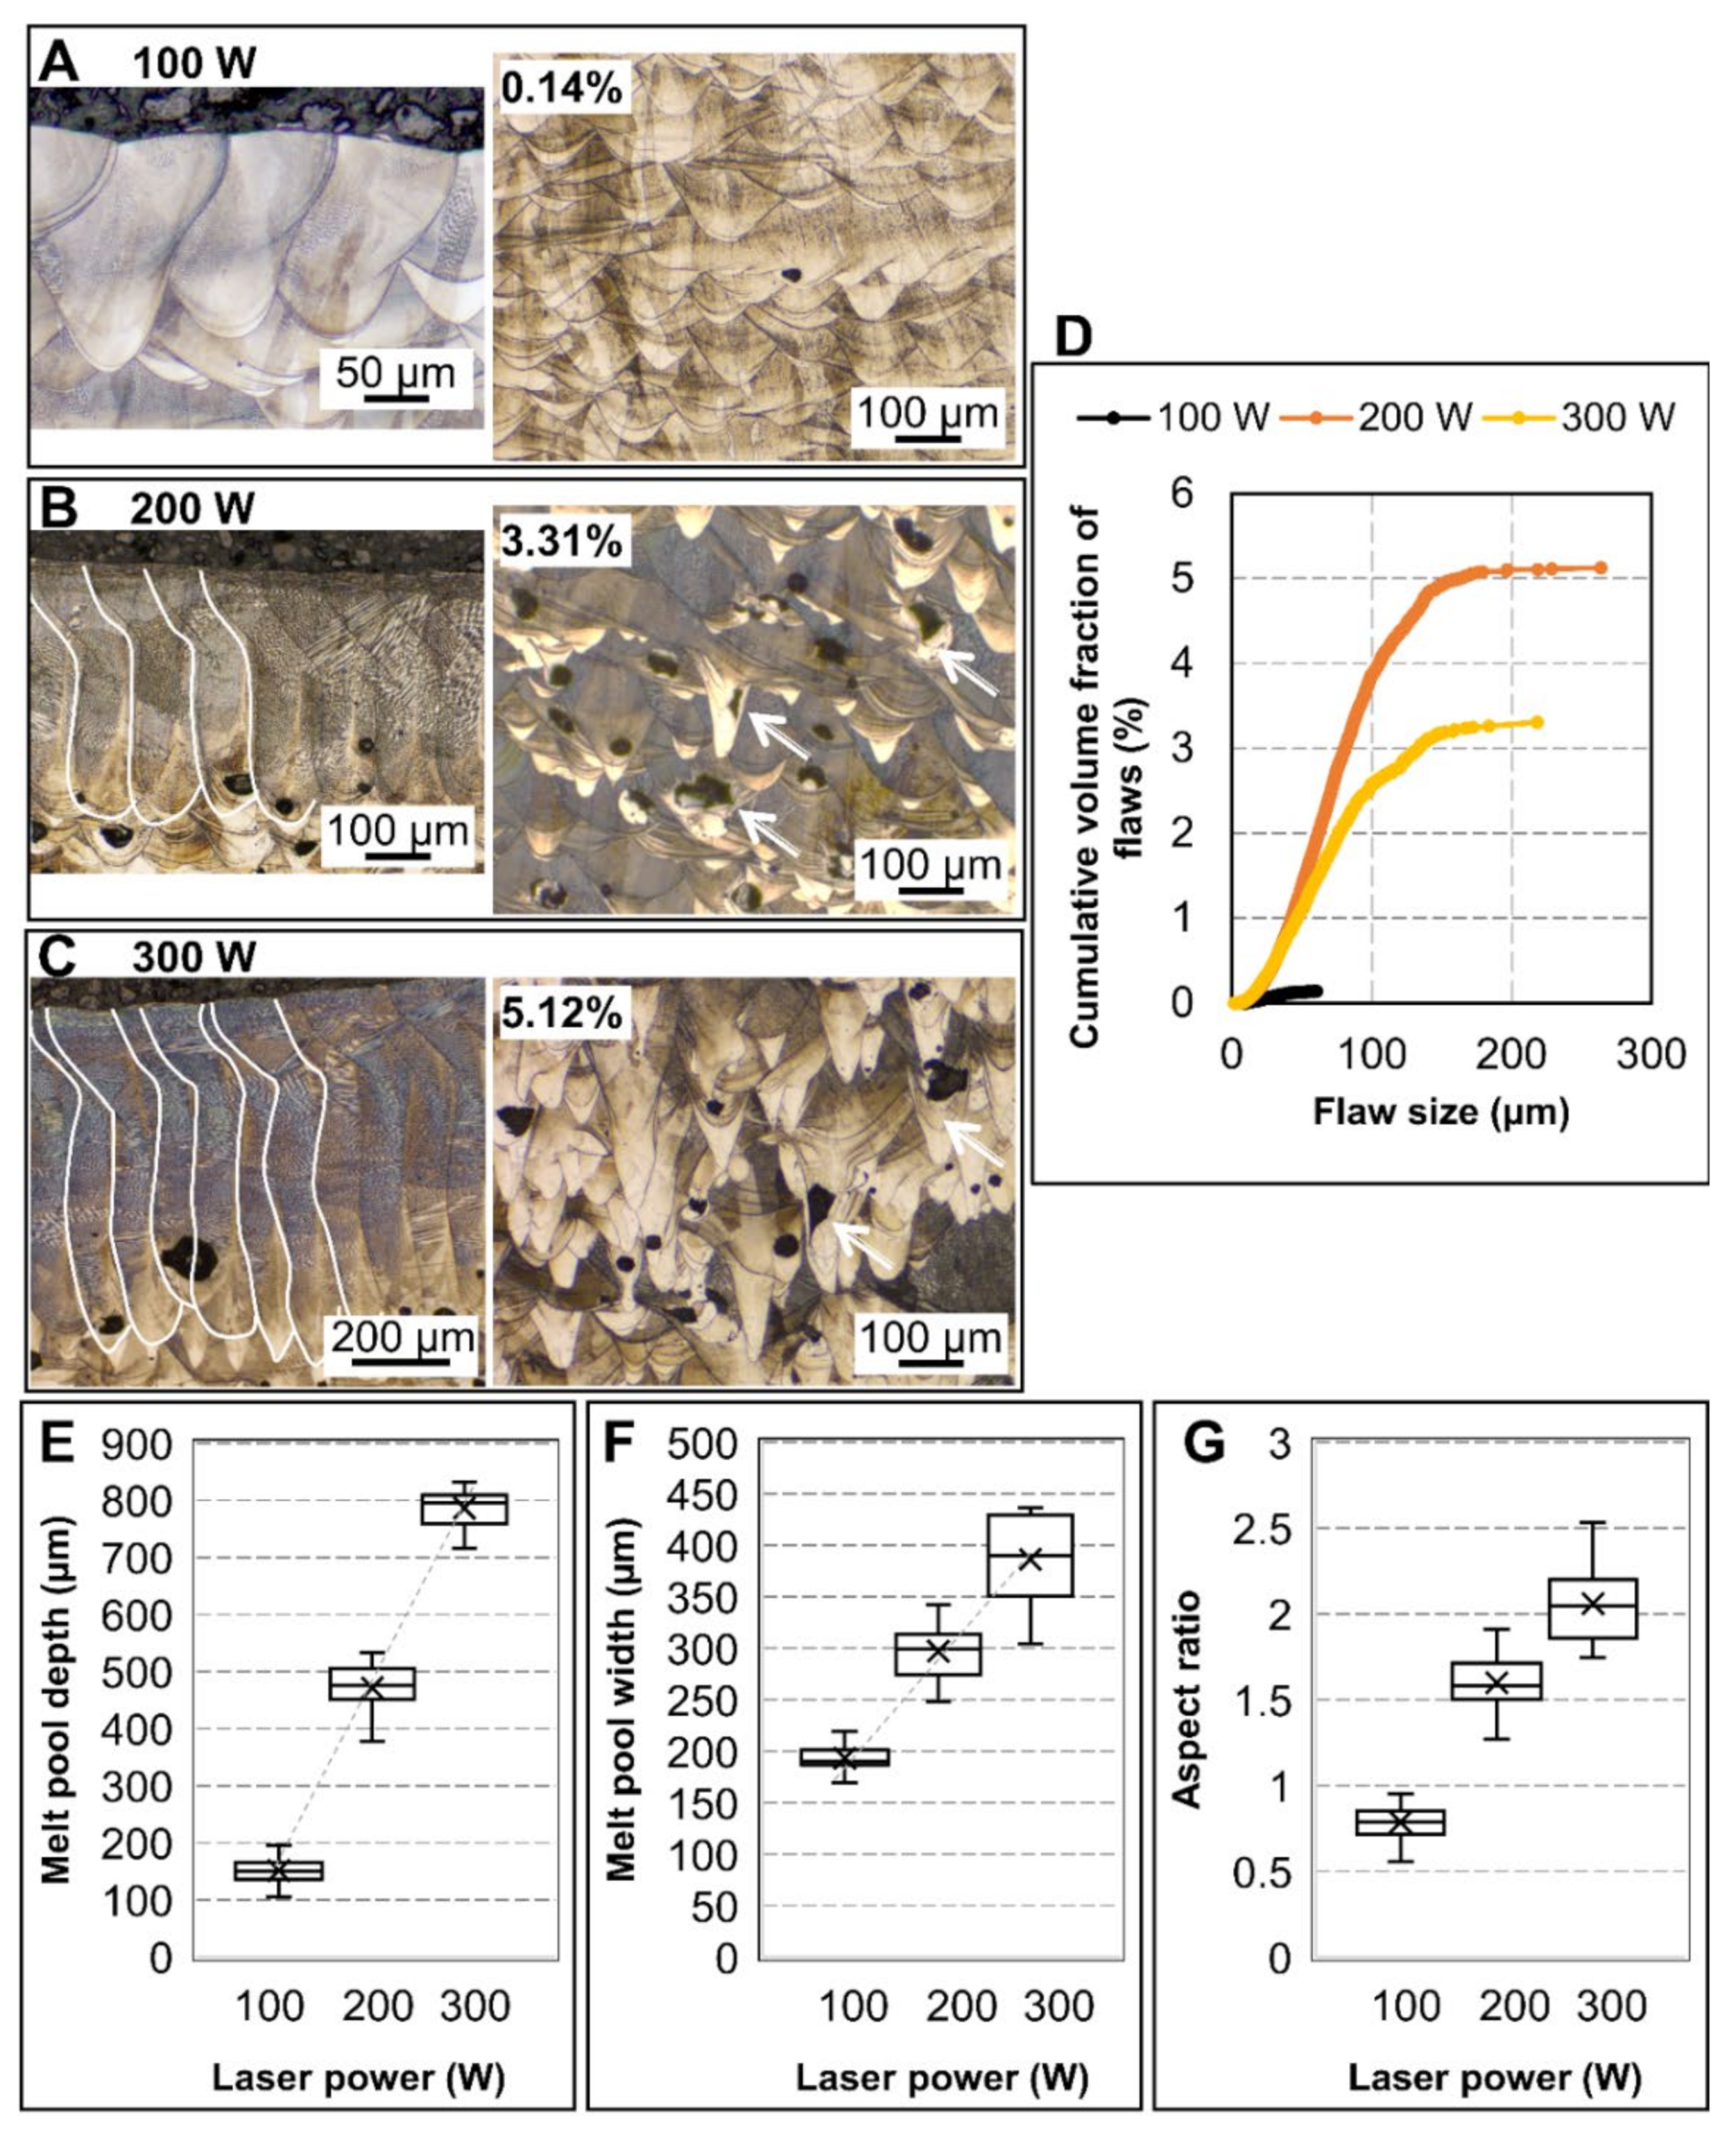
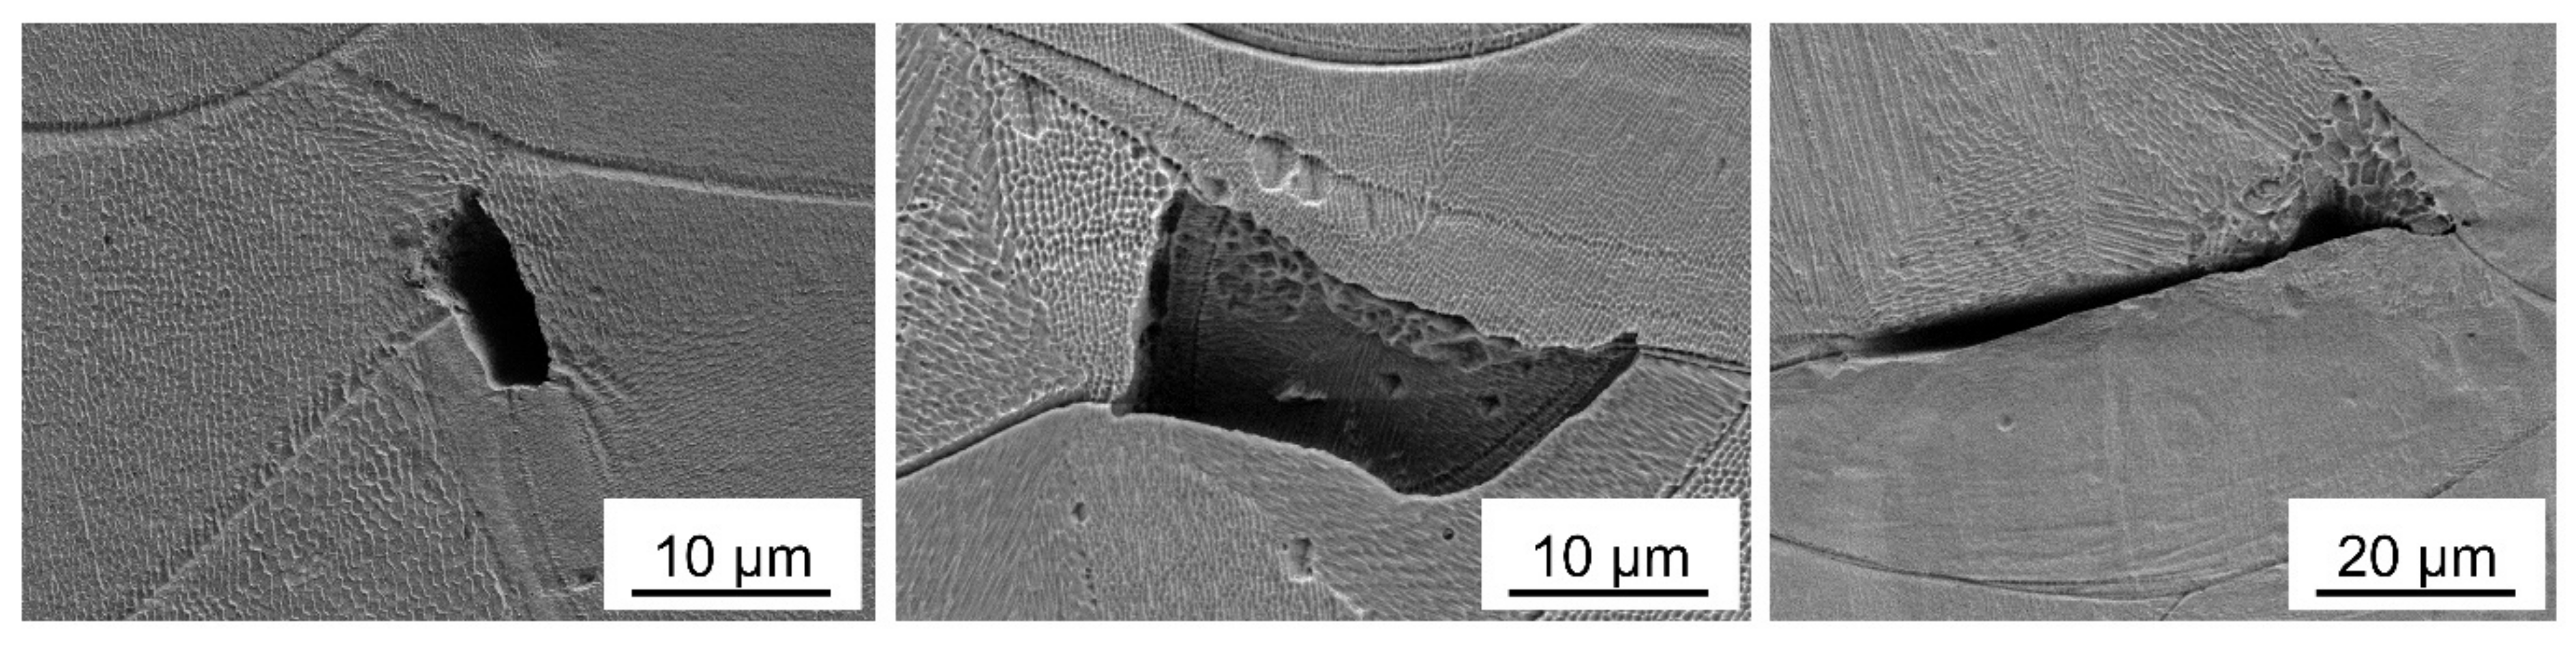
3.1. Melt Pool Geometries and Internal Flaws in the Keyhole Regime

In Table 1, the keyhole regime corresponds to conditions where high laser power and low laser scan speeds are combined. In keyhole fusion, the deep and narrow vapor cavity created allows more efficient use of energy due to the multiple reflections of the laser in this cavity [25]. However, if keyhole fusion is not controlled, the incomplete collapse of the vapor cavity can occur, leaving voids consisting of entrapped vapor [4], i.e., keyhole porosity. In this section, the influence of each process parameter on the melt pool geometry, melt pool emissions, and the incidence of internal flaws within the keyhole regime is analyzed separately.

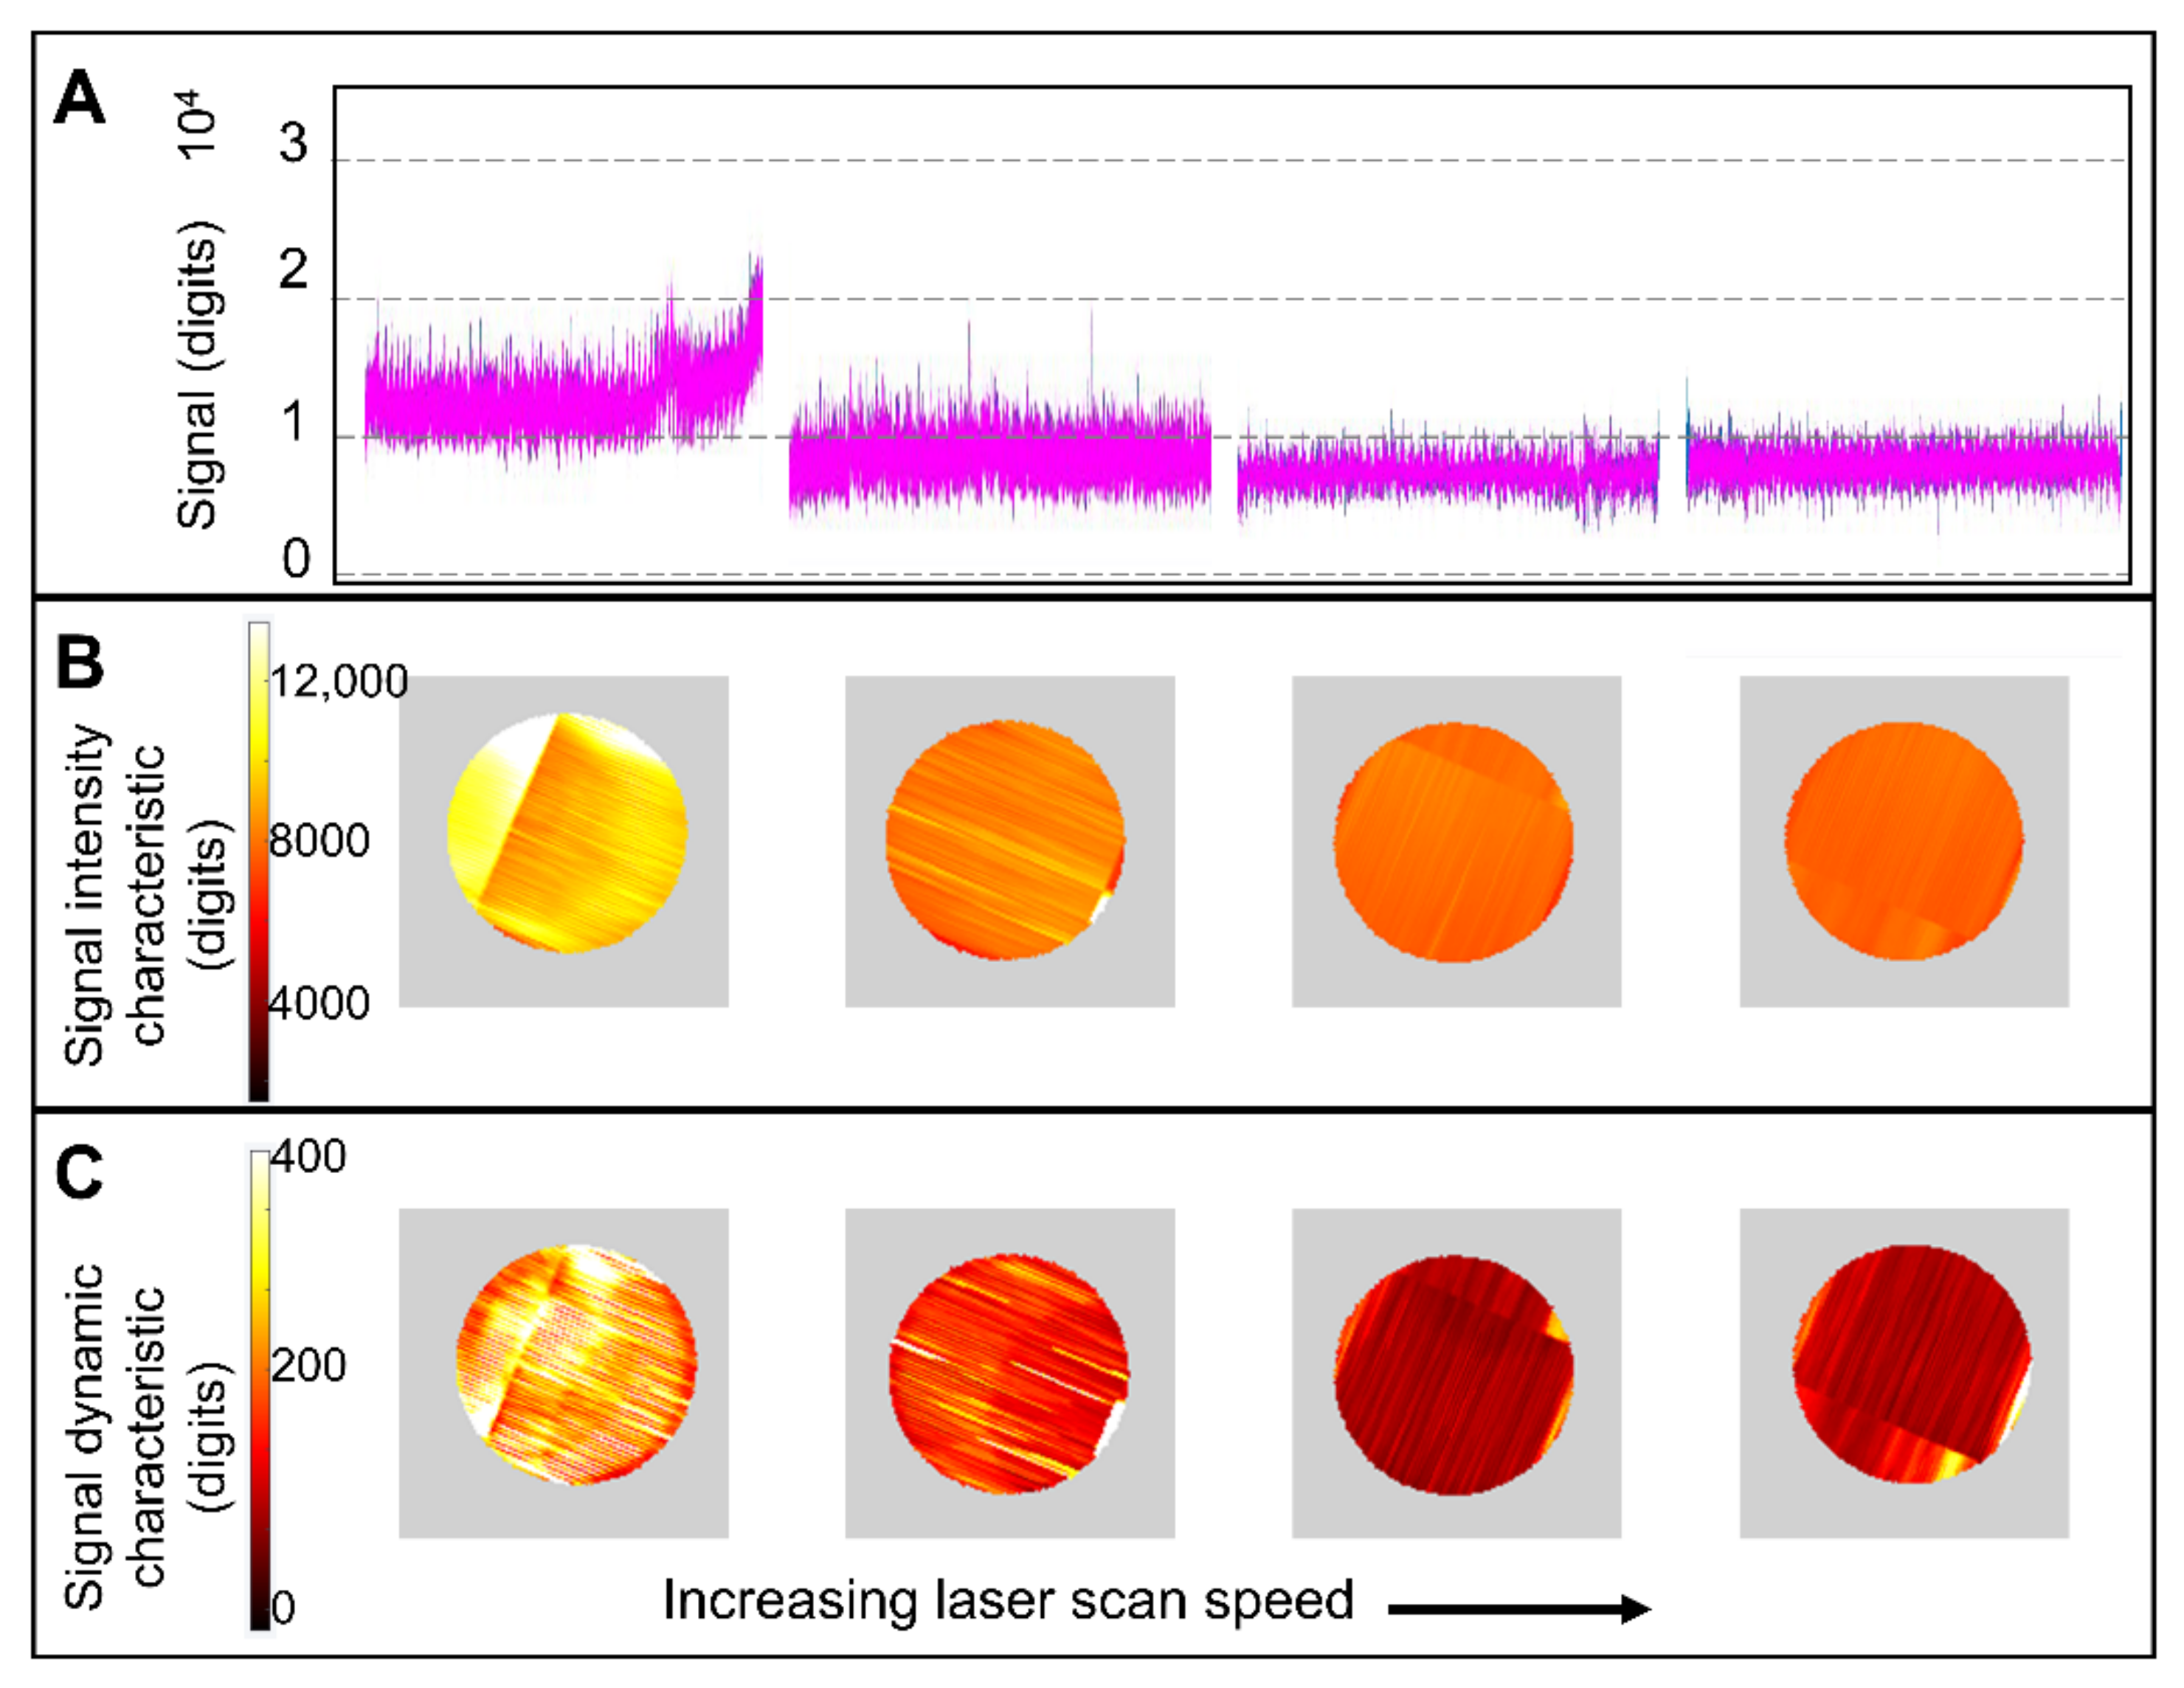
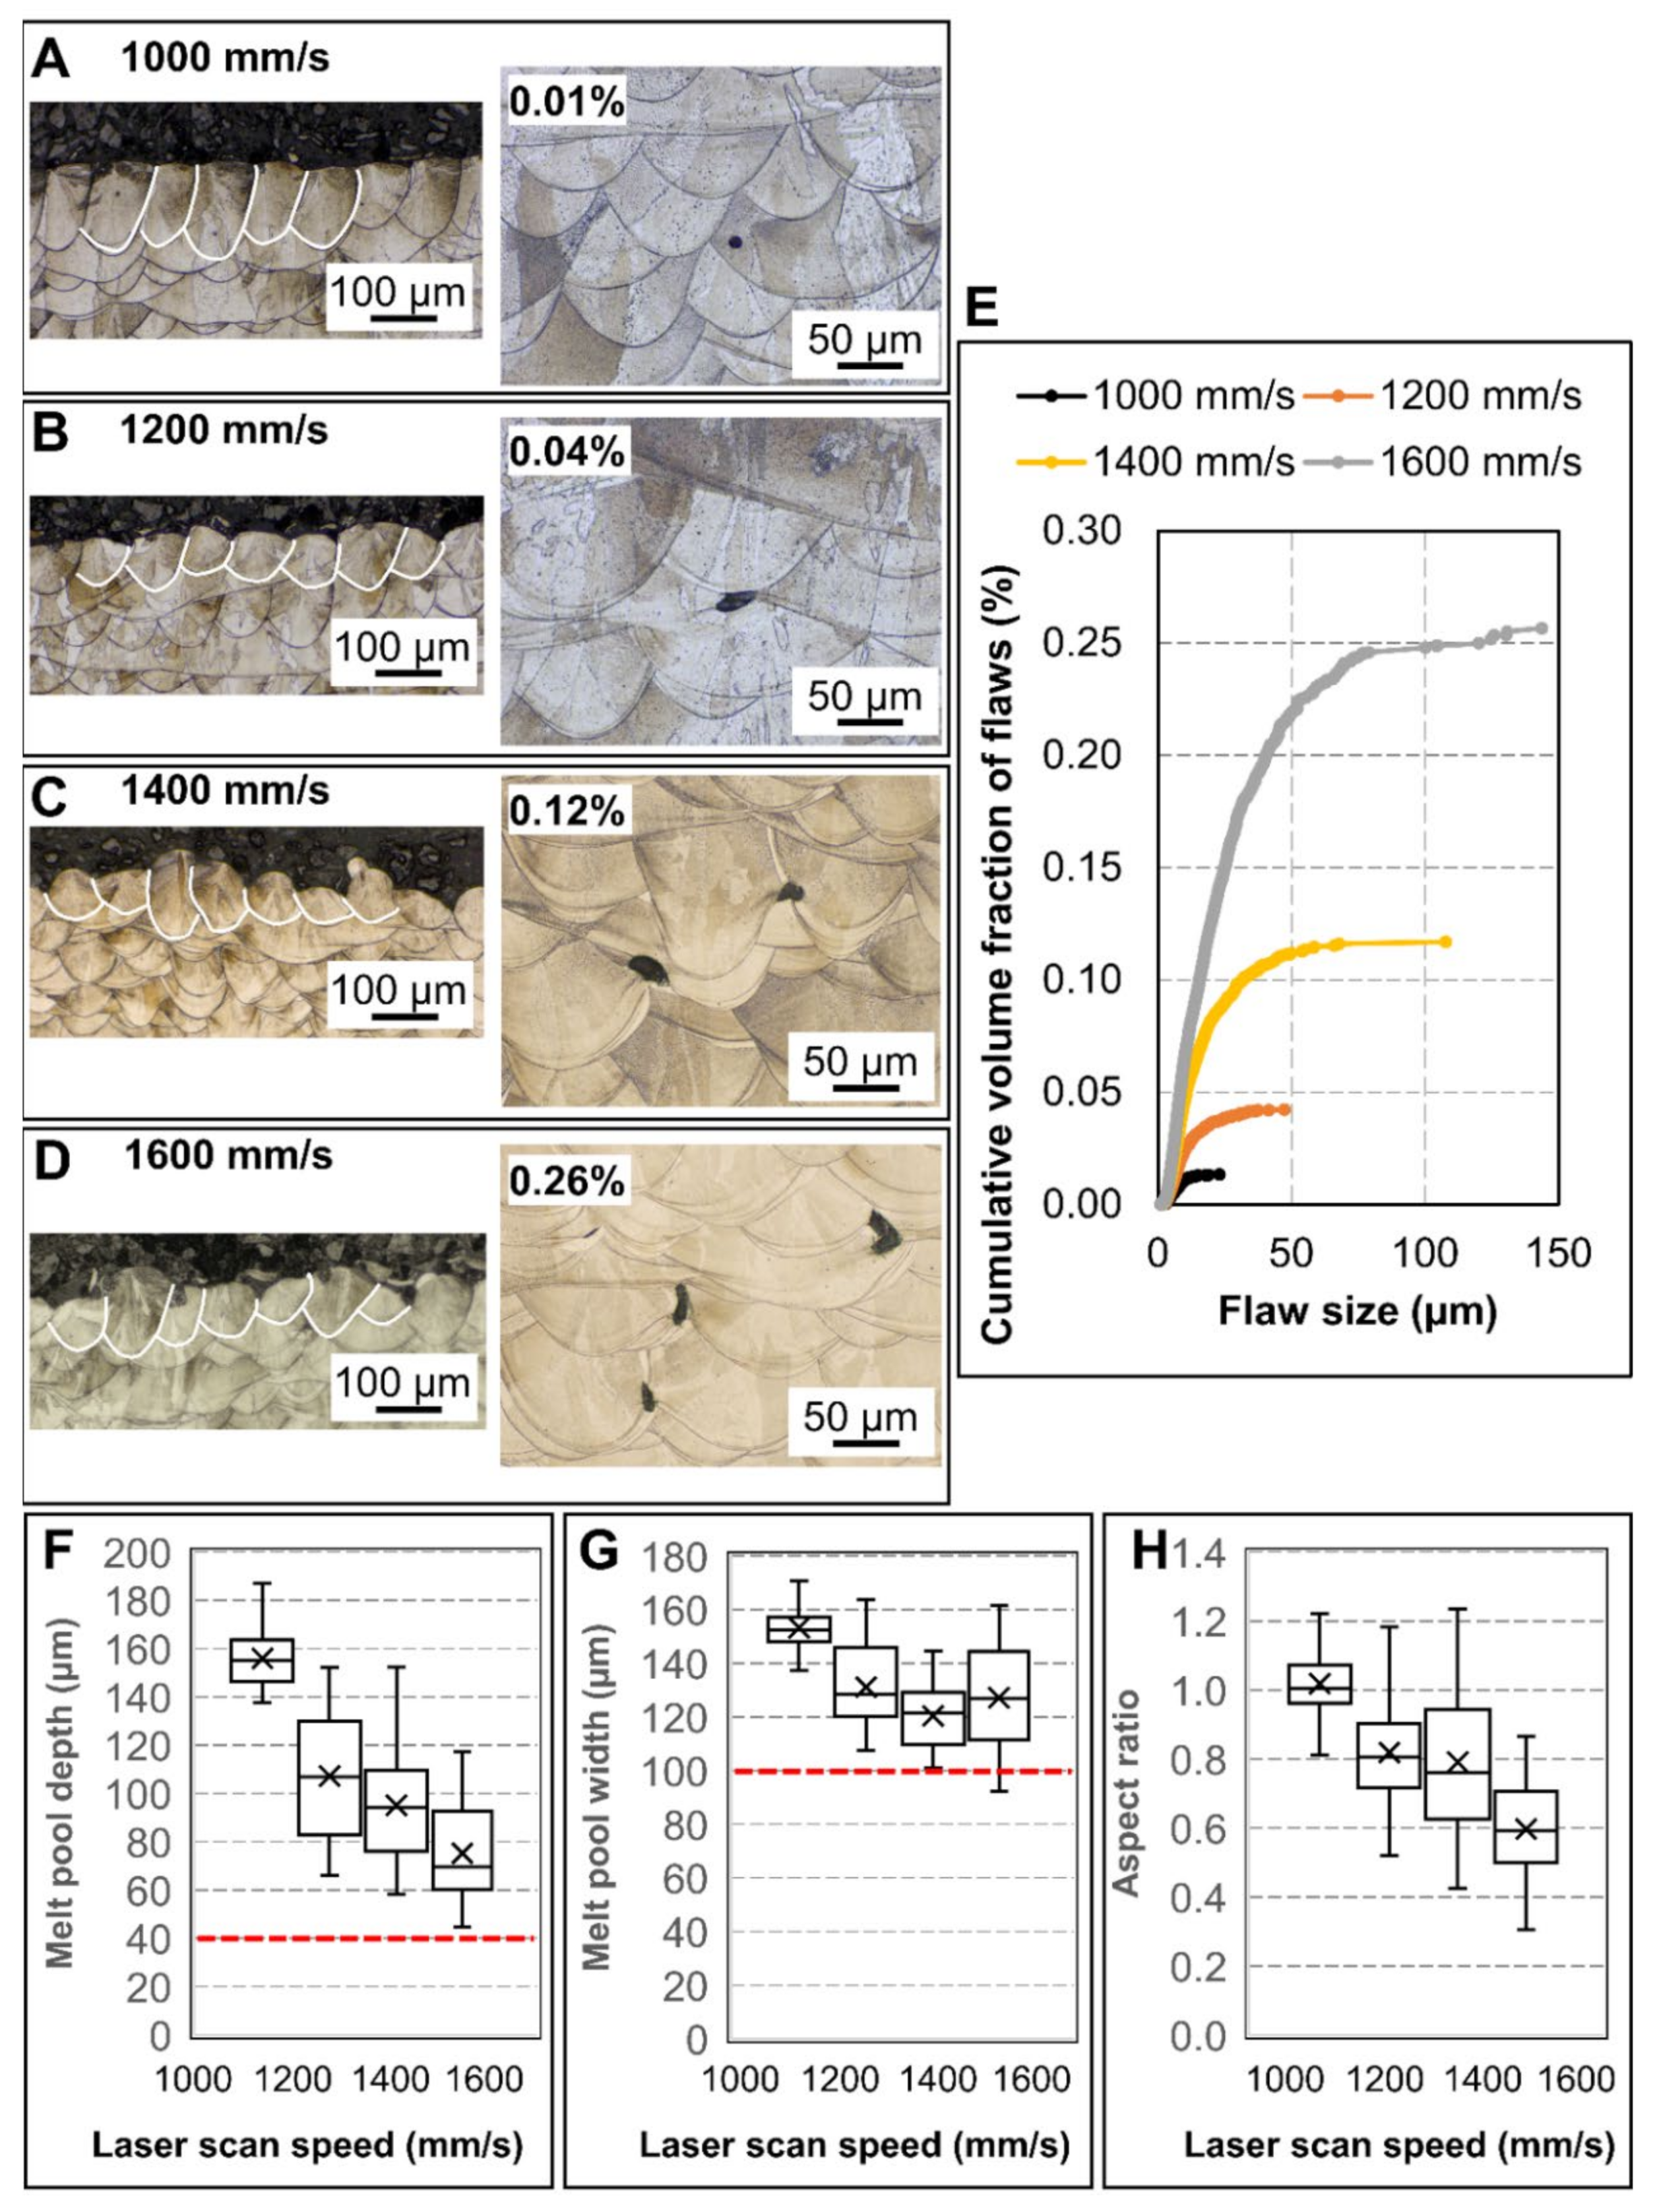
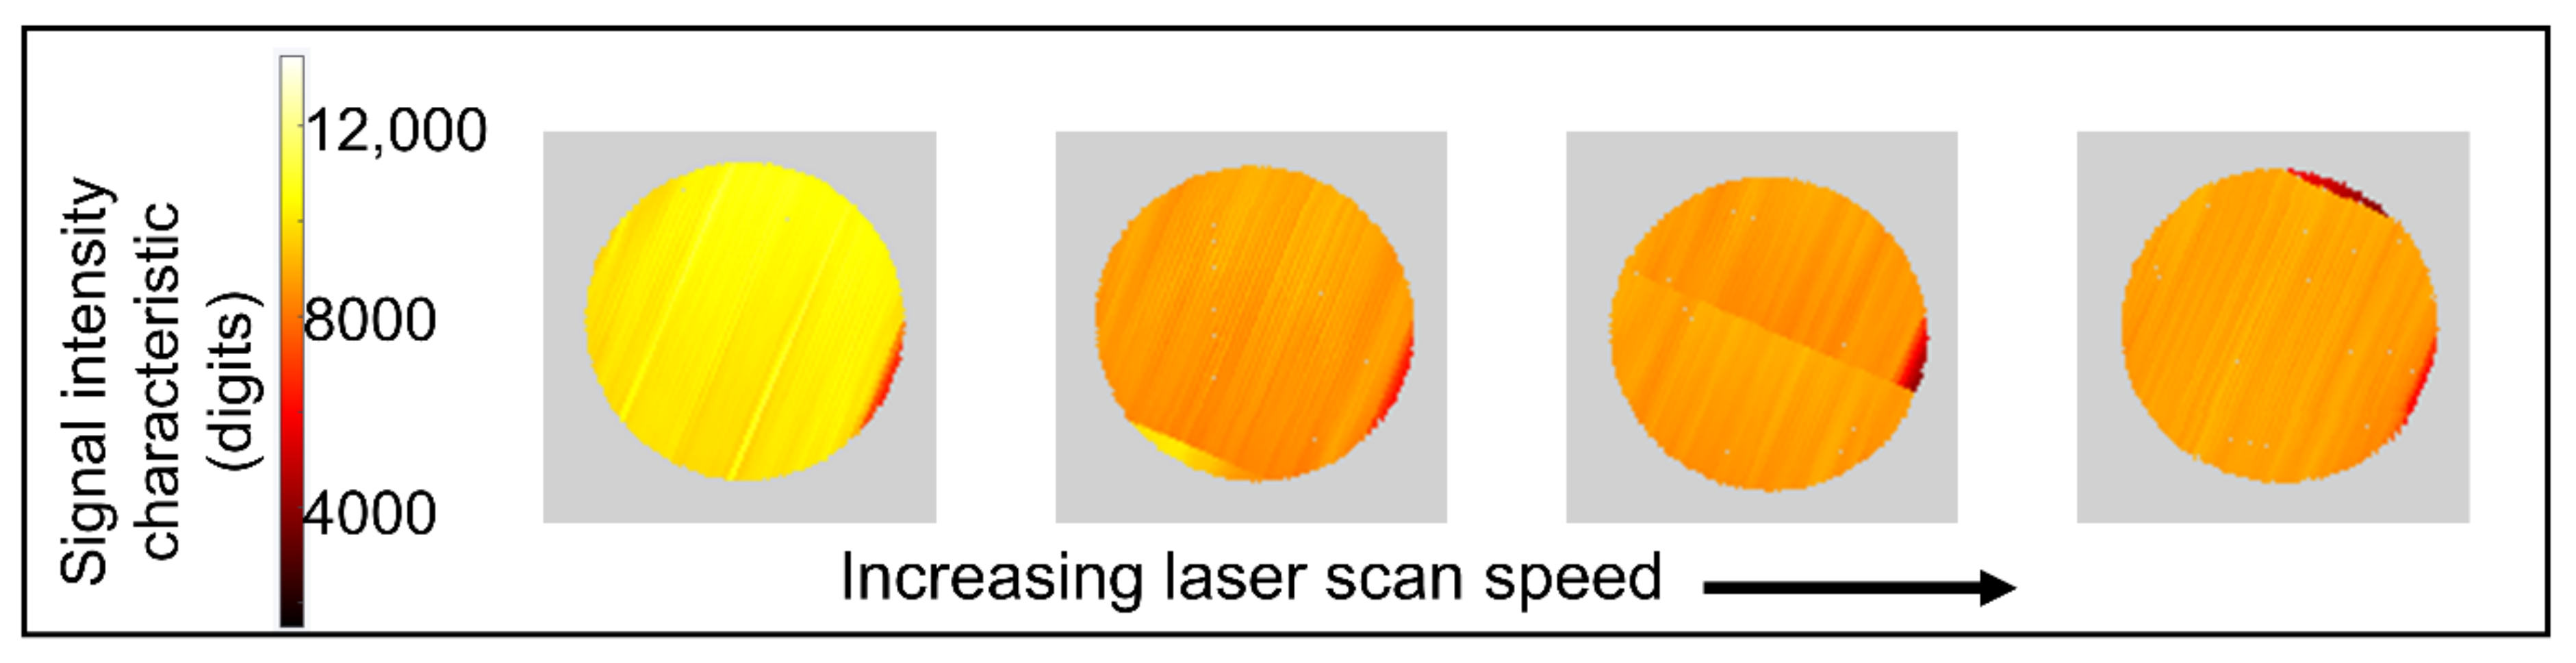
3.1.1. Varying Laser Scan Speed

Within this regime, an increase in the laser scan speed promotes reduction in the melt pool depths, widths, aspect ratios (depth/width), and their variability, as illustrated in Figure 2G–I, which shows a representative subset of the data. As the flaw size distributions are typically right-skewed distribution, with a high quantity of small flaws and a low number of larger flaws, the distributions are graphically represented in the form of cumulative flaw content versus flaw size (Figure 2E,F). The volume fraction of porosities is observed to decrease down to residual levels, less than 0.03%. In the specimens virtually free from internal flaws, the maximum pore size observed is 60 µm, which could indicate that only gas porosity is present. However, metallographic investigation reveals sparse keyhole pores in the bottom region of the melt pools (Figure 2C). Overall, the amount and size of pores are reduced as the laser scan speed is increased and the process transitions to the conduction fusion. Higher volume fraction of systematically occurring internal flaws result in reduced load bearing section, which influences the resulting mechanical properties [26]. Furthermore, internal flaws constitute of stress accumulation sites, which favor crack nucleation, and are favorable paths for crack propagation [27]. Hence, this result indicates that the transition region is important for identifying the process window, agreeing with the findings in [4,13,28,29], for example. In specimens with a substantial volume fraction of porosity, pores larger than 100 µm and up to 260 µm are identified. Further, these specimens contain pores of irregular morphology (indicated in Figure 2A,B) as a result of the flow dynamics in the melt pool and incomplete collapse of the vapor cavity [4].
Figure 3 shows the signal obtained from melt pool monitoring of the last printed layer of specimens analyzed ex situ, as presented in Figure 2. The last layer corresponds to the location where melt pool measurements were taken ex situ, and its signal is deemed representative for not differing significantly from the remaining layers in a given specimen. The raw signal per se reveals that the signal intensity decreases with increasing scan speed, following the same trend as melt pool dimensions and in agreement with the observations in [18]. The signal smoothed by a moving average operation containing 600 points (equivalent to the captures within 0.01 s) and translated to spatial coordinates in Figure 3B shows the locations where signals of high intensity were captured. This representation also allows for visualization of the evolution of melt pool emissions upon increments in the laser scan speed. Figure 3C highlights signal dynamics, also considering moving average in a window of length 600. The spatial representation of signal variations uses the same colormap as previously, with an adjusted scale. These results reveal the signal is more dynamic in specimens manufactured with lower scan speeds, i.e., specimens with larger variation in melt pool dimensions and higher flaw contents identified ex situ.

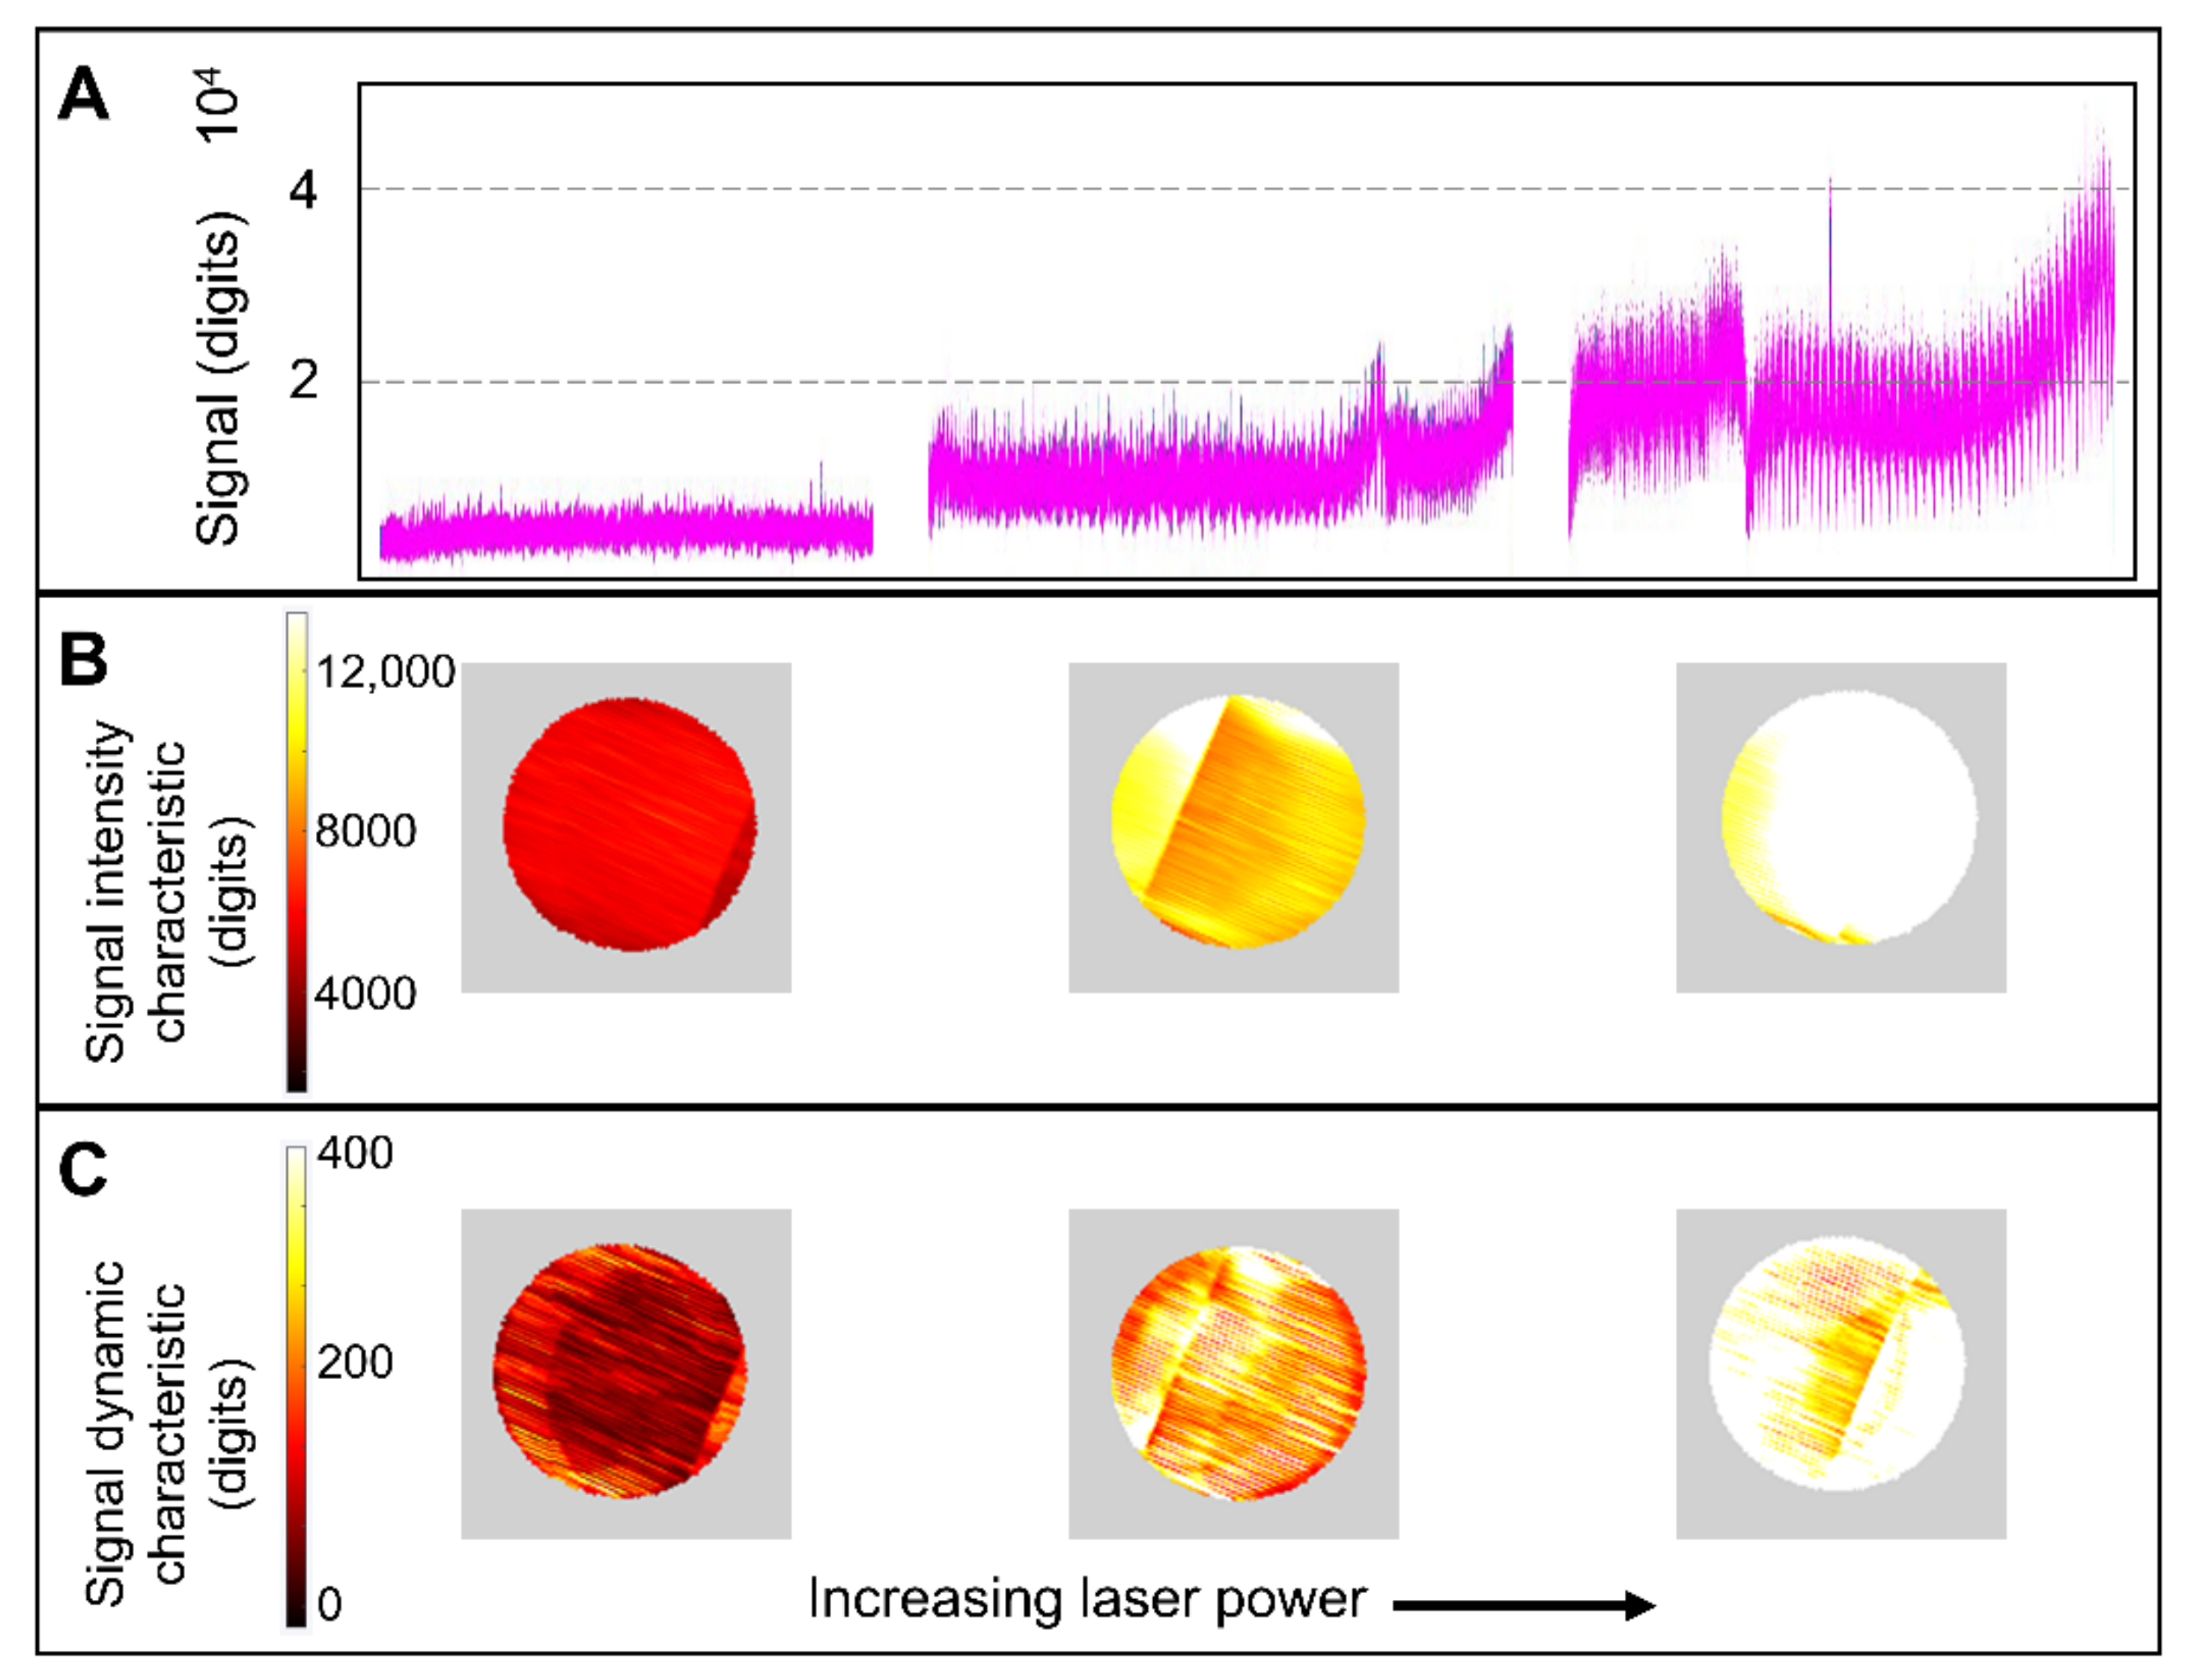
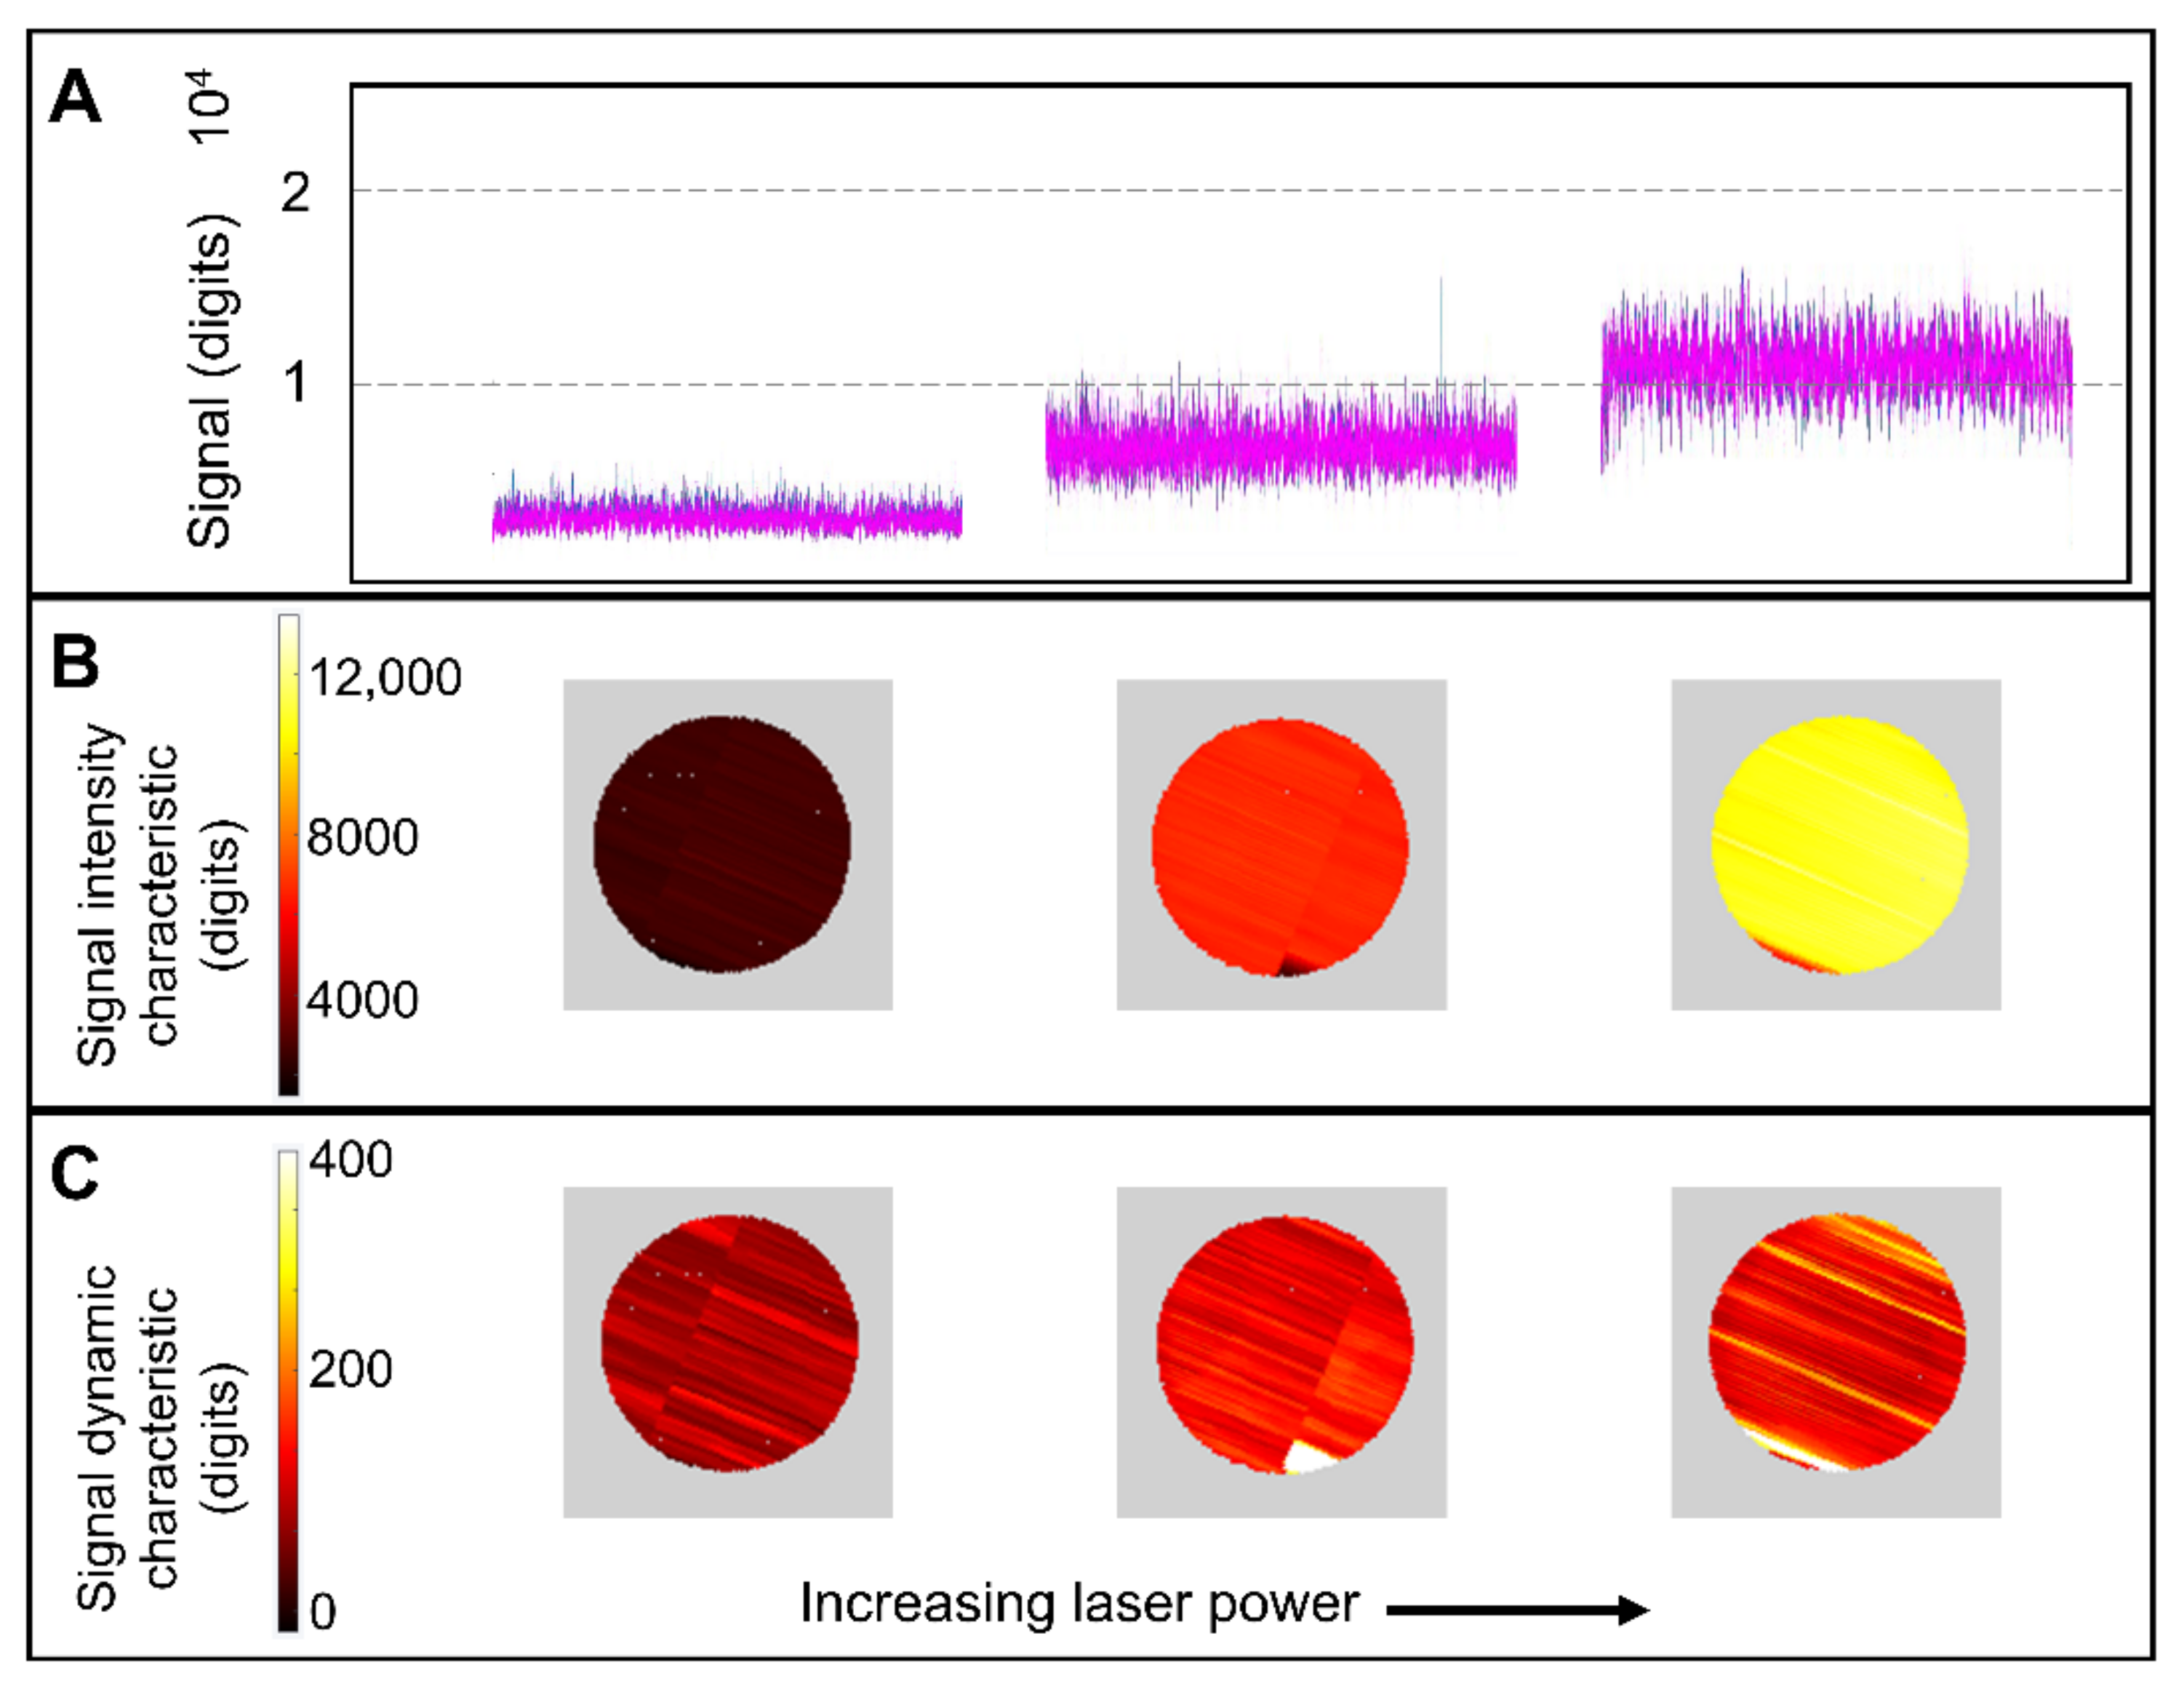
3.1.2. Varying Laser Power

Keyhole fusion and keyhole porosity can occur when processing with the relatively low laser power of 100 W, provided the laser travel velocity is sufficiently low, as illustrated in Figure 4A for nominal laser scan speed 200 mm/s and layer thickness 40 µm. The average melt pool depths increase with laser power in a linear fashion (Figure 4E), as previously observed by Cunningham et al. [30]. A similar trend is observed for the melt pool widths (Figure 4F). The increasing laser power affects melt pool depths more significantly, resulting in increasing aspect ratios (Figure 4G). Larger variability is identified in the melt pool depths and widths stemming from higher laser power. Contrary to the trend observed with variation of laser scan speed, the volume fraction of keyhole porosity does not necessarily increase with the more extreme melt pool geometries. Table 1 reveals that for the lowest laser scan speed analyzed, the maximum volume fraction of porosity was consistently identified at intermediate laser power (200 W). Larger pores are still observed in conjunction with larger volume fraction of flaws, as observed in Figure 4D.
Melt pool monitoring consistently acquires higher intensity signals from specimens where deeper and wider melt pools were revealed ex situ (Figure 5). The signal presents larger fluctuations in specimens with larger scatter in melt pool dimensions, i.e., specimens manufactured with increasing laser power. This result is in agreement with the findings in [31], where, by using a CCD camera to measure the image brightness profiles in the laser irradiation zone and taking solidification temperature as a reference point, it was found that the maximum temperature of the melt pools increased significantly with laser power and that the width and depth of the melt pool had a strong correlation with this estimation of temperature. Further, in [18], it was observed that the acquired infrared signal intensities in melt pool monitoring increase with laser power.

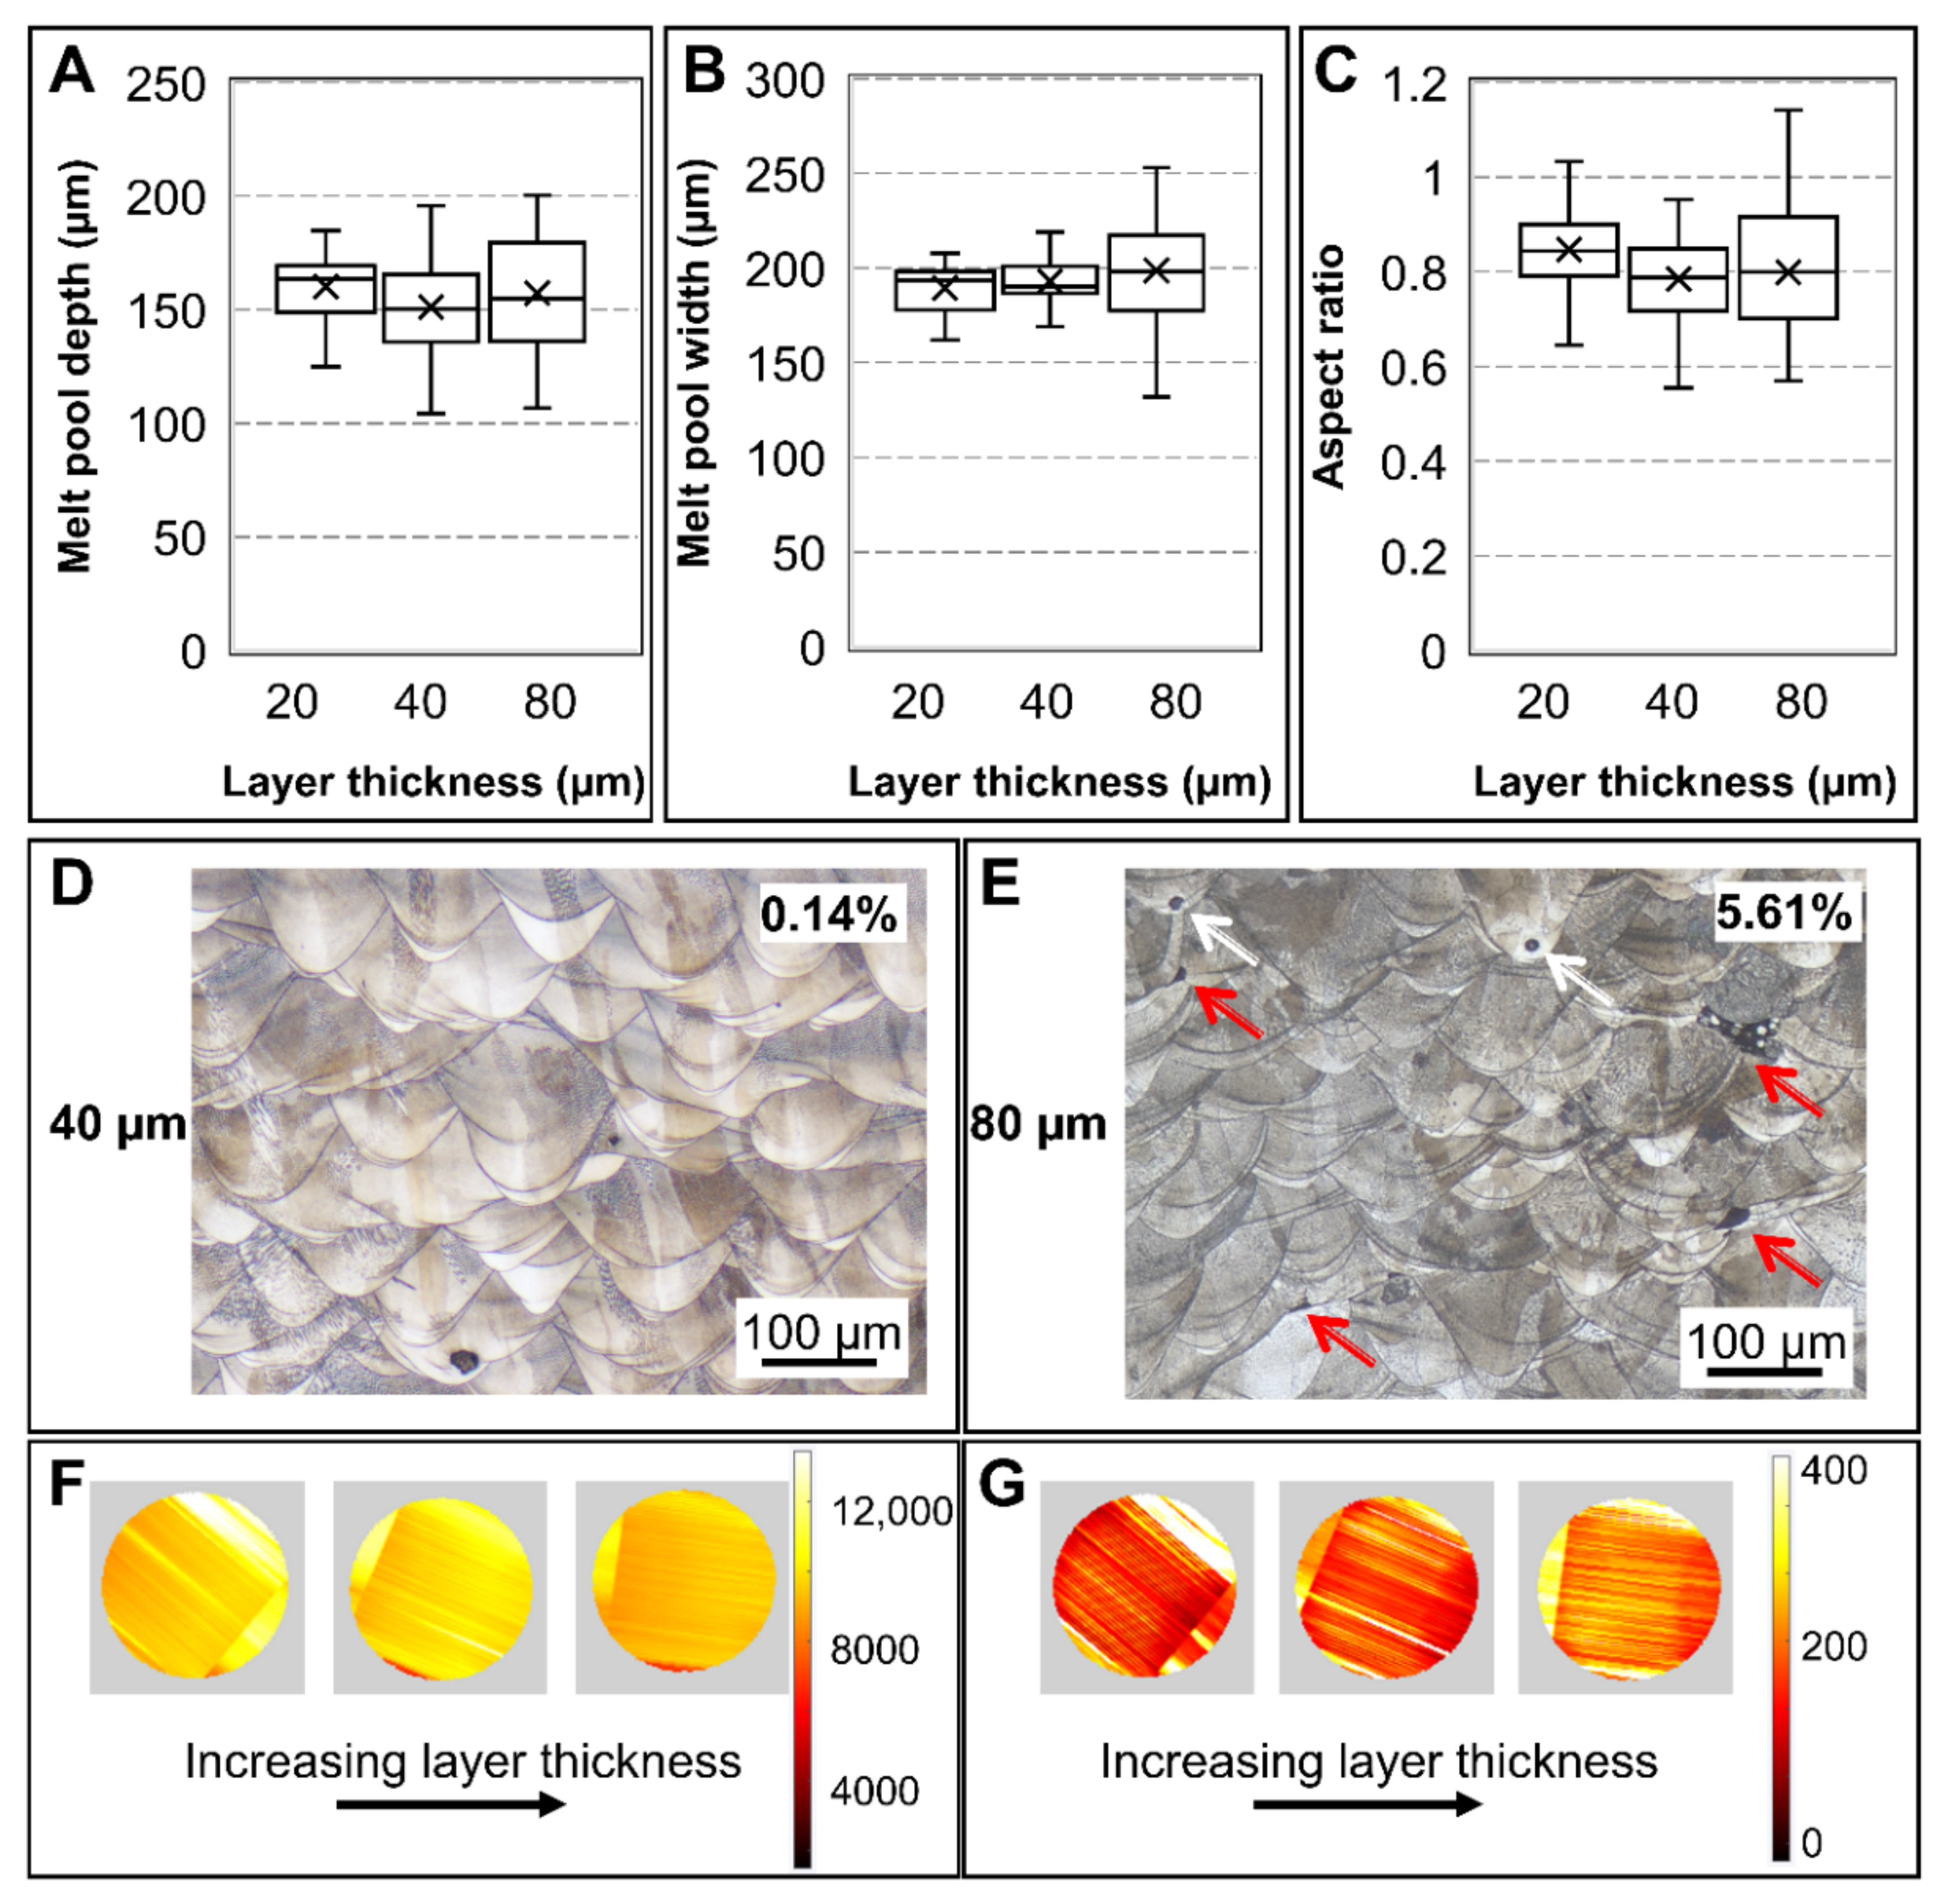
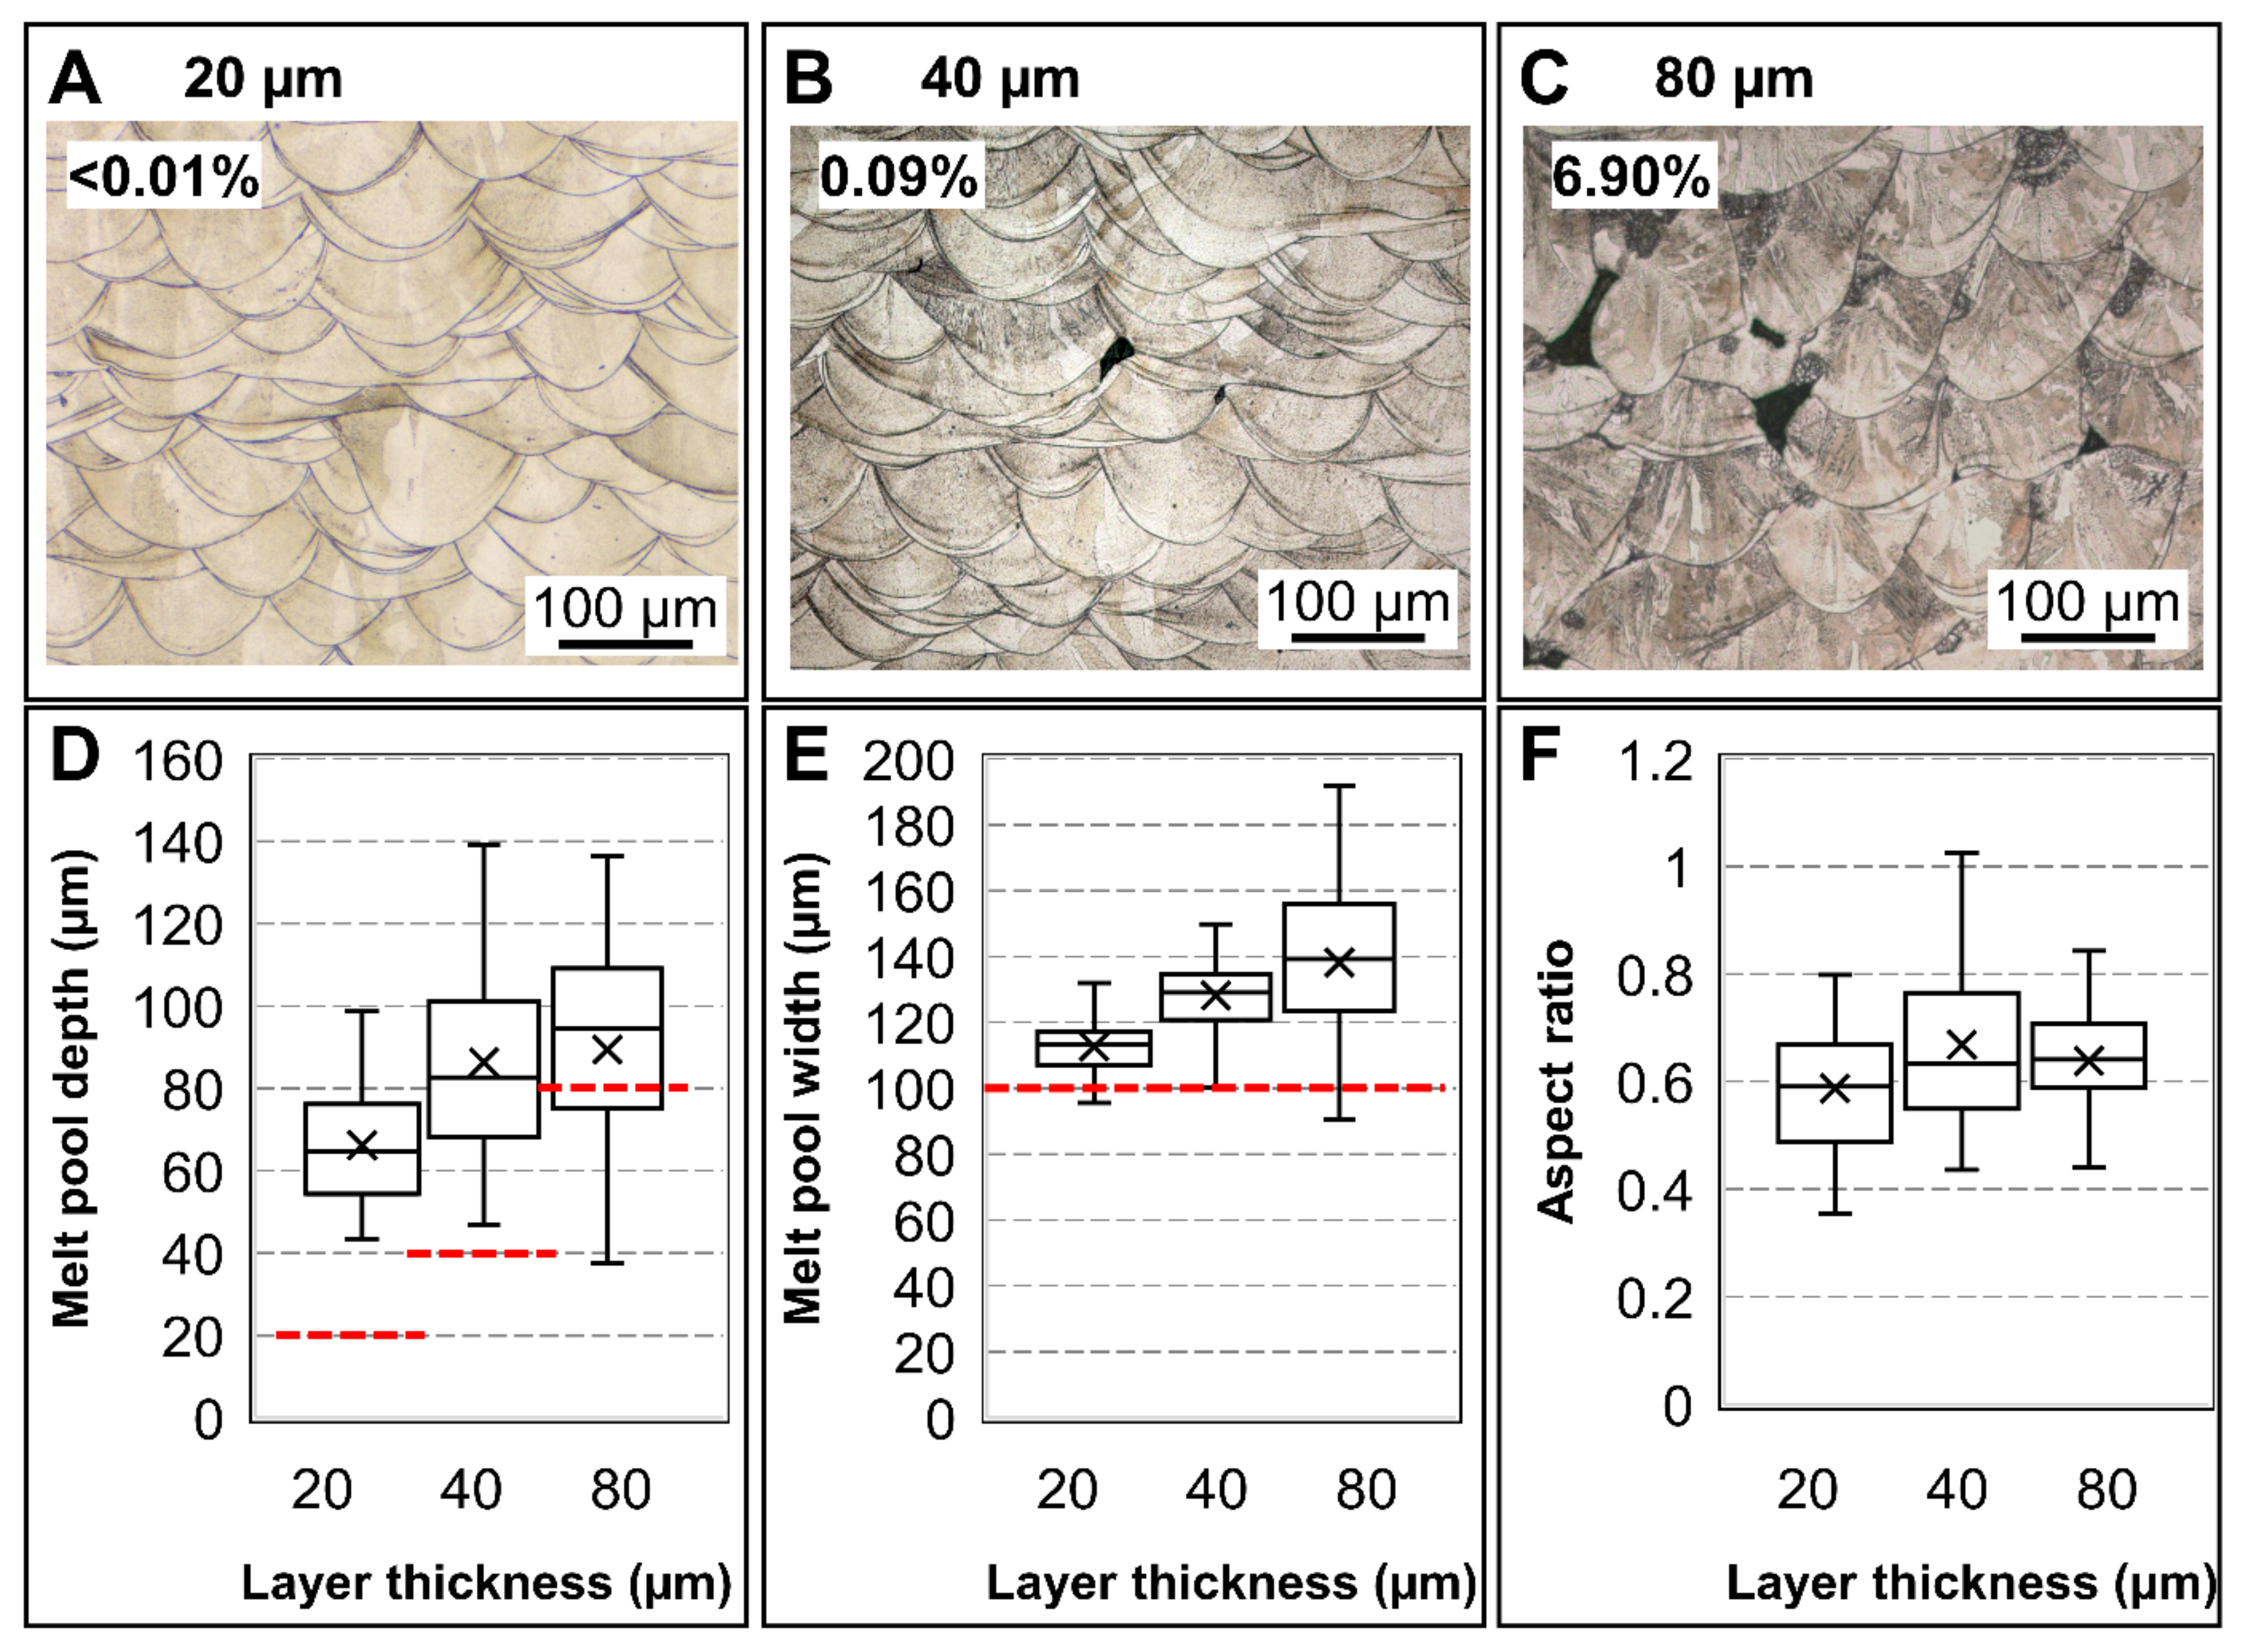
3.1.3. Varying Layer Thickness

No major changes are normally observed in melt pool geometries or in the incidence of internal flaws with a varying layer thickness in the keyhole regime. Exceptions can occur in case the processing conditions enable the formation of lack of fusion in addition to keyhole and gas pores, as observed in the manufacturing with nominal laser power 100 W, scan speed 200 mm/s and layer thickness 80 µm. In this case, the melt pool depths obtained are comparable to this layer thickness value (Figure 6A), resulting in the insufficient overlap of adjacent melt pools, i.e., lack of fusion flaws. Since the combined laser power and scan speed utilized give rise to keyhole porosity, in this specimen, keyhole porosity and lack of fusion coexist (Figure 6E). Larger scatter on the melt pool dimensions is also observed in this specimen (Figure 6A,B). No significant differences are observed from monitoring of the melt pools during manufacturing of these specimens–similar intensities and melt pool dynamic characteristics are identified, despite the distinct flaw populations. This observation suggests that melt pool monitoring has a fair correspondence to melt pool dimensions but not to the presence of internal flaws.
In the specimens analyzed in this study, the largest keyhole pores formed are over 200 µm and can be as large as 300 µm. These extreme pores usually present irregular morphologies (Figure 7A) in relation to smaller pores (Figure 7B,C); and can be particularly detrimental to dynamic properties, as the fatigue performance responds critically to pore rounding [32].

3.2. Melt Pools and Internal Flaws in the Conduction Regime

The process conditions in which conduction fusion occurs are visualized in Table 1 and correspond to the combination of low laser power and high laser scan speed. In this section, the influence of each process parameter on the melt pool geometry and the incidence of internal flaws within the conduction regime is analyzed separately.

3.2.1. Varying Laser Power

The laser power has a major influence on the melt pool dimensions, as already observed in the keyhole regime. However, in the conduction regime, the melt pools are significantly smaller, comparable to parameters as layer thickness (Figure 8D) and hatch spacing (Figure 8E). Red dashed lines indicate the respective parameters used in the specimens illustrated. Distributions of melt pool dimensions that overlap the nominal geometrical parameters result in significant volume fraction of flaws (over 14% in the example illustrated). Hence, the occurrence of lack of fusion flaws is sensitive to variations in laser power as it promotes appreciable differences in melt pool dimensions.
As shown in Figure 9, for the conduction regime, the signal intensities increase with melt pool dimensions, i.e., with laser power, as also observed for the keyhole regime. However, the signal is also increasingly dynamic with increasing laser power, despite the decreasing scatter in melt pool dimensions and lower quantity of flaws. This characteristic of signal dynamics is possibly correlated to the generation of spatter, which is boosted with high energy input, both by the influence of laser power [33,34] or laser scan speed [35]. Hence, this result indicates that the signal dynamics characteristic corresponds to the dynamics in the melt pool responsible for the generation of process byproducts rather than the variation in melt pool dimensions.

3.2.2. Varying Laser Scan Speed

The changes in melt pool signal, dimensions and flaw populations promoted by variations in laser scan speed are relatively more subtle in the investigated parameter range than those promoted by variation of laser power. Figure 10E shows the distribution of flaw sizes and volume fraction of flaws obtained with varying laser scan speeds. In two of the specimens, both the volume fraction and the individual flaw sizes can be considered low (below 0.05% and 50 µm, respectively), which could indicate gas porosity as the only type of flaw present. However, metallographic analysis reveals a systematic lack of fusion flaws even though the relative density is as high as 99.96% (Figure 10B), which is an important result as the relative density is the most often used processability metric in LPBF. Lack of fusion flaws is generally not desirable due to their morphology, which makes them into stress concentrators [1]. The morphology of a relatively small lack of fusion flaws can be observed in detail in Figure 11, where the melt pool boundaries are also visible. On the other hand, the flaw size is also a major factor in the dynamic performance of materials, including those manufactured additively [36]. As larger flaws are identified in specimens with lower relative densities, densities can be used as a relative metric for comparison of processability.
The trends in intensity characteristics obtained from melt pool monitoring (Figure 12) correspond to those observed ex situ through measurements of the melt pool dimensions. The specimen manufactured with the lowest scan speed has significantly larger melt pools and higher signal intensity characteristics than the remaining specimens analyzed. The melt pool dimensions of the remaining specimens decrease with increasing laser scan speed but are comparable to one another, as are the intensity characteristics.
In the conduction mode, specimens containing only gas porosity (e.g., Figure 10A) and specimens containing lack of fusion (e.g., Figure 10B–D) are identified. Specimens containing only gas porosity are located in the adjacencies of the transition to keyhole fusion, as the energy input enables the formation of deeper (Figure 10F) and wider melt pools (Figure 10G). In these specimens, the melt pools present less variability and higher aspect ratios (Figure 10H). In specimens containing systematic lack of fusion, the lower end of the distribution of melt pool depths approaches the nominal layer thickness (i.e., 40 µm in Figure 10), and the lower tail of the distribution of melt pool widths approaches and even overlaps the nominal hatch spacing (100 µm).

3.2.3. Varying Layer Thickness

The increase in layer thickness in the conduction regime promotes a slight increase in melt pool dimensions (Figure 13D,E), a difference appreciable due to the small melt pools, with dimensions comparable to the thickness of the powder layer. The relative enlargement of the melt pool is, however, not sufficient to avoid lack of fusion. Higher variability in melt pool dimensions is observed in specimens containing lack of fusion. As in the keyhole regime, no significant differences in the melt pool signal intensity and dynamic characteristics are identified.

4. Conclusions

This study collectively addressed melt pool variability, its detectability through state-of-the-art melt pool monitoring, and its influence on the formation of internal flaws in multilayer builds in both conduction and keyhole fusion when processing Hastelloy X by means of LPBF.
In the keyhole regime, the amount and size of pores are reduced as the process transitions to conduction fusion. The volume fraction of pores can reach residual levels with the systematic presence of keyhole pores and in specimens containing only gas porosity despite manufacturing in the keyhole regime. The volume fraction of keyhole porosity does not necessarily increase with the more extreme melt pool geometries. It is possible to obtain large keyhole pores, over 200 μm, that, in addition, present irregular notch-like morphologies, which are particularly detrimental to dynamic properties.
In the conduction regime, systematic lack of fusion is identified in specimens with relative densities as high as 99.96%. This is an important result as the relative density is the most used processability metric in LPBF, and as lack of fusion flaws are generally not desirable for acting as stress concentrators.
Higher volume fractions of flaws are usually accompanied by larger flaws and larger variation in melt pool dimensions, as the factor-by-factor analysis in both fusion regimes shows. The larger variation in melt pool dimensions is likely due to an increasingly irregular substrate where the melt pools are deposited due to the presence of larger and more abundant internal flaws. The monitoring system utilized in this study, based on the acquisition of visible and infrared emissions by means of a photodiode installed on-axis, is not necessarily suited for the detection of these flaws. On the other hand, the signal intensities are proportional to the melt pool dimensions, and the signal dynamics characteristics relate to processing conditions known to generate spatter, which indicates that the monitoring system used can be employed to detect instabilities that can generate spatters and thereby stochastic flaws elsewhere in the build area [37].

Author Contributions

Conceptualization, C.S.; methodology, C.S.; formal analysis, C.S.; writing—original draft preparation, C.S.; visualization, C.S.; writing—review and editing, L.N.; supervision, L.N.; project administration, L.N.; funding acquisition, L.N. All authors have read and agreed to the published version of the manuscript.

Funding

This research was funded by European Union’s Horizon 2020 research and innovation programme, grant number 820774 within project MANUELA—Additive Manufacturing using Metal Pilot Line. This work was conducted within the framework of the Centre for Additive Manufacturing—Metal (CAM2), supported by the Swedish Governmental Agency of Innovation Systems (Vinnova) under grant number 2016-05175.

Data Availability Statement

Not applicable.

Acknowledgments

The authors would like to thank Electro Optical Systems Finland Oy for providing the feedstock powder utilized in this research.

Conflicts of Interest

The authors declare no conflict of interest. The funders had no role in the design of the study; in the collection, analyses, or interpretation of data; in the writing of the manuscript, or in the decision to publish the results.

Appendix A

Table A1. Largest flaw size (µm) identified across the process space. “N/A” indicates manufacturing could not be completed due to extreme processing conditions.
Laser Scan Speed (mm/s)
2004006008001000120014001600
Laser power: 100 WNominal layer thickness (µm)20745881148359517509787
4060325209651790136715692239
80186715011271188025668117N/AN/A
Laser power: 200 WNominal layer thickness (µm)2022621484173586122196
40264145595170158260614
8028915391195794133615901971
Laser power: 300 WNominal layer thickness (µm)201959520297198103103
40218226113352347108144
8028018794388897227359

References

  1. Snow, Z.; Nassar, A.R.; Reutzel, E.W. Invited Review Article: Review of the formation and impact of flaws in powder bed fusion additive manufacturing. Addit. Manuf. 2020, 36, 101457. [Google Scholar] [CrossRef]
  2. Yan, W.; Ge, W.; Qian, Y.; Lin, S.; Zhou, B.; Liu, W.K.; Lin, F.; Wagner, G.J. Multi-physics modeling of single/multiple-track defect mechanisms in electron beam selective melting. Acta Mater. 2017, 134, 324–333. [Google Scholar] [CrossRef]
  3. Khairallah, S.A.; Anderson, A.T.; Rubenchik, A.; King, W.E. Laser powder-bed fusion additive manufacturing: Physics of complex melt flow and formation mechanisms of pores, spatter, and denudation zones. Acta Mater. 2016, 108, 36–45. [Google Scholar] [CrossRef] [Green Version]
  4. King, W.E.; Barth, H.D.; Castillo, V.M.; Gallegos, G.F.; Gibbs, J.; Hahn, D.E.; Kamath, C.; Rubenchik, A.M. Observation of keyhole-mode laser melting in laser powder-bed fusion additive manufacturing. J. Mater. Process. Technol. 2014, 214, 2915–2925. [Google Scholar] [CrossRef]
  5. Kamath, C.; Eldasher, B.S.; Gallegos, G.F.; King, W.E.; Sisto, A. Density of additively-manufactured, 316L SS parts using laser powder-bed fusion at powers up to 400 W. Int. J. Adv. Manuf. Technol. 2014, 74, 65–78. [Google Scholar] [CrossRef] [Green Version]
  6. Klemens, P.G. Heat balance and flow conditions for electron beam and laser welding. J. Appl. Phys. 1976, 47, 2165–2174. [Google Scholar] [CrossRef]
  7. DebRoy, T.; David, S.A. Physical processes in fusion welding. Rev. Mod. Phys. 1995, 67, 85–112. [Google Scholar] [CrossRef]
  8. Keshavarzkermani, A.; Marzbanrad, E.; Esmaeilizadeh, R.; Mahmoodkhani, Y.; Ali, U.; Enrique, P.D.; Zhou, N.Y.; Bonakdar, A.; Toyserkani, E. An investigation into the effect of process parameters on melt pool geometry, cell spacing, and grain refinement during laser powder bed fusion. Opt. Laser Technol. 2019, 116, 83–91. [Google Scholar] [CrossRef]
  9. Yang, J.; Han, J.; Yu, H.; Yin, J.; Gao, M.; Wang, Z.; Zeng, X. Role of molten pool mode on formability, microstructure and mechanical properties of selective laser melted Ti-6Al-4V alloy. Mater. Des. 2016, 110, 558–570. [Google Scholar] [CrossRef]
  10. Guo, Q.; Zhao, C.; Qu, M.; Xiong, L.; Escano, L.I.; Hojjatzadeh, S.M.H.; Parab, N.D.; Fezzaa, K.; Everhart, W.; Sun, T.; et al. In-situ characterization and quantification of melt pool variation under constant input energy density in laser powder bed fusion additive manufacturing process. Addit. Manuf. 2019, 28, 600–609. [Google Scholar] [CrossRef]
  11. Reijonen, J.; Revuelta, A.; Riipinen, T.; Ruusuvuori, K.; Puukko, P. On the effect of shielding gas flow on porosity and melt pool geometry in laser powder bed fusion additive manufacturing. Addit. Manuf. 2020, 32, 101030. [Google Scholar] [CrossRef]
  12. Qi, T.; Zhu, H.; Zhang, H.; Yin, J.; Ke, L.; Zeng, X. Selective laser melting of Al7050 powder: Melting mode transition and comparison of the characteristics between the keyhole and conduction mode. Mater. Des. 2017, 135, 257–266. [Google Scholar] [CrossRef]
  13. Patel, S.; Vlasea, M. Melting modes in laser powder bed fusion. Materialia 2020, 9, 100591. [Google Scholar] [CrossRef]
  14. Scime, L.; Beuth, J. Using machine learning to identify in-situ melt pool signatures indicative of flaw formation in a laser powder bed fusion additive manufacturing process. Addit. Manuf. 2019, 25, 151–165. [Google Scholar] [CrossRef]
  15. Zhang, Y.; Hong, G.S.; Ye, D.; Zhu, K.; Fuh, J.Y. Extraction and evaluation of melt pool, plume and spatter information for powder-bed fusion AM process monitoring. Mater. Des. 2018, 156, 458–469. [Google Scholar] [CrossRef]
  16. Kanko, J.A.; Sibley, A.P.; Fraser, J.M. In situ morphology-based defect detection of selective laser melting through inline coherent imaging. J. Mater. Process. Technol. 2016, 231, 488–500. [Google Scholar] [CrossRef]
  17. Paulson, N.H.; Gould, B.; Wolff, S.J.; Stan, M.; Greco, A.C. Correlations between thermal history and keyhole porosity in laser powder bed fusion. Addit. Manuf. 2020, 34, 101213. [Google Scholar] [CrossRef]
  18. Forien, J.-B.; Calta, N.P.; DePond, P.J.; Guss, G.M.; Roehling, T.T.; Matthews, M.J. Detecting keyhole pore defects and monitoring process signatures during laser powder bed fusion: A correlation between in situ pyrometry and ex situ X-ray radiography. Addit. Manuf. 2020, 35, 101336. [Google Scholar] [CrossRef]
  19. Tang, M.; Pistorius, P.C.; Beuth, J. Prediction of lack-of-fusion porosity for powder bed fusion. Addit. Manuf. 2017, 14, 39–48. [Google Scholar] [CrossRef]
  20. Darvish, K.; Chen, Z.; Pasang, T. Reducing lack of fusion during selective laser melting of CoCrMo alloy: Effect of laser power on geometrical features of tracks. Mater. Des. 2016, 112, 357–366. [Google Scholar] [CrossRef]
  21. Criales, L.E.; Arısoy, Y.M.; Lane, B.; Moylan, S.; Donmez, A.; Özel, T. Laser powder bed fusion of nickel alloy 625: Experimental investigations of effects of process parameters on melt pool size and shape with spatter analysis. Int. J. Mach. Tools Manuf. 2017, 121, 22–36. [Google Scholar] [CrossRef]
  22. Scime, L.; Beuth, J. Melt pool geometry and morphology variability for the Inconel 718 alloy in a laser powder bed fusion additive manufacturing process. Addit. Manuf. 2019, 29, 100830. [Google Scholar] [CrossRef]
  23. Guo, Q.; Zhao, C.; Qu, M.; Xiong, L.; Hojjatzadeh, S.M.H.; Escano, L.I.; Parab, N.D.; Fezzaa, K.; Sun, T.; Chen, L. In-situ full-field mapping of melt flow dynamics in laser metal additive manufacturing. Addit. Manuf. 2020, 31, 100939. [Google Scholar] [CrossRef]
  24. Fabbro, R. Melt pool and keyhole behaviour analysis for deep penetration laser welding. J. Phys. D Appl. Phys. 2010, 43, 445501. [Google Scholar] [CrossRef]
  25. Rai, R.; Elmer, J.W.; Palmer, T.A.; DebRoy, T. Heat transfer and fluid flow during keyhole mode laser welding of tantalum, Ti–6Al–4V, 304L stainless steel and vanadium. J. Phys. D Appl. Phys. 2007, 40, 5753–5766. [Google Scholar] [CrossRef] [Green Version]
  26. Bidulská, J.; Bidulský, R.; Grande, M.A.; Kvačkaj, T. Different Formation Routes of Pore Structure in Aluminum Powder Metallurgy Alloy. Materials 2019, 12, 3724. [Google Scholar] [CrossRef] [PubMed] [Green Version]
  27. Marcu Puscas, T.; Signorini, M.; Molinari, A.; Straffelini, G. Image analysis investigation of the effect of the process variables on the porosity of sintered chromium steels. Mater. Charact. 2003, 50, 1–10. [Google Scholar] [CrossRef]
  28. Aboulkhair, N.T.; Maskery, I.; Tuck, C.; Ashcroft, I.; Everitt, N.M. On the formation of AlSi10Mg single tracks and layers in selective laser melting: Microstructure and nano-mechanical properties. J. Mater. Process. Technol. 2016, 230, 88–98. [Google Scholar] [CrossRef]
  29. Lu, Y.; Wu, S.; Gan, Y.; Huang, T.; Yang, C.; Junjie, L.; Lin, J. Study on the microstructure, mechanical property and residual stress of SLM Inconel-718 alloy manufactured by differing island scanning strategy. Opt. Laser Technol. 2015, 75, 197–206. [Google Scholar] [CrossRef]
  30. Cunningham, R.; Zhao, C.; Parab, N.; Kantzos, C.; Pauza, J.; Fezzaa, K.; Sun, T.; Rollett, A.D. Keyhole threshold and morphology in laser melting revealed by ultrahigh-speed X-ray imaging. Science 2019, 363, 849–852. [Google Scholar] [CrossRef]
  31. Yadroitsev, I.; Krakhmalev, P.; Yadroitsava, I. Selective laser melting of Ti6Al4V alloy for biomedical applications: Temperature monitoring and microstructural evolution. J. Alloys Compd. 2014, 583, 404–409. [Google Scholar] [CrossRef]
  32. Beiss, P.; Dalgic, M. Structure property relationships in porous sintered steels. Mater. Chem. Phys. 2001, 67, 37–42. [Google Scholar] [CrossRef]
  33. Liu, Y.; Yang, Y.; Mai, S.; Wang, D.; Song, C. Investigation into spatter behavior during selective laser melting of AISI 316L stainless steel powder. Mater. Des. 2015, 87, 797–806. [Google Scholar] [CrossRef]
  34. Wang, D.; Wu, S.; Fu, F.; Mai, S.; Yang, Y.; Liu, Y.; Song, C. Mechanisms and characteristics of spatter generation in SLM processing and its effect on the properties. Mater. Des. 2017, 117, 121–130. [Google Scholar] [CrossRef]
  35. Andani, M.T.; Dehghani, R.; Karamooz-Ravari, M.R.; Mirzaeifar, R.; Ni, J. A study on the effect of energy input on spatter particles creation during selective laser melting process. Addit. Manuf. 2018, 20, 33–43. [Google Scholar] [CrossRef]
  36. Beretta, S.; Romano, S. A comparison of fatigue strength sensitivity to defects for materials manufactured by AM or traditional processes. Int. J. Fatigue 2017, 94, 178–191. [Google Scholar] [CrossRef]
  37. Schwerz, C.; Raza, A.; Lei, X.; Nyborg, L.; Hryha, E.; Wirdelius, H. In-situ detection of redeposited spatter and its influence on the formation of internal flaws in laser powder bed fusion. Addit. Manuf. 2021, 47, 102370. [Google Scholar] [CrossRef]
Figure 1. Schematic illustration of the method applied for measuring melt pool depth (d) and halfwidth (w/2) in melt pools characteristic of (A) conduction and (B) keyhole melting.
Metals 11 01856 g001
Figure 2. Influence of laser scan speed on melt pool geometries and flaw populations in the keyhole regime. Microstructure of specimens manufactured with laser scan speed of: 200 mm/s (A); 400 mm/s (B); 600 mm/s (C); 800 mm/s (D); otherwise identical parameters (nominal laser power 200 W and layer thickness 40 µm). The volume fraction of flaws is indicated. Melt pool boundaries are highlighted for easier visualization. Arrows indicate keyhole pores of irregular morphology. Corresponding flaw size distributions (E) and detailed view for specimens with low flaw content (F). Influence of laser scan speed on melt pool: depths (G); widths (H); aspect ratios (I).
Metals 11 01856 g002
Figure 3. Representative sample of melt pool monitoring of specimens with increasing laser scan speed in the keyhole regime, sampled from the topmost layer of each specimen. Laser scan speed of 200 mm/s, 400 mm/s, 600 mm/s, and 800 mm/s and otherwise identical parameters (nominal laser power 200 W and layer thickness 40 µm). (A) Raw signal in temporal x-coordinate. (B) The signal intensity characteristic is the output of a smoothing operation and translation to spatial coordinates. (C) The signal dynamic characteristic highlights regions of high melt pool dynamics.
Metals 11 01856 g003
Figure 4. Influence of laser power on melt pool geometries and flaw populations in the keyhole regime. Microstructure of specimens manufactured with laser power of: 100 W (A); 200 W (B); 300 W (C); otherwise identical parameters (nominal laser scan speed 200 mm/s and layer thickness 40 µm). The volume fraction of flaws is indicated. Melt pool boundaries are highlighted for easier visualization. Arrows indicate keyhole porosity of irregular morphology. (D) Corresponding flaw size distributions. Influence of laser power on melt pool: depths (E); widths (F); aspect ratios (G).
Metals 11 01856 g004
Figure 5. Representative sample of melt pool monitoring in specimens with increasing laser power in the keyhole regime, sampled from the topmost layer of each specimen. Laser power of 100 W, 200 W, and 300 W and otherwise identical parameters (nominal laser scan speed 200 mm/s and layer thickness 40 µm). (A) Raw signal in temporal x-coordinate. (B) Signal smoothed and translated to spatial coordinates. (C) Signal processed to highlight regions of high melt pool dynamics.
Metals 11 01856 g005
Figure 6. Variation on melt pool geometry, melt pool signal characteristics, and incidence of flaws with a layer thickness in the keyhole regime at 100 W and 200 mm/s. Distributions of melt pool depths (A), widths (B), and aspect ratios (C) with varying layer thickness. In the specimens manufactured with layer thickness 20 µm and 40 µm (D), only gas and keyhole pores are observed. For layer thickness of 80 µm, both pores (indicated by the white arrows) and lack of fusion (indicated by the red arrows) are observed (E). The volume fraction of flaws is indicated in (D,E). (F,G) are spatial representations of the intensity and dynamic signal characteristics, respectively.
Metals 11 01856 g006
Figure 7. Detail on pore morphology. Keyhole pores (A,B) can present distinct morphologies and sizes. Gas pores (C) are present in all specimens.
Metals 11 01856 g007
Figure 8. Influence of laser power on melt pool geometries and flaw populations in the conduction regime. Microstructure of specimens manufactured with a laser power of: 100 W (A); 200 W (B); 300 W (C); with otherwise identical parameters (nominal laser scan speed 1000 mm/s and layer thickness 40 µm). The volume fraction of flaws is indicated. Distribution of melt pool: depths (D); widths (E); aspect ratios (F) for the three levels of laser power. The red dashed lines represent the nominal layer thickness (D) and hatch spacing (E) used in manufacturing.
Metals 11 01856 g008
Figure 9. Results from melt pool monitoring of specimens with increasing laser power in the conduction regime sampled from the topmost layer of each specimen. Laser power of 100 W, 200 W, and 300 W, and otherwise identical parameters (nominal laser scan speed 1000 mm/s and layer thickness 40 µm). (A) Raw signal in temporal x-coordinate. Spatial representation of the intensity (B) and dynamic signal characteristics (C).
Metals 11 01856 g009
Figure 10. Influence of laser scan speed on melt pool geometries and flaw populations in the conduction regime. Microstructure of specimens manufactured with a laser scan speed of: 1000 mm/s (A); 1200 mm/s (B); 1400 mm/s (C); 1600 mm/s (D); otherwise identical parameters (nominal laser power 300 W and layer thickness 40 µm). The volume fraction of flaws is indicated. Melt pool boundaries are highlighted for easier visualization. Corresponding flaw size distributions (E). Influence of laser scan speed on melt pool: depths (F); widths (G); aspect ratios (H). The red dashed lines represent the nominal layer thickness (F) and hatch spacing (G) used in manufacturing.
Metals 11 01856 g010
Figure 11. Detail on the morphology of lack of fusion flaws.
Metals 11 01856 g011
Figure 12. Signal intensity characteristics with increasing laser scan speed in the conduction regime, sampled from the topmost layer of each specimen. Laser scan speed 1000 mm/s, 1200 mm/s, 1400 mm/s, and 1600 mm/s and otherwise identical parameters (nominal laser power 300 W and layer thickness 40 µm).
Metals 11 01856 g012
Figure 13. Influence of layer thickness on melt pool geometries and flaw populations in the conduction regime. Microstructure of specimens manufactured with layer thickness of: 20 µm (A); 40 µm (B); 80 µm (C); otherwise identical parameters (nominal laser power 200 W and scan speed 1000 mm/s). The volume fraction of flaws is indicated. Distribution of melt pool: depths (D); widths (E); aspect ratios (F) for the three levels of layer thickness. The red dashed lines represent the nominal layer thickness (D) and hatch spacing (E) used in manufacturing.
Metals 11 01856 g013
Table 1. Volume fraction of flaws (%) across the process parameter space. Laser power, scan speed and layer thickness are varied systematically. Cells in gray correspond to process conditions in the keyhole regime; cells in yellow correspond to the conduction regime. “N/A” indicates manufacturing could not be completed due to extreme processing conditions.
Laser Scan Speed (mm/s)
2004006008001000120014001600
Laser power: 100 WNominal layer thickness (µm)200.390.010.311.415.487.9711.614.2
400.140.760.785.9514.319.427.332.1
805.6111.716.526.835.145.4N/AN/A
Laser power: 200 WNominal layer thickness (µm)204.472.550.030.01<0.010.190.631.27
405.122.770.020.010.090.441.674.51
806.792.190.110.316.9012.118.825.6
Laser power: 300 WNominal layer thickness (µm)20N/A2.340.44<0.01<0.010.020.100.14
403.313.500.30<0.010.010.040.120.26
804.503.190.350.010.030.060.392.53
Publisher’s Note: MDPI stays neutral with regard to jurisdictional claims in published maps and institutional affiliations.

