Article

Causes of Structural Heterogeneity in High-Strength OCTG Tubes and Minimizing Their Impact on Sulfide Stress Corrosion Cracking Resistance

1
Scientific and Technological Complex “New Technologies and Materials”, Institute of Advanced Engineering Technologies, Peter the Great St. Petersburg Polytechnic University, 195251 St. Petersburg, Russia
2
JSC Pervouralsk New Pipe Plant, 121205 Pervouralsk, Russia
*
Author to whom correspondence should be addressed.
Metals 2021, 11(11), 1843; https://doi.org/10.3390/met11111843
Submission received: 7 October 2021 / Revised: 1 November 2021 / Accepted: 11 November 2021 / Published: 17 November 2021

Abstract

:
High-strength oil country tubular goods (OCTG) like C110, according to standard API 5CT (yield strength at least 758 MPa), are subject to requirements in terms of mechanical and corrosion properties. In this work, we studied the microstructure of seamless casing tubes made of class C110 high-strength steel with a 194.5 mm diameter and 19.7 mm wall thickness, and its influence on sulfide stress corrosion cracking (SSC). Casing tubes were obtained from continuous billets by screw piercing with preliminary quenching and tempering. It was shown that cracking during the tests always begins from the inner surface of the tube. Rough segregation bands were found on the inner tube surface, which occupies about a third of the thickness of the wall. To increase the resistance of 0.3C-Cr-Mn-Mo + 0.15(V + Nb + Ti) steel to SSC, primary recommendations for adjusting the chemical composition, production technology and heat treatment were developed.

1. Introduction

During the development of deep oil and gas fields, casing is influenced not only by the aggressive environment of the well (H2S and CO2), but also by high pressures and temperatures [1,2,3,4]. If low-alloyed steel casing tubes are exposed to these environments, hydrogen cracking can occur, causing corrosion cracks in the hydrogen sulfide environment (SSC) [5]. Casing of high-strength groups in a corrosion-resistant design is used for those conditions, for example C110, according to ANSI/API 5CT (yield strength at least 758 MPa) [6,7].
Extreme operating conditions require high quality of steels and determine the requirements for the level of alloying and purity for detrimental impurities, as well as for the chemical and structural homogeneity of the finished casing tubes. Therefore, to produce these tubes, it is important to choose the optimal chemical composition of steel and consider that the formation of the final structure is influenced by all processes: melting and casting [8], rolling [9] and final heat treatment [10].
At high mechanical properties, determined under static tension, local weak points arise due to nonmetallic inclusions (NMIs) and segregations of chemical elements, which can lead to SSC in a corrosive environment [11]. Near a surface defect (nonmetallic inclusions, solid structural components), pitting may occur [12,13], hydrogen accumulates, which is then adsorbed, diffuses into the steel and leads to its embrittlement [11,12,13,14]. If segregations and defects are developed into the depth of the tube, then further opening and development of a corrosion cracks occurs along them [11].
The production of steel grades C110 is a challenging task. C110 is a borderline strength group in the relationship between mechanical properties and resistance to sulfide stress corrosion cracking. Due to the large number of potential causes of steel fracture during tests on SSC, a detailed study of each specific case is required to determine the causes of test failures and to develop technological recommendations to minimize them.
In this work, we studied the influence of seamless casing tubes microstructure with a 194.5 mm diameter and 19.7 mm wall thickness of class C110 high-strength steel 0.3C-Cr-Mn-Mo + 0.15(V + Nb + Ti) to sulfide stress corrosion cracking (SSC). The evolution of structure and segregations was studied at each stage of processing from a continuously cast billet to the final product. Casing tubes were obtained from continuous billets by screw piercing with preliminary quenching and tempering.

2. Materials and Methods

In this work studied samples of C110 casing tube with the same chemical composition were tested for resistance to SSC according to NACE TM0177 [15] and API 5CT [7] requirements for strength group C110—exposure in 100% hydrogen sulfide for 720 h at a load of 644 MPa.
The samples were tested at various loads to determine the threshold stress: at 50%, 62.5%, 75% and 85% of the minimum standard yield strength (MSYS) of 758 MPa. All samples, except those tested at 75% load or more, showed resistance to SSC (Figure 1).
To identify the causes of the negative results of the SSC tests, we studied samples of 194.5 × 19.7 tube. In this work, samples from three main stages of manufacturing were investigated: from continuous casting billet (CCB), after hot rolling (hot-rolled pipe billet—HRPB) and after heat treatment (casing tube—CT).
Mechanical properties were determined using a universal testing machine UM-10T using standard cylindrical fivefold samples. Testing was made on three cylindrical samples taken from different OCTG quadrants in accordance with GOST 1497 [16]. The macro-hardness of the casing tube was determined on a transverse template using a TK-2M hardness machine by the Rockwell method.
Longitudinal specimens were cut from the casing tube and from the tested samples, which were then ground, polished and etched with 4% nitric acid. Metallographic studies were performed using a Reichter light optical microscope (LOM) equipped with a Thixomet automatic image analyzer. The microhardness of individual structural components was determined using a microhardness tester according to the Vickers method with 180 g load (HV0.18).
The analysis of the dispersed structure and determination of the local chemical composition were studied using a Zeiss Supra scanning electron microscope (SEM) equipped with energy dispersive spectrometer (EDS).
Calculations and thermodynamic modeling of phase formation processes during solidification were performed in commercial ThermoCalc software (TCW5) equipped with TCFE6 databases [17]. The calculations were carried out according to the Sheil equation [18], which considers the nonequilibrium nature of solidification. The main idea of the calculation is the assumption that the diffusion of impurity elements in the solid phase is completely suppressed, and completely proceeds in the liquid phase.

3. Results and Discussions

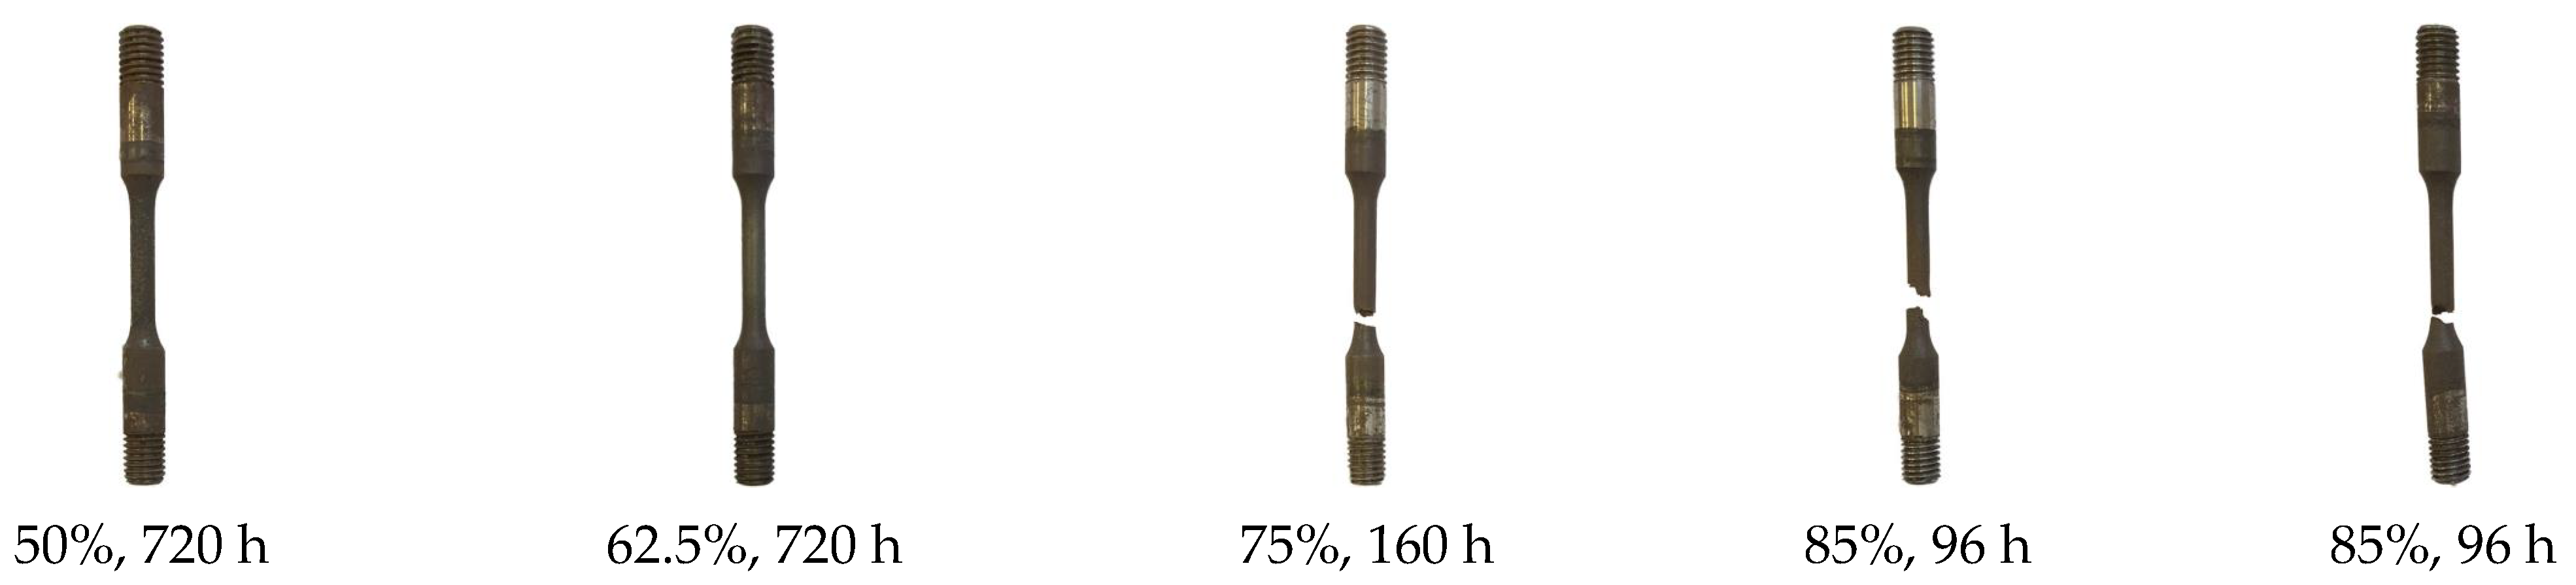
3.1. Mechanical Properties and Analysis of Samples after SSC Tests

The test results are presented in Table 1. It presents the yield strength (YS), tensile strength (TS), elongation and hardness (HRC) of the studied samples.
According to the results of mechanical tests, the material of the casing tube sample corresponds to the strength class C110 (ANSI/API 5CT).
The fracture surface of the samples after testing on SSC at 85% (samples on Figure 1) of the yield strength was studied using SEM (Figure 2).
Crack nucleation on the samples always occurred from the side marked in red, followed by a ductile rupture zone (yellow) and a break zone (blue and magenta). The fracture structure Figure 2b has a brittle fracture. The structure of Figure 2c has numerous ductile fracture pits, which is typical for crack growth zones, the structure of Figure 2d is similar to the previous one, but it has multiple secondary cracks, which corresponds to the break fracture zone.
For metallographic studies, longitudinal thin sections (along the dashed line in Figure 3) were cut out from the samples after testing on the SSC so that the fracture surface fell into the thin section. A panoramic view of the structure of the cross-section part of the sample is shown in Figure 3.
Dark segregation bands were found on the sample, occupying about a third of the surface on the side of the inner tube surface. It is from this surface that the destruction of samples always begins during tests on the SSC. Moreover, the secondary cracks located perpendicular to the axis of the specimen, according to the stress state diagram during testing, as they develop and meet the segregation band, unfold parallel to the specimen axis.
The structure of SSC samples is composed of tempered martensite and sorbitic pearlite (Figure 4a). An inhomogeneity was also found along the tube wall thickness in the form of segregation bands located at the inner surface and occupying about a third of the thickness (Figure 4b). In segregation, the structure is more dispersed and contains NMIs.
This crude structural heterogeneity results in different properties across the samples, as measured by hardness. Closer to the crack growth zone (Figure 2c) of the sample, the hardness is lower than that of the central part but is within the permissible divergence (about 30 HV according to API 5CT). In microstructure closer to crack nucleation zone of the samples, there is an unevenness in hardness caused by the presence of segregation bands. The hardness between the structural heterogeneities differs by 40–50 HV0.18, 270–280 HV0.18 outside the bands and up to 325 HV0.18 in the bands.
The structure in the segregation bands is more dispersed and contains many small NMIs. According to the results of the chemical analysis of the dark and light bands presented in Table 2 and Figure 5, it was determined that in the segregation areas there is an increased content of molybdenum, chromium, and silicon, inherited from the zonal segregations in the central part of the continuous casting.
The reasons for the initiation of cracks on studied specimens of high-strength steel (strength group C110) after SSC testing are determined. The main reason for the destruction of samples is the presence of segregation banding (dark and bright bands of different degrees of tempering), localized on one of the sides of the sample, along which destruction occurs.

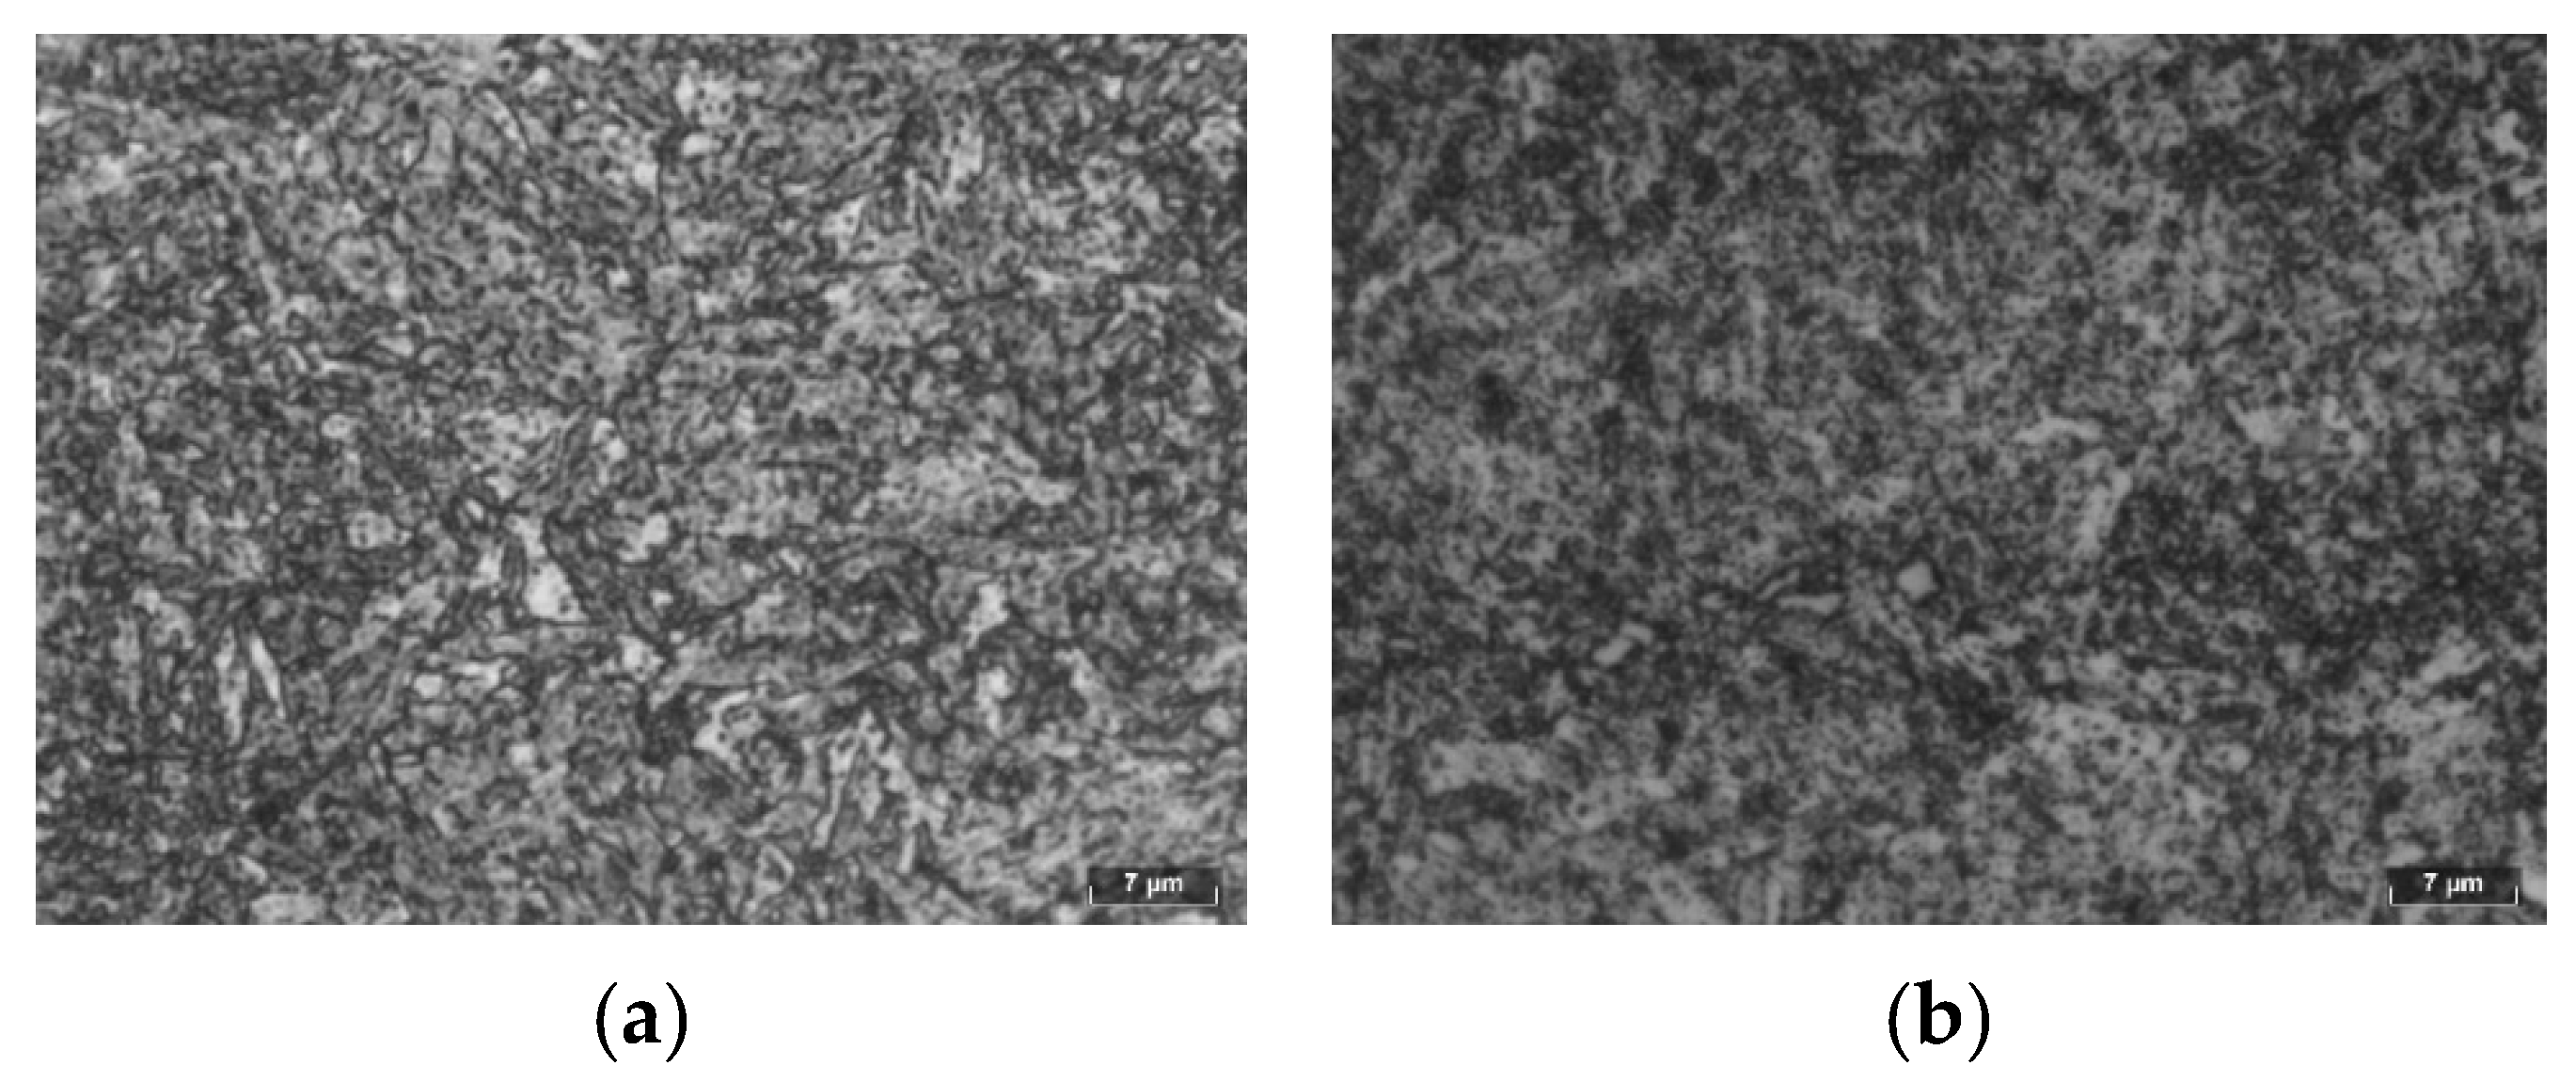
3.2. Metallographic Analysis of Samples of All Metallurgical Manufacture Stages

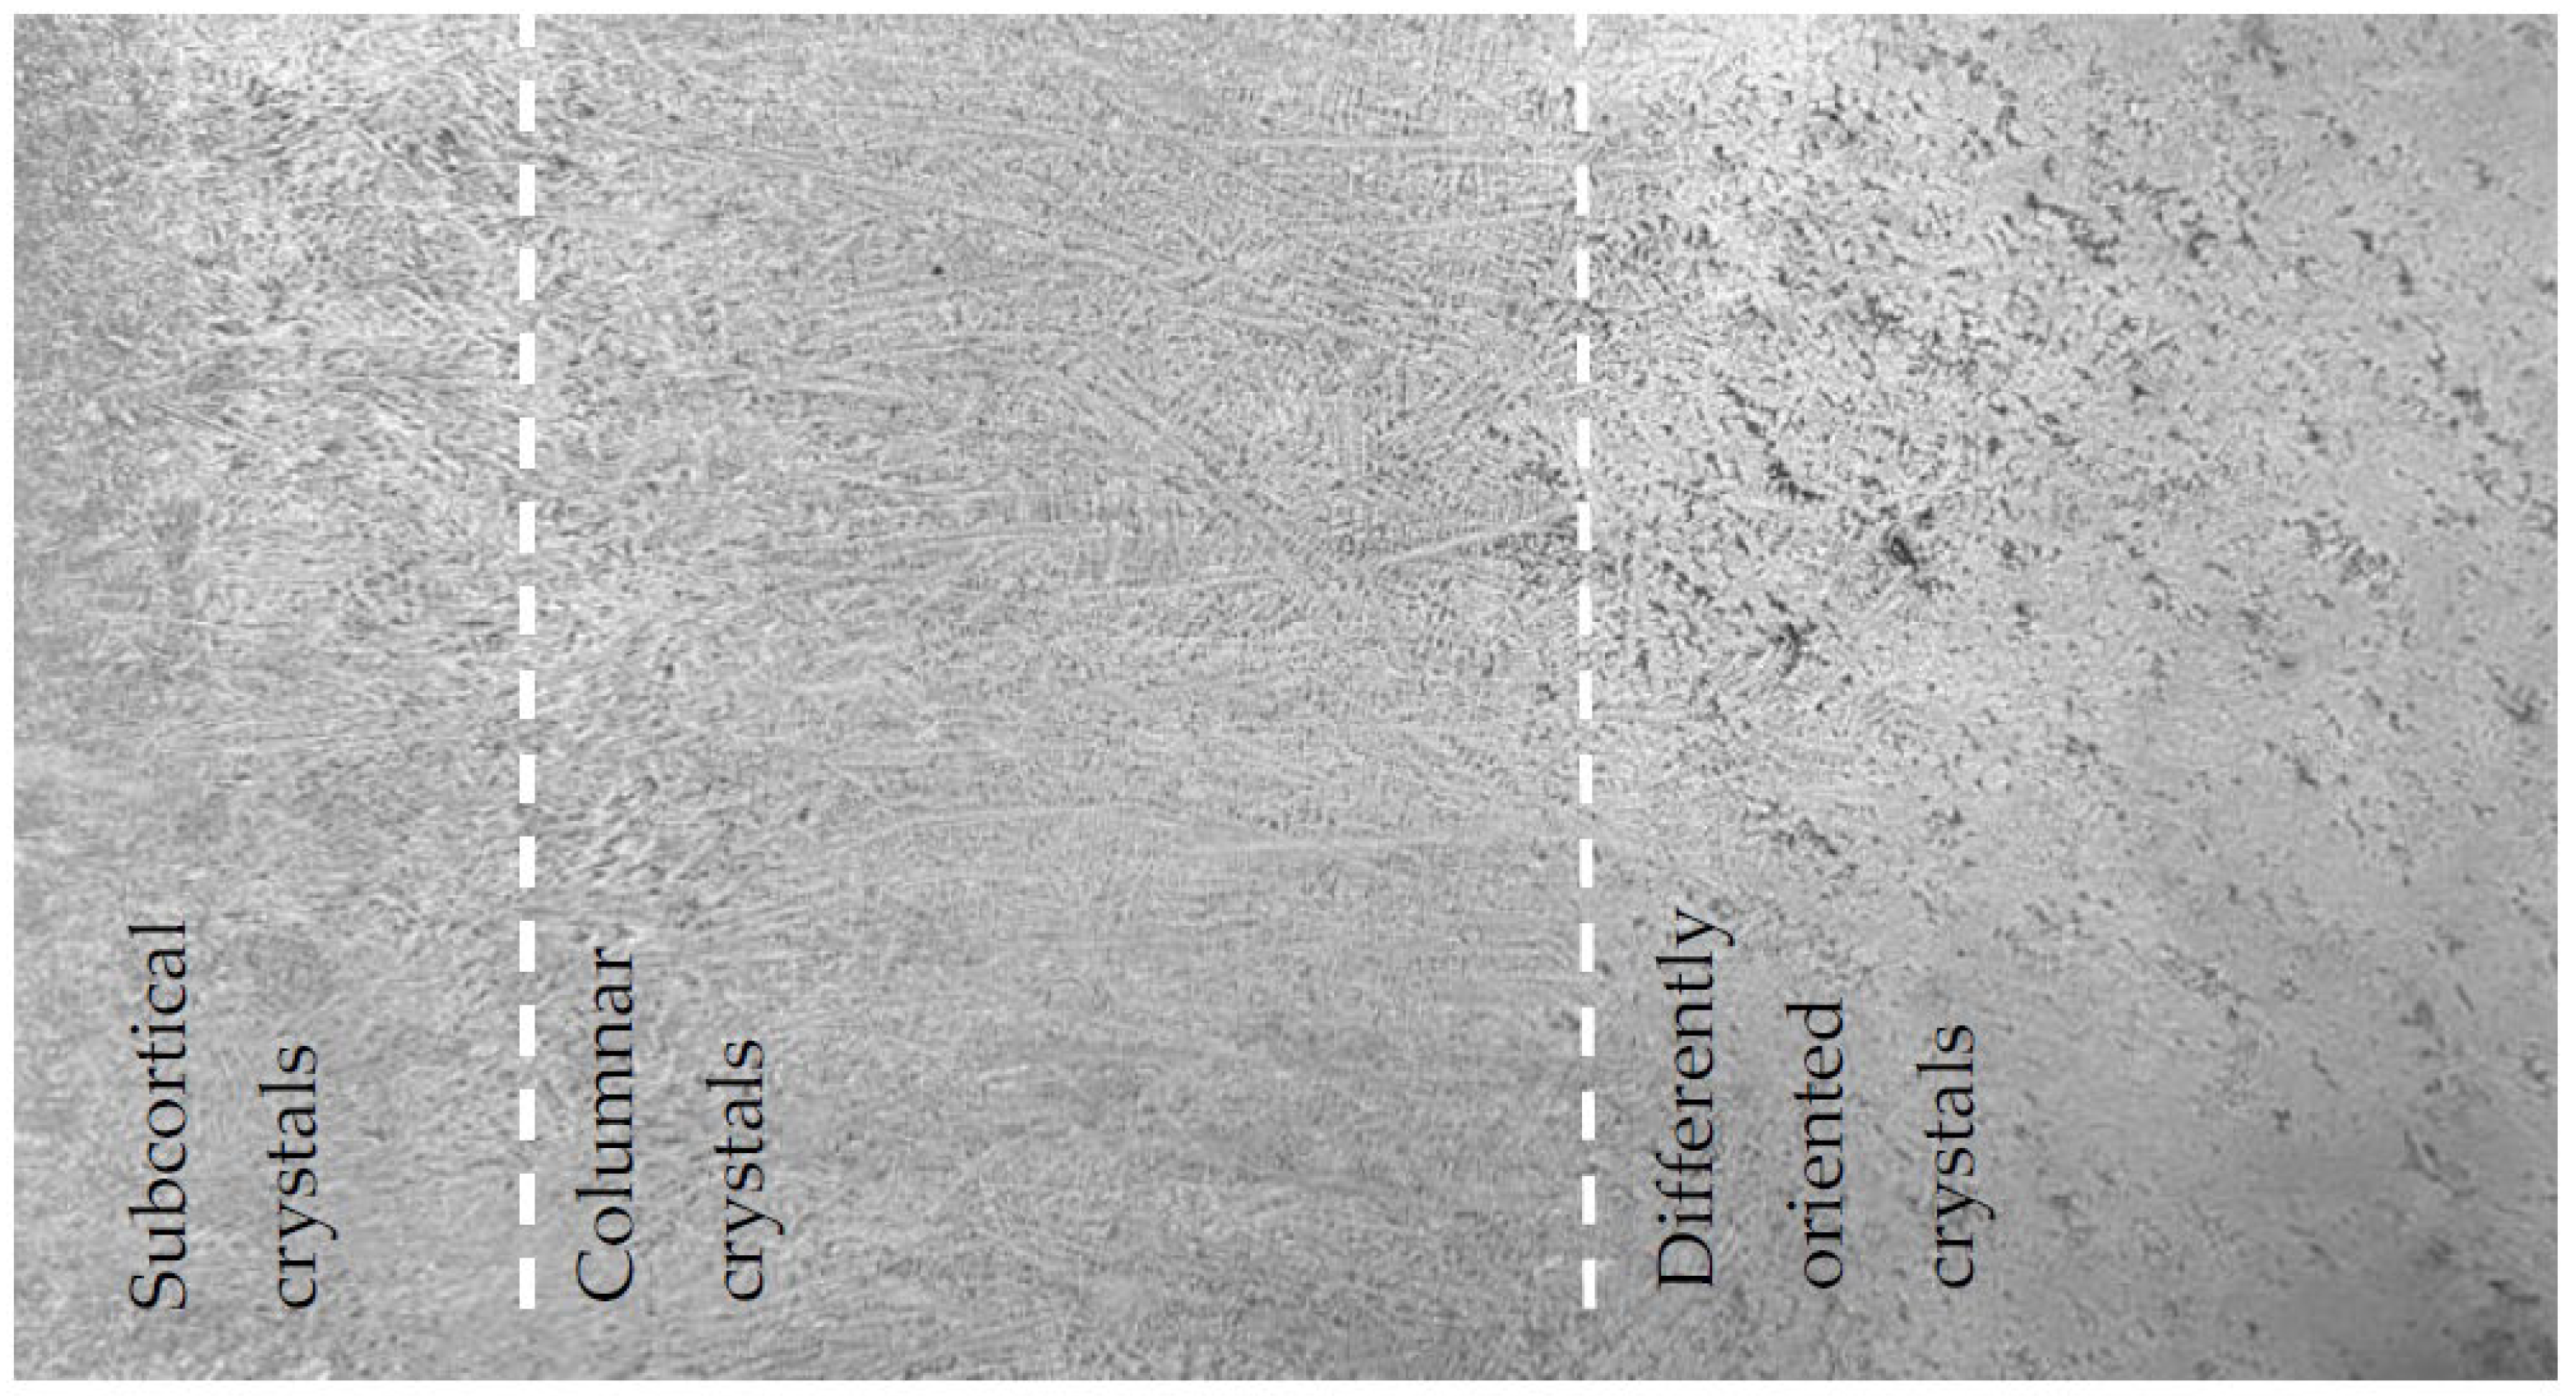
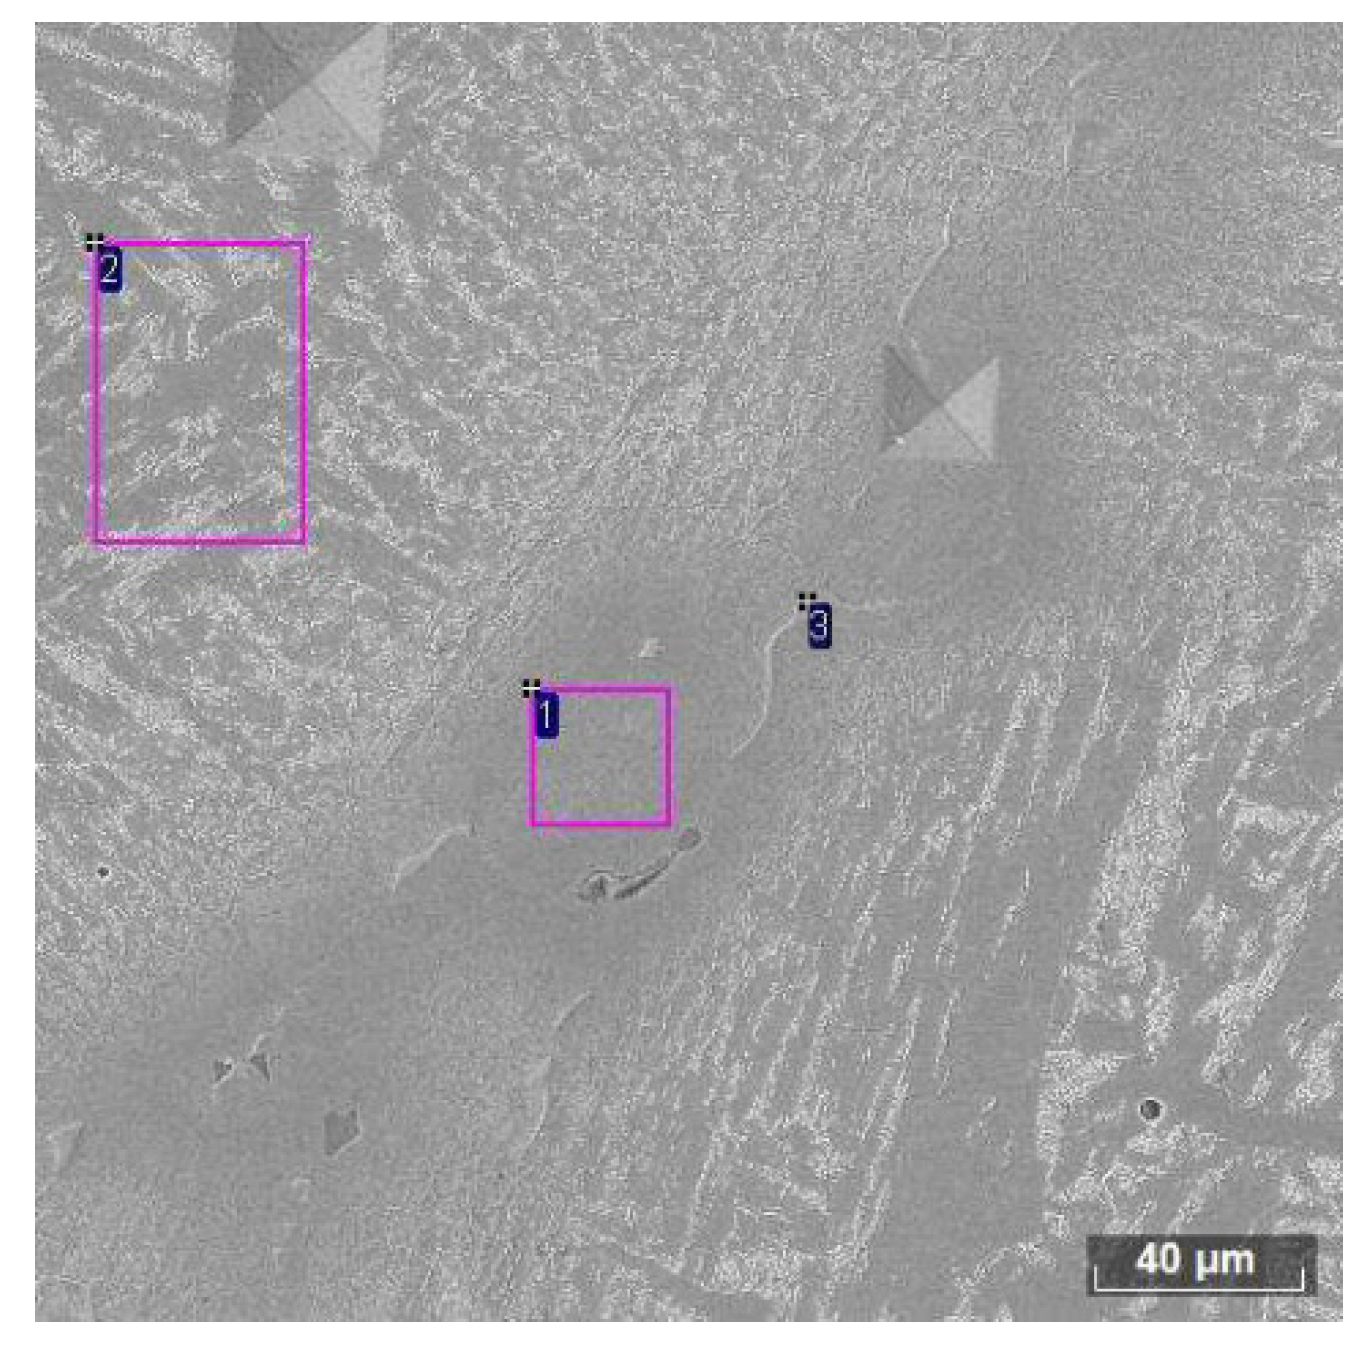
3.2.1. Metallographic Analysis of CCB

Figure 6 shows an image of the CCB template after hot etching with hydrochloric acid. All the characteristic structural zones that form during solidification are clearly visible: the zone of small subcortical crystals, formed at the initial moment of time, when the liquid metal touches the surface of the water-cooled crystallizer; the zone of columnar crystals growing in conditions of strong directional heat removal; and the central zone of differently oriented crystals growing under conditions of low temperature gradients and constitutional supercooling [18].
Depending on the forming dendritic structure, the nonmetallic phase is formed in different parts of the billet in different ways. This is clearly shown in Figure 7.
Numerous faceted nitride inclusions were found. Near the surface of the billet, where the cooling rates are the highest, nitrides are single, or in clusters of two or three inclusions (Figure 7a). Already starting from about 30 mm from the surface, the nitrides are large, elongated, located along the boundaries of the cast grains (Figure 7b). With distance from the cooling surface, and, accordingly, with a decrease in the solidification rate and, with an intensification of liquation processes, the sizes of nitrides increase, the degree of their branching increases (Figure 7c). The presence of nitrides both in the center of the billet and on the surface indicates that their formation is associated with the not optimal chemical composition of the steel. Liquation processes superimposed on this cause lead to the appearance of even coarser nitrides in the central part CCB.
Figure 8 shows the structure of a sample cut from the center of the CCB. It is well seen that around the carbonitrides there are large areas of reduced etching caused by an increased concentration of impurities. The microhardness of the metal outside the segregations was 290 HV0.18, and of these segregated areas—up to 500 HV0.18 (D = 26 µm and 33.9 µm mean the diagonal of indenter imprint), because, due to the accumulation of impurities in segregations, even at low cooling rates of the CCB’s central part, quenching structures are formed.
Elongated inclusions in segregations are niobium titanium and vanadium carbonitrides described in Table 3. Table 3 shows the chemical composition in segregations and in metal without segregation (see Figure 9).
In spectrum 1 (segregation), the content of chromium, manganese, molybdenum, and vanadium is increased. In the center of the segregation band, light elongated inclusions (spectrum 3) of niobium (95.66%), titanium (2.34%), and vanadium (2.10%) carbonitrides ((Nb,Ti,V)xCyNz) were found.

3.2.2. Metallographic Analysis of Hot-Rolled Samples (HRPB)

On polished samples taken from hot-rolled pipe billet (HRPB), NMIs were found, the distribution pattern of which is the same as in the CCB—they are smaller and single at the outer wall, and nitrides accumulations were found at the inner wall. Microstructure of samples shown in Figure 10.
The structure at the inner wall is crude (with large structural components) with pronounced segregations in the form of banding. The structure at the outer wall is more dispersed. Such a difference in the structure may be due to the inheritance of heterogeneity from the CCB. Since segregation in the CCB is present in the central part of the billet, it remains at the rolling stage and after.
Figure 11 shows a microstructure in base metal and segregation. Table 4 shows comparison of the chemical composition of the metal in segregations and outside them for a sample of HRPB at the inner wall.
As in the CCB sample, an increased content of carbide-forming elements, including niobium, as well as manganese, was noted in the segregations. Thus, the nonuniformity of the CCB caused by liquation processes is transformed into the banding of the structure after rolling. The difference in the concentration of elements in the segregations and in the base metal decreases relative to the CCB due to the diffusion of impurities during pre-rolling heating, rolling and heat treatment. Table 5 shows the chemical composition and Figure 12 shows morphology of carbides in the segregations and base metal of the HRPB sample.
Carbides in segregations are larger, and their content is higher than in the base metal. The segregations also contain manganese sulfides elongated along the rolling direction. These factors also cause uneven properties over the section of the pipe billet.

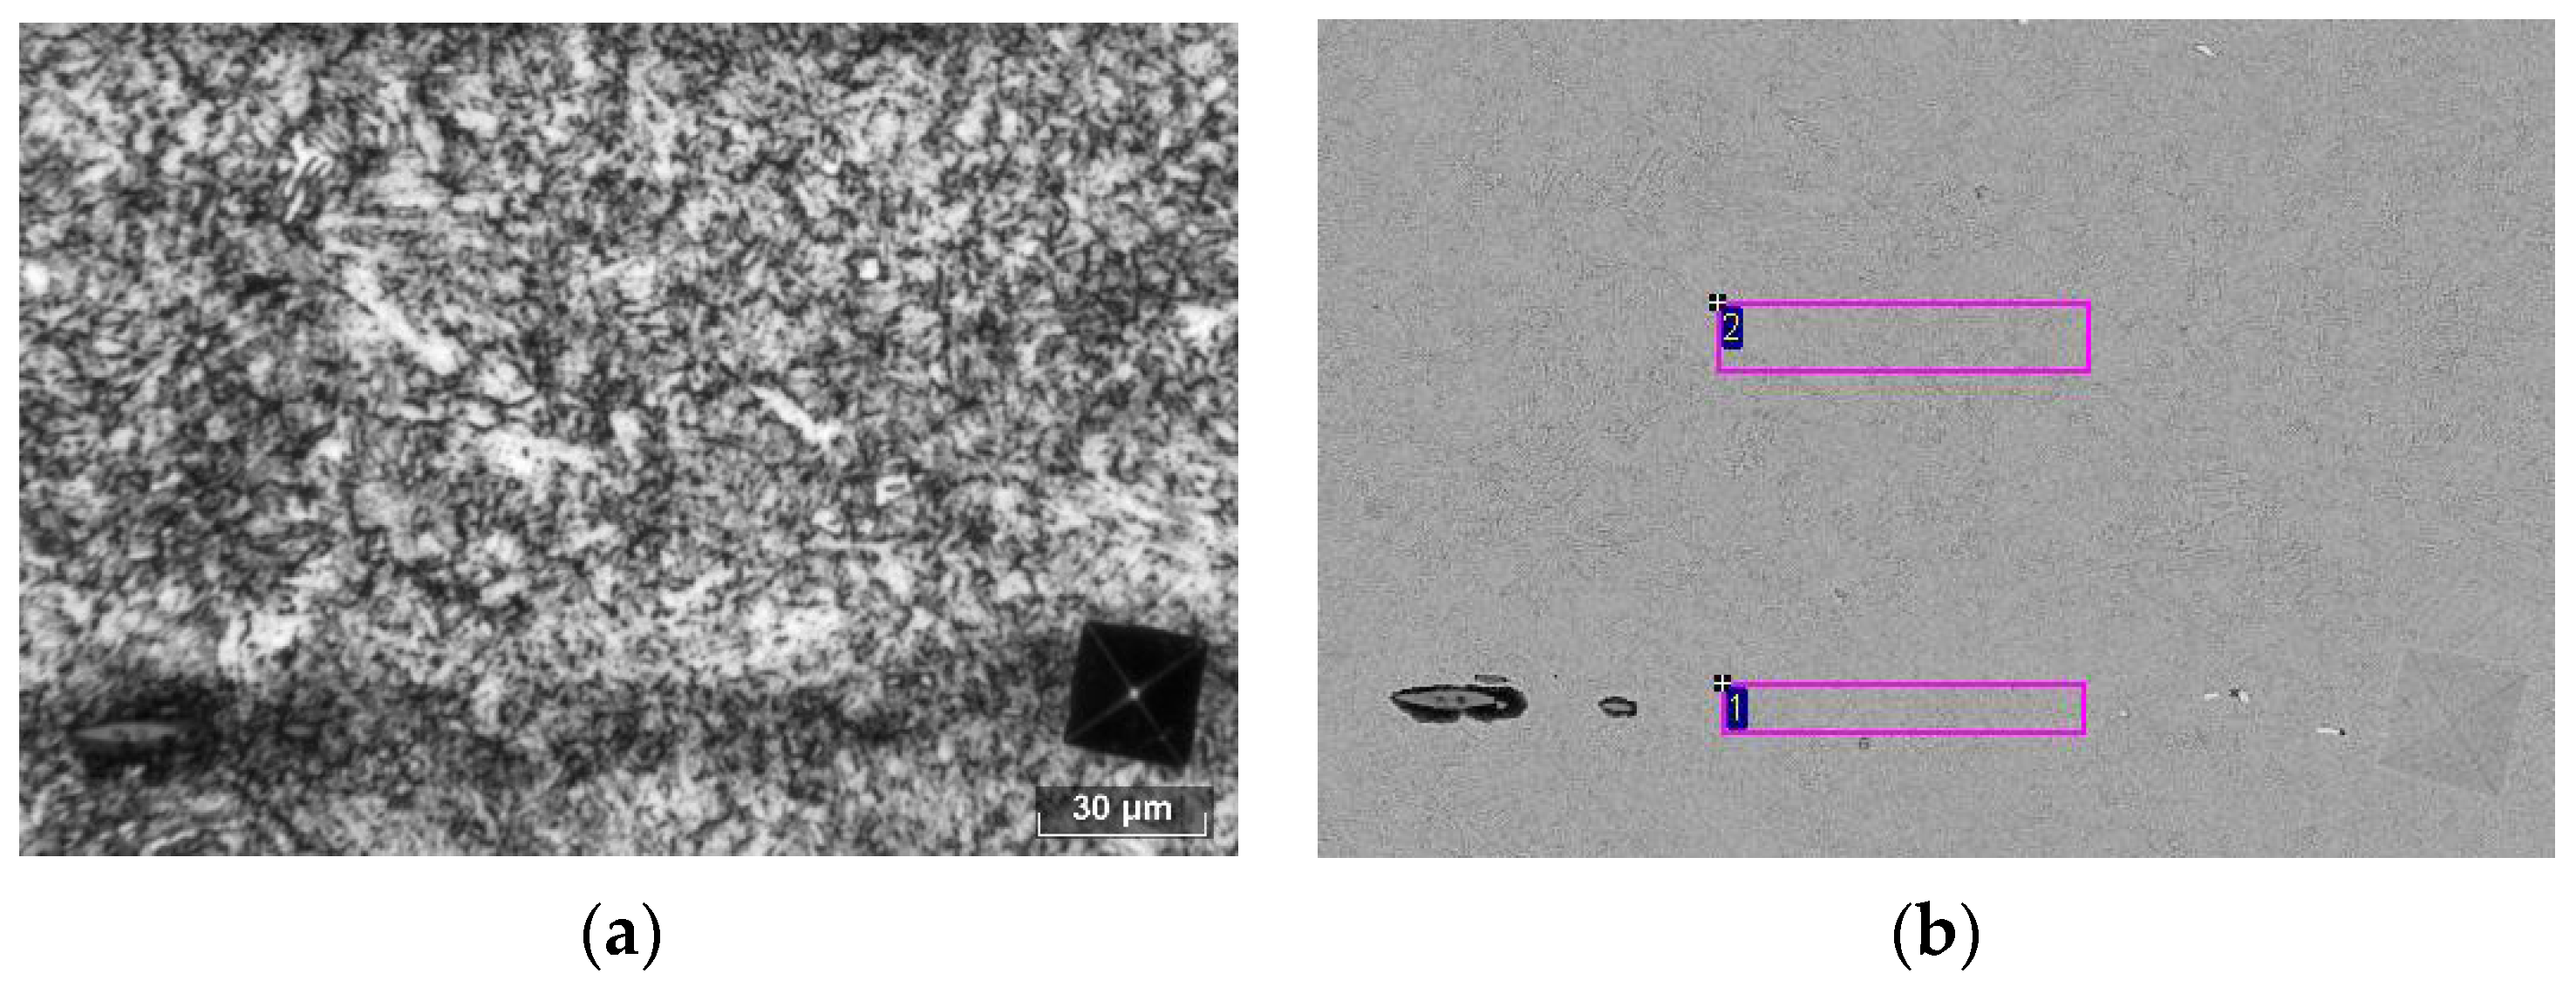
3.2.3. Metallographic Analysis of Casing Tube (CT) Samples

A casing tube is a final product obtained after heat treatment of a hot-rolled billet, and in which all defects formed at an earlier processing stage are inherited, including continuous casting and hot-rolling. The microhardness was measured along the tube wall thickness in the radial direction, the results are shown in Figure 13.
On average, microhardness values range from 300 to 320 HV0.18 (from 30 to 33 HRC according to ASTM E140). However, in the areas of segregation bands, the microhardness values increase to 330–350 HV (34–36 HRC, Figure 13), while the adjacent areas have a relatively low hardness in the region of 280 HV (28 HRC). These differences are caused by the liquation of alloying elements during solidification. Also, after heat treatment, the structure is leveled along the wall thickness in comparison with the features of microstructure noted in the HRPB samples (Figure 10).
As in the HRPB billet, this samples have a similar distribution of NMIs over the section. At the outer wall, there are fewer inclusions, including niobium carbonitrides, and their shape and arrangement are chaotic. A large accumulation of niobium carbonitride inclusions elongated into lines was noted near the inner wall. According to the results of measuring the volume fraction of inclusions, the volume fraction of carbonitrides at the inner wall is comparable with other inclusions (oxides and sulfides). The microstructures of the CT sample are shown in Figure 14.
The CT microstructure is tempered martensite (sorbitic pearlite), evenly distributed at the outer wall and with developed segregation bands at the inner wall. Figure 15 shows the areas for determination of chemical composition, Table 6 shows a comparison of the chemical composition of the segregation zone and in the base metal of the CT sample.
As in the case of the CCB and HRPB samples, an increased content of carbide-forming elements, as well as manganese, was noted in the segregations. The inhomogeneity of the CCB and HRPB remains after heat treatment. However, it is noted that the degree of chemical inhomogeneity decreases as different heat treatments are carried out.
Figure 16 shows the morphology of carbides (×30,000) in segregations and the base metal of the CT sample. Carbides in segregations are larger, and their content is higher than in the base metal. Also in the segregations are manganese sulfides found in the CCB and HRPB, elongated along the direction of rolling. The structure of segregations became dispersed in comparison with the sample of HRPB.
Chemical composition (Table 7) shows that in carbides in segregations the content of molybdenum is increased.

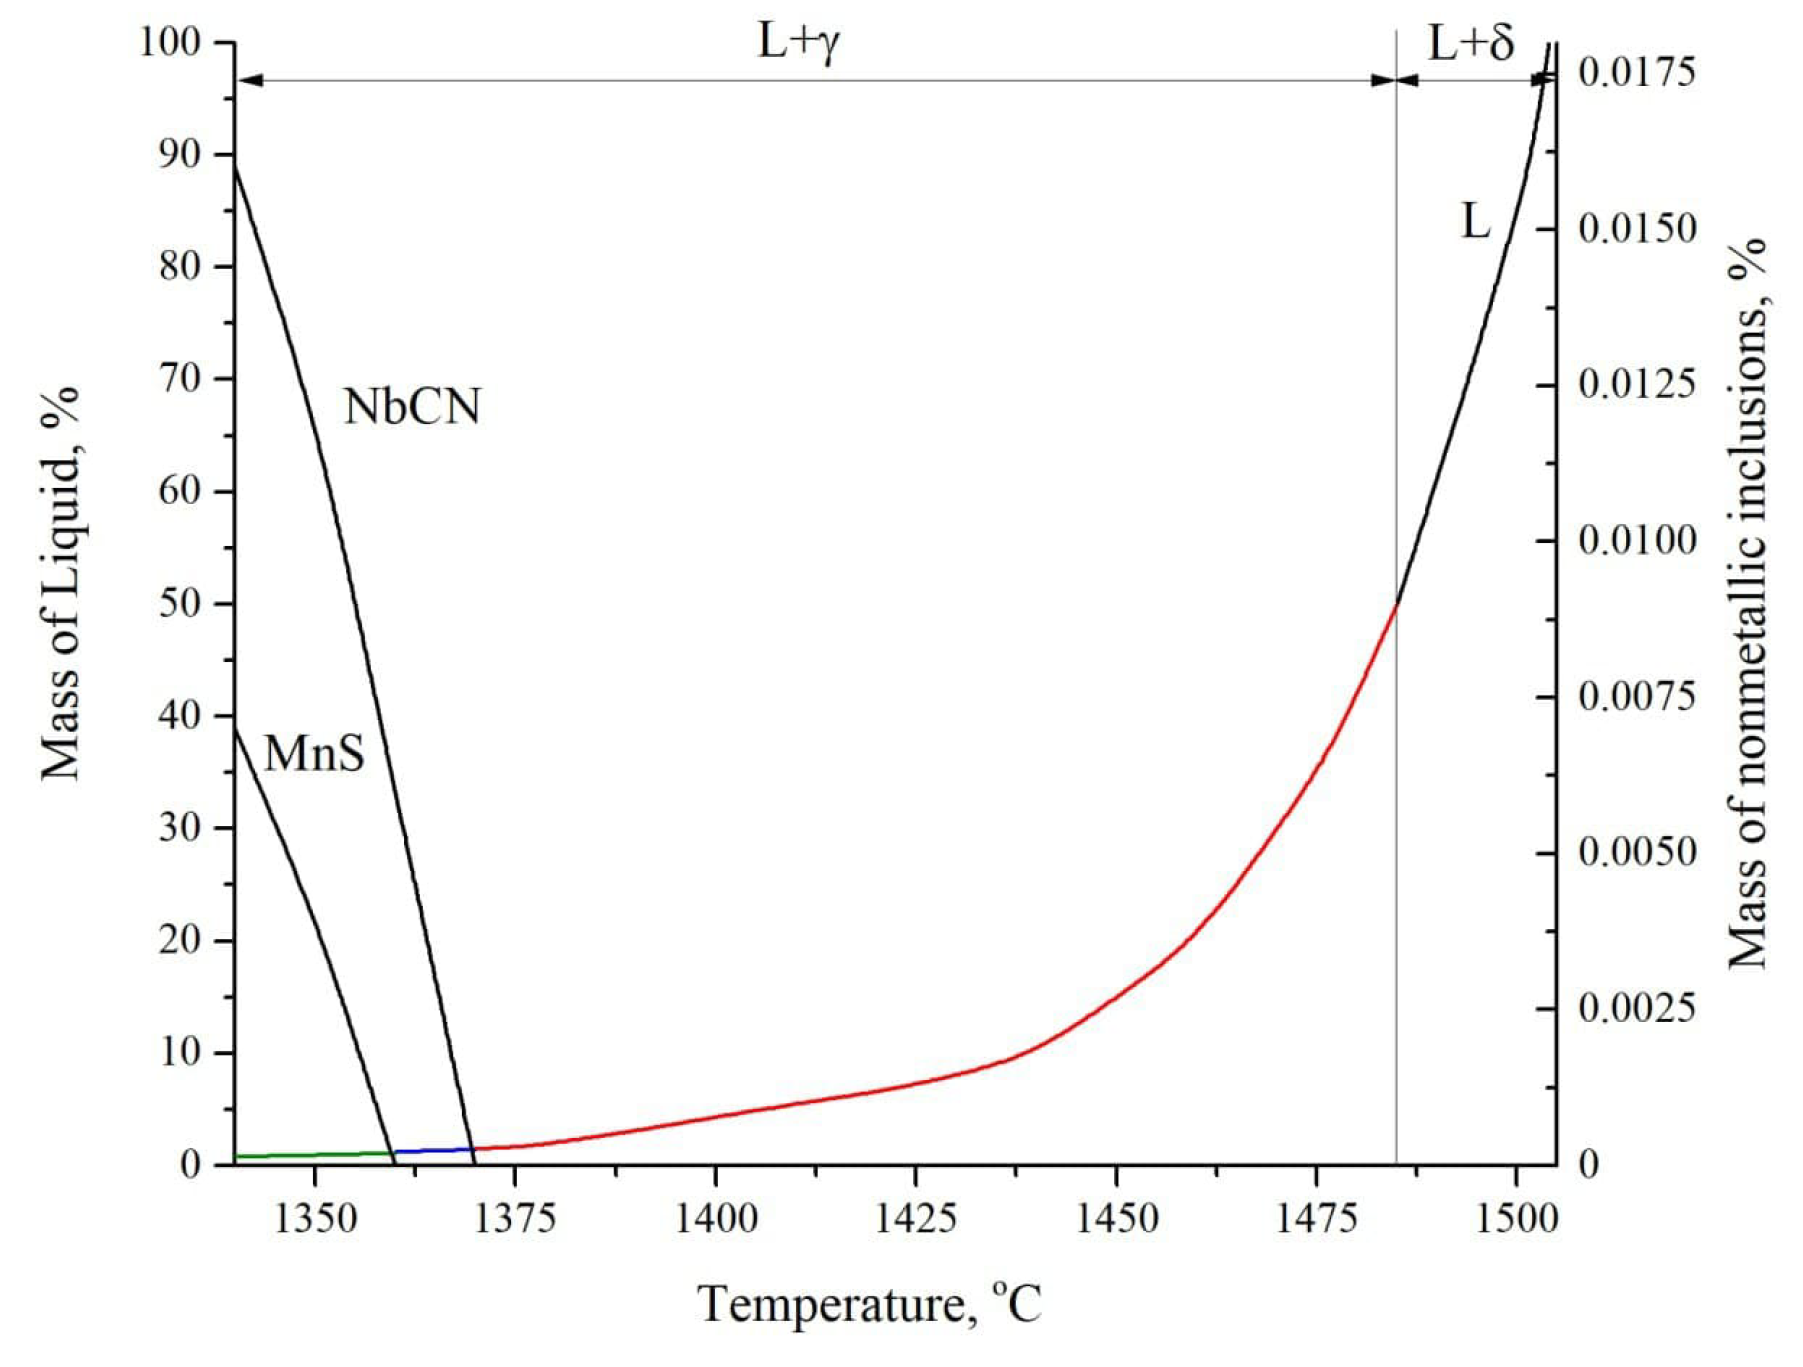
3.3. Evolution of Segregations

To correctly interpret the observed segregations that form in the continuously cast billet and persist throughout all further stages of manufacture, we calculated the solidification according to the rule of nonequilibrium lever (Sheil’s equation). The calculation results are shown in Figure 17 and Table 8, which also show the results of the experimental determination of the composition of segregations.
Thermodynamic modeling showed that steel of a studied chemical composition begins to solidify with the formation of delta-ferrite, which then turns into austenite. At the end of solidification, due to the liquation accumulation of impurities, it becomes possible to form niobium carbonitrides and manganese sulfides, which are found in segregation at all stages of casing tubes manufacturing. The formation of such high-melting compounds cannot be corrected at the stages of further processing of hot rolling and heat treatment. In this case, to prevent high segregation of these inclusions, it is necessary to reduce the temperature and casting speed, and to regulate the secondary cooling of the continuous casting machine. The most effective solution is to organize a soft reduction of the workpiece. Other solution is to adjust the chemical composition to exclude their significant liquation during solidification.
The composition of the liquation liquid at the time of the end of solidification is shown in Table 8, line 1. The Sheil’s equation gives a somewhat overestimated result [17] and trends persist for all elements. The content of Mo and Mn differs significantly from the results of studies with an electron microscope (segregations and base metal), and no niobium present. This is because the study of the area did not consider the presence of inclusions, where the concentrations of these elements are much higher.
The remaining rows of Table 8 summarize the data on the chemical composition in segregation bands found in CT. The degree of chemical heterogeneity during prerolling heating, hot rolling, heating for quenching and tempering decreases, but remains high.
At the very end of solidification at a temperature of 1395 °C, a significant segregation accumulation of sulfur, manganese, nitrogen and carbonitride-forming elements occurs, and carbonitrides based on niobium and manganese sulfides are formed. Thus, in steel with a niobium content of >0.05%, niobium nitrides will always form during solidification. As the cooling rates decrease, these processes will naturally receive more and more development, which is consistent with experimental observations.
In the present work, we determined the concentration of niobium at which carbonitrides are not formed in a liquid metal during nonequilibrium crystallization, which amounted to 0.03%.
Based on the research results, it was recommended to consider the possibility of reducing the content of carbon, niobium and manganese, as well as increasing the content of molybdenum and adding titanium to align the structural heterogeneity. It is necessary to increase the isothermal holding during tempering in order to align the microstructure.

4. Conclusions

  • It is shown that the main reason for the unsatisfactory resistance of CT samples to SSC is the presence of segregation bands and niobium carbonitrides, from which corrosion cracking begins.
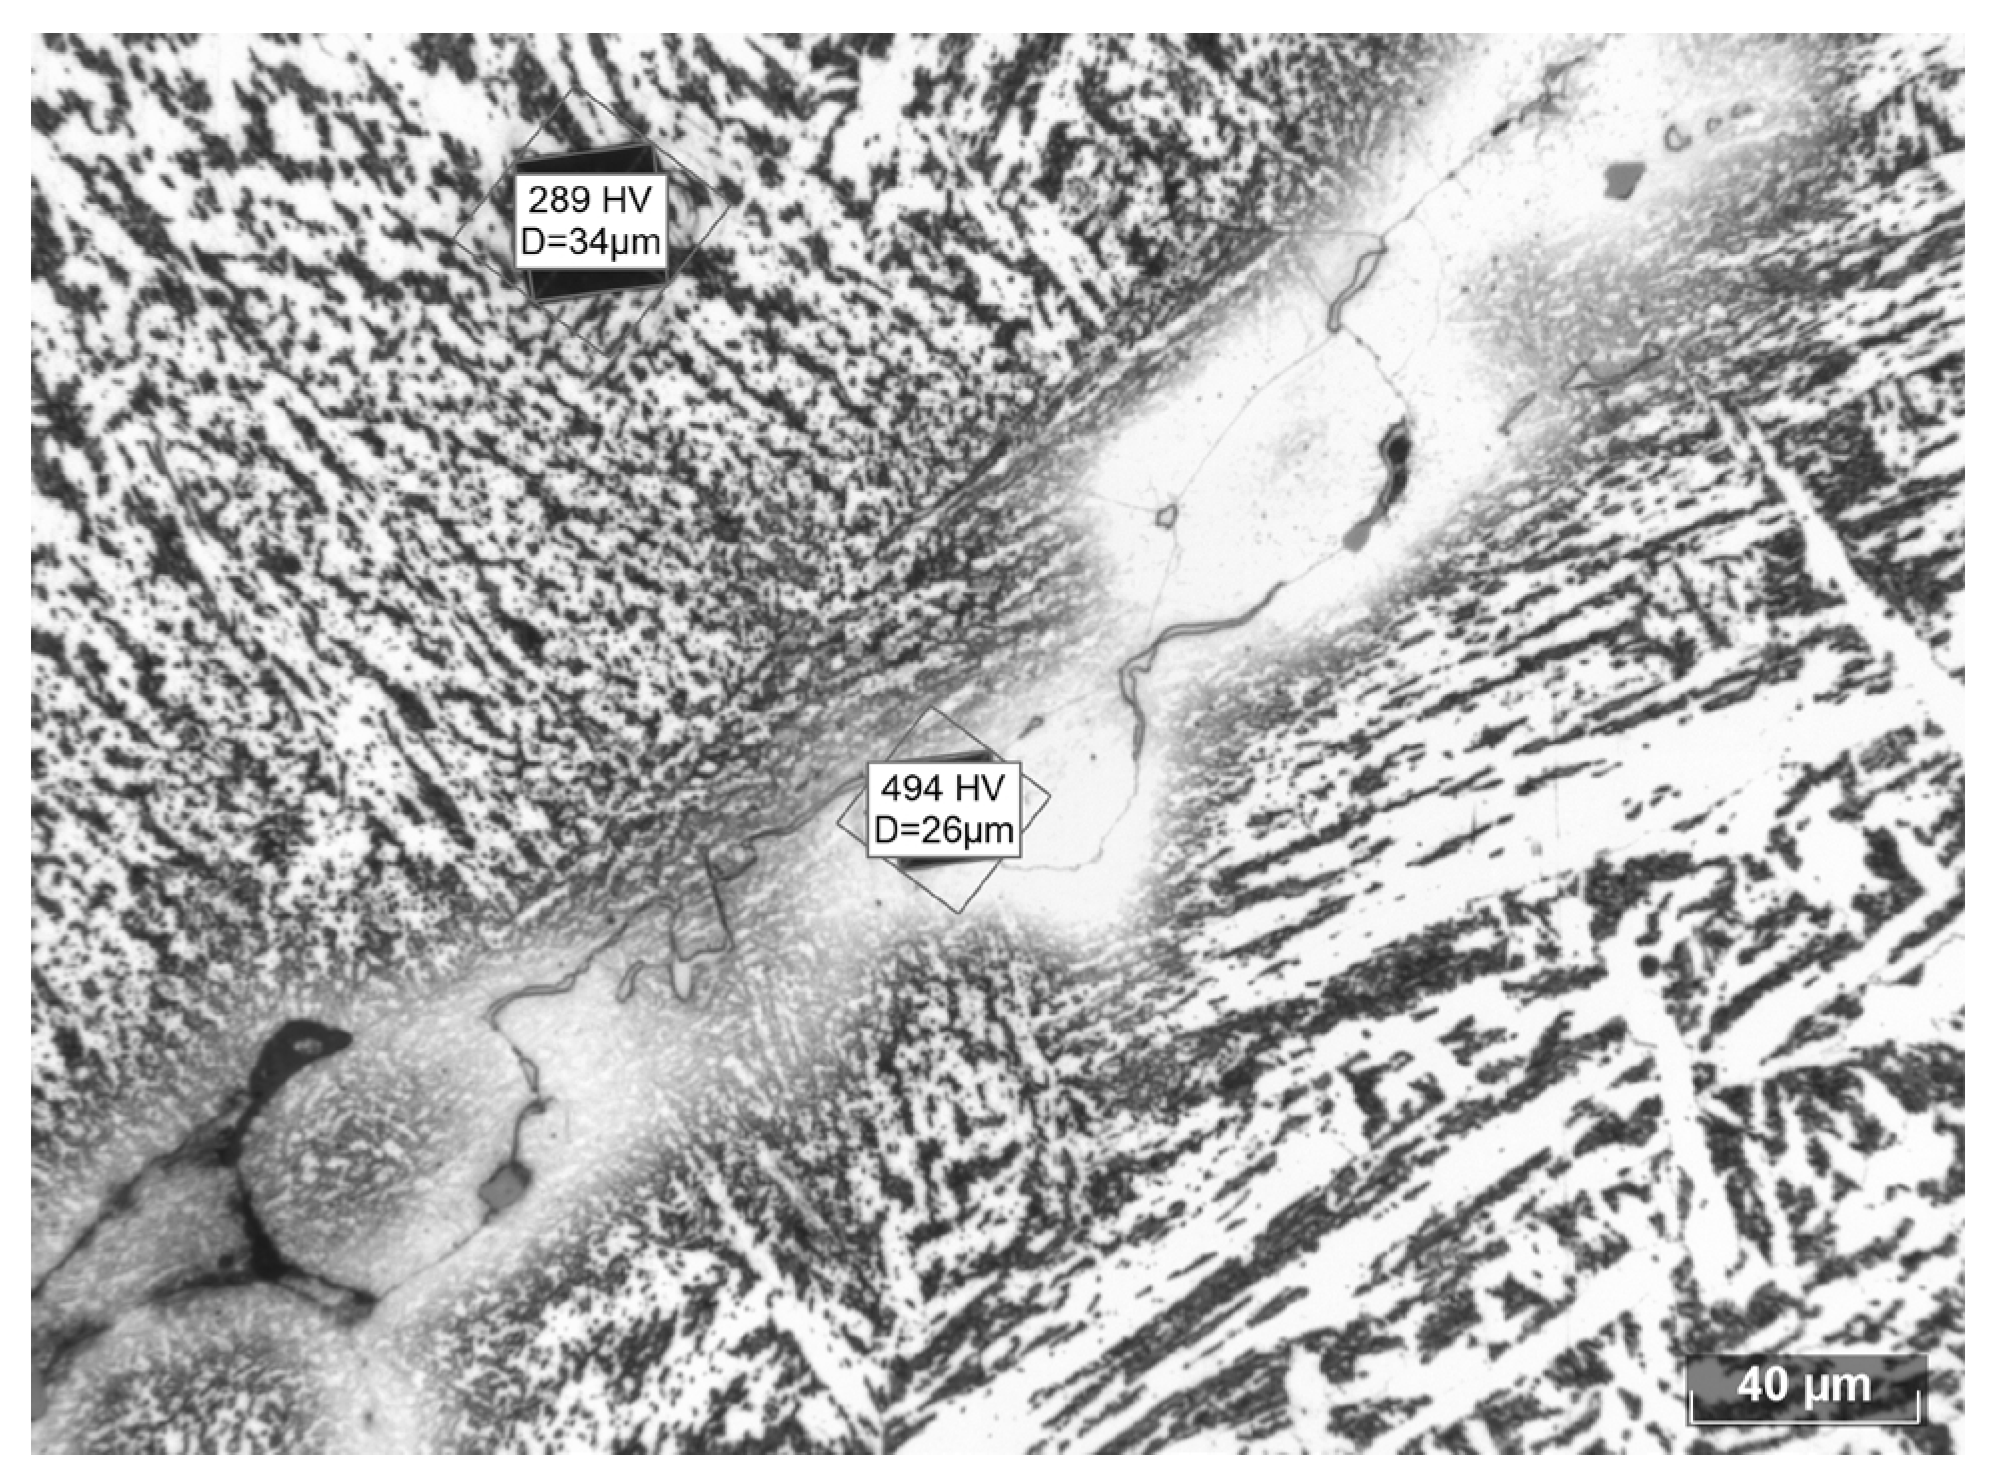
  • Sample of CT corresponds to strength group C110 (API 5CT) in terms of mechanical properties (including macrohardness). However, it has structural heterogeneity and high values of microhardness in segregations. Thus, local deviations from the requirements for hardness values (up to 36 HRC in segregations) are observed, which leads to a decrease in corrosion properties and a manifestation of the material’s tendency to SSC.
  • Coarse segregations were found in the center of the CCB, in which the content of all alloying elements were increased, and also coarse niobium nitrides and manganese sulfides were found. The formation of these segregations is due to the chemical composition of the steel and is also aggravated by the specifics of manufacturing. In the structure of HRPB and CT, segregation bands were found near the inner wall of the tube. In segregations, there is an increased hardness in comparison with the base metal, an increased content of chromium, molybdenum, vanadium and niobium. In addition to dispersed molybdenum and chromium carbides formed during rolling and heat treatment, coarse carbonitrides of niobium, titanium and vanadium were found in the strips, which were formed in the solidifying metal due to liquation processes.
  • To increase the resistance of steel 0.3C-Cr-Mn-Mo + 0.15(V + Nb + Ti) to SCC, primary recommendations for adjusting the chemical composition, production technology and heat treatment have been developed.

Author Contributions

Conceptualization, A.D. and A.Z.; Data curation, N.D. and K.L.; Investigation, A.D. and A.Z.; Methodology, A.D. and A.Z.; Project administration, A.A. and N.D.; Resources, N.D. and K.L.; Supervision, A.Z., A.A., N.D. and K.L.; Validation, A.A.; Visualization, A.D.; Writing—original draft, A.D.; Writing—review & editing, N.D. and K.L. All authors have read and agreed to the published version of the manuscript.

Funding

The research is partially funded by the Ministry of Science and Higher Education of the Russian Federation as part of World-class Research Center program: Advanced Digital Technologies (contract No. 075-15-2020-934 dated 17 November 2020).

Institutional Review Board Statement

Not applicable.

Informed Consent Statement

Informed consent was obtained from all subjects involved in the study.

Data Availability Statement

Data sharing is not applicable.

Conflicts of Interest

The authors declare no conflict of interest.

References

  1. Kostitsyna, I.; Shakhmatov, A.; Davydov, A. Study of corrosion behavior of carbon and low-alloy steels in CO2-containing environments. In Proceedings of the E3S Web of Conferences, Saint Petersburg, Russia, 15–17 September 2021; Volume 121, p. 04006. [Google Scholar]
  2. Strekalovskaya, D.A.; Davydov, A.D.; Lyashenko, D.V.; Tleshev, M. Failure analysis of plunger rod and barrel of sucker rod pumps. Int. J. Mech. Prod. Eng. Res. Dev. 2020, 10, 14835–14844. [Google Scholar] [CrossRef]
  3. Devyaterikova, N.; Nurmukhametova, M.; Kharlashin, A.; Popov, Y. Types of corrosion damage of tubing in the oilfield. In Proceedings of the E3S Web of Conferences, Saint Petersburg, Russia, 22–24 May 2019; Volume 121, p. 03001. [Google Scholar]
  4. Ermakov, B.; Alhimenko, A.; Shaposhnikov, N.; Tsvetkov, A.; Shirokov, A. Study of the crystallographic texture of pipe steel. Lett. Mater. 2020, 10, 48–53. [Google Scholar] [CrossRef]
  5. Alkhimenko, A.A.; Ermakov, B.S.; Alekseeva, E.L.; Mushnikova, S.Y. Peculiarities of Corrosion Cracking of High-Strength Pipe Steels in Hydrogen Sulfide Environment. Int. J. Mech. Prod. Eng. Res. Dev. 2020, 10, 15175–15184. Available online: http://www.tjprc.org/publishpapers/2-67-1601123912-IJMPERDJUN20201446.pdf (accessed on 1 September 2021). [CrossRef]
  6. Aleksandrov, S.; Laev, K.; Shcherbakov, I.; Devyaterikova, N.; Oshurkov, G.; Rogova, K.; Pavlov, A.; Rodionova, I. Hot-rolled Seamless Tubing with Increased Operational Reliability for Oil-Field Equipment. Patent RU 2719618 C1, 21 April 2020. [Google Scholar]
  7. ANSI/API Specification 5CT. Specification for Casing and Tubing. Available online: https://www.api.org/~/media/Files/Certification/Monogram-APIQR/Purchasing%20Guidelines/5CT%209th%20Edition%20Purch%20Guidelines%20R1%2020120429.pdf (accessed on 1 September 2021).
  8. Shiryaeva, A.G.; Chetverikovb, S.G.; Chikalova, S.G.; Pyshmintsevc, I.Y.; Krylovd, P.V. Production of seamless steel pipe for oil and gas extractionin challenging conditions. Steel Transl. 2018, 48, 704–711. [Google Scholar] [CrossRef]
  9. Zhou, T.; Zhang, P.; Kuuskman, K.; Cerilli, E.; Rehman, K.; Cho, S.; Burella, D. Development of medium-high carbon cas-ing/tubing for direct strip production complex (DSPC). In Proceedings of the Materials Science and Technology 2016 (MS&T16) Salt Palace Convention Center, Salt Lake City, UT, USA, 23–27 October 2016; Volume 1, pp. 769–776. [Google Scholar]
  10. Putilova, E.A.; Zadvorkin, S.M.; Gorkunov, E.S.; Veselov, I.N.; Pyshmintsev, I.Y. Investigation of structure and properties of low-carbon low-alloyed Cr-Mo pipe steel intended for operating in sour environment. AIP Conf. Proc. 2019, 2167, 020291. [Google Scholar]
  11. Omura, T.; Numata, M.; Takayama, T.; Arai, Y. Super-high Strength Low Alloy Steel OCTG with Improved Sour Resistance. Nippon Steel & Sumitomo Metal Technical Report No. 107 February 2015. Ferrum. Bull. Iron Steel Inst. Japan 2015, 9, 575–579. [Google Scholar]
  12. El-Sherik, A.M. Trends in Oil and Gas Corrosion Research and Technologies; Pitting corrosion 28; Sankara Papavinasam CorrMagnet Consulting Inc.: Ottawa, ON, Canada, 2017. [Google Scholar]
  13. Popoola, L.T.; Grema, A.S.; Latinwo, K.; Gutti, B.; Balogun, A.S. Corrosion problems during oil and gas production and its mitigation. Int. J. Ind. Chem. 2013, 4, 35. [Google Scholar] [CrossRef] [Green Version]
  14. Alhimenko, A.; Kharkov, A.; Shemyakinskiy, B.; Shaposhnikov, N. Development of the methodology of accelerated testing of oil-gas pipe steels for stress corrosion cracking 2020 Zavodskaya Laboratroiya. Diagn. Mater. 2020, 86, 70–76. [Google Scholar]
  15. NACE TM 0177 Laboratory Testing of Metals for Resistance to Sulfide Stress Cracking and Stress Corrosion Cracking in H2S Environments. Available online: https://store.nace.org/tm0177-2016 (accessed on 1 September 2021).
  16. GOST 1497-84 Metals. Methods of Tension Test. Available online: https://docs.cntd.ru/document/1200004888 (accessed on 1 September 2021).
  17. Andersson, J.-O.; Helander, T.; Höglund, L.; Shi, P.; Sundman, B. Thermo-Calc & DICTRA, computational tools for materials science. Calphad 2002, 26, 273–312. [Google Scholar] [CrossRef]
  18. Kurz, W.; Fisher, D.J. Fundamentals of Solidification, 3rd ed.; Trans Tech Publications, Ltd.: Kapellweg, Switzerland, 1990; ISBN 0878495233. [Google Scholar]
Figure 1. Samples after sulfide stress cracking (SSC) testing.
Metals 11 01843 g001
Figure 2. Fracture surface of the specimen after testing on SSC 85% yield strength (YSmin). (a) General view of the fracture surface, ×10; (bd) enlarged images, respectively, in the red, yellow and blue regions, ×2000.
Metals 11 01843 g002
Figure 3. Secondary cracks in microstructure of the specimen after testing on SSC.
Metals 11 01843 g003
Figure 4. Light optical microscope (LOM) images of microstructure in bright (a) and dark (b) bands.
Metals 11 01843 g004
Figure 5. Scanning electron microscope SEM images of microstructure in dark (a) and bright (b) bands. In these pictures shown areas for the local chemical composition determination (magenta).
Metals 11 01843 g005
Figure 6. Continuous casting billet (CCB) template 100 mm long after macroetching with hydrochloric acid (HCl).
Metals 11 01843 g006
Figure 7. Nitrides at distances of 15 (a), 50 (b) and 90 (c) mm in CCB.
Metals 11 01843 g007
Figure 8. Microstructure in the segregation in CCB.
Metals 11 01843 g008
Figure 9. SEM image of microstructure in segregation in CCB.
Metals 11 01843 g009
Figure 10. Microstructure in inner wall (a), central part (b) and outer wall (c) of hot-rolled pipe billet (HRPB).
Metals 11 01843 g010
Figure 11. Comparison of LOM (a) and SEM (b) images of microstructure in segregations and base metal in HRPB. Also shown are areas for determining the chemical composition.
Metals 11 01843 g011
Figure 12. SEM images of carbides in segregations (a) and in base metal (b) in HRPB.
Metals 11 01843 g012
Figure 13. Distribution of microhardness on cross-section of the wall of casing tube (CT).
Metals 11 01843 g013
Figure 14. Microstructure in inner wall (a), central part (b) and outer wall (c) of CT.
Metals 11 01843 g014
Figure 15. Comparison of LOM (a) and SEM (b) images of microstructure in segregations and base metal in CT. Also shown are areas for determining the chemical composition.
Metals 11 01843 g015
Figure 16. SEM images of carbides in segregations (a) and in base metal (b) in CT.
Metals 11 01843 g016
Figure 17. Thermodynamic modeling of impurities content.
Metals 11 01843 g017
Table 1. Mechanical properties of the OCTG samples.
SampleYS, MPaTS, MPaElongation, %YS/TSHardness, HRC
179587818.70.9026.0
278587519.10.8926.5
380088020.10.9026.0
API 5CT (C110)758–828>793<30.0
Table 2. Chemical composition in dark and bright bands (for Figure 5), wt. %.
ElementDark BandBright Band
Spectrum 1Spectrum 2
Si0.420.32
Cr1.290.96
Mn0.880.93
Fe95.9997.07
Mo1.420.71
Table 3. Chemical composition of segregation zone in CCB, wt. %.
ElementSiTiVCrMnFeCuNbMo
Spectrum 10.610.301.421.0393.130.303.22
Spectrum 20.390.690.6697.300.320.63
Spectrum 32.342.1095.66
Table 4. Chemical composition of the segregations and the base metal of the HRPB sample, wt. %.
ElementSiCrMnFeCuNbMo
Spectrum 10.400.840.7396.480.200.241.11
Spectrum 20.290.680.5097.880.65
Table 5. Chemical composition of carbides in segregations and base metal of the hot-rolled pipe billet (HRPB) sample, wt. %.
ZoneSegregation BandBase Metal
Spectrum, №1234123
Si15.3315.4117.1015.5113.3123.4714.75
Cr30.6729.8428.7126.2725.1028.6428.11
Mn23.0022.3023.2325.0020.5322.5423.96
Cu22.069.22
Nb
Mo31.0032.4630.9733.2319.0125.3523.96
Table 6. Chemical composition of the segregations and the base metal of the casing tube (CT) sample, wt. %.
ElementSiCrMnFeCuNbMo
Spectrum 10.470.940.7896.390.331.08
Spectrum 20.310.720.6397.530.240.58
Table 7. Chemical composition of carbides in segregations and base metal of the CT sample, wt. %.
ZoneSegregation BandBase Metal
Spectrum, №12341234
Si16.1212.2921.0416.0416.3116.8020.5817.01
Cr24.8622.1730.4922.9929.7930.4026.2326.53
Mn21.5820.2425.6120.5922.3422.0024.6121.77
Cu7.386.2711.767.458.8010.099.18
Mo30.0539.0422.8728.6124.1122.0018.1625.51
Table 8. Chemical composition, wt. % (from Table 3, Table 4 and Table 6).
ElementSiVCrMnCuNbMo
Thermodynamic modeling
(T = 1375 °C)
1.20.51.001.802.54.60
Segregations in CCB0.610.31.421.030.303.22
Base metal in CCB0.390.690.660.320.63
Segregations in HRPB0.400.840.730.20.241.11
Base metal in HRPB0.290.680.50.65
Segregations CT0.470.940.780.331.08
Base metal in CT0.310.720.630.240.58
Publisher’s Note: MDPI stays neutral with regard to jurisdictional claims in published maps and institutional affiliations.

