Author Contributions
Conceptualization, X.M. and J.Z.; methodology, R.M.; software, L.L.; validation, L.L., X.M. and R.Z.; formal analysis, R.Z.; investigation, J.Z.; resources, J.Z.; data curation, L.L.; writing—original draft preparation, X.M.; writing—review and editing, L.L.; visualization, R.M.; supervision, R.Z.; project administration, J.Z.; funding acquisition, R.M. All authors have read and agreed to the published version of the manuscript.
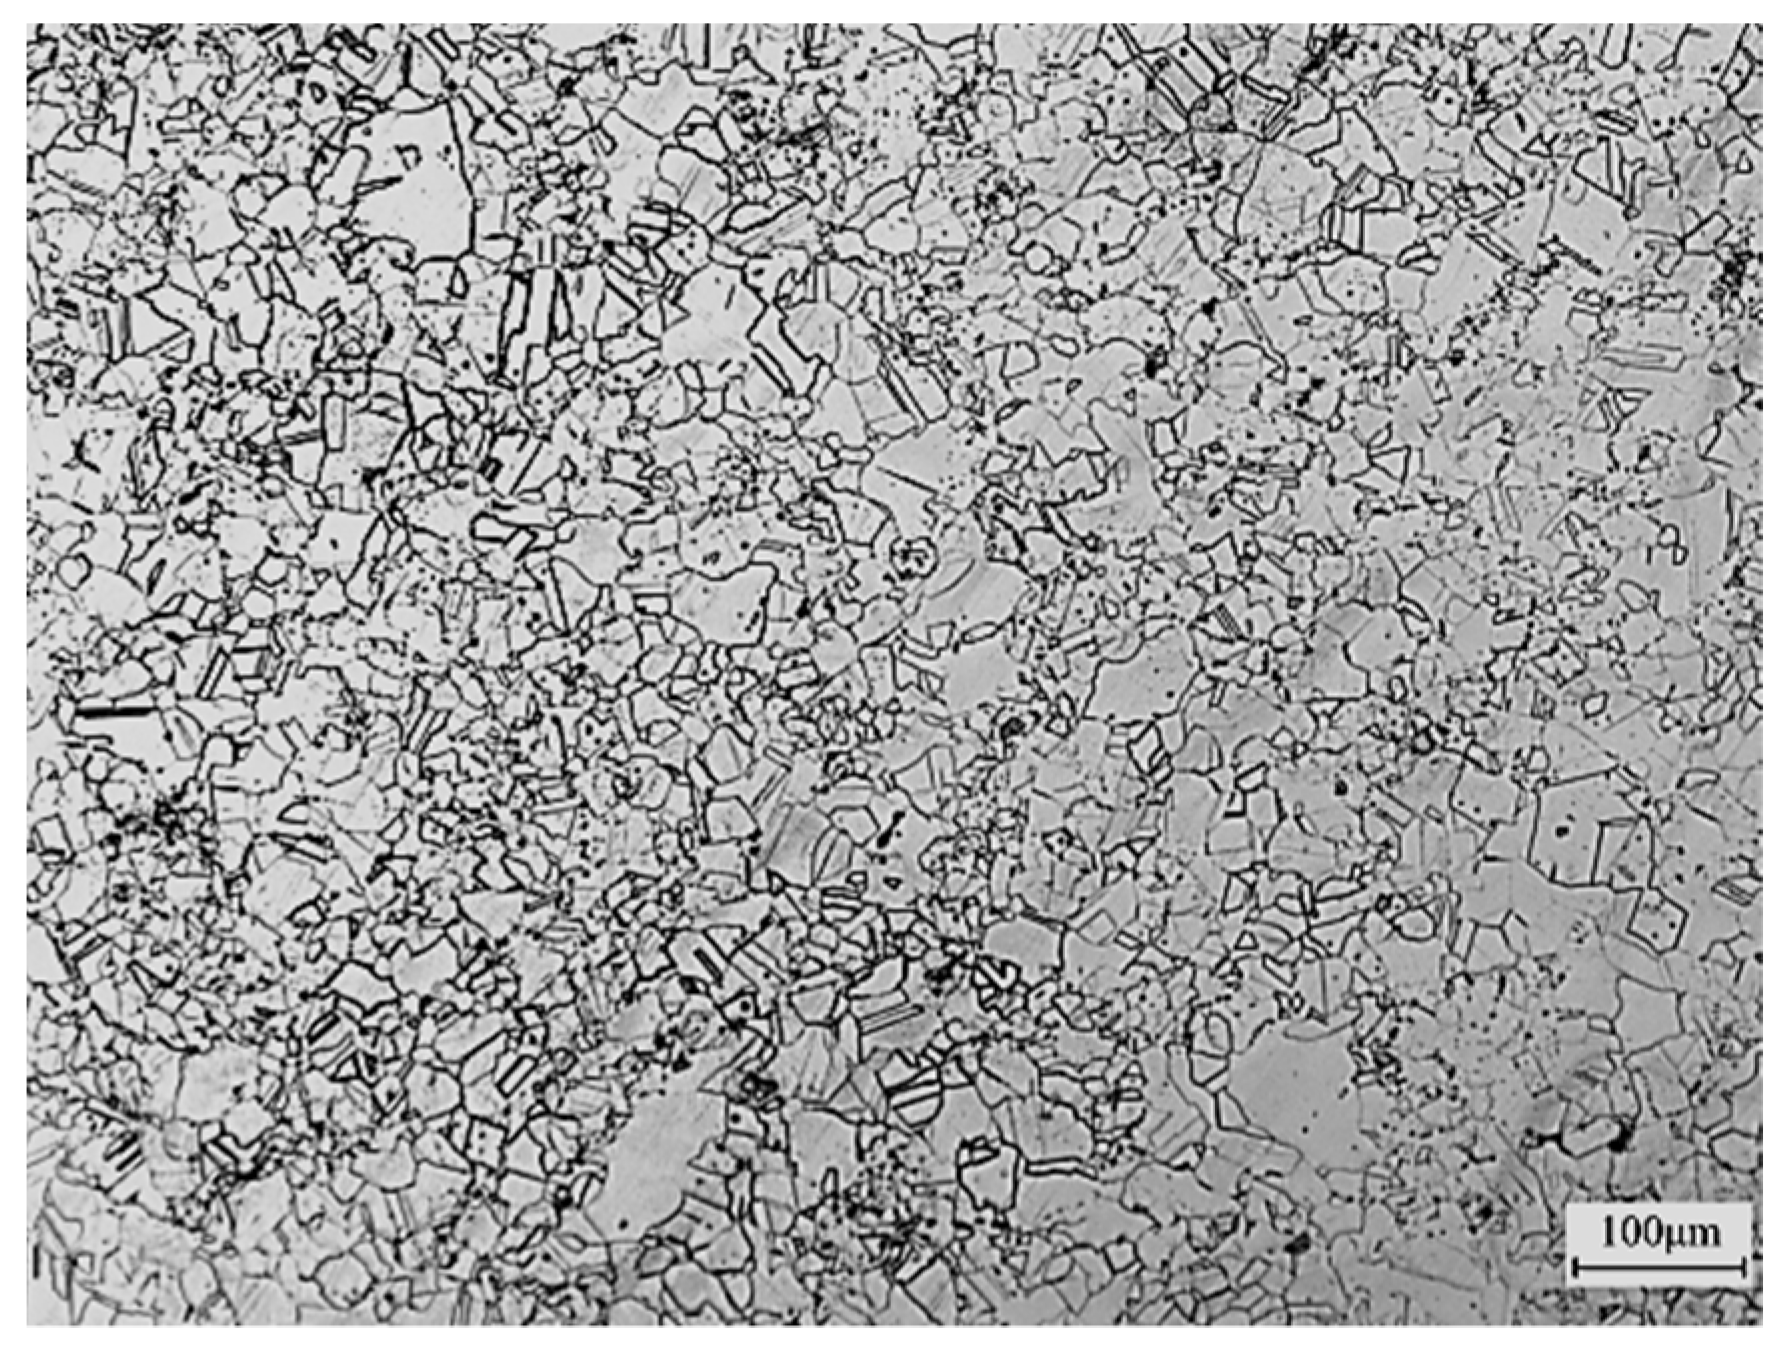
Figure 1.
Original metallographic structure of GH901 superalloy.
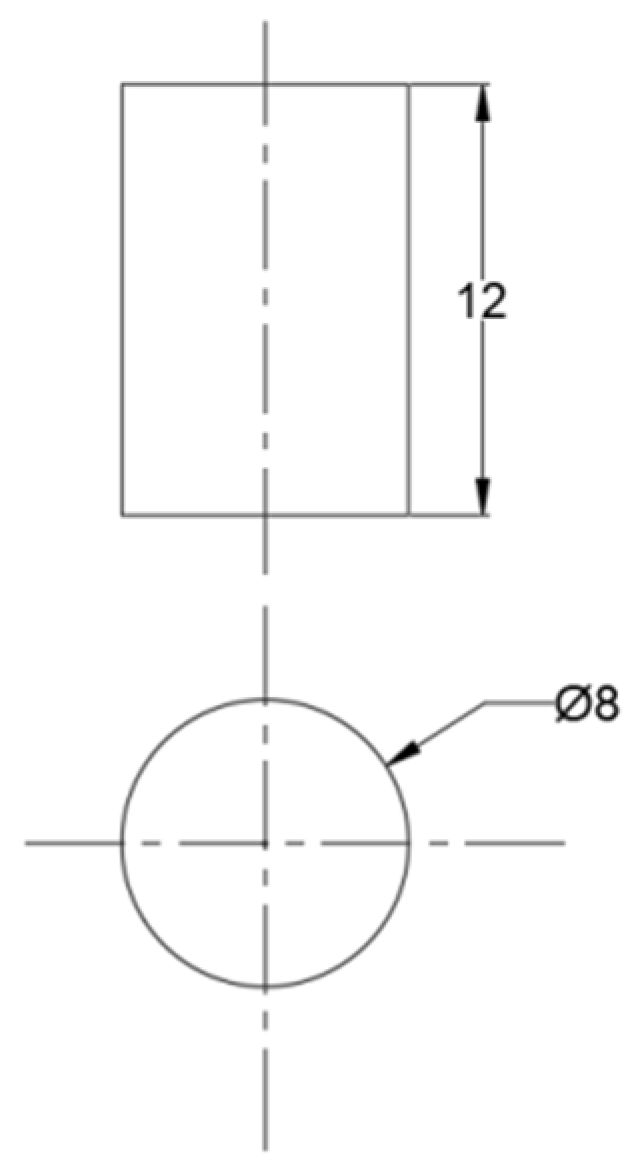
Figure 2.
Original cylindrical specimen.
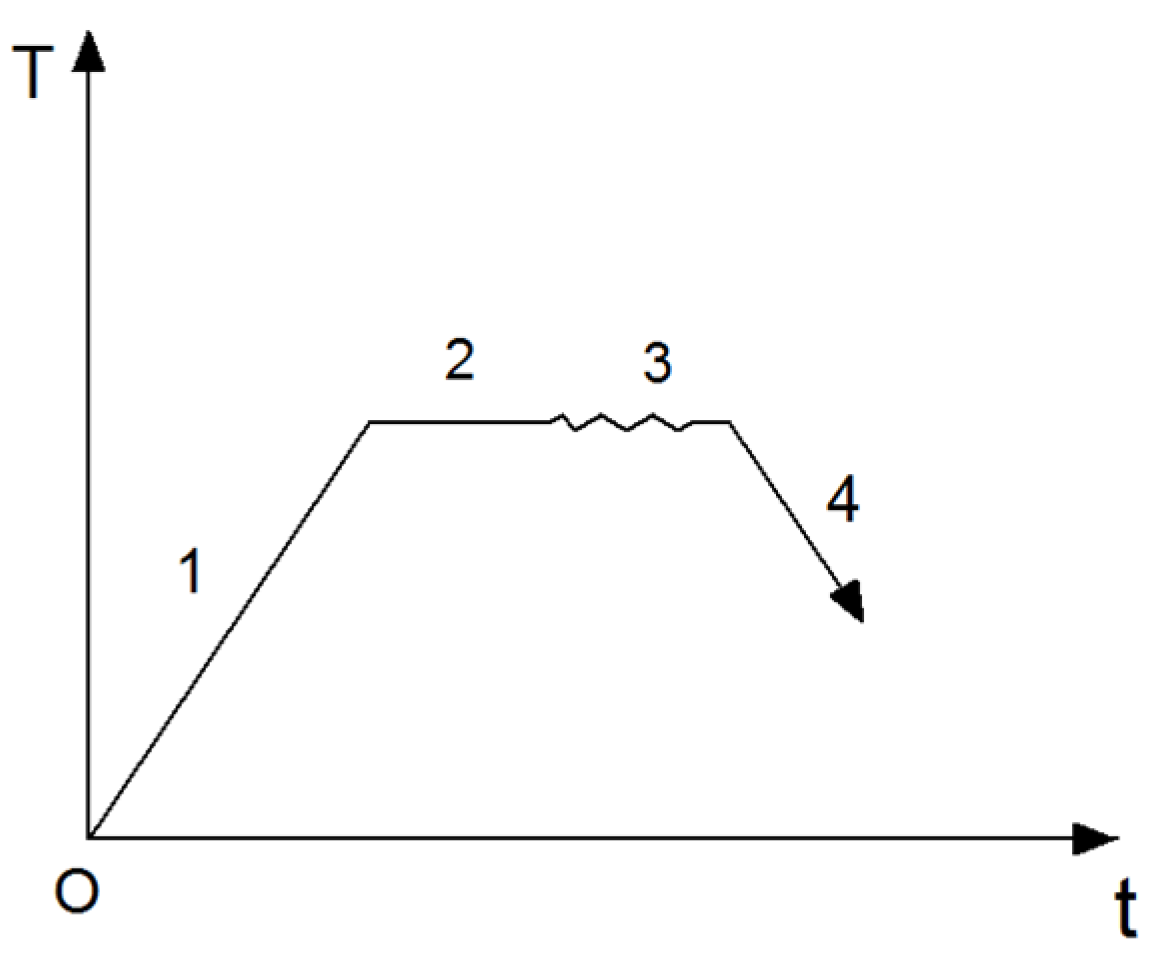
Figure 3.
Flow chart of isothermal compression.
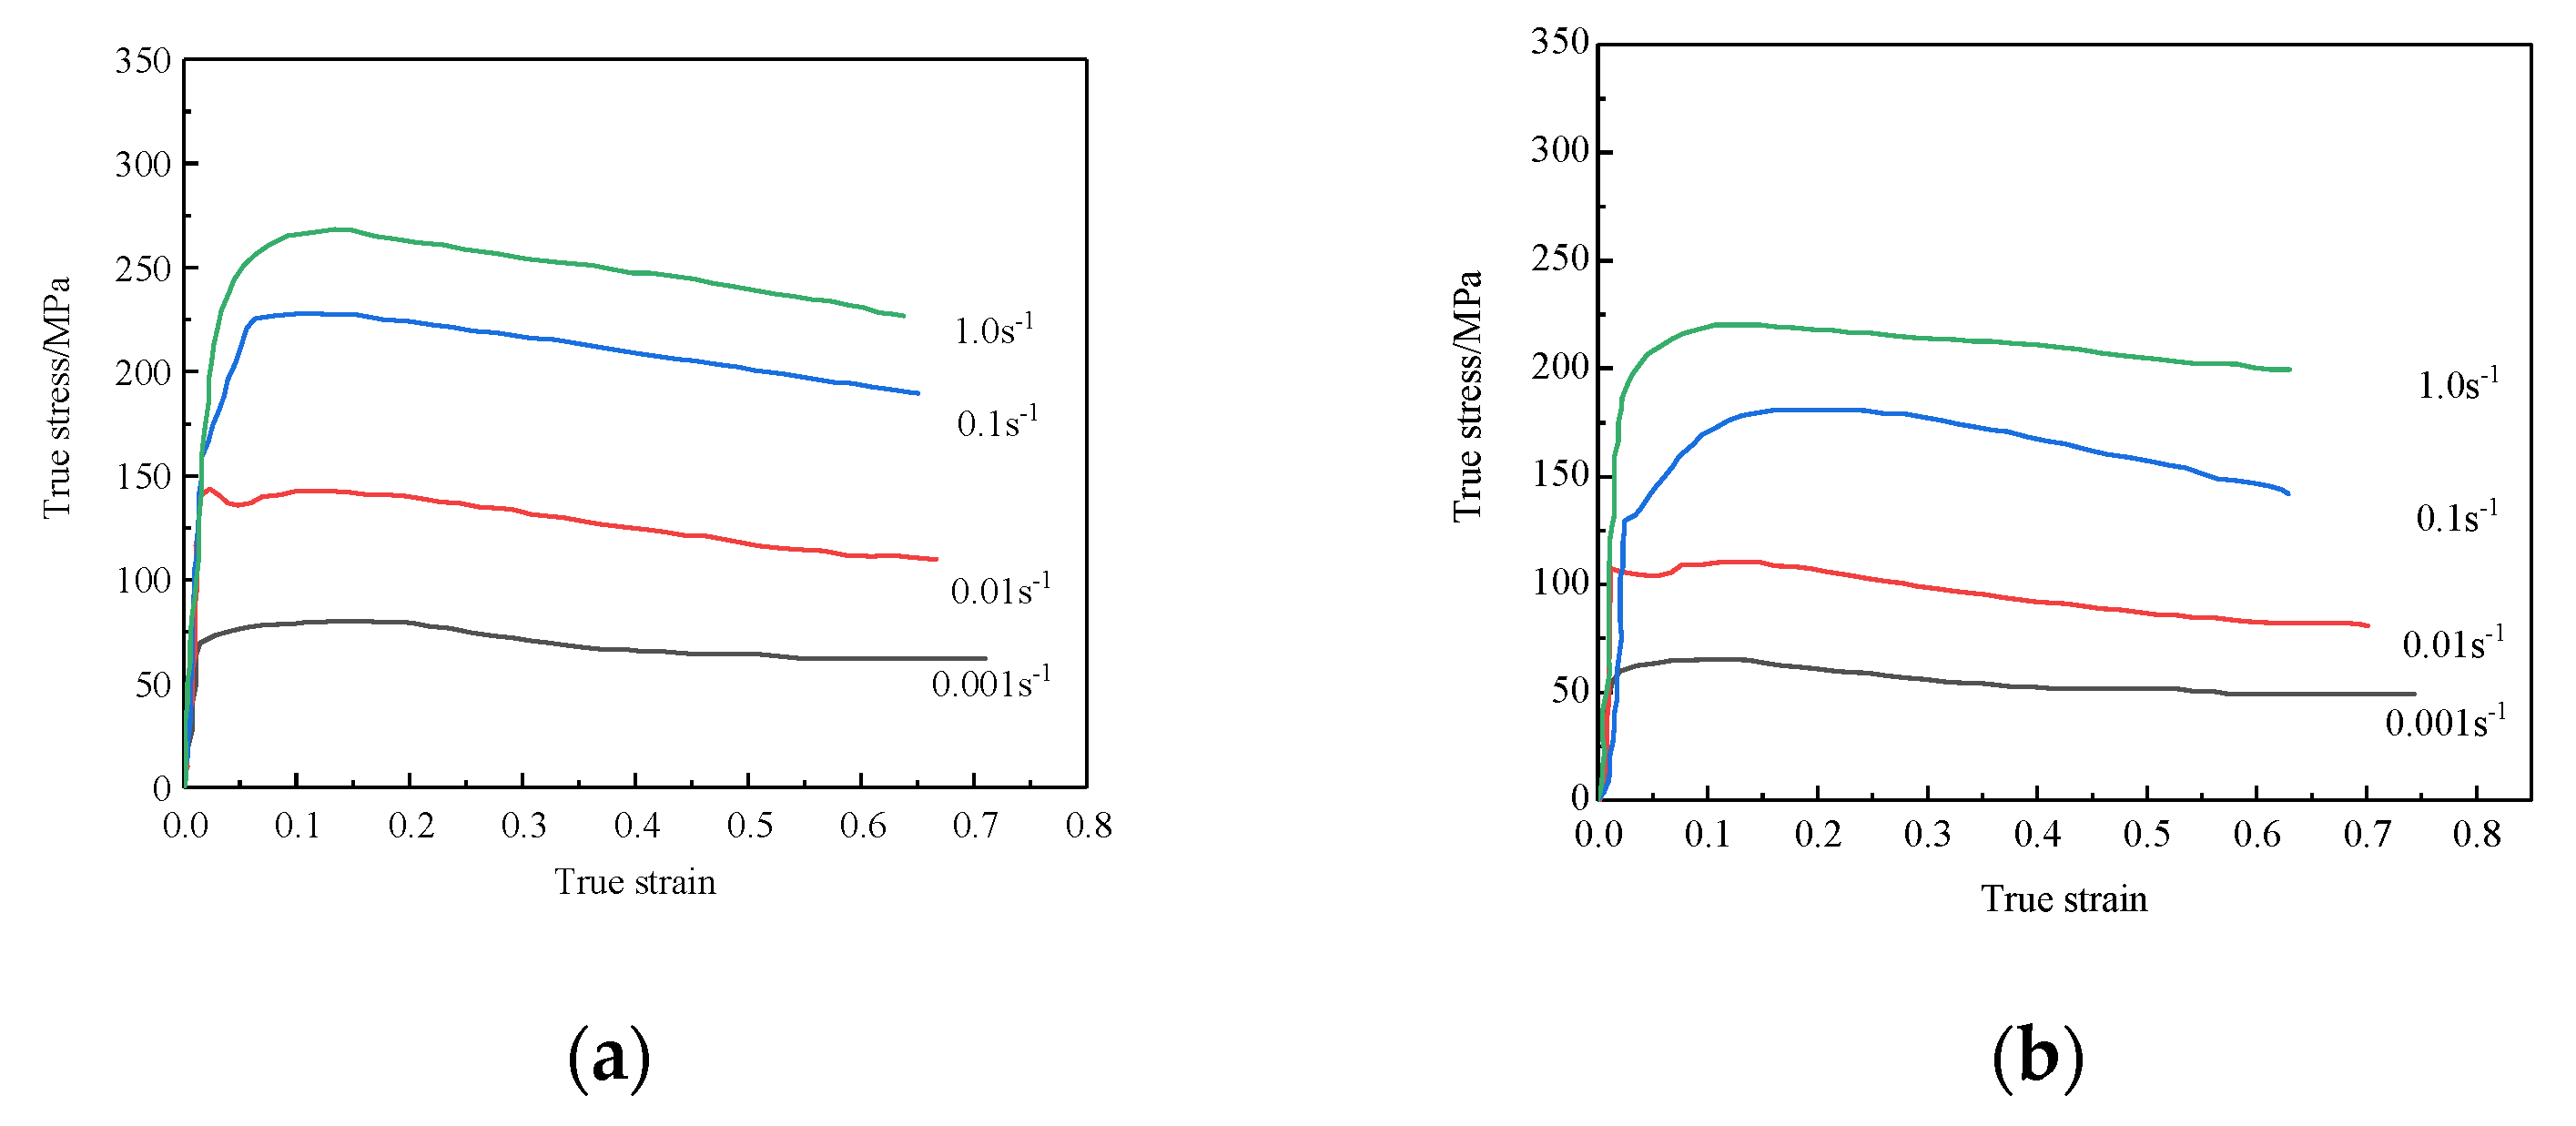
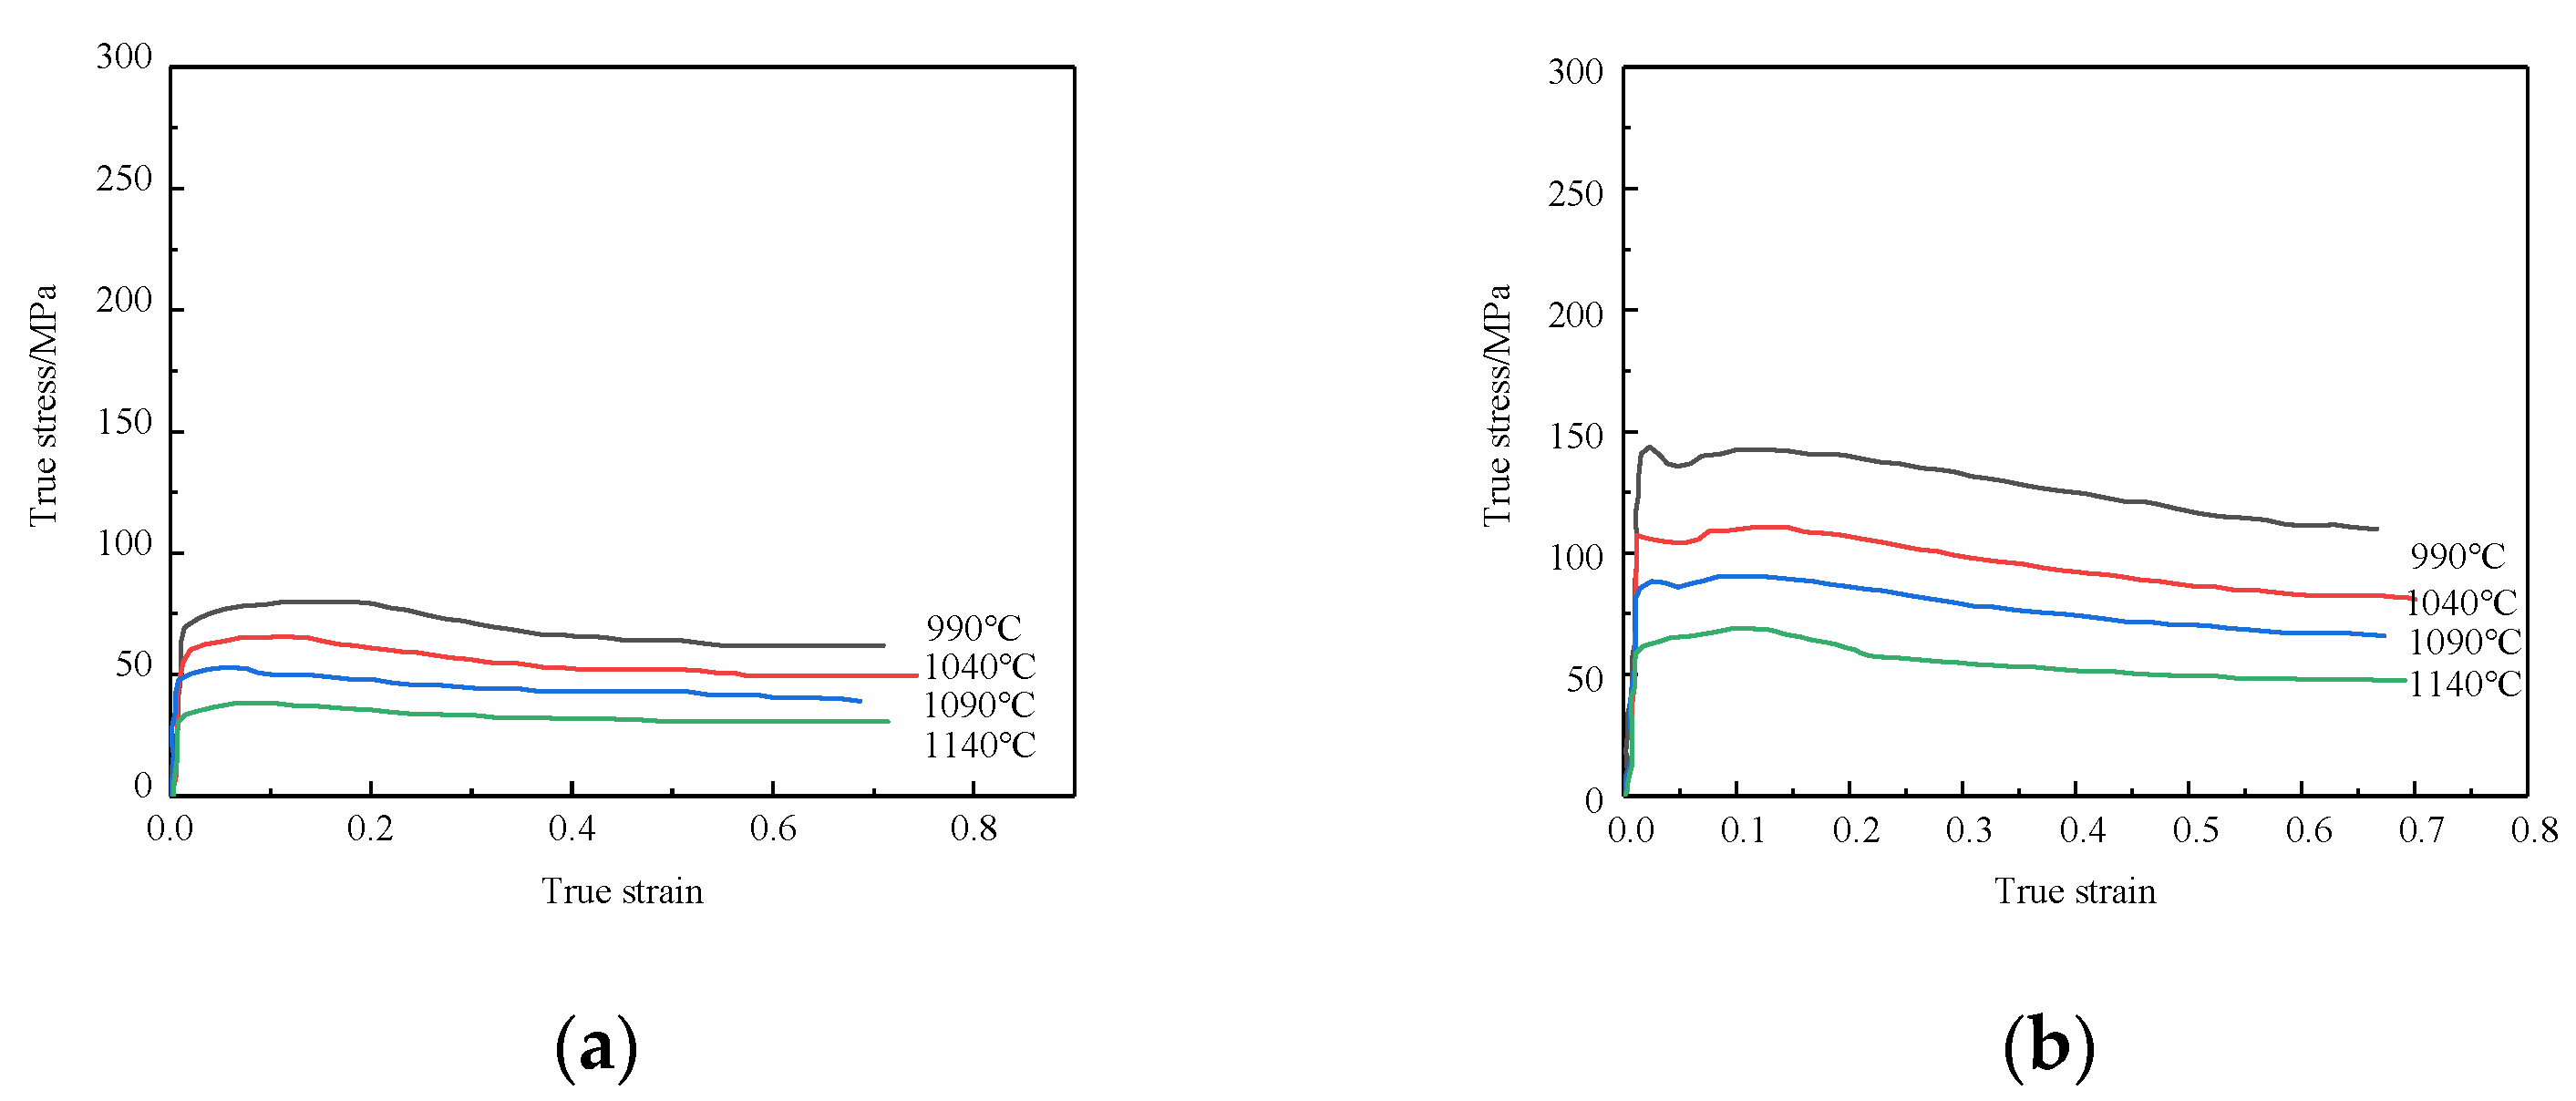
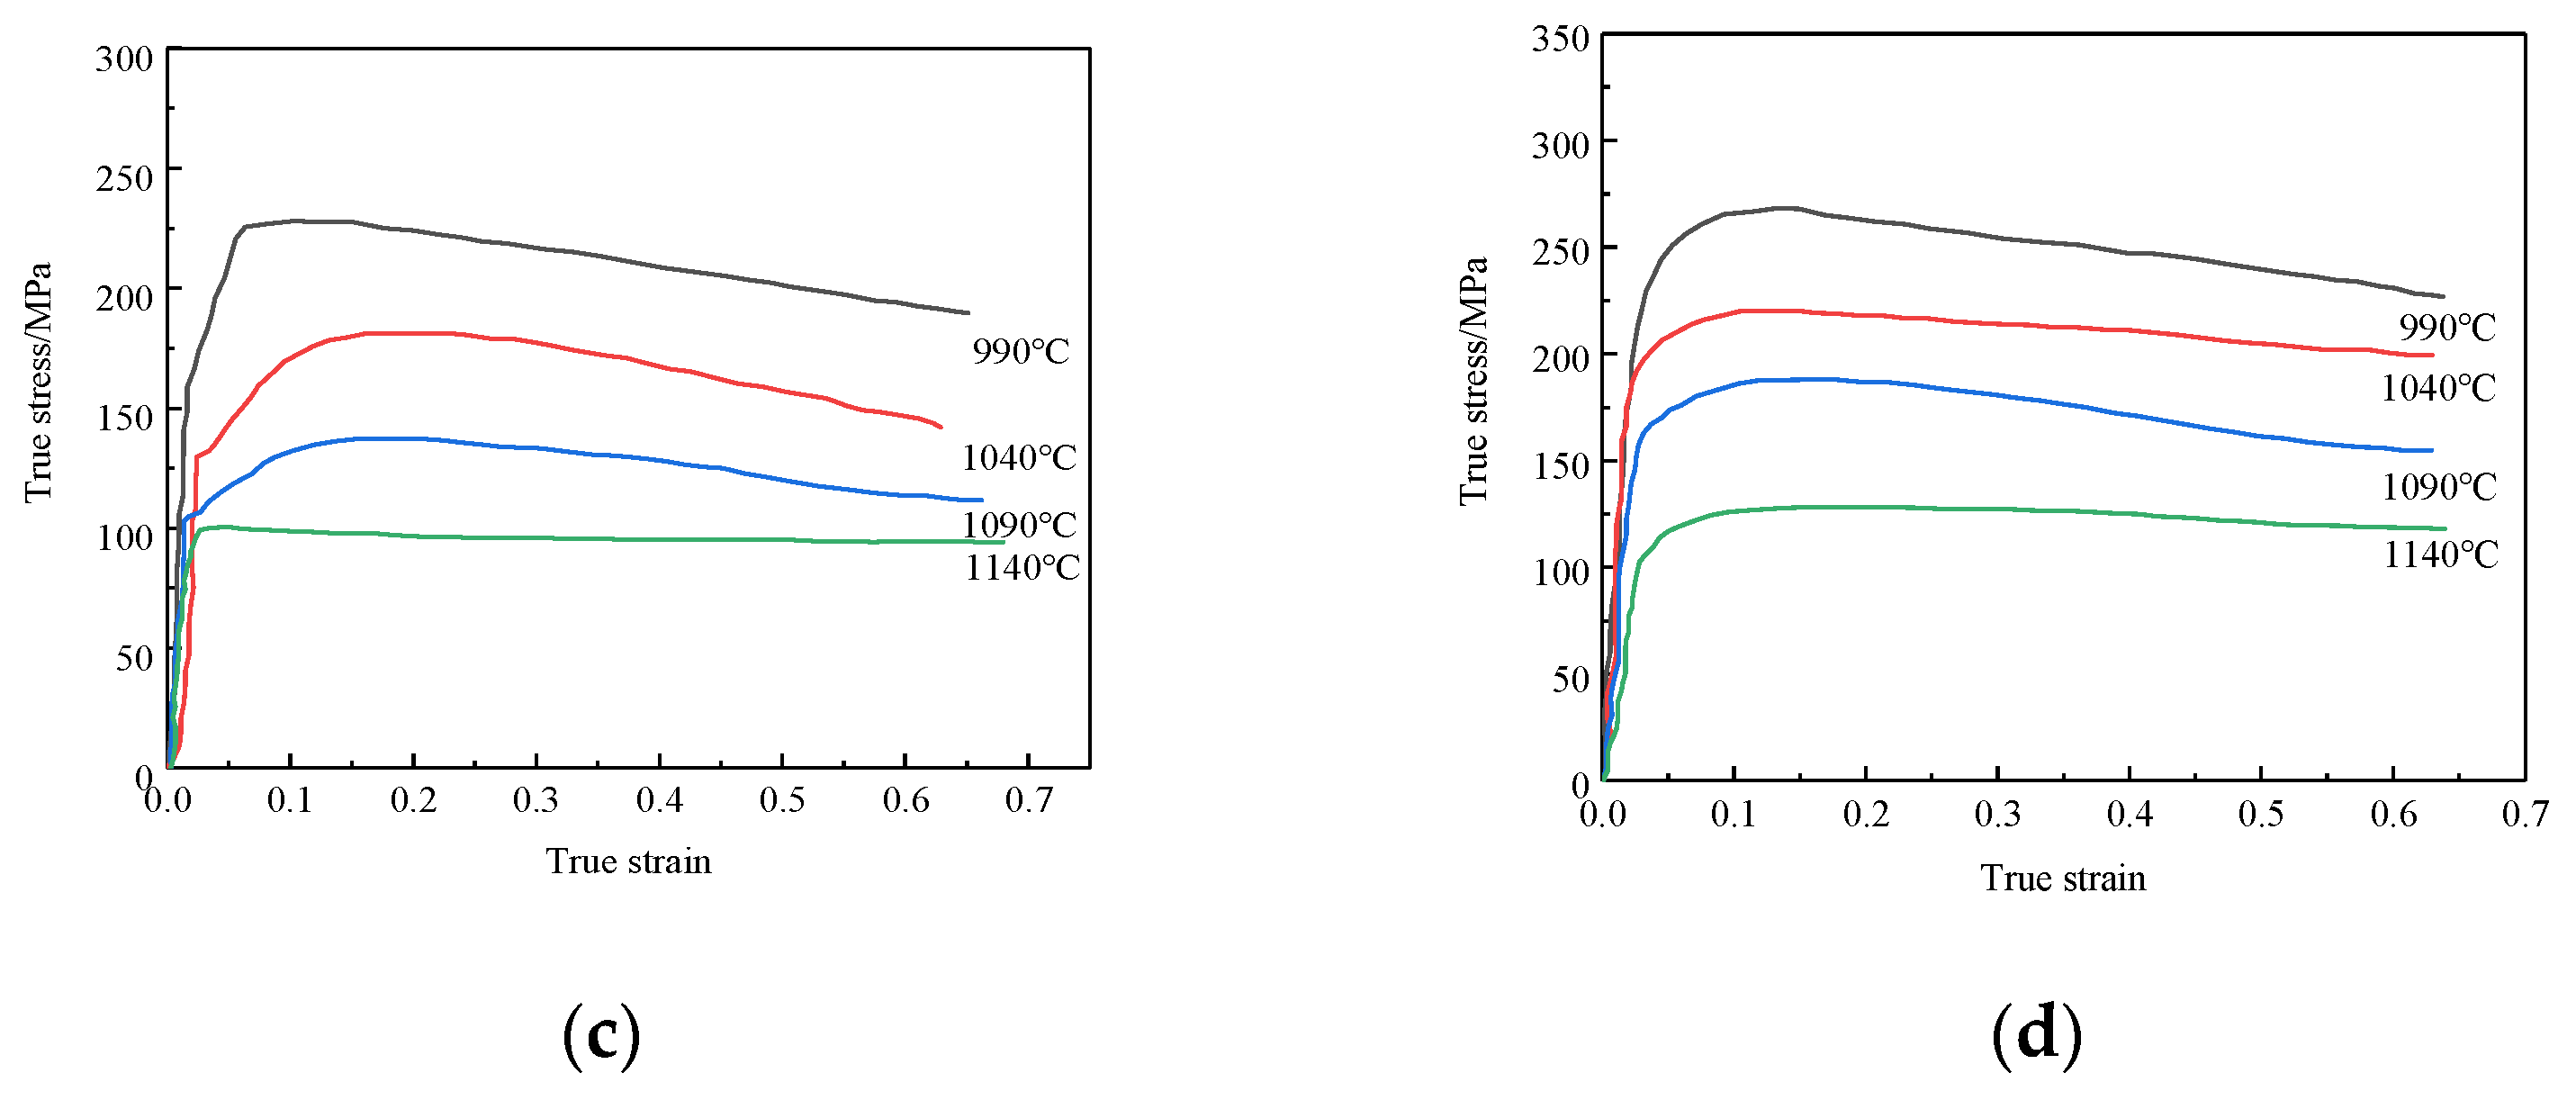
Figure 4.
True stress–strain curves of GH901. (a) T = 990 °C, (b) T = 1040 °C, (c) T = 1090 °C, (d) T = 1140 °C.
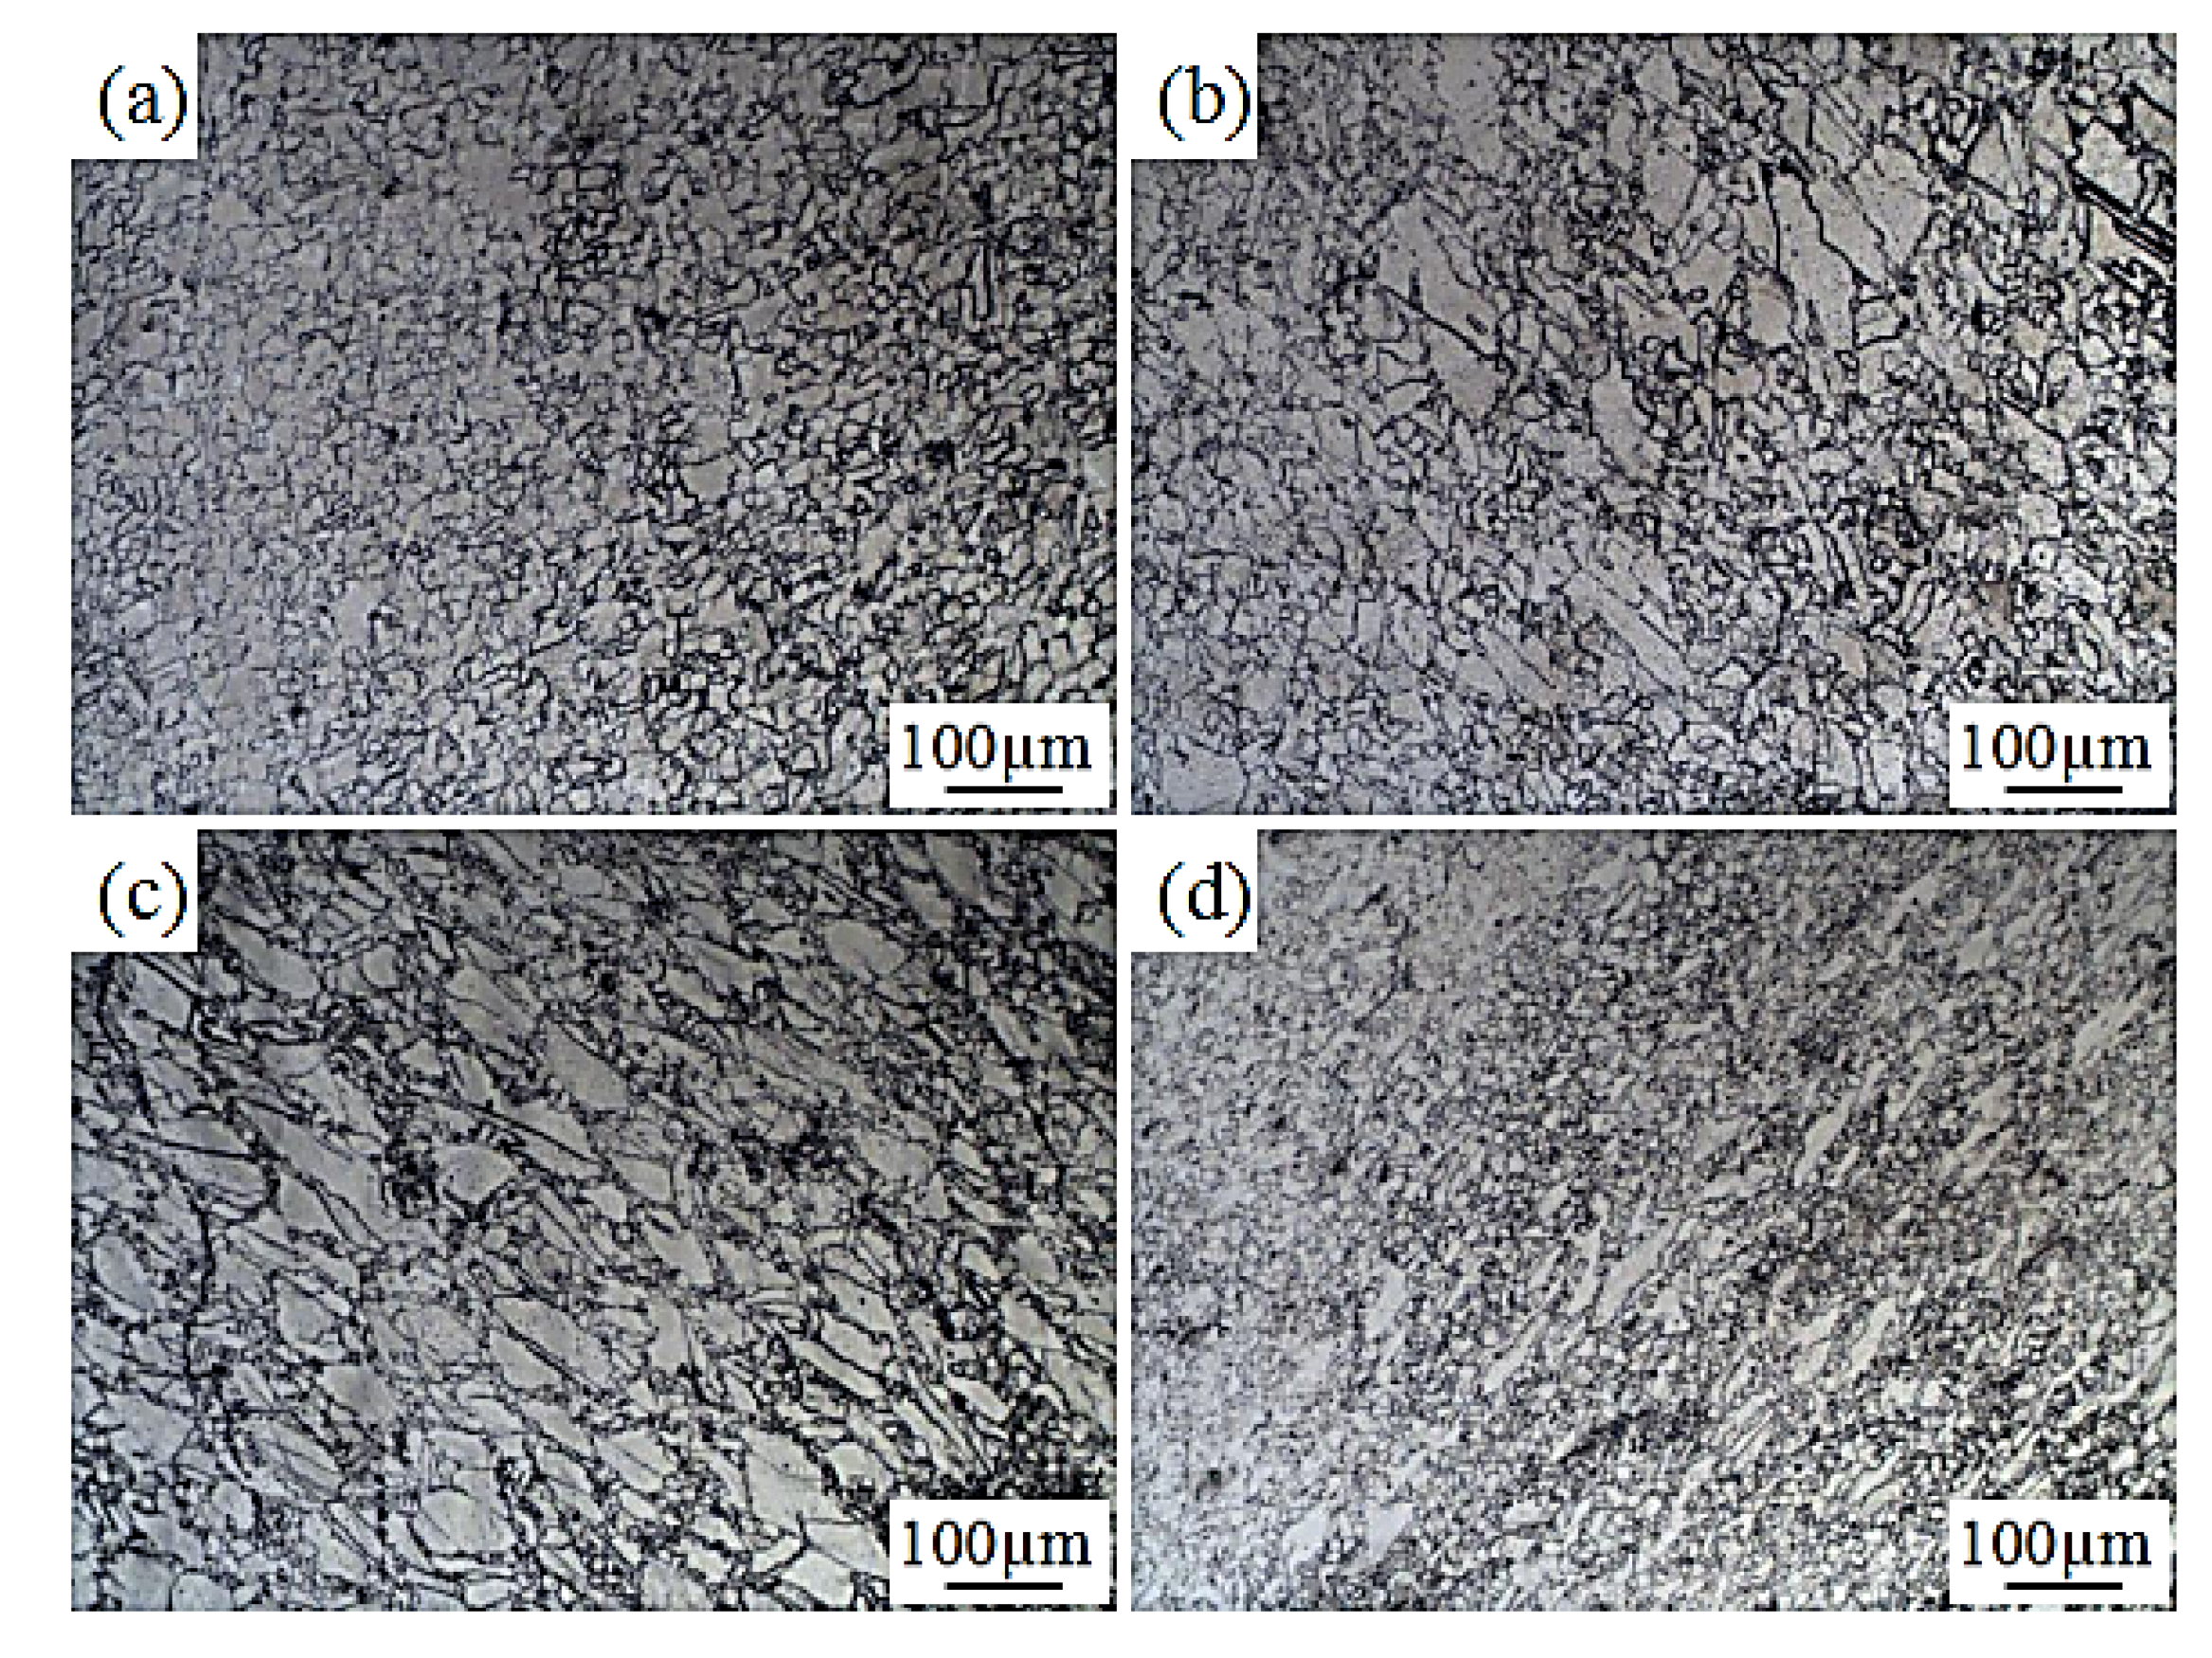
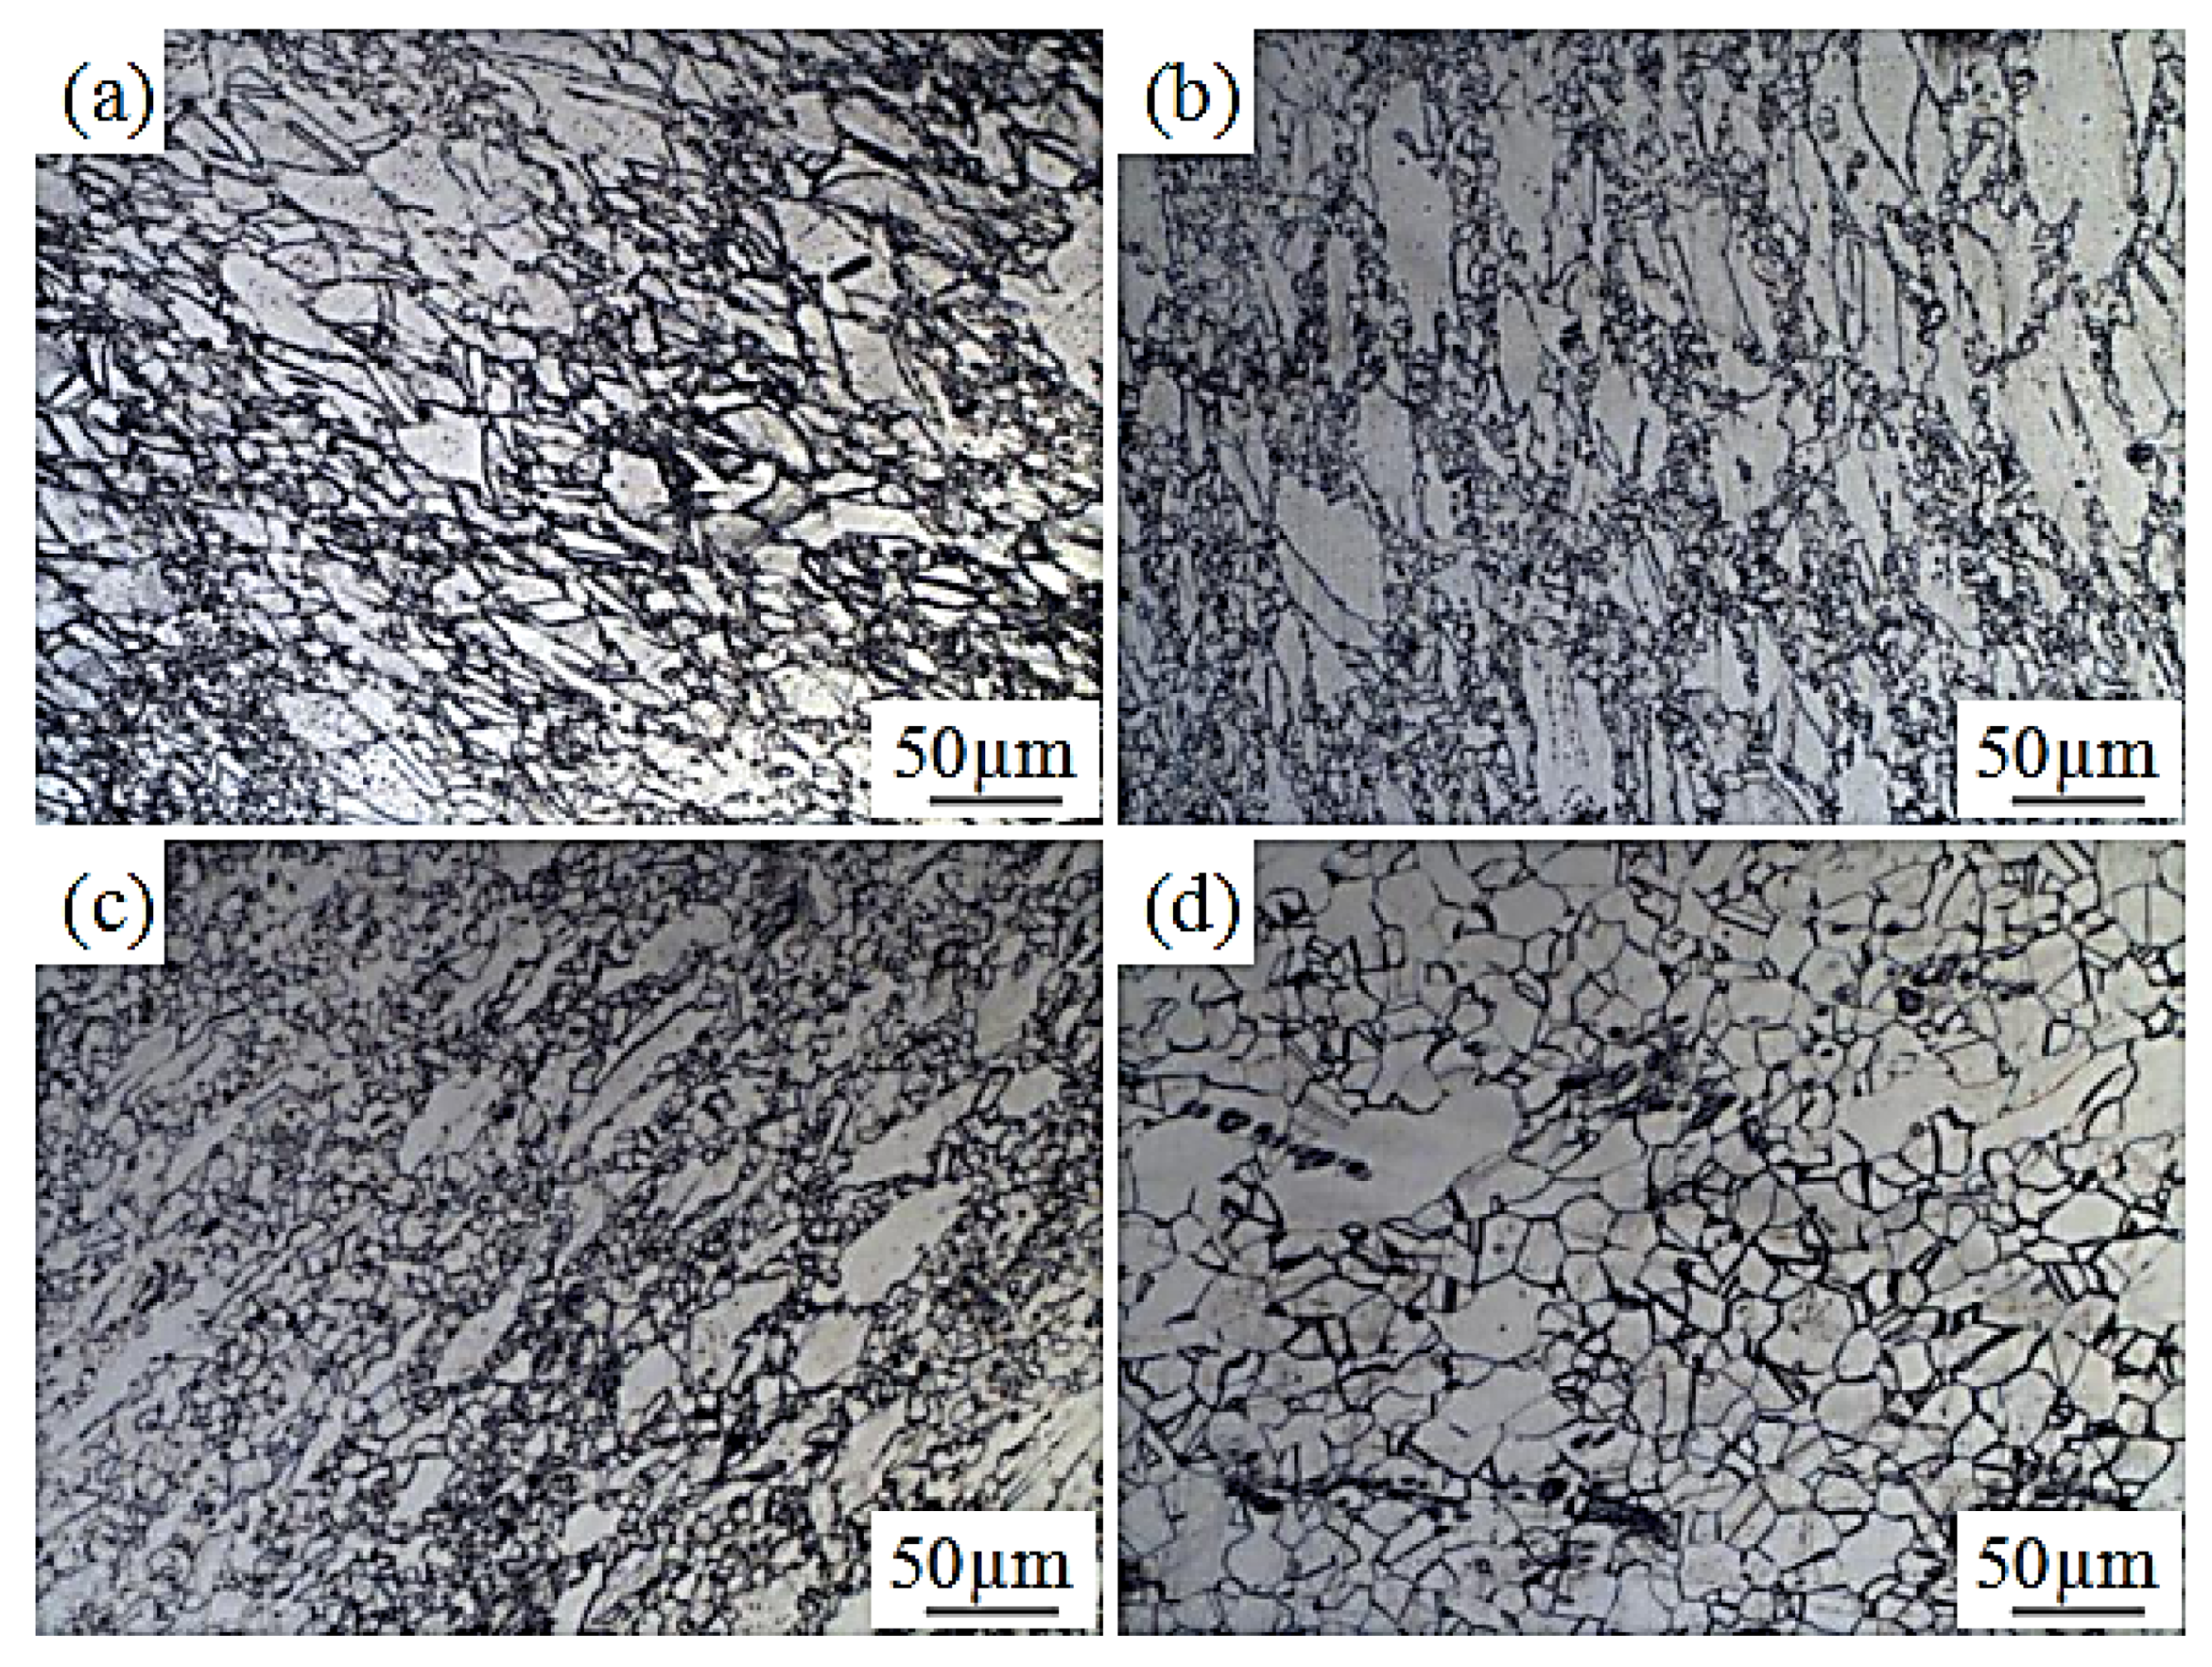
Figure 5.
Microstructure of GH901 superalloy deformed at 1090 °C. (a) Microstructure at 0.001 s−1, (b) Microstructure at 0.01 s−1, (c) Microstructure at 0.1 s−1, (d) Microstructure at 1 s−1.
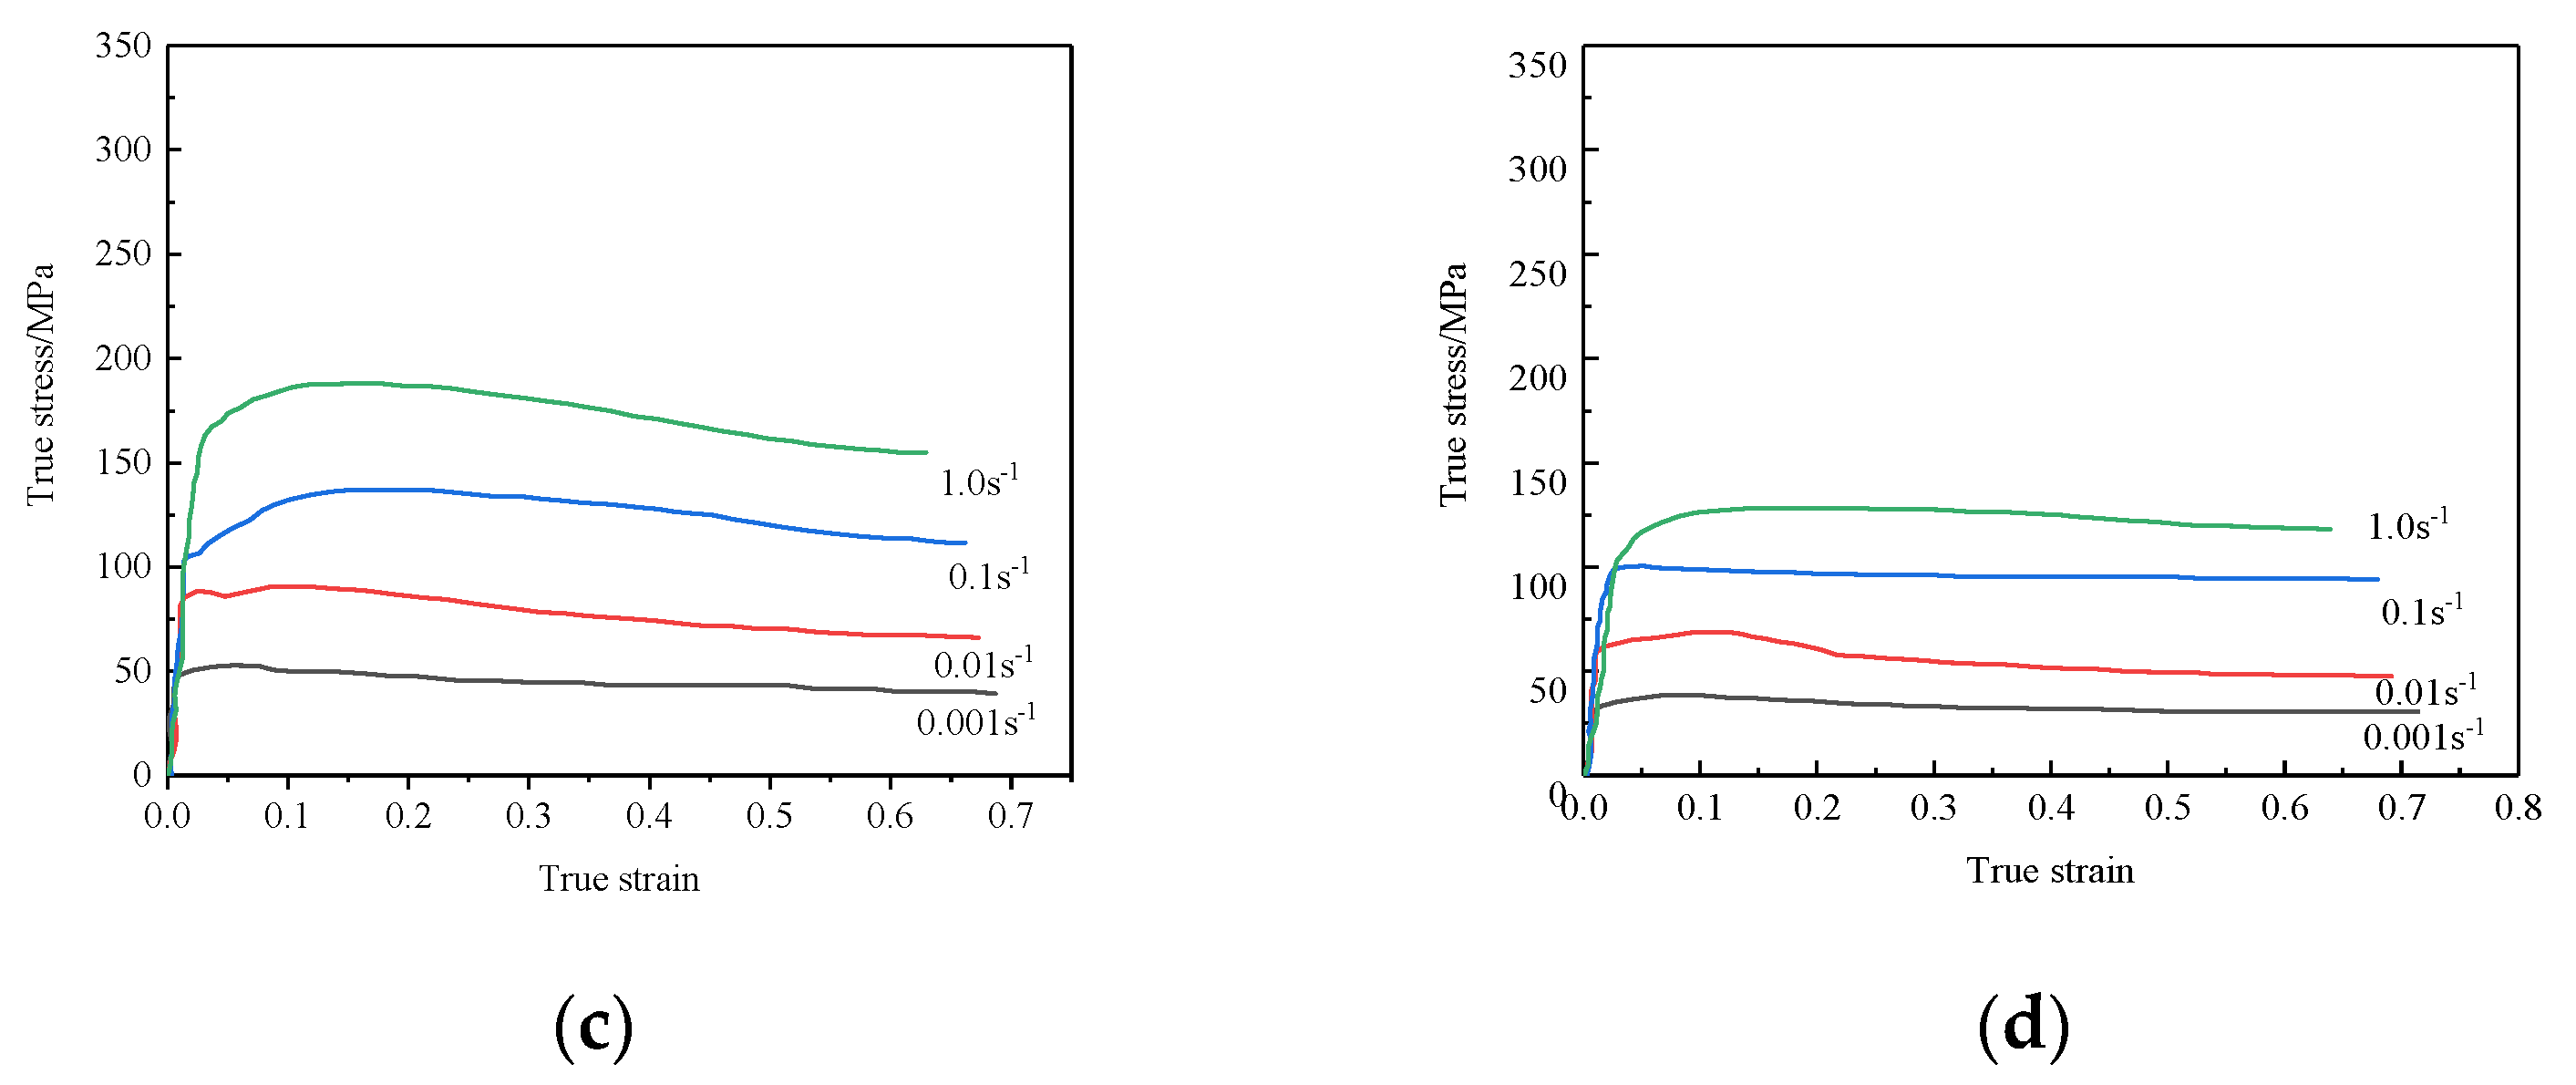
Figure 6.
True stress-strain curves of GH901. (a) , (b) , (c) , (d) .
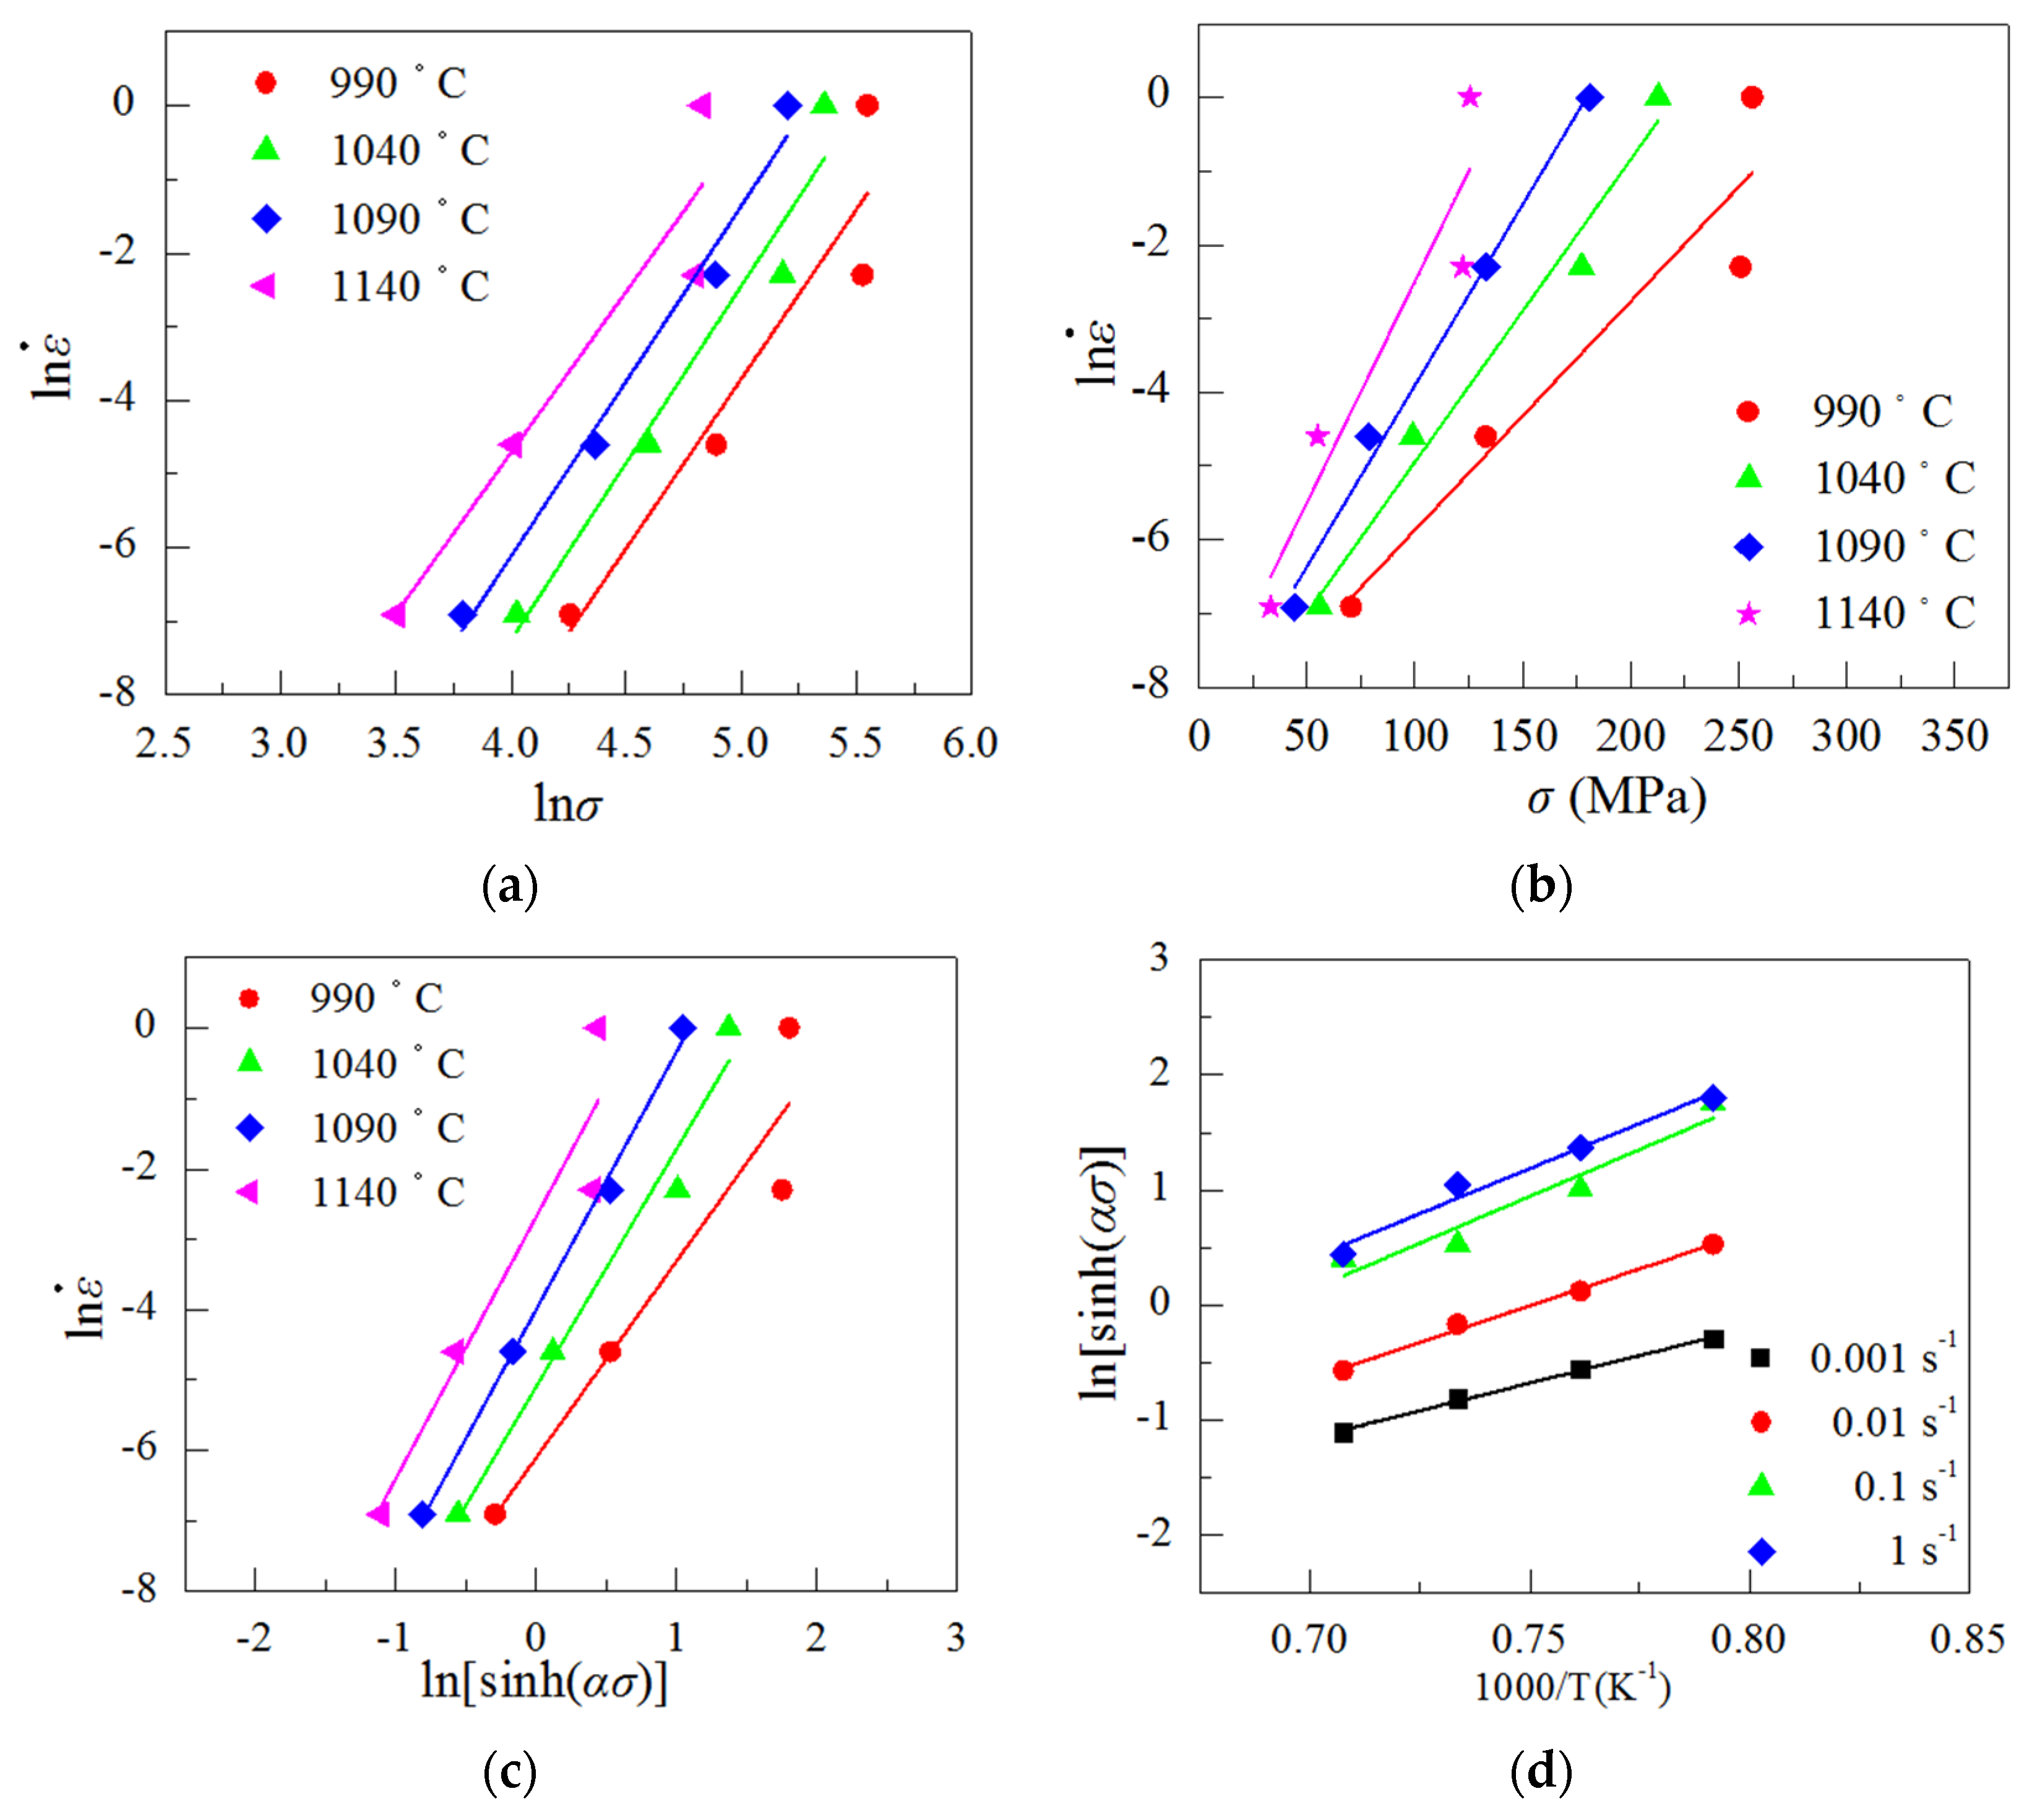
Figure 7.
Microstructure of GH901 superalloy deformed at 1 s−1. (a) Microstructure at 990 °C, (b) Microstructure at 1040 °C, (c) Microstructure at 1090 °C, (d) Microstructure at 1140 °C.
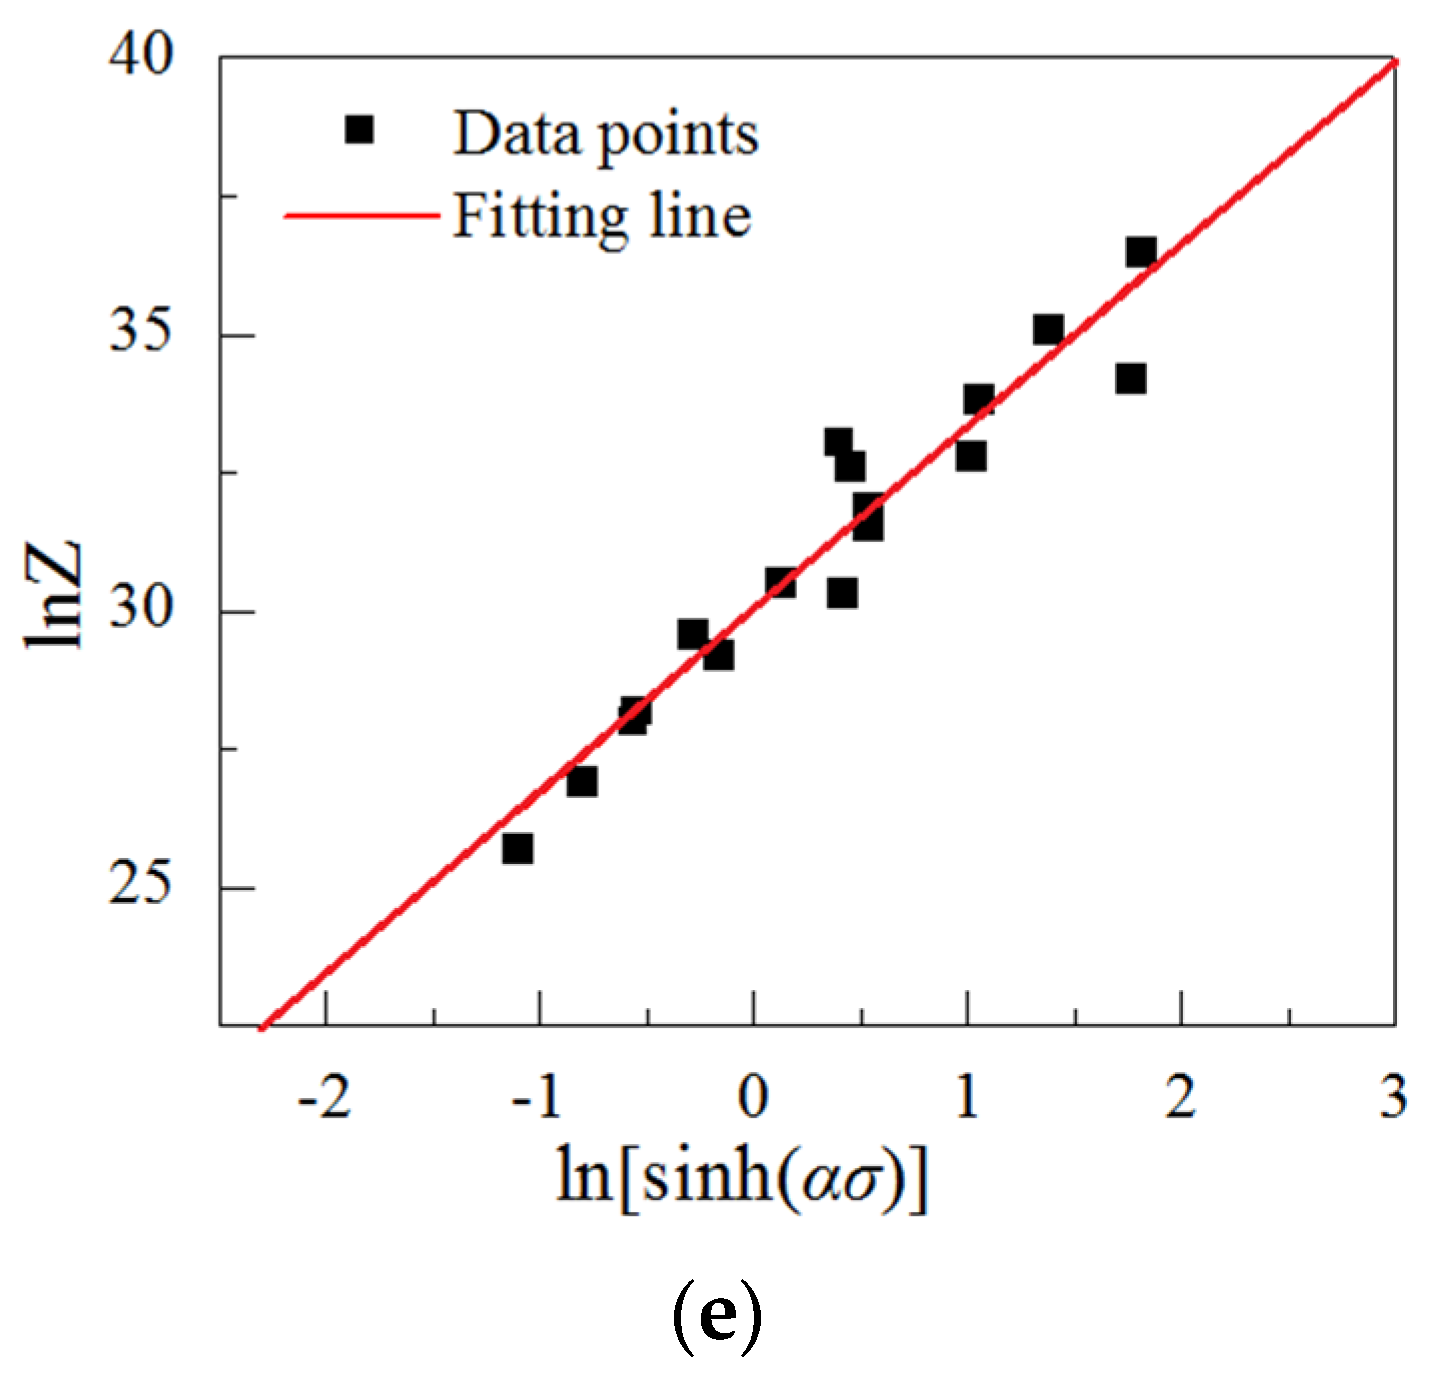
Figure 8.
Linear regression curves. (a) − , (b) − , (c) − , (d) − , (e) − .
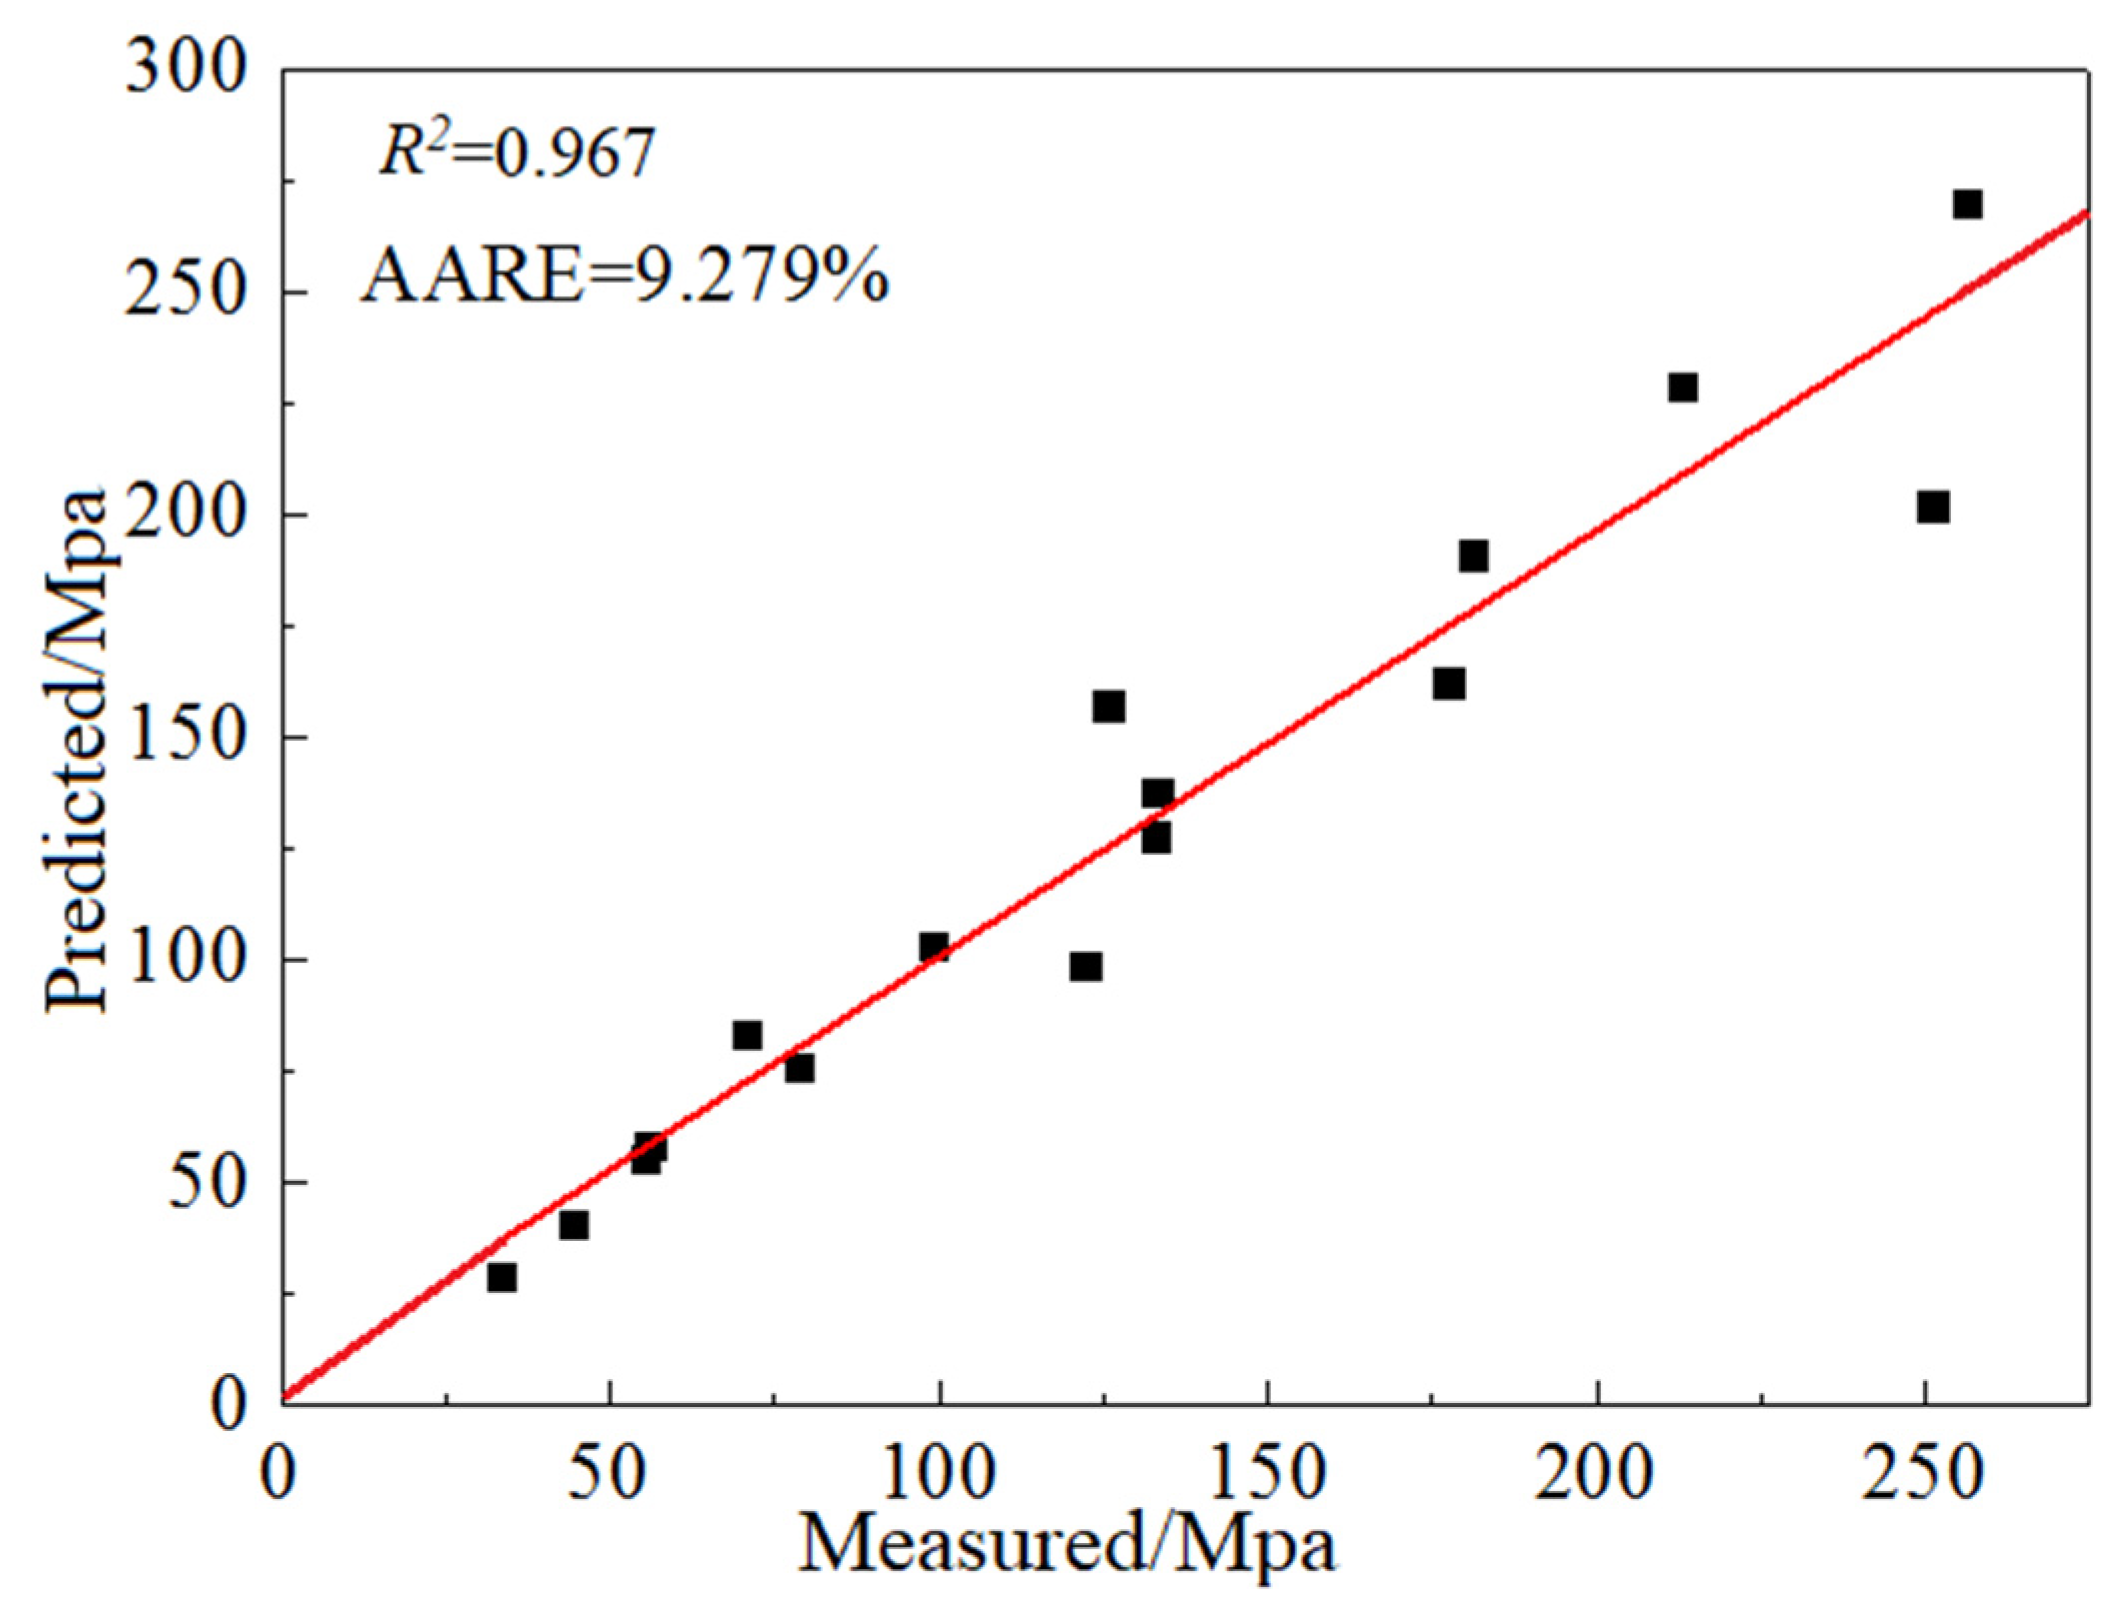
Figure 9.
Measured versus the predicted .
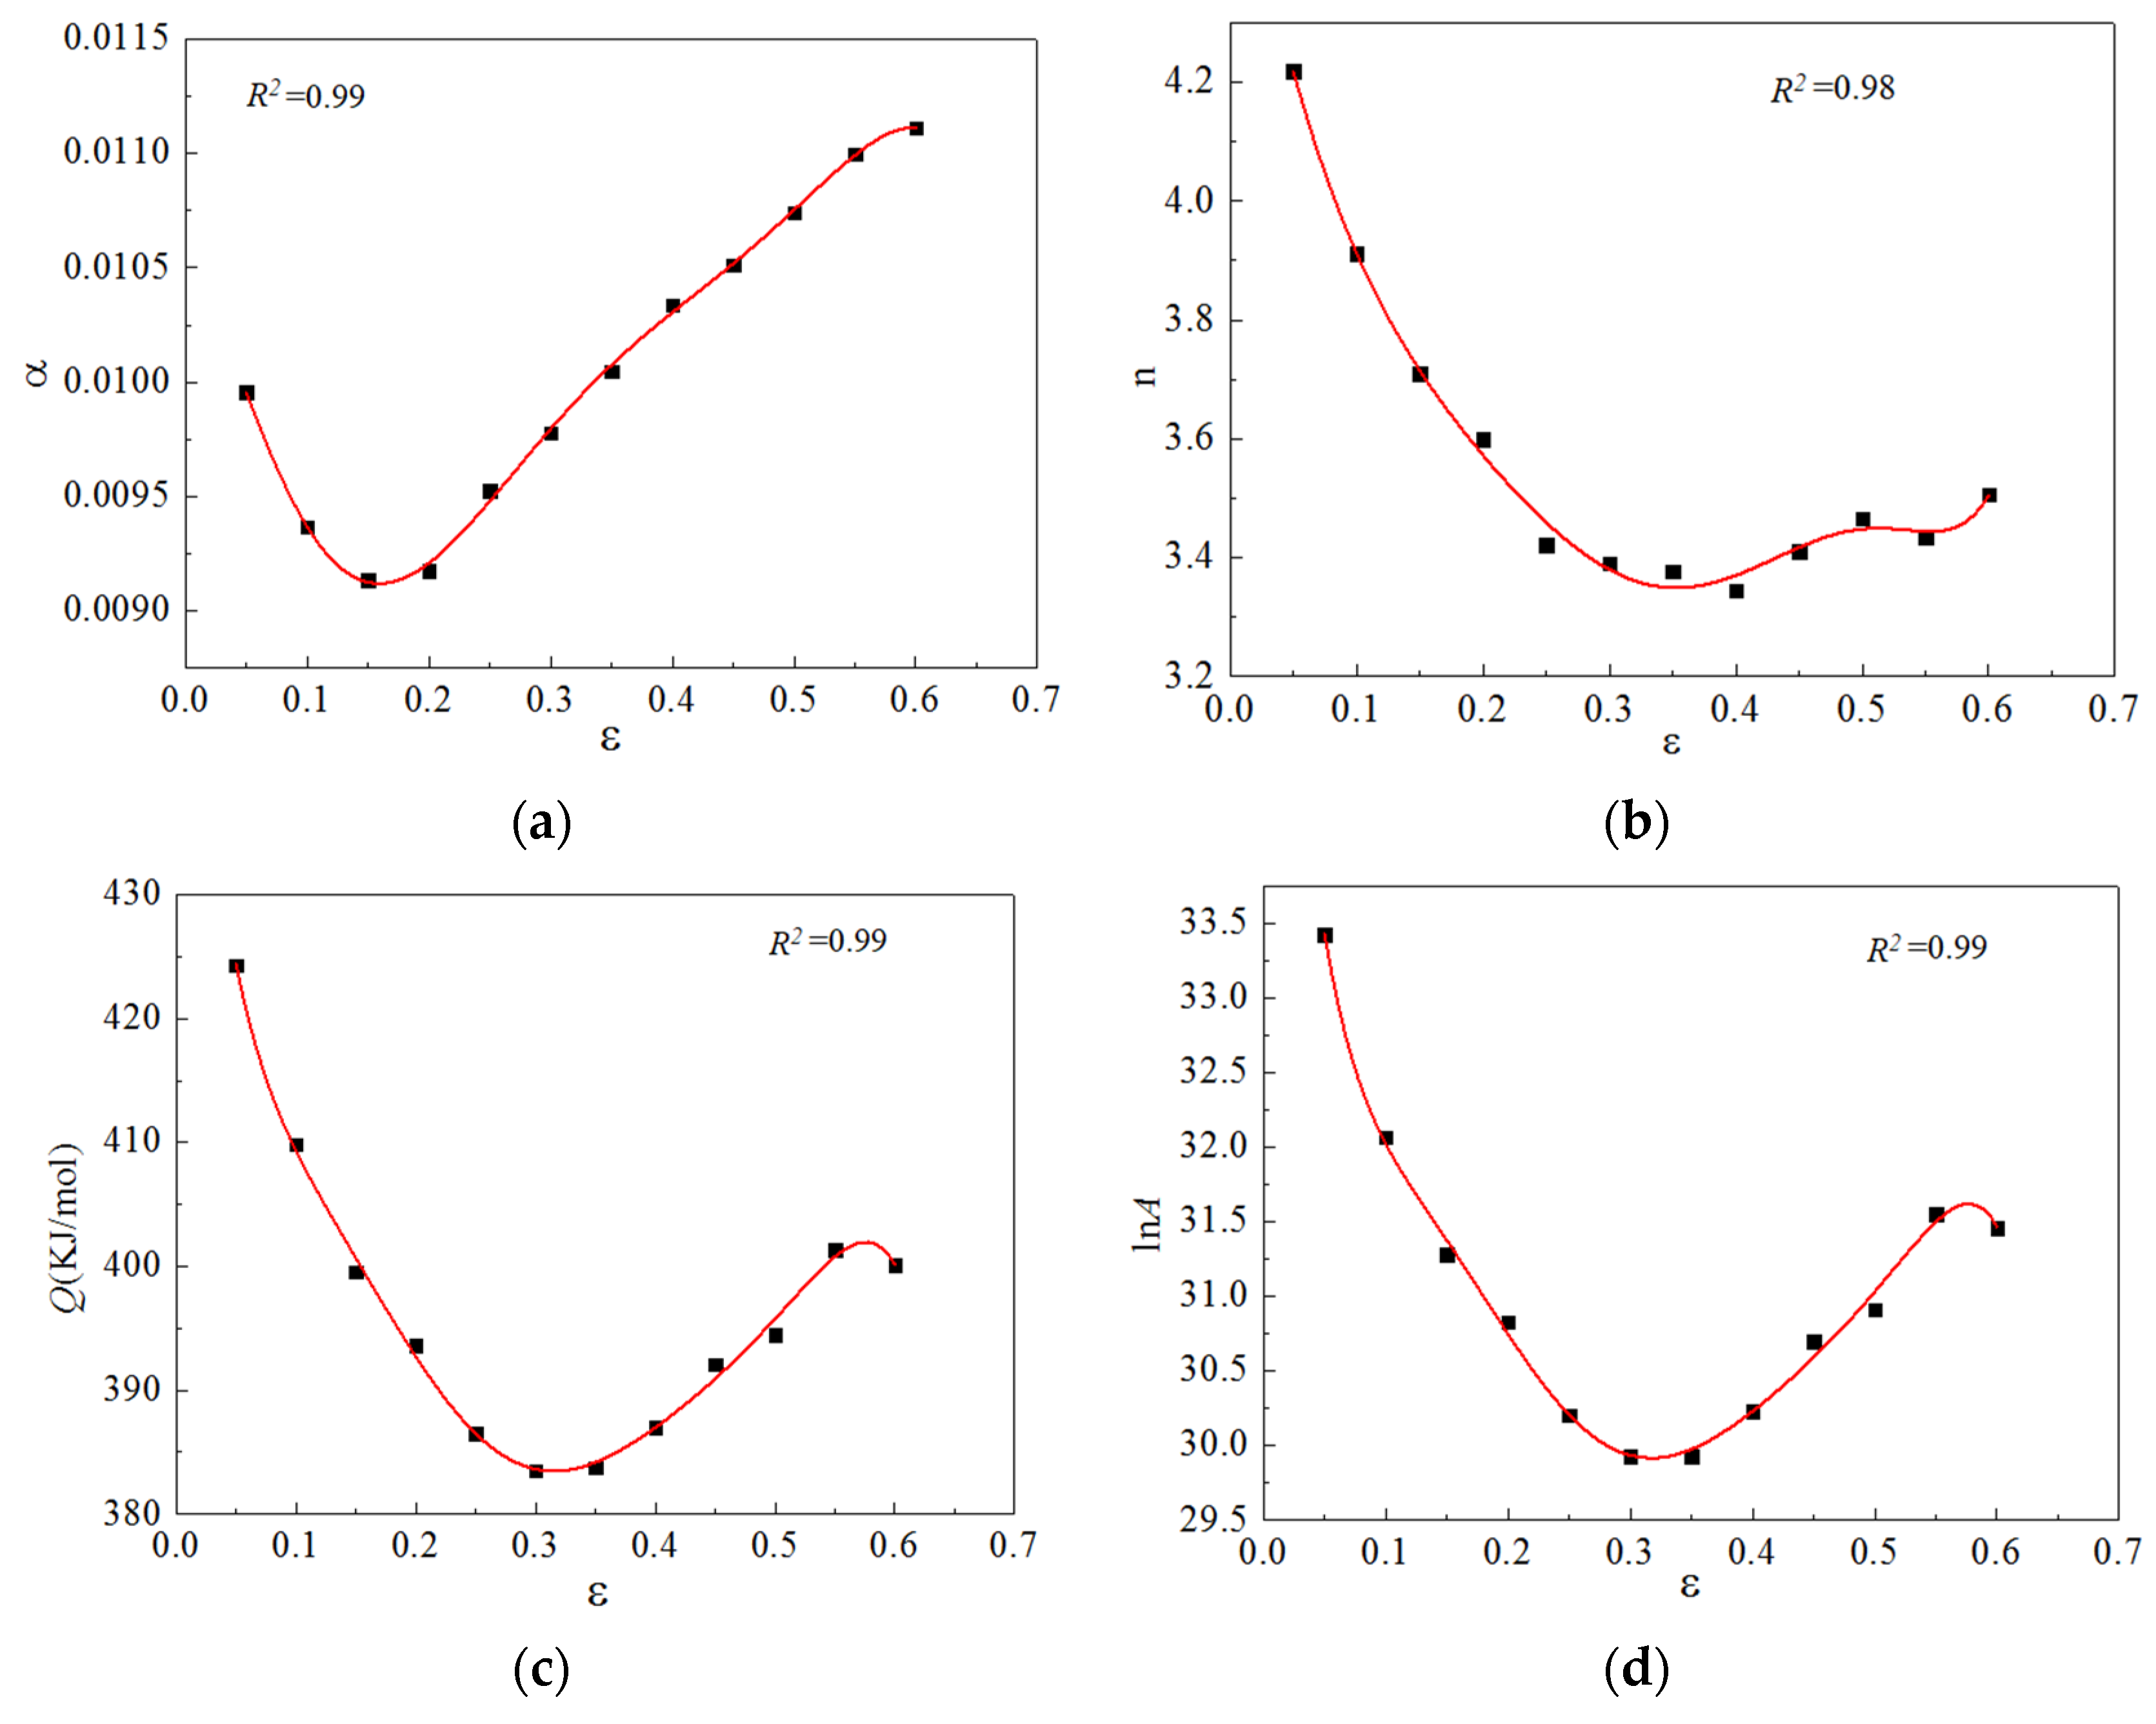
Figure 10.
Polynomial relationship between material parameters and strain. (a) , (b) , (c) , (d) .
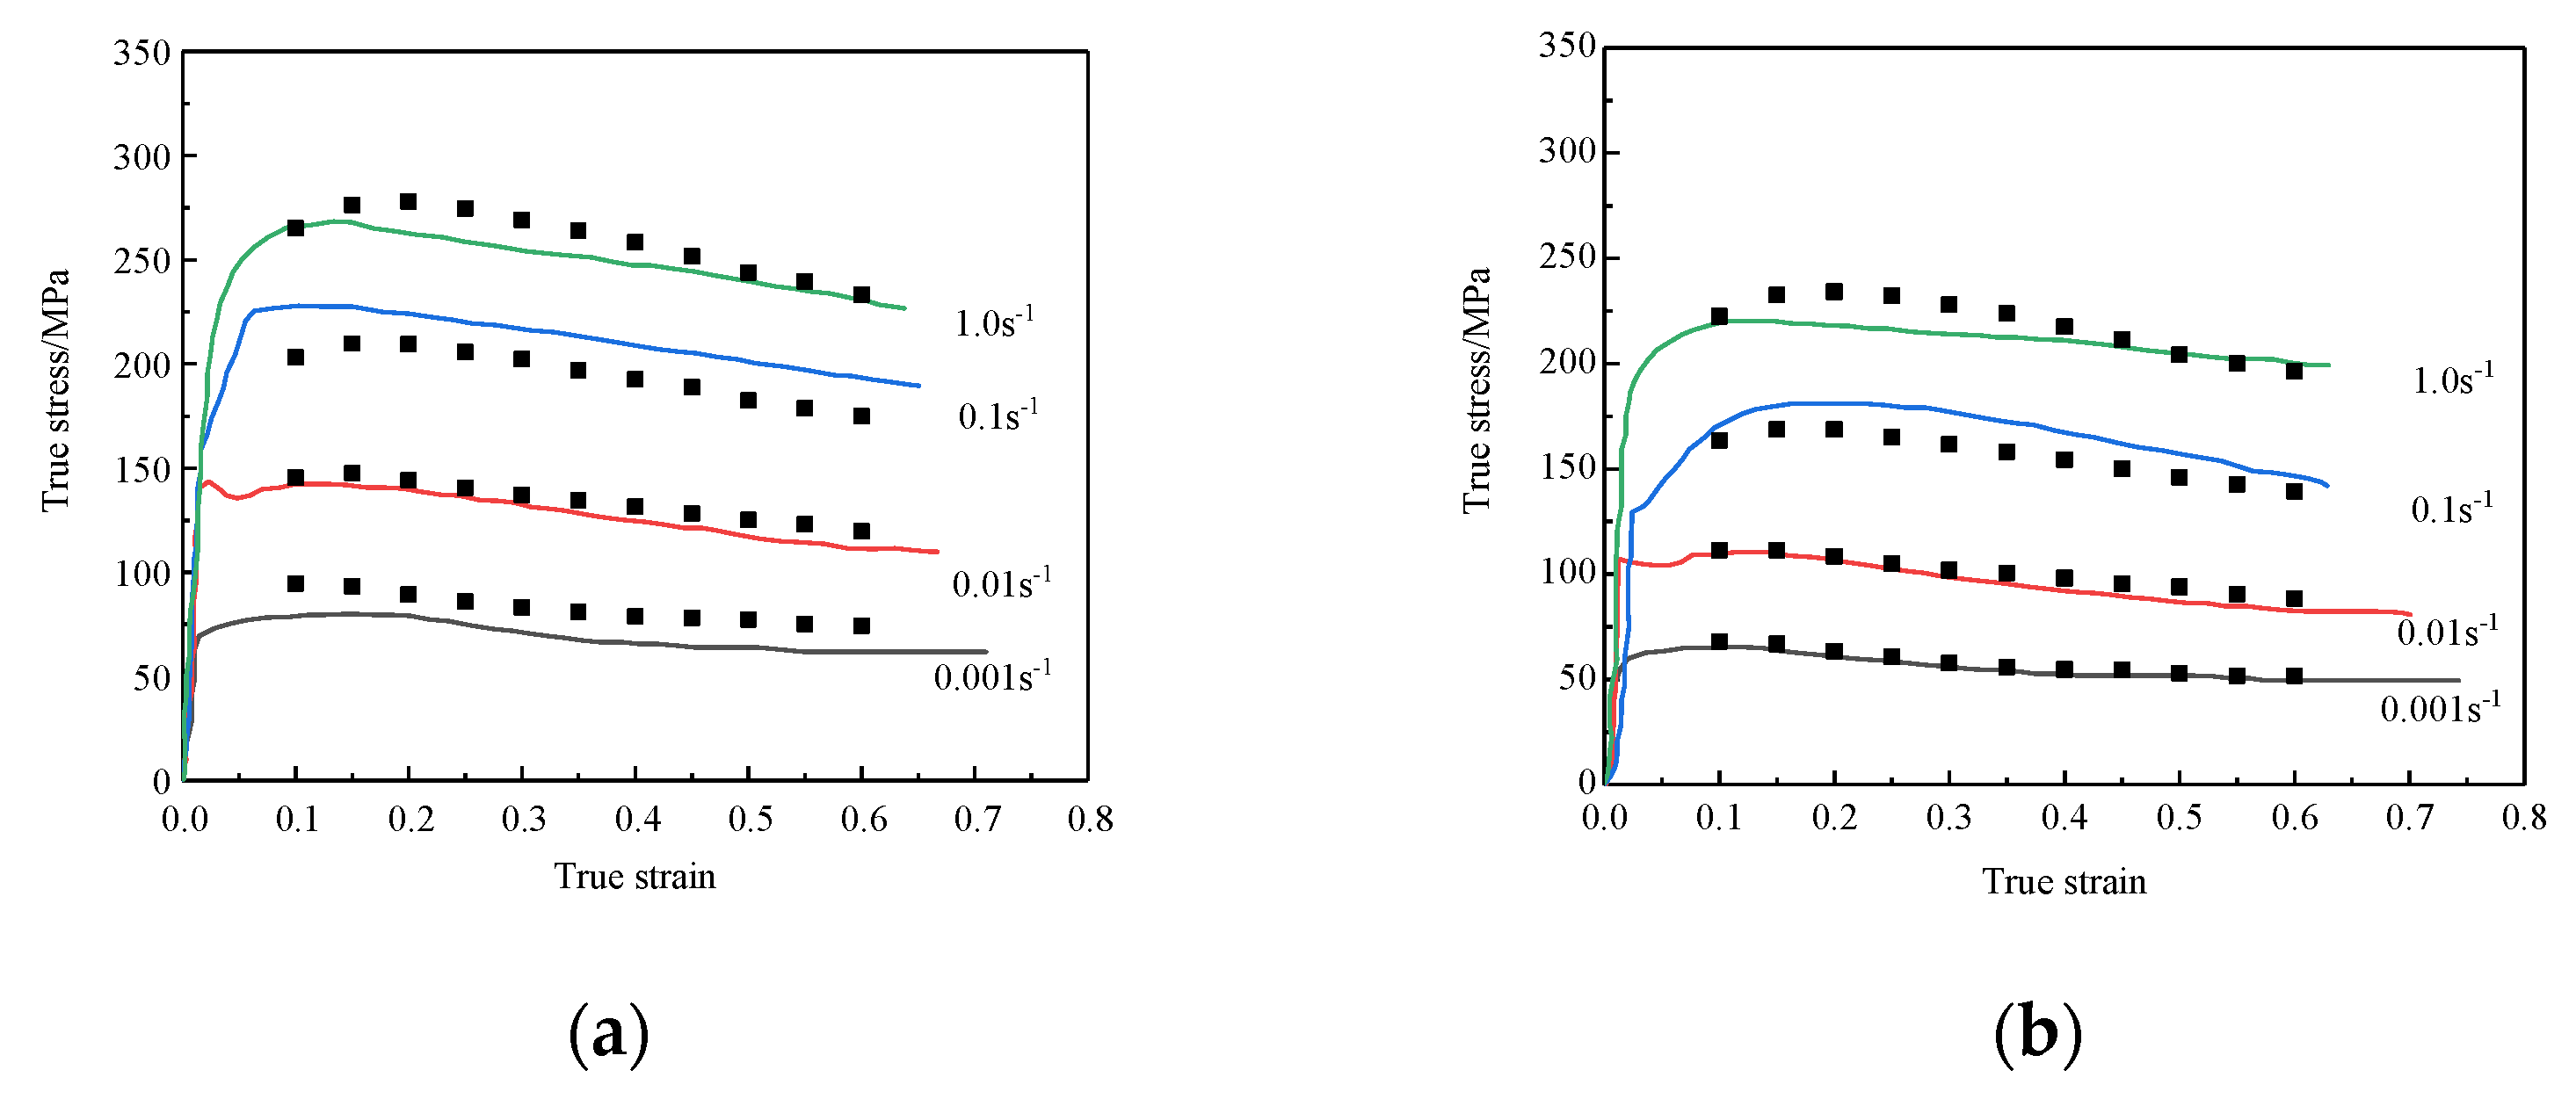
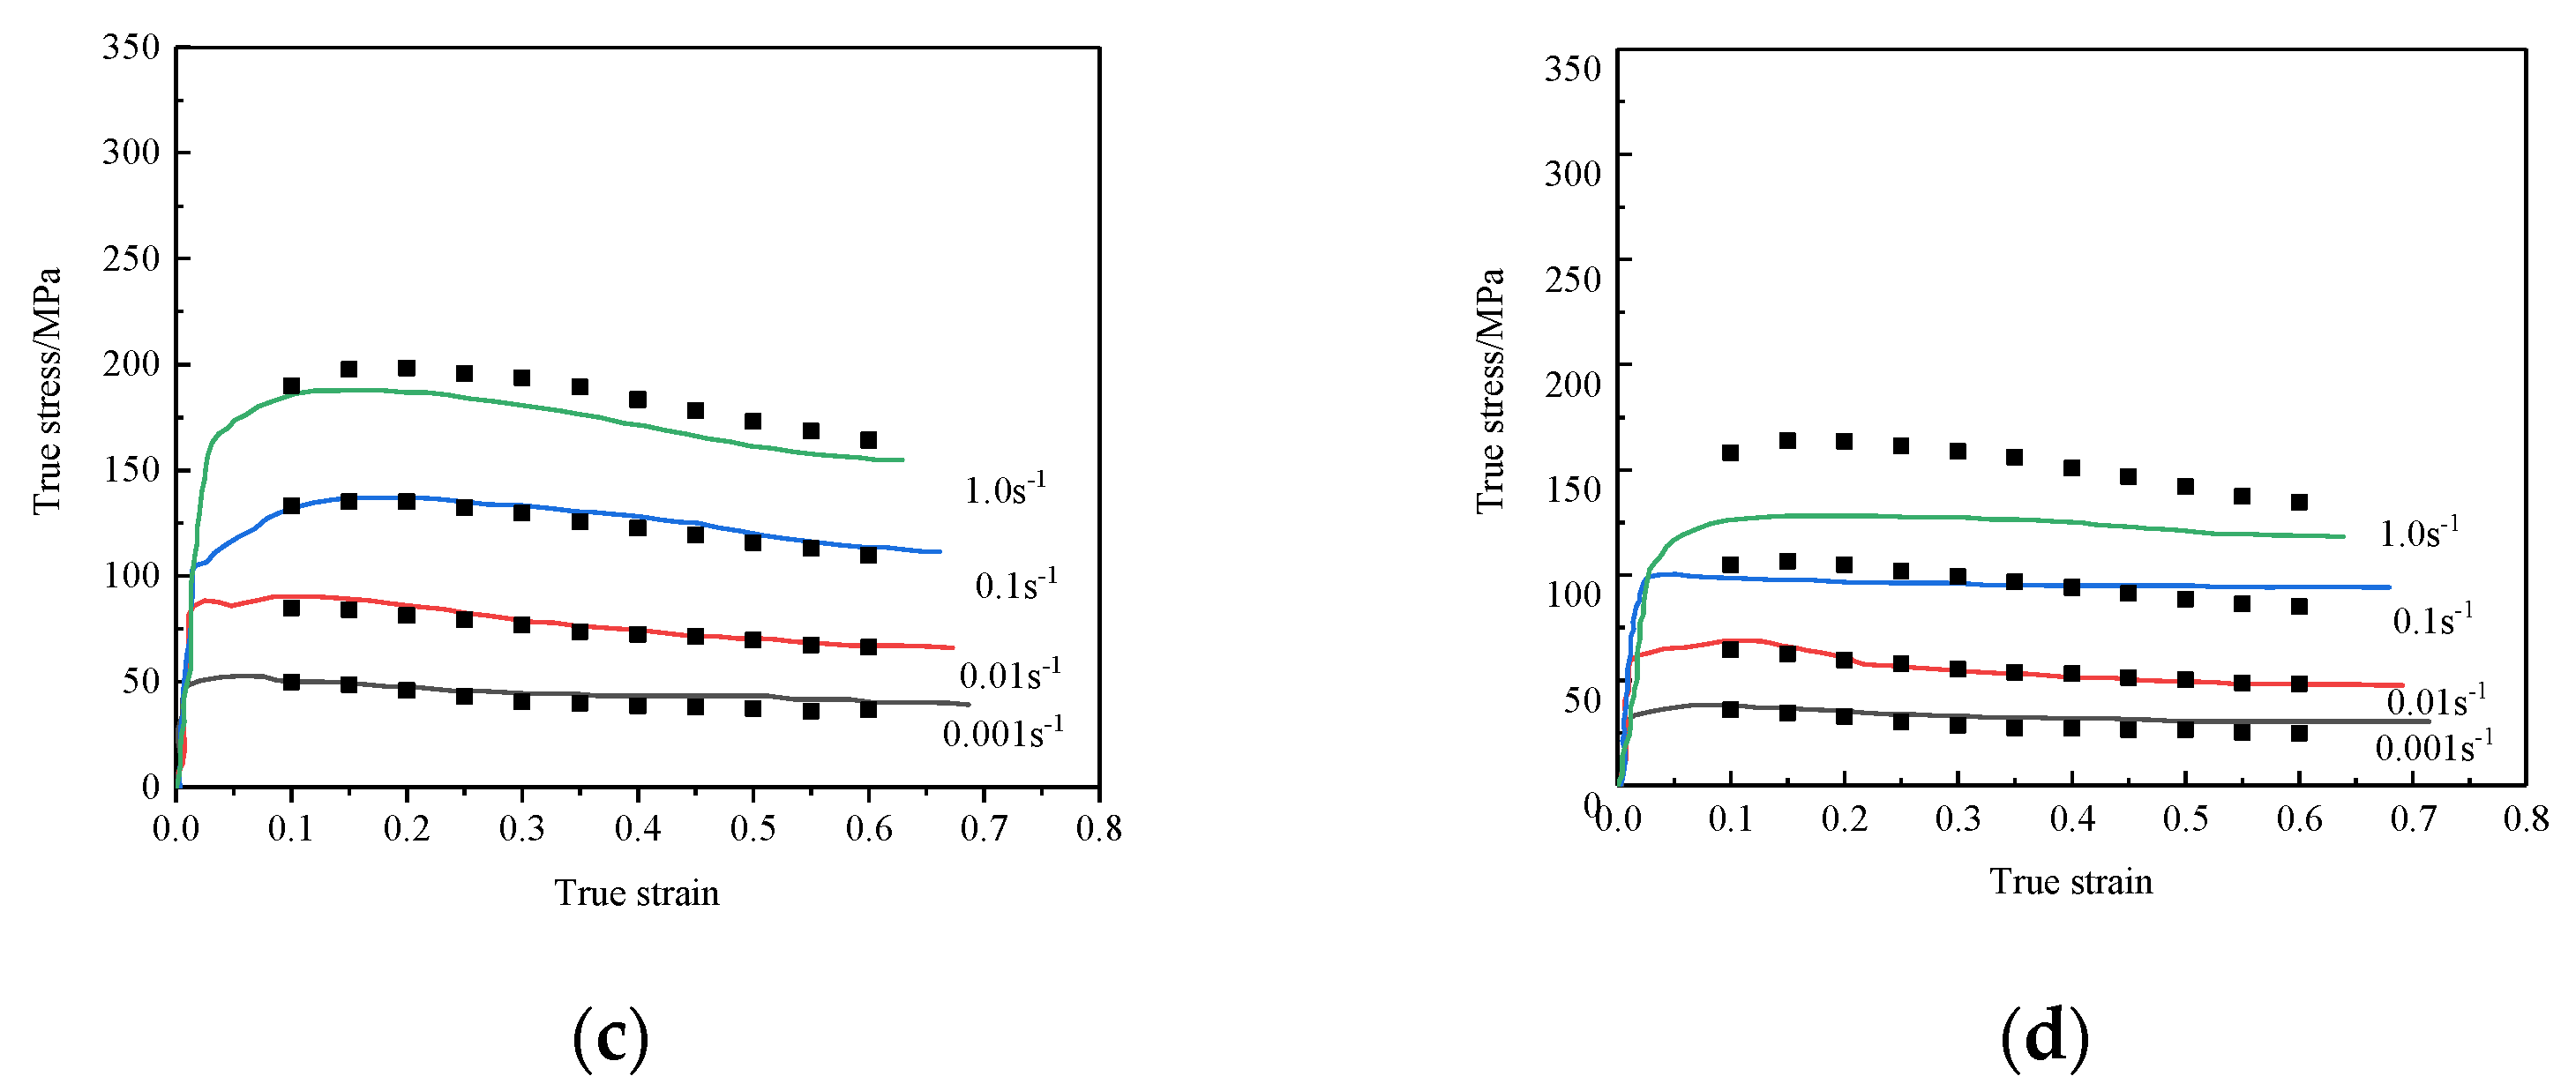
Figure 11.
Experimental and calculated data. (a) T = 990 °C, (b) T = 1040 °C, (c) T = 1090 °C, (d) T = 1140 °C.
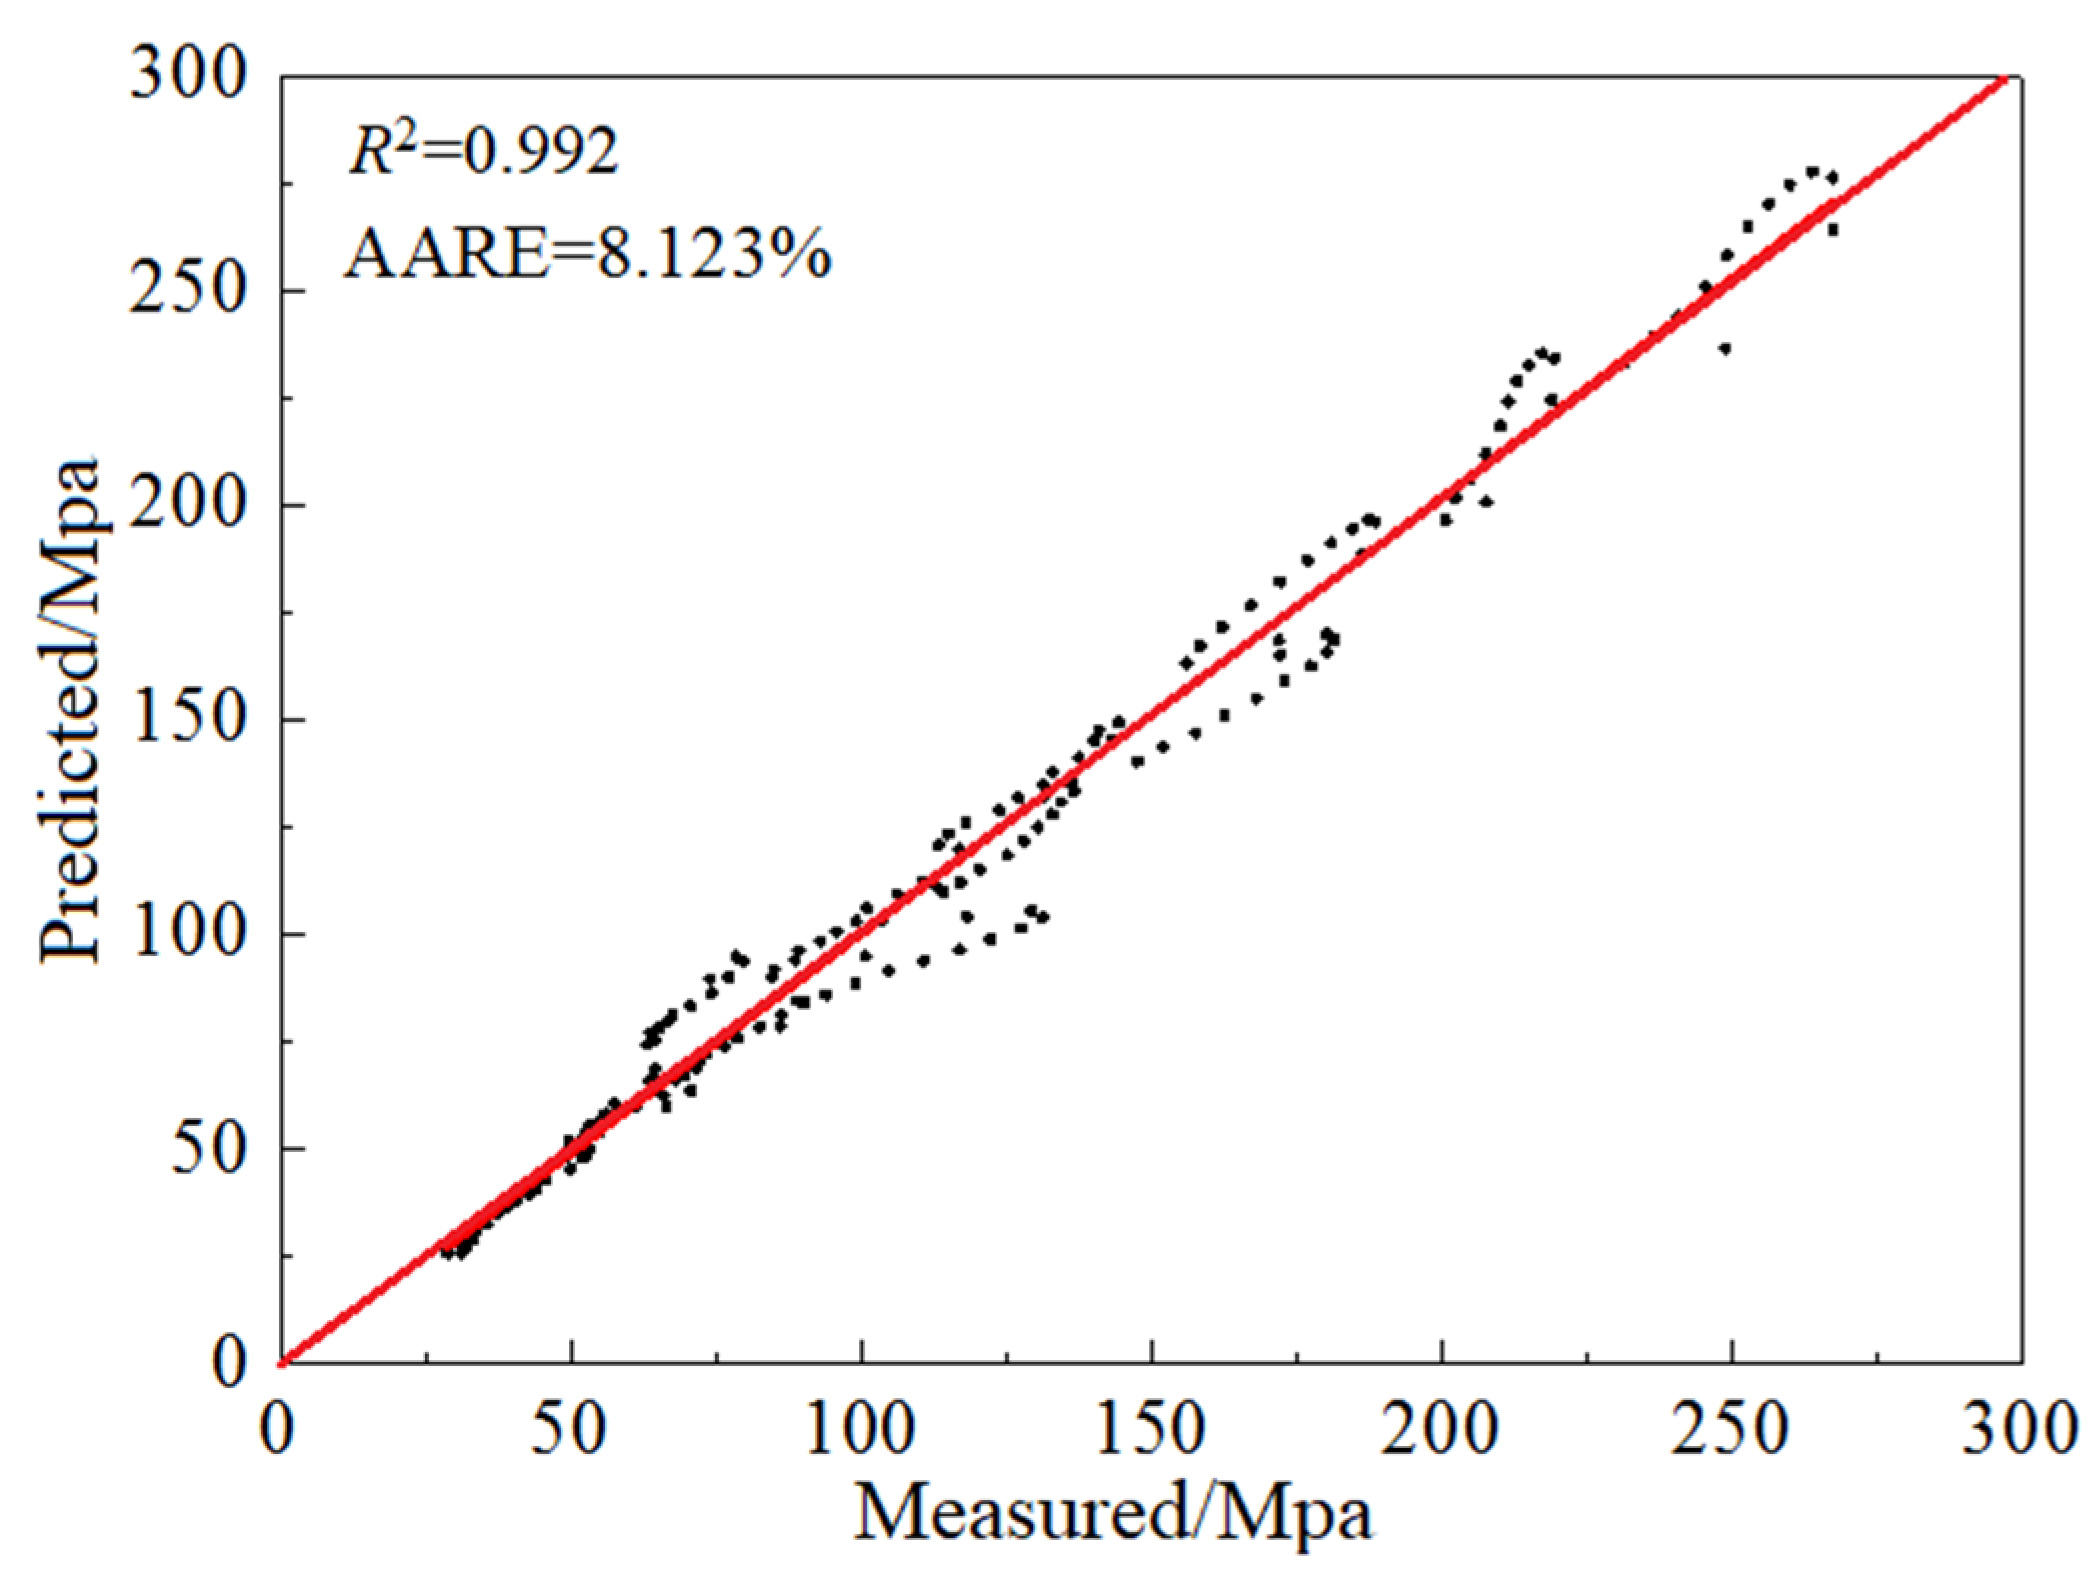
Figure 12.
Measured versus the predicted stress.
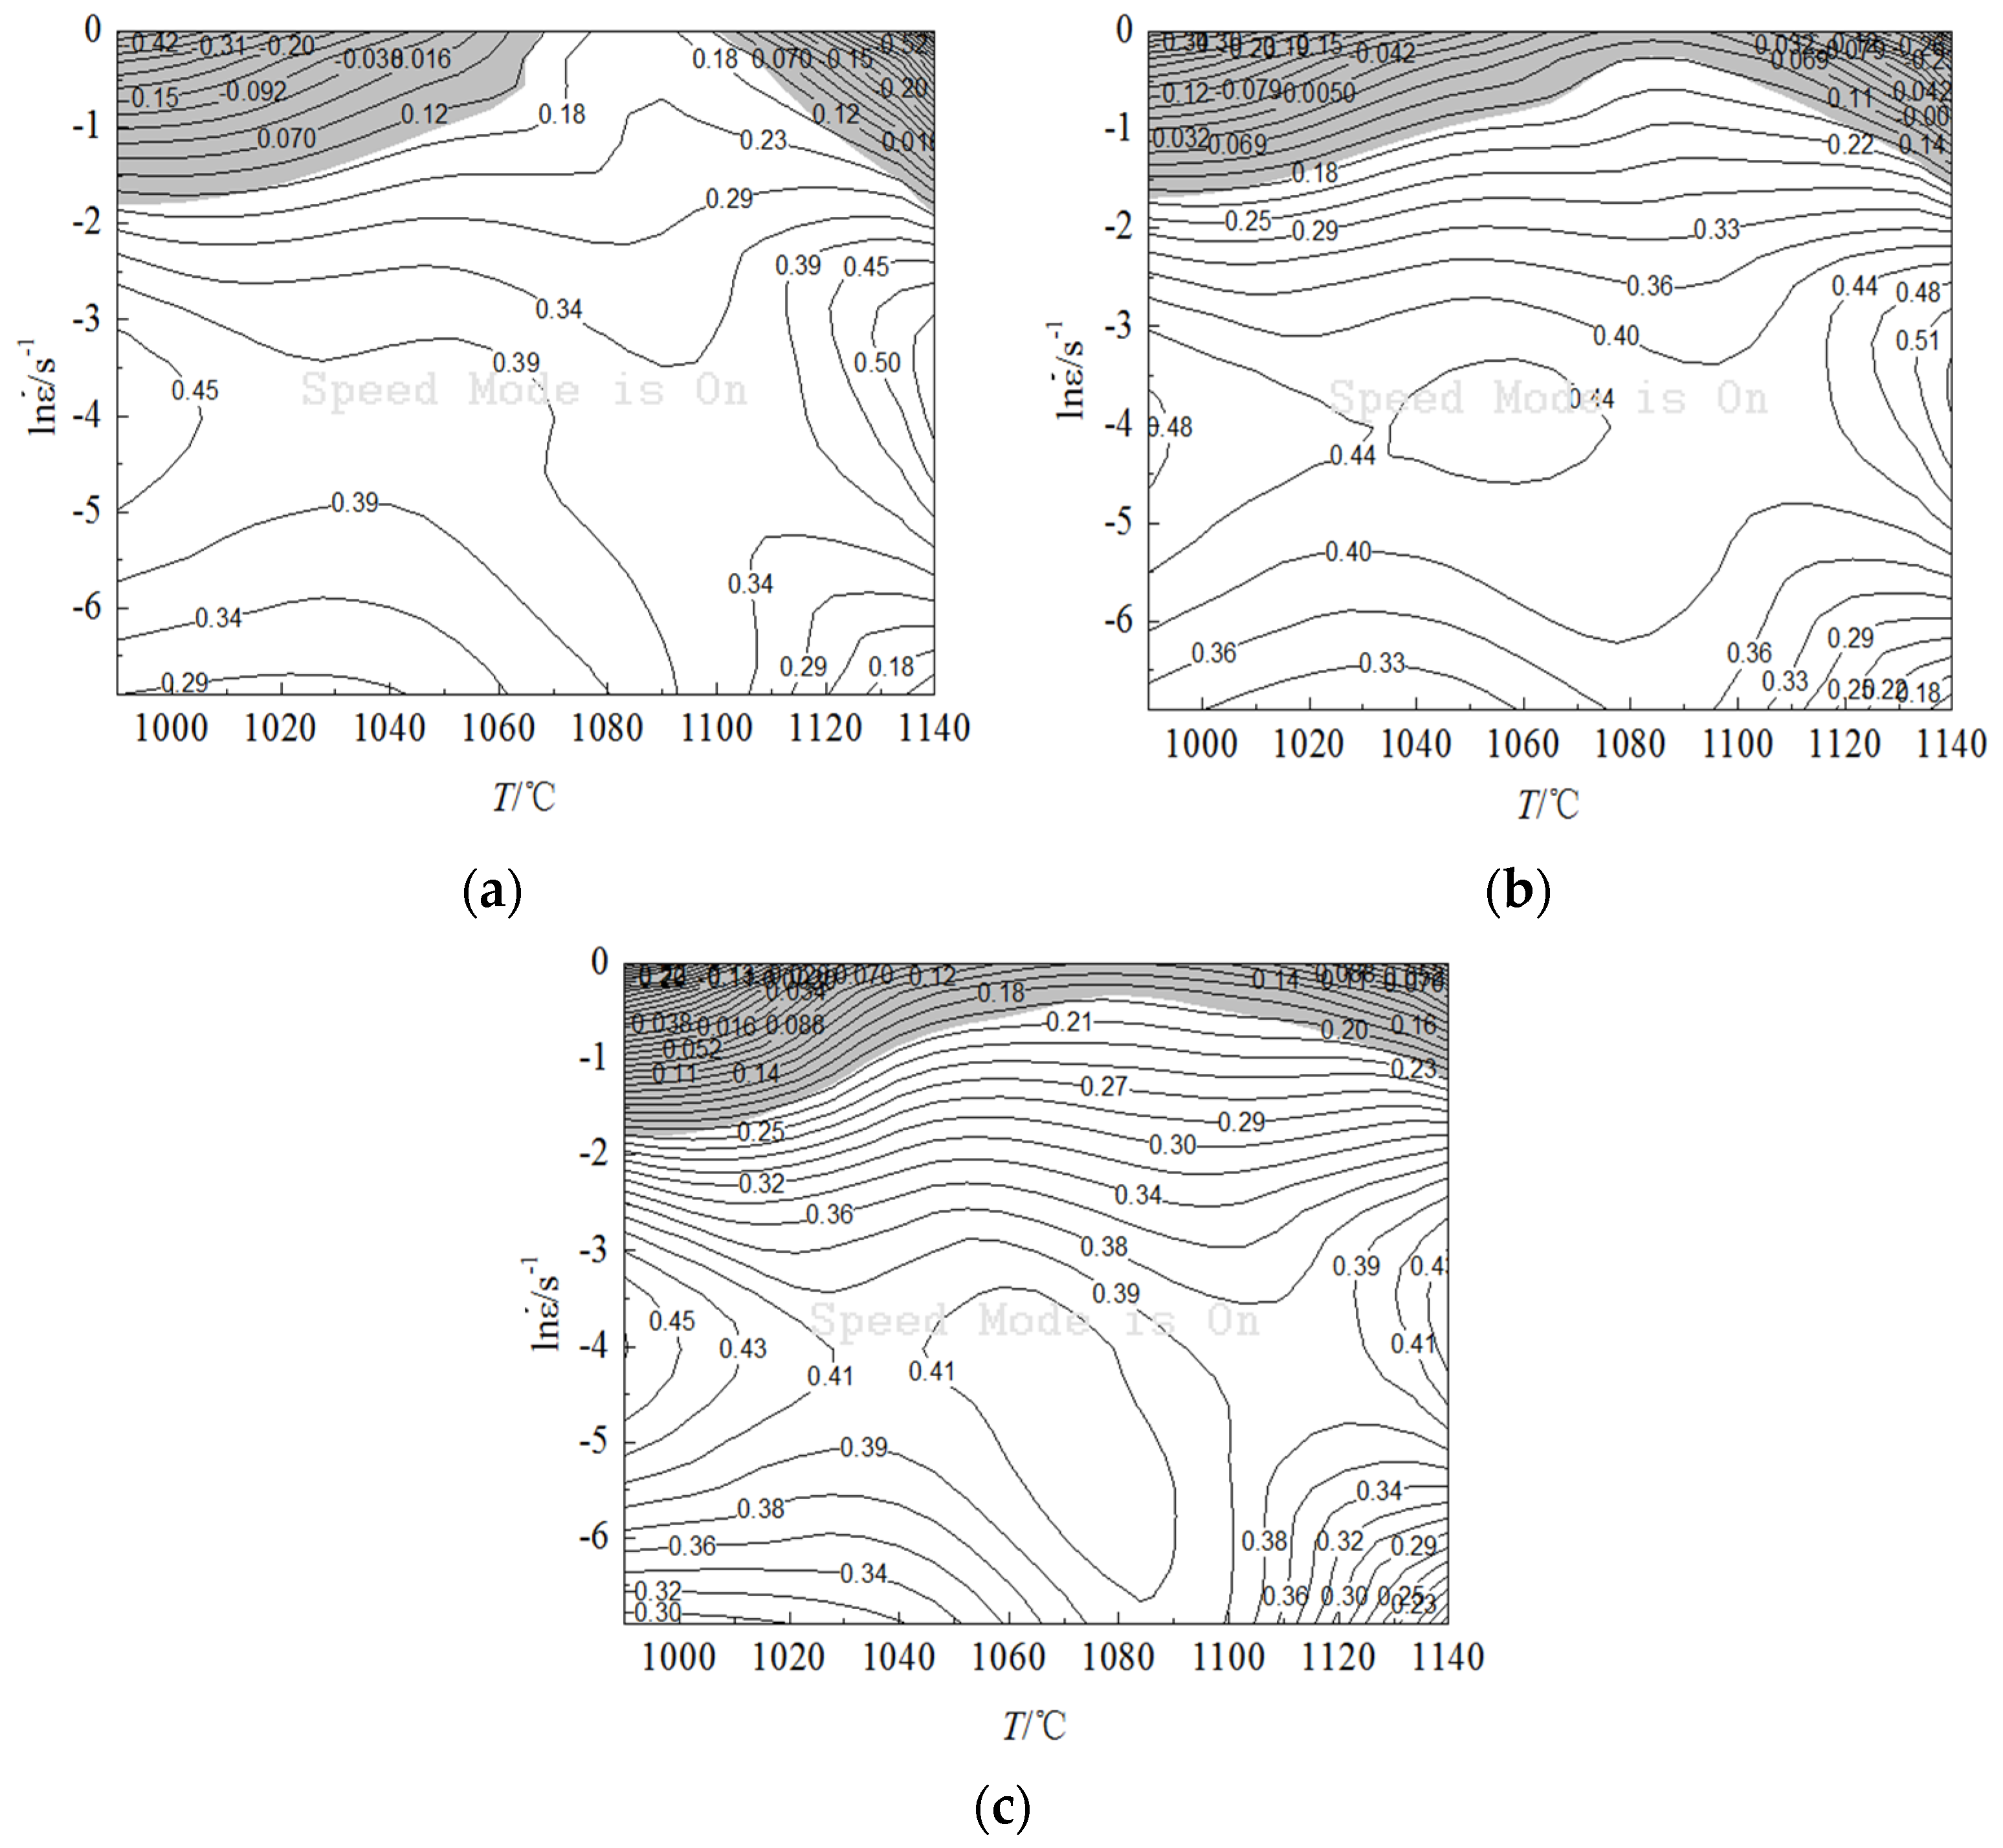
Figure 13.
Processing map of GH901 alloy under different strain variables. (a) , (b) , (c) .
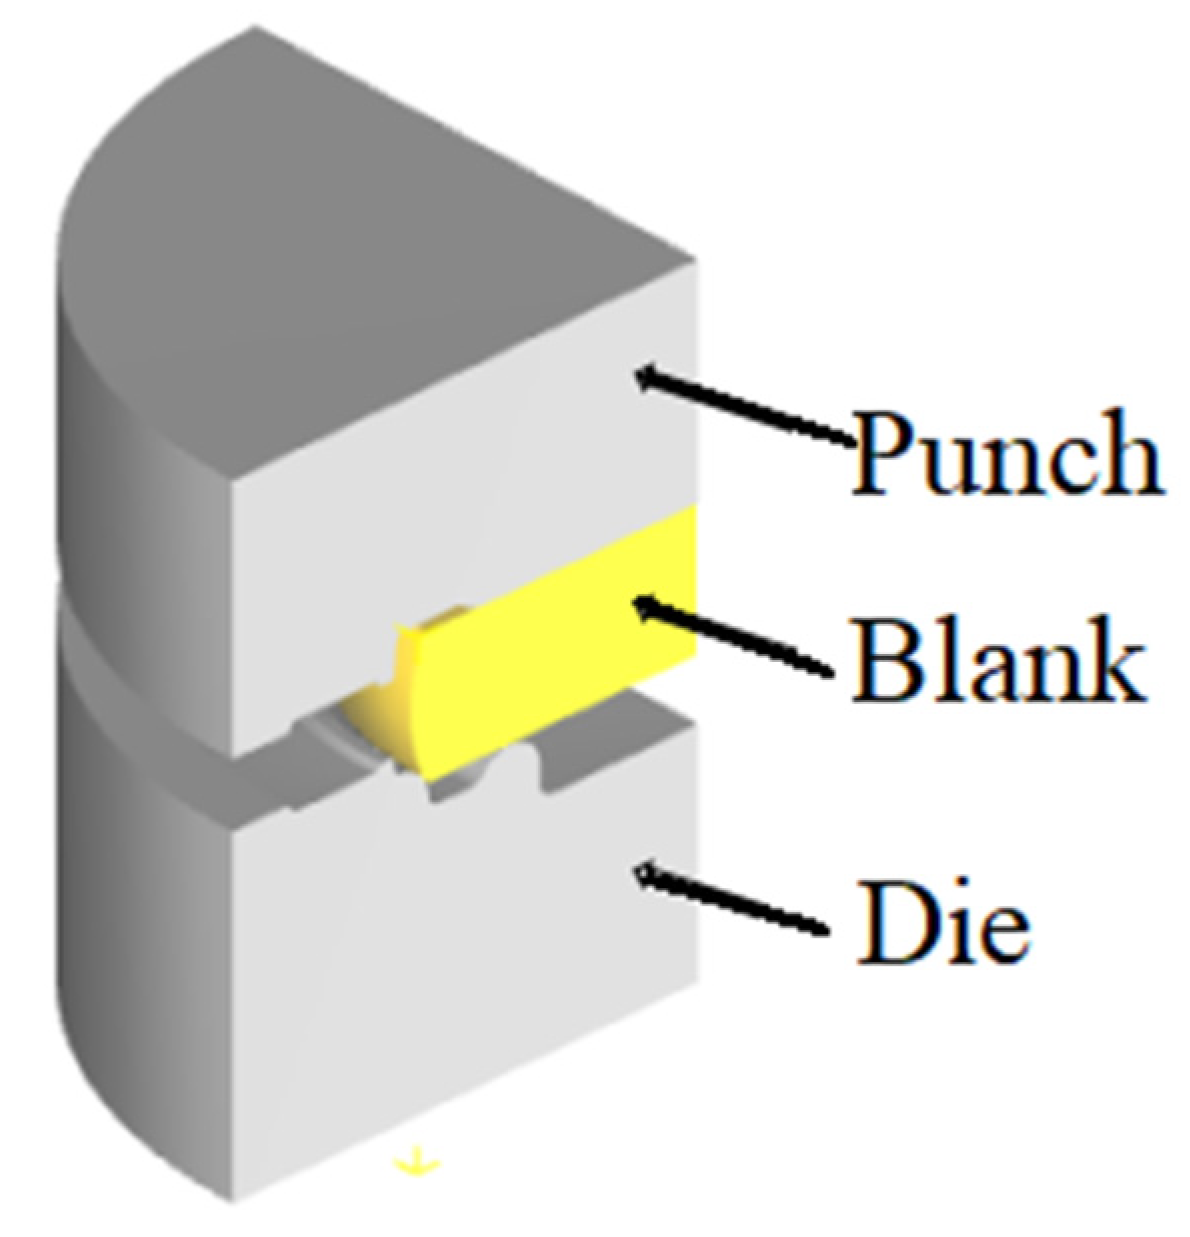
Figure 14.
Plate forging.
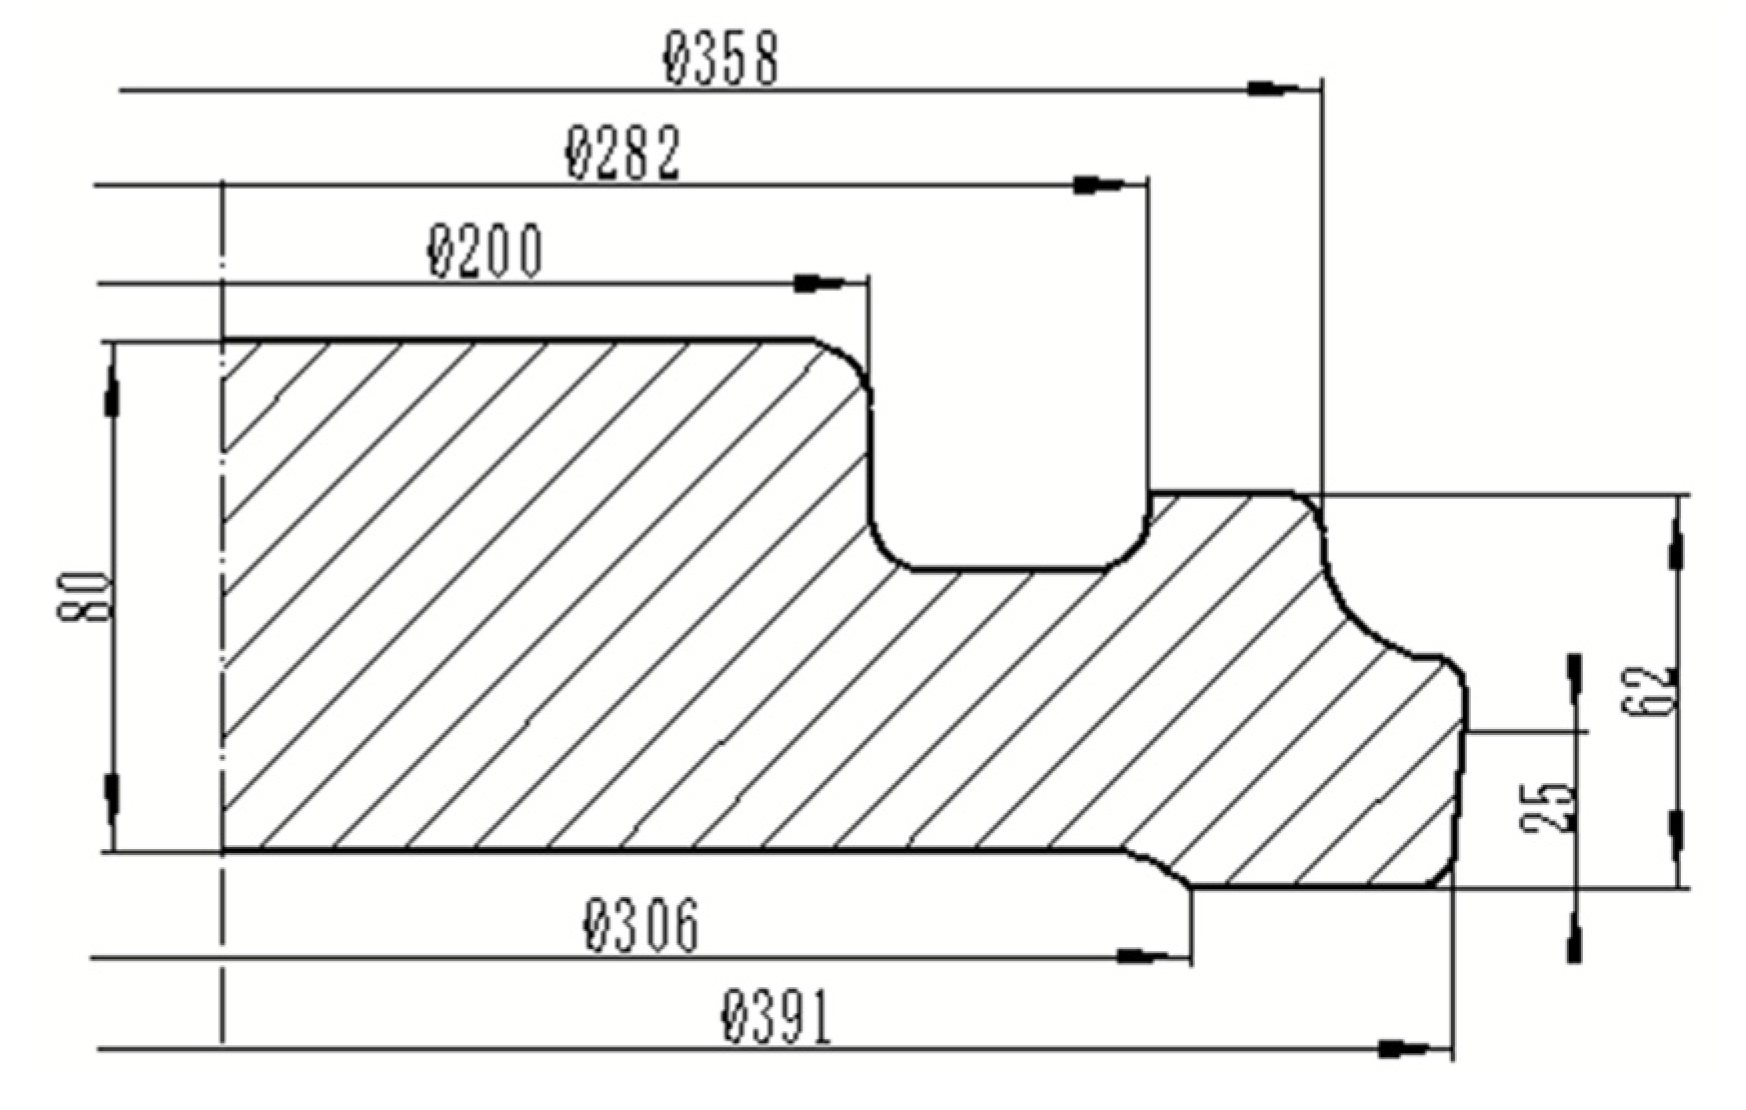
Figure 15.
3D model of the disc.
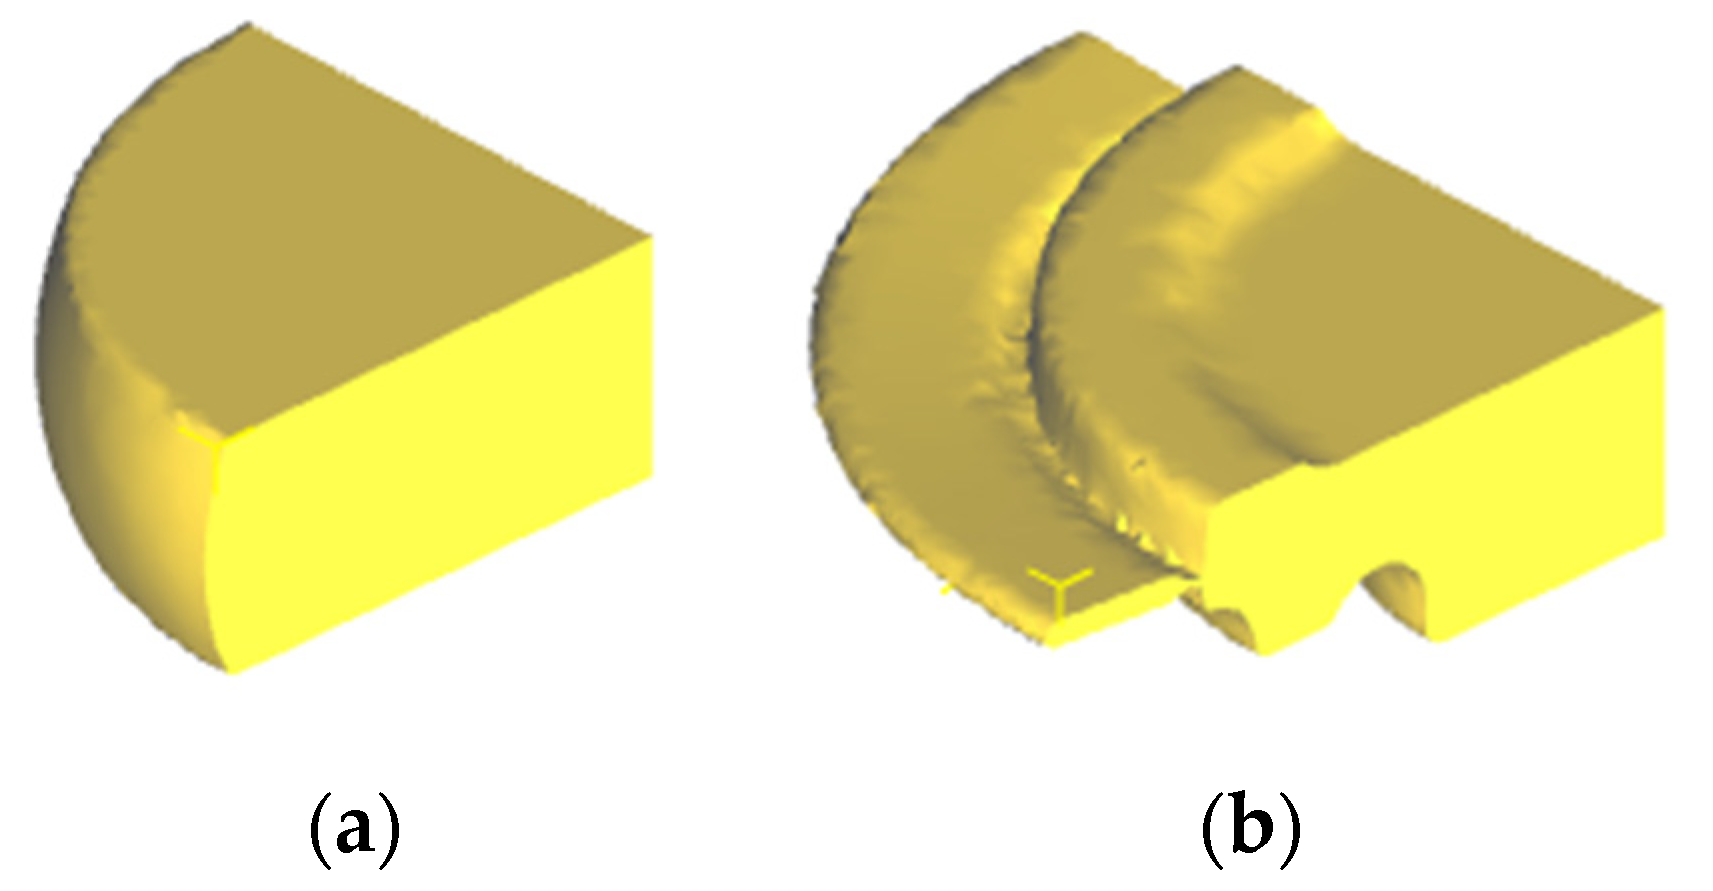
Figure 16.
Numerical simulation results. (a) Upsetting after billet, (b) disk forging.
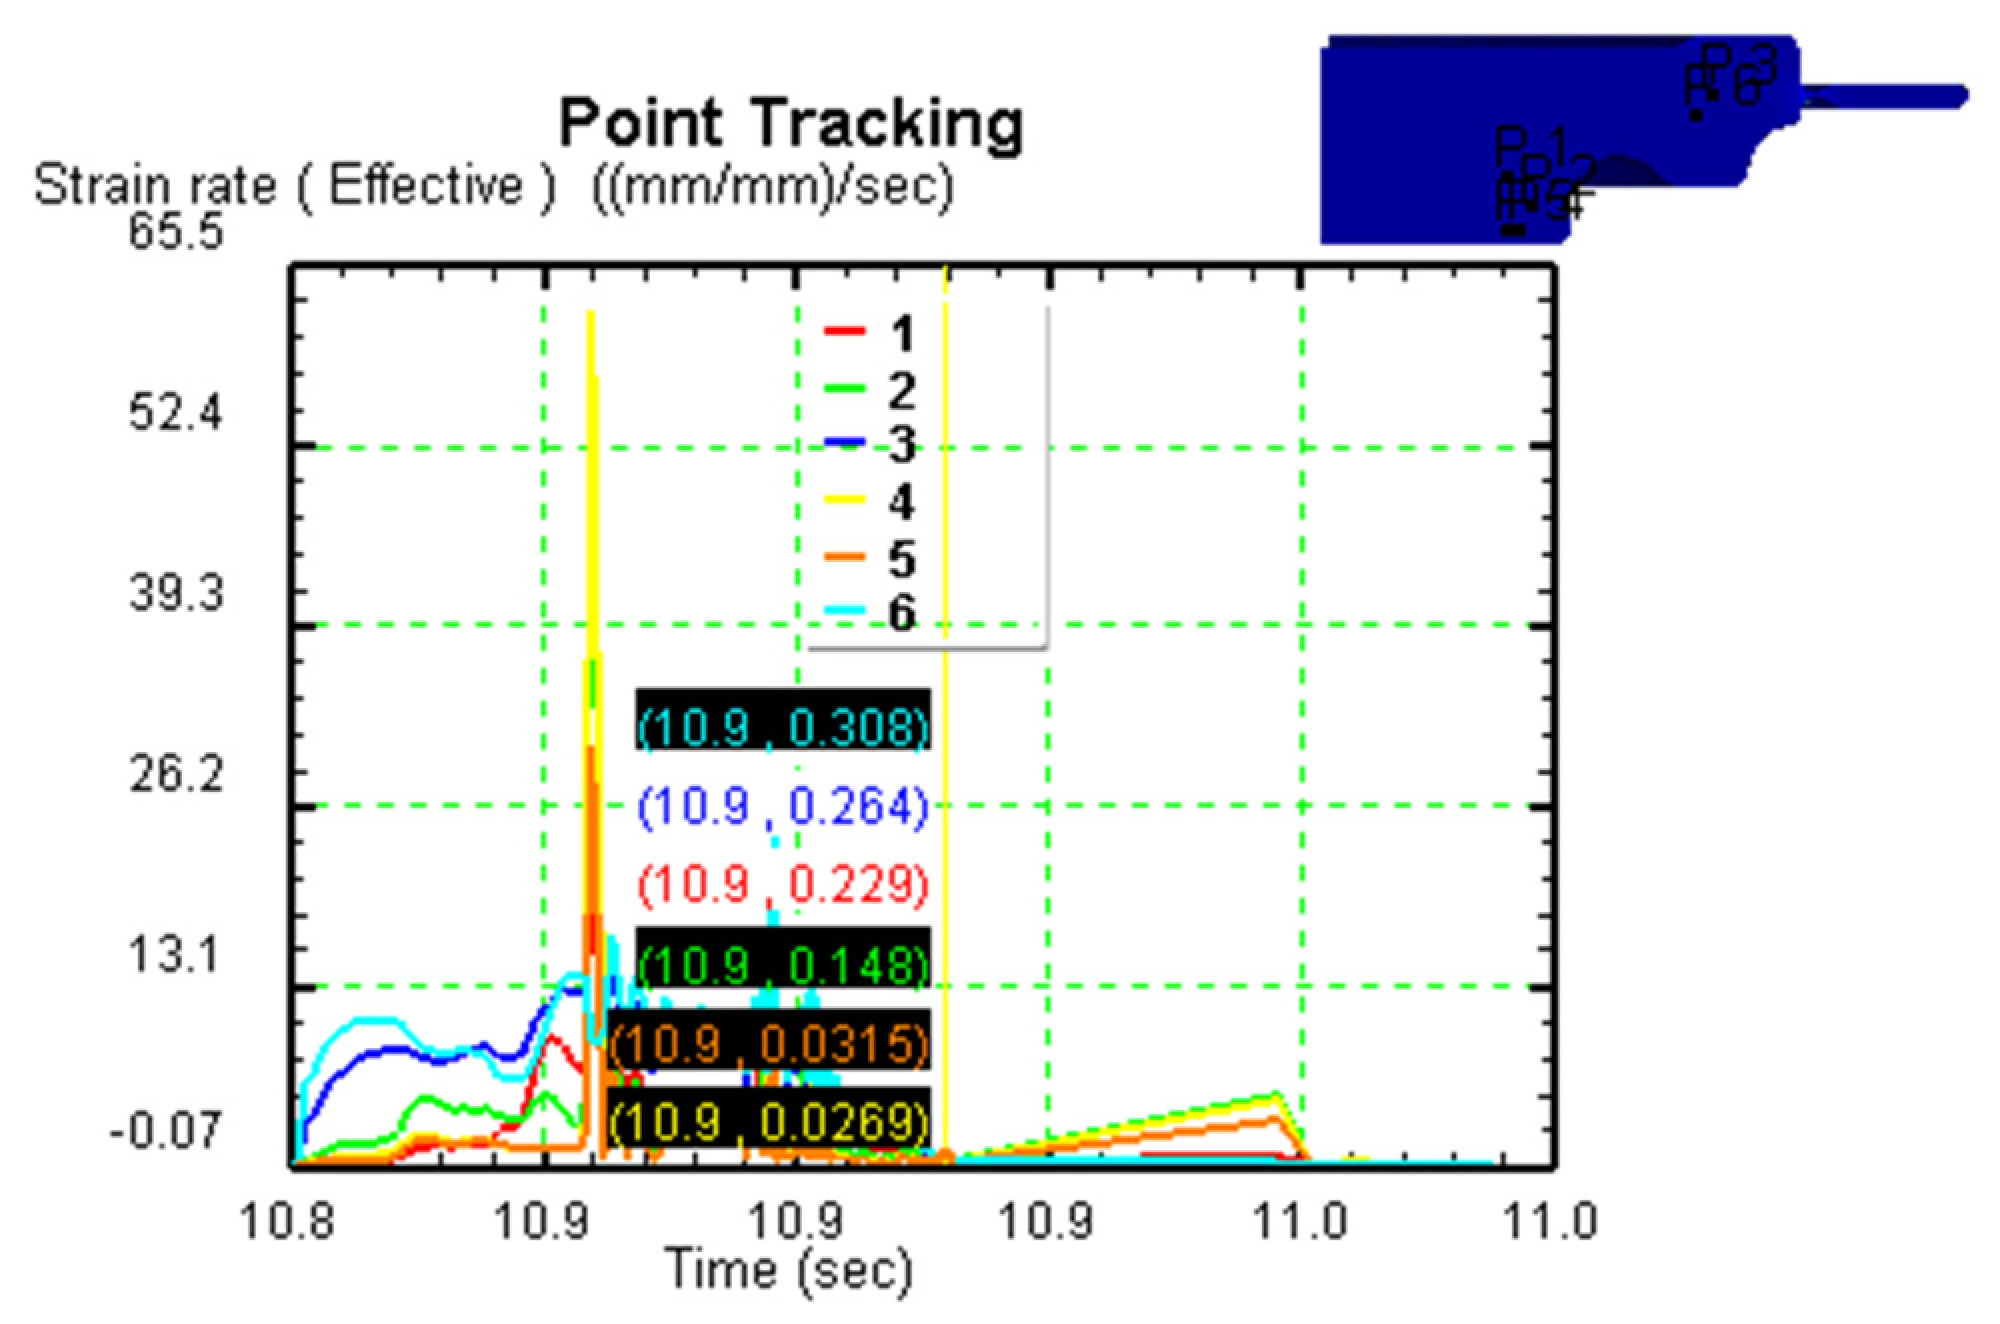
Figure 17.
Strain-rate nephogram at the end of the molding process (deformation temperature is 1090 °C).
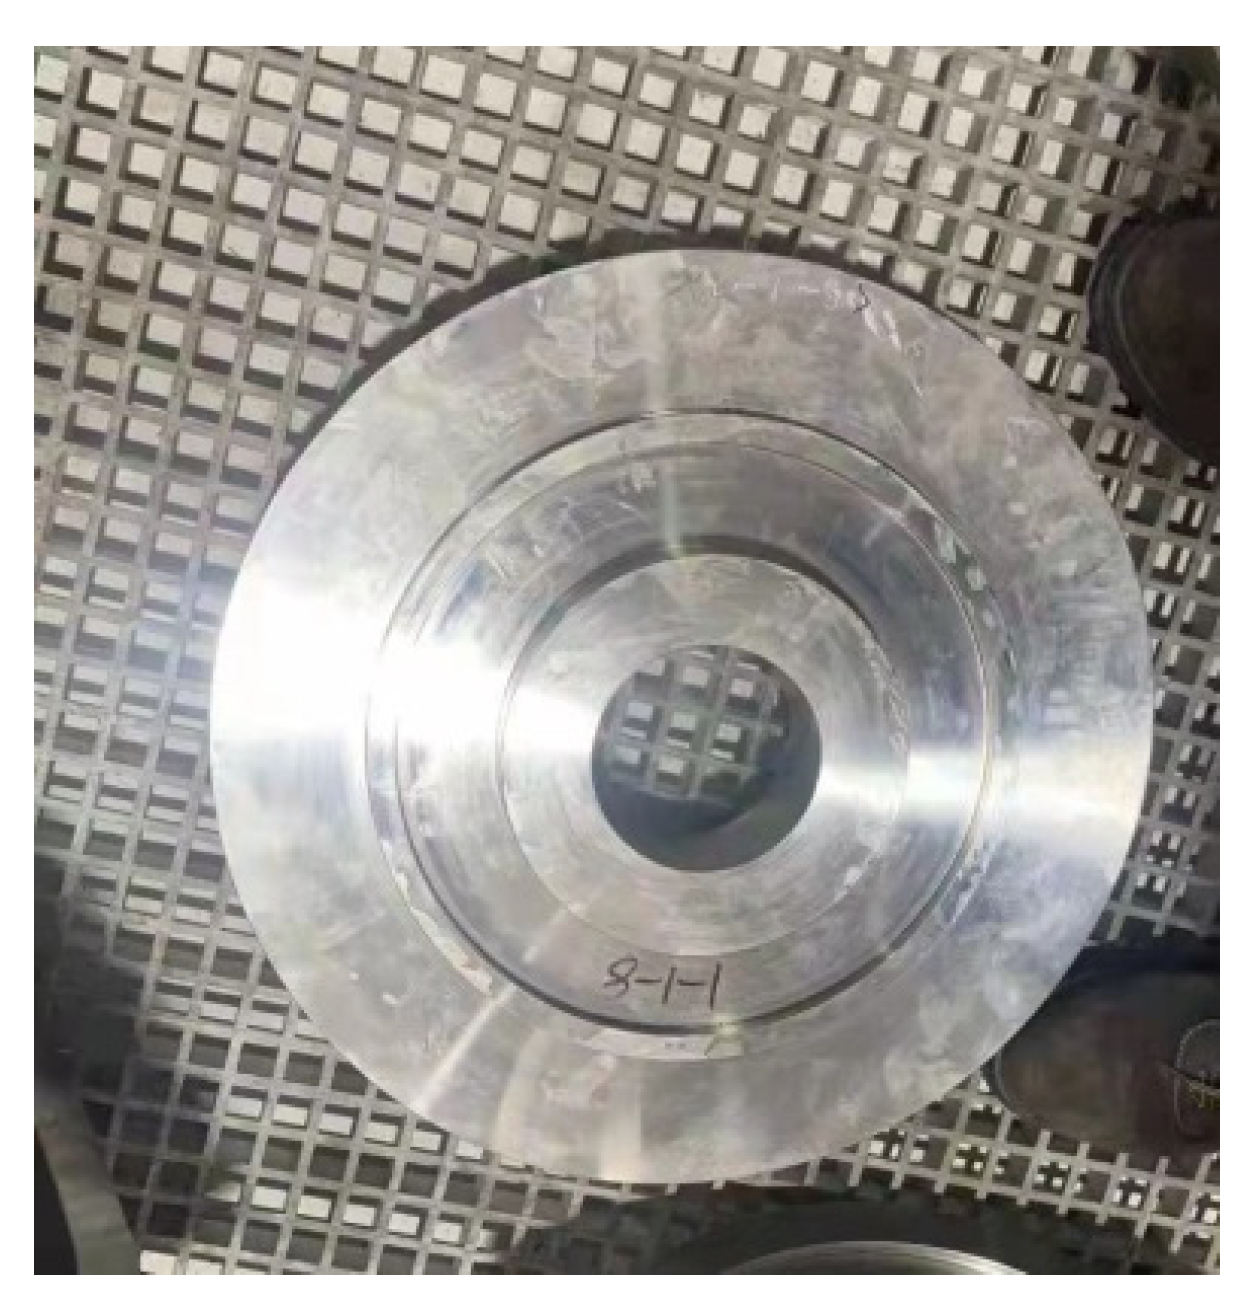
Figure 18.
The final forgings produced.
Table 1.
Chemical composition of GH901 superalloy (wt. %).
| C | Mn | Si | Cr | Mo | S | P | Al |
| 0.031 | 0.00063 | 0.045 | 12.43 | 6.00 | 0.0006 | 0.015 | 0.22 |
| Ti | Cu | Co | B | Pb | Bi | Ag | Ni+Co |
| 3.06 | 0.0030 | 0.015 | 0.015 | 0.00017 | 0.000043 | 0.000073 | 42.28 |
Table 2.
The corresponding stress when the strain is 0.3 (Mpa).
| Deformation Temperature T/°C | Strain Rate |
|---|
| 0.001 | 0.01 | 0.1 | 1 |
|---|
| 990 | 70.626 | 132.98 | 250.98 | 256.22 |
| 1040 | 55.984 | 99.08 | 177.32 | 212.79 |
| 1090 | 44.17034 | 78.609 | 132.82 | 180.94 |
| 1140 | 33.249 | 55.046 | 122.18 | 125.46 |
Table 3.
Regression analysis results of and under different temperatures.
| Material Parameter | Deformation Temperature T/°C |
|---|
| 990 | 1040 | 1090 | 1140 |
|---|
| − | 4.60344 | 4.80803 | 4.76176 | 4.38038 |
| − | 0.03107 | 0.0411 | 0.0492 | 0.06005 |
Table 4.
The hyperbolic sine function fits the slope of and under different deformation conditions.
| Material Parameter | Deformation Temperature T/°C |
|---|
| 990 | 1040 | 1090 | 1140 |
|---|
| 2.79443 | 3.37687 | 3.66579 | 3.72341 |
Table 5.
The regression analysis results of hyperbolic sine function of temperature and .
| Material Parameter | Strain Rate |
|---|
| 0.001 | 0.01 | 0.1 | 1 |
|---|
| 9.61373 | 12.81344 | 16.30829 | 15.68962 |
Table 6.
Material parameters , , and under different strains.
| Strain | | | | |
|---|
| 0.05 | 0.009956 | 4.219159 | 424.2852 | 33.42577 |
| 0.1 | 0.009368 | 3.911235 | 409.8304 | 32.06992 |
| 0.15 | 0.009136 | 3.709211 | 399.5897 | 31.28004 |
| 0.2 | 0.009176 | 3.599519 | 393.6089 | 30.82849 |
| 0.25 | 0.009526 | 3.420980 | 386.5302 | 30.20629 |
| 0.3 | 0.009779 | 3.390125 | 383.5184 | 29.93040 |
| 0.35 | 0.010049 | 3.377397 | 383.7422 | 29.92981 |
| 0.4 | 0.010337 | 3.345353 | 387.0122 | 30.232746 |
| 0.45 | 0.010514 | 3.411254 | 392.0682 | 30.696745 |
| 0.5 | 0.010743 | 3.466367 | 394.5052 | 30.913938 |
| 0.55 | 0.010999 | 3.434757 | 401.3594 | 31.554777 |
| 0.6 | 0.011112 | 3.506462 | 400.0757 | 31.460104 |


