1. Introduction
Solid-state additive manufacturing (AM) provides a valuable approach for printing near-net shape metallic materials layer-upon-layer [
1]. In contrast with conventional, fusion-based AM, solid-state AM does not involve the melting and re-solidification of feedstock materials. Thus, the major concerns from fusion-based AM summarized by Frazier [
2], such as hot cracking, elemental segregation, shrinkage, and gas porosity, could be alleviated by non-beam-based solid-state AM demonstrated by Yu et al. [
3]. Another advantage of solid-state AM is the isotropic mechanical properties from the refined, equiaxed grains in the final depositions [
3]. Solid-state AM is particularly well-suited to alloys which are not fusion weldable, e.g., 2xxx and 7xxx aluminum alloys.
Additive Friction Stir-Deposition (AFS-D) is a more recent solid-state AM technique, and it applies severe plastic deformation and frictional heating from a rotating tool to build metallic materials through layer-by-layer deposition. Originally, van der Stelt et al. [
4] and Liu et al. [
5] introduced the AFS-D technology to the scientific community as the hollow rotating tool friction stir cladding (FSC) process depositing layers of round consumable feed rods, where the FSC process shares similar physics to friction stir welding (FSW). Both FSW and AFS-D involve severe plastic deformation during the process: FSW, patented by Thomas et al. [
6], stirs the material under the shoulder and around the non-consumable probe to join workpieces, whereas AFS-D deforms the filler material (via a hollow tool) between the tool shoulder and the substrate into thin layers (~1 mm). New layers can be built upon previous layers by repeating the process; and thus, achieving the final deposition geometry.
AFS-D has been successfully applied to produce aluminum alloys [
7,
8,
9,
10,
11,
12], magnesium alloys [
13], Inconel [
14,
15], copper [
16], and aluminum matrix composites (AMCs) [
17]. AFS-D of the Mg-based WE43 alloy exhibits fine grain sizes and a homogeneous microstructure with an increased elongation exceeding 10% [
13]. AFS-D of IN625 shows refined and equiaxed grain structure, and significantly higher strength than wrought or fusion-based AM of the same alloy [
14]. In further research on IN625, the as-deposited AFS-D builds present improved fatigue properties compared with the wrought feedstock [
15]. The strength of AFS-D Cu is lower compared to the feedstock due to the loss of work hardening from a lower inferred dislocation density in the recrystallized deposit [
16]. On the whole, the AFS-D process refines the grain size compared to wrought feedstock material, and usually improves the ductility.
AFS-D applied to AA6061 has received particular attention in the recent literature [
8,
11,
12]. In these papers, the AFS-D process refined the grain size from 200 µm in the AA6061-T6 feedstock to an equiaxed size around 15 µm in the deposition [
8]. By optimizing the combination of AFS-D process parameters including rotational speed, traverse speed, and actuator feed rate, Phillips et al. were able to build an AFS-D deposit without excessive flash on the edge or surface grooves on the deposit. The AFS-D builds exhibited comparable homogeneous mechanical strength to AA6061 in an O-temper [
11]. The yield strength (YS) and ultimate tensile strength (UTS) for these materials was around 60 and 130 MPa, respectively. The elongation to failure was improved to above 40% in both orientations of the deposition. Under cyclic loading, the longitudinal orientation exhibited a slightly stronger fatigue resistance than the build direction.
One particularly promising aspect for AFS-D additive manufacturing is its ability to use a variety of feedstock materials, including recycled materials [
18]. The use of aluminum alloy chips and strips as the feedstock material, would allow for AM in areas with limited access to more expensive or exacting feedstock materials. A potential concern with this approach, however, is the mixing of surface oxides (a few nanometers thick) on the recycled feedstock material into the additively produced component. Will these oxides reduce the ductility or strength of the AFS-D builds? This paper systematically investigates the impact of oxide surface layers on the mechanical properties of AA6061 material produced by AFS-D. The aluminum oxide amount in the AFS-D builds was controlled by the thickness of anodized layers on the surface of bar feedstock. The microstructural oxide distribution, mechanical properties, and fracture mechanisms are all described.
2. Materials and Methods
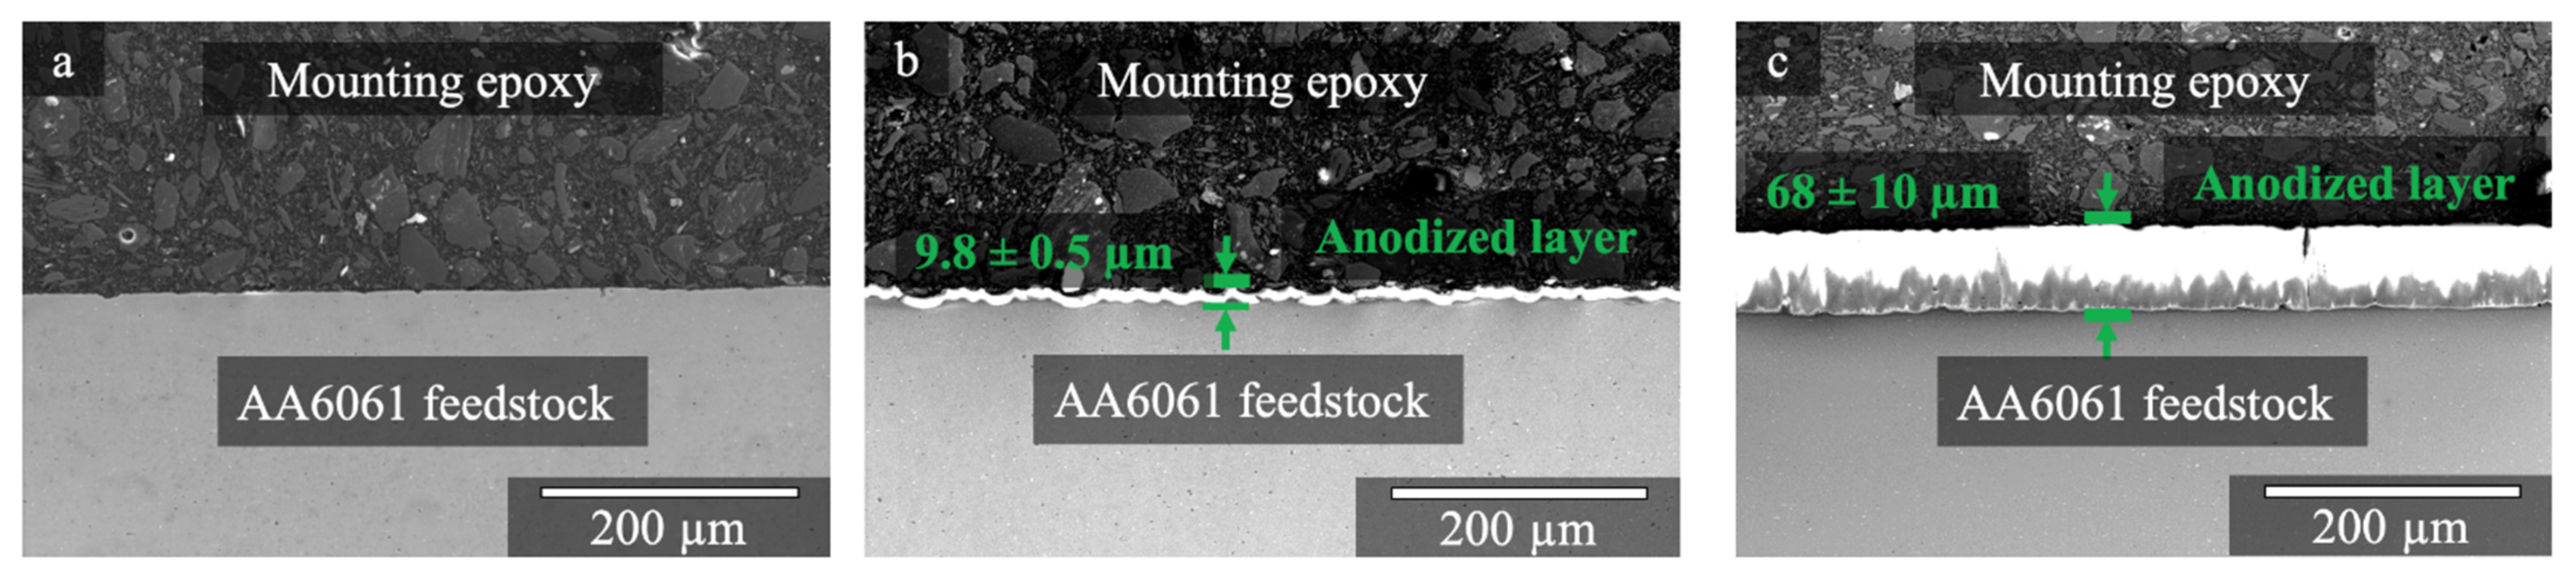
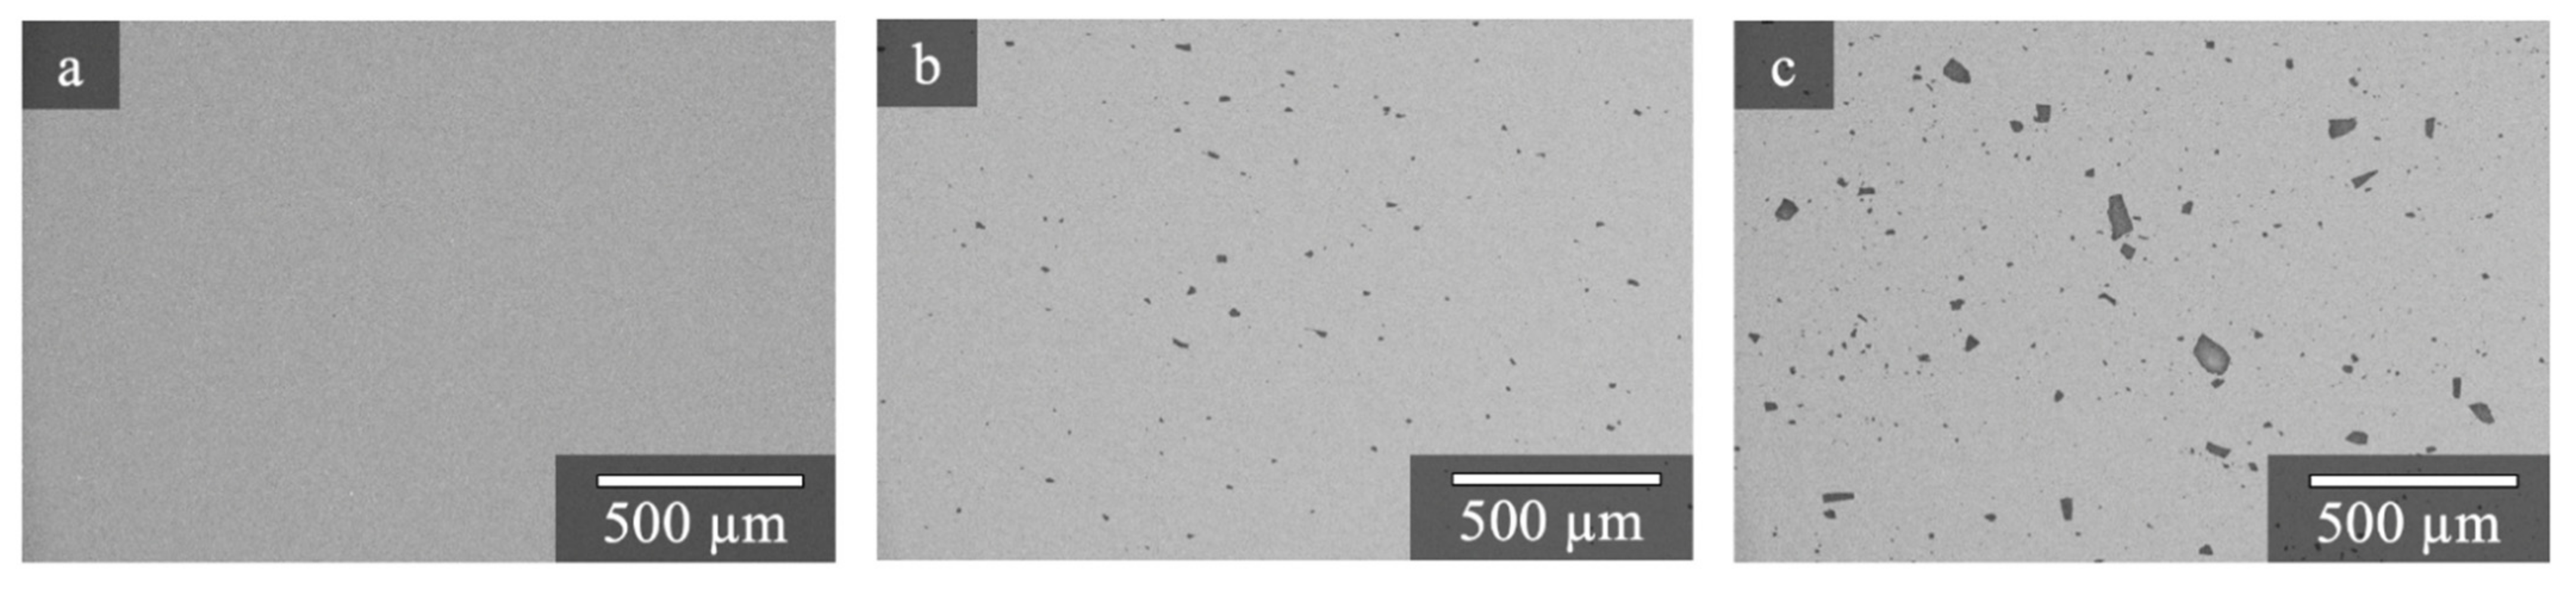
In this research, two batches of square-rod AA6061-T6 feedstock bars (9.5 mm × 9.5 mm × 305 mm) were anodized in sulfuric acid by D & J Enterprises (Huntsville, Alabama, USA) (
Figure 1). The naturally occurring oxide layer (a few nanometers thick) on the non-anodized feedstock bars was not observable at low magnification (
Figure 1a). The average thickness of the anodized layers on the feedstock bars was 9.8 ± 0.5 µm and 68 ± 10 µm for each of two batches, respectively (
Figure 1b,c). Three pieces of anodized feedstock were selected randomly from each batch, and on each piece three cross-sections (two at the edges and one in the center) were used to measure the thickness of anodized layers. In total, the layer thickness was measured at least 36 times at 9 cross-sections on three pieces of feedstocks of each batch. The anodized layers exhibited uniformity in thickness on the feedstock bars with 5% and 15% variation, respectively. These two thicknesses were chosen based on the average grain size (15 µm) of AFS-D builds from non-anodized AA6061 feedstock [
8].
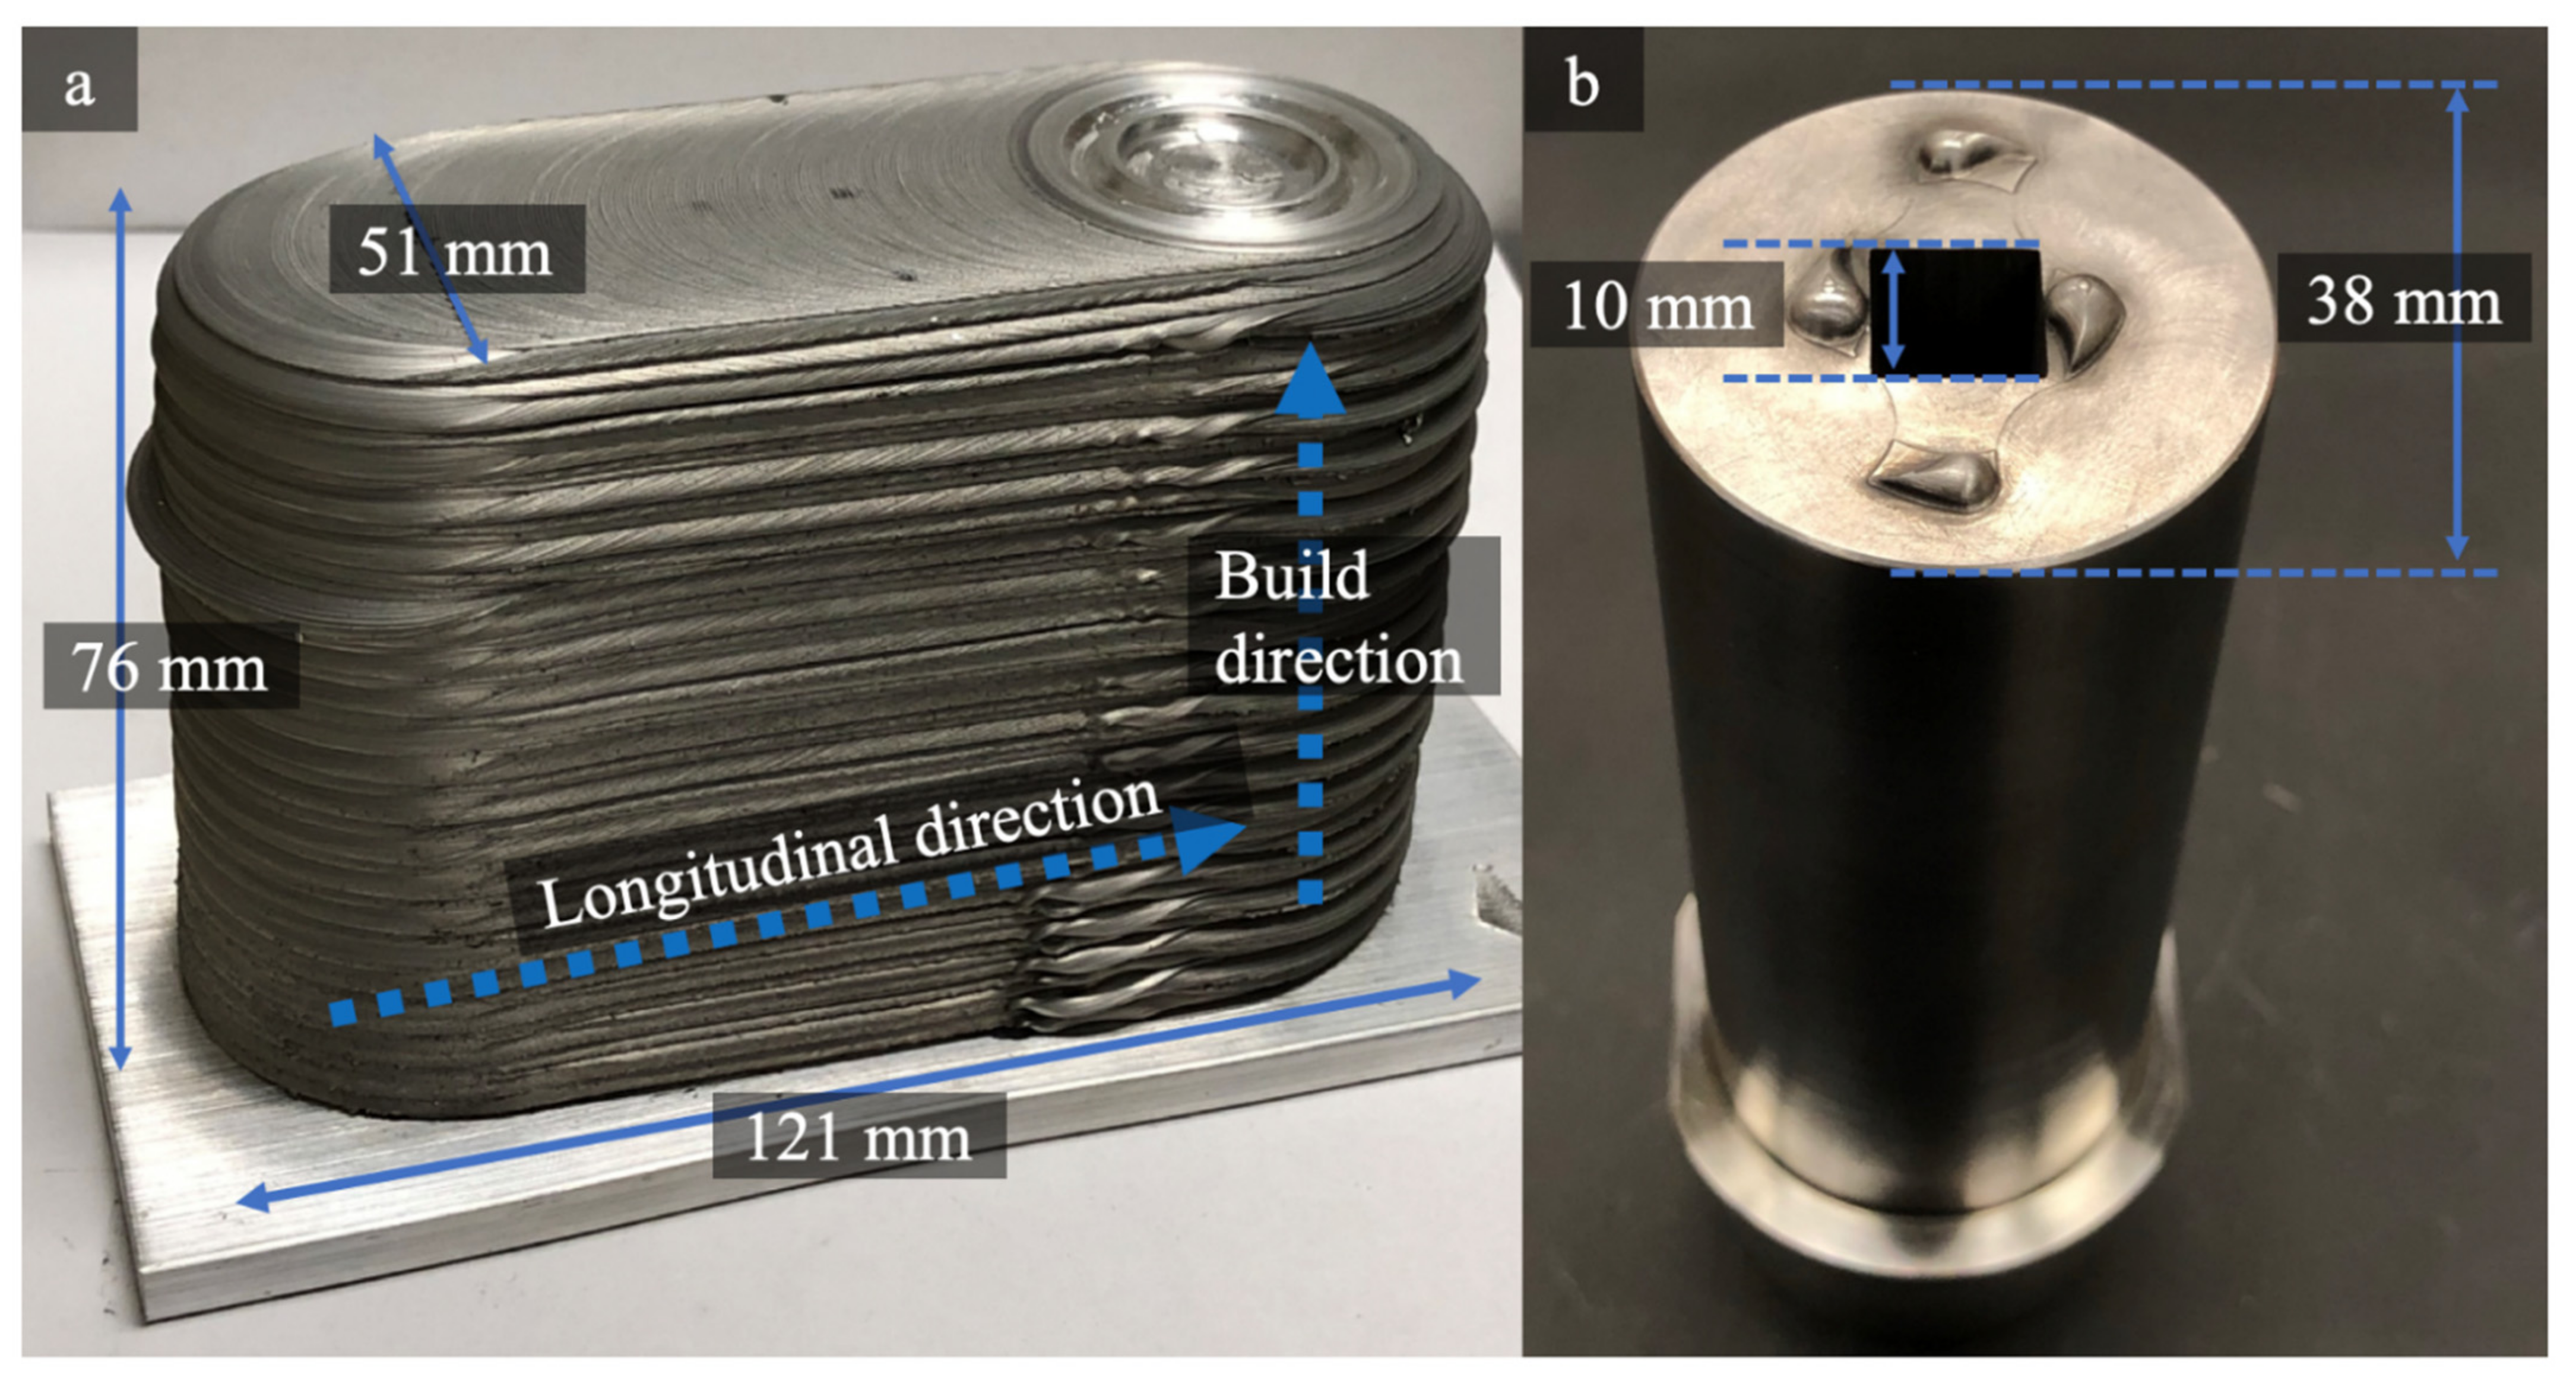
A commercial B8 AFS-D machine (MELD Corporation, Blacksburg, VA, USA) was used to produce two AFS-D builds with a geometry of 121 mm × 51 mm × 76 mm from the two batches of the anodized feedstocks (
Figure 2a). In this present study, processing parameters developed in the work by Philips et al. were used for the two depositions: 300 RPM for the rotational speed, 127 mm/min for the tool traverse speed, and 66 mm/min for the actuator feed rate [
8]. Each piece of the square-rod feedstock produced four 1-mm-thick layers with alternating traverse directions, and a total of 18 pieces of feedstock were used for each deposition. The substrate was AA6061-T651 with a 6.35 mm thickness. No distortion of the substrate was observed after removing the depositions from clamping. A typical AFS-D tool was used for the depositions consisting of a 38.1 mm diameter with four “teardrop” protrusions on the shoulder surface to enhance material mixing between deposited layers during the process as detailed in
Figure 2b. The microstructures and mechanical properties from these anodized feedstock depositions were compared to laboratory data from the non-anodized AA6061-T6 feedstock, and the processing parameters and the AFS-D tool were the same for all depositions [
11].
Wire electro-discharge machining (EDM) fabricated tensile coupons in both the longitudinal direction and the build direction for each deposition feedstock condition. Each tensile coupon was 63.5 mm in length, 12 mm in width and 4 mm in thickness corresponding to a modified ASTM E8 coupon as used previously [
10,
11]. The gauge length for each was 5.5 mm. Quasi-static (
= 0.001 mm/mm/s) monotonic tests were carried out in triplicate on a servo hydraulic load frame under displacement control. A 5-mm extensometer was used to record the strain in the gauge section. Thus, allowing for the tensile mechanical properties of the AFS-D builds from non-anodized and anodized feedstocks to be directly compared.
Cross-sections parallel to the build direction from each deposition were used for microstructural analysis. Those samples were mounted, ground, and polished using standard metallographic techniques. A final polish was performed using a four-hour-long vibratory polish with a 0.02 colloidal silica slurry. A Thermo Fisher Scientific Apreo scanning electron microscope (Thermo Fisher Scientific, Waltham, MA, USA) was used to obtain the microstructure images at 20 kV and 6.4 nA with a working distance of 10 mm. For each deposition, 12 backscattered electron (BSE) images were collected at 65× magnification to analyze particle size and distribution. Compositional identification of particles was made with energy dispersive X-ray spectroscopy (EDS) at 20 kV and 0.4 nA using an EDAX system (EDAX LLC, Mahwah, NJ, USA). A Tescan Lyra FIB-FESEM (TESCAN USA, Inc., Warrendale, PA, USA) was used to take the fractography images at 20 kV and 0.3 nA with a working distance of 40 mm.
The particle distribution was analyzed via ImageJ image-processing software based on the BSE images (
Figure 3). A median filter was used to reduce noise in the scanning electron microscopy (SEM) images by replacing each pixel with the median of the neighboring (radius of 2 pixels) pixel values. Then the image was converted to a black and white binary image (
Figure 3c,d). Only particles with a size larger than 4 pixels were included in the analysis.
In this paper, we will refer to the two depositions from anodized AA6061 feedstock as AA6061-0.4%alumina and AA6061-2.8%alumina, respectively. The values of 0.4% and 2.8% represent the theoretical percentage of alumina in the deposited material. These theoretical values were calculated based on the ratio of the measured area of oxide layers to the remaining area of the AA6061 matrix. The data from non-anodized AA6061-T651 feedstock will be termed AA6061-NA (no alumina).
3. Results
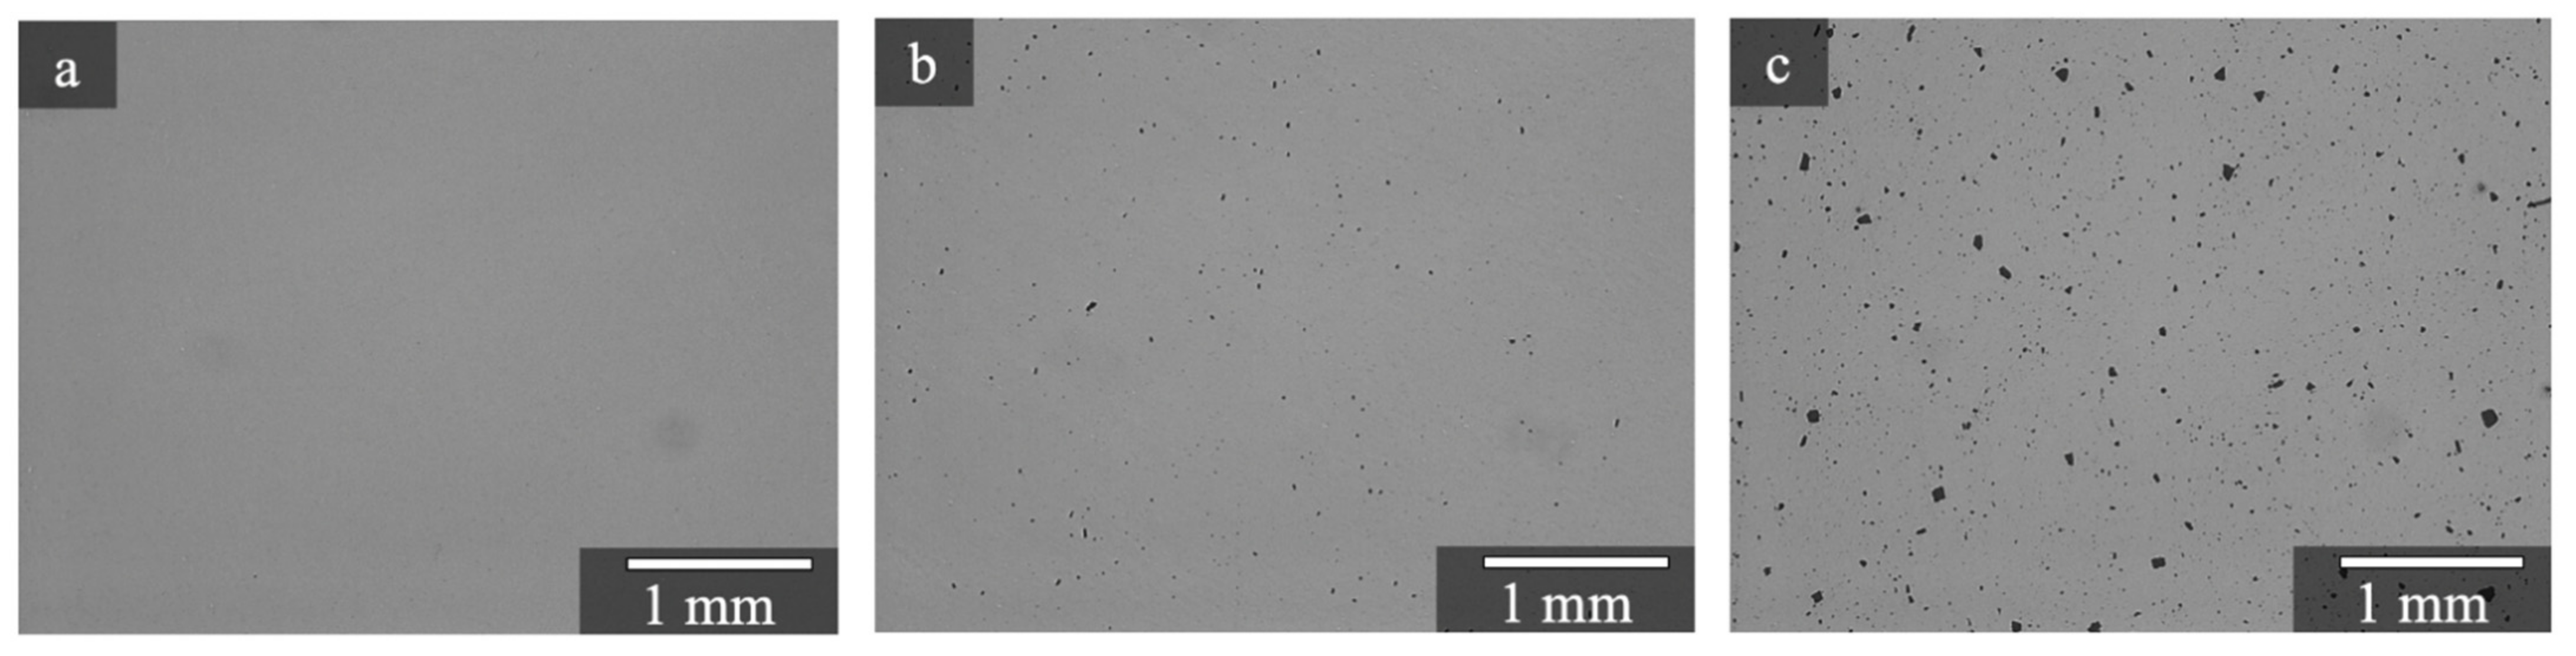
The anodized feedstocks produced fully dense AFS-D builds without apparent porosity or cracks (
Figure 4). Black particles in the microstructure were alumina from the anodized layers on the feedstock (
Figure 4b,c). Such large alumina particles were not observed in the non-anodized AA6061 material (
Figure 4a). Despite the presence of alumina particles in depositions from anodized feedstock, the material was fully consolidated within the aluminum matrix, and there were no pores or crevices along the boundaries between the alumina particles and the matrix. Larger alumina particles were observed in the AA6061-2.8%alumina deposition, which was produced from the feedstock with thicker anodized layers (68 µm) (
Figure 4c).
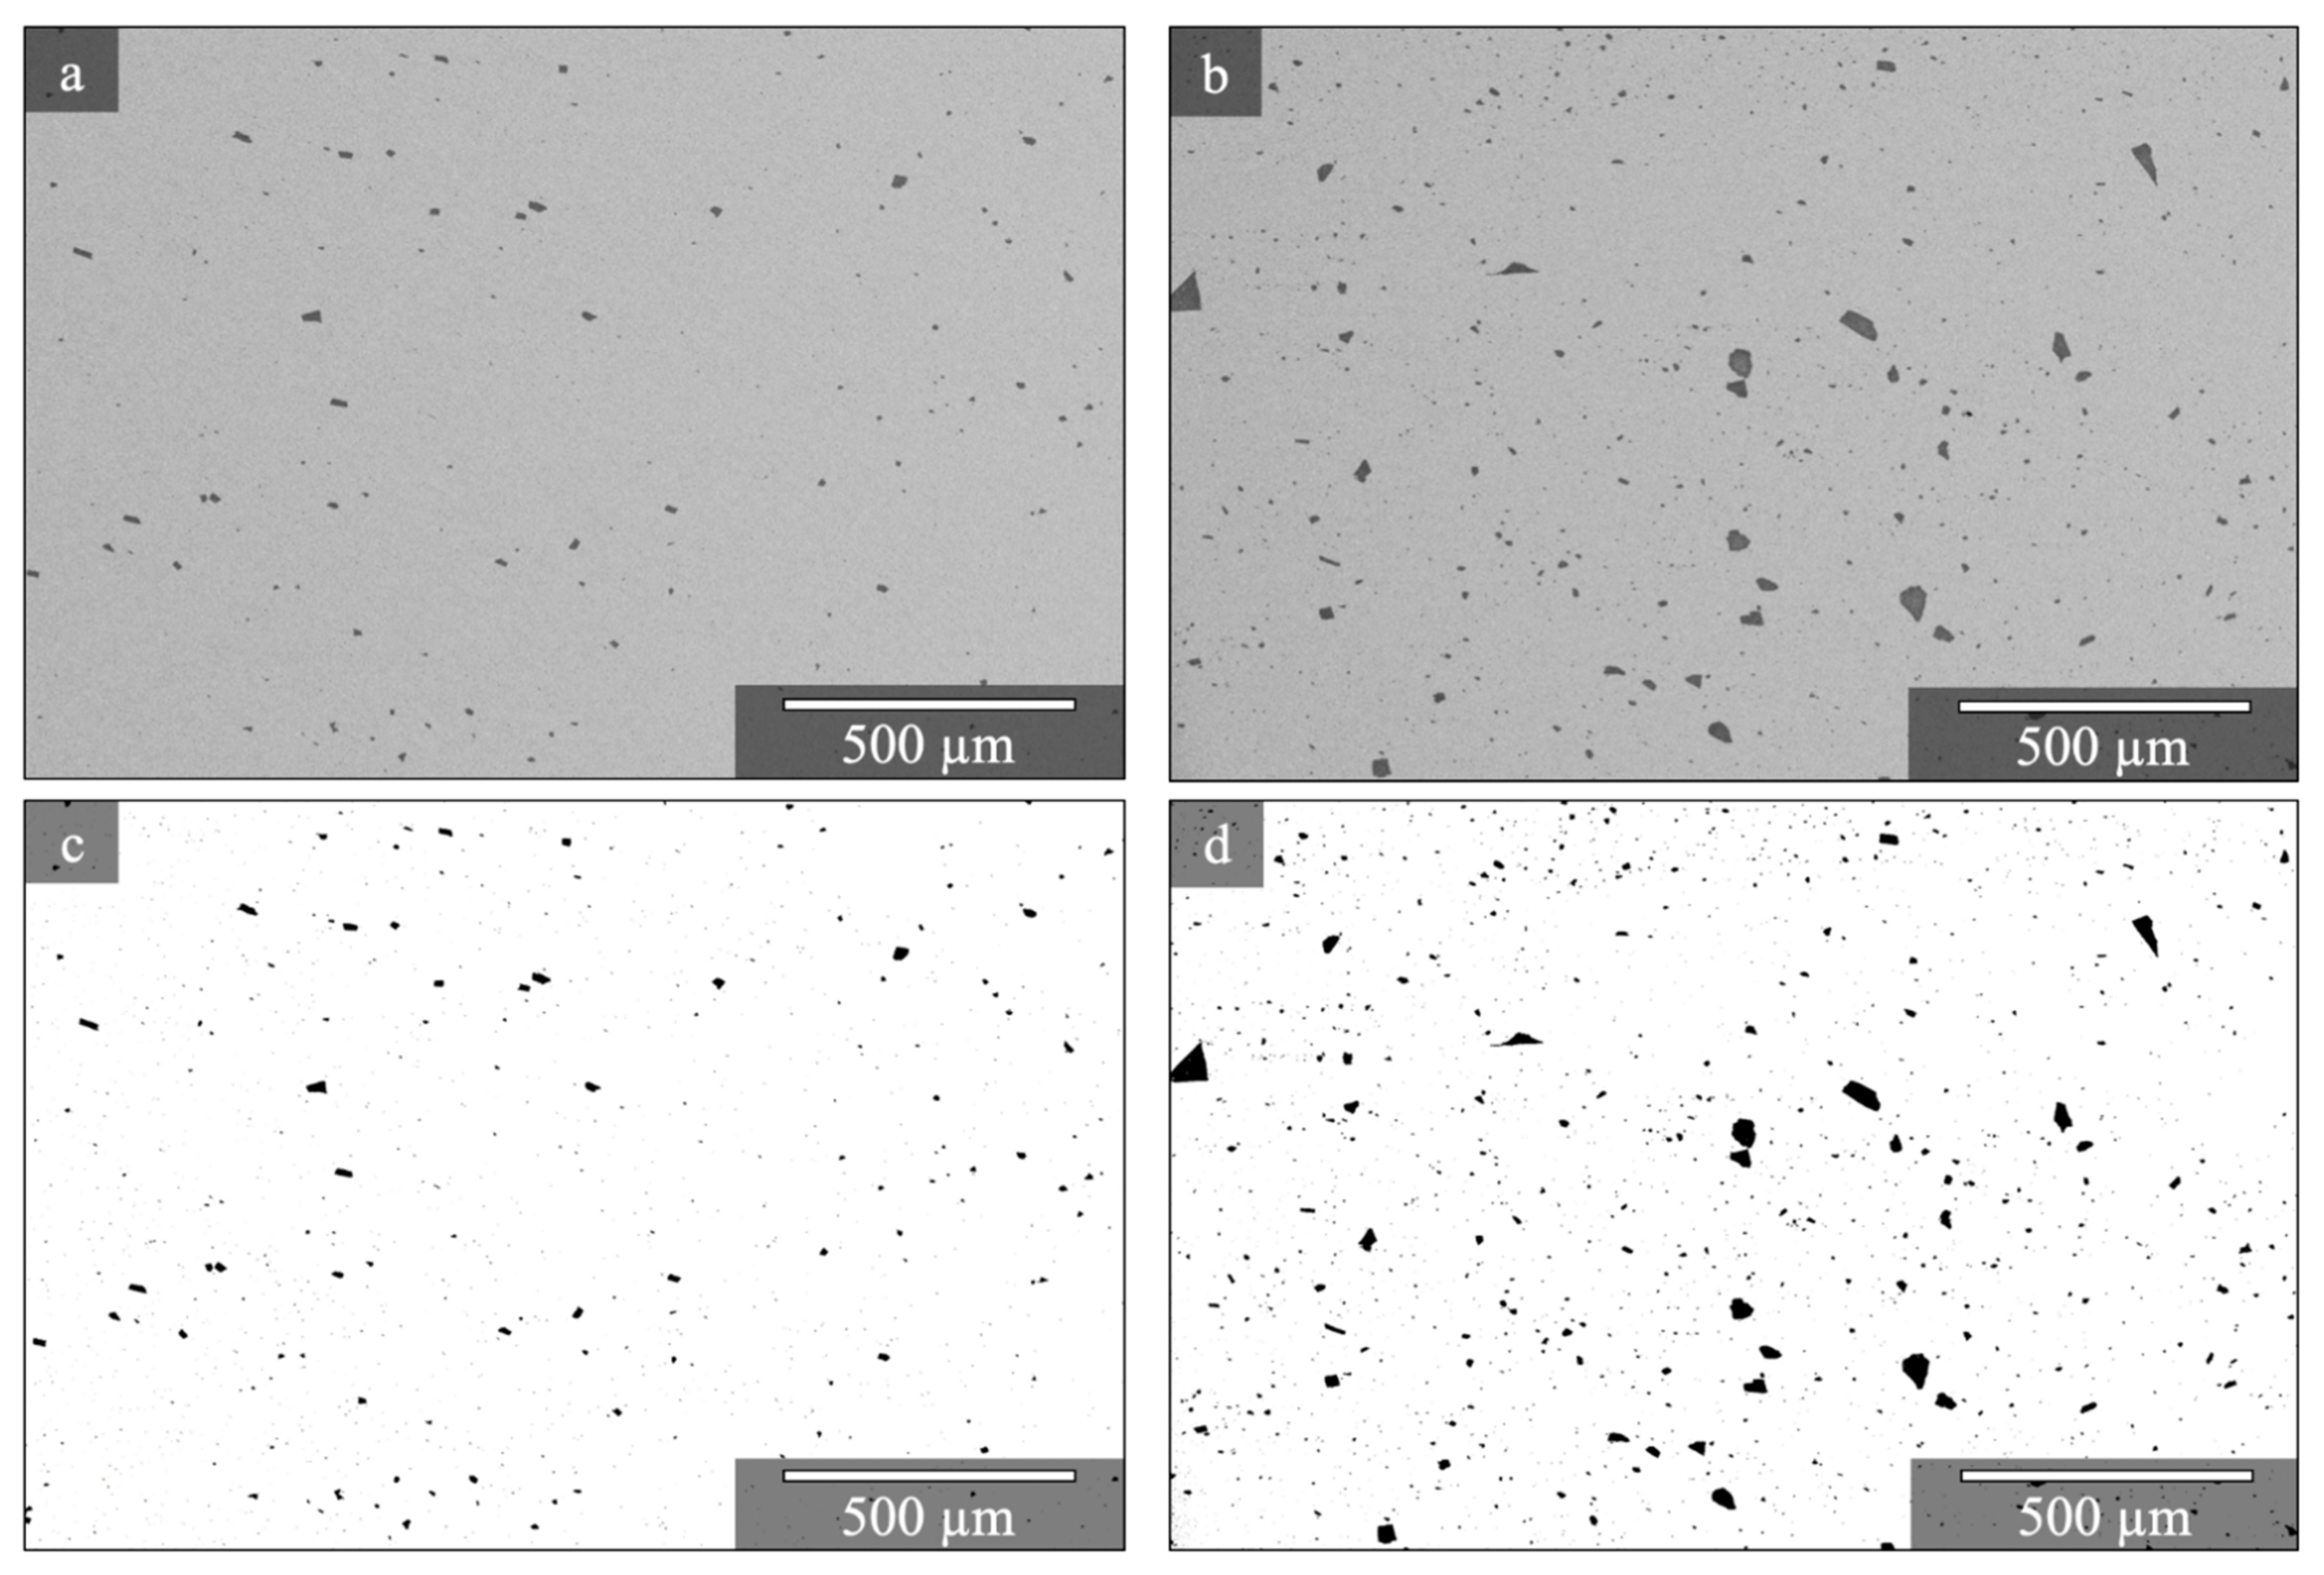
Irregular-shaped alumina particles (diameter > 9.8 μm) were observed in both depositions from anodized feedstock, and their sizes and area fractions were proportional to the thickness of anodized layers on the feedstocks (
Figure 5b,c). In the AA6061-2.8%alumina deposition, the particle sizes were distinctly larger, and the amount of both large particles (>68 μm) and small particles was increased. The distribution of alumina particles was relatively uniform, with no obvious agglomeration. In the deposition from non-anodized feedstocks (
Figure 5a), no alumina particles were observed at this same low magnification.
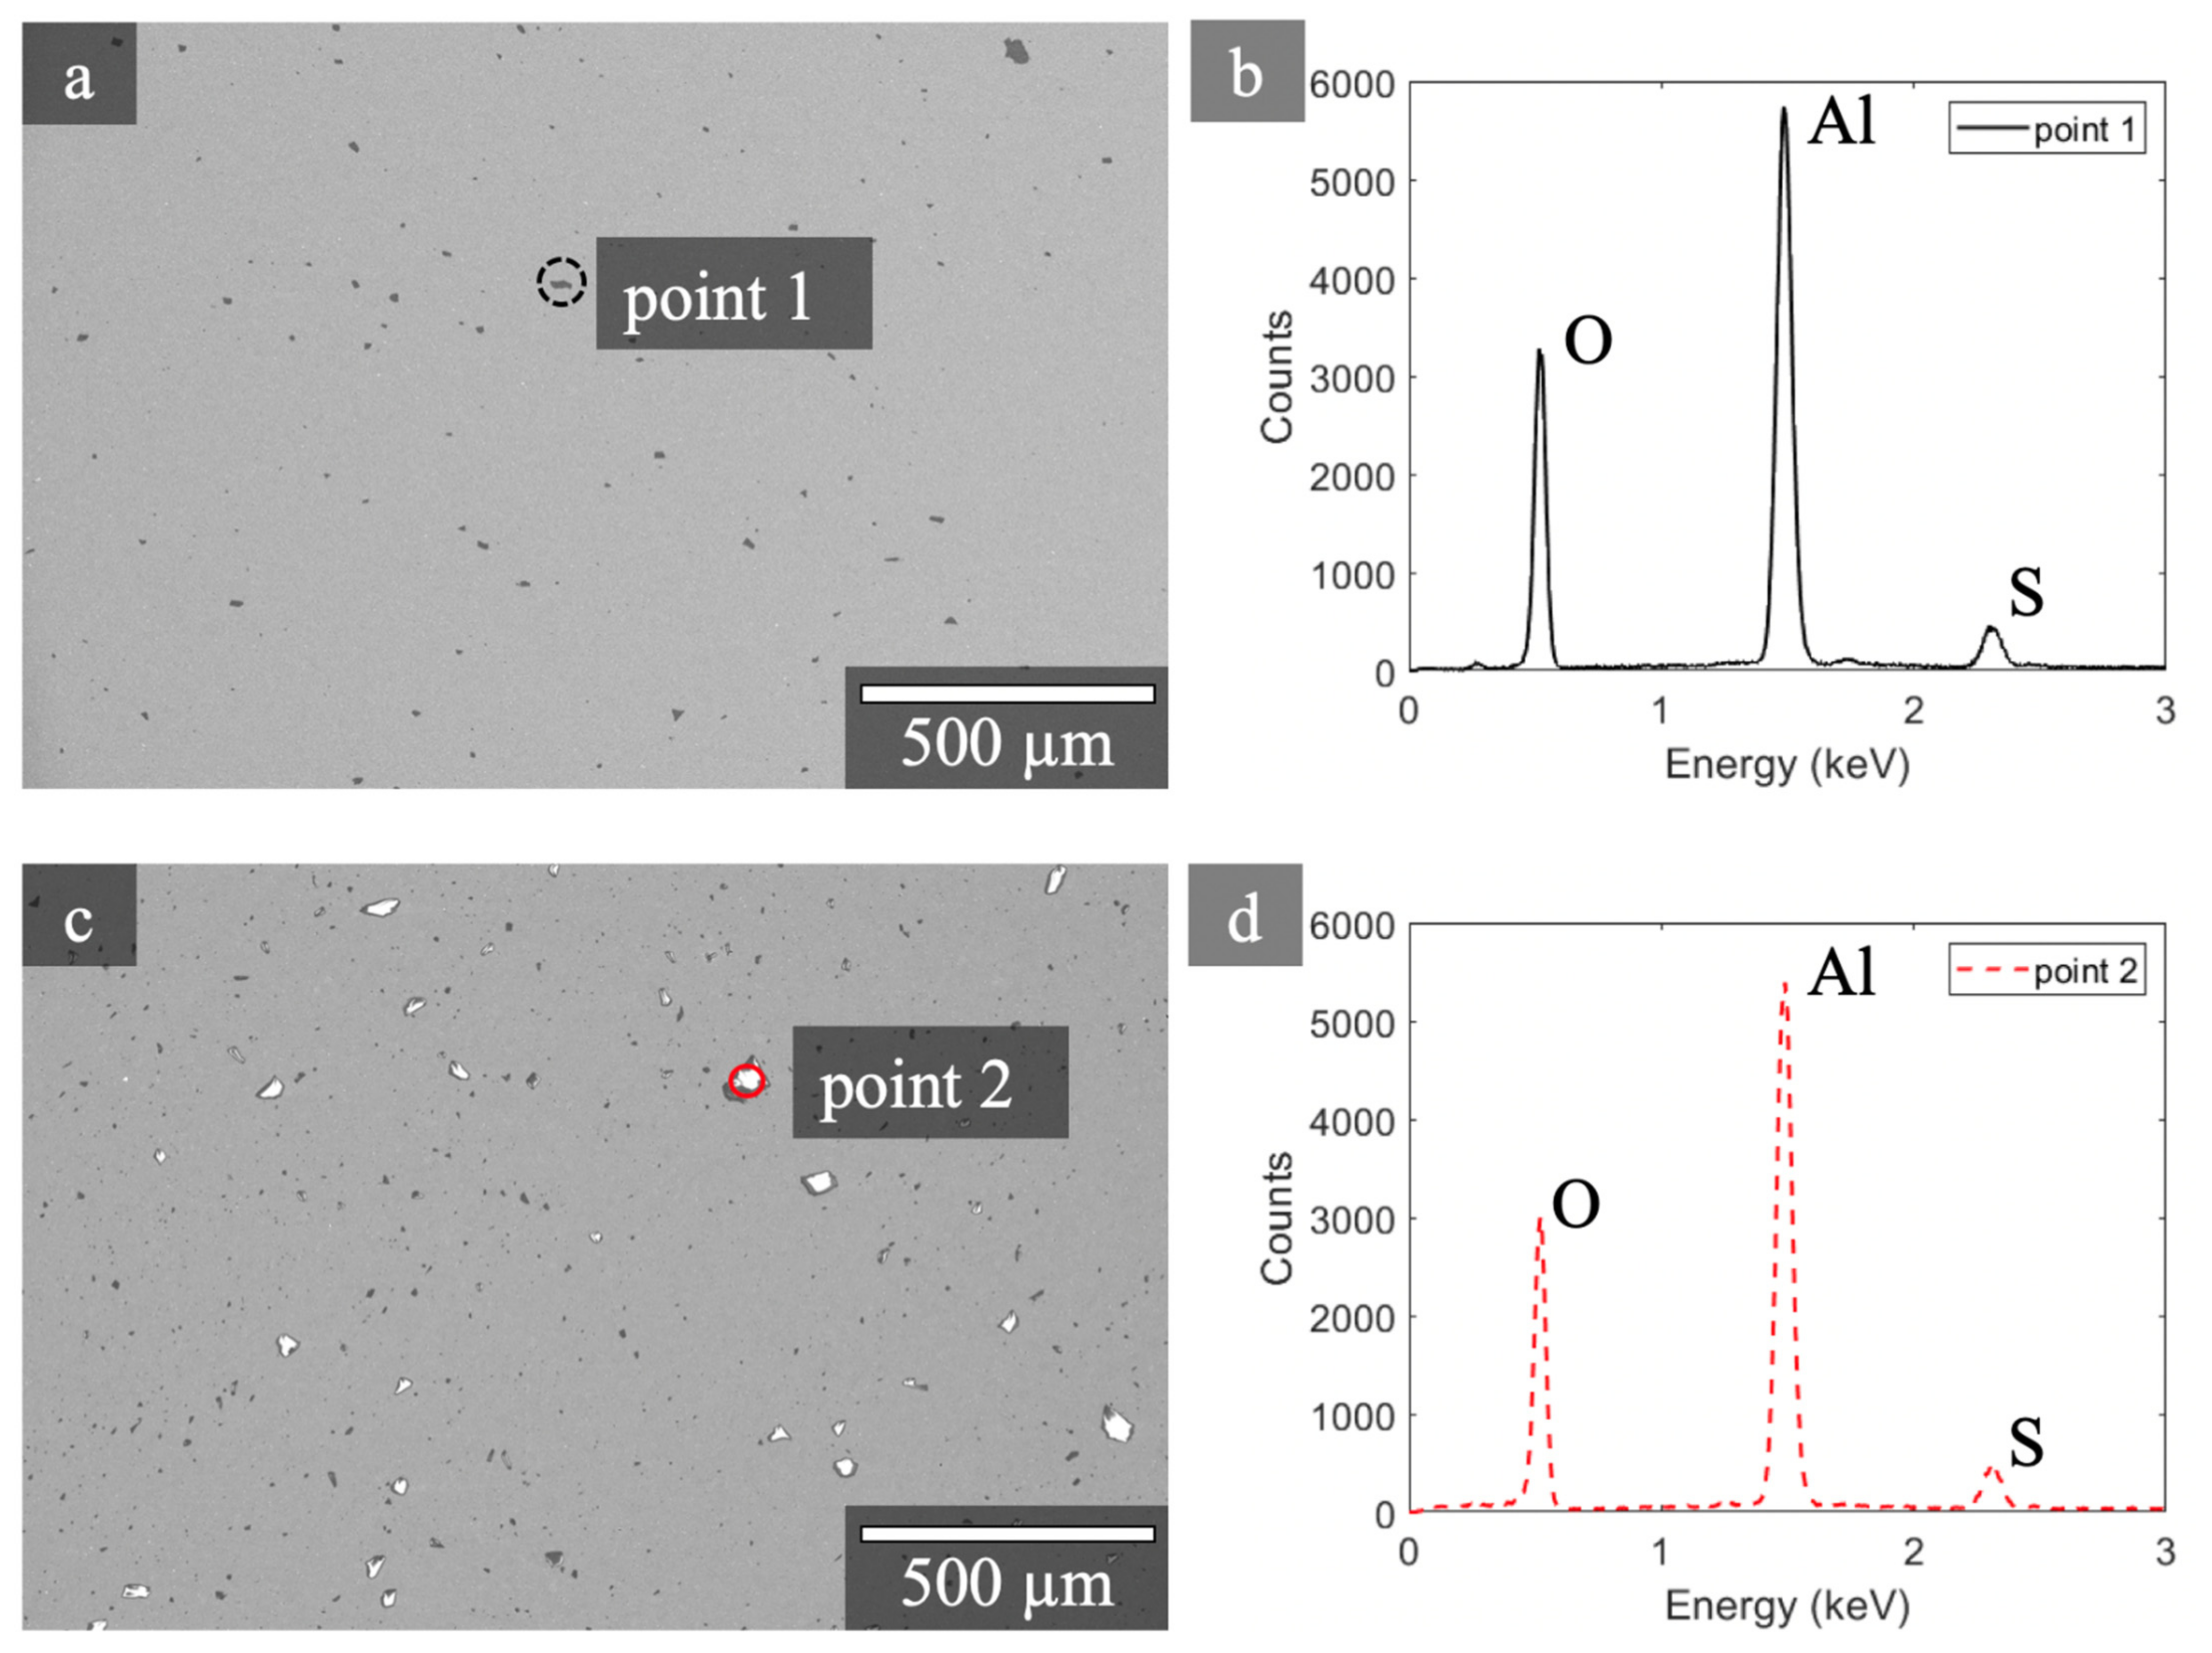
The larger black particles (
Figure 5 and
Figure 6) showed X-ray signals consistent with being alumina. All of these particles showed an enhanced oxygen signal in the EDS spectra. The larger particles (>9.8 μm in diameter) exhibited a strong oxygen signal in all EDS results from multiple particles.
Figure 6b,d are examples of EDS signals collected at the alumina particles point 1 and point 2, as circled in
Figure 6a,c. The detected sulfur signal was from the sulfuric acid electrolyte used in the hard anodization process to prepare the anodized feedstock.
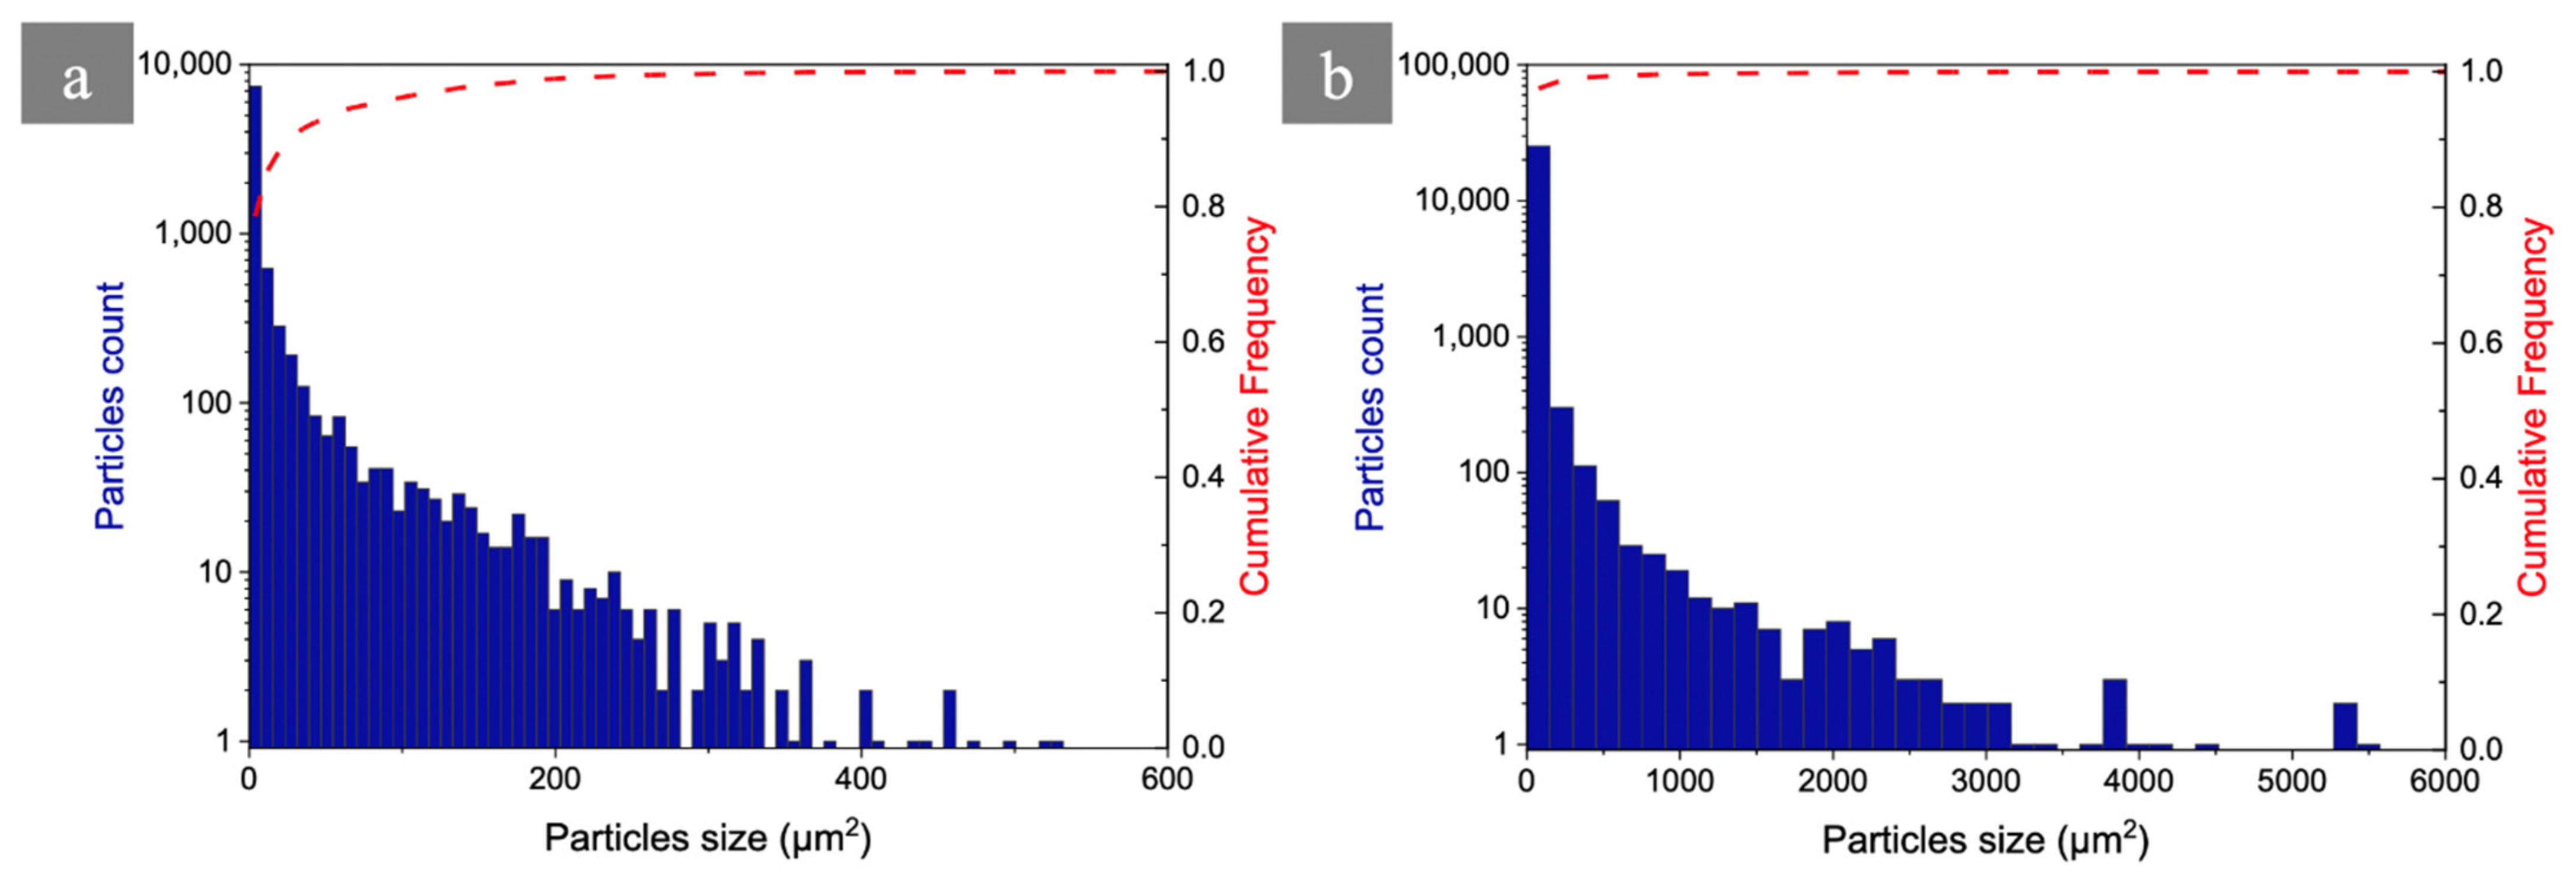
The AFS-D process clearly refines and disperses the alumina coatings on the anodized feedstock into small particles throughout the deposition (
Figure 7a,b). Note those particles were positively identified as alumina with the EDS signals shown in
Figure 6b,d. The frequency of particles sharply decreased with increasing particle size, shown by the red cumulative frequency curve in the
Figure 7. Nevertheless, a few particularly large alumina particles were observed: in both depositions, less than 5% of the alumina particles were larger than 100 μm
2. In the AA6061-0.4%alumina deposition, the maximum particle size observed was 528 μm
2; in the AA6061-2.8%alumina the largest particle size was 10,100 μm
2. Descriptive statistics of alumina particles sizes are summarized in
Table 1.
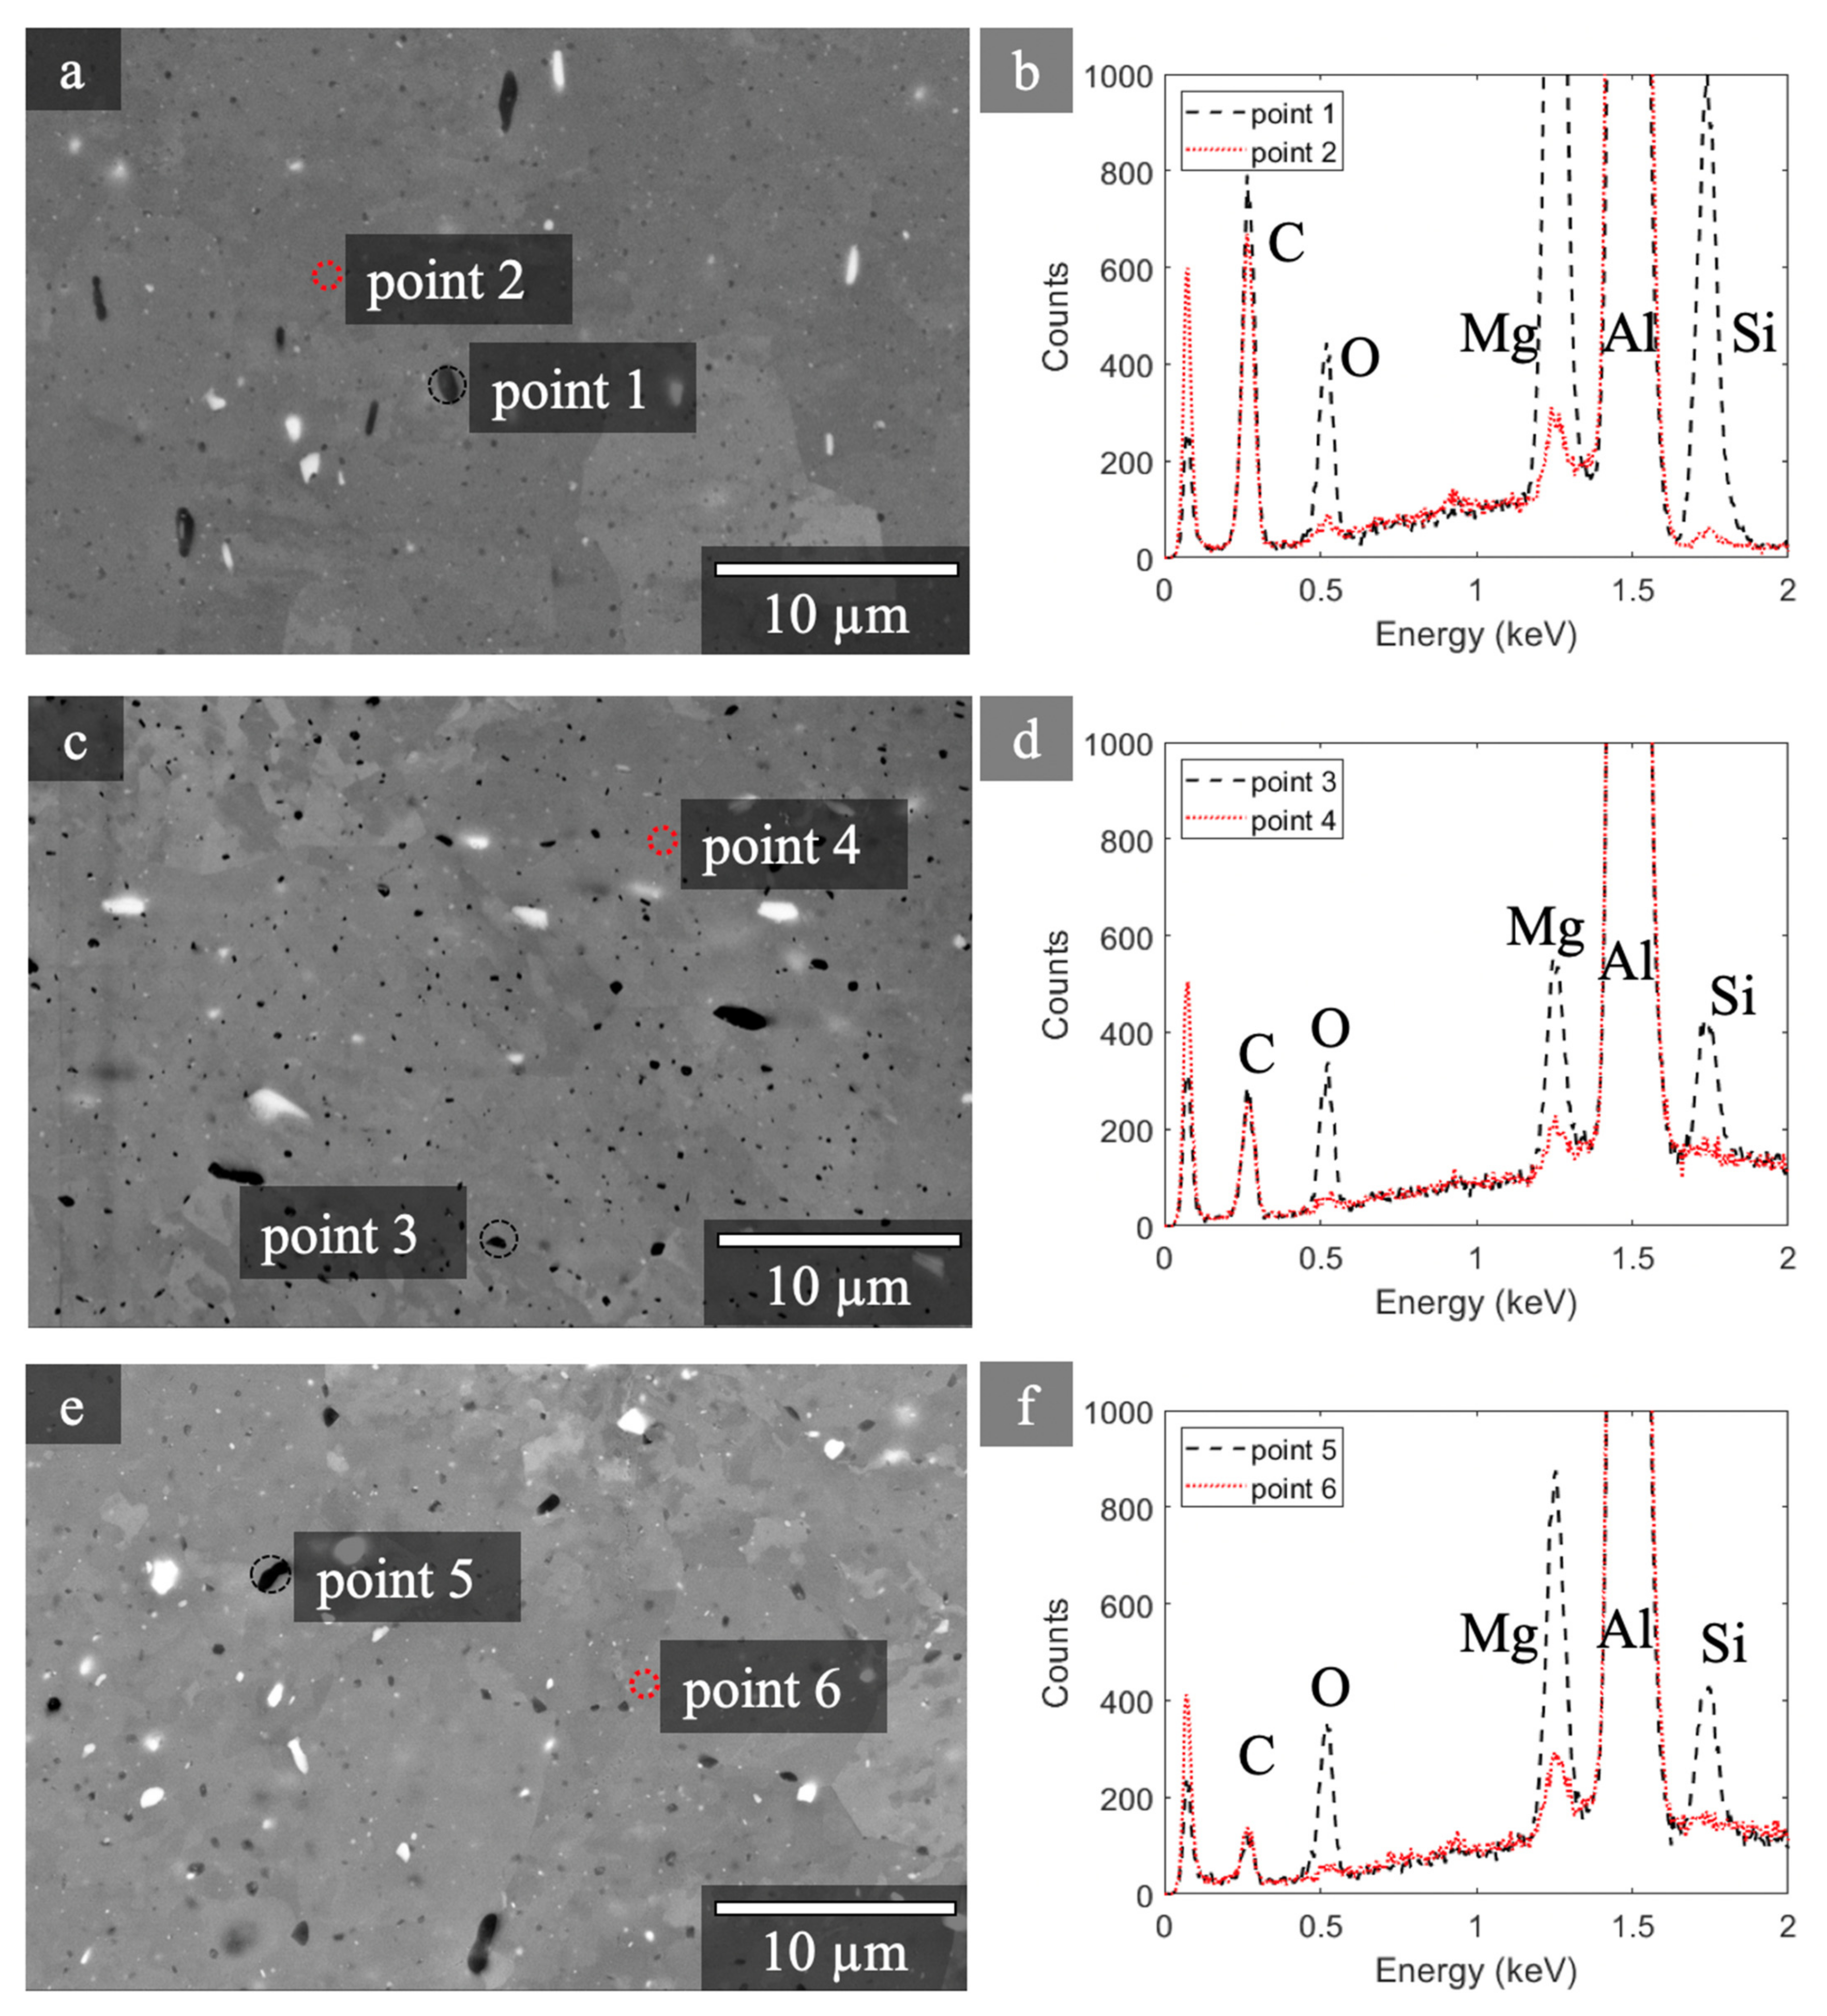
Additionally, depositions from all three feedstocks showed another set of even smaller (around 3 µm diameter) oxide particles (
Figure 8). EDS spectra showed enhanced oxygen signals on all of the small particles measured, which implies that these small, black particles were also oxides (points 1,3,5). Due to their small size, it is important to consider the interaction volume of the electron beam and the resultant X-ray generation, which limits the spatial resolution for collecting oxygen signals from those particles. Monte Carlo modelling in NIST DTSA-II was used to simulate the interaction volume of the characteristic X-rays of oxygen Kα in an Al
2O
3 bulk sample. The resulting X-ray generation volume was 15.9 μm
3. From this simulation, assuming a spherical interaction volume, the spatial resolution in EDS is sufficient for collecting the oxygen signal from Al
2O
3 particles larger than 3.2 μm in diameter. While oxygen signals were detected in particles smaller than 3.2 μm in diameter, it must be noted that this signal may also be from material outside of the particles and higher spatial resolution techniques will be required for a more accurate determination. It should be noted that all of these smaller particles, unlike the larger ones, showed clearly enhanced Mg and Si signals in addition to oxygen. This combination of aluminum, magnesium, silicon, and oxygen may suggest the presence of a magnesium aluminosilicate phase; however, further investigations would be required to confirm the crystallographic identity of this phase. There was no noticeable difference in the small black particles among the three depositions; the size, shape, and distribution were all similar.
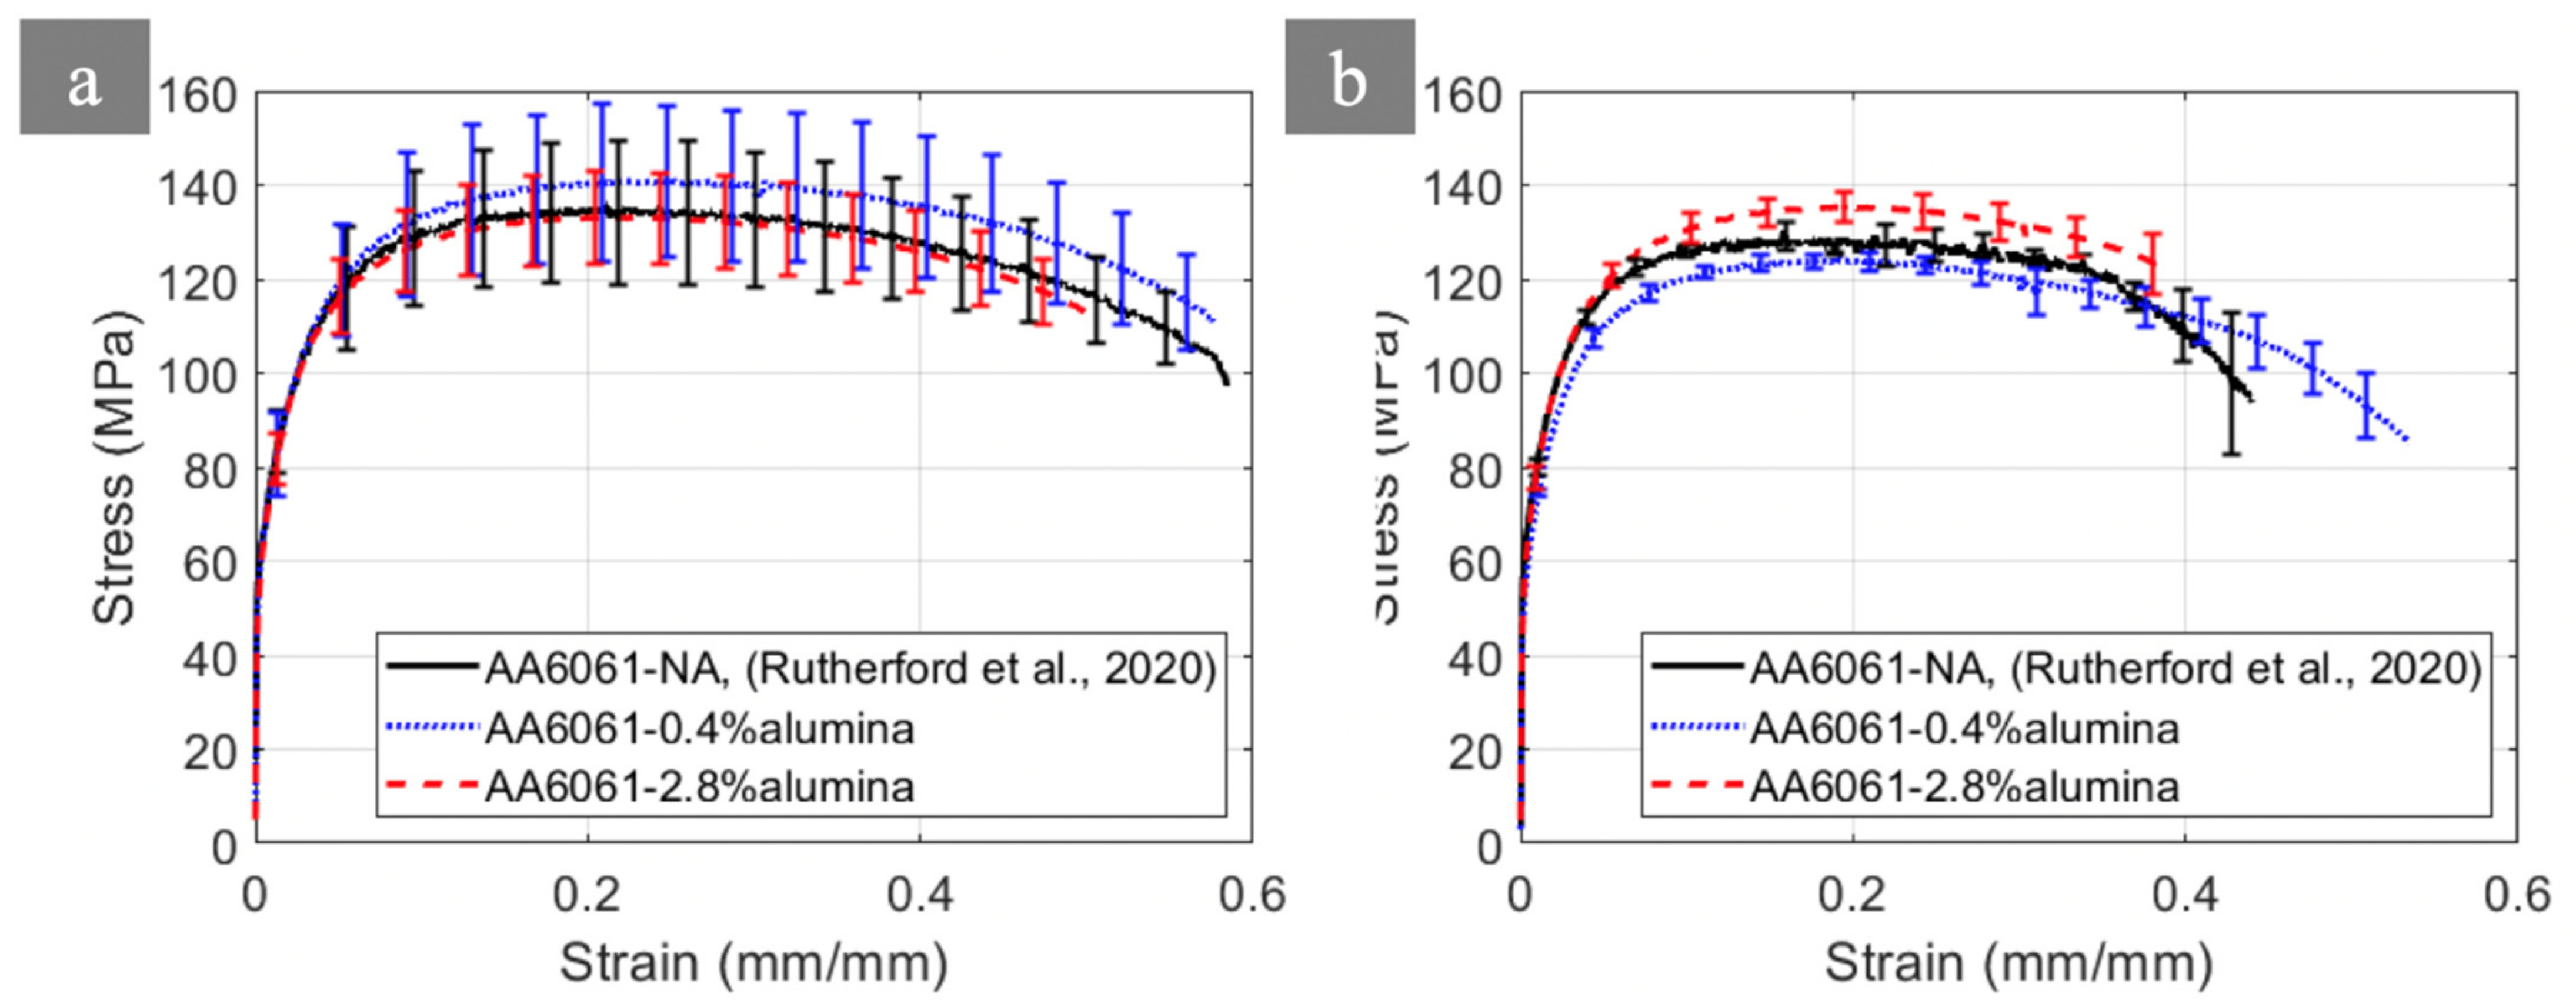
The tensile properties of the two depositions produced by anodized feedstock (red and blue curves) yielded similar tensile behavior to the non-anodized feedstock material depositions presented by Rutherford et al. [
11], shown in
Figure 9. The YS and UTS did not measurably change as a function of the feedstock-type. The average UTS of the three depositions in the longitudinal direction were between 134 and 144 MPa, and in the build direction were from 125 to 136 MPa (
Table 2). The elongation-to-failure did decrease somewhat with increased volume fraction of alumina in the depositions. Note that
Figure 9 shows the stress-strain curves until a 40% reduction from the maximum stress was reached. As the volume of alumina increased in the depositions, the average elongation-to-failure was decreased from 68% to 55% in the longitudinal direction and decreased from 60% to 43% in the build direction (
Table 2).
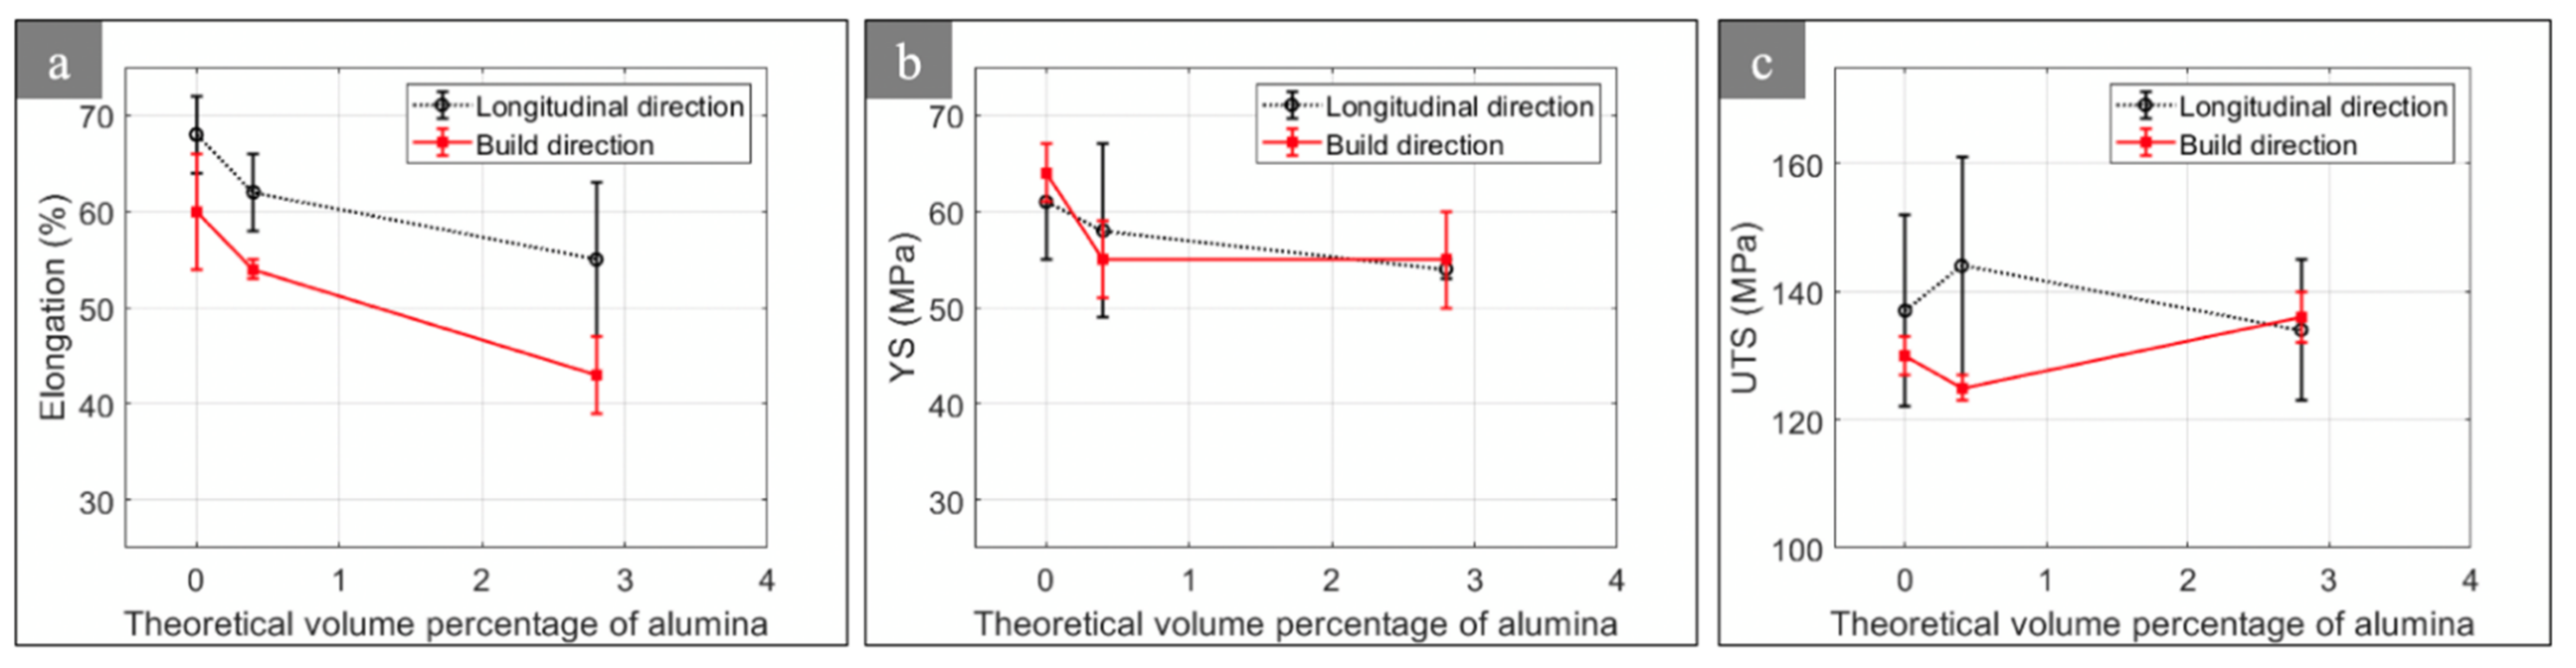
The elongation to failure of AFS-D builds was larger in the longitudinal direction than the build direction, but the YS and UTS did not show such a correlation (
Figure 10). For the three AFS-D builds with different volume fractions of alumina (0%, 0.4%, and 2.8%), elongation to failure in the longitudinal direction was consistently about 10% higher than in the build direction. The UTS did not show an appreciable change between the longitudinal direction and the build direction. The UTS in the longitudinal direction was slightly larger than the build direction in the depositions with 0% and 0.4% of alumina. However, in the deposition with 2.8% of alumina, the UTS is almost the same (134 vs. 136 MPa). In each deposition, the measured UTS in the build direction had less variation (standard deviation of 4 MPa), compared to a standard deviation of 14 MPa in the longitudinal direction.
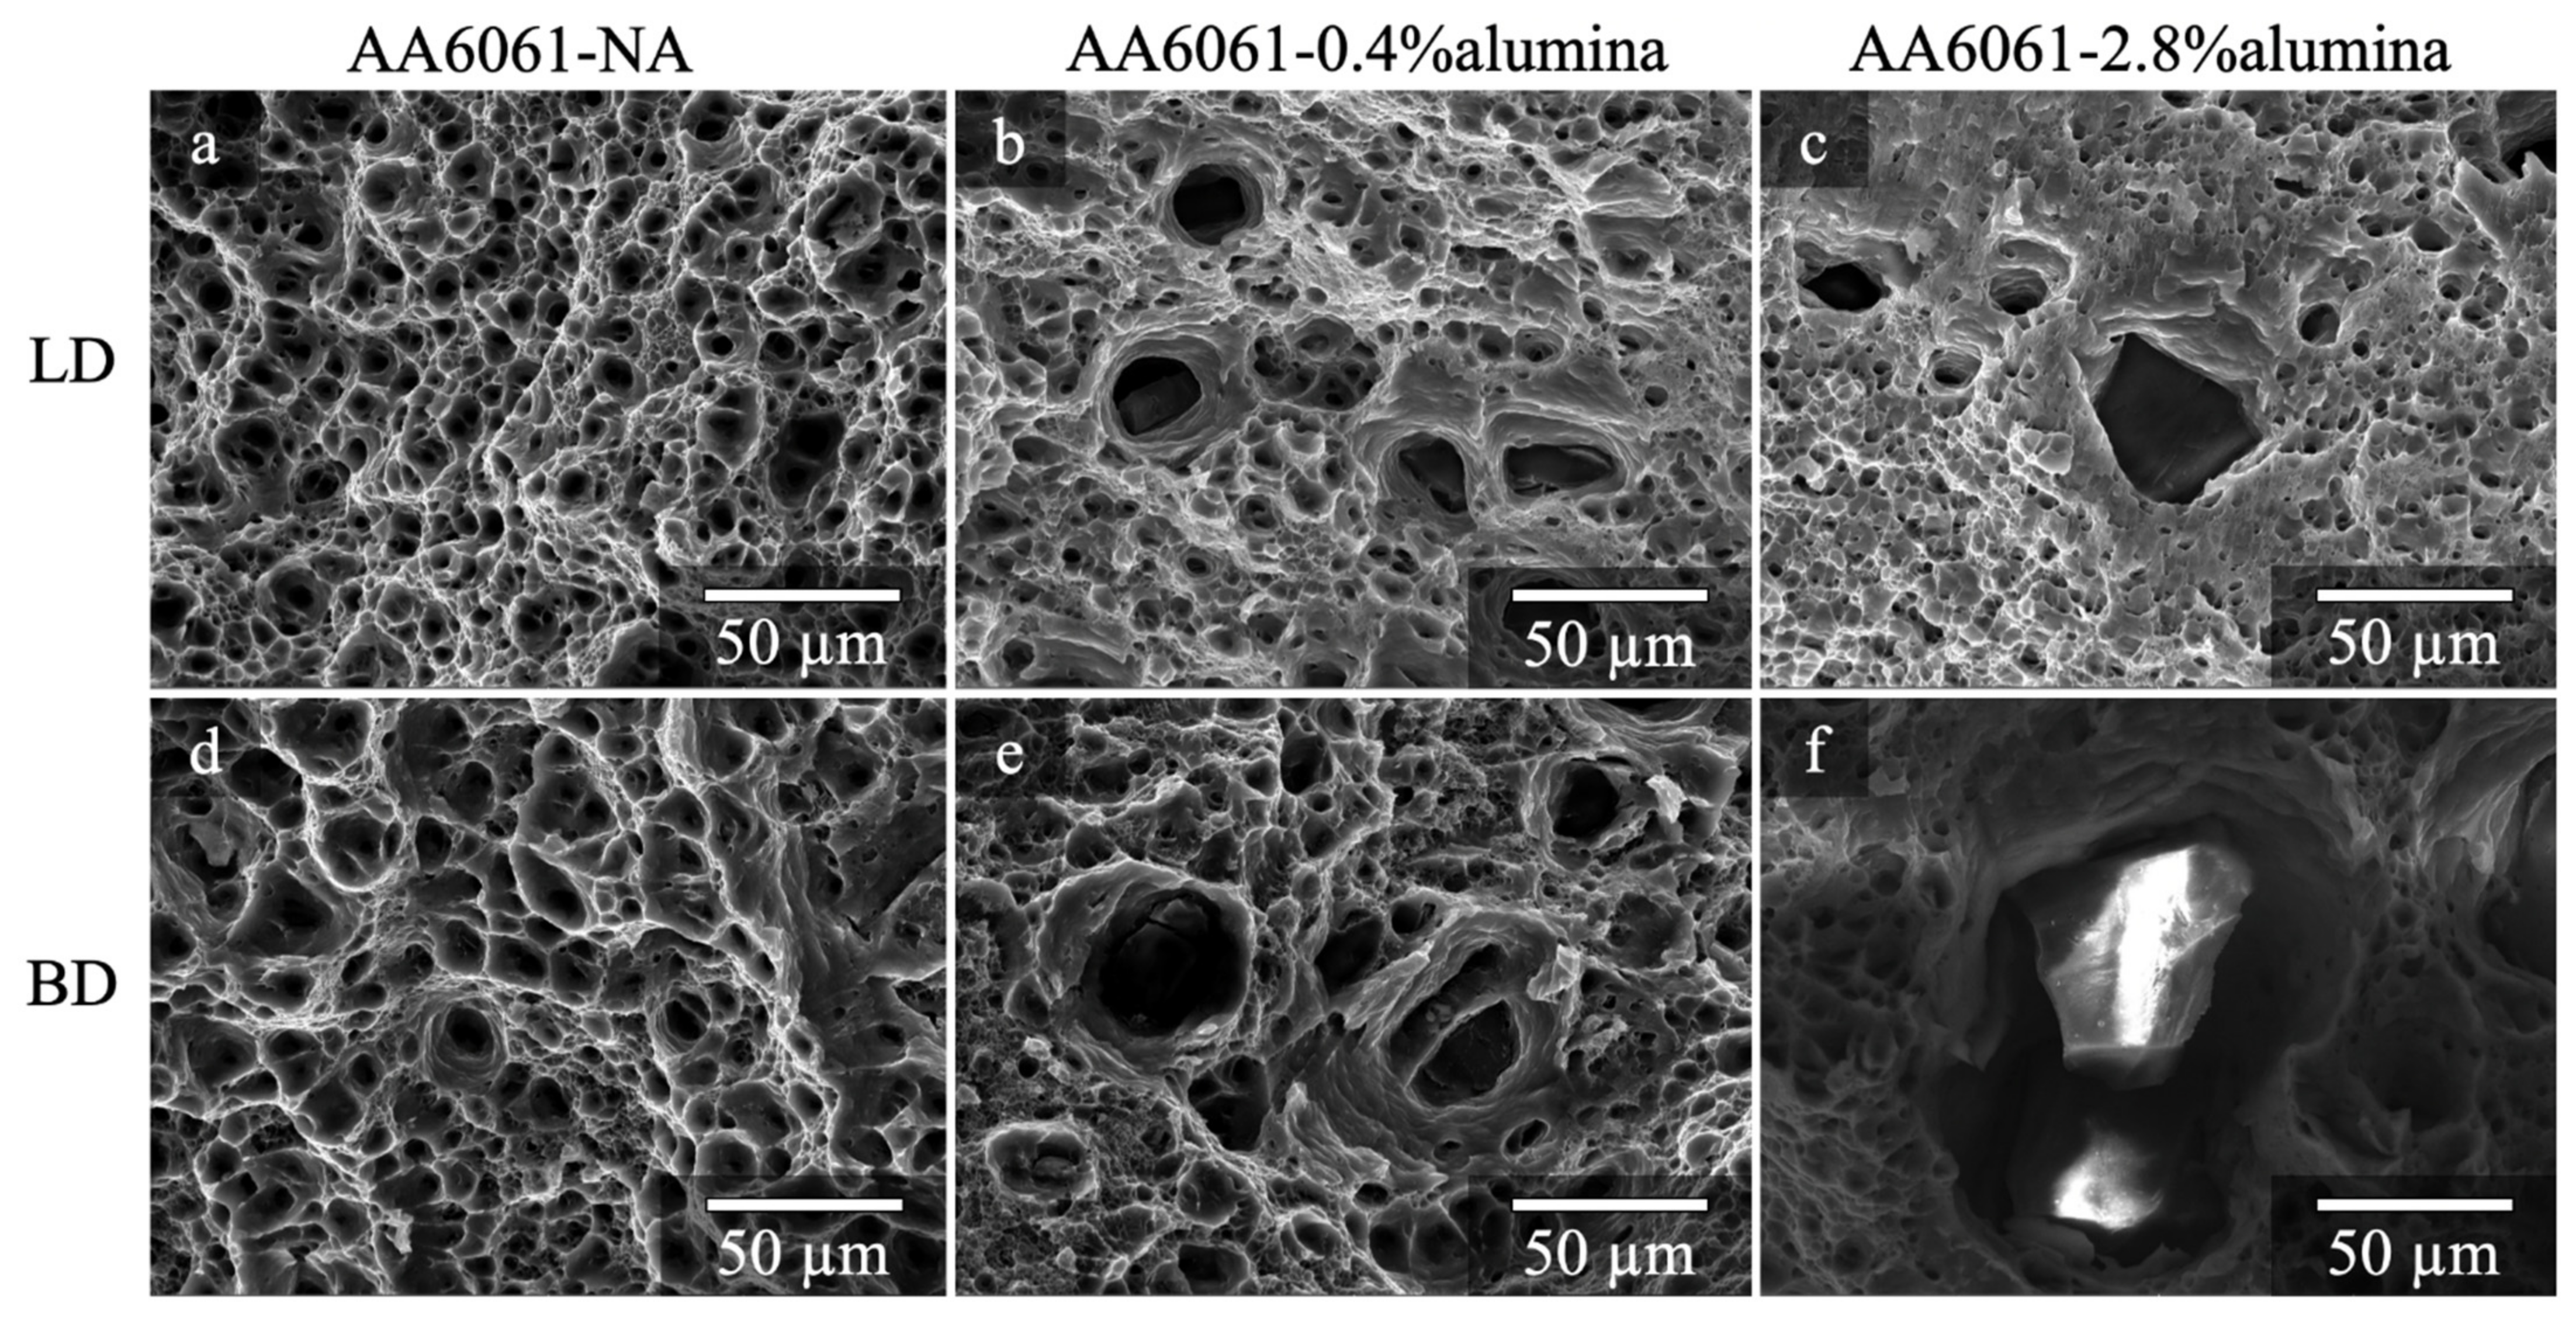
Ductile fracture was the main failure mechanism observed in both the longitudinal directions (LD) and build directions (BD) for all the three depositions. Extensive microvoids coalescence was observed on the fracture surfaces of all samples (
Figure 11). The size of microvoids increased with increasing percentage of alumina in the depositions. Large alumina particles can clearly be seen within the large voids on the fracture surface of the AA6061-2.8%alumina deposition (
Figure 11c,f). More microvoids per unit area were observed in the longitudinal direction (
Figure 11a–c) than the build direction (
Figure 11d–f) in all three depositions.
4. Discussion
This study answered the concern that oxide layers on the surface of the AFS-D feedstock bars do not measurably increase or decrease the strength of the deposited material. The tensile results from the AFS-D deposits clearly show that the level of difference in strength between non-anodized and anodized feedstock materials is within the scatter of the measurements (
Figure 10b,c). Furthermore, the variation in strength in the build direction is barely measurable. For comparison, other researchers have found that the addition of aluminum oxides/alumina would increase the strength of friction stir welded aluminum alloys compared to the welds without alumina. In the study of friction stir welded AA6061 from Singh et al., an addition of theoretical 3 vol.% of Al
2O
3 particles effectively increased the hardness, YS, and UTS in the nugget zone [
19,
20,
21]. Tashkandi et al. showed increased UTS of friction stir welded AA6061 from the addition of 2–6 vol.% of alumina particles [
22]. The increase of hardness of friction stir welded aluminum alloys with reinforcement particles was widely observed: Mazaheri et al. showed increased hardness of A356 with different sizes of Al
2O
3 particles after FSW [
23]; Panaskar and Sharma showed increased hardness in friction stir processed aluminum with nanometer-scale (<50 nm) alumina [
24]; in the study from Singh et al. [
19], the microhardness in the nugget zone was effective increased with increasing the amount of Al
2O
3 particles in the AA6061 after FSW; in the other research from the same group, such increased hardness in the nugget zone was also observed by using TiO
2 as the reinforcement material [
20]. In those studies, the alumina particle size was either in nanometers [
19,
20,
21,
23,
24] before FSW or refined from 25–63 µm to less than 10 µm (as observed from micrographs) [
22,
23] after FSW. In both cases, the small alumina particles in the friction stir welds served as dispersed, second phase particles that pinned the grain growth and increased the sub-grain boundary strengthening (Hall–Petch relationship) in the aluminum alloys after FSW [
25], also known as the Zener pinning effect introduced by Rohrer [
26]. Such a correlation between particle size and material strength was not observed in the current AFS-D AA6061 deposits because of some relatively large alumina particles in the deposits (
Figure 11). The larger, observed alumina particles in the AFS-D deposit is likely for two major reasons. First, the initial alumina in this research was not micro-sized particles but was in the form of oxide layers around the feedstock bars. The thickness of those layers was 9.8 and 68 µm, respectively, but the length of those layers was much larger, scaling with the dimensions of the square feedstock bars with a side length 9500 µm, or 9.5 mm. Second, the parameters of the AFS-D process had a higher traverse speed (
V) and a lower rotational speed (
ω) as compared to the FSW process: the weld pitch (
V/ω) in the AFS-D was 0.42 mm/RPM compared to 0.013–0.125 mm/RPM in all the FSW studies discussed above. Low weld pitch in FSW allowed for more stir interaction time between the tool pin and the substrate embedded with alumina particles, thus potentially generating a smaller alumina particle size. Although there is no improvement of the mechanical strength in the AFS-D AA6061 deposit with additional alumina, there was also no observed degradation in strength, as the measured level of difference in strength was within the scatter of measurements.
In addition, there was no measured correlation between the amount of alumina in the AFS-D AA6061 deposits and the measured strength of the deposited material. The volume percentage (vol.%) of alumina for the two AFS-D deposits with anodized coatings was between 0.4% and 2.8%, but the measured yield and ultimate tensile strengths in those deposits were not measurably different (
Figure 10b,c). Similar results were also found in friction stir welded aluminum alloys with a low volume fraction of alumina (<6 vol.%): the YS and UTS did not consistently increase with increasing the amount of alumina. In the research of friction stir processed AA6061 with added Al
2O
3 (initial particle size: 40–50 nm), the YS increased from 172.7 to 184.5 MPa with increasing the Al
2O
3 amount from 2 to 4 vol.%, but then sharply decreased to 129.2 MPa with 6 vol.% of Al
2O
3 [
27]. In another research of friction stir welded AA6061 with added alumina particles (initial particle size: 25 µm), the UTS also increased at first with an increasing amount of alumina particles from 2 to 4 vol.% in the welds, but then the UTS decreased in the weld with 6 vol.% of alumina [
22]. In both studies, the maximum increase in strength, as compared to AA6061 plate without alumina, was observed for 4 vol.% alumina before decrease for loading of 6% or greater. In considering the strength of AA6061 material produced by AFS-D, one should also consider the other potential strengthening mechanisms. As FSW and AFS-D process raise the temperature of the material from the frictional heat, the nanoscale, strengthening precipitates (β”) in AA6061 were dissolved in the aluminum matrix revealed by transmission electron microscopy in AFS-D AA6061 from Phillips et al. [
8] and in friction stir welded AA6061 from Feng et al. [
28], thus reducing the strength of the material as compared with wrought plate. If fine enough, alumina particles could contribute to added strength through grain and substructure strengthening and Orowan strengthening, discussed in the review of metal matrix composites from Lloyd [
29] and validated with prediction models from Kim et al. [
30]. In future research, changes to the AFS-D parameter which increase the stir time for a given volume of material, could decrease the alumina particle size and possibly strengthen the material as observed from the FSW literature.
In contrast, the alumina coatings on the feedstock do decrease the ductility since the fragmented alumina particles in the AFS-D AA6061 deposits served as additional nucleation sites on the fracture surface (
Figure 11). The alumina particles present in the AFS-D deposits did not change the failure mechanism between materials, as all the samples clearly showed ductile rupture with microvoid coalescence (
Figure 11). The fractography images clearly show that the alumina particles on the fracture surface were fully embedded in the large voids without any fracture surfaces or cracks inside those alumina particles: the material failed either within the AA6061 matrix or along the boundaries between the matrix and the alumina particles. The presence of the alumina particles appears to generate few, larger microvoids. The decreased ductility of AFS-D AA6061-alumina deposits compared to the non-alumina AFS-D deposit could be attributed to the increased amount of fragmented alumina particles from the oxide layers. A larger amount of alumina particles would reduce the density of microvoids and further decrease the ductility. In the research on FSW of AA6061 from Pirondi et al., the addition of 20 vol.% of alumina particles decreased the elongation from 18% in the AA6061 welds to 4% in the AA6061-alumina welds [
31]. Parumandla and Kumar did not observe a constant increased mechanical strength in friction stir welded AA6061 with reinforcement particles, but the elongation was constantly decreased from 8.4% to 4.6%, as the Al
2O
3 amount increased from 2 to 6 vol.% [
27]. For a constant amount of alumina particles, a smaller average size of alumina particles could potentially increase the ductility. Gustafson et al. found the flow stress of AMCs with magnesium aluminate spinel was dependent on the metal ligament size while the reinforcement particles amount remained the same [
32]. In a related approach, Yang et al. used FSP to refine the size of alumina particles in initially cold sprayed AA2024-Al
2O
3, and they reported an increase in elongation [
33]. The research from Lee et al. on FSP of Si-reinforced aluminum revealed that elongation of welds constantly decreased from 27% to 6% as the amount of Si reinforcement particles increased from 12 to 34 vol.% with a similar average size (1.26 to 1.51 µm) [
34]. In a different study using B
4C reinforcement, decreasing the particle size from 83 to 9.3 µm with a similar volume percentage of particles (51–58%) did improve the AMC elongation from 1.5% to 3% [
35]. This correlation was not observed in the AMC with Al
2O
3 as the reinforcement particles in the same study. Finally, Li et al. also studied the impact of B
4C reinforcement, with a constant amount (20 wt.%) and a similar size (between 5 and 6 µm) of the reinforcement particles, and they did not observe a meaningful change in the elongation (4.3% to 4.7%) [
36].
The AFS-D process caused multiple fragmentations to the alumina coatings on the feedstock bars into micro-size alumina particles, resulting in a median particle size of 1.8 and 3 μm
2, respectively. The large, irregular alumina particles were uniformly distributed in the AFS-D builds without any agglomeration (
Figure 4,
Figure 5 and
Figure 6). Griffith et al. also observed a uniform distribution of reinforcement particles (silicon carbide) using the same AFS-D process but with metal powders as the feedstock material [
17]. In the current study, the oxygen signal shown in the EDS spectra positively identified the larger black particles as alumina (
Figure 6). Those alumina particles did not show a preferential shape, such as circular or square. Such irregular-shaped reinforcement particles have also been observed in friction stir welded AA6061 with SiC from the review of Gan et al. [
37] and in friction stir welded AA6061 with 20 vol.% of Al
2O
3 particles from Marzoli et al. [
38]. If these larger particles were produced by a simple, single fragmentation event during AFS-D, then the largest possible width of those alumina particles would be the thickness of the oxide layers (9.8 and 68 μm) on the feedstock bars. Assuming square-shaped alumina particles, the largest possible cross-sectional area would be 96 and 4624 μm
2, respectively. From our stereology, 95% of the alumina particles were smaller than 96 μm
2 in the AA6061-0.4%alumina deposition (
Figure 7a), and 99.9% of the alumina particles were smaller than 4624 μm
2 in the AA6061-2.8%alumina deposition (
Figure 7b). Based on this observation, the AFS-D process seems to refine the particles through multiple fragmentations. This multi-fragmentation in AFS-D is likely from the stirring action of materials beneath the shoulder surface, with applied frictional force from the rotating and plunging tool shoulder. In a similar way, studies from Yang et al. [
33] and Hodder et al. [
39] suggested that the FSP could effectively refine the size of Al
2O
3 particles in the cold sprayed aluminum deposits.
In the AFS-D builds, there are a few alumina particles with a particular larger size indicates those particles were likely being fragmented only once during the friction stirring process. Those largest alumina particles with a length larger than the thickness of the anodized layer, were rectangular in shape with a width limited by the upper scale of the original thickness of the anodized layer. Approximately, there were 5% and 0.1% of those particles in AA6061-0.4%alumina deposition and AA6061-2.8%alumina deposition, respectively, and they could be clearly observed in the fractography images (
Figure 11). In the AA6061-2.8%alumina deposition, the largest alumina particle (10,100 μm
2) was rectangular with the width around 80 μm (upper scale of the anodized layer thickness) and the length around 130 μm. A similar observation was found in the AA6061-0.4%alumina deposition, for which the largest particle (528 μm
2) had a rectangular shape with a width around 17 μm and a length around 31 μm. Those large alumina particles were likely to be fragmented only once during the AFS-D process, which resulted in a rectangular shape with the length larger than the original thickness of the anodized layer. However, those large rectangular alumina particles were less than 5% of the total particles observed in both builds.
The data in this paper also indicates a second population of smaller, more complex oxides in the AFS-D AA6061 builds. EDS spectra exhibited enhanced oxygen, magnesium, and silicon signals on those particles comparing to the aluminum matrix, which suggest, that these smaller particles have a more complex composition, and are likely not alumina (
Figure 8). Similar, small particles were observed in the wrought feedstock material, thus suggesting that the smaller particles were not generated by the AFS-D process. Further crystallographic investigation would be necessary to confirm that smaller particles are indeed carried over from the wrought feedstock.
Given these results, one might consider AFS-D as a solid-state means of producing AMCs. This paper is the first work using AA6061 feedstock bars with anodized alumina layers to produce consolidated AMCs via AFS-D. The optimized AFS-D processing parameters for AA6061 from Phillips et al. [
8], also produced sound aluminum alloys depositions using anodized feedstock material. As previously described in the literature, AMCs produced from FSW can require laborious preparation: most of the reinforcement materials were nanoscale particles and substrates required pre-machining with grooves or drilled holes to load the reinforcement particles [
40]. In contrast, AFS-D has successfully produced AMCs by two approaches: previous work showed by Griffiths et al. [
17] using a continuous powder feeding system, and this work using the solid square-rods feeding system. In the paper from Griffith et al., the AFS-D system used powder feedstocks, which required fine meshed powders and a pre-mixture of matrix powders and reinforcement particles. The approach to AFS-D in this work used commercially available, solid square-rod feedstock (9.5 mm × 9.5 mm × 305 mm) with the alumina reinforcement material provided by anodization. Despite the simplicity and low-cost of the anodized feedstock approach, the current loading of the alumina reinforcement phase will need to be increased beyond 3 vol.% in order to achieve a higher level of composite strengthening. This increase in reinforcement loading must be balanced against any decrease in ductility. Future work will consider feedstock designs which balance these needs.


 ,
, 


