
Microstructural Evolution as a Function of Increasing Aluminum Content in Novel Lightweight Cast Irons

 , , , , ,
Abstract
:1. Introduction
2. Materials and Methods
2.1. Calculation of Equilibrium Phase Diagram
2.2. Materials Preparation
2.3. Microstructural and Elemental Characterization
2.4. Mechanical Characterization
3. Results and Discussion
3.1. Thermodynamic Equilibrium Phase Diagram of the Alloys
3.2. Alloy Composition and Microstructure of the Cast Samples
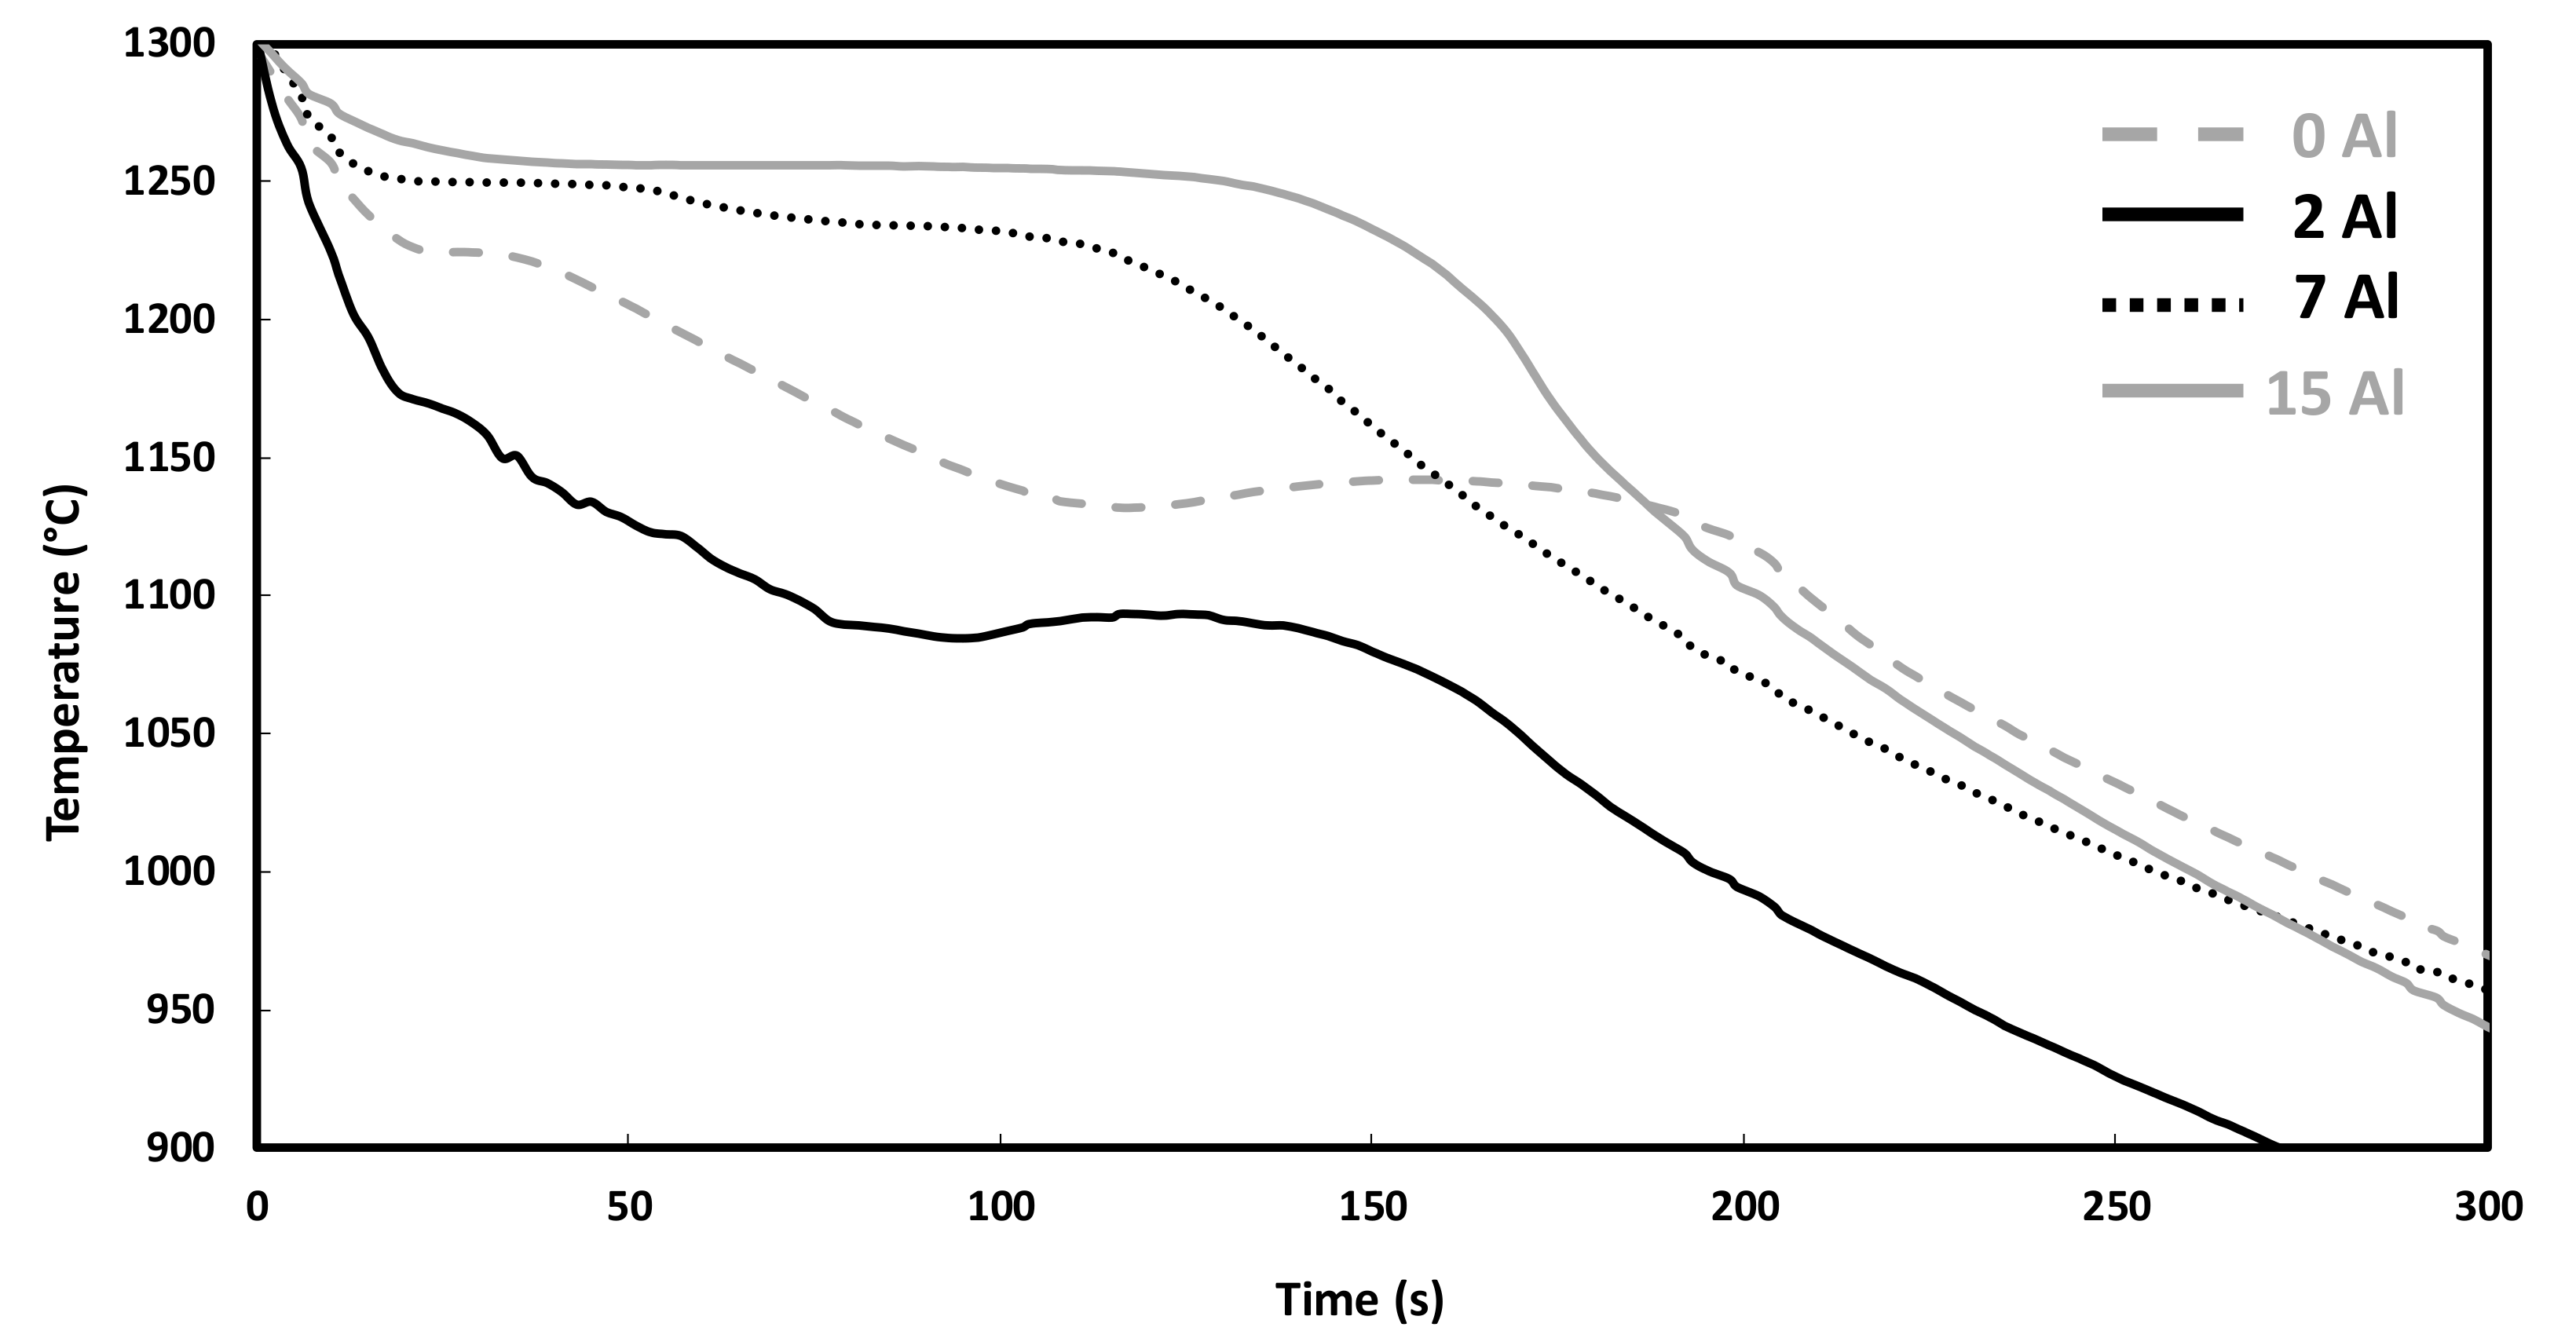
3.3. Analysis of the Cooling Curves
3.4. Hardness of the Samples
4. Conclusions
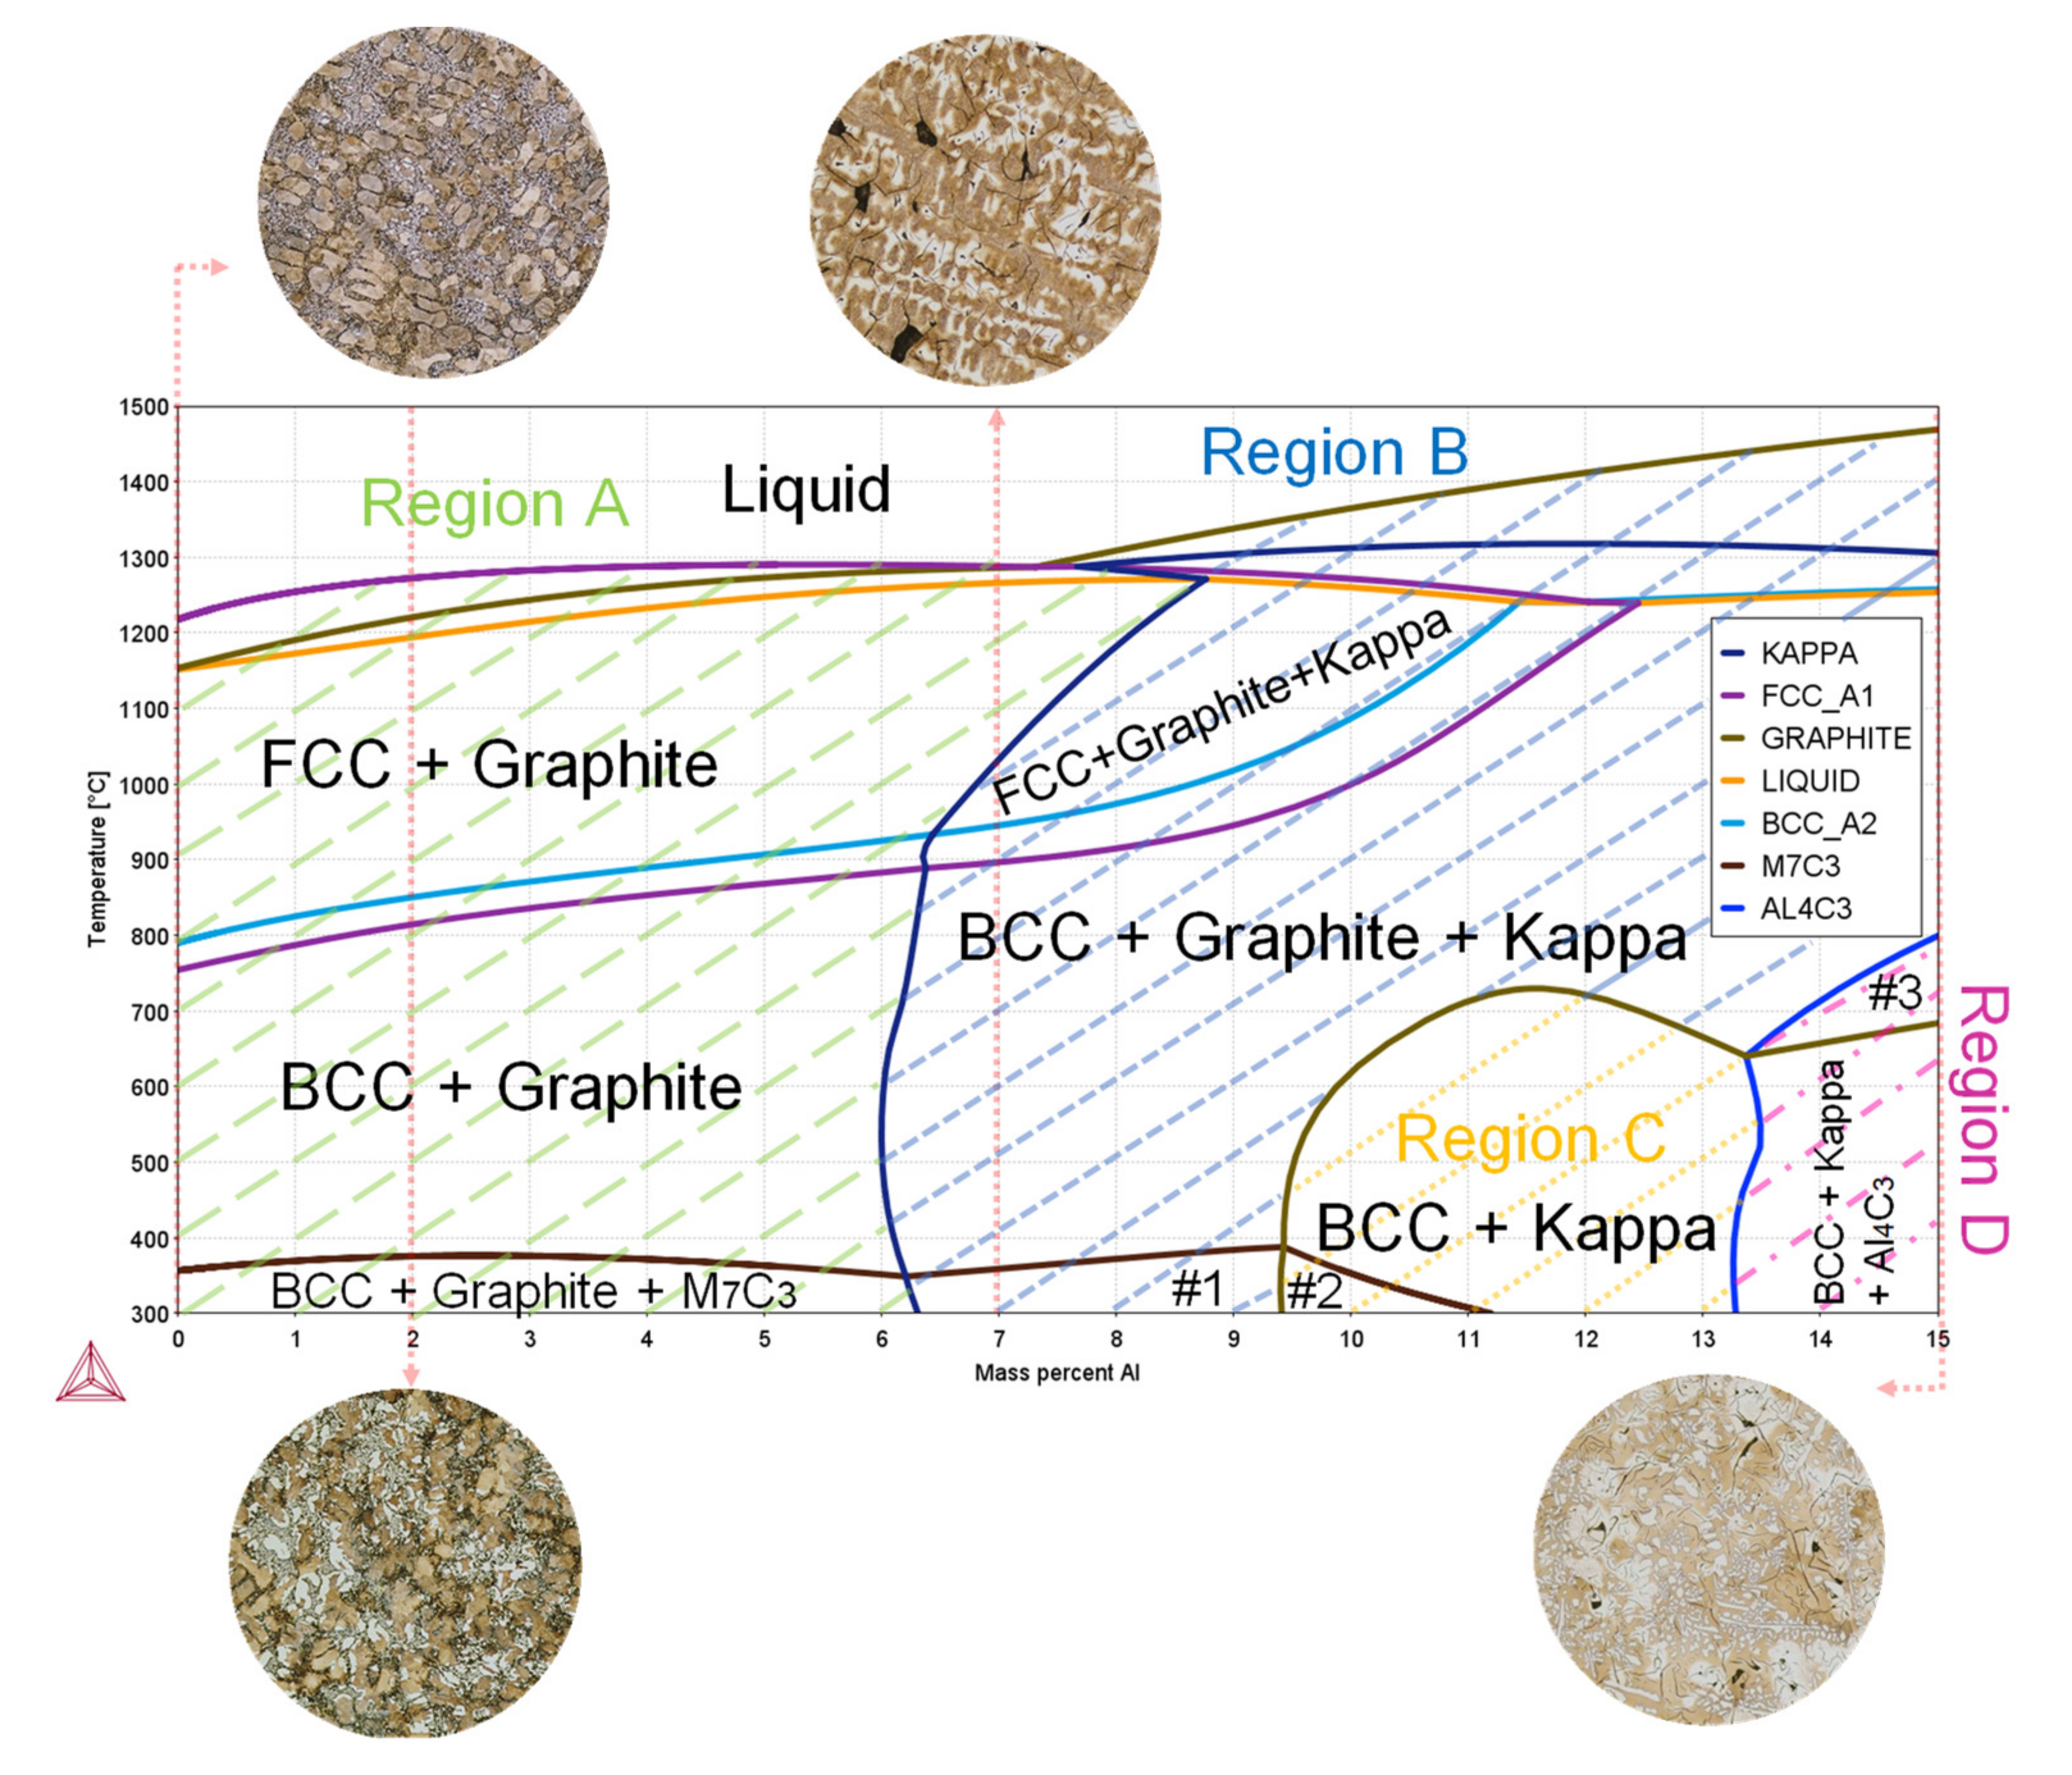
- The phase diagram of the alloys in function of the wt. % of Al can be divided in four regions in function of the stable phases. From the phase diagram, graphite is not expected to be in thermodynamic equilibrium over 9,4 wt. % Al at low temperatures (Region C and D). But the observed microstructures showed the formation of graphite, which means that thermodynamic equilibrium of 15-Al is over ~800 °C (Region B).
- From thermodynamic calculations, the increasing of the Al content also promotes the formation of M7C3, kappa-carbides and Al4C3 phases. Al4C3 carbides are in thermodynamic equilibrium when the amount of Al is over ~13 wt. %. Therefore, according to thermodynamic calculations, there is a limit as to where, in addition to Al4C3 phase, kappa-carbides are also stabilized.
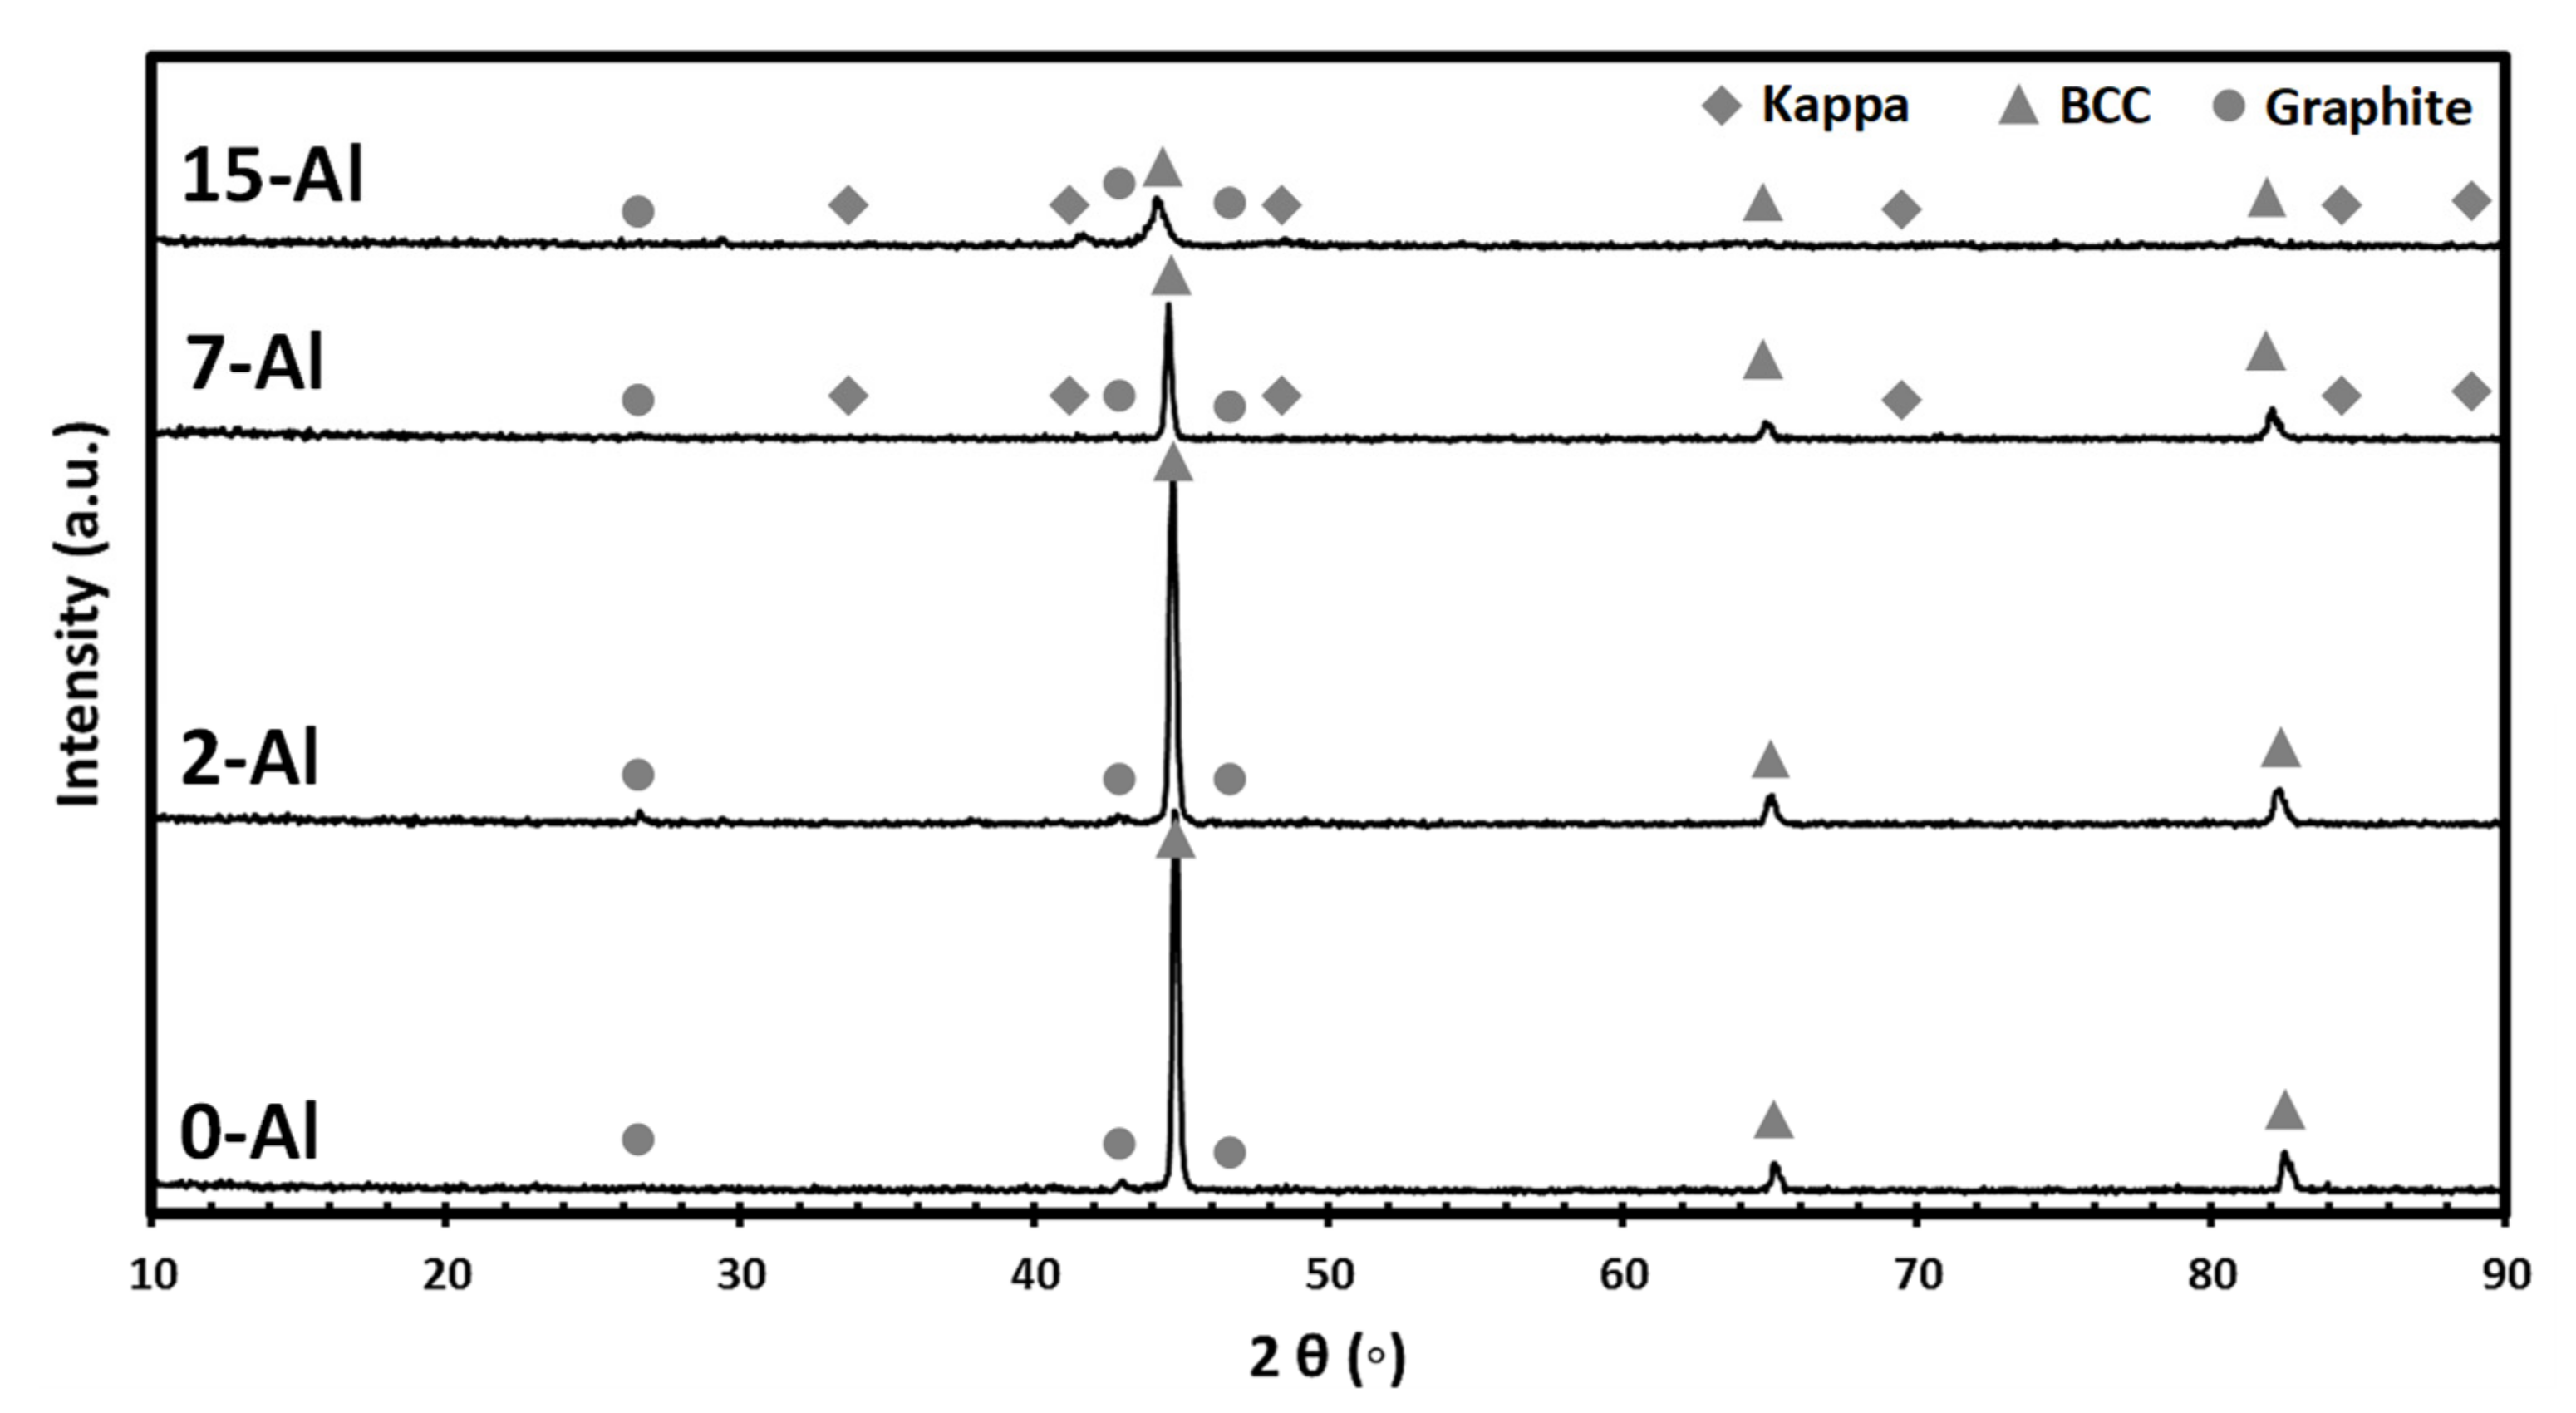
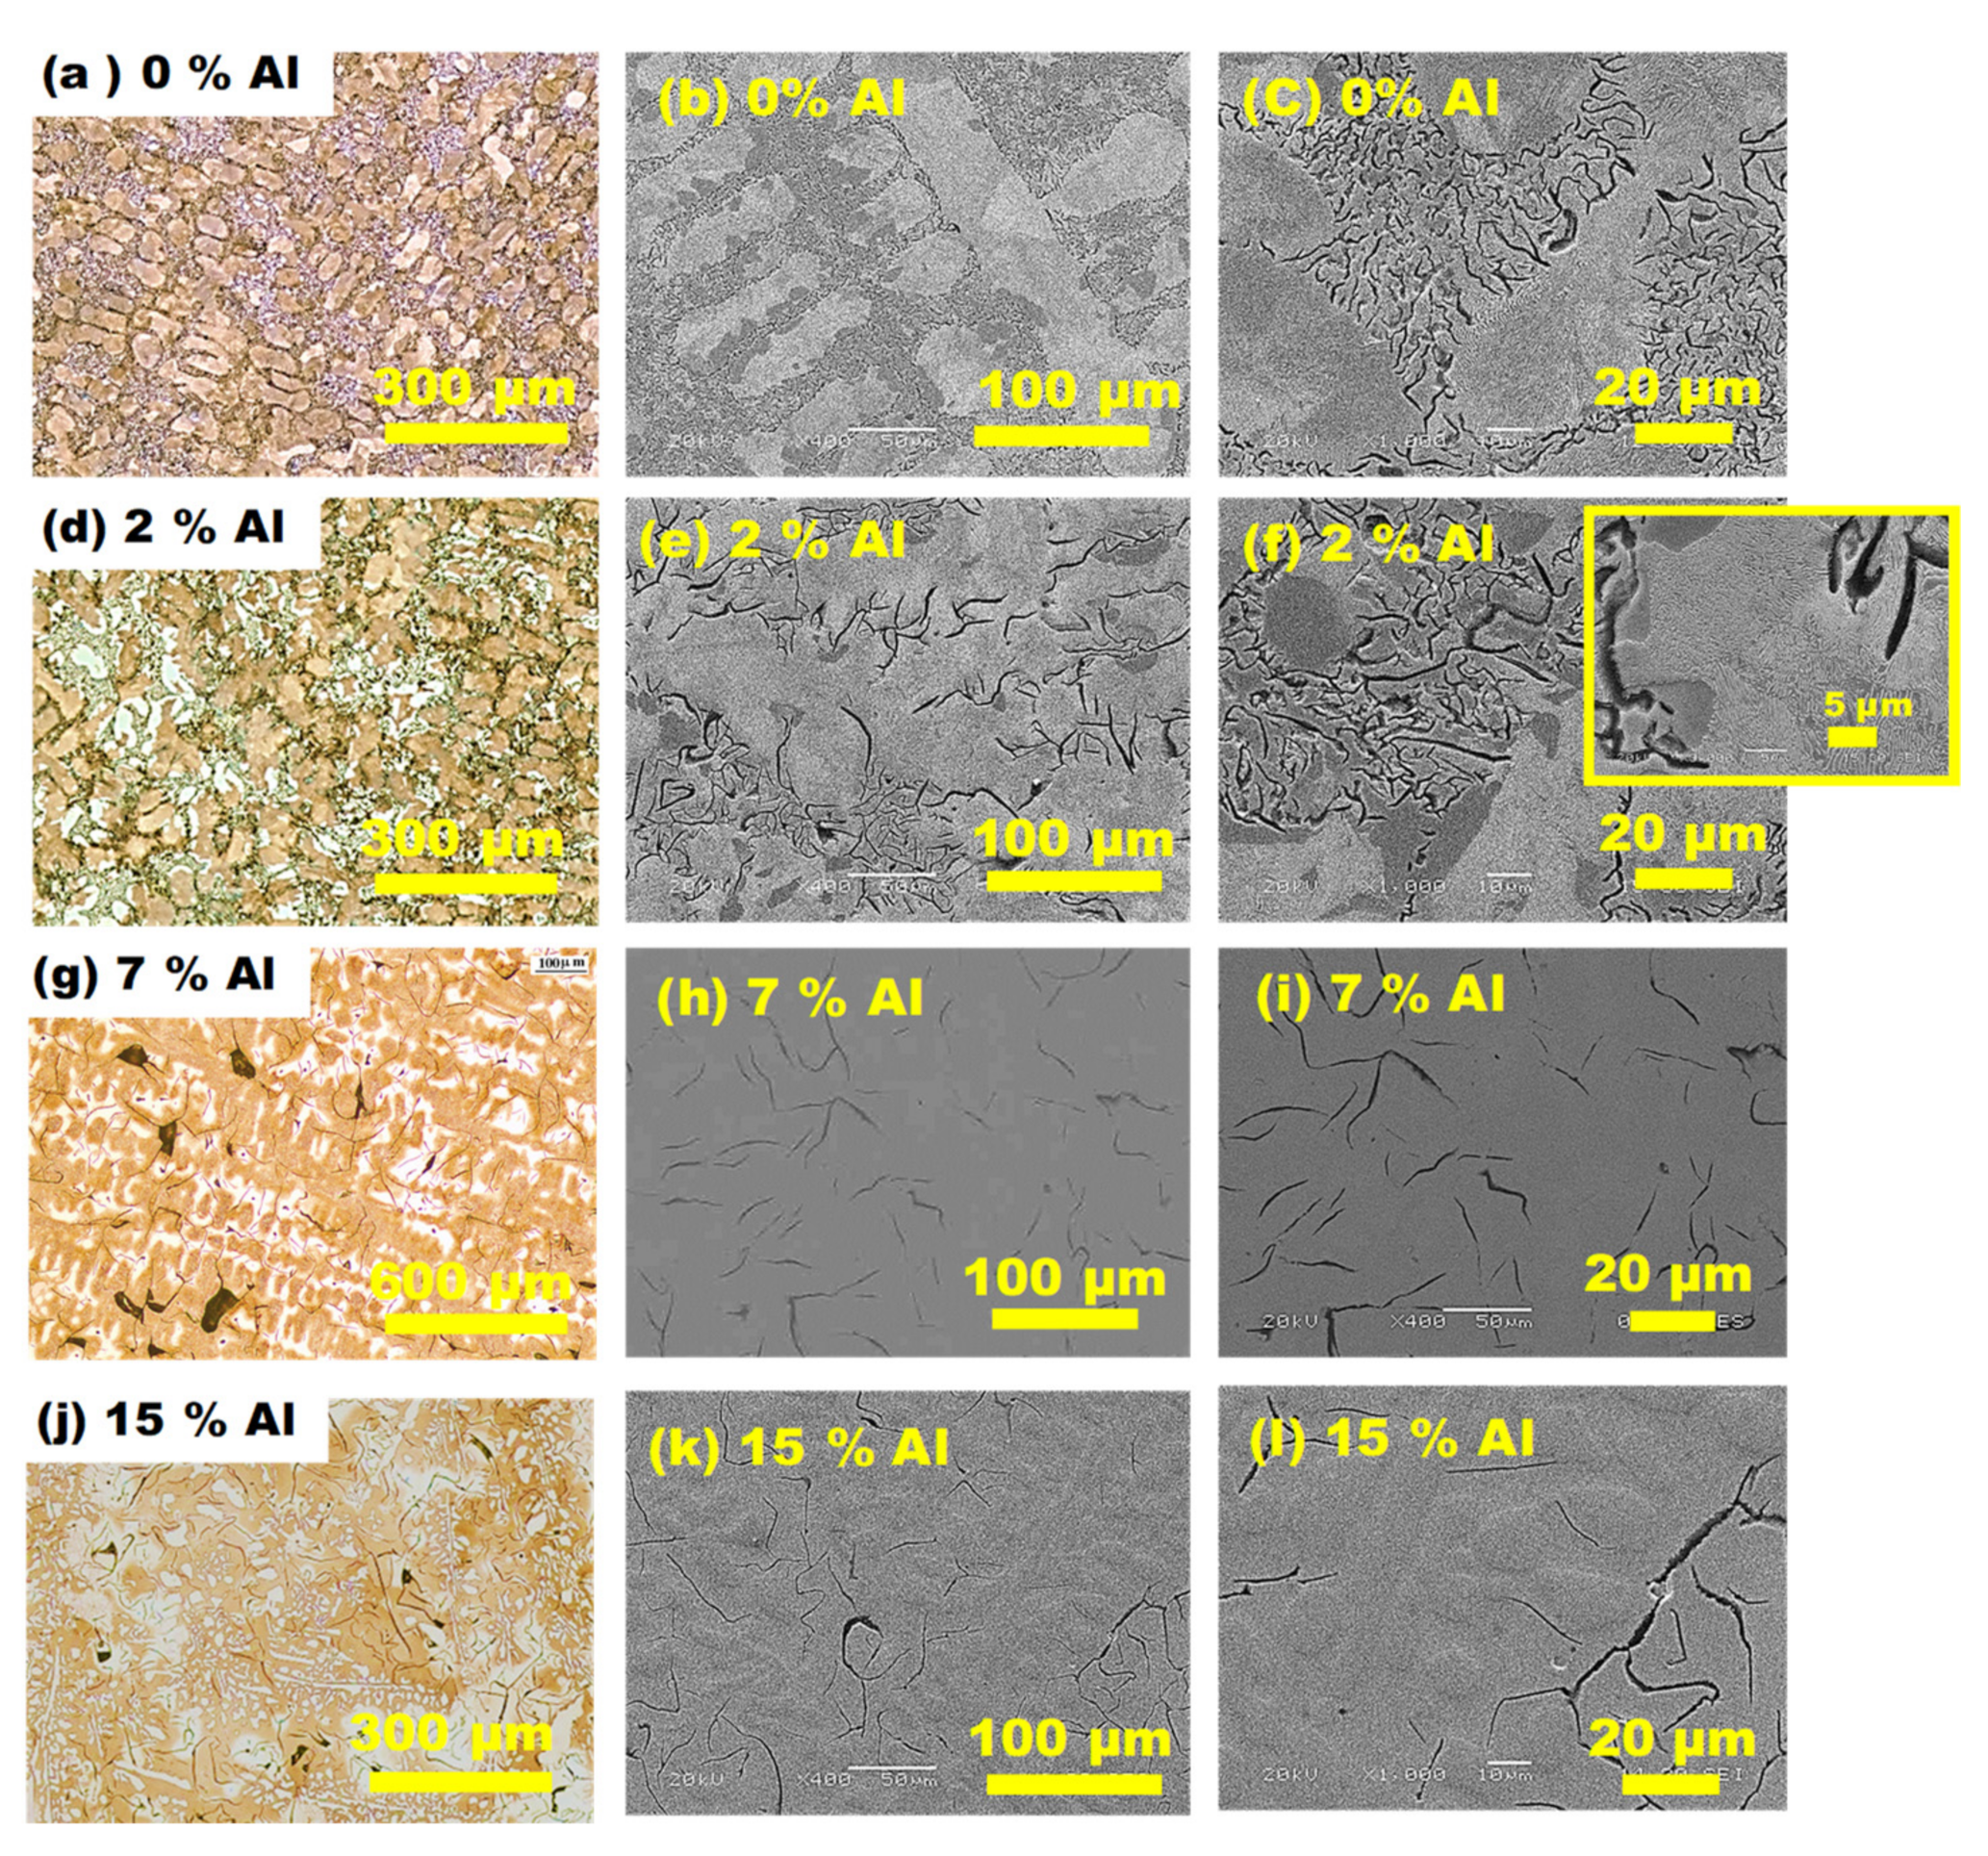
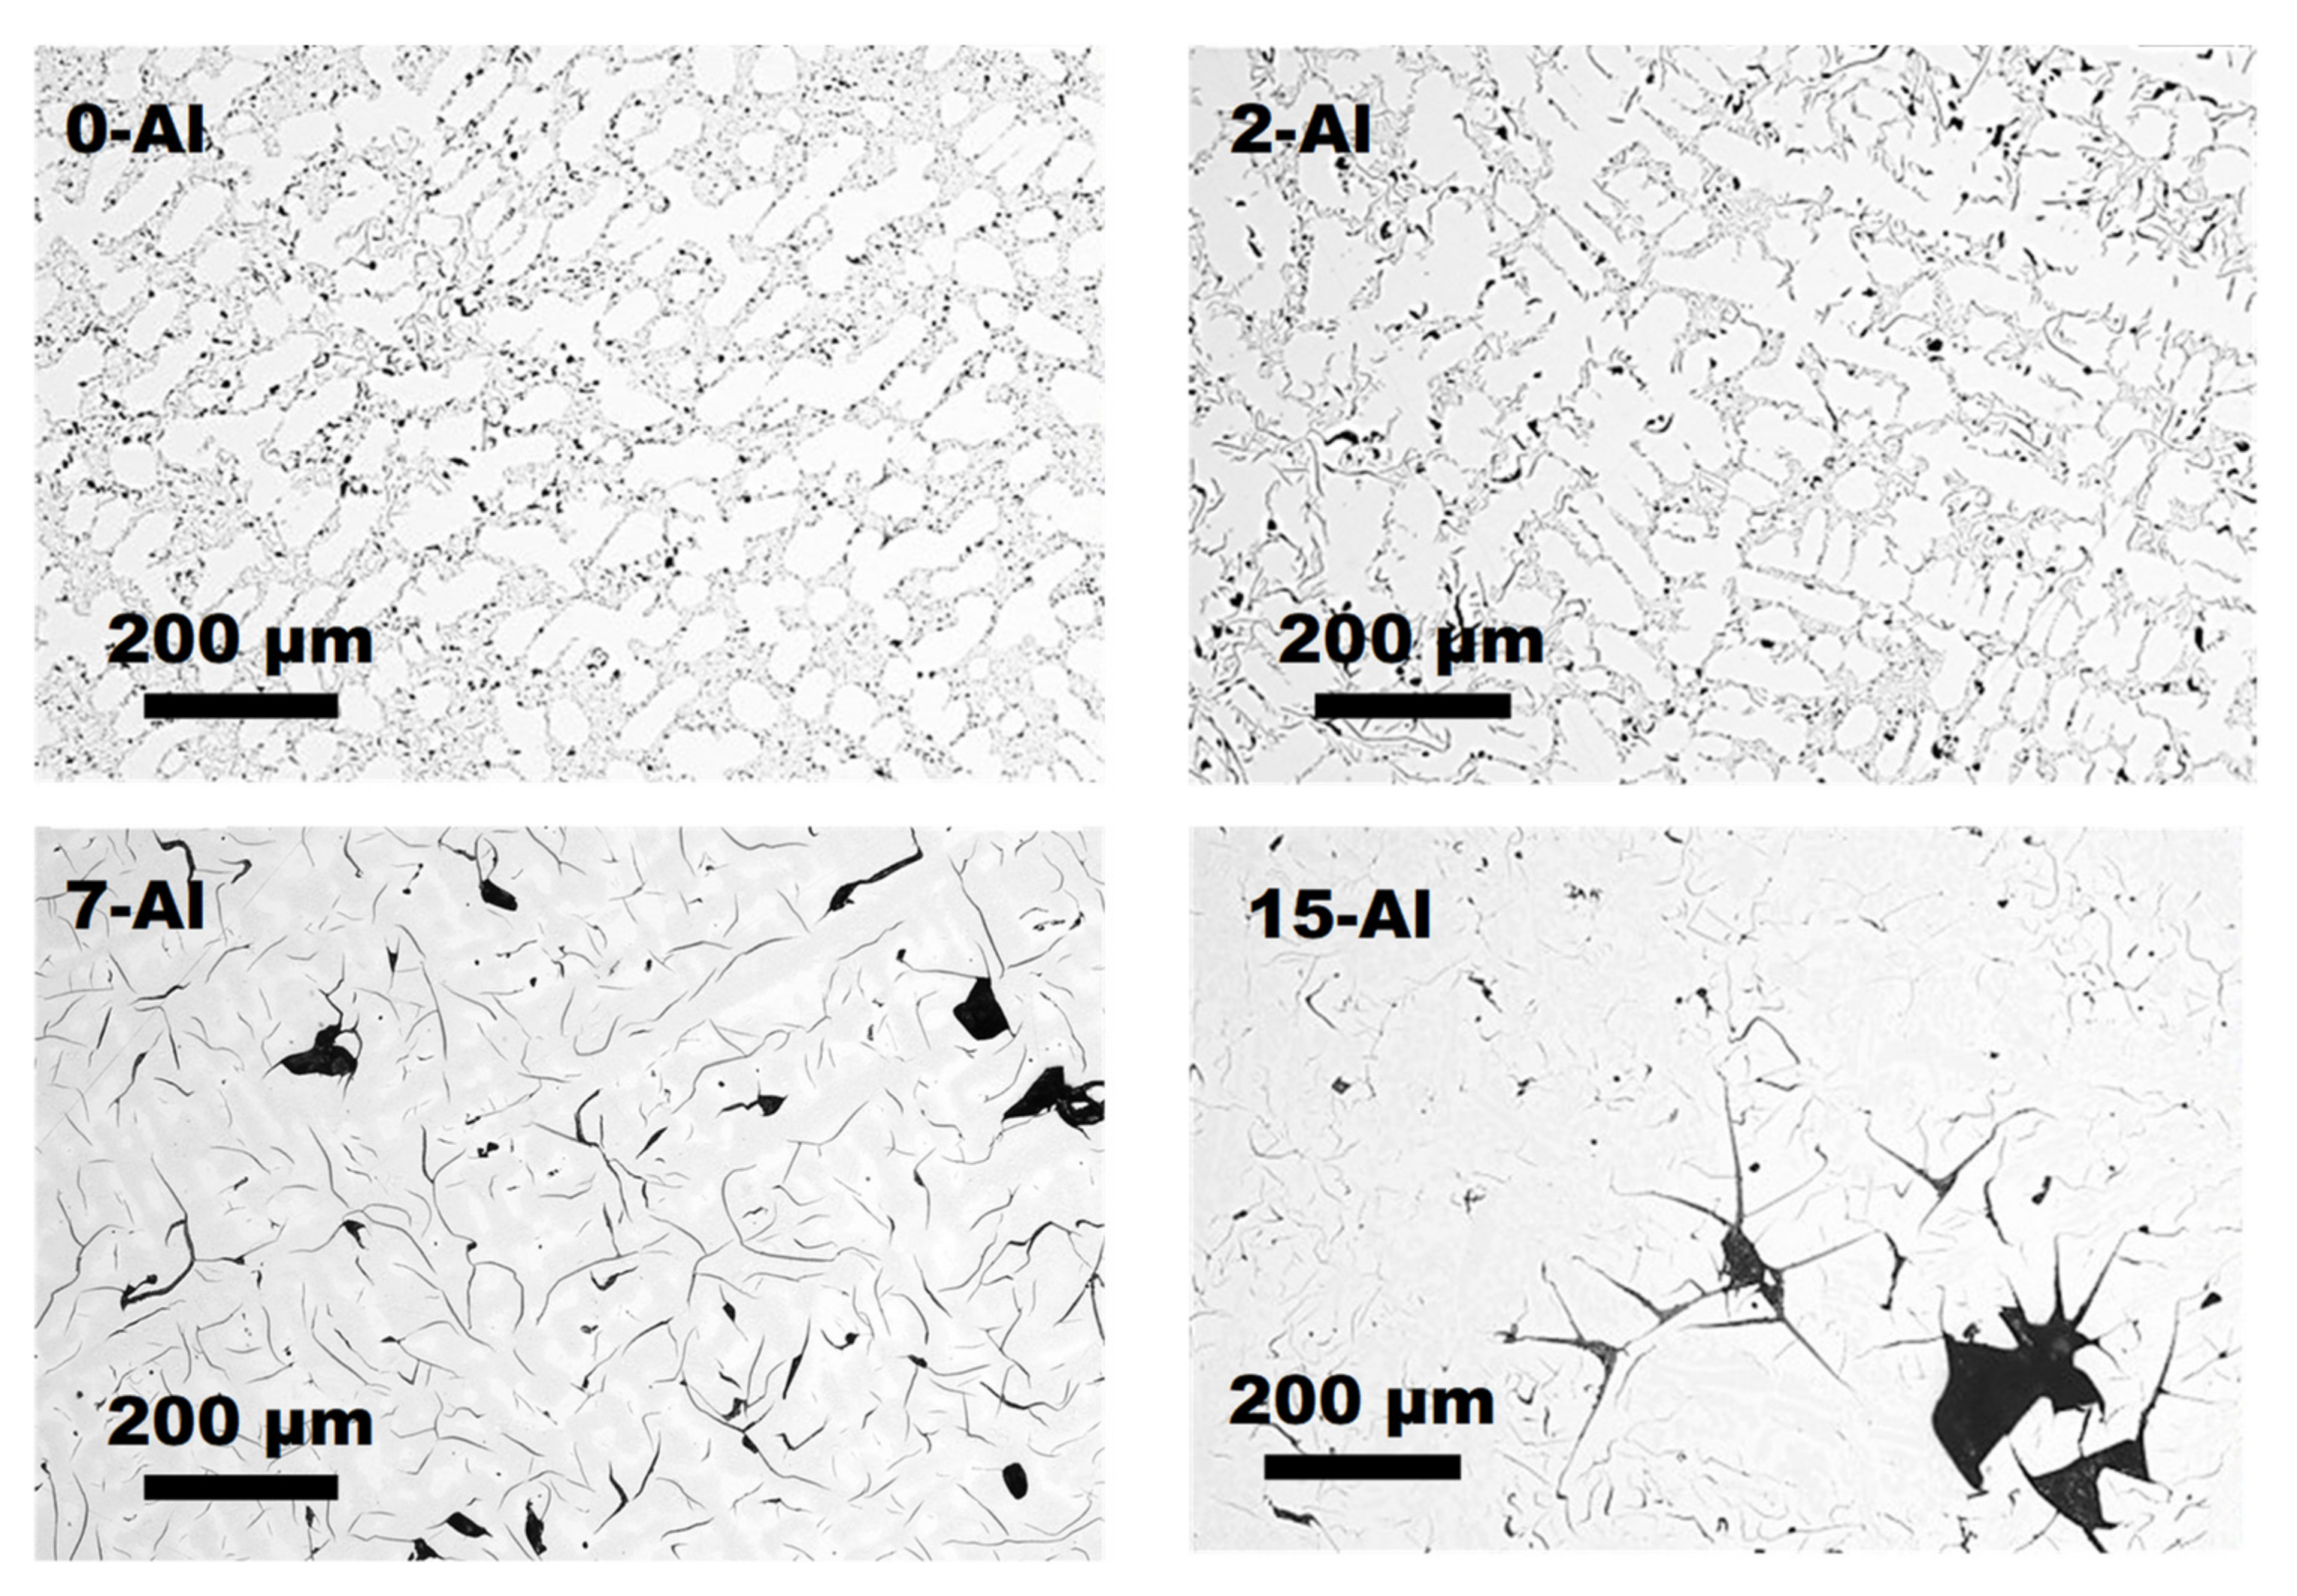
- The microstructure of 0-Al alloy is formed by a fine graphite flakes distributed in a pearlitic matrix, and a low fraction of ferrite. The microstructure of 2-Al alloy also shows a pearlitic matrix with ferrite, but “D”/“E” type distribution with overcooled graphite. The microstructure of 7-Al alloy is formed by a ferritic matrix with dispersed perlite. The graphite flakes show a large morphology that indicates the presence of primary graphite. The microstructure also shows the stabilization of kappa-carbides. The microstructure of 15-Al graphite shows a similar pattern to alloy containing 7 wt. %. Al, but the graphite shows coarser morphology.
- The microstructures show that the perlite content decrease with the increment of wt. % of Al. The opposite occurs with the ferrite. In the case of graphite, a slight increment occurs with 2 wt. % of Al, but a great decrease occurs until 15 wt. % of Al.
- The cooling curves of the studied cast irons shows that recalescence is not observed in 7-Al cast iron. The solidification changes from a hypoeutectic to a eutectic behavior, with a recalescence that remains stable at the eutectic temperature in 15-Al cast iron.
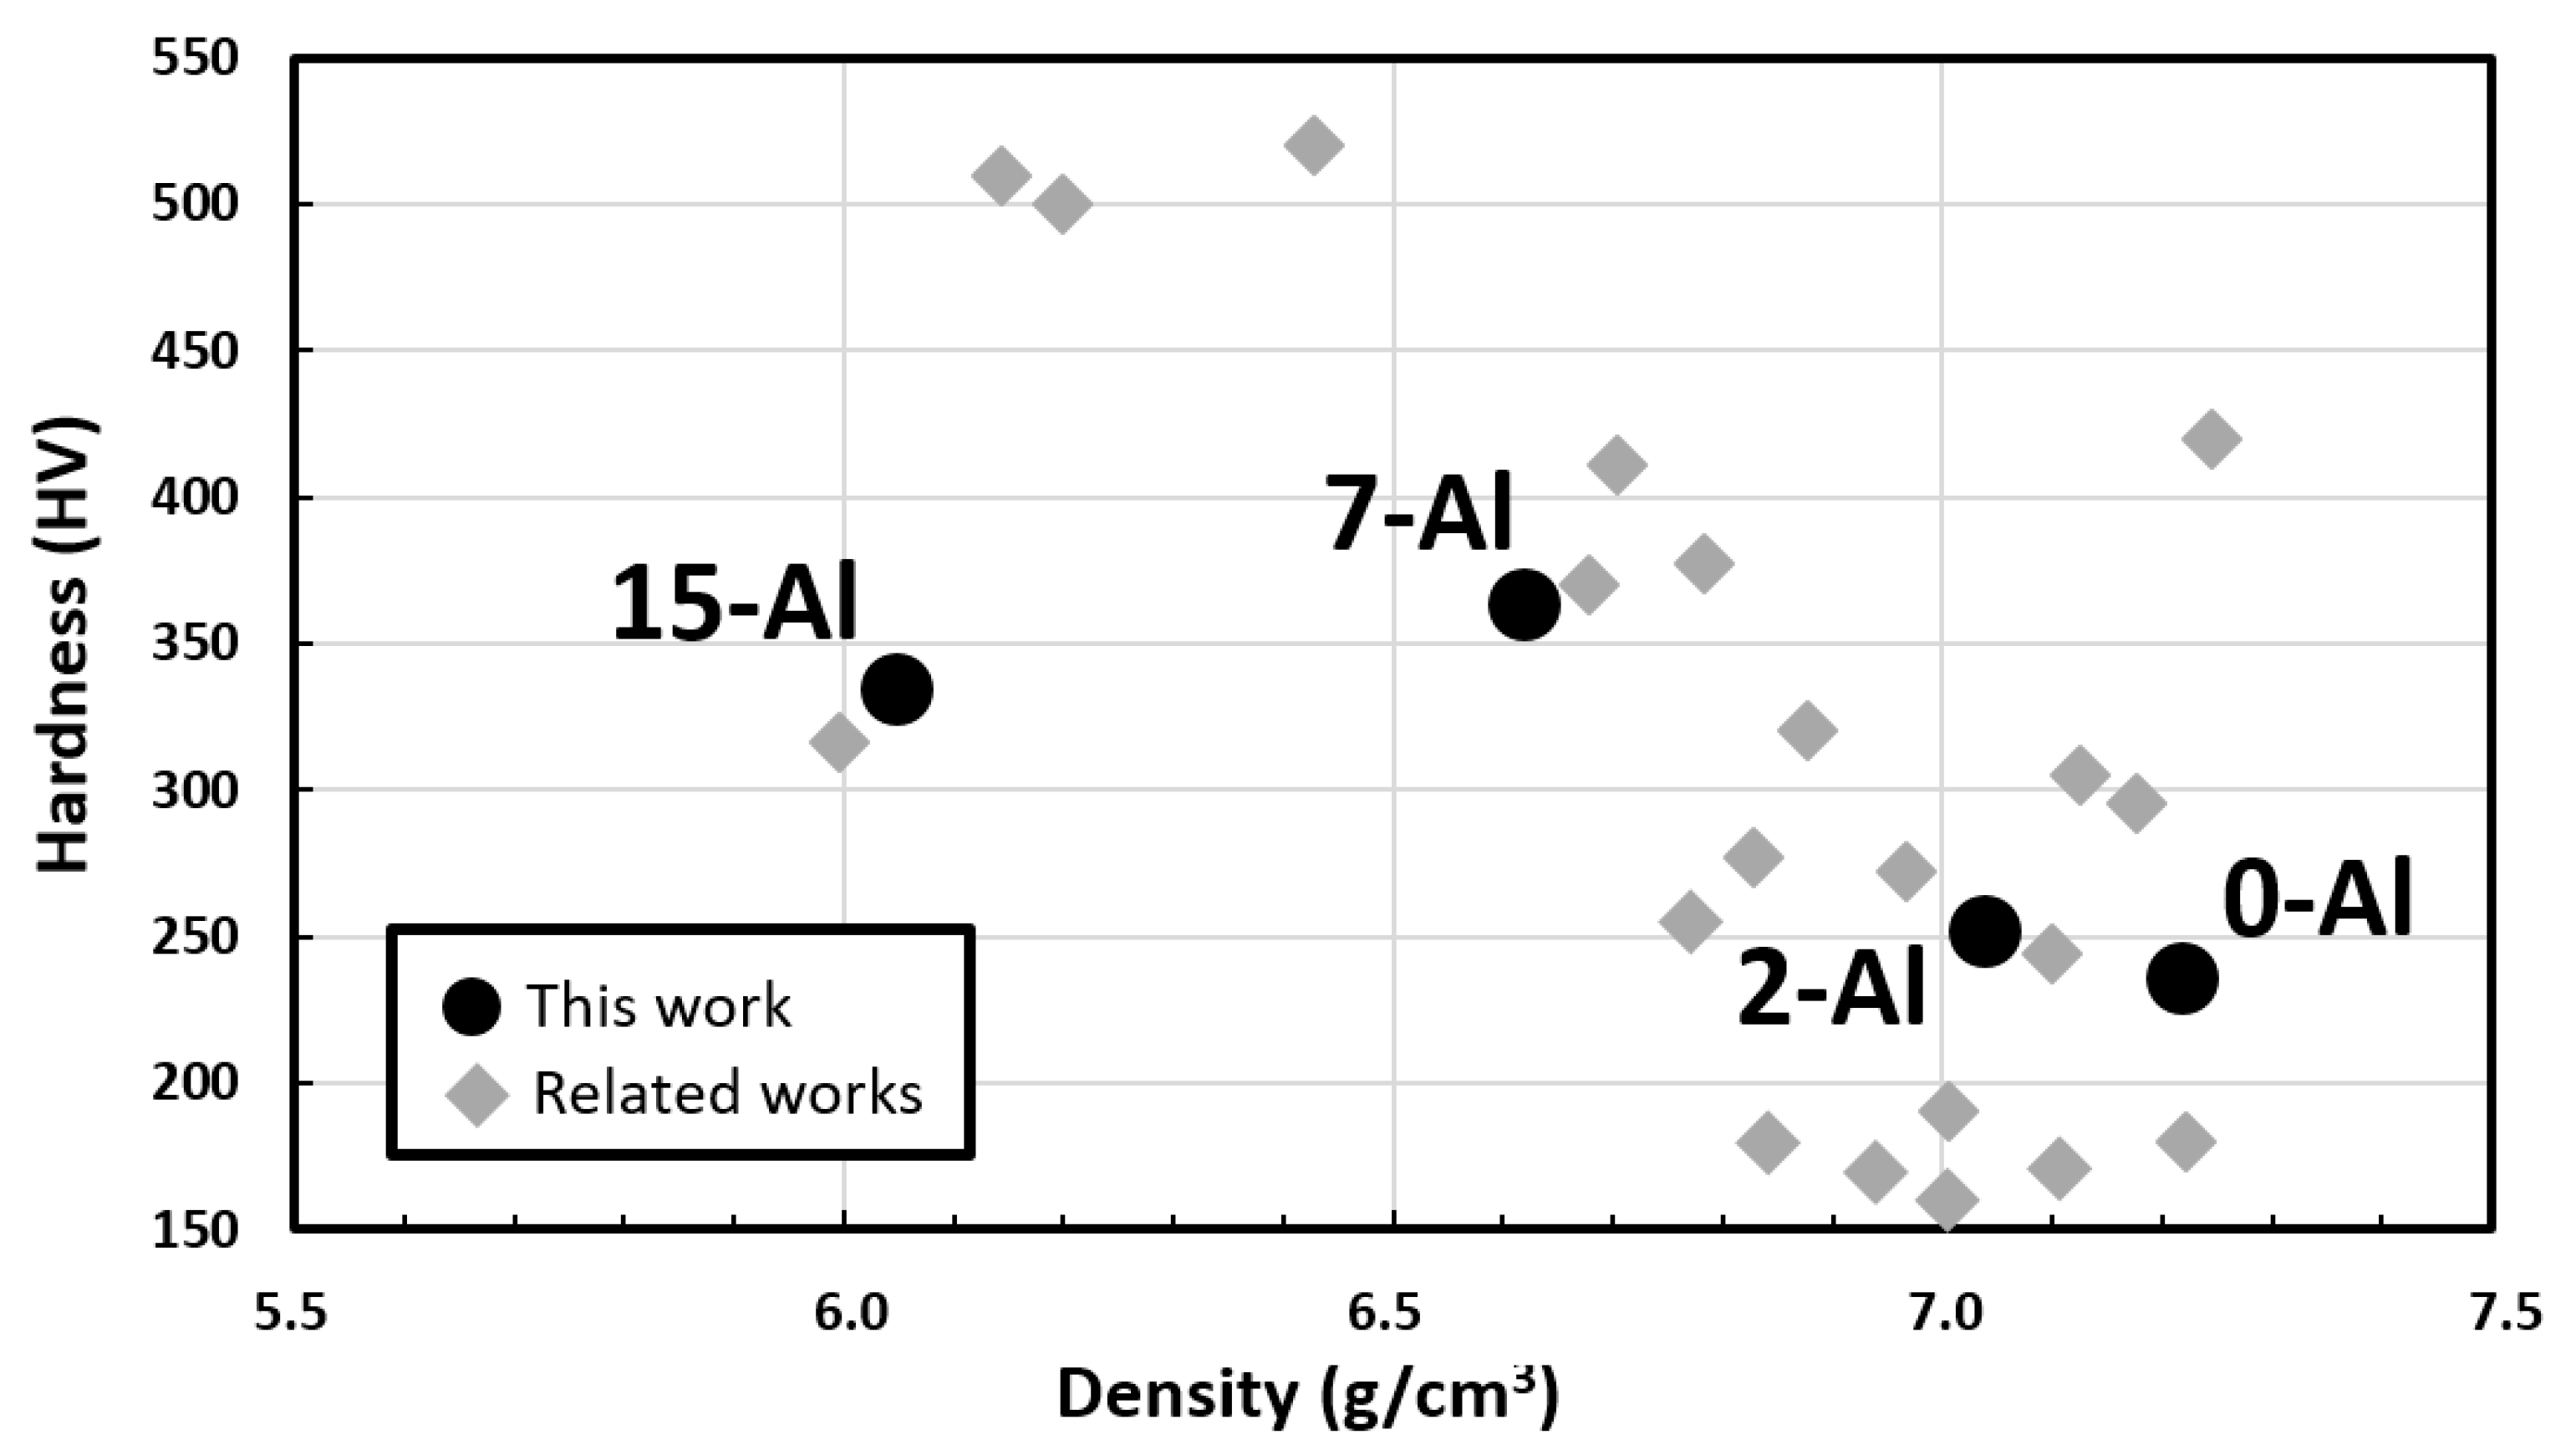
- The addition of Al increases the hardness of the studied cast irons, but not gradually. The alloy with the highest hardness is 7-Al, which is correlated with the formation of kappa carbides and finer perlite.
- The obtained properties showed good consistency in terms of hardness vs. density with related works in the field.
Author Contributions
Funding
Data Availability Statement
Conflicts of Interest
References
- Mitrica, D.; Badea, I.C.; Olaru, M.T.; Serban, B.A.; Vonica, D.; Burada, M.; Geanta, V.; Rotariu, A.N.; Stoiciu, F.; Badilita, V.; et al. Modeling and experimental results of selected lightweight complex concentrated alloys, before and after heat treatment. Materials 2020, 13, 4330. [Google Scholar] [CrossRef] [PubMed]
- Tun, K.S.; Charadva, V.; Gupta, M. Lightweight medium entropy magnesium alloy with exceptional compressive strength and ductility combination. J. Mater. Eng. Perform. 2021, 30, 2422–2432. [Google Scholar] [CrossRef]
- Chandel, R.; Sharma, N.; Bansal, S.A. A review on recent developments of aluminum-based hybrid composites for automotive applications. Emergent Mater. 2021, 1–15. [Google Scholar] [CrossRef]
- Wallerstein, D.; Salminen, A.; Lusquiños, F.; Comesaña, R.; García, J.D.V.; Rodríguez, A.R.; Badaoui, A.; Pou, J. Recent developments in laser welding of aluminum alloys to steel. Metals 2021, 11, 622. [Google Scholar] [CrossRef]
- Zhou, B.; Liu, B.; Zhang, S. The advancement of 7xxx series aluminum alloys for aircraft structures: A review. Metals 2021, 11, 718. [Google Scholar] [CrossRef]
- Kaltzakorta, I.; Gutierrez, T.; Elvira, R.; Jimbert, P. Manufacturing and forging issues encountered while upscaling 1.3C30Mn10Al-austenitic and 0.65C12Mn-duplex low-density steels. Mater. Manuf. Process. 2021, 1–12. [Google Scholar] [CrossRef]
- Moon, J.; Ha, H.Y.; Kim, K.W.; Park, S.J.; Lee, T.H.; Kim, S.D.; Jang, J.H.; Jo, H.H.; Hong, H.U.; Lee, B.H.; et al. A new class of lightweight, stainless steels with ultra-high strength and large ductility. Sci. Rep. 2020, 10, 1–10. [Google Scholar] [CrossRef] [PubMed]
- Liu, D.; Ding, H.; Han, D.; Cai, M.; Lee, Y.K. Microstructural evolution and tensile properties of Fe–11Mn–10Al-1.2C medium-Mn lightweight steel. Mater. Sci. Eng. A 2020, 797, 140256. [Google Scholar] [CrossRef]
- Wang, Z.; Lu, W.; Zhao, H.; He, J.; Wang, K.; Zhou, B.; Ponge, D.; Raabe, D.; Li, Z. Formation mechanism of κ-carbides and deformation behavior in Si-alloyed FeMnAlC lightweight steels. Acta Mater. 2020, 198, 258–270. [Google Scholar] [CrossRef]
- Kaltzakorta, I.; Gutiérrez, T.; Elvira, R.; Guraya, T.; Jimbert, P. Low density steels for forging. Mater. Sci. Forum 2018, 941, 287–291. [Google Scholar] [CrossRef]
- Chen, S.; Rana, R.; Haldar, A.; Ray, R.K. Current state of Fe-Mn-Al-C low density steels. Prog. Mater. Sci. 2017, 89, 345–391. [Google Scholar] [CrossRef]
- Kaltzakorta, I.; Gutierrez, T.; Elvira, R.; Jimbert, P.; Guraya, T. Evolution of microstructure during isothermal treatments of a duplex-austenitic 0.66C11.4Mn.9.9Al low-density forging steel and effect on the mechanical properties. Metals 2021, 11, 214. [Google Scholar] [CrossRef]
- Pero-Sanz Elorz, J.A.; Fernández González, D.; Verdeja González, L.F. Physical Metallurgy of Cast Irons; Springer: Cham, Switzerland, 2018. [Google Scholar]
- Verhoeven, J.D. Cast Irons. In Steel Metallurgy for the Non-Metallurgist; ASM International: Novelty, OH, USA, 2019. [Google Scholar]
- Davis, J.R. (Ed.) ASM Specialty Handbook: Cast Irons; ASM International: Materials Park, OH, USA, 1996. [Google Scholar]
- Bourdie, J.; Bruneseaux, F.; De Parseval, P.; Gouy, S.; Laffont, L.; Lacaze, J. Effect of cooling rate and aluminium addition on graphite growth during solidification and graphitization. Mater. Sci. Forum 2018, 925, 20–27. [Google Scholar] [CrossRef] [Green Version]
- Haque, M.M.; Young, J.M. Production of spheroidal graphite aluminium cast iron and the factors affecting it. J. Mater. Process. Technol. 1995, 55, 186–192. [Google Scholar] [CrossRef]
- Ibrahim, M.M.; Mourad, M.M.; Nofal, A.A.; Farahat, A.I.Z. Microstructure, hot oxidation resistance and damping capacity of Al- alloyed cast iron. Int. J. Cast Met. Res. 2017, 30, 61–69. [Google Scholar] [CrossRef]
- Gumienny, G.; Kurowska, B.; Klimek, L. Aluminium in compacted graphite iron. China Foundry 2020, 17, 137–143. [Google Scholar] [CrossRef]
- Shayesteh-Zeraati, A.; Naser-Zoshki, H.; Kiani-Rashid, A.R. Microstructural and mechanical properties (hardness) investigations of Al-alloyed ductile cast iron. J. Alloys Compd. 2010, 500, 129–133. [Google Scholar] [CrossRef]
- Aguado, E.; Ferrer, M.; Larrañaga, P.; Stefanescu, D.M.; Suárez, R. The effect of the substitution of silicon by aluminum on the properties of lamellar graphite iron. Int. J. Met. 2019, 13, 536–545. [Google Scholar] [CrossRef]
- Kasvayee, K.A.; Ghassemali, E.; Svensson, I.L.; Olofsson, J.; Jarfors, A.E.W. Characterization and modeling of the mechanical behavior of high silicon ductile iron. Mater. Sci. Eng. A 2017, 708, 159–170. [Google Scholar] [CrossRef]
- Takamori, S.; Osawa, Y.; Halada, K. Aluminum-alloyed cast iron as a versatile alloy. Mater. Trans. 2002, 43, 311–314. [Google Scholar] [CrossRef]
- Adebayo, A.O.; Oyetunji, A.; Alaneme, K.K. Microstructural characteristics, mechanical and wear behaviour of aluminium-alloyed ductile irons subjected to two austempering processes. Acta Polytech. 2020, 60, 185–196. [Google Scholar] [CrossRef]
- Sandikoglu, A.; Gecu, R. Microstructural, mechanical and tribological characterization of aluminum-alloyed ductile cast irons based on aluminum content. J. Alloys Compd. 2021, 879, 160428. [Google Scholar] [CrossRef]
- Andersson, J.O.; Helander, T.; Höglund, L.; Shi, P.; Sundman, B. Thermo-Calc & DICTRA, computational tools for materials science. Calphad Comput. Coupling Phase Diagrams Thermochem. 2002, 26, 273–312. [Google Scholar] [CrossRef]
- Zheng, W.; He, S.; Selleby, M.; He, Y.; Li, L.; Lu, X.G.; Ågren, J. Thermodynamic assessment of the Al-C-Fe system. Calphad 2017, 58, 34–49. [Google Scholar] [CrossRef]
- Cheng, W.C.; Song, Y.S.; Lin, Y.S.; Chen, K.F.; Pistorius, P.C. On the eutectoid reaction in a quaternary Fe-C-Mn-Al alloy: Austenite → ferrite + kappa-carbide + M23C6 carbide. Metall. Mater. Trans. A Phys. Metall. Mater. Sci. 2014, 45, 1199–1216. [Google Scholar] [CrossRef]


| Fe | C | Si | Mn | Cr | Ni | Mo | Cu | Sn | P | S |
|---|---|---|---|---|---|---|---|---|---|---|
| Bal. | 3.12 | 2.0 | 0.63 | 0.15 | 0.06 | 0.01 | 0.09 | 0.01 | 0.02 | 0.03 |
| Alloy | Fe | C | Al | Si * | Mn | P | S | Cr | Ni | Mo | Cu |
|---|---|---|---|---|---|---|---|---|---|---|---|
| 0-Al | Bal. | 3.19 | 0.01 | 2.53 | 0.65 | 0.02 | 0.02 | 0.15 | <0.10 | <0.10 | 0.10 |
| 2-Al | Bal. | 3.04 | 1.80 | 2.83 | 0.66 | 0.02 | 0.02 | 0.18 | <0.10 | <0.10 | 0.10 |
| 7-Al | Bal. | 2.85 | 7.30 | 2.74 | 0.62 | 0.02 | 0.02 | 0.16 | <0.10 | <0.10 | 0.09 |
| 15-Al | Bal. | 2.65 | 15.0 | 2.33 | 0.55 | 0.02 | 0.02 | 0.16 | <0.10 | <0.10 | 0.09 |
| Alloy | Ferrite (%) | Graphite (%) | Perlite (%) |
|---|---|---|---|
| 0-Al | 9.2 | 8.1 | 82.7 |
| 2-Al | 15.5 | 8.6 | 75.9 |
| 7-Al | 26.9 * | 7.1 | 66.0 |
| 15-Al | 36.1 * | 5.5 | 56.8 |
| Alloy | Liquidus (°C) | Solidus (°C) | Eutectic Undercooling (°C) | Eutectic Recalescence (°C) | Recalescence | Time (s) |
|---|---|---|---|---|---|---|
| 0-Al | 1224 | 1082 | 1132 | 1142 | 10 | 39 |
| 2-Al | 1168 | 1044 | 1084 | 1093 | 9 | 29 |
| 7-Al | 1250 | 1170 | -- | -- | -- | -- |
| 15-Al | 1264 | 1179 | 1256 | 1256 | 0 | 26 |
| Alloy | Hardness (HV 10) | Density (g/cm3) | Specific Hardness (HV/g∙cm−3) |
|---|---|---|---|
| 0-Al | 235 ± 14 | 7.22 | 32.5 |
| 2-Al | 251 ± 15 | 7.04 | 35.6 |
| 7-Al | 363 ± 06 | 6.62 | 54.8 |
| 15-Al | 334 ± 25 | 6.05 | 55.2 |
Publisher’s Note: MDPI stays neutral with regard to jurisdictional claims in published maps and institutional affiliations. |
© 2021 by the authors. Licensee MDPI, Basel, Switzerland. This article is an open access article distributed under the terms and conditions of the Creative Commons Attribution (CC BY) license (https://creativecommons.org/licenses/by/4.0/).
Share and Cite
Obregon, A.; Sanchez, J.M.; Eguizabal, D.; Garcia, J.C.; Arruebarrena, G.; Hurtado, I.; Quintana, I.; Rodriguez, P. Microstructural Evolution as a Function of Increasing Aluminum Content in Novel Lightweight Cast Irons. Metals 2021, 11, 1646. https://doi.org/10.3390/met11101646
Obregon A, Sanchez JM, Eguizabal D, Garcia JC, Arruebarrena G, Hurtado I, Quintana I, Rodriguez P. Microstructural Evolution as a Function of Increasing Aluminum Content in Novel Lightweight Cast Irons. Metals. 2021; 11(10):1646. https://doi.org/10.3390/met11101646
Chicago/Turabian StyleObregon, Alejandro, Jon Mikel Sanchez, David Eguizabal, Jose Carlos Garcia, Gurutze Arruebarrena, Iñaki Hurtado, Ion Quintana, and Patxi Rodriguez. 2021. "Microstructural Evolution as a Function of Increasing Aluminum Content in Novel Lightweight Cast Irons" Metals 11, no. 10: 1646. https://doi.org/10.3390/met11101646