
Thermodynamic Analysis and Experimental Investigation of Al and F Removal from Sulfuric Acid Leachate of Spent LiFePO4 Battery Powder


Abstract
:1. Introduction
2. Experimental
2.1. Materials
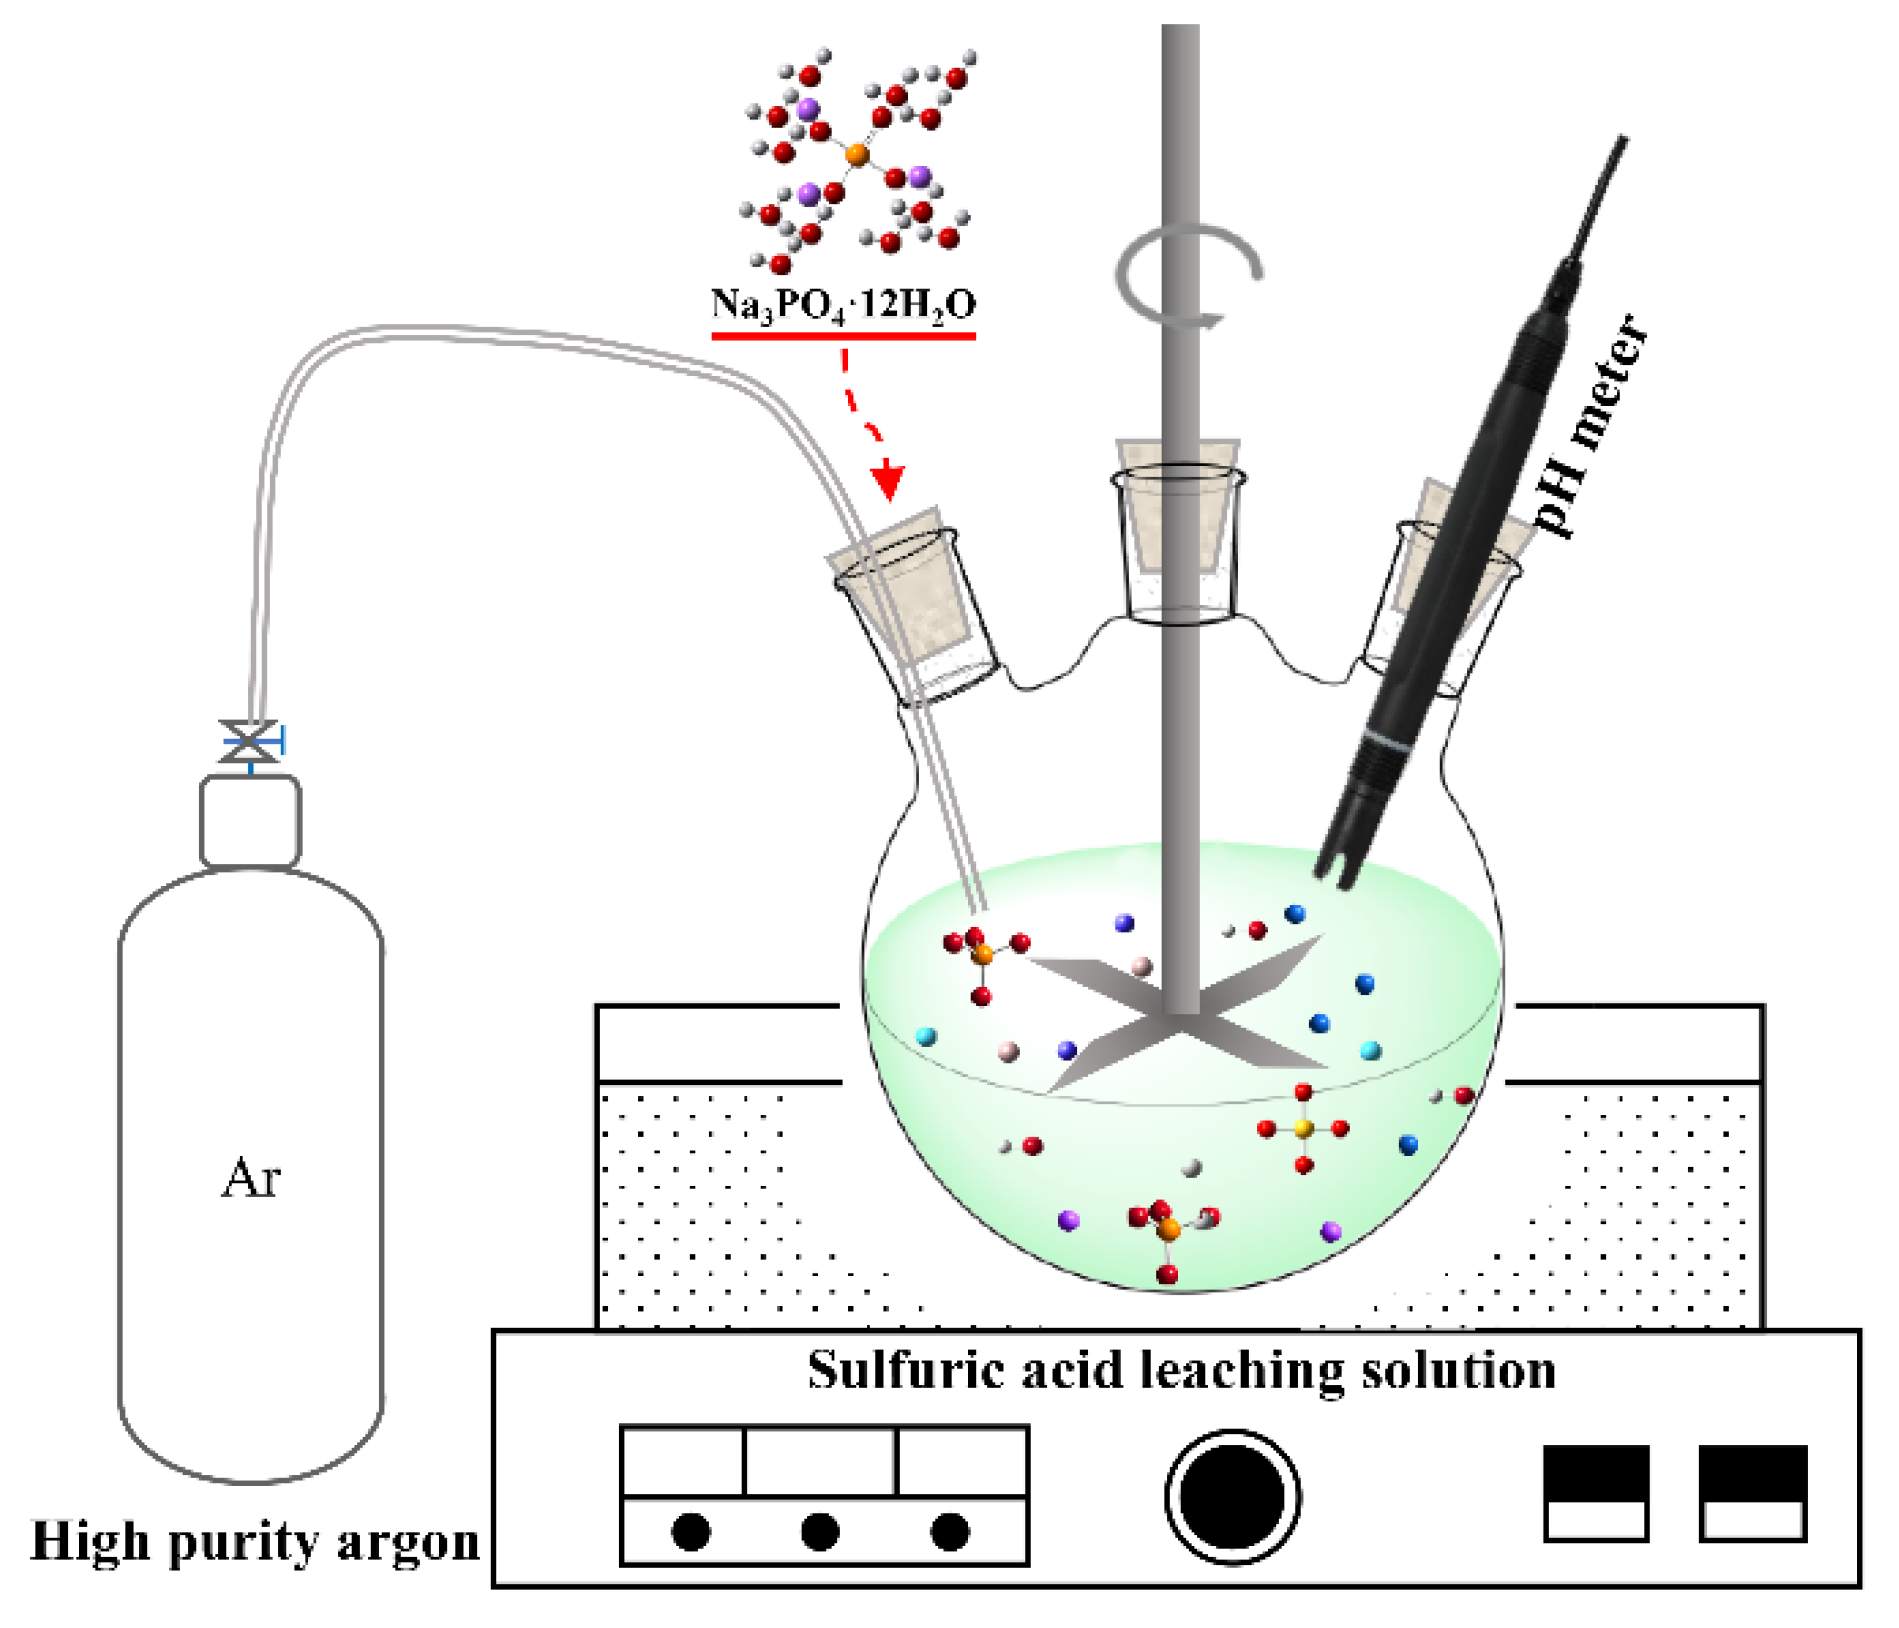
2.2. Methods
3. Thermodynamic Data and Calculation Model
3.1. Ion Species and Their Thermodynamic Data
3.2. Solid Species and Their Thermodynamic Data
3.2.1. Calculation of Ksp value of AlF3
3.2.2. Calculation of Ksp value of FeF3
3.2.3. Solid-State Reactions and Their Equilibrium Constant
3.3. Thermodynamic model of the Li+–Fe2+–Al3+–PO43−–SO42−–F−–H2O System
3.4. Thermodynamic Model of the Li+–Fe3+–Al3+–PO43−–SO42−–F−–H2O System
4. Results and Discussion
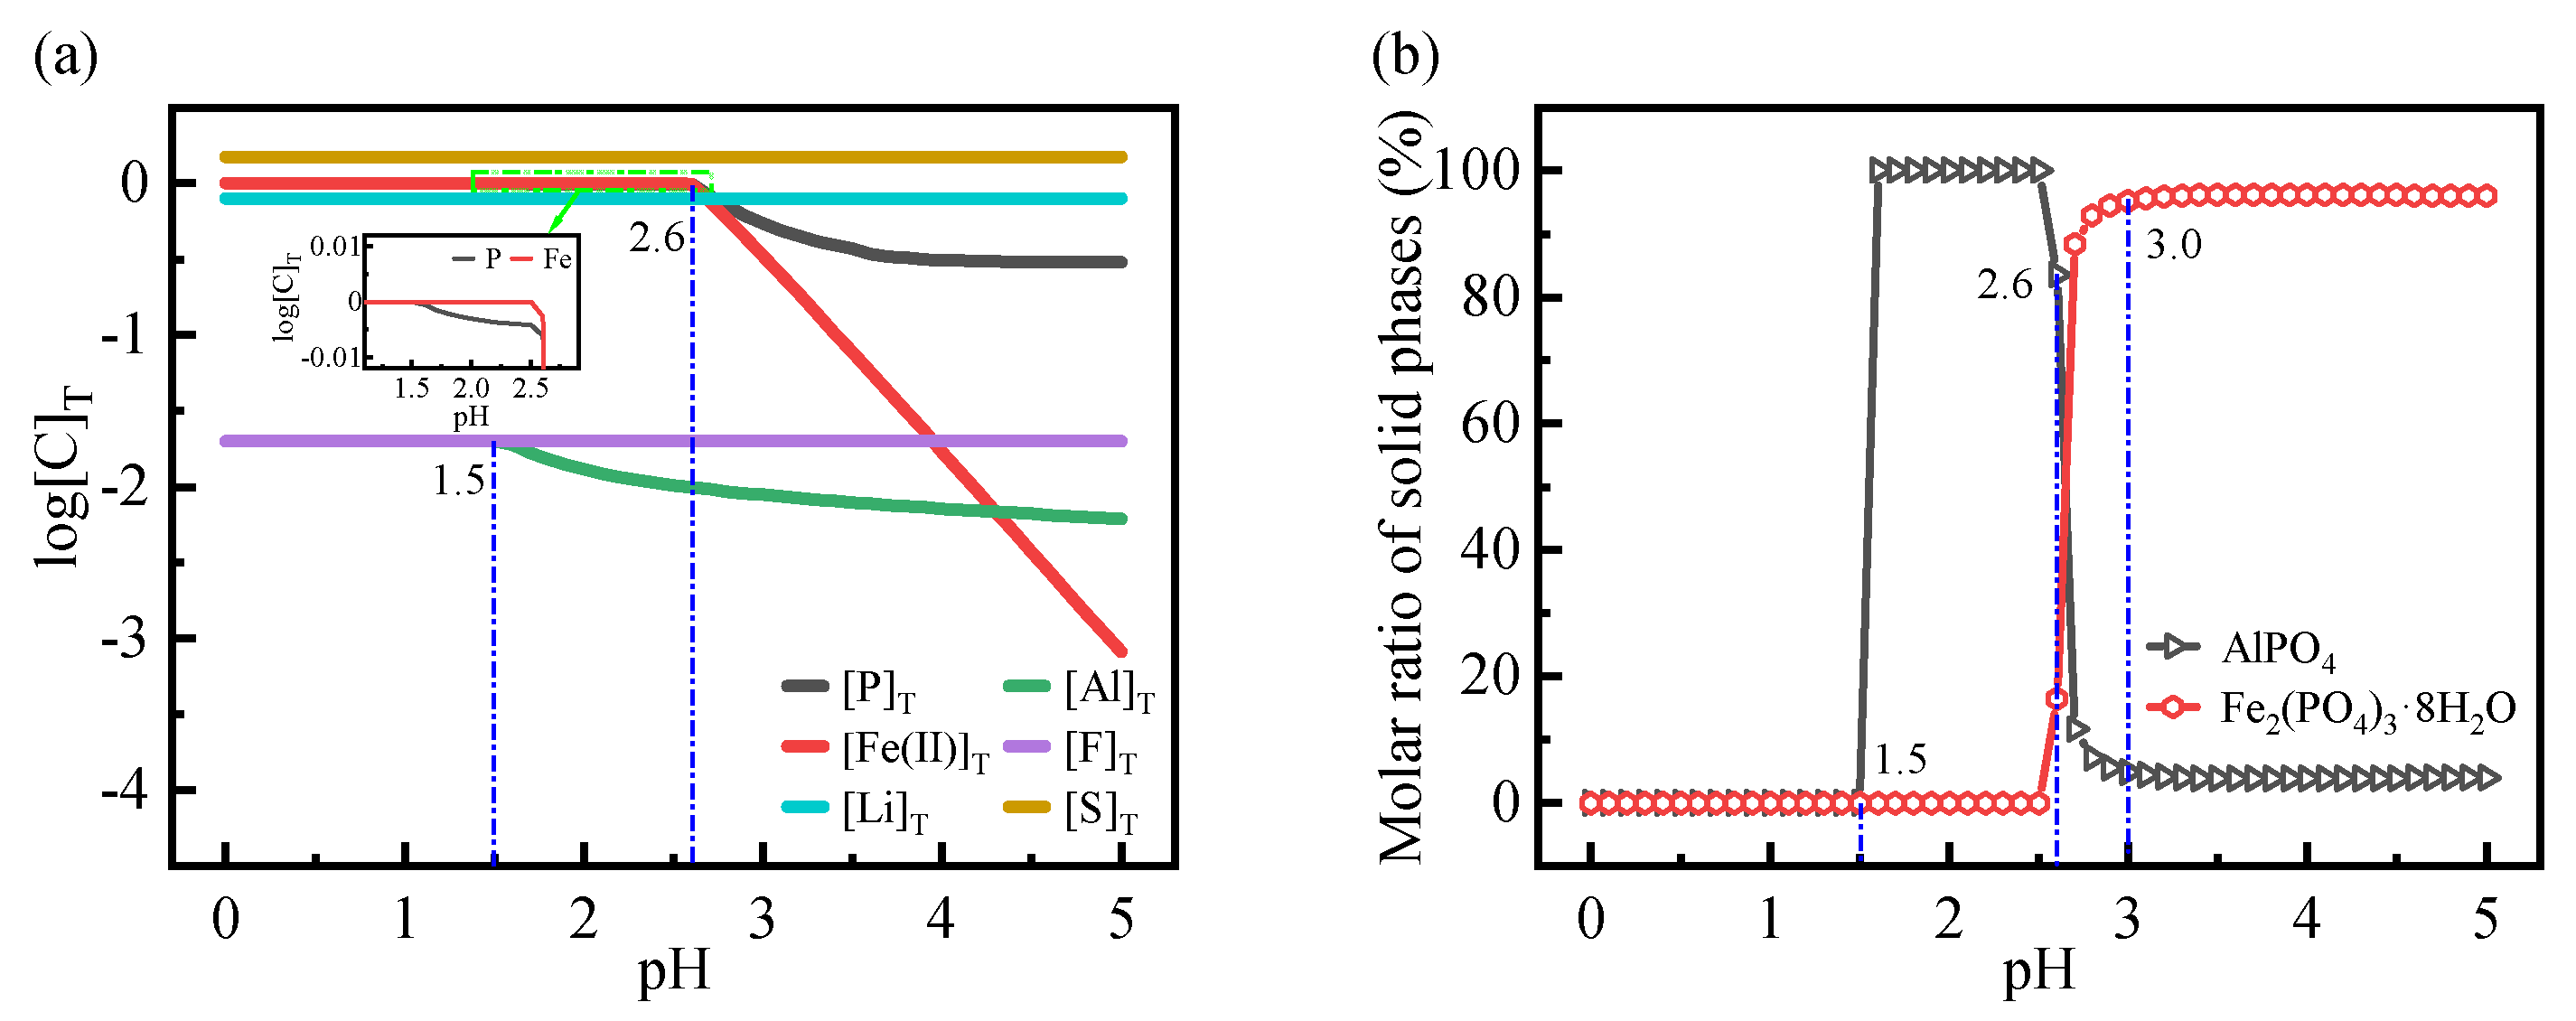
4.1. Li+–Fe2+–Al3+–PO43−–SO42−–F−–H2O System
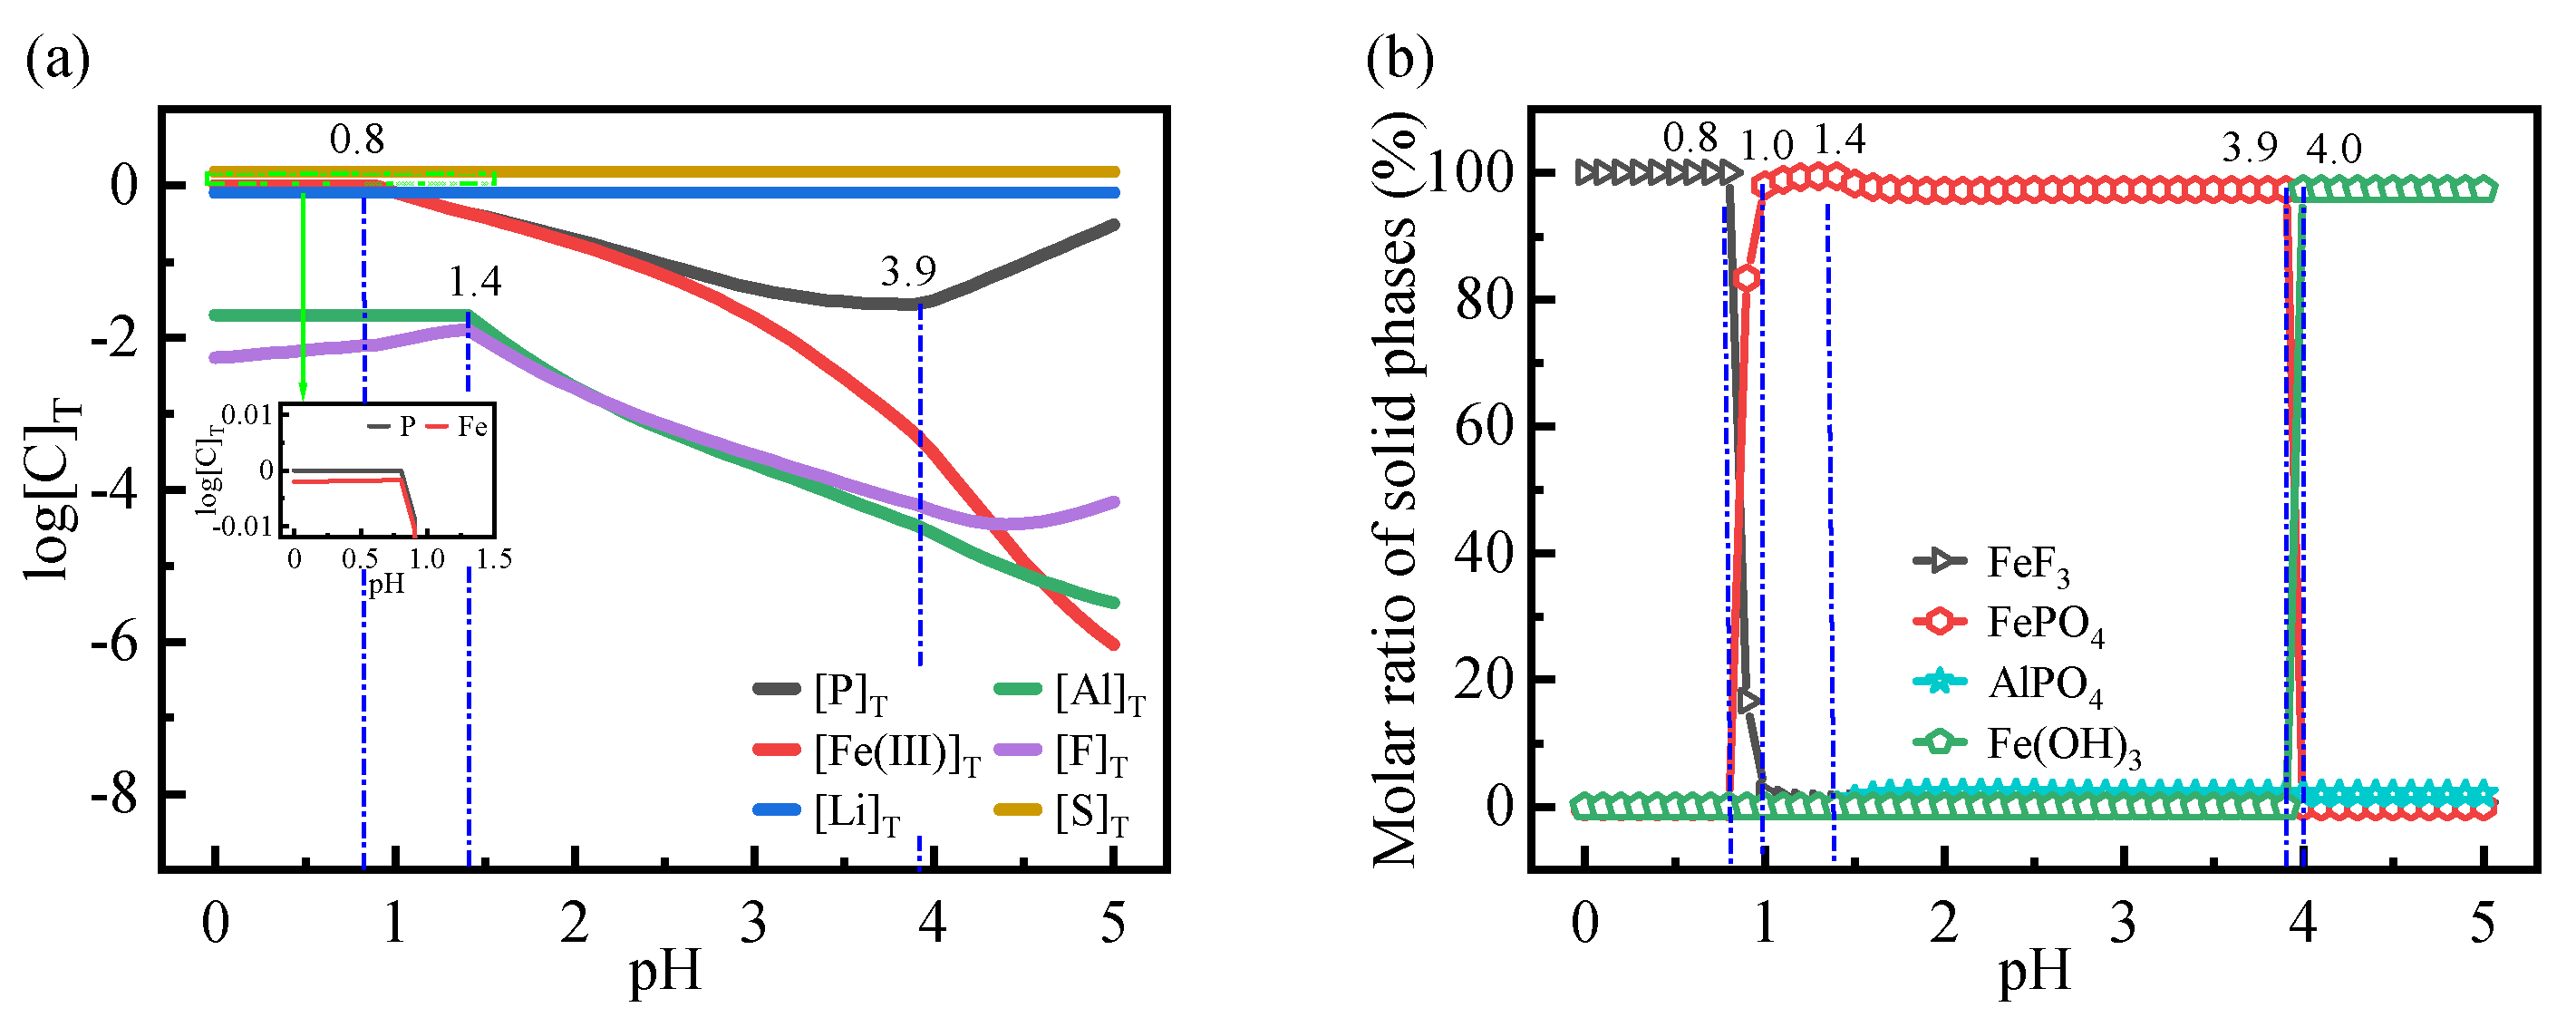
4.2. Li+–Fe3+–Al3+–PO43−–SO42−–F−–H2O System
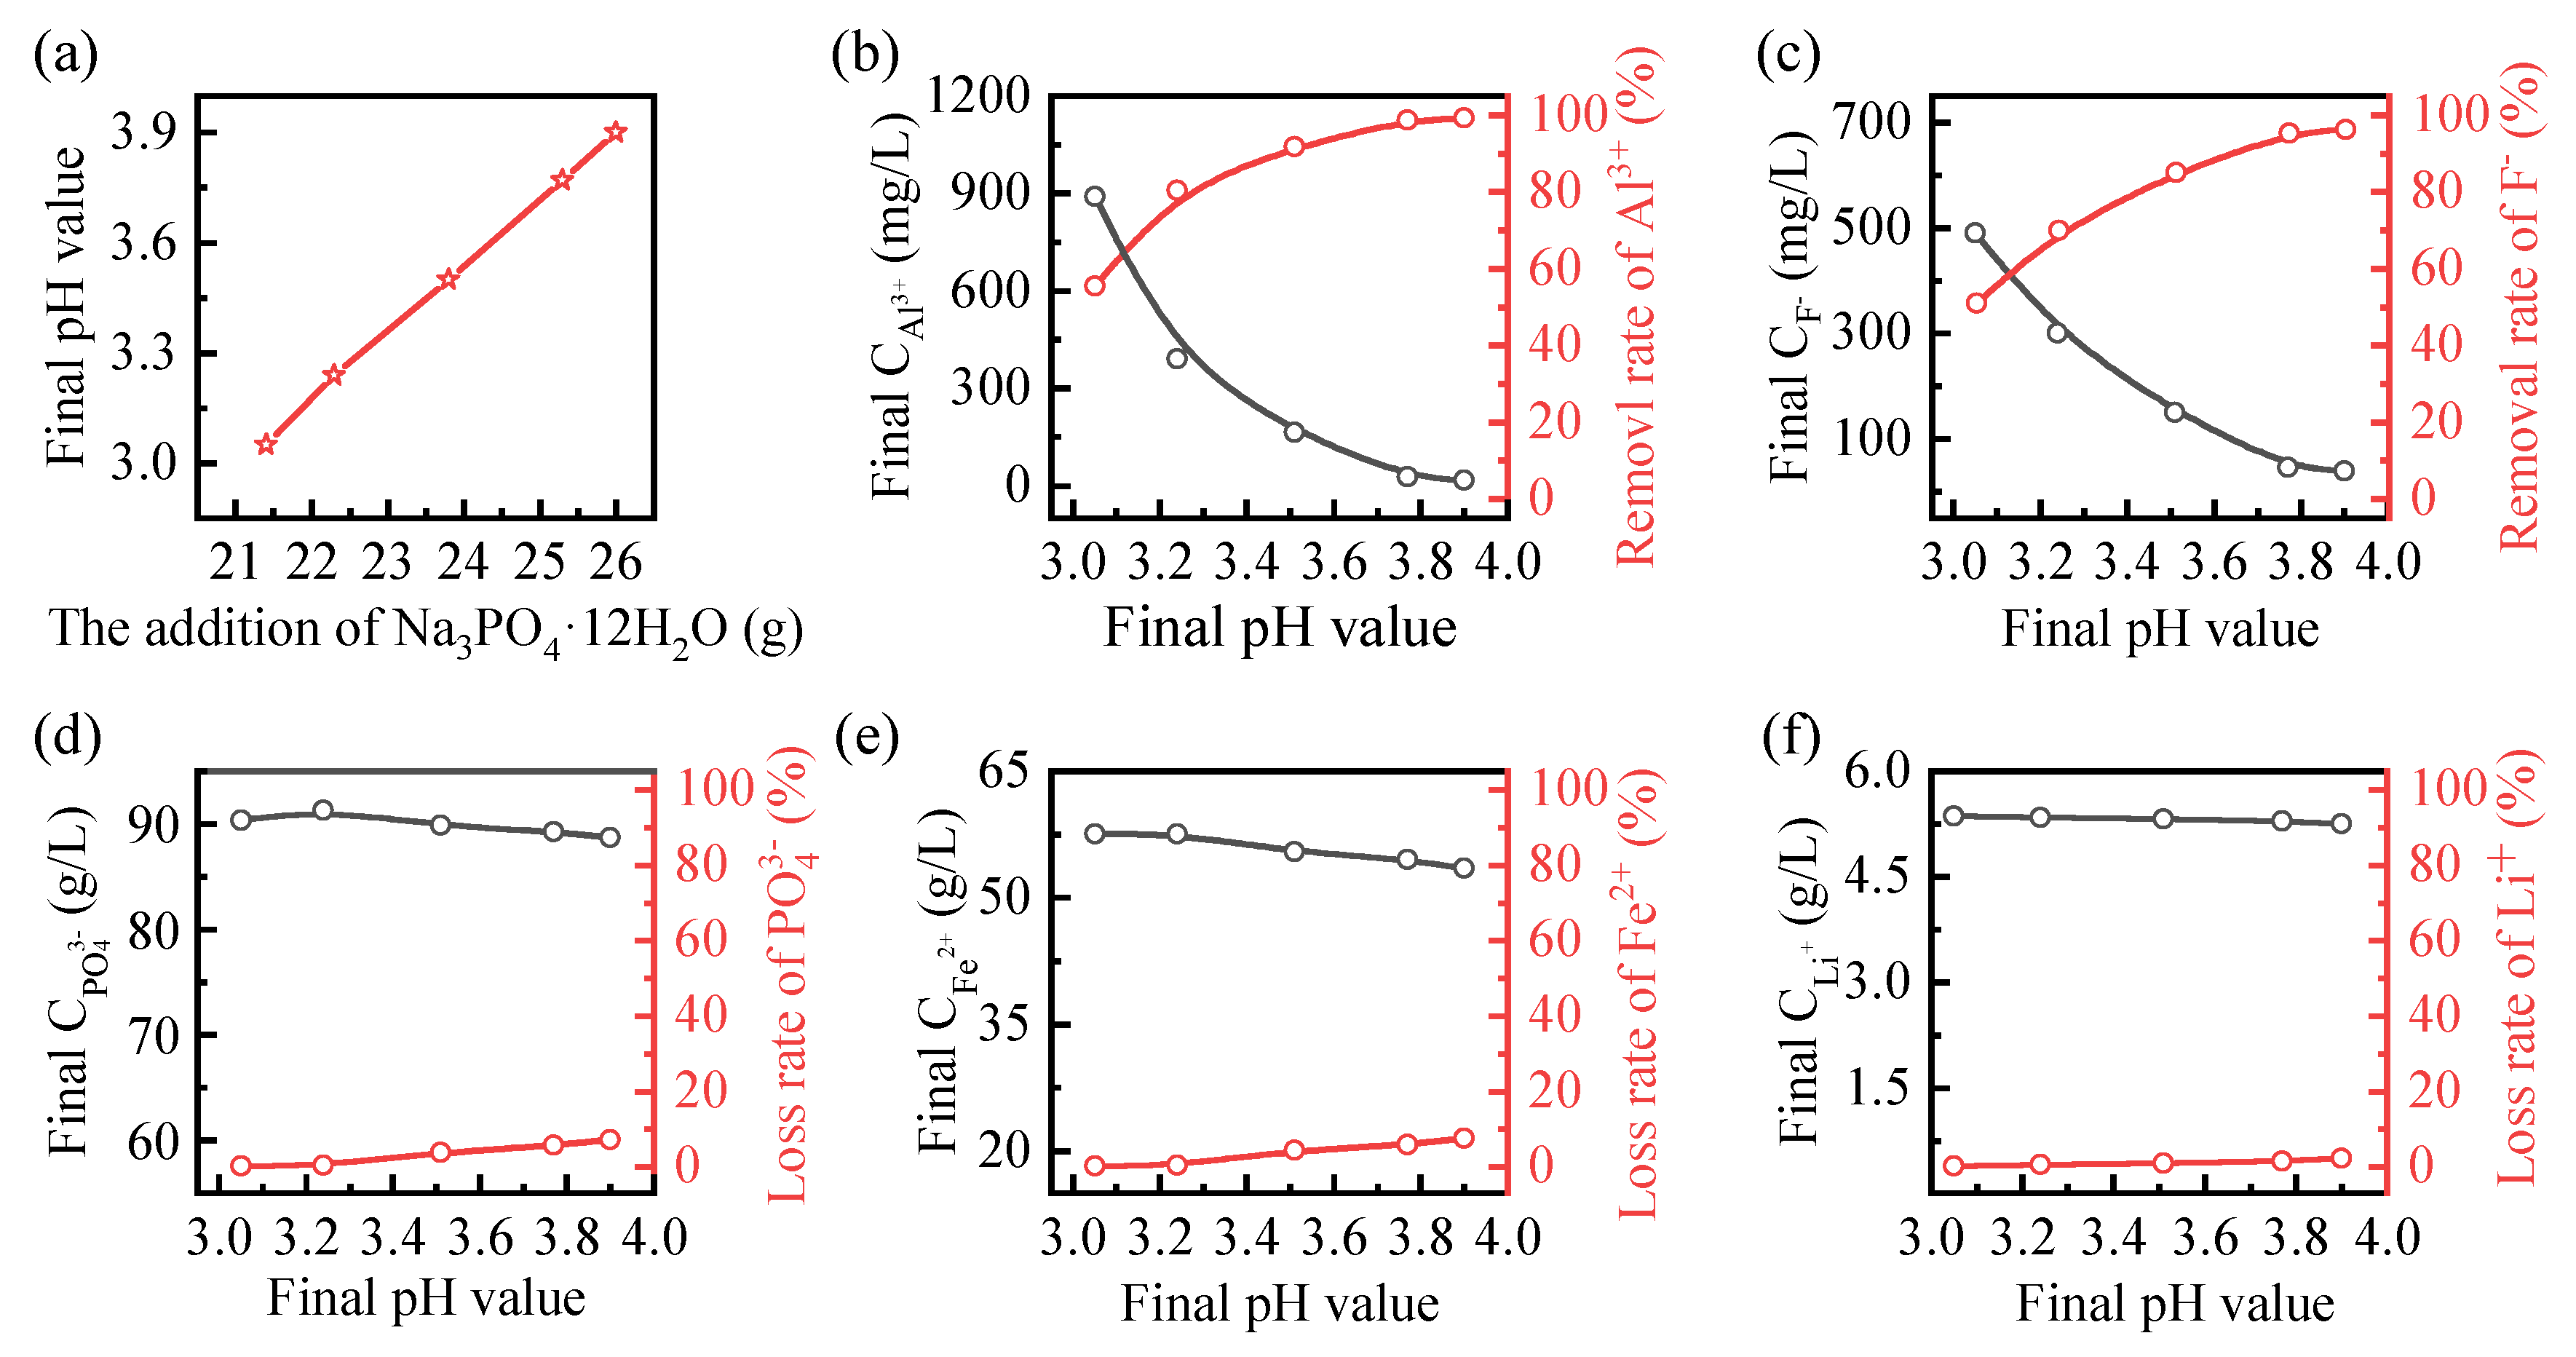
4.3. Precipitation Experiments
5. Conclusions
Author Contributions
Funding
Data Availability Statement
Conflicts of Interest
References
- Arens, M.; Åhman, M.; Vogl, V. Which countries are prepared to green their coal-based steel industry with electricity?—Reviewing climate and energy policy as well as the implementation of renewable electricity. Renew. Sustain. Energy Rev. 2021, 143, 110938. [Google Scholar] [CrossRef]
- Mallapaty, S. How China could be carbon neutral by mid-century. Nature 2020, 586, 482–483. [Google Scholar] [CrossRef]
- Bu, C.; Cui, X.; Li, R.; Li, J.; Zhang, Y.; Wang, C.; Cai, W. Achieving net-zero emissions in China’s passenger transport sector through regionally tailored mitigation strategies. Appl. Energy 2021, 284, 116265. [Google Scholar] [CrossRef]
- Wu, W.; Zhai, C.; Sui, Y.; Zhang, H. A novel distributed energy system using high-temperature proton exchange membrane fuel cell integrated with hybrid-energy heat pump. Energy Convers. Manag. 2021, 235, 113990. [Google Scholar] [CrossRef]
- Sommerville, R.; Zhu, P.; Rajaeifar, M.A.; Heidrich, O.; Goodship, V.; Kendrick, E. A qualitative assessment of lithium ion battery recycling processes. Resour. Conserv. Recycl. 2021, 165, 105219. [Google Scholar] [CrossRef]
- Yang, D.; Du, T.; Gong, H.; Luo, W. The Current Process for the Recycling of Spent Lithium Ion Batteries. Front. Chem. 2020, 8, 578044. [Google Scholar]
- China EV 100, Power Battery Life Cycle Asset Operation Management Research. Available online: http://www.ev100plus.com/content/details1017_4298.html (accessed on 11 May 2021).
- Gu, S.; Zhang, L.; Fu, B.; Wang, X.; Ahn, J.W. Feasible route for the recovery of strategic metals from mixed lithium-ion batteries cathode materials by precipitation and carbonation. Chem. Eng. J. 2020, 420, 127561. [Google Scholar] [CrossRef]
- Liu, F.; Peng, C.; Ma, Q.; Wang, J.; Zhou, S.; Chen, Z.; Wilson, B.P.; Lundström, M. Selective lithium recovery and integrated preparation of high-purity lithium hydroxide products from spent lithium-ion batteries. Sep. Purif. Technol. 2021, 259, 118181. [Google Scholar] [CrossRef]
- Zhao, Y.; Yuan, X.; Jiang, L.; Wen, J.; Wang, H.; Guan, R.; Zhang, J.; Zeng, G. Regeneration and reutilization of cathode materials from spent lithium-ion batteries. Chem. Eng. J. 2020, 383, 123089. [Google Scholar] [CrossRef]
- Wang, S.; Zhang, Z.; Lu, Z.; Xu, Z. A novel method for screening deep eutectic solvent to recycle the cathode of Li-ion batteries. Green Chem. 2020, 22, 4473–4482. [Google Scholar] [CrossRef]
- Jie, Y.; Yang, S.; Li, Y.; Hu, F.; Zhao, D.; Chang, D.; Lai, Y.; Chen, Y. Waste Organic Compounds Thermal Treatment and Valuable Cathode Materials Recovery from Spent LiFePO4 Batteries by Vacuum Pyrolysis. ACS Sustain. Chem. Eng. 2020, 8, 19084–19095. [Google Scholar] [CrossRef]
- Huang, B.; Pan, Z.; Su, X.; An, L. Recycling of lithium-ion batteries: Recent advances and perspectives. J. Power Sources 2018, 399, 274–286. [Google Scholar] [CrossRef]
- Yang, Y.; Meng, X.; Cao, H.; Lin, X.; Liu, C.; Sun, Y.; Zhang, Y.; Sun, Z. Selective recovery of lithium from spent lithium iron phosphate batteries: A sustainable process. Green Chem. 2018, 20, 3121–3133. [Google Scholar] [CrossRef]
- Li, H.; Xing, S.; Liu, Y.; Li, F.; Guo, H.; Kuang, G. Recovery of Lithium, Iron, and Phosphorus from Spent LiFePO4 Batteries Using Stoichiometric Sulfuric Acid Leaching System. ACS Sustain. Chem. Eng. 2017, 5, 8017–8024. [Google Scholar] [CrossRef]
- Zheng, R.; Zhao, L.; Wang, W.; Liu, Y.; Ma, Q.; Mu, D.; Li, R.; Dai, C. Optimized Li and Fe recovery from spent lithium-ion batteries via a solution-precipitation method. RSC Adv. 2016, 6, 43613–43625. [Google Scholar] [CrossRef]
- Cai, G.; Fung, K.Y.; Ng, K.M. Process Development for the Recycle of Spent Lithium Ion Batteries by Chemical Precipitation. Ind. Eng. Chem. Res. 2014, 53, 18245–18259. [Google Scholar] [CrossRef]
- Huang, Y.; Han, G.; Liu, J.; Chai, W.; Wang, W.; Yang, S.; Su, S. A stepwise recovery of metals from hybrid cathodes of spent Li-ion batteries with leaching-flotation-precipitation process. J. Power Sources 2016, 325, 555–564. [Google Scholar] [CrossRef]
- Shin, E.J.; Kim, S.; Noh, J.K.; Byun, D.; Chung, K.Y.; Kim, H.S.; Cho, B.W. A green recycling process designed for LiFePO4 cathode materials for Li-ion batteries. J. Mater. Chem. A 2015, 3, 11493–11502. [Google Scholar] [CrossRef]
- Chen, X.; Li, J.; Kang, D.; Zhou, T.; Ma, H. A novel closed-loop process for the simultaneous recovery of valuable metals and iron from a mixed type of spent lithium-ion batteries. Green Chem. 2019, 21, 6342–6352. [Google Scholar] [CrossRef]
- Chen, X.; Cao, L.; Kang, D.; Li, J.; Zhou, T.; Ma, H. Recovery of valuable metals from mixed types of spent lithium ion batteries. Part II: Selective extraction of lithium. Waste Manag. 2018, 80, 198–210. [Google Scholar] [CrossRef]
- Yang, Y.; Zheng, X.; Cao, H.; Zhao, C.; Lin, X.; Ning, P.; Zhang, Y.; Jin, W.; Sun, Z. A Closed-Loop Process for Selective Metal Recovery from Spent Lithium Iron Phosphate Batteries through Mechanochemical Activation. ACS Sustain. Chem. Eng. 2017, 5, 9972–9980. [Google Scholar] [CrossRef]
- Bian, D.; Sun, Y.; Li, S.; Tian, Y.; Yang, Z.; Fan, X.; Zhang, W. A novel process to recycle spent LiFePO4 for synthesizing LiFePO4/C hierarchical microflowers. Electrochim. Acta 2016, 190, 134–140. [Google Scholar] [CrossRef]
- Li, L.; Lu, J.; Zhai, L.; Zhang, X.; Curtiss, L.; Jin, Y.; Wu, F.; Chen, R.; Amine, K. A facile recovery process for cathodes from spent lithium iron phosphate batteries by using oxalic acid. CSEE J. Power Energy 2018, 4, 219–225. [Google Scholar] [CrossRef]
- Fan, E.; Li, L.; Zhang, X.; Bian, Y.; Xue, Q.; Wu, J.; Wu, F.; Chen, R. Selective Recovery of Li and Fe from Spent Lithium-Ion Batteries by an Environmentally Friendly Mechanochemical Approach. ACS Sustain. Chem. Eng. 2018, 6, 11029–11035. [Google Scholar] [CrossRef]
- Yadava, P.; Jie, C.J.; Tanb, S.; Srinivasan, M. Recycling of cathode from spent lithium iron phosphate batteries. J. Hazard. Mater. 2020, 399, 123068. [Google Scholar] [CrossRef]
- Yao, Y.; Zhu, M.; Zhao, Z.; Tong, B.; Fan, Y.; Hua, Z. Hydrometallurgical Processes for Recycling Spent Lithium-Ion Batteries: A Critical Review. ACS Sustain. Chem. Eng. 2018, 6, 13611–13627. [Google Scholar] [CrossRef]
- Lv, W.; Wang, Z.; Cao, H.; Sun, Y.; Zhang, Y.; Sun, Z. A Critical Review and Analysis on the Recycling of Spent Lithium-Ion Batteries. ACS Sustain. Chem. Eng. 2018, 6, 1504–1521. [Google Scholar] [CrossRef]
- Pagnanelli, F.; Moscardini, E.; Altimari, P.; Abo Atia, T.; Toro, L. Cobalt products from real waste fractions of end of life lithium ion batteries. Waste Manag. 2016, 51, 214–221. [Google Scholar] [CrossRef]
- Joo, S.H.; Shin, D.; Oh, C.H.; Wang, J.; Senanayake, G.; Shin, S.M. Selective extraction and separation of nickel from cobalt, manganese and lithium in pre-treated leach liquors of ternary cathode material of spent lithium-ion batteries using synergism caused by Versatic 10 acid and LIX 84-I. Hydrometallurgy 2016, 159, 65–74. [Google Scholar] [CrossRef]
- Kang, J.; Senanayake, G.; Sohn, J.; Shin, S.M. Recovery of cobalt sulfate from spent lithium ion batteries by reductive leaching and solvent extraction with Cyanex 272. Hydrometallurgy 2010, 100, 168–171. [Google Scholar] [CrossRef] [Green Version]
- Weng, Y.; Xu, S.; Huang, G.; Jiang, C. Synthesis and performance of Li[(Ni1/3Co1/3Mn1/3)1-xMgx]O2 prepared from spent lithium ion batteries. J. Hazard. Mater. 2013, 246–247, 163–172. [Google Scholar] [CrossRef]
- Hsu, P.H. Precipitation of phosphate from solution using aluminum salt. Water Res. 1975, 9, 1155–1161. [Google Scholar]
- Speight, J.G. Lange’s Handbook of Chemistry, 6th ed.; McGraw-Hill: New York, NY, USA, 2005. [Google Scholar]
- Roine, A. HSC Chemistry 9.2.6. Outotec Research Oy, Pori, Finland. 2019. Available online: http://www.chemistry-software.com/ (accessed on 11 May 2021).
- Bale, C.W.; Chartrand, P.; Degterov, S.A.; Eriksson, G.; Hack, K.; Mahfoud, R.B.; Melançon, J.; Pelton, A.D.; Petersen, S. FactSage thermochemical software and databases. Calphad 2016, 54, 35–53. [Google Scholar] [CrossRef] [Green Version]
- Yu, F.; Zhang, J.; Yang, Y.; Song, G. Reaction mechanism and electrochemical performance of LiFePO4/C cathode materials synthesized by carbothermal method. Electrochim. Acta 2009, 54, 7389–7395. [Google Scholar] [CrossRef]
- Xie, X.; Cheng, H. Adsorption and desorption of phenylarsonic acid compounds on metal oxide and hydroxide, and clay minerals. Sci. Total Environ. 2021, 757, 143765. [Google Scholar] [CrossRef] [PubMed]
- Jie, Y.; Yang, S.; Li, Y.; Zhao, D.; Lai, Y.; Chen, Y. Oxidizing Roasting Behavior and Leaching Performance for the Recovery of Spent LiFePO4 Batteries. Minerals-Basel 2020, 10, 949. [Google Scholar] [CrossRef]
- Castro, L.; Dedryve‘re, R.; Khalifi, M.E.; Lippens, P.-E.; Bre’ger, J.; Tessier, C.; Gonbeau, D. The Spin-Polarized Electronic Structure of LiFePO4 and FePO4 Evidenced by in-Lab XPS. J. Phys. Chem. C 2010, 114, 17995–18000. [Google Scholar] [CrossRef]


| Elements | P | Fe | Li | Cu | Al | F |
| Wt.% | 15.9 | 38.5 | 3.76 | 0.5 | 1.4 | 0.8 |
| Elements | P | Fe | Li | Cu | Al | F |
| mg/L | 22785.0 | 56320.0 | 5365.0 | 0.5 | 1999.0 | 1003.1 |
| Elements | S | Na | K | Ca | Si | Mg |
| mg/L | 84749.0 | 5.5 | 6.3 | 24.2 | 12.5 | 9.3 |
| Equation No. | Reaction | log K | Chemical Equilibrium Constant Relationship |
|---|---|---|---|
| (3) | H2O = H+ + OH− | −14 | [H2O] = [H+] × [OH−] × 1014 |
| (4) | H3PO4 = H+ + H2PO4− | −2.04 | [H3PO4] = [H+] × [H2PO4−] × 102.04 |
| (5) | H2PO4− = H+ + HPO42− | −7.2 | [H2PO4−] = [H+] × [HPO42−] × 107.2 |
| (6) | HPO42− = H+ + PO43− | −12.36 | [HPO42−] = [H+] × [PO43−] × 1012.36 |
| (7) | H2SO4 = HSO4− + H+ | 3 | [H2SO4] = [HSO4−] × [H+] × 10−3 |
| (8) | HSO4− = SO42− + H+ | −1.99 | [HSO4−] = [SO42−] × [H+] × 101.99 |
| (9) | FeSO4(aq) = SO42− + Fe2+ | −2.2 | [FeSO4(aq)] = [SO42−] × [Fe2+] × 102.2 |
| (10) | FeOH+ = Fe2+ + OH− | −4.5 | [FeOH+] = [Fe2+] ×[OH−] × 104.5 |
| (11) | Fe(OH)2(aq) = Fe2+ + 2OH− | −7.4 | [Fe(OH)2(aq)] = [Fe2+] ×[OH−]2 × 107.4 |
| (12) | Fe(OH)3− = Fe2+ + 3OH− | −10.0 | [Fe(OH)3−] = [Fe2+] × [OH−]3 × 1010.0 |
| (13) | Fe(OH)42− = Fe2+ + 4OH− | −9.6 | [Fe(OH)42−] = [Fe2+] × [OH−]4 × 109.6 |
| (14) | FeHPO4(aq) = Fe2+ + HPO42− | −3.6 | [FeHPO4(aq)] = [Fe2+] × [HPO42−] × 103.6 |
| (15) | FeH2PO4+ = Fe2+ + H2PO4− | −2.7 | [FeH2PO4+] = [Fe2+] × [H2PO4−] × 102.7 |
| (16) | FeF+ = Fe2+ + F− | −0.8 | [FeF+] = [Fe2+] × [F−] × 100.8 |
| (17) | FeSO4+ = Fe3+ + SO42− | −4.04 | [FeSO4+] = [Fe3+] × [SO42−] × 104.04 |
| (18) | Fe(SO4)2− = Fe3+ + 2SO42− | −5.38 | [Fe(SO4)2−] = [Fe3+] × [SO42−]2 × 105.38 |
| (19) | FeOH2+ = Fe3+ + OH− | −11.81 | [FeOH2+] = [Fe3+] × [OH−] × 1011.81 |
| (20) | Fe(OH)2+ = Fe3+ + 2OH− | −22.3 | [Fe(OH)2+] = [Fe3+] × [OH−]2 × 1022.3 |
| (21) | Fe(OH)4− = Fe3+ + 4OH− | −34.4 | [Fe(OH)4−] = [Fe3+] × [OH−]4 × 1034.4 |
| (22) | Fe2(OH)24+ = 2Fe3+ + 2OH− | −25.1 | [Fe2(OH)24+] = [Fe3+]2 × [OH−]2 × 1025.1 |
| (23) | Fe3(OH)45+ = 3Fe3+ + 4OH− | −49.7 | [Fe3(OH)45+] = [Fe3+]3 × [OH−]4 × 1049.7 |
| (24) | FeHPO4+ = Fe3+ + HPO42− | −8.30 | [FeHPO4+] = [Fe3+] × [HPO42−] × 108.30 |
| (25) | FeH2PO42+ = Fe3+ + H2PO4− | −3.47 | [FeH2PO42+] = [Fe3+] × [H2PO4−] × 103.47 |
| (26) | FeF2+ = Fe3+ + F− | −6.0 | [FeF2+] = [Fe3+] × [F−] × 106.0 |
| (27) | FeF2+ = Fe3+ + 2F− | −9.07 | [FeF2+] = [Fe3+] × [F−]2 × 109.07 |
| (28) | FeF3(aq) = Fe3+ + 3F− | −12.1 | [FeF3(aq)] = [Fe3+] × [F−]3 × 1012.1 |
| (29) | Li(OH)(aq) = Li+ + OH− | −0.36 | [Li(OH)(aq)] = [Li+] × [OH−] × 100.36 |
| (30) | LiSO4− = SO42− + Li+ | −0.64 | [LiSO4−] = [SO42−] × [Li+] × 100.64 |
| (31) | LiHPO4− = Li+ + HPO42− | −0.72 | [LiHPO4−] = [Li+] × [HPO42−] × 100.72 |
| (32) | Al(OH)2+ = Al3+ + OH− | −9.01 | [Al(OH)2+] = [Al3+] × [OH−] × 109.01 |
| (33) | Al(OH)2+ = Al3+ + 2OH− | −18.7 | [Al(OH)2+] = [Al3+] × [OH−]2 × 1018.7 |
| (34) | Al(OH)3(aq) = Al3+ + 3OH− | −27.0 | [Al(OH)3(aq)] = [Al3+] × [OH−]3 × 1027.0 |
| (35) | Al(OH)4− = Al3+ + 4OH− | −33.0 | [Al(OH)4−] = [Al3+] × [OH−]4 × 1033.0 |
| (36) | Al2(OH)24+ = 2Al3+ + 2OH− | −20.3 | [Al2(OH)24+] = [Al3+]2 × [OH−]2 × 1020.3 |
| (37) | Al3(OH)45+ = 3Al3+ + 4OH− | −42.1 | [Al3(OH)45+] = [Al3+]3 × [OH−]4 × 1042.1 |
| (38) | AlF2+ = Al3+ + F− | −6.09 | [AlF2+] = [Al3+] × [F−] × 106.09 |
| (39) | AlF2+ = Al3+ + 2F− | −11.12 | [AlF2+] = [Al3+] ×[F−]2 × 1011.12 |
| (40) | AlF3(aq) = Al3+ + 3F− | −15 | [AlF3(aq)] = [Al3+] ×[F−]3 × 10¹⁵ |
| (41) | AlF4− = Al3+ + 4F− | −18 | [AlF4−] = [Al3+] ×[F−]4 × 10¹⁸ |
| (42) | AlF52− = Al3+ + 5F− | −19.4 | [AlF52−] = [Al3+] ×[F−]5 × 1019.4 |
| (43) | AlF63− = Al3+ + 6F− | −19.8 | [AlF63−] = [Al3+] ×[F−]6 × 1019.8 |
| Equation No. | Reaction | log K | Chemical Equilibrium Constant Relationship |
|---|---|---|---|
| (54) | Fe3(PO4)2·8H2O(s) = 3Fe2+ + 2PO43− + 8H2O | −36.85 | [Fe2+]3 × [PO43−]2 = 10−36.85 |
| (55) | FePO4·2H2O(s) = Fe3+ + PO43− + 2H2O | −15.0039 | [Fe3+] × [PO43−] = 10−15.0039 |
| (56) | FePO4(s) = Fe3+ + PO43− | −21.886 | [Fe3+] × [PO43−] = 10−21.886 |
| (57) | Al(OH)3 = Al3+ + 3OH− | −32.89 | [Al3+] × [OH−]3 = 10−32.89 |
| (58) | AlPO4(s) = Al3+ + PO43− | −20.007 | [Al3+] × [PO43−] = 10−20.007 |
| (59) | Li3PO4(s) = 3Li+ + PO43− | −10.6253 | [Li+]3 × [PO43−] = 10−10.6253 |
| (60) | AlF3(s) = Al3+ + 3F− | −16.3439 | [Al3+] × [F−]3 = 10−16.3439 |
| (61) | FeF3(s) = Fe3+ + 3F− | −24.4409 | [Fe3+] × [F−]3 = 10−24.4409 |
| (62) | FeF2(s) = Fe2+ + 2F− | −5.62709 | [Fe2+] × [F−]2 = 10−5.62709 |
| (63) | LiF(s) = Li+ + F− | −2.77 | [Li+] × [F−] = 10−2.77 |
| (64) | Fe(OH)2(s) = Fe2+ + 2OH− | −16.31 | [Fe2+] × [OH−]2 = 10−16.31 |
| (65) | Fe(OH)3(s) = Fe3+ + 3OH− | −38.8 | [Fe3+] × [OH−]3 = 10−38.8 |
| Eq no. | Equation |
|---|---|
| (73) | ([Fe(II)]O–[Fe(II)]T)/([P]O–[P]T) = 3/2 |
| (74) | [Fe2+]3 × [PO43−]2 = 10−36.85 |
| (75) | [Al]O–[Al]T = [P]O–[P]T |
| (76) | [Al3+] × [PO43−] = 9.84 × 10⁻²¹ |
| (77) | ([Al]O–[Al]T)/([F]O–[F]T) = 1/3 |
| (78) | [Al3+] × [F−]3 = 4.53 × 10⁻¹⁷ |
| (79) | [([P]O–[P]T) –([Al]O–[Al]T)]/([Fe(II)]O–[Fe(II)]T)) = 2/3 |
| (80) | [([Al]O–[Al]T) –([P]O–[P]T)]/([F]O–[F]T)) = 1/3 |
| No. | Stable Regions | Constraint Equations |
|---|---|---|
| 1 | Liquid phase | (3–16) + (29–43) + (66–72) |
| 2 | Fe3(PO4)2·8H2O(s) | (3–16) + (29–43) + (66–74) |
| 3 | AlPO4(s) | (3–16) + (29–43) + (66–72) + (75–76) |
| 4 | AlF3(s) | (3–16) + (29–43) + (66–72) + (77–78) |
| 5 | Fe3(PO4)2·8H2O(s) + AlPO4(s) | (3–16) + (29–43) + (66–72) + (74) + (76) + (79) |
| 6 | Fe3(PO4)2·8H2O(s) + AlF3(s) | (3–16) + (29–43) + (66–74) + (77–78) |
| 7 | AlPO4(s) + AlF3(s) | (3–16) + (29–43) + (66–72) + (76) + (78) + (80) |
| 8 | Fe3(PO4)2·8H2O(s) + AlPO4(s) + AlF3(s) | (3–16) + (29–43) + (66–72) + (74) + (76) + (78–79) + (80) |
| Eq no | Equation |
|---|---|
| (88) | [Fe(III)]O–[Fe(III)]T = [P]O–[P]T |
| (89) | [Fe3+] × [PO43−] = 1.3 × 10⁻²² |
| (90) | [Al]O–[Al]T = [P]O–[P]T |
| (91) | [Al3+] × [PO43−] = 9.84 × 10⁻²¹ |
| (92) | ([Fe(III)]O–[Fe(III)]T)/([F]O–[F]T) = 1/3 |
| (93) | [Fe3+] × [F−]3 = 1.089 × 10−36 |
| (94) | [Fe3+] × [OH−]3 = 10−38.8 |
| (95) | ([P]O–[P]T)/[([Fe(III)]O–[Fe(III)]T) + ([Al]O–[Al]T)] = 1 |
| (96) | ([Fe(III)]O–[Fe(III)]T)/[([P]O–[P]T) + ([F]O–[F]T)] = 1 |
| No. | Stable Regions | Constraint Equations |
|---|---|---|
| 1 | Liquid phase | (3–8) + (17–43) + (81–87) |
| 2 | FePO4(s) | (3–8) + (17–43) +(81–87) |
| 3 | AlPO4(s) | (3–8) + (17–43) + (81–87)+ (90–91) |
| 4 | FeF3(s) | (3–8) + (17–43) + (81–87)+ (92–93) |
| 5 | Fe(OH)3(s) | (3–8) + (17–43) + (81–87) + (94) |
| 6 | FePO4(s) + AlPO4(s) | (3–8) + (17–43) + (81–87) + (89) + (91) + (95) |
| 7 | FePO4(s) + FeF3(s) | (3–8) + (17–43) + (81–87) +(89) + (93) + (96) |
| 8 | FePO4(s) + Fe(OH)3(s) | (3–8) + (17–43) + (81–87) + (89) + (94) |
| 9 | AlPO4(s) + FeF3(s) | (3–8) + (17–43) + (81–87) + (90–93) |
| 10 | AlPO4(s) + Fe(OH)3(s) | (3–8) + (17–43) + (81–87) + (90–91) + (94) |
| 11 | FeF3(s) + Fe(OH)3(s) | (3–8) + (17–43) + (81–87) + (93–94) |
| 12 | FePO4(s) + AlPO4(s) + FeF3(s) | (3–8) + (17–43) + (81–87) + (89) + (91) + (93) + (95) + (96) |
| 13 | FePO4(s) + AlPO4(s) + Fe(OH)3(s) | (3–8) + (17–43) + (81–87) +(89) + (91) + (94) |
| 14 | AlPO4(s) + FeF3(s) + Fe(OH)3(s) | (3–8) + (17–43) + (81–87) + (90–91) + (93–94) |
| 15 | FePO4(s) + FeF3(s) + Fe(OH)3(s) | (3–8) + (17–43) + (81–87) + (89) + (93–94) |
| 16 | FePO4(s) + AlPO4(s) + FeF3(s) + Fe(OH)3(s) | (3–8) + (17–43) + (81–87) + (89) + (91) + (93–94) |
Publisher’s Note: MDPI stays neutral with regard to jurisdictional claims in published maps and institutional affiliations. |
© 2021 by the authors. Licensee MDPI, Basel, Switzerland. This article is an open access article distributed under the terms and conditions of the Creative Commons Attribution (CC BY) license (https://creativecommons.org/licenses/by/4.0/).
Share and Cite
Jie, Y.; Yang, S.; Shi, P.; Chang, D.; Fang, G.; Mo, C.; Ding, J.; Liu, Z.; Lai, Y.; Chen, Y. Thermodynamic Analysis and Experimental Investigation of Al and F Removal from Sulfuric Acid Leachate of Spent LiFePO4 Battery Powder. Metals 2021, 11, 1641. https://doi.org/10.3390/met11101641
Jie Y, Yang S, Shi P, Chang D, Fang G, Mo C, Ding J, Liu Z, Lai Y, Chen Y. Thermodynamic Analysis and Experimental Investigation of Al and F Removal from Sulfuric Acid Leachate of Spent LiFePO4 Battery Powder. Metals. 2021; 11(10):1641. https://doi.org/10.3390/met11101641
Chicago/Turabian StyleJie, Yafei, Shenghai Yang, Pengfei Shi, Di Chang, Gang Fang, Caixuan Mo, Jiang Ding, Zhiqiang Liu, Yanqing Lai, and Yongming Chen. 2021. "Thermodynamic Analysis and Experimental Investigation of Al and F Removal from Sulfuric Acid Leachate of Spent LiFePO4 Battery Powder" Metals 11, no. 10: 1641. https://doi.org/10.3390/met11101641