Article

Renovation of Crystallizer Surface Using Electrodeposited Alloy Coating to Increase High-Temperature Abrasion Resistance

by
Janette Brezinová
1,
Mária Hagarová
2,*,
Dagmar Jakubéczyová
3,
Gabriela Baranová
2 and
Olegas Prentkovskis
4
1
Department of Technologies, Materials and Computer Aided Production, Faculty of Mechanical Engineering, Technical University of Košice, Mäsiarska 74, 040 01 Košice, Slovakia
2
Institute of Materials and Quality Engineering, Faculty of Materials, Metallurgy and Recycling, Technical University of Košice, Letná 9, 042 00 Košice, Slovakia
3
Slovak Academy of Sciences, Institute of Materials Research, Watsonova 47, 040 01 Košice, Slovakia
4
Faculty of Transport Engineering, Vilnius Gediminas Technical University-Vilnius Tech, J. Basanavičiaus g. 28, 03224 Vilnius, Lithuania
*
Author to whom correspondence should be addressed.
Metals 2021, 11(10), 1629; https://doi.org/10.3390/met11101629
Submission received: 27 August 2021 / Revised: 23 September 2021 / Accepted: 5 October 2021 / Published: 13 October 2021
(This article belongs to the Special Issue Renovation of Parts to Save Metals)

Abstract

:
This paper deals with the evaluation of mechanical and tribological properties of Ni-Co galvanic coatings at elevated temperatures. The coatings were deposited on the copper surface, which in practice is the material of the crystallizer. Ni-Co coatings are manufactured to increase the abrasion resistance of the crystallizer surface at elevated operating temperatures. The microhardness (HV0.05) measurements of the coating at 400 °C were used to determine its mechanical properties. The Ball-on-Disc Test was used to determine the tribological properties of the coatings at 400 °C. The mechanical and tribological properties of Ni-Co coatings at elevated temperature were compared to the results of experiments performed at room temperature. When heated to 400 °C, HV0.05 decreased by 9.5 to 22% (depending on Co content in the coating) compared to the values that were measured at 23 °C. The change in the COF for the Ni-Co coating at 400 °C was from 0.680 to 0.750 depending on the Co amount compared to the values at 23 °C. The COF values at room temperature ranged from 0.373 to 0.451. The places with higher wt. % Co had better friction properties than the places with lower wt. % Co.

Graphical Abstract

1. Introduction

In many cases, two surfaces moving against each other are damaged by wear. Continuous material reduction from the surface shortens its service life and results in energy and economic losses in industrial equipment. Practical applications of metallic materials are often limited by their insufficient resistance to friction, wear, corrosion, and fatigue [1].
It is well known that the friction coefficient of metals decreases due to the formation of an oxide layer. In surface structures with direct contact with low roughness, only thin oxide layers are formed, namely direct intermetallic contacts. In contrast, even with slight steel wear the growth of up to several microns thick oxide layers can be observed, separating the metal counterparts. If the oxide layer thickness exceeds a critical value, it disintegrates and forms debris particles [2].
At low temperatures, the wear takes place through continuous oxide formation accompanied by the surface contact loss.
The presence of oxide debris in the fretting contact can significantly influence wear behavior.
Oxide formation rate reduction can result in abrasion rate reduction and also in material contact loss rate reduction in the form of oxide. Both factors contribute to reducing wear rate.
The resulting protective layers can have the form of fine particles, however, at higher temperatures, a hard and highly protective oxide “glazed” surface of compacted oxide particles is formed, resulting in reduced friction and wear [3].
Friction and wear of metals and alloys at high temperatures should be taken into consideration with regard to efficient performance of moving parts, e.g., combustion engines, moving parts of power equipment, drive systems, and cutting tools during metalworking processes. The ever-increasing demand for compact, lightweight, and high-performing machines has resulted in a drastic increase in transmission energy densities of mechanical systems. The operation of mechanical systems in harsh conditions at high temperatures has serious consequences in terms of efficiency, performance, and reliability due to the temperature effect on friction size and wear of contact materials [4,5].
Coatings are commonly used as surface protection to reduce its wear resulting in increased equipment life and reliability. Various coating deposition techniques, such as high velocity oxygen fuel (HVOF), plasma spraying, PVD and CVD process, and electrolytic coating deposition, are used to improve surface properties. Among these methods, electroplating is a simple and available method for precise coating substrates of various shapes and sizes with composite, alloy, or pure metal layers [1].
Nickel-based alloy coatings are also used in environments where materials are exposed to high temperatures. Ni-Co alloy coatings are interesting for their excellent corrosion and wear resistance in combination with high hardness [6,7].
The research covered in the paper [8] has shown that the microhardness in Ni-Co alloys gradually increases with increasing Co content to an optimal level; subsequently, the microhardness decreases with further Co content increase. The authors attributed this decrease to a change in crystal structure and grain size. In the mentioned paper under defined electrodeposition conditions, the maximum Ni-Co coating microhardness was at the level of about 50 wt. % Co.
Ni-Co coatings are relatively easy to produce by an electrolytic deposition process from aqueous electrolyte, where the standard electrode nickel potential has the value of E0 = −0.246 V and cobalt potential E0 = −0.277 V [9]. The mechanism of the Ni-Co alloy anomalous codification according to [10] is assumed by a model according to which the deposition involves an adsorbed reaction intermediate product containing both metal ions in partially reduced form. The mechanical properties of nickel-based alloy coatings can be modified by changing the electrolyte composition and operating parameters [8,11].
Change of operating conditions, e.g., current density, temperature, and pH results in coating formations that have different morphologies. As the authors state in the paper [12], for example, an increase in current density from 6.7 to 33.3 mA cm−2 resulted in the formation of a cauliflower-like structure, which increased in size with an increase in current density.
Additives are part of the galvanic bath. These are usually added to prevent the harmful effects of metal impurities in the bath. By adsorbing on the cathode surface, they affect the growth and formation of coating crystals, act as hydrogen inhibitors, modifiers, brighteners, balancers, wetting agents, and stress reducers [13].
Coating properties can also be changed by introducing additional metal elements, ceramic particles, or fibers into the nickel matrix [14]. Hard nickel coatings with low internal stress can be achieved by using additives such as, e.g., NiBr2, saccharin and the like [15,16]. Simultaneous precipitation of cobalt with nickel is hardened by nickel by forming a solid solution [1,17,18].
In studies by other authors [7,19,20,21], the attention was drawn to the description of the electrolytic deposition mechanism, structural characteristics, and magnetic and corrosive properties of Ni-Co alloy coatings.
The higher the concentration of Co in the electrolyte, the greater the formation of this solid solution matrix on the coated material surface. Co2+ variations in the electrolyte have a significant effect on grain size and cobalt content in electroplated Ni-Co alloys [7].
The alloy coating morphology and grain size are significantly affected by Co content. The surface coating morphology changes from pyramidal to spherical with increasing Co content [22]. The microhardness of Ni-Co coatings increases up to the maximum value, and then it gradually decreases. The microhardness of Ni-Co alloys increased initially with Co content to the maximum value and then gradually decreased. The authors confirmed in the paper [23] that the maximum hardness is associated with the smallest grain size according to the Hall–Petch effect: H = H0 + kd−0.5, where H0 is the hardness constant, k is the constant, and d is the grain diameter (average grain size).
Tribological properties studies of coatings show that cobalt-rich alloys have lower friction coefficient and higher wear resistance compared to Ni-rich alloys. The authors [15,16] attribute this behavior to a different coating phase structure. Alloys with a high Co content show more stable frictional behavior compared to Ni-rich alloys. In alloys with high Co content, the transformation of crystals from fcc to hcp is the reason for lower friction coefficient. In the paper [15], it was determined that Co content higher than 49 wt. % results in a decrease in friction coefficient.
An example for Ni-Co coatings used at high temperatures is the copper mold working surface protection during continuous casting. High casting speeds place increased demands on mechanical properties of the material from which the molds are made, especially on their functional surfaces. The application of surface treatment technology to the mold surface increases its hardness and abrasion resistance. For this reason, it increases productivity, improves product quality, and reduces the overall casting process costs. [10,17].
In this work, the influence of Co content in alloyed Ni-Co coating on the coating hardness and wear resistance at 400 °C will be studied. Tribological tests results will be compared with the coating tribological properties obtained at normal temperature that were published in other works of authors of this article [24,25].
An example of Ni-Co coatings used at high temperatures is the copper mold working surface protection during continuous casting. High casting speeds place increased demands on mechanical properties of the material from which the molds are made, especially on their functional surfaces.
The application of surface treatment technology to the mold surface increases its hardness and abrasion resistance. For this reason, it increases productivity, improves product quality, and reduces the overall casting process costs [10,17]. Currently, mold surfaces are improved by depositing Ni galvanic coatings on their surface [26].
Research has shown that electroplated Ni-Co alloy coatings show better properties compared to pure Ni coating. Ni-Co alloy shows higher hardness, better adhesion, high resistance to wear and corrosion, and good stability at high temperatures [15,16,19,20]. Wang et al. in their paper [23] investigated the influence of cobalt content on mechanical and microstructural properties of the Ni-Co alloy coating. Ni-Co alloy coatings were found to have approximately twice the microhardness of pure Ni coatings. It was also found that Ni-49Co coatings with max hardness showed reduced wear rate compared to pure Ni coatings.
In our previous studies [24,25], the mechanical and tribological properties of Ni-Co coatings at ambient temperature were analyzed. Therefore, the aim of the present paper is to continue our studies of these coatings. In this paper, the mechanical and tribological properties of Ni-Co alloy coatings with different Co content at the temperature of 400 °C will be monitored. This temperature corresponds to the mold wall heating temperature during metallic liquid phase solidification, when the coating applied to the mold surface reduces the abrasive degrading effect of the liquid phase.

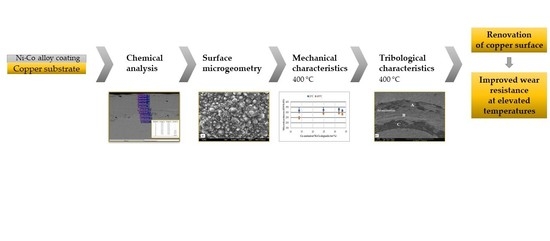
2. Materials and Methods

For the experiments, prism shaped coated samples with square basis with a size of 18 mm × 18 mm were used. Technically pure copper (99.5% Cu) was used as the base material on which Ni-Co galvanic coatings were applied.
Regarding the galvanic coatings’ deposition process, it is necessary to watch the following main parameters: the bath composition, current density, and coating time (Table 1).
After the electrodeposition process to determine the chemical composition of the produced coating, quantitative EDX analysis on the scanning electron microscope JEOL AC 7000F was used with a microanalyzer INCA xSight fy, Oxford Instruments.
To confirm the chemical composition homogeneity of the Ni-Co coatings, the “EDS line-scan analysis” was used.
On mechanically and chemically readjusted copper surfaces, micro geometrical characteristics were measured, which namely included the following: the mean arithmetic deviation of the profile Ra, the greatest height of the profile Rz, and the average number of peak counts per unit length Pc. The micro geometrical characteristics were measured on a Taylor/Hobson–Surtronic 3 device, and the total measured length was lc = 4.8 mm. To measure sample microhardness, a galvanic Ni-Co coating was used for the microhardness test under Vickers on the LECO microhardness tester device LM 700 AT with the load of 50 g in the direction perpendicular to the sample surface with the Cr coating. The average microhardness value HV0.05 was obtained from ten measurements.
The tribological characteristics of Ni-Co coatings at elevated temperatures were determined using the Pin-on-Disc Test, which was performed on the tribometer CSEM device. The test parameters at the temperature of 400 °C are listed in Table 2. In the chapter Results and Discussion Section, the measured tribological characteristics of Ni-Co coating at the temperature of 400 °C are compared with the tribological characteristics obtained at the temperature of 23 °C from our previous studies [10,18].
During the measurements, the friction coefficient, COF, was recorded between the coating and the bead depending on the runway length. The ball created a track on the sample, which was further analyzed by scan electron microscope JEOL AC 7000F.

3. Results and Discussion

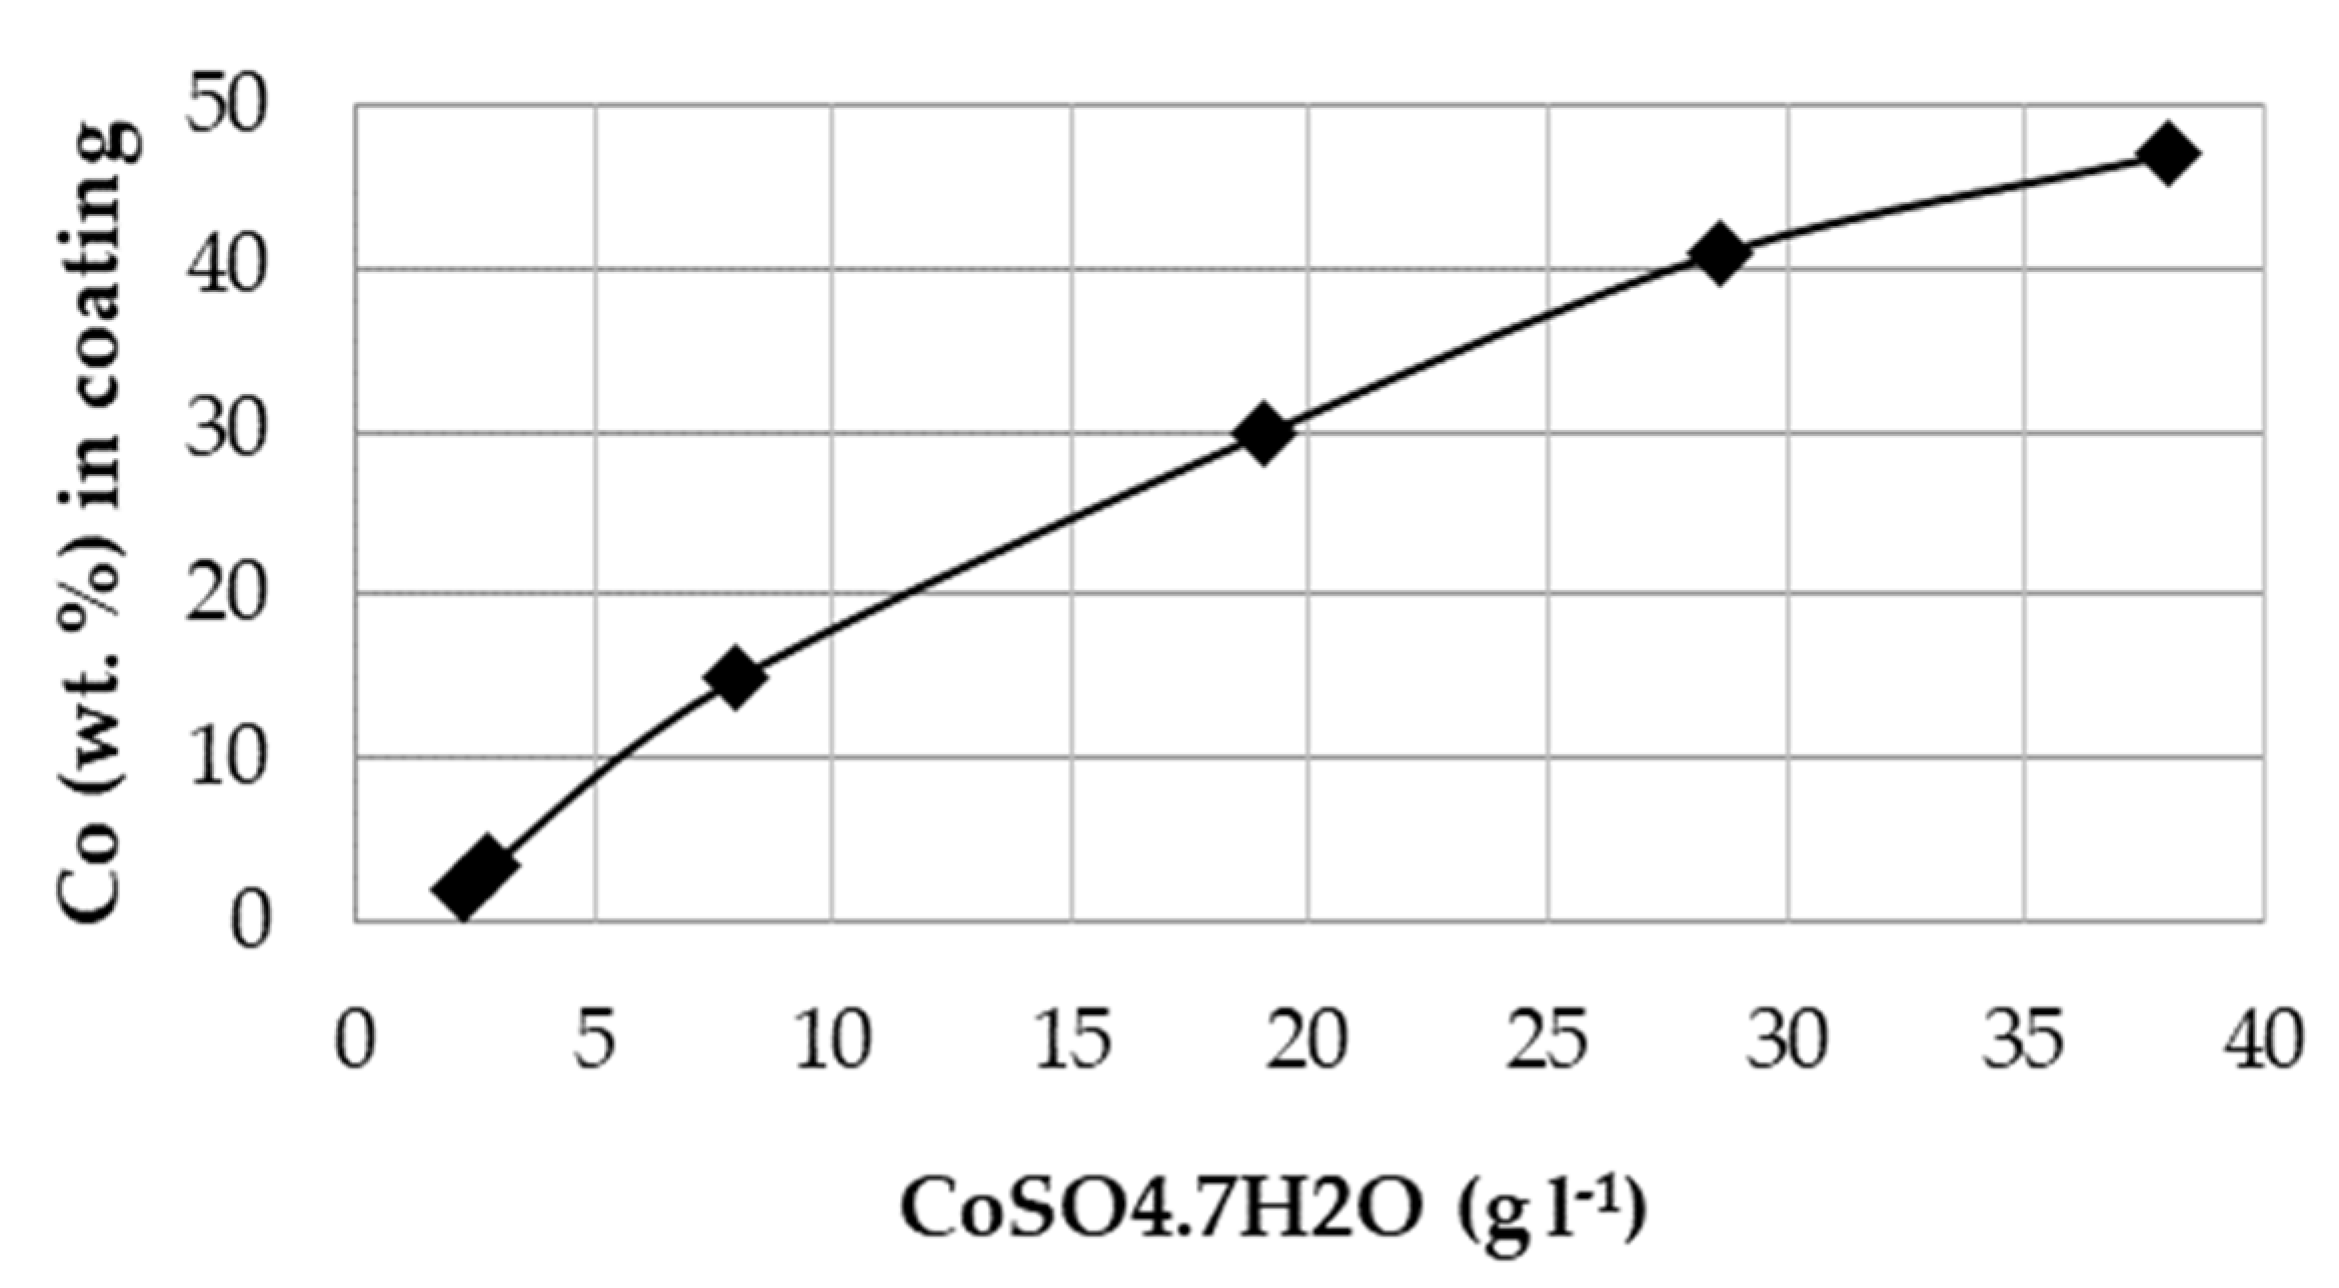
3.1. Chemical Analysis of Ni-Co Coatings

The deposition process resulted in an alloyed Ni-Co coating with the thickness of 30 µm and with Co content varying depending on the amount of CoSO4 · 7H2O g L−1 in the bath, Figure 1, determined at a current density of 2 A dm−2.
On basis of the data processed on Figure 1, it was possible to prepare the alloyed Ni-Co coating with the desired chemical composition in a wide interval of basic component concentrations according to the Ni-Co diagram [27]. According to Figure 1, it was observed that the Co content in the alloy coating gradually increased with increasing Co2+ concentration in the electrolyte. The Cobalt weight fraction (in wt. %) in the alloy was always higher than the weight fraction in the electrolyte, which can be explained by anomalous Ni-Co alloy co-depositions. Namely, less noble metal (Co) was preferably deposited [23].
Chemical analysis in the form of an “EDS line scan profile” in the cross section of the coatings was used to confirm uniform Ni and Co distributions in the coating (Figure 2).
The cobalt concentration in the Ni-Co coating reached a balanced value after its cross-section, which indicated stable technological conditions (especially current density) in the electrochemical process.

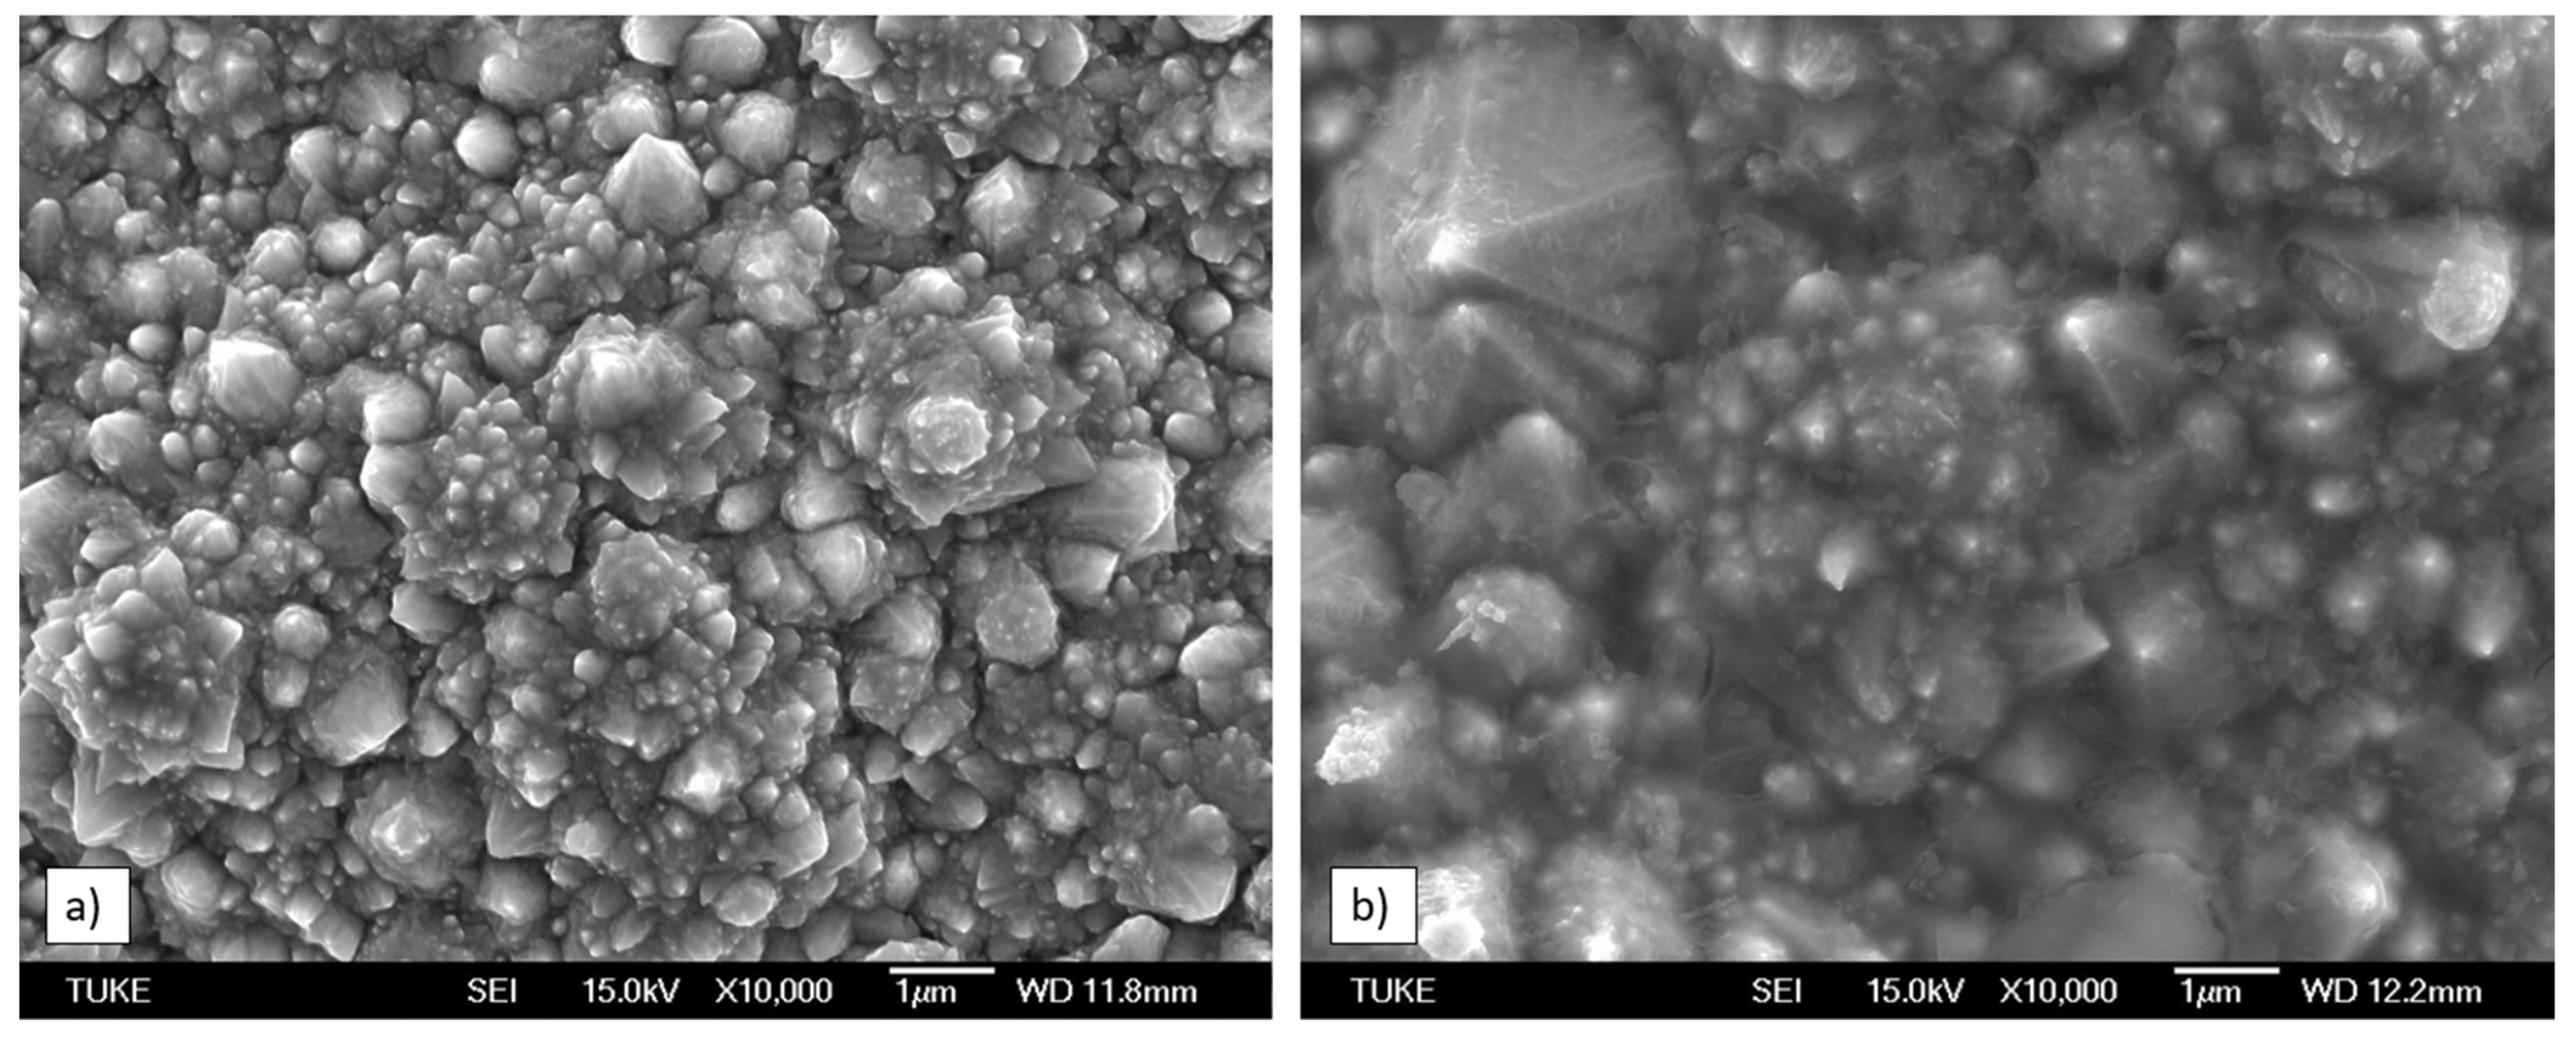
3.2. Surface and Surface Microgeometry

The coated samples surface was studied by the scanning electron microscope of the type JEOL AC. The surface morphology of the Ni-Co coatings deposited at current densities of 1, 2, 4, and 6 A dm−2 is presented on Figure 3 and Figure 4. The based nickel galvanic coatings are characterized by the cauliflower-like structure. The surface morphology of the coating consists of uniform spherical fine grain blisters. Current density significantly affects the structure and morphology of the coating. This technology parameter determines not only the rate of the coating formation but also the intensity increase in coating growth and, thus, the size and distribution of crystals in the structure of the coating. With increasing current densities, the coatings’ microgeometry varied and created a subtle arrangement of crystals. At a suitably chosen value of current density, the formation of more subtle coatings occurred, which provided more appropriate microgeometrical characteristics [10,24]. The structure of the applied Ni-Co coating is characterized by solid solution formation; increasing the current density results in the increase in the cubic phase volume fraction. The Ni-Co coating morphology is influenced by the conditions applied during electrolysis, and it is determined by the nature of ions of the coating. Ni underlined the growth of grains during the deposition, which is manifested by typical cauliflower-like structure. The entire process determined the nucleation places’ density and final coating morphology [15,23].
The measured base material surface microgeometry values in initial state before its metallization and the surface with Ni-Co coating according to EN ISO 4287 are listed in Table 3.
As was investigated by the authors in the papers [8,10], by adding the optimal amount of saccharin additives in the nickel-cobalt coating deposition process, wear resistance increased due to the reduction in grain size, which, according to the Hall–Petch relationship [23], also resulted in increased coating hardness. The coatings’ surface morphology also affected the friction coefficient course. Galvanized coatings were uniform and copied the substrate’s surface. Their roughness was, therefore, significantly different from the roughness of the substrate on which they were bound [10,24].

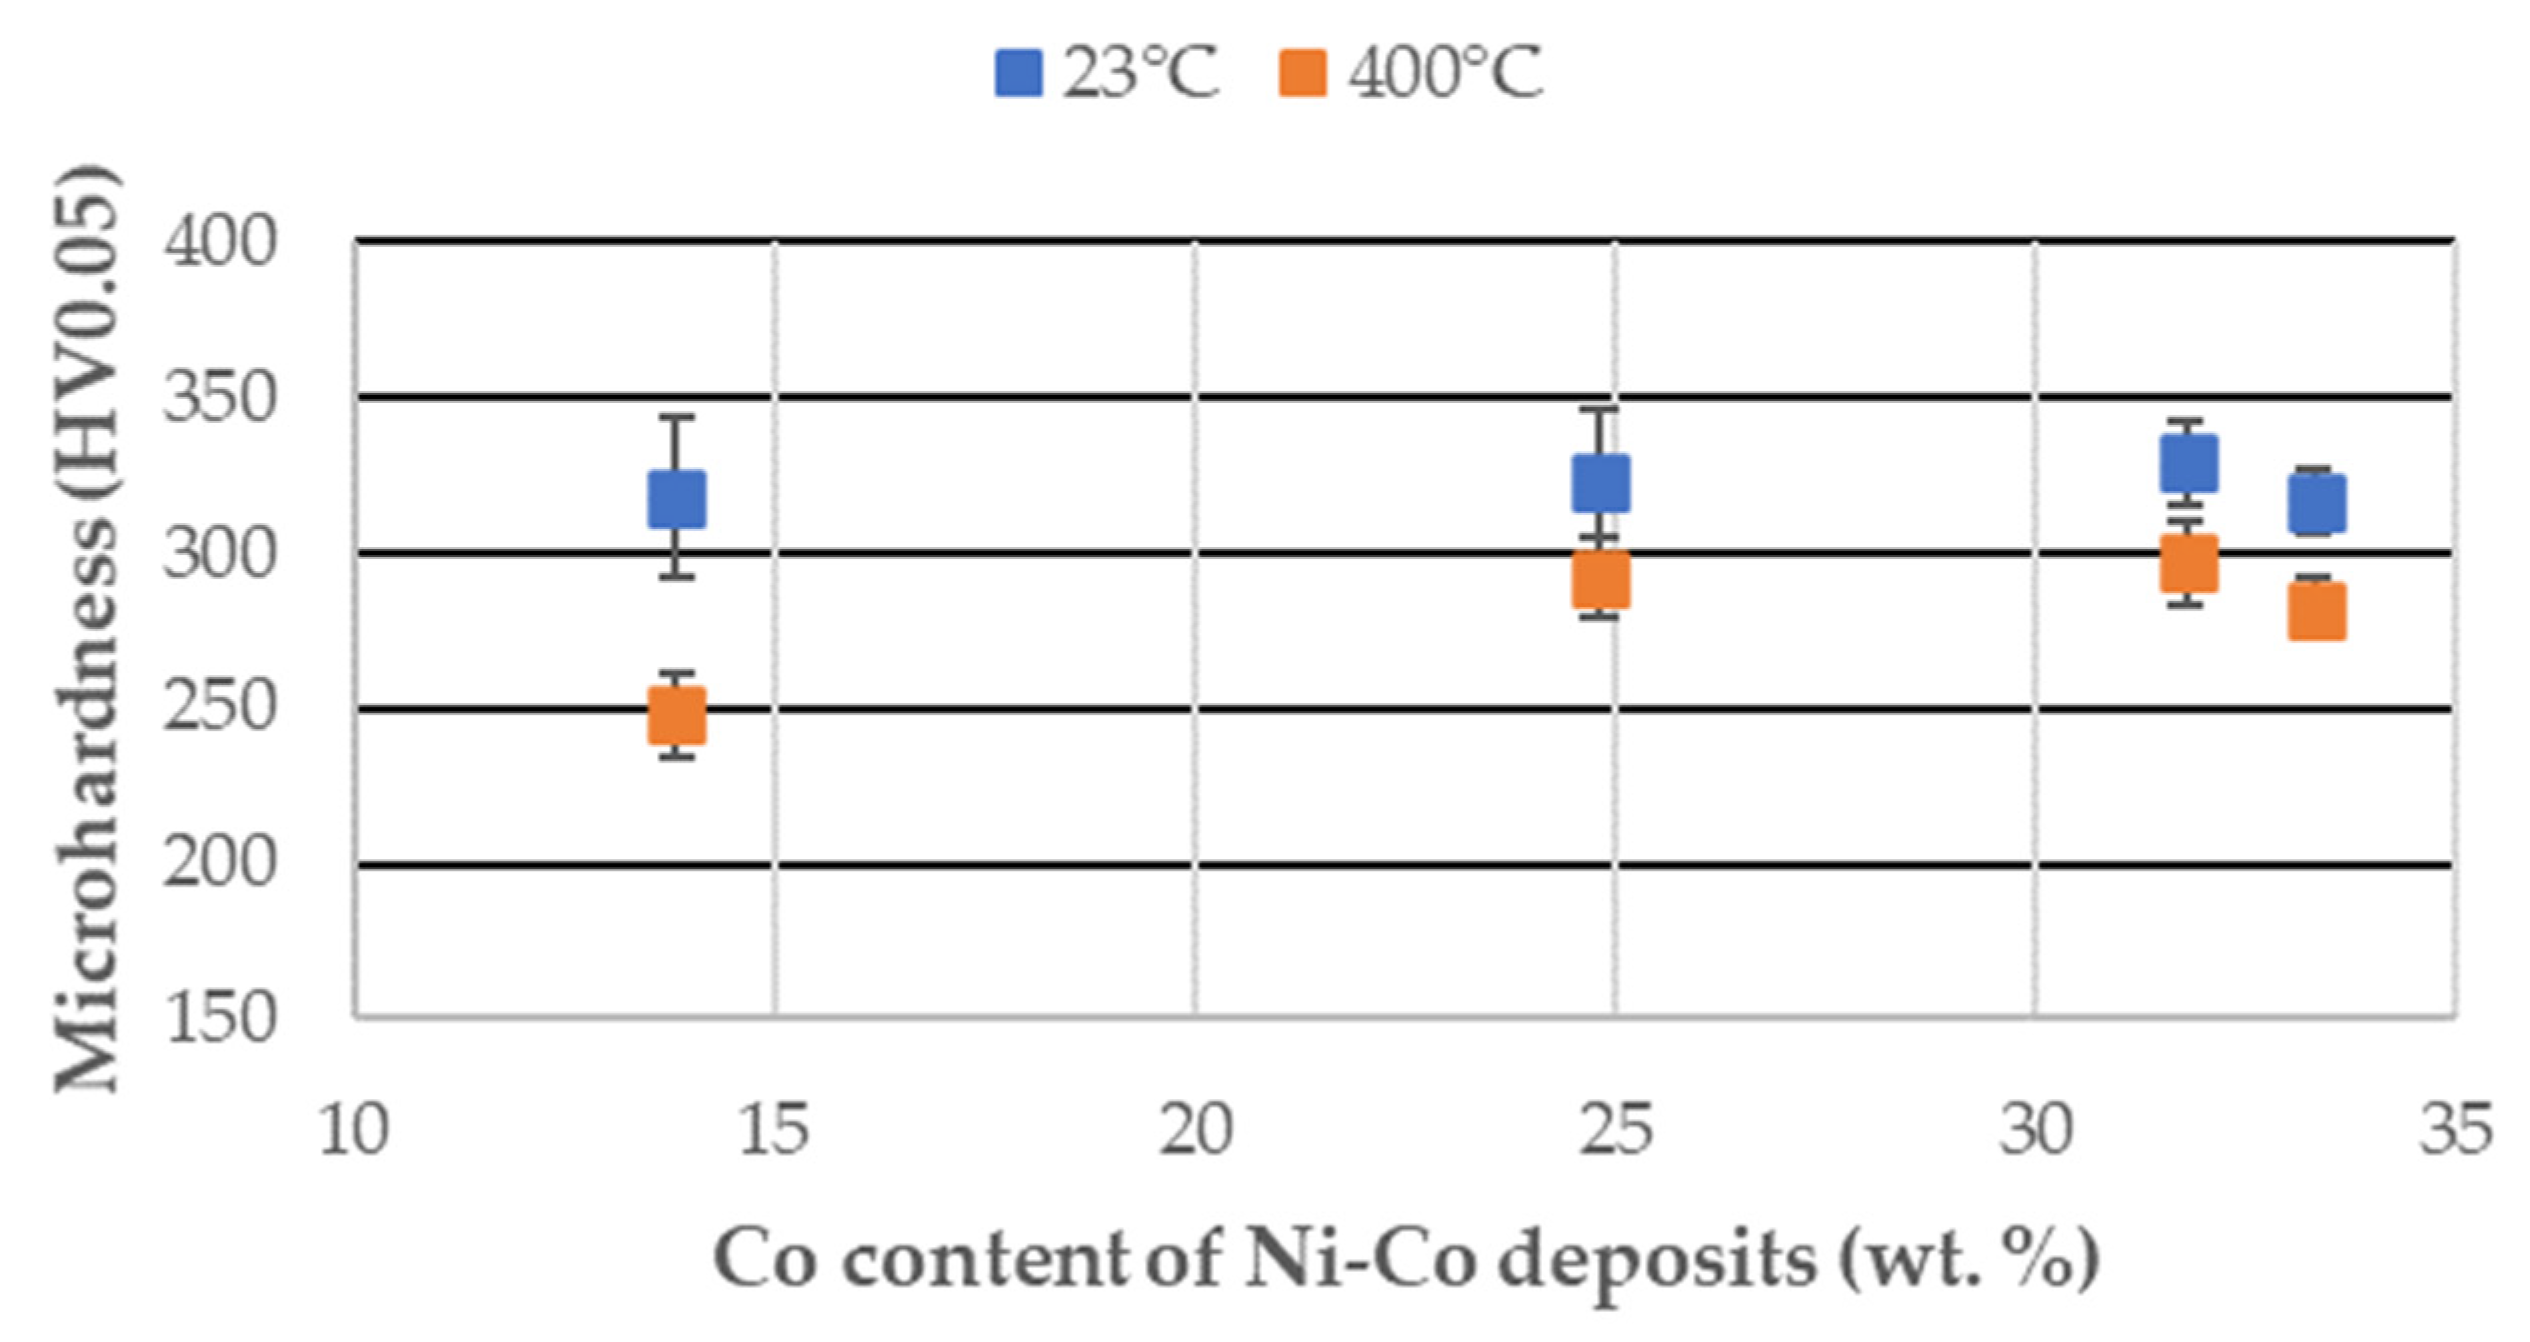
3.3. Mechanical Characteristics

The hardness of Ni-Co coatings with a thickness of 30 µm was determined by the Vickers method of measurement with a load of 50 g at a temperature of 400 °C. The measured values of HV0.05 are graphically presented on Figure 5 and expressed depending on the Co content in the coating. In [1], the authors stated that when the cobalt content was higher than 49 wt. %, the wear rate gradually decreased due to the increased microhardness from 315 to 462 HV. In the paper [11], the authors determined that at the room temperature the microhardness of Ni-Co alloys coatings increased gradually up to the Co content of 50 wt. %; however, further Co content increases resulted in a drop in microhardness. This is the result of the crystal structure composition of an alloy with a high proportion of the hcp phase [28]. In paper [28], the authors stated that the friction coefficient of the Ni-based coating correlated with the alloy coating microhardness. In [15], the hardness increase could be attributed to the grain refinement effect by an increase in current density. The microhardness of electrodeposited Ni-Co coatings was in the range of 482–610 HV [20]. The microhardness values depending on the Co portion correlated with both performed tests, while there was a reduction in the microhardness values of about 9.5 to 22% in the process at 400 °C. With the Co portion of 31.8%, a microhardness decreases of roughly 5% at both temperatures was observed. With further increases in Co portion to 33.32%, the hardness increased again for both temperatures (Figure 5).
A decrease in the microhardness of the Ni-Co coating at the room temperature was recorded from the Co content of 30 wt. % at HV0.05. A similar development of HV0.05 was recorded at 400 °C.
As was mentioned in the paper [23], the microhardness values influence the coating grain size. In the papers [10,24], the authors determined that the addition of the additive-saccharin to the galvanic bath refined the grains of the Ni-Co alloy coating, which was reflected in higher HV0.05 values. For example, at the Co content of about 15% at 400 °C after the addition of saccharin, the value was 307 HV0.05, while in our paper, without the addition of saccharin, the value was 248 HV0.05 for approximately 13 wt. % Co.

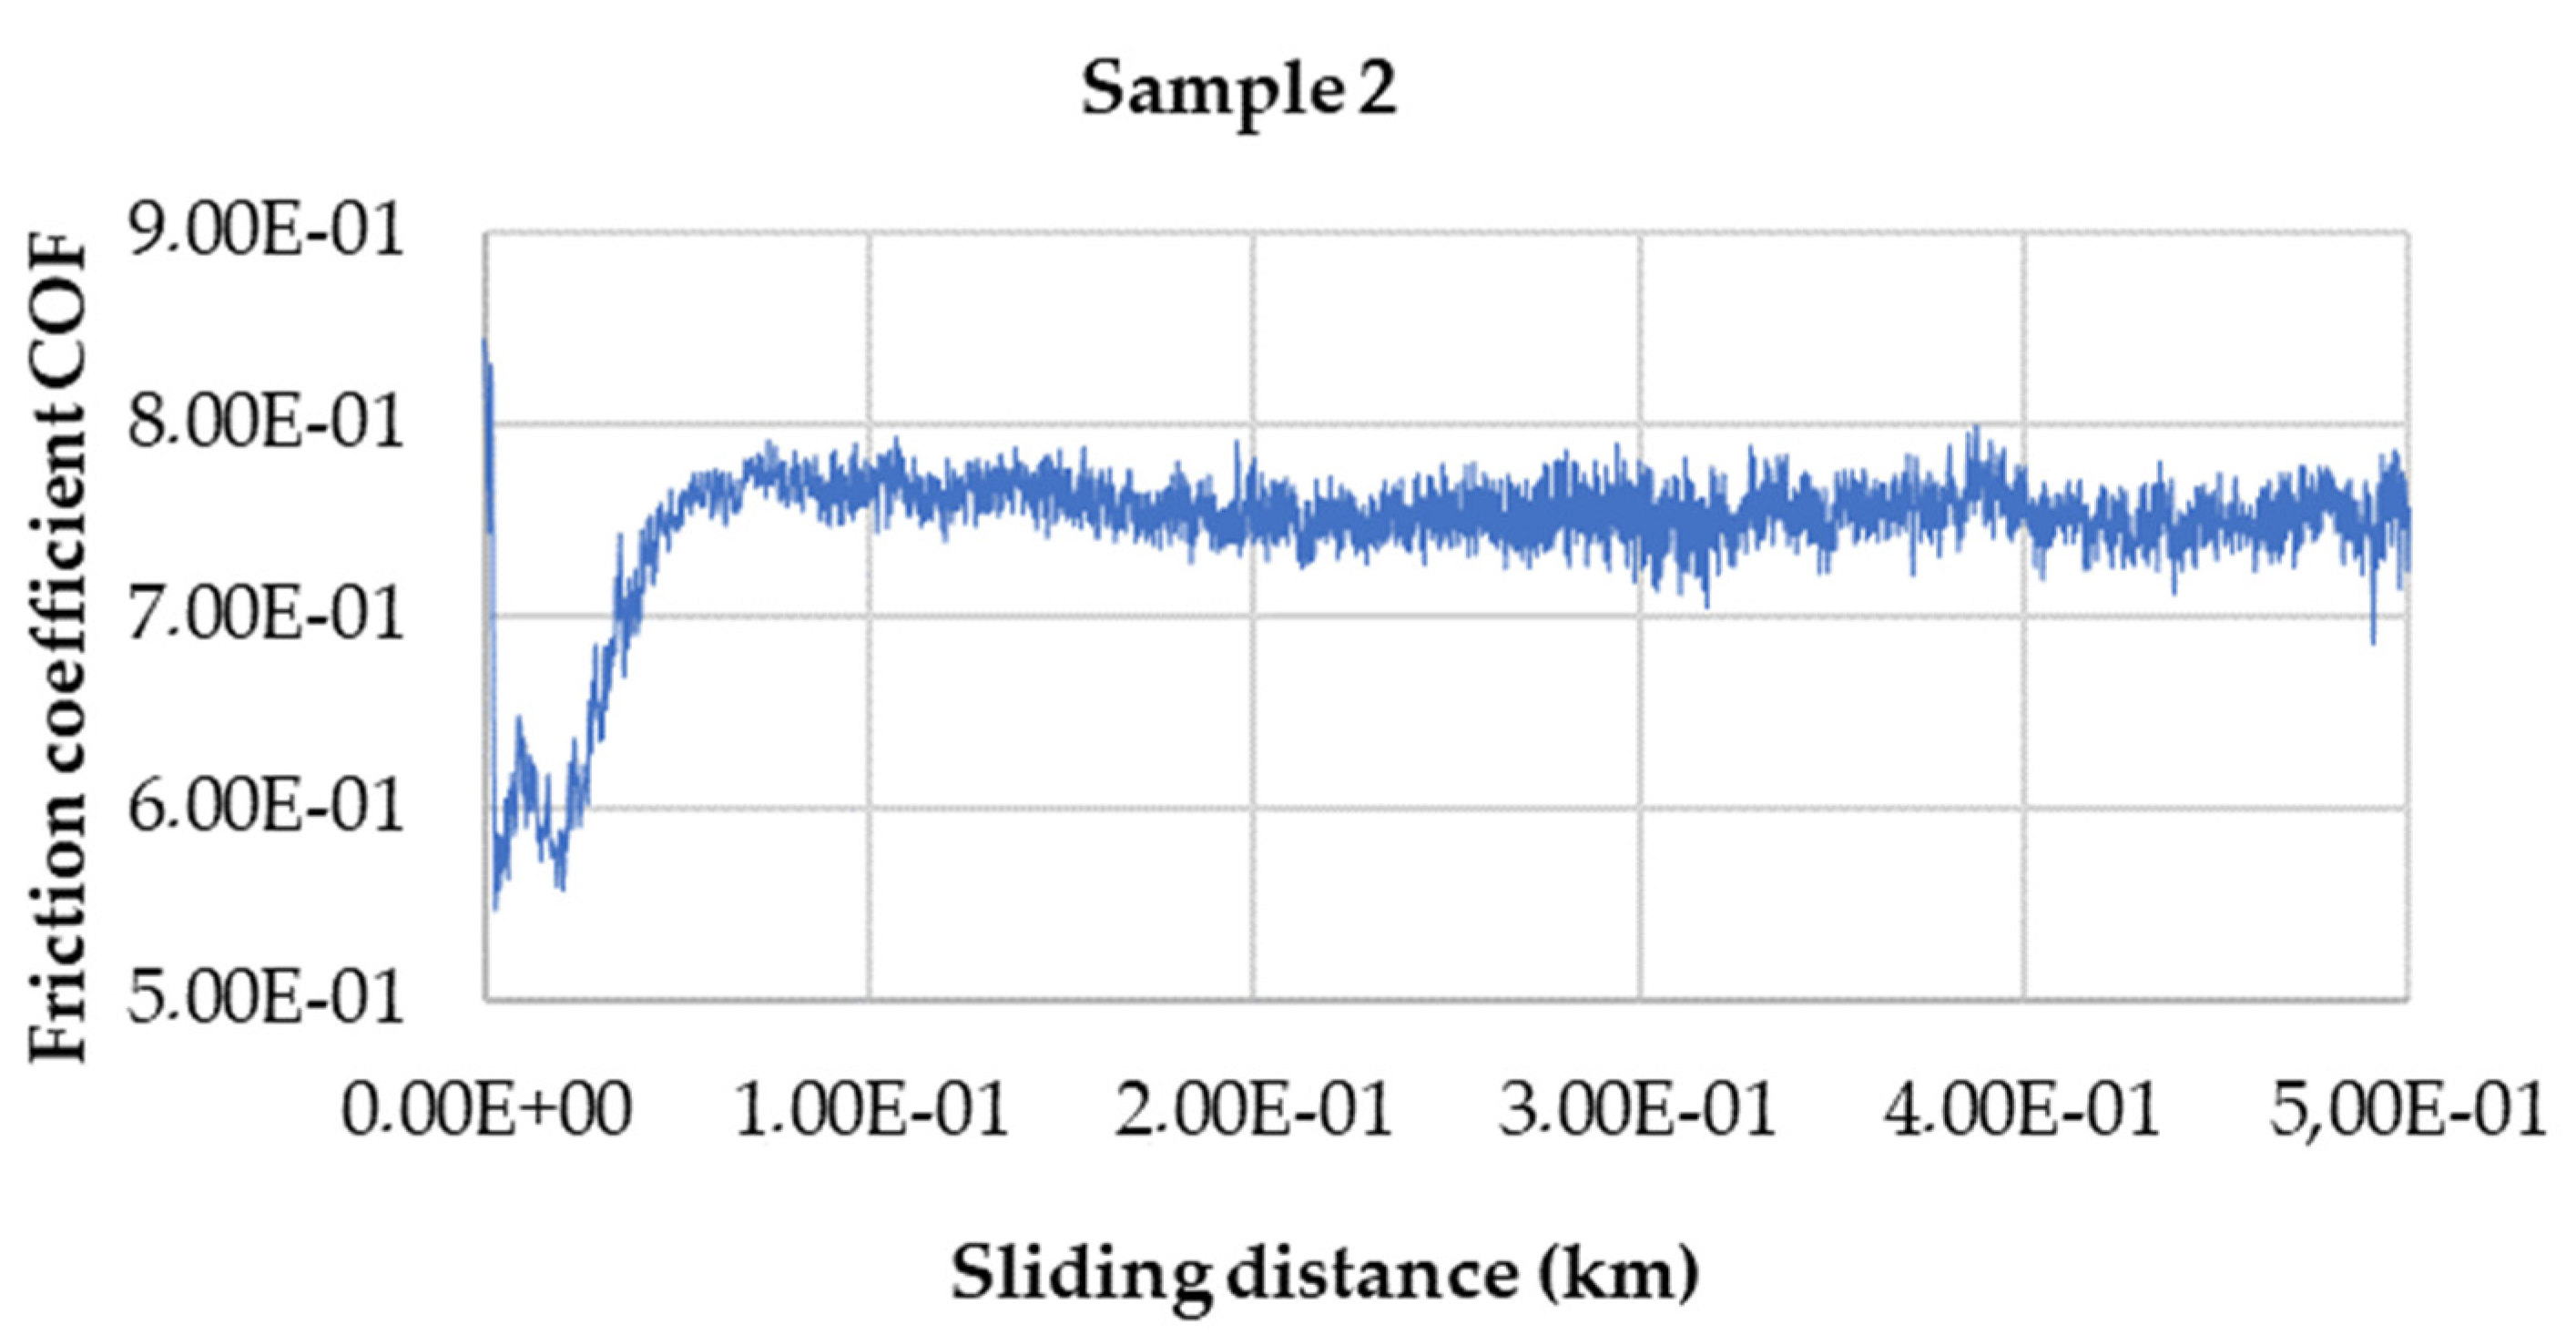
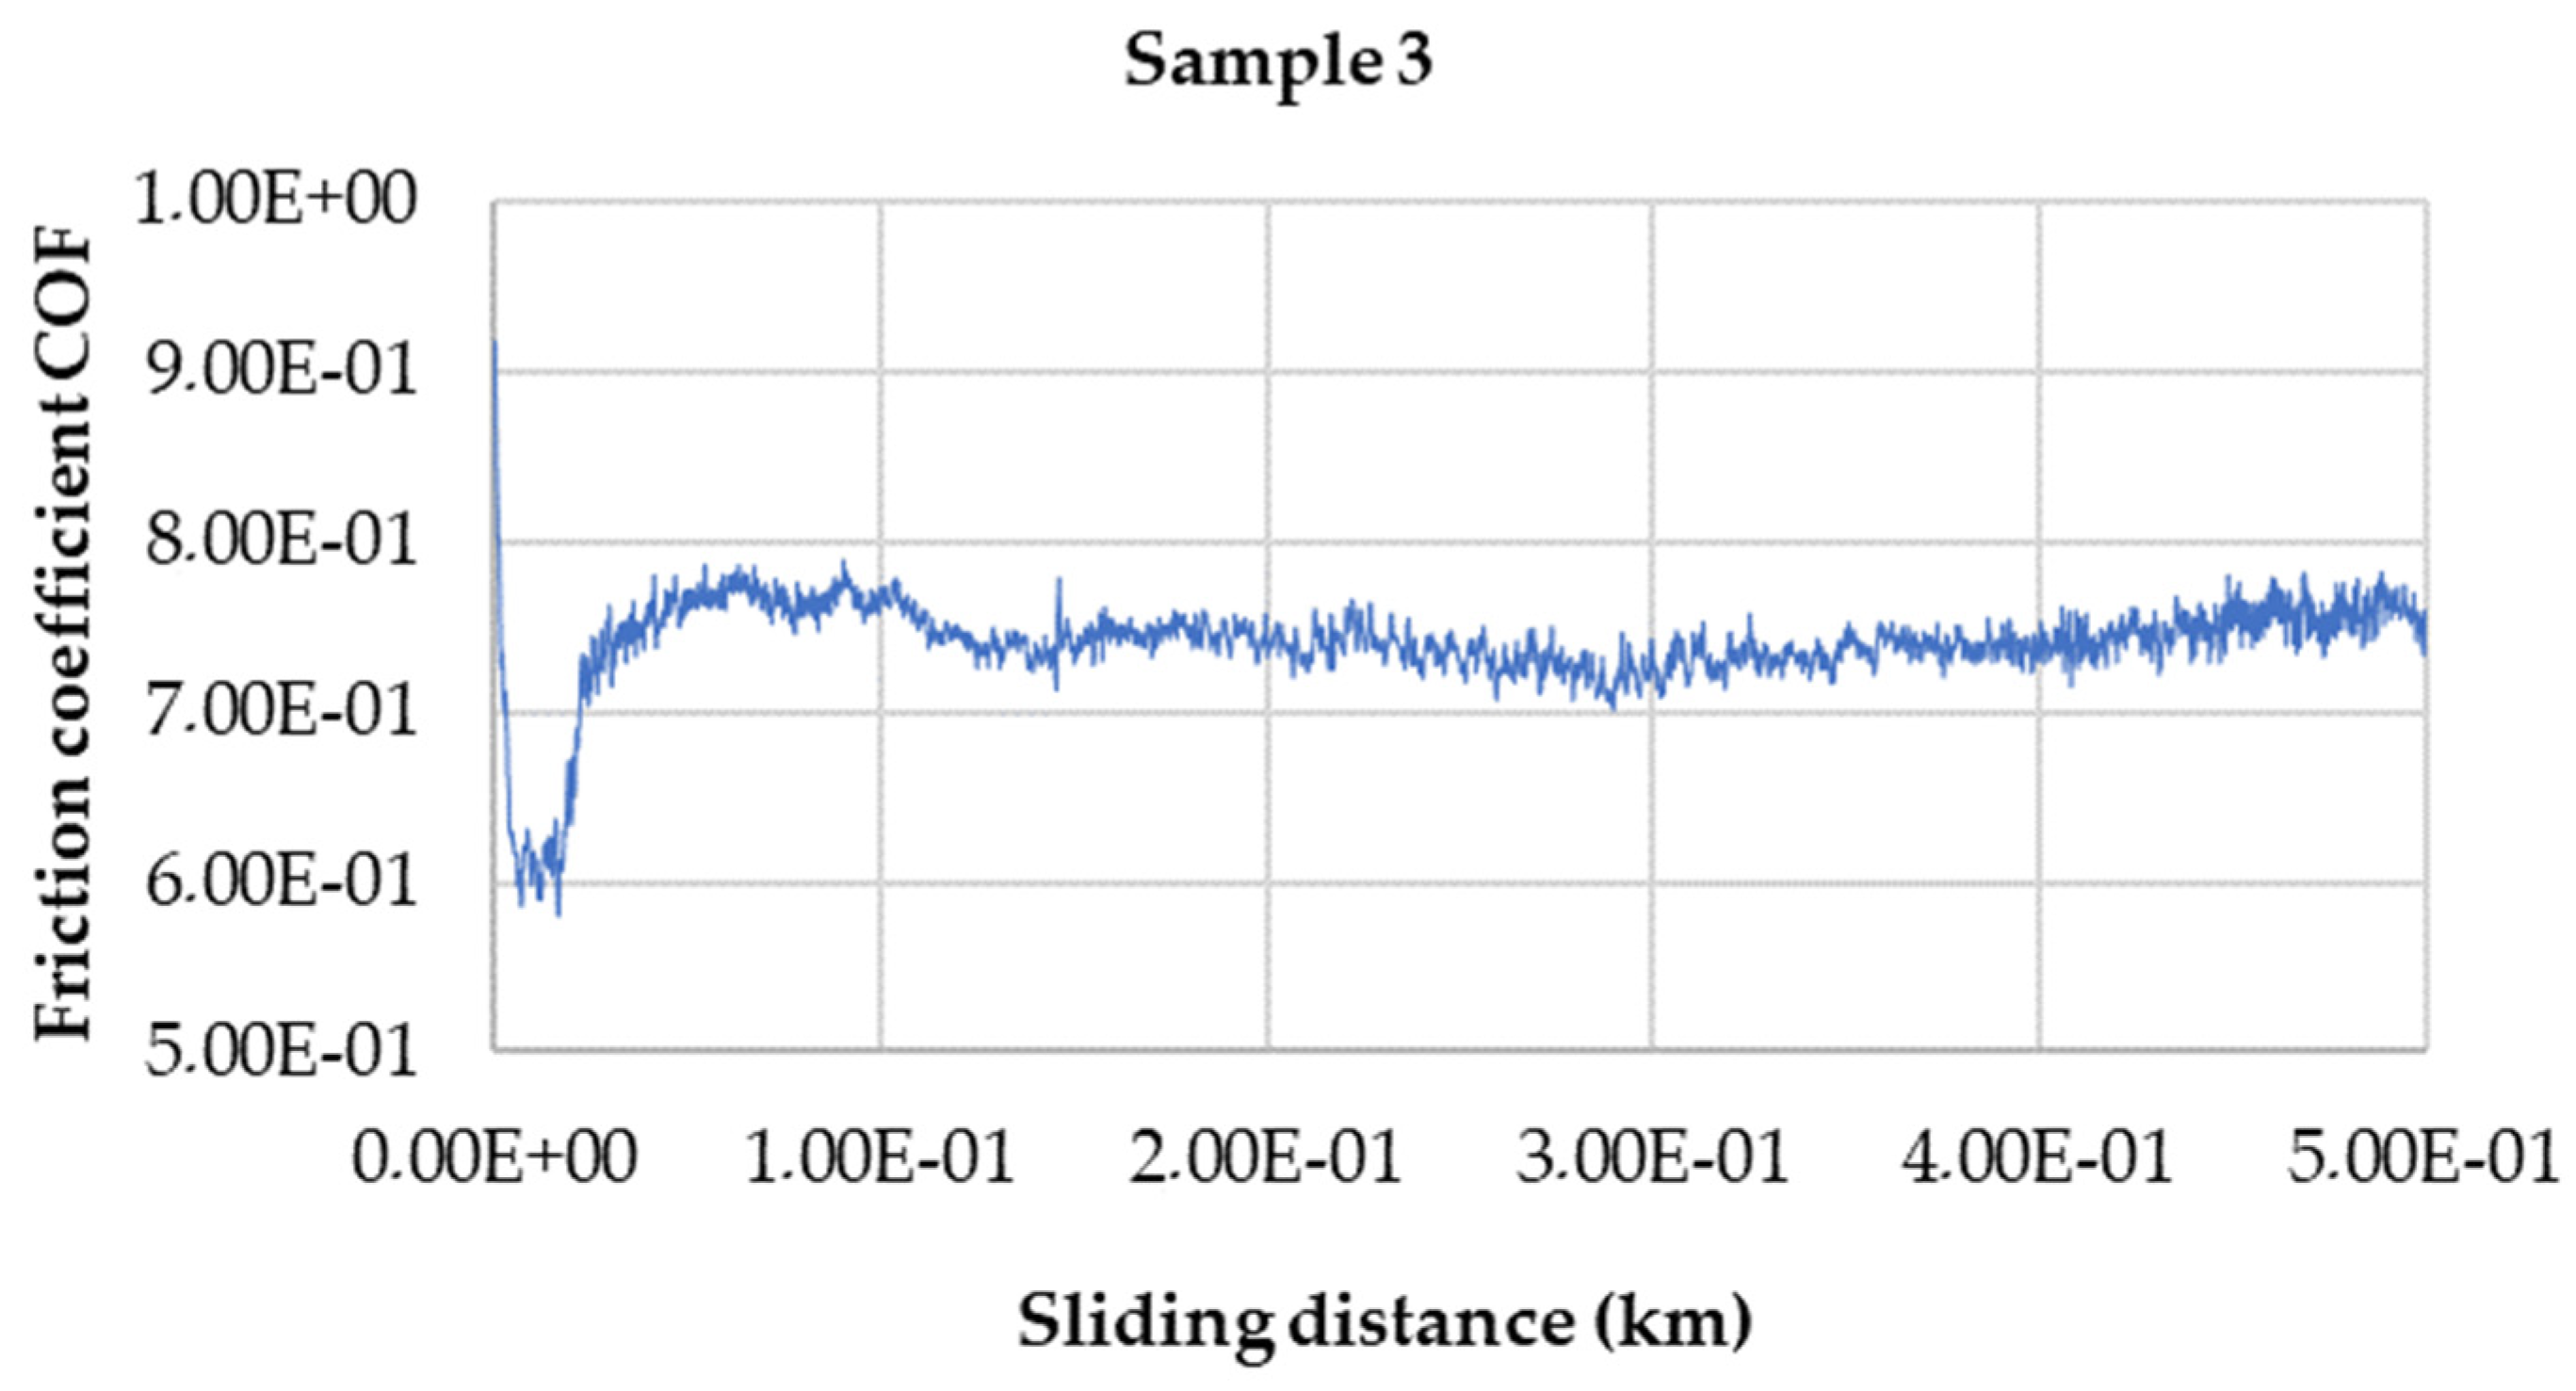
3.4. Tribological Characteristics

Tribological tests were aimed at determining the course of the COF friction coefficient at the temperature of 400 °C. The nature of the surface wear of the examined coating after the tribological test at the temperature of 400 °C was evaluated using a scanning electron microscope.
The Sample 1 COF profile at 400 °C is shown in Figure 6. After the initial COF increase to the maximum value of 0.768, it decreased, and after that the friction coefficient had a relatively stable course around the value of 0.680. The minimum value during the test was 0.660. If we take into account the highest roughness values of Sample 1, the friction coefficient showed the largest fluctuations during the process. The fluctuations in the beginning of the pin body movement up to about 15 m in all sample tests were related to the surface roughness up to the stage of the arm device movement stabilization with the pin body.
The course of COF during the pin-on-disc test on Sample 2 at 400 °C is shown in Figure 7. After an initial increase at the beginning of the test to a maximum value of 0.785, it stabilized at an average value of 0.768. The friction coefficient course almost stabilized throughout the test, which also indicated a uniform coating surface wear (compared to Sample 1).
Figure 8 shows the course of the coefficient of friction of Sample 3 at 400 °C. Compared to Samples 1 and 2, the pin body recorded the smallest deviations of surface irregularities during the test, which was reflected in a smoother course of the coefficient of friction of Sample 3 (compared to Samples 1 and 2). The coefficient of friction maximum value for Sample 3 was 0.919, and the minimum value was 0.580.
In Figure 9, the COF profile for Sample 4 at 400 °C is shown, which decreased slightly to a minimum value of 0.698 at the end of the test. The friction coefficient maximum value for Sample 6 was 0.814. The test results were compared with the COF values for Ni-Co coatings obtained at 23 °C, which were published in [18].
The effect of Co content in Ni-Co alloy on COF at room temperature in the tribo test and at 400 °C is shown in Figure 10.
With increasing Co content in the Ni-Co coating, the friction coefficients in both stages almost correlated, however, increasing the process temperature to 400 °C increased the wear rate of the coating, thus increasing the COF. This also corresponds to the comparison with microhardness values, Figure 6, which are lower at 400 °C.
An increase in the COF at 400 °C indicated deterioration in coating tribological behaviors. The solution would be to add saccharin to the bath in order to refine the structure of the deposited coating. As a result, there would be finer grains in the structure [8,10]. On Figure 11 and Figure 12, tribological traces of the Pin-on-Disc Test at 400 °C obtained by using a scanning electron microscope indicating the sites of the EDX analysis are shown by way of illustration. On the tracks, it is possible to observe a slight layering of the coating material, which peeled off and moved as the ball moved. The layered coating material was also extruded from the footprint center to its edges. The coating wears up to the copper base were determined, as confirmed by EDX analysis in Figure 11 and Figure 12 of the locations marked A, B, and C (Table 4). The difference in the wear of Ni-Co coatings could be analyzed, based on the surface morphology, at and near the tribo track. At higher values of the coefficient of friction, a deformation in the pin body movement direction was observed, Figure 11a, or at the larger adhesive wear extent, Figure 11b. Greater surface roughening was observed at the tribo track–base material interface. At lower values of the coefficient of friction, the degree of adhesive wear is lower, and the surface is smoother with areas of damage in the form of grooves, Figure 12a, and in the form of scars on the overworn surface, Figure 12b. Oxygen is present in the oxides, which were generated during the test by heat generated during friction. The proportion of oxygen on the surface indicated that the surface showed a combination of abrasion wear associated with the oxidation process.
The comparison of wear resistance of pure Ni and Ni-rich alloys was presented in [17]. In that paper, the Co-rich alloys exhibited much lower friction coefficients and higher wear resistance than Ni-rich alloys. In this paper, there is a documented place on Figure 11a (Sample 1, Place B) with the highest Co content (Table 4), which revealed slight adhesive wear and a relatively smooth surface with small, damaged areas.
Table 4 shows the highest Co content in Place B on the tribo track in Sample 1 and the lowest Cu content at the same time. A different situation is observed in Sample 2, where in Place B in the tribo track, Co content is the lowest and at the same time the content of Cu increased. The higher the Co content, the higher the presumption for better friction properties [23], although this may not correspond to the highest hardness of the Ni-Co coating itself.
In the material accumulated on the outside and inside of the ball track, an increased weight percentage of nickel and cobalt was found at Places A and C. In the middle of the track, the bodies were ground up to the substrate; thus, increased copper content was recorded at Place B. Oxygen was present in the oxides that were formed during the test by the heat formed during friction. Chemical EDX analysis was an indicative parameter and depended on the location where it was determined. The tracks’ morphology was too heterogeneous to determine the pattern between wear and chemical analysis; however, Samples 2 and 3 were most grounded into the copper substrate at Place B compared to the other samples.

3.5. Profile Analysis

The track profile formed by the ball on the samples was analyzed by using a profilometer [29]. Five track profile measurements were performed on each sample at five different locations. On Figure 13 and Figure 14, the trace profile courses on the samples after the test at 400 °C and 23 °C at a current density of 2 A dm−2 are shown by way of illustration.
The track depth and width were measured. From the obtained data, the average examined parameter values were subsequently calculated and listed in Table 5.
The track width at the same temperature for the individual Ni-Co samples differed very little on average, which also indicates the uniformity of the mechanical coating wear. At 400 °C, the deepest trace was measured in Sample 3, namely 71.4 µm, and the smallest trace depth of 32.1 µm was measured in Sample 4. The tribo trace width after the test at 400 °C was in the range of 0.8 to 1.2 mm.
The tribo track depth after the test at 23 °C was significantly smaller compared to the values at 400 °C. The highest penetration was recorded on Sample 3, namely 11.6 µm. The coating on Sample 4 was least affected to a depth of 5.2 µm. The tribo traces width on the individual samples tested at 23 °C was in the range of 0.4 to 0.7 mm. In the case of samples tested at 23 °C, the coating was affected only to about 1/10 of the coating thickness.

4. Conclusions

In the paper, the mechanical and tribological properties of Ni-Co galvanic coatings at elevated temperature were evaluated and compared with the results of experiments performed at room temperature. The coatings were deposited onto the copper surface, which is in the practice material of the crystallizer. Technically pure copper (99.5% Cu) was used as the base material on which a Ni-Co galvanic coating was deposited.
Based on the performed set of experiments and achieved results, the following can be stated:
  • Knowledge of the dependence between the components content in the electrolyte, which are part of the binary system of formed coating, and the content of these components in the crystallized coating is the basis for effective galvanic process control.
  • Coating hardness depends on chemical composition, microstructure, coating strength, etc. By increasing the amount of Co by 13.83 wt. % up to 31.80 wt. %, the microhardness raises from 318 HV0.05 to 329 HV0.05 at 23 °C and from 248 HV0.05 to 297 HV0.05 at 400 °C. However, a further increase in Co content results in a drop in the microhardness to 316 HV0.05 at 23 °C and 282 HV0.05 at 400 °C. When heated to 400 °C, the microhardness values decreased by 9.5 to 22% (depending on Co content in the coating) compared to the values which were measured at 23 °C.
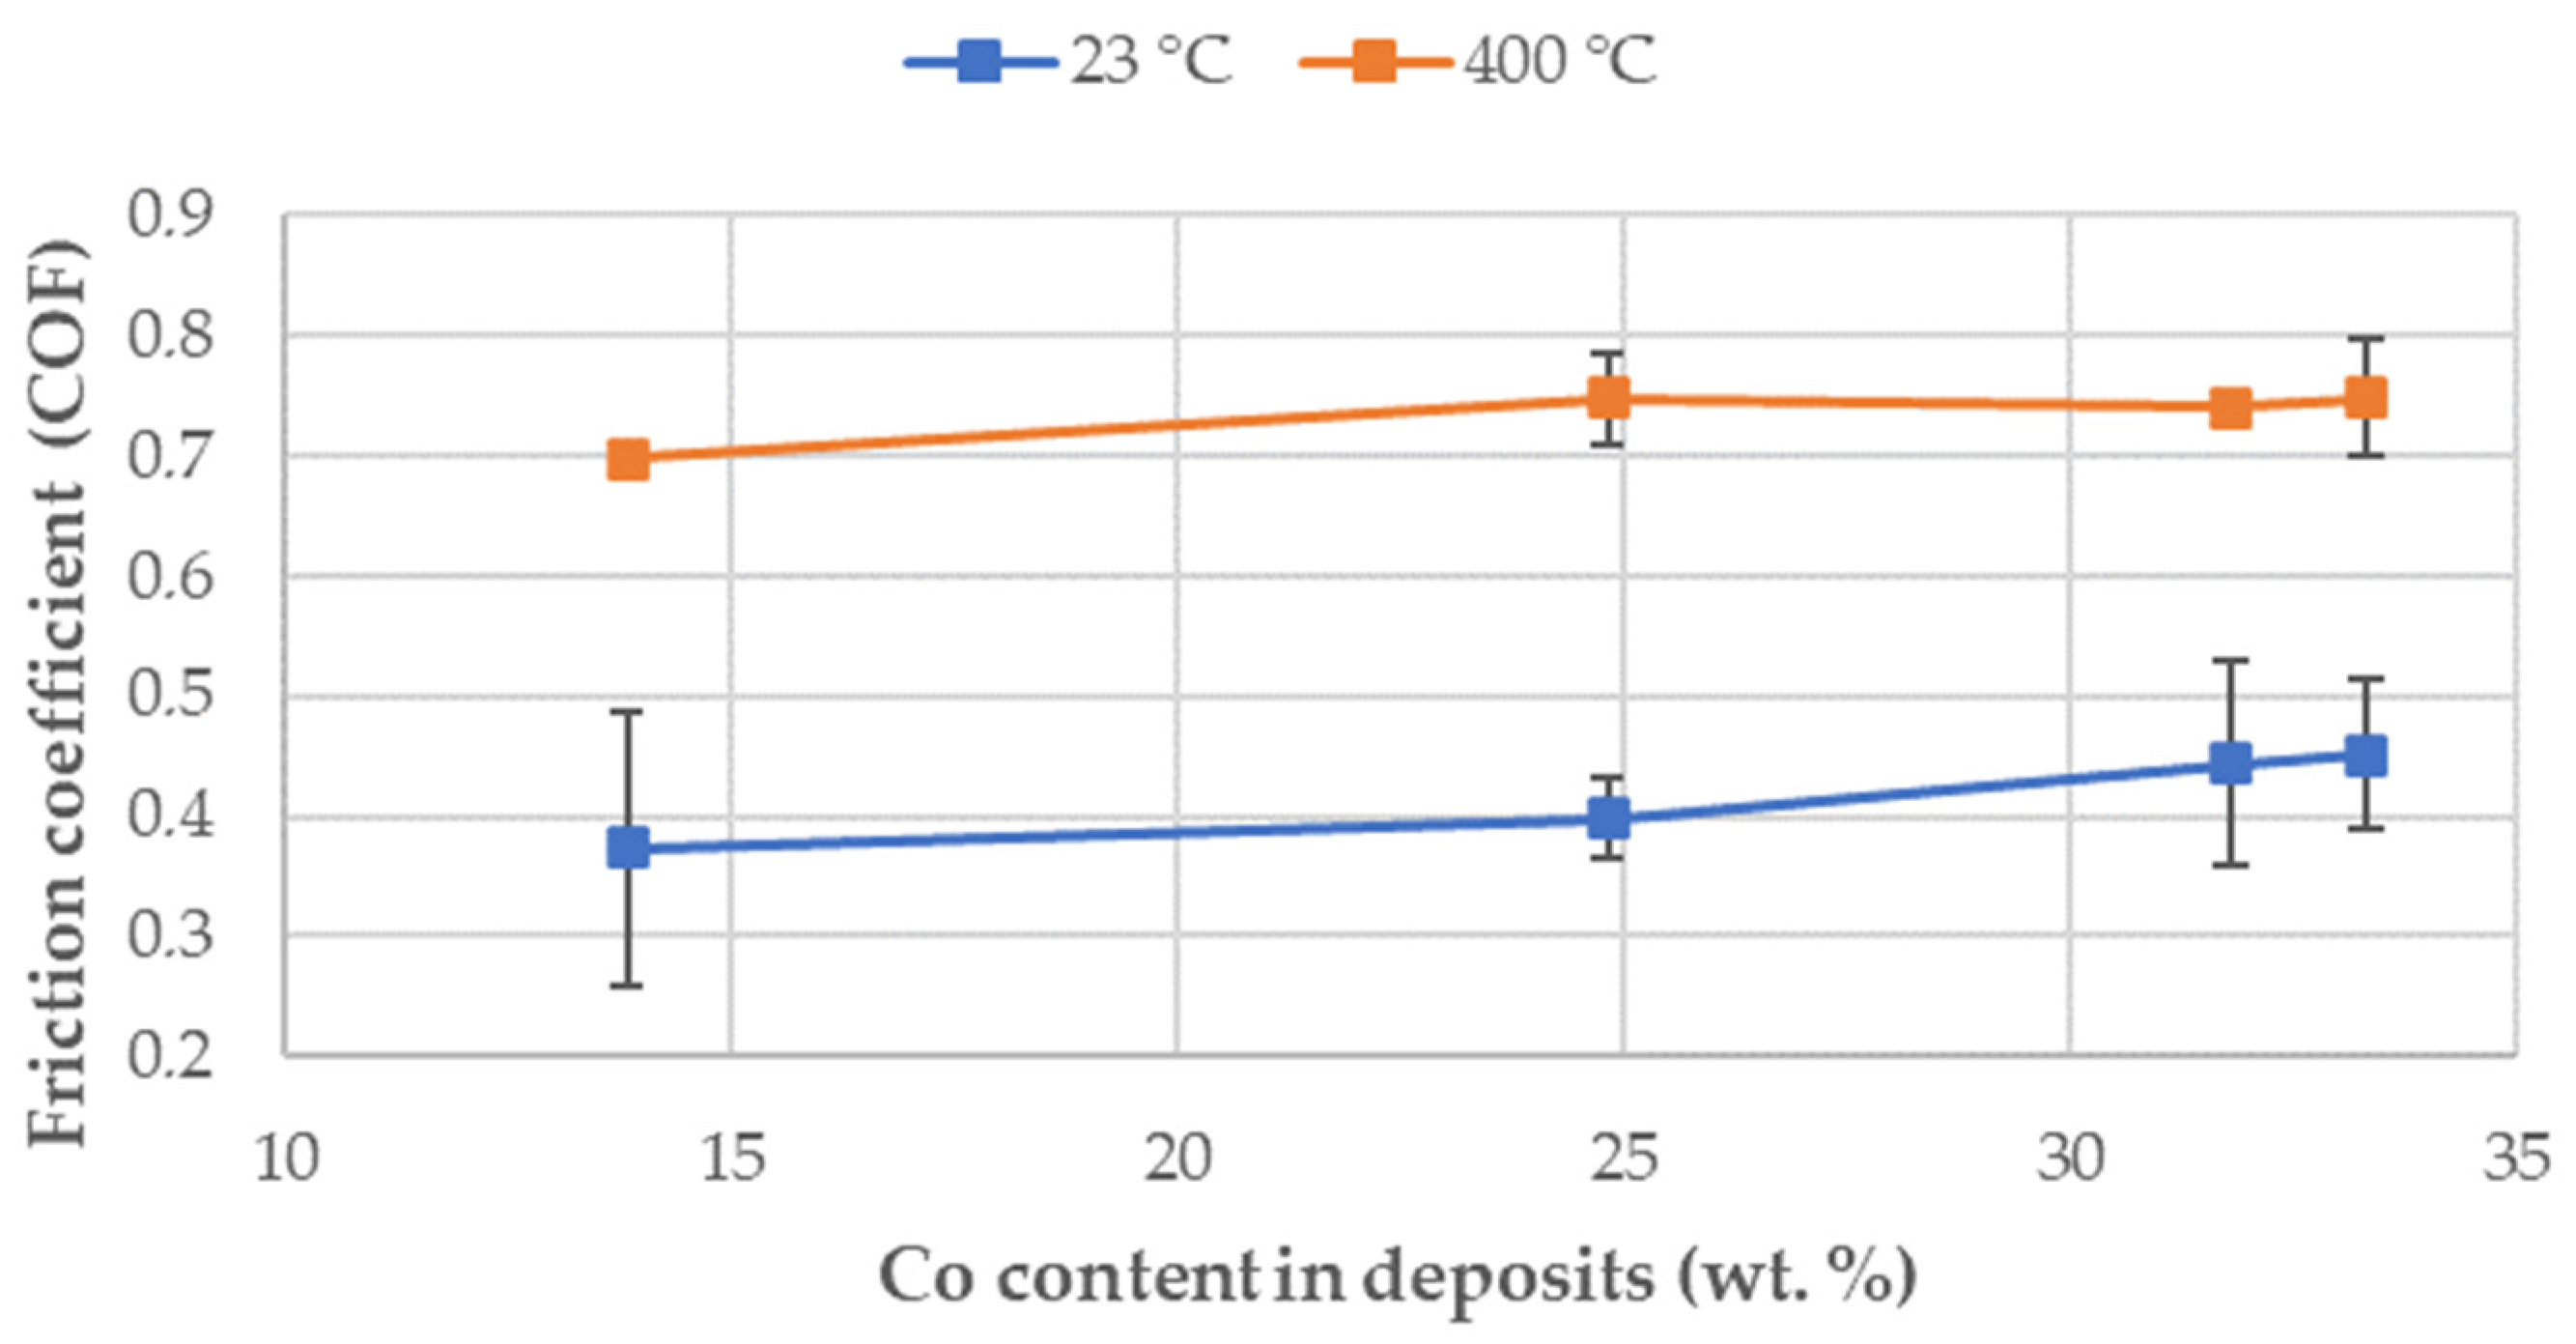
  • The COF values at room temperature ranged from 0.373 to 0.451 for the Ni-Co coating with increasing Co content. The change in COF for the Ni-Co coating at 400 °C was in the range of values from 0.680 to 0.750 depending on the Co amount in the coating. Cobalt redistribution in the tribo track affected tribo behavior. The places with higher wt. % Co had better friction properties than the places with lower wt. % Co.
The applicability of Ni-Co coatings is limited by higher temperatures. By applying Ni-Co alloy coatings, we can effectively increase the abrasion resistance of the copper mold surface. By optimizing the deposition parameters, it was possible to obtain a coating with the required quality for specific operating conditions.

Author Contributions

The research was conceptualized by J.B., M.H., and D.J.; the experiments were conducted by J.B., M.H., D.J. and G.B.; and the results were analyzed and discussed by J.B., M.H., D.J., G.B. and O.P. The manuscript was written and reviewed by J.B., M.H., D.J. and G.B. All authors have read and agreed to the published version of the manuscript.

Funding

This research was funded by the Scientific Grant Agency, “Design surface topography tools from the WC-Co applied PVD coating“ (2/0070/20), “Application of progressive technologies in restoration of functional surfaces of products” (1/0497/20), and the Cultural and Educational Grant Agency, “Modernization of teaching in the field of technologies for joining construction materials” (001STU-4/2019).

Institutional Review Board Statement

Not applicable.

Informed Consent Statement

Not applicable.

Data Availability Statement

The data presented in this study are available upon request from the corresponding author.

Acknowledgments

The research described in this paper was financially supported by the Scientific Grant Agency, “Design surface topography tools from the WC-Co applied PVD coating“ (2/0070/20), “Application of progressive technologies in restoration of functional surfaces of products” (1/0497/20), and the Cultural and Educational Grant Agency, “Modernization of teaching in the field of technologies for joining construction materials” (001STU-4/2019). This support is highly appreciated by the authors.

Conflicts of Interest

The authors declare no conflict of interest.

References

  1. Mahidashti, Z.; Aliofkhazraei, M.; Lotfi, N. Review of Nickel-Based Electrodeposited Tribo-Coatings. Trans. Indian Inst. Met. 2018, 71, 257–295. [Google Scholar] [CrossRef]
  2. Merz, R.; Brodyanski, A.; Kopnarski, M. On the Role of Oxidation in Tribological Contacts under Environmental Conditions. In Proceedings of the European Symposium on Friction, Wear, and Wear Protection, Karlsruhe, Germany, 6–8 May 2014; Dienwiebel, M., Ed.; Hindawi: London, UK, 2015. [Google Scholar] [CrossRef] [Green Version]
  3. Jin, X.; Shipway, P.H.; Sun, W. The Role of Temperature and Frequency on Fretting Wear of a Like-on-Like Stainless Steel Contact. Tribol. Lett. 2017, 65, 77. [Google Scholar] [CrossRef]
  4. Meng, Y.; Xu, J.; Jin, Z.; Prakash, B.; Hu, Y. A review of recent advances in tribology. Friction 2020, 8, 221–300. [Google Scholar] [CrossRef] [Green Version]
  5. Wu, L.; Guo, X.; Zhang, J. Abrasive Resistant Coatings—A Review. Lubricants 2014, 2, 66–89. [Google Scholar] [CrossRef] [Green Version]
  6. Kharmachi, I.; Dhouibi, L.; Berçot, P.; Rezrazi, M. Co-deposition of Ni-Co alloys on carbon steel and corrosion resistance. J. Mater. Environ. Sci. 2015, 6, 1807–1812. [Google Scholar]
  7. Mbugua, N.S.; Kang, M.; Zhang, Y.; Ndiithi, N.J.; Bertrand, G.V.; Yao, L. Electrochemical Deposition of Ni, NiCo Alloy and NiCo–Ceramic Composite Coatings—A Critical Review. Materials 2020, 13, 3475. [Google Scholar] [CrossRef]
  8. Srivastava, M.; Ezhil Selvi, V.; William Grips, V.K.; Rajam, K.S. Corrosion resistance and microstructure of electrodeposited nickel–cobalt alloy coatings. Surf. Coat. Technol. 2006, 201, 3051–3060. [Google Scholar] [CrossRef]
  9. Fotovvati, B.; Namdari, N.; Dehghanghadikolaei, A. On Coating Techniques for Surface Protection: A Review. J. Manuf. Mater. Process. 2019, 3, 28. [Google Scholar] [CrossRef] [Green Version]
  10. Dzedzina, R. Influence of Galvanic Deposition Parameters on the Properties of Ni-Based Coatings. Ph.D. Thesis, Technical University of Košice, Košice, Slovakia, 2013. [Google Scholar]
  11. Yu, J.; Wang, Y.; Zhao, X.; Li, Q.; Qiao, Q.; Zhao, J.; Zhai, S. Wear resistance of Ni-based Alloy Coatings. Adv. Mater. Sci. Eng. 2019, 2019, 2548285. [Google Scholar] [CrossRef] [Green Version]
  12. Al Radadi, R.M.; Ibrahim, M.A.M. Nickel-cobalt alloy coatings prepared by electrodeposition Part II: Morphology, structure, microhardness, and electrochemical studies. Korean J. Chem. Eng. 2021, 38, 152–162. [Google Scholar] [CrossRef]
  13. Mohanty, U.S.; Tripathy, B.C.; Singh, P.; Keshavarz, A.; Iglauer, S. Roles of organic and inorganic additives on the surface quality, morphology, and polarization behavior during nickel electrodeposition from various baths: A review. J. Appl. Electrochem. 2019, 49, 847–870. [Google Scholar] [CrossRef]
  14. Kamel, M.M.; Hamid, Z.A.; Rashwan, S.M.; Ibrahim, I.S.; El-Sheikh, S.M.; Mohamed, M.M. Electrodeposition of Ni–Co/nano Al2O3 composite coating on low carbon steel and its characterization. Int. J. Electrochem. Sci. 2020, 15, 6343–6358. [Google Scholar] [CrossRef]
  15. Karimzadeh, A.; Aliofkhazraei, M.; Walsh, F.C. A review of electrodeposited Ni-Co alloy and composite coatings: Microstructure, properties and applications. Surf. Coat. Technol. 2019, 372, 463–498. [Google Scholar] [CrossRef]
  16. Jiang, Y.; Chen, C.; Chang, T.M.; Luo, X.; Yamane, D.; Sone, M. Electrodeposition of Ni-Co Alloys and Their Mechanical Properties by Micro-Vickers Hardness Test. Electrochem 2021, 2, 1. [Google Scholar] [CrossRef]
  17. Hagarová, M. Electrodeposition of nickel and its alloys. In Electrodeposition of Nickel and Its Alloys, 1st ed.; Brezinová, J., Ševčíková, J., Eds.; Technical University of Košice: Košice, Slovakia, 2019; Volume 1, pp. 55–104. ISBN 978-80-553-3261-1. [Google Scholar]
  18. Hagarová, M.; Jakubéczyová, D.; Hvizdoš, P.; Fečková, Z.; Vojtko, M.; Dúl, G. The influence of current density on tribological behaviour Ni- Co coatings. Key Eng. Mater. 2015, 635, 127–130. [Google Scholar] [CrossRef]
  19. Yelton, W.G.; Harper, J.C. Electroplated Coatings for Friction, Lubrication, and Wear Technology. In Friction, Lubrication, and Wear Technology, 2nd ed.; Totten, E.G., Ed.; ASM International: Novelty, OH, USA, 2017; Volume 18, pp. 623–633. [Google Scholar] [CrossRef]
  20. Marita, Y.; Ridwan; Nanda, S. Nurdin Preparation of Ni-Co Alloy by Electrodeposition. Appl. Mech. Mater. 2014, 525, 58–61. [Google Scholar] [CrossRef]
  21. Hansal, W.E.G.; Tury, B.; Halmdienst, M.; Varsányi, M.L.; Kautek, W. Pulse reverse plating of Ni–Co alloys: Deposition kinetics of Watts, sulfamate and chloride electrolytes. Electrochim. Acta 2006, 52, 1145–1151. [Google Scholar] [CrossRef]
  22. Bakhit, B.; Akbari, A. Nanocrystalline Ni–Co alloy coatings: Electrodeposition using horizontal electrodes and corrosion resistance. J. Coat. Technol. Res. 2012, 10, 285–295. [Google Scholar] [CrossRef]
  23. Wang, L.; Gao, Y.; Xuea, Q.; Liu, H.; Xu, T. Microstructure and tribological properties of electrodeposited Ni–Co alloy deposits. Appl. Surf. Sci. 2015, 242, 326–332. [Google Scholar] [CrossRef]
  24. Hagarová, M.; Dzedzina, R.; Gavendová, P. Properties of Ni-Co alloy coating prepared from sulphate bath. Mater. Sci. Forum 2014, 782, 598–603. [Google Scholar] [CrossRef]
  25. Hagarová, M.; Jakubeczyová, D.; Cervová, J. Microstructure and Properties of Electroplated Ni-Co Alloy Coatings. Int. J. Electrochem. Sci. 2015, 10, 9968–9974. [Google Scholar]
  26. A kind of Continuous Casting Roll-Type Crystallizer. Available online: https://patents.google.com/patent/CN105543551B/en (accessed on 17 September 2021).
  27. Equilibrium diagrams. In Smithells Metals References Book, 8th ed.; Gale, W.F.; Totemeier, T.C. (Eds.) Elsevier Inc.: Oxford, UK, 2004; p. 1-11-1-1-553. ISBN 978-0-7506-7509-3. [Google Scholar]
  28. Liu, X.; Xu, Y.; Qu, Y.; Sun, L. Structure, Morphology and Wear Resistance of Electrodeposited Ni–Co Alloy Deposits. Integr. Ferroelectr. 2014, 152, 144–151. [Google Scholar] [CrossRef]
  29. Stylus Profilometer. Available online: http://images.frompo.com/854e40028326d5fa6be79bb32ae9fb80 (accessed on 23 July 2021).
Figure 1. Dependence of Co wt. % in coatings on the cobalt sulphate concentration in galvanic bath at a current density of 2 A dm−2.
Metals 11 01629 g001
Figure 2. SEM images and EDS analysis of Ni-Co coating with 31.80 wt. % Co deposited at 2 A dm−2.
Metals 11 01629 g002
Figure 3. Surface morphology of Ni-Co coatings: (a) Sample 1 (with 33.32 wt. % Co deposited at 1 A dm−2); (b) Sample 2 (with 31.80 wt. % Co deposited at 2 A dm−2).
Metals 11 01629 g003
Figure 4. Surface morphology of Ni-Co coatings: (a) Sample 3 (with 24.82 wt. % Co deposited at 4 A dm−2); (b) Sample 4 (with 13.83 wt. % Co deposited at 6 A dm−2).
Metals 11 01629 g004
Figure 5. Microhardness in dependence on Co content in Ni-Co coatings at the temperatures of 23 °C and 400 °C.
Metals 11 01629 g005
Figure 6. Course of COF for Ni-Co coatings (Sample 1) deposited at 1 A dm−2.
Metals 11 01629 g006
Figure 7. Course of COF for Ni-Co coatings (Sample 2) deposited at 2 A dm−2.
Metals 11 01629 g007
Figure 8. Course of COF for Ni-Co coatings (Sample 3) deposited at 4 A dm−2.
Metals 11 01629 g008
Figure 9. Course of COF for Ni-Co coatings (Sample 4) deposited at 6 A dm−2.
Metals 11 01629 g009
Figure 10. The influence of Co content in coatings on the friction coefficient (COF) at the temperatures of 23 °C and 400 °C.
Metals 11 01629 g010
Figure 11. The worn surface of Ni-Co coatings: (a) Sample 1; (b) Sample 2. The A, B, and C places mark the EDX analysis locations.
Metals 11 01629 g011
Figure 12. The worn surface of Ni-Co coatings: (a) Sample 3; (b) Sample 4. The A, B, and C places mark the EDX analysis locations.
Metals 11 01629 g012
Figure 13. Tribological track profile on Sample 2 after the test at 400 °C.
Metals 11 01629 g013
Figure 14. Tribological track profile on Sample 2 after the test at 23 °C.
Metals 11 01629 g014
Table 1. Coating process parameters.
Sample NumberElectrolyte ParametersCoating Process Parameters
CompositionpHTemperature (°C)Current Density (A dm−2) **Deposit Time (min)
1640 g L−1 NiSO4. 6H2O,
10–20 g L−1 NiCl2,
8–40 g L−1 CoSO4. 7H2O,
20–30 g L−1 H3BO3 *
455115–25
22
34
46
* Boric acid was added to the electrolyte as pH buffer. ** The maximum current density value was opted for to achieve the highest current efficiency, and the deposition process was not accompanied by the hydrogen evolution at the cathode [10,17].
Table 2. Parameters of Pin-on-Disc Test at the temperature of 400 °C.
ParameterValue
Pin-on-ballAl2O3 ø 6 mm
Path length500 m
Load5 N
Path radius2 mm
Temperature400 °C
Sliding speed5·10−2 m s−1
Table 3. Micro geometrical characteristics of copper substrate and Ni-Co coatings.
Sample
Number
ParameterCopper SubstrateNi-Co Coatings
Deposit Current Density (A·dm−2)Ra (µm)Rz (µm)Pc (1/cm)Ra (µm)Rz (µm)Pc (1/cm)
115.429.5544.724.550
222.818.11332.314.5110
342.716.81462.111.4173
462.818.7882.818.072
Ra—arithmetical mean deviation of the assessed profile (µm); Rz—maximum height of the profile (µm); Pc—peak count per unit length (1/cm).
Table 4. Quantitative EDX analysis of element content in the area tribo track on Ni-Co coatings in wt. % after tribological test at the temperature of 400 °C at the listed current density.
Place/ElementSample
1 (1 A dm−2)2 (2 A dm−2)3 (4 A dm−2)4 (6 A dm−2)
OCoNiCuOCoNiCuOCoNiCuOCoNiCu
A19.227.451.33.416.99.839.134.217.18.337.438.015.48.131.145.4
B20.211.323.045.117.63.617.561.323.33.418.155.318.34.415.262.1
C18.424.446.311.249.74.820.325.123.39.046.220.219.210.437.121.0
Table 5. Average parameters of track profiles on the samples after tests.
Data400 °C23 °C
Sample 1 Sample 2Sample 3Sample 4Sample 1 Sample 2Sample 3Sample 4
Width (mm)1.21.11.20.80.60.40.70.4
Depth (µm)61.160.271.432.16.410.111.65.2
Publisher’s Note: MDPI stays neutral with regard to jurisdictional claims in published maps and institutional affiliations.

