
Programmed Plastic Deformation in Mathematically-Designed Architected Cellular Materials


Core Technology Platforms Operations, New York University Abu Dhabi, Abu Dhabi 129188, United Arab Emirates
Metals 2021, 11(10), 1622; https://doi.org/10.3390/met11101622
Submission received: 9 September 2021
/
Revised: 25 September 2021
/
Accepted: 29 September 2021
/
Published: 13 October 2021
(This article belongs to the Special Issue Additive Manufacturing of Architected Metallic Materials)
Abstract
:The ability to control the exhibited plastic deformation behavior of cellular materials under certain loading conditions can be harnessed to design more reliable and structurally efficient damage-tolerant materials for crashworthiness and protective equipment applications. In this work, a mathematically-based design approach is proposed to program the deformation behavior of cellular materials with minimal surface-based topologies and ductile constituent material by employing the concept of functional grading to control the local relative density of unit cells. To demonstrate the applicability of this design tactic, two examples are presented. Rhombic, and double arrow deformation profiles were programmed as the desired deformation patterns. Grayscale images were used to map the relative density distribution of the cellular material. 316L stainless steel metallic samples were fabricated using the powder bed fusion additive manufacturing technique. Results of compressive tests showed that the designed materials followed the desired programmed deformation behavior. Results of mechanical testing also showed that samples with programmed deformation exhibited higher plateau stress and toughness values as compared to their uniform counterparts while no effect on Young’s modulus was observed. Plateau stress values increased by 8.6% and 13.4% and toughness values increased by 5.6% and 11.2% for the graded-rhombic and graded-arrow patterns, respectively. Results of numerical simulations predicted the exact deformation behavior that was programmed in the samples and that were obtained experimentally.
1. Introduction
In materials science, the inability of a unit material to continue enduring and withstanding externally applied loads is referred to as material failure [1]. Different types of material failure can be identified. For example, reaching the yield strength of a material where the transition from the elastic to plastic state takes place, degradation of stiffness, loss of fracture resistance at different scale levels, buckling, and fatigue, among others [1]. Material failure theory is the science concerned with investigating the conditions under which a material loses its load-bearing capacity. Predicting the conditions that cause material failure and minimizing the catastrophic consequences triggered by such failure has always been an engineering pursuit. Therefore, different design approaches at the material or structural level are adopted to give the engineers an active role in deciding how failure will take place in case of inevitable extreme conditions. For example, the pressurized piping systems of steam generators are designed to leak-before-break (LBB) such that under accidental overpressure, the system will leak first, at an acceptable and detectable level, which can help operators take early action and prevent undesired catastrophic rupture [2,3]. Another example can be found in structural engineering design where control joints, which are grooves introduced at certain locations to create weakening points, are added in concrete to regulate crack propagation, such that crack growth is guided to locations of minimal impact on the overall structure [4].
Inspired by the previous examples, this paper presents a design approach for architected cellular materials with programmable deformation mechanisms under mechanical loading. Architected cellular materials have gained increased interest since the emergence of additive manufacturing as a reliable and facile manufacturing method to produce highly complex topologies. The advances in manufacturing techniques facilitated the adaption of cellular materials in the design of functional mechanical components. These architected materials were found to be revolutionary in different engineering fields. For example, as structurally efficient lightweight materials for aerospace applications [5], thermal management devices [6,7,8,9], scaffolds and body implants [10,11,12,13,14,15], wastewater treatment [16,17,18,19,20], and soft robotics [21] among others. Many architected cellular materials, varying in complexity from simple geometries such as BCC and Octet-truss [22,23,24,25] to more complex geometries such as triply periodic minimal surfaces (TPMS) [26,27,28,29,30,31,32,33,34,35,36,37], have been proposed and their topology-property relationship has been investigated both experimentally and numerically. In general, the mechanical properties of architected cellular materials depend on the exhibited topology, relative density, length scale, and properties of the parent material [38]. Recent studies investigated the effect of functional grading on the exhibited mechanical properties and deformation behavior [39,40,41,42,43,44,45]. Functional grading can be achieved by spatially varying the relative density, cell size, and/or cell type in an attempt to mimic the topological and mechanical attributes of the targeted materials. For example, mimicking pore distribution, porosity, and local stiffness of bone in the design of body implants [46,47,48,49,50,51].
Understanding the deformation and failure mechanisms of architected cellular materials and being able to control them is essential for the entire design process of functional components and is motivated by the fact that these materials are often used in energy absorption applications such as automotive crashworthiness, protective sports equipment, packaging, and strain isolation, among others [52]. The deformation mechanisms of architected cellular materials are rather complex to predict. Studies have shown that under a simple uniaxial compression experiment, the failure mechanism of a cellular material depends on many factors such as the cell type, parent materials, cell size, cell orientation, and post-processing history, such as heat treatment [33,53]. For example, a recent study investigating the compressive behavior of AlSi10Mg Gyroid structure revealed clear, cell size-dependent failure modes including the successive collapse of cells, brittle fractures, and the formation of shear bands. Moreover, the study reported a shift in deformation mechanisms following a heat treatment post-processing procedure [33]. Comparing the deformation behavior of Gyroids fabricated using different metallic materials reveals the dependence of the deformation pattern on the parent materials [33,54]. In another study, the deformation mechanisms of different strut-based cellular materials were investigated and compared to stochastic foams [53]; results showed that deformation stress peaks and the shape of the stress–strain response changed by changing the orientation of the unit cell. Recently, many studies investigated the crashworthiness, energy absorption, and deformation mechanisms of architected cellular materials [33,55,56,57,58,59,60]. Also, several studies proposed methods to couple topology optimization results with cellular materials to generate structurally efficient and optimized mechanical and thermal components [39,45,61,62]. To the best of the author’s knowledge, only limited studies have proposed methods to control the exhibited deformation behaviors of architected cellular materials [63,64].
In this paper, a design method to control the exhibited deformation mechanism of mathematically generated TPMS-based cellular materials with ductile constituents is proposed and validated experimentally and numerically using finite element analysis. In this design method, a matrix-based grayscale image with carefully assigned pixel values was first designed then converted to a functionally graded, architected material with built-in deformation behavior by mapping pixel values to control local relative density, and hence mechanical properties. In Section 2, details of the proposed design approach and its mathematical implementation are provided. Following this proposed design methodology, two examples are demonstrated and the results of experimental and numerical analysis are presented in Section 3. Finally, concluding remarks are presented in Section 4.
2. Methodology
2.1. Design of Architected Materials
Minimal surface-based cellular materials can be generated using mathematical equations. A TPMS can be expressed using level-set approximation equations. These equations are a set of trigonometric functions that express an iso-surface, evaluated at an iso-value. For example, the Primitive surface is described using the level set equation as following:
where and are the Cartesian coordinates, is the unit cell size, and is the iso-value used to define the thickness, and controls the relative density of the cellular material, such that RD(%) = 57.57t − 0.197. This level-set equation and several others were coded using MATLAB (R2021b, MathWorks, Natick, MA, USA) and compiled into a standalone executable package called MSLattice [65]. An example of a uniform primitive cellular material produced using this package is shown in Figure 1a. If the value of the constant is replaced by a certain function, the relative density can be graded in space depending on that function. For example, a linear function such as (Figure 1b) or a more complex function in two or three dimensions such as a (Figure 1c) can be used to functionally grade the structure.
However, controlling a more complex spatial distribution of relative density can be challenging using functions. Therefore, a more viable solution is to divide the spatial domain into several subdomains using control points and to assign different (or similar) cellular material topologies to the subdomains, each domain with its respective relative density [51]. As such, the level set equation can then be described in the form of a weighted sum of the different subdomains:
where the weight functions are defined by
where points xi lay in the ith sub-domain, the ith substructure is assigned to the ith sub-domain, the parameter is used to control the transition between the sub-domains, n is the number of control points, and x denotes the 3D spatial coordinates (x, y, z).
An example of implementing Equations (2) and (3) is given here using two adjunct control points, and , where the two subdomains are filled with the Primitive minimal surfaces, , evaluated at two different t values, namely and , with and used for each sub-domain. The resulting structure is presented in Figure 1d. The numerical implementation is detailed in Appendix A. Using this approach, cellular materials can be graded, cell by cell, allowing full control over the topology, and hence, the corresponding exhibited mechanical property.
Grayscale images can be used to guide the functional grading of cellular materials such that a pixel’s coordinates are the coordinates of the control point while the pixel value correlates to the iso-value constant . A facile way to produce grayscale images is through matrices. For example, the Matrix A in Figure 1e-I is converted to the grayscale image shown in Figure 1e-II using the commercial software Wolfram Mathematica, which is in turn converted to the graded structure shown in Figure 1e-III. Following this approach, a series of grayscale images can be generated and converted into a graded cellular material where grading takes place in three different directions. A simple example is shown in Figure 1f, where three different matrix-based grayscale images were first generated and then transformed into a graded cellular material.
This design approach allows programming the material to deform in a predefined manner by grading it as needed. This is demonstrated in this work using two examples. In the first example, a cellular structure is programmed to follow a rhombus-like deformation, once plastic deformation takes place. The cellular material is designed such that grading takes the form of a rhombus outline where the unit cells that construct the rhombic shape are assigned a relative density of 20%, while the rest of the units are assigned a relative density of 22.5%. The grayscale image and the corresponding cellular material design are shown in Figure 2a. Figure 2 also shows the corresponding additively manufactured structure with a unit cell size of 4 mm (see Section 2.3); in what follows, this structure will be referred to as the graded-rhombic structure. The average relative density of the graded-rhombic structure is 21.4%. For purposes of comparison, a uniform structure (Uniform–I) with a relative density of 21.4% was generated for experimental testing and numerical simulations. Both structures were designed with 9 × 9 × 6 unit cells with 4 mm cell size yielding samples of 36 mm × 36 mm × 24 mm in size.
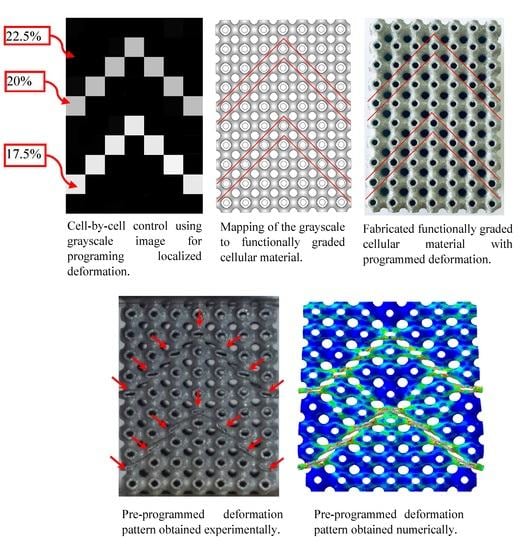
In a second example, controlled progressive deformation is demonstrated. A cellular structure is designed such that deformation follows a double-arrow-like arrangement, where, once plastic deformation starts, the bottom set of cells forming the first arrow are programmed to plastically deform first, then as plastic deformation continues the upper set of cells that form the top arrow shape start deforming following the densification of the first set. The structure was designed with a 22.5% relative density; the bottom arrow was assigned 17.5% relative density and the top arrow was assigned 20% relative density. The grayscale image is shown in Figure 2b alongside the corresponding design and additively manufactured structure. In what follows, this structure will be referred to as the graded-arrows structure. The average relative density of the graded-arrows’ structure is 20.7%. Again, for purposes of comparison, a uniform structure (Uniform–II) with a relative density of 20.7% was generated for experimental testing and numerical simulations. Both structures were designed with 10 × 7 × 7 unit cells with 4 mm cell size yielding samples with 40 mm × 28 mm × 28 mm in size.
2.2. Numerical Simulations
Finite element analyses were conducted using the finite-element software Abaqus (2020, ABAQUS Inc., Dassault Systèmes, France) to verify that the obtained plastic deformation matched the desired programmed plastic deformation. In-house developed codes were used to generate the STL files that were later converted to Abaqus input files with a quadratic tetrahedral element of type C3D10 for the mesh. On average 4000 elements per cell were used. The analyses were conducted using an elastic-perfectly plastic constitutive model. The elastic properties were 210 GPa and 0.3 for Young’s modulus and Poisson’s Ratio respectively, and 240 MPa for the Yield stress. Boundary conditions were applied as displayed in Figure 3.
2.3. Fabrication and Mechanical Testing
STL files were sliced and additively manufactured using the powder bed fusion system EOS M280 (EOSINT, Munich, Germany). The additive manufacturing machine uses a 400-W ytterbium fiber laser with a beam diameter between 100 µm and 500 µm, and scan speeds up to 7 m/s. Gas atomized stainless steel 316L powder was used to fabricate the samples. Figure 4a presents a scanning electron microscope (SEM) image that shows the powder particles. Image J (1.52n, National Institutes of Health, Bethesda, MD, USA) software was used to obtain the particle size distribution; results are shown in Figure 4b where particle diameters ranging between 5 and 60 µm with a mean particle size of 30 µm were observed. The chemical composition of the used powder was supplied by the manufacturer, and detailed in the table in Figure 4c. Samples were mechanically tested under compression with a displacement velocity of 2 mm/min using the MTS testing machine equipped with a 100 KN load cell.
3. Results and Discussion
3.1. Geometrical Characterization
After fabrication, samples were air-blasted to remove surrounding powder and were cut from the build platform using a wire electric discharge system. In general, it is not straightforward to spot the difference in the graded structures since only a slight change in thickness is needed to cause a notable change in relative density. For example, the primitive unit cell with 4 mm cell size and 22.5% relative density has a thickness of 520 µm which reduces to 440 µm when the relative density is reduced to 20%. Therefore, SEM was used to assess the quality of printing. Figure 5 shows additively manufactured structures and SEM images for selected cells at different relative densities. In general, good agreement between fabricated samples and CAD files was observed. SEM images also show the powder adhering to the surface of the cell along the printing direction. The powder adheres more to the bottom surfaces laying over the powder bed due to the thermal diffusivity barrier between the solidified and loose powder.
3.2. Experimental Testing and Numerical Simulation
Stress–strain responses of the graded-rhombic samples and Uniform-I samples tested under compression are plotted in Figure 6a. The figure shows good repeatability in the obtained results. Responses of both structures show a typical cellular material behavior under compressive loading where the linear elastic region characterized by Young’s modulus is followed by a plastic region mainly characterized by plateau stress that extends until densification starts to take place. The Uniform–I structure follows a smooth transition from elastic to plastic which is linked to the overall (collective) deformation of unit cells forming the structure, as can be seen in Figure 6b. In this figure, the deformation pattern is recorded at different strain levels. As strain progresses, one layer of cells starts deforming at a faster rate than the others (indicated with arrows). Testing different samples shows that this row of cells may differ from one sample to another, which may be a result of the distribution of internal defects (micro-cracks). Before the first layer has completely collapsed and densified, the plateau stress was mostly flat. After the complete collapse of this first layer at around 25% strain, the plateau stress started to show a hardening behavior due to local densification; this hardening effect starts to become more evident as more layers collapse. On the other hand, the graded-rhombic structure exhibits first peak stress after the elastic region, followed by a slight reduction in stress which is linked to the deformation of the graded layers in the form of a rhombic shape at 5% strain. The structure plastically deformed following the programmed deformation pattern. The curve then recovers as a result of local densification. The full densification of the rhombic patterns is at a strain of approximately 25%, which results in a second peak in the stress–strain response. As the loading progresses, the local densification of the successive layers results in a hardening effect, evident by the slope of the plateau stress. It can be concluded that inducing an early collapse of a set of layers triggers an early hardening effect, caused by local densification. This is reflected in the properties deduced from the stress–strain responses and presented in Figure 6c. Young’s moduli of both structures are identical, and were not affected much by the grading. Similarly, the first peak, defined as the maximum stress after the elastic region and before the stress drops, exhibited by both structures did not seem to differ significantly. The Uniform-I structure exhibited the first peak at 42.3 MPa, which is 2.7% higher than the first peak recorded from the graded-rhombic structure (41.2 MPa). However, the plateau stress of the graded-rhombic, defined as the average stress between 20% and 50% strain, showed an increase of 8.6%. This increase in plateau strength resulted in a 5.6% increase in the toughness (defined as the area under the stress–strain response up to 60% strain) of the graded-rhombic as compared to the Uniform-I structure. Plotting the toughness as a function of strain in Figure 6d revealed that both structures exhibited similar toughness values up until a strain of 25%. After this strain, the graded-rhombic started to show slightly higher values of toughness. This confirms the fact that local densification of the programmed rhombic structure triggers increasing toughness.
The performed numerical simulations are in good agreement with the experimental testing. In Figure 7a, the von Mises stress distribution for the Uniform–I, and the graded-rhombic structures are shown at a small strain of 0.5%. While the Uniform–I structure shows uniform distribution of stress, the graded-rhombic structure shows localized stress around the cells that define the rhombic shape and have smaller relative density. By examining the progressive plastic deformation shown in Figure 7a, it can be seen that the Uniform–I structure exhibits a collective deformation where all the rows deform similarly. Moreover, the plastic deformation of the graded-rhombic structure followed the same pattern obtained experimentally. Localization of stresses triggered early plastic deformation taking the form that was predefined in the design stage. The good agreement between the experimental and numerical results confirms the applicability of the proposed design methodology to program the desired plastic deformation behavior.
In the second example, the Uniform–II structure and the graded-arrows structure with the same overall relative density of 20.7% are experimentally and numerically compared. The stress–strain responses are presented in Figure 8a. Deformation patterns and the deduced mechanical properties are presented in Figure 8b,c, respectively. The Uniform–II structure exhibits a similar stress–strain response to the Uniform–I structure reported in Figure 6a with 21.2% relative density. Uniform–II exhibited the first peak at 39.8 MPa, followed by plateau stress with an average of 39.6 MPa, and toughness of 23.7 MJ/kg. In general, the deformation pattern of the Uniform–I structure is comparable to that of the Uniform–II structure. Both the graded-arrows and Uniform–II structure exhibited comparable Young’s moduli. The graded-arrows exhibited first peak stress at 31.3 MPa, which is notably lower than the Uniform–II structure. The drop in the curve following the first peak is associated with the loss of the load-bearing capability of the lower set of cells which form the first arrow with 17.5% relative density. The curve recovers shortly following the complete collapse of this set of cells and shows signs of hardening before it drops again following the deformation of the second set of cells at approximately 15% strain. Once again, the curve recovers and shows signs of hardening as cells continue to deform. This behavior resulted in an increase of 13.4% in the plateau stress and an increase of 11.2% in the toughness as compared to the Uniform–II structure. Plotting the toughness as a function of strain in Figure 8d shows that at strain values below 25%, the Uniform–II structure shows slightly higher toughness values. Beyond 25% the graded-arrows structure starts to outperform the Uniform–II structure. this confirms the fact that increasing toughness is associated with local densification in the graded-arrows structure.
The von Mises stress and equivalent plastic strain obtained numerically and presented in Figure 9a,b, respectively, were in good agreement with the experimental results. The von Mises stresses in the graded-arrows structure show high-stress concentrations in the set of cells forming the bottom arrow and to a lesser extent in the set of cells forming the top arrow. The equivalent plastic strain distribution for the same structure at the different strain levels is in good agreement with the sequence of deformation patterns obtained experimentally.
It should be noted that for the purpose of finite element analysis, an elastic-perfectly plastic constitutive model was used. Using this simplified model was aimed at verifying that the equivalent plastic strain distribution would indeed follow the programmed deformation and that it would qualitatively agree with the experimental data. To numerically obtain stress–strain responses that accurately predict the experimentally obtained responses, the constitutive model should include material damage and should also account for strain rate hardening to reproduce the peaks associated with failure of unit cells and to follow the exact plateau behavior. Some models such as the Johnson–Cook model can accurately predict such behavior. However, such complex models require calibrating the model’s material parameters for the base materials, which are usually process-dependent and require a considerable amount of testing to obtain all of the constants related to plasticity and damage which is beyond the scope of this work.
The presented design methodology was used in this work to design cellular materials with a predefined deformation pattern. However, this method can be used in a more generic way to program the desired response of the cellular material to external stimuli such as electric fields, magnetic fields, heat, or light by controlling the material’s electric, magnetic, thermal, and optical properties. However, it should be noted that this approach is suitable for ductile materials that exhibit large plastic deformation behavior before fracture. While in this work grayscale images were designed through matrices, then used to program the desired output, the mapping of grayscale-to-lattice can be used in general in different applications. For example, grayscale images generated using computed tomography (CT) scans can be utilized to design body implants with locally matching stiffness to that of the target bone.
4. Conclusions
In this work, a design method to program and control the deformation behavior of architected cellular materials with minimal surface topologies is presented and demonstrated using a combined approach of design, manufacturing, mechanical testing, and numerical simulations. Two examples were presented, which demonstrated the feasibility of this approach in controlling plastic deformation. In the first example, a rhombic-like shape was programmed as the desired deformation pattern, and in the second example, a double arrow-like deformation was programmed. Experimental and numerical results showed that the samples followed the exact programmed deformation behavior. Moreover, results showed that forcing local deformation and subsequent local densification resulted in local hardening that was reflected in the stress–strain response by an increase in the plateau strength. In both examples, structures with programmed deformation patterns showed an increase in both the plateau strength and toughness as compared to the uniform structures. However, it should be noted that this approach is suitable for ductile materials that exhibit large plastic deformation behavior before fracture. This design approach can be employed in cellular materials aimed for crashworthiness, impact mitigation, and protective equipment among others.
Funding
This research received no external funding.
Acknowledgments
This research was carried out using the Core Technology Platforms resources at New York University Abu Dhabi.
Conflicts of Interest
The authors declare no conflict of interest.
Appendix A
In this section, the mathematical implementation of Equations (1)–(3) to obtain the structure shown in Figure 1d is demonstrated. The constants used are:
l = 1, k = 10, t1 = 0.4, t2 = 0.6, x1 = 0.5, and x2 = 1.5
- 1-
- Substituting , and l in Equation (1) to obtain and yields:
- 2-
- Substituting , and k in the denominator of Equation (3) yields:
- 3-
- Substituting part 1, and part 2 in Equation (2) yields:
- 4-
- Coding the resulting surface in MATLAB, or inputting the equation in the implicit function plotter of MSLattice.
References
- Altenbach, H.; Sadowski, T. Failure and Damage Analysis of Advanced Materials; Springer: Berlin/Heidelberg, Germany, 2015. [Google Scholar]
- Flesch, B.; Cochet, B. Leak-before-break in steam generator tubes. Int. J. Press. Vessel. Pip. 1990, 43, 165–179. [Google Scholar] [CrossRef]
- Moan, G.; Coleman, C.; Price, E.; Rodgers, D.K.; Sagat, S. Leak-before-break in the pressure tubes of CANDU reactors. Int. J. Press. Vessel. Pip. 1990, 43, 1–21. [Google Scholar] [CrossRef]
- Gu, X.; Song, X.; Lin, F.; Li, C.; Jin, X. Cracking behaviour of cast in situ reinforced concrete slabs with control joints. Constr. Build. Mater. 2011, 25, 1398–1406. [Google Scholar] [CrossRef]
- Macchia, M.A. Application of Metamaterials for Multifunctional Satellite Bus Enabled via Additive Manufacturing. Master’s Thesis, Air Force Institute of Technology, Rafin Kura, Nigerian, 2019. [Google Scholar]
- Ali, M.I.H.; Al-Ketan, O.; Alhammadi, A.; Khalil, M.; Khan, K.; Abu Al-Rub, R.K. Heat Transfer Characterization of 3D Printable Architected Heat Sinks. Am. Soc. Mech. Eng. 2019, 59452, V008T09A005. [Google Scholar]
- Mirabolghasemi, A.; Akbarzadeh, A.H.; Rodrigue, D.; Therriault, D. Thermal conductivity of architected cellular metamateri-als. Acta Mater. 2019, 174, 61–80. [Google Scholar] [CrossRef]
- Catchpole-Smith, S.; Sélo, R.R.J.; Davis, A.W.; Ashcroft, I.A.; Tuck, C.J.; Clare, A. Thermal conductivity of TPMS lattice struc-tures manufactured via laser powder bed fusion. Addit. Manuf. 2019, 30, 100846. [Google Scholar] [CrossRef]
- Al-Ketan, O.; Ali, M.; Khalil, M.; Rowshan, R.; Khan, K.A.; Abu Al-Rub, R.K. Forced convection CFD analysis of architected and 3D printable heat sinks based on triply periodic minimal surfaces. J. Therm. Sci. Eng. Appl. 2021, 13, 021010. [Google Scholar] [CrossRef]
- Arabnejad, S.; Johnston, R.B.; Pura, J.A.; Singh, B.; Tanzer, M.; Pasini, D. High-strength porous biomaterials for bone replace-ment: A strategy to assess the interplay between cell morphology, mechanical properties, bone ingrowth and manufacturing constraints. Acta Biomater. 2016, 30, 345–356. [Google Scholar] [CrossRef] [PubMed] [Green Version]
- Bagheri, Z.S.; Melancon, D.; Liu, L.; Johnston, R.B.; Pasini, D. Compensation strategy to reduce geometry and mechanics mis-matches in porous biomaterials built with Selective Laser Melting. J. Mech. Behav. Biomed. Mater. 2017, 70, 17–27. [Google Scholar] [CrossRef] [Green Version]
- Ahmadi, S.M.; Yavari, S.A.; Wauthle, R.; Pouran, B.; Schrooten, J.; Weinans, H.; Zadpoor, A.A. Additively manufactured open-cell porous biomaterials made from six different space-filling unit cells: The mechanical and morphological properties. Materials 2015, 8, 1871–1896. [Google Scholar] [CrossRef] [Green Version]
- Kadkhodapour, J.; Montazerian, H.; Darabi, A.C.; Anaraki, A.P.; Ahmadi, S.; Zadpoor, A.A.; Schmauder, S. Failure mechanisms of additively manufactured porous biomaterials: Effects of porosity and type of unit cell. J. Mech. Behav. Biomed. Mater. 2015, 50, 180–191. [Google Scholar] [CrossRef] [PubMed]
- Bobbert, F.; Lietaert, K.; Eftekhari, A.A.; Pouran, B.; Ahmadi, S.; Weinans, H.; Zadpoor, A.A. Additively manufactured metallic porous biomaterials based on minimal surfaces: A unique combination of topological, mechanical, and mass transport properties. Acta Biomater. 2017, 53, 572–584. [Google Scholar] [CrossRef] [PubMed] [Green Version]
- Wang, X.; Xu, S.; Zhou, S.; Xu, W.; Leary, M.; Choong, P.; Qian, M.; Brandt, M.; Xie, Y.M. Topological design and additive manu-facturing of porous metals for bone scaffolds and orthopaedic implants: A review. Biomaterials 2016, 83, 127–141. [Google Scholar] [CrossRef] [PubMed]
- Sreedhar, N.; Thomas, N.; Al-Ketan, O.; Rowshan, R.; Hernandez, H.; Abu Al-Rub, R.K.; Arafat, H. 3D printed feed spacers based on triply periodic minimal surfaces for flux enhancement and biofouling mitigation in RO and UF. Desalination 2018, 425, 12–21. [Google Scholar] [CrossRef]
- Sreedhar, N.; Thomas, N.; Al-Ketan, O.; Rowshan, R.; Hernandez, H.H.; Al-Rub, R.K.A.; Arafat, H.A. Mass transfer analysis of ultrafiltration using spacers based on triply periodic minimal surfaces: Effects of spacer design, directionality and voidage. J. Membr. Sci. 2018, 561, 89–98. [Google Scholar] [CrossRef]
- Thomas, N.; Sreedhar, N.; Al-Ketan, O.; Rowshan, R.; Abu Al-Rub, R.K.; Arafat, H. 3D printed triply periodic minimal surfaces as spacers for enhanced heat and mass transfer in membrane distillation. Desalination 2018, 443, 256–271. [Google Scholar] [CrossRef]
- Cabrera-Castillo, E.; Thomas, N.; Al-Ketan, O.; Rowshan, R.; Abu Al-Rub, R.K.; Nghiem, L.; Vigneswaran, S.; Arafat, H.A.; Naidu, G. 3D printed spacers for organic fouling mitigation in membrane distillation. J. Membr. Sci. 2019, 581, 331–343. [Google Scholar] [CrossRef]
- Thomas, N.; Sreedhar, N.; Al-Ketan, O.; Rowshan, R.; Abu Al-Rub, R.K.; Nghiem, L.; Vigneswaran, S.; Arafat, H.A.; Naidu, G. 3D printed spacers based on TPMS architec-tures for scaling control in membrane distillation. J. Membr. Sci. 2019, 581, 38–49. [Google Scholar] [CrossRef]
- Hussain, I.; Al-Ketan, O.; Renda, F.; Malvezzi, M.; Prattichizzo, D.; Seneviratne, L.; Abu Al-Rub, R.K.; Gan, D. Design and proto-typing soft–rigid tendon-driven modular grippers using interpenetrating phase composites materials. Int. J. Robot. Res. 2020, 39, 1635–1646. [Google Scholar] [CrossRef]
- Vigliotti, A.; Deshpande, V.S.; Pasini, D. Non linear constitutive models for lattice materials. J. Mech. Phys. Solids. 2014, 64, 44–60. [Google Scholar] [CrossRef] [Green Version]
- Dong, L.; Deshpande, V.; Wadley, H. Mechanical response of Ti–6Al–4V octet-truss lattice structures. Int. J. Solids Struct. 2015, 60, 107–124. [Google Scholar] [CrossRef]
- Vigliotti, A.; Pasini, D. Stiffness and strength of tridimensional periodic lattices. Comput. Methods Appl. Mech. Eng. 2012, 229, 27–43. [Google Scholar] [CrossRef] [Green Version]
- Mazur, M.; Leary, M.; Sun, S.; Vcelka, M.; Shidid, D.; Brandt, M. Deformation and failure behaviour of Ti-6Al-4V lattice structures manufactured by selective laser melting (SLM). Int. J. Adv. Manuf. Technol. 2016, 84, 1391–1411. [Google Scholar] [CrossRef]
- Ataee, A.; Li, Y.; Brandt, M.; Wen, C. Ultrahigh-strength titanium gyroid scaffolds manufactured by selective laser melting (SLM) for bone implant applications. Acta Mater. 2018, 158, 354–368. [Google Scholar] [CrossRef]
- Al-Ketan, O.; Rowshan, R.; Abu Al-Rub, R.K. Topology-mechanical property relationship of 3D printed strut, skeletal, and sheet based periodic metallic cellular materials. Addit. Manuf. 2018, 19, 167–183. [Google Scholar] [CrossRef]
- Al-Ketan, O.; Abu Al-Rub, R.K.; Rowshan, R. The effect of architecture on the mechanical properties of cellular structures based on the IWP minimal surface. J. Mater. Res. 2018, 33, 343–359. [Google Scholar] [CrossRef]
- Al-Ketan, O.; Rezgui, R.; Rowshan, R.; Du, H.; Fang, N.X.; Abu Al-Rub, R.K. Microarchitected Stretching-Dominated Mechani-cal Metamaterials with Minimal Surface Topologies. Adv. Eng. Mater. 2018, 20, 1800029. [Google Scholar] [CrossRef]
- Al-Ketan, O.; Al-Rub, R.K.A. Multifunctional Mechanical Metamaterials Based on Triply Periodic Minimal Surface Lattices. Adv. Eng. Mater. 2019, 21, 1900524. [Google Scholar] [CrossRef]
- Abueidda, D.W.; Abu Al-Rub, R.; Dalaq, A.S.; Lee, D.-W.; Khan, K.A.; Jasiuk, I. Effective conductivities and elastic moduli of novel foams with triply periodic minimal surfaces. Mech. Mater. 2016, 95, 102–115. [Google Scholar] [CrossRef]
- Abueidda, D.W.; Bakir, M.; Abu Al-Rub, R.K.; Bergström, J.S.; Sobh, N.A.; Jasiuk, I. Mechanical properties of 3D printed polymeric cellular materials with triply periodic minimal surface architectures. Mater. Des. 2017, 122, 255–267. [Google Scholar] [CrossRef]
- Maskery, I.; Aboulkhair, N.T.; Aremu, A.; Tuck, C.; Ashcroft, I. Compressive failure modes and energy absorption in additively manufactured double gyroid lattices. Addit. Manuf. 2017, 16, 24–29. [Google Scholar] [CrossRef]
- Maskery, I.; Sturm, L.; Aremu, A.O.; Panesar, A.; Williams, C.B.; Tuck, C.J.; Wildman, R.D.; Ashcroft, I.A.; Hague, R.J.M. Insights into the mechanical properties of several triply periodic minimal surface lattice structures made by polymer additive man-ufacturing. Polymer 2018, 152, 62–71. [Google Scholar] [CrossRef]
- Han, S.C.; Lee, J.W.; Kang, K. A New Type of Low Density Material: Shellular. Adv. Mater. 2015, 27, 5506–5511. [Google Scholar] [CrossRef]
- Lee, M.G.; Lee, J.W.; Han, S.C.; Kang, K. Mechanical analyses of “Shellular”, an ultralow-density material. Acta Mater. 2016, 103, 595–607. [Google Scholar] [CrossRef]
- Han, S.C.; Choi, J.M.; Liu, G.; Kang, K. A Microscopic Shell Structure with Schwarz’s D-Surface. Sci. Rep. 2017, 7, 13405. [Google Scholar] [CrossRef] [Green Version]
- Deshpande, V.; Ashby, M.; Fleck, N. Foam topology: Bending versus stretching dominated architectures. Acta Mater. 2001, 49, 1035–1040. [Google Scholar] [CrossRef]
- Brackett, D.; Ashcroft, I.; Wildman, R.; Hague, R. An error diffusion based method to generate functionally graded cellular structures. Comput. Struct. 2014, 138, 102–111. [Google Scholar] [CrossRef]
- Al-Ketan, O.; Lee, D.-W.; Rowshan, R.; Abu Al-Rub, R.K. Functionally graded and multi-morphology sheet TPMS lattices: Design, manufacturing, and mechanical properties. J. Mech. Behav. Biomed. Mater. 2020, 102, 103520. [Google Scholar] [CrossRef]
- Afshar, M.; Anaraki, A.P.; Montazerian, H. Compressive characteristics of radially graded porosity scaffolds architectured with minimal surfaces. Mater. Sci. Eng. C 2018, 92, 254–267. [Google Scholar] [CrossRef] [PubMed]
- Han, C.; Li, Y.; Wang, Q.; Wen, S.; Wei, Q.; Yan, C.; Hao, L.; Liu, J.; Shi, Y. Continuous functionally graded porous titanium scaf-folds manufactured by selective laser melting for bone implants. J. Mech. Behav. Biomed. Mater. 2018, 80, 119–127. [Google Scholar] [CrossRef]
- Maskery, I.; Aremu, A.; Parry, L.; Wildman, R.; Tuck, C.; Ashcroft, I. Effective design and simulation of surface-based lattice structures featuring volume fraction and cell type grading. Mater. Des. 2018, 155, 220–232. [Google Scholar] [CrossRef]
- Yang, L.; Mertens, R.; Ferrucci, M.; Yan, C.; Shi, Y.; Yang, S. Continuous graded Gyroid cellular structures fabricated by selective laser melting: Design, manufacturing and mechanical properties. Mater. Des. 2019, 162, 394–404. [Google Scholar] [CrossRef]
- Panesar, A.; Abdi, M.; Hickman, D.; Ashcroft, I. Strategies for functionally graded lattice structures derived using topology optimisation for Additive Manufacturing. Addit. Manuf. 2018, 19, 81–94. [Google Scholar] [CrossRef]
- Yoo, D. New paradigms in hierarchical porous scaffold design for tissue engineering. Mater. Sci. Eng. C 2013, 33, 1759–1772. [Google Scholar] [CrossRef]
- Yoo, D.-J. Recent trends and challenges in computer-aided design of additive manufacturing-based biomimetic scaffolds and bioartificial organs. Int. J. Precis. Eng. Manuf. 2014, 15, 2205–2217. [Google Scholar] [CrossRef]
- Yoo, D.-J.; Kim, K.-H. An advanced multi-morphology porous scaffold design method using volumetric distance field and beta growth function. Int. J. Precis. Eng. Manuf. 2015, 16, 2021–2032. [Google Scholar] [CrossRef]
- Yang, N.; Gao, L.; Zhou, K. Simple method to generate and fabricate stochastic porous scaffolds. Mater. Sci. Eng. C 2015, 56, 444–450. [Google Scholar] [CrossRef]
- Yang, N.; Quan, Z.; Zhang, D.; Tian, Y. Multi-morphology transition hybridization CAD design of minimal surface porous structures for use in tissue engineering. Comput. Des. 2014, 56, 11–21. [Google Scholar] [CrossRef]
- Yang, N.; Tian, Y.; Zhang, D. Novel real function based method to construct heterogeneous porous scaffolds and additive manufacturing for use in medical engineering. Med. Eng. Phys. 2015, 37, 1037–1046. [Google Scholar] [CrossRef]
- Gibson, L.J.; Ashby, M.F. Cellular Solids: Structure and Properties; Cambridge University Press: Cambridge, UK, 1999. [Google Scholar]
- Mueller, J.; Matlack, K.H.; Shea, K.; Daraio, C. Energy Absorption Properties of Periodic and Stochastic 3D Lattice Materials. Adv. Theory Simul. 2019, 2, 1900081. [Google Scholar] [CrossRef] [Green Version]
- Al-Ketan, O.; Rowshan, R.; Palazotto, A.N.; Abu Al-Rub, R.K. On Mechanical Properties of Cellular Steel Solids With Shell-Like Periodic Architectures Fabricated by Selective Laser Sintering. J. Eng. Mater. Technol. 2019, 141. [Google Scholar] [CrossRef]
- Ozdemir, Z.; Hernández-Nava, E.; Tyas, A.; Warren, J.A.; Fay, S.D.; Goodall, R.; Todd, I.; Askes, H. Energy absorption in lattice structures in dynamics: Experiments. Int. J. Impact Eng. 2016, 89, 49–61. [Google Scholar] [CrossRef] [Green Version]
- Novak, N.; Borovinšek, M.; Vesenjak, M.; Wormser, M.; Körner, C.; Tanaka, S.; Hokamoto, K.; Ren, Z. Crushing Behavior of Graded Auxetic Structures Built from Inverted Tetrapods under Impact. Phys. Status Solidi (b) 2019, 256, 1800040. [Google Scholar] [CrossRef] [Green Version]
- Novak, N.; Hokamoto, K.; Vesenjak, M.; Ren, Z. Mechanical behaviour of auxetic cellular structures built from inverted tetrapods at high strain rates. Int. J. Impact Eng. 2018, 122, 83–90. [Google Scholar] [CrossRef]
- Novak, N.; Vesenjak, M.; Ren, Z. Crush behaviour of auxetic cellular structures. Sci. Technol. Mater. 2018, 30, 4–7. [Google Scholar] [CrossRef]
- Xiao, L.; Song, W. Additively-manufactured functionally graded Ti-6Al-4V lattice structures with high strength under static and dynamic loading: Experiments. Int. J. Impact Eng. 2018, 111, 255–272. [Google Scholar] [CrossRef]
- Zhang, L.; Feih, S.; Daynes, S.; Chang, S.; Wang, M.Y.; Wei, J.; Lu, W.F. Energy absorption characteristics of metallic triply periodic minimal surface sheet structures under compressive loading. Addit. Manuf. 2018, 23, 505–515. [Google Scholar] [CrossRef]
- Li, D.; Liao, W.; Dai, N.; Dong, G.; Tang, Y.; Xie, Y.M. Optimal design and modeling of gyroid-based functionally graded cellular structures for additive manufacturing. Comput. Des. 2018, 104, 87–99. [Google Scholar] [CrossRef]
- Li, D.; Dai, N.; Tang, Y.; Dong, G.; Zhao, Y.F. Design and Optimization of Graded Cellular Structures With Triply Periodic Level Surface-Based Topological Shapes. J. Mech. Des. 2019, 141, 071402. [Google Scholar] [CrossRef] [Green Version]
- Pham, M.-S.; Liu, C.; Todd, I.; Lertthanasarn, J. Damage-tolerant architected materials inspired by crystal microstructure. Nat. Cell Biol. 2019, 565, 305–311. [Google Scholar] [CrossRef]
- Kuang, X.; Wu, J.; Chen, K.; Zhao, Z.; Ding, Z.; Hu, F.; Fang, D.; Qi, H.J. Grayscale digital light processing 3D printing for highly functionally graded materials. Sci. Adv. 2019, 5, eaav5790. [Google Scholar] [CrossRef] [PubMed] [Green Version]
- Al-Ketan, O.; Al-Rub, R.K.A. MSLattice: A free software for generating uniform and graded lattices based on triply periodic minimal surfaces. Mater. Des. Process. Commun. 2020, e205. [Google Scholar] [CrossRef]
Figure 1.
Minimal surface-based cellular materials and the use of control points to control relative density distribution. (a) Uniform, (b) linearly graded, and (c) exponentially graded in the x and y axes. (d) Example of two unit cells graded using control points. (e) Example of a matrix-based grayscale image and the corresponding graded material. (f) Example of grayscale image stack and the corresponding graded material.

Figure 2.
Grayscale image, cellular material design, and additively manufactured sample of (a) graded-rhombic structure, and (b) graded-arrows structure.
Figure 2.
Grayscale image, cellular material design, and additively manufactured sample of (a) graded-rhombic structure, and (b) graded-arrows structure.

Figure 3.
Finite elements mesh and the corresponding boundary conditions.

Figure 4.
316L Stainless steel powder analysis. (a) SEM image showing the shape and size of the powder. (b) Particle size distribution histogram. (c) Chemical composition of the used stainless steel 316L powder.
Figure 4.
316L Stainless steel powder analysis. (a) SEM image showing the shape and size of the powder. (b) Particle size distribution histogram. (c) Chemical composition of the used stainless steel 316L powder.

Figure 5.
Additively manufactured samples with graded structure and SEM images of selected cells. Inset arrows at the bottom left of each subfigure indicate the printing direction.
Figure 5.
Additively manufactured samples with graded structure and SEM images of selected cells. Inset arrows at the bottom left of each subfigure indicate the printing direction.

Figure 6.
(a) Stress–strain response, (b) deformation pattern, (c) deduced mechanical properties of the graded rhombic and uniform structures, and (d) toughness as a function of strain level.
Figure 6.
(a) Stress–strain response, (b) deformation pattern, (c) deduced mechanical properties of the graded rhombic and uniform structures, and (d) toughness as a function of strain level.

Figure 7.
(a) Von Mises stress distribution and (b) equivalent plastic strain for the Uniform–I and graded-rhombic structure.
Figure 7.
(a) Von Mises stress distribution and (b) equivalent plastic strain for the Uniform–I and graded-rhombic structure.

Figure 8.
(a) Stress–strain response, (b) deformation pattern, (c) deduced mechanical properties of the graded arrow and uniform structures and (d) toughness as a function of strain level.
Figure 8.
(a) Stress–strain response, (b) deformation pattern, (c) deduced mechanical properties of the graded arrow and uniform structures and (d) toughness as a function of strain level.

Figure 9.
(a) The von Mises stress distribution and (b) equivalent plastic strain for the Uniform–II and graded-arrows structures.
Figure 9.
(a) The von Mises stress distribution and (b) equivalent plastic strain for the Uniform–II and graded-arrows structures.

Publisher’s Note: MDPI stays neutral with regard to jurisdictional claims in published maps and institutional affiliations. |
© 2021 by the author. Licensee MDPI, Basel, Switzerland. This article is an open access article distributed under the terms and conditions of the Creative Commons Attribution (CC BY) license (https://creativecommons.org/licenses/by/4.0/).
Share and Cite
MDPI and ACS Style
Al-Ketan, O. Programmed Plastic Deformation in Mathematically-Designed Architected Cellular Materials. Metals 2021, 11, 1622. https://doi.org/10.3390/met11101622
AMA Style
Al-Ketan O. Programmed Plastic Deformation in Mathematically-Designed Architected Cellular Materials. Metals. 2021; 11(10):1622. https://doi.org/10.3390/met11101622
Chicago/Turabian StyleAl-Ketan, Oraib. 2021. "Programmed Plastic Deformation in Mathematically-Designed Architected Cellular Materials" Metals 11, no. 10: 1622. https://doi.org/10.3390/met11101622
Note that from the first issue of 2016, this journal uses article numbers instead of page numbers. See further details here.