Article

Improved Procedures for Feature-Based Suppression of Surface Texture High-Frequency Measurement Errors in the Wear Analysis of Cylinder Liner Topographies

by
Przemysław Podulka
Faculty of Mechanical Engineering and Aeronautics, Rzeszow University of Technology, Powstancow Warszawy 8 Street, 35-959 Rzeszów, Poland
Metals 2021, 11(1), 143; https://doi.org/10.3390/met11010143
Submission received: 22 December 2020 / Revised: 6 January 2021 / Accepted: 9 January 2021 / Published: 12 January 2021

Abstract

:
Studies on the effect of surface texture on cylinder liner wear is of great importance in many research areas due to the fact that a major part of the mechanical power losses in an engine are caused by friction in the piston-cylinder liner system. Interest from both manufacturers and customers in optimizing this mechanical system seems to be similar. The surface roughness of cylinder liners plays an important role in the control of tribological properties. Cylinder liner surface topography, which affects running-in duration, oil consumption, exhaust gas emissions and engine performance as well, was taken into detailed consideration in this paper. They were measured with a stylus (Talyscan 150) or non-contact—optical (Talysurf CCI Lite white light interferometer) equipment. Precise machining process and accurate measurement equipment may not provide relevant information about surface texture properties when the procedure of processing of received (raw) measured data is not selected appropriately. This work aims to compare various type of procedures for detection and reduction of some-frequency surface topography measurement errors (noise) and consider its influence on the results of wear analysis. It was found that assessments of some extracted areas (profiles) may be much more useful than the characterization of the whole of measured details when noise was defined. Moreover, applications of a commonly-used algorithm, available in the commercial software of the measuring equipment, for measurement errors suppression may be potentially decisive in the definition of measurement noise but, simultaneously, scrupulous attention should be paid if they are implemented adequately.

1. Introduction

The surface topography of cylinder liners is studied comprehensively in many research areas as the tribological performance can affect the properties of ‘engineering surfaces’ [1] like wear resistance [2], lubricant retention [3], sealing [4], friction [5,6] and material contact in general. Moreover, the increasing use of biofuels [7], e.g., biodiesel or ethanol, requires a closer examination of the tribological implications [8]. It was found that for four-stroke spark ignition and diesel engines, up to 50% of the total energy is lost due to friction of the piston group elements, cylinder liners, rings and pistons in particular. An approximated breakdown of rubbing and accessory friction can be assigned: 50% for piston assembly, 25% valve train, 10% crankshaft bearings and the last 15% for accessories [9]. For reducing fuel consumption and CO2 emissions special coatings can be applied as well. Therefore, for reduction of the frictional losses, the cylinder liner–piston ring interaction should be carefully evaluated. Moreover, minimizing friction in the power cylinder unit demands a sophisticated understanding of how the various parameters are related.
Plateau-honed cylinder liner (bronze) surfaces with additionally burnished oil pockets, so-called dimples, valleys or reservoirs, are a representative example of a textured surface. In general, honing is a widely used finishing process for cylinder surfaces after drilling or turning operation to guarantee reproducibility with efficient productivity in mass production of cylinder liners [10]. The oil pockets can distribute a microhydrodynamic bearing by full or mixed lubrication, especially dimples that can provide a micro reservoir oil protection when starved lubrication occurs. In general, the surfaces with burnished dimples have a considerable advantage over one-process surfaces [11]. It was also found that the oil pocket size and distribution has a substantial impact on wear in lubricated sliding [12].
Characterization of the surface topographies of elements containing the oil pockets requires both precise measuring equipment (measurement technique) and the appropriate method for processing of the received raw measured data. The very accurate measuring device may not provide adequate information about surface performance when the procedures of surface preparing [13] and data handling are not performed competently.
Nowadays, very popular in surface topography measurement are optical methods [14]. One of the significant advantage in this technique is its time of measurement that optical (non-contact in general) methods are much faster than a stylus. One of the typical examples is the scanning white-light interferometry (SWLI) technique which has increased in importance for, i.e., manufacturing quality control [15]. Therefore, this measurement method is often called ‘probably the most useful optical instrument’ for measuring surfaces, films and coatings [16]. It is susceptible, however, in some cases (when the amplitude is related to the coherence length of the light source), to a skewing effect. Nonetheless, optical instruments used for areal measurements of surface topography, might be sensitive to the presence of noise, especially when scanning is required. The noise may have different sources from those generated internally and those containing external sources from the environment such as vibration or temperature changes [17]. Profilometers show 90% less noise when thermal stabilization is applied [18].
Generally, the errors in the whole measurement process of surface topography, affecting uncertainty in surface geometry measurement, can be divided into those typical for the measuring method, caused by the digitization process [19], errors obtained during data processing [20] and other errors [21]. Consequently, errors can be caused by the environment, measuring equipment, the measured object, software or measuring method in general. There can be defined a various type of noise when considering surface metrology, e.g., scattering [22], background [23], instrument (measurement) [24], outlier [25], static [26], white [27] and other types [28] of the errors. In general, the noise can be highly correlated with the signal or can be in a different frequency band where is not closely correlated.
Simplifying, the measurement noise can be defined as the noise added to the output signal [29] when the normal use of the measuring instruments is applied. In many papers, the measurement noise was determined as a ‘dynamic phenomena’ affected by the motion of the drive unit and internal noise created by the instrument due to the environmental disturbances. For a definition of some standard reference frames, the noise is ought to be precisely determined along with the selected measurement bandwidth. Accordingly, one of the most difficult and arduous tasks is the definition of the high-frequency noise from the results of surface topography measurements. When the literature review is accomplished, there are no detailed descriptions of how to deal with this type of metrological problem. Many methods require a repeated measurement process, e.g., calibrated optical flat approach [30], which increases the time of analysis. Problems in surface metrology can be also thoroughly examined with different intensity of measurement-light [31]. One of the proposals might be an analysis of the measurement noise with determining bandwidth, such as in the high-frequency domain, described for selected surfaces, e.g., plateau-honed cylinder liner topographies. Noise can be defined specifically for each type of measurement technique as well. Description, detection and reduction (minimization) in particular, of the high-frequency measurement noise, may be highly advantageous for the characterization of the selected properties (and features) of surface textures.
In this paper, the feature-based detection of selected (high-frequency) measurement errors is proposed. Comparing of the cylinder liner topographies, when zero-wear [32], running-in [33] and worn details are considered, may require characterization of selected surface details. The changes in parameters values of cylinder liner honed surface during the wear process were presented previously [34,35], therefore it was not closely examined in this research, nonetheless, it should be carefully considered in future studies. Moreover, some of the results were presented in extracted (enlarged) details from both areal (3D) and profile (2D) characteristics.

2. Materials and Methods

2.1. Measuring Equipment and Measurement Process

The analyzed surfaces were measured by a Talyscan 150 stylus instrument (Taylor Hobson, Warrenville, IL, USA) with a nominal tip radius about 2 μm, height resolution about 10 nm. The measured area was 5 mm by 5 mm with 1000 × 1000 points. The sampling interval was from 5 to 10 μm. The measurement speed was equal to 0.3 mm/s, 0.5 mm/s and 0.7 mm/s. The effect of the measurement velocity on the results (values of surface topography parameters) obtained was outside the scope of this paper, nevertheless, it should be thoroughly scrutinized in the next studies.
The measurement was also provided with a Talysurf CCI Lite (Taylor Hobson, Warrenville, IL, USA) white light interferometer with a height resolution of 0.01 nm. The measured area was 3.35 mm by 3.35 mm with 1024 × 1024 received measured points. The spacing was 3.27 μm, respectively. The effect of sampling on values of areal texture parameters was not studied in the current paper.
In Figure 1 extracted details, areas (a,b) and profiles (c,d), from the cylinder liner surface topographies after a various stage of wear, e.g., zero-wear (a,c), running-in (b,d), are presented. They were measured with a different, stylus (a,b) or optical (c,d), techniques.

2.2. Analysed Details and Parameters

In this paper, the cylinder liners after the plateau-honing process and plateau-honed cylinder liners with dimples (oil pockets) created additionally by the burnishing techniques, were considered. The dimple size, depth and width (diameter) were between 0.08 and 0.12 mm and between 0.5 and 1 mm correspondingly. In Figure 2 examples of isometric views (a,b), material ratio curves (c,d) and selected parameters (e,f) from the plateau-honed cylinder liners with additionally burnished dimples with depth and width equal to 0.08 mm and 0.8 mm respectively were presented.
The values of the following surface topography parameters (from ISO 25178-2 standard) were measured and studied: arithmetic mean height Sa, auto-correlation length Sal, surface bearing index Sbi, core fluid retention index Sci, mean dale area Sda, root mean square gradient Sdq, developed interfacial areal ratio Sdr, mean dale volume Sdv, core roughness depth Sk, kurtosis Sku, inverse areal material ratio Smc, areal material ratio Smr, maximum peak height Sp, arithmetic mean peak curvature Spc, peak density Spd, reduced summit height Spk, root mean square height Sq, skewness Ssk, texture direction Std, texture parameter Str, maximum valley depth Sv, valley fluid retention index Svi, reduced valley depth Svk, extreme peak height Sxp and the maximum height of surface Sz.

2.3. Applied Procedures and Algorithms for Noise Suppressions

For a definition of the selected (in the high-frequency domain) measurement errors (noise), various techniques for data analysis were proposed. Definition of noise was divided into two efficient operations, detection process and then reduction (minimization) of the influence of this type of errors on the results of surface texture measurements. For better suppression of the high-frequency errors, the noise surface (noise profile) was proposed for the areal 3D (profile 2D) measurement noise analysis. Moreover, the surface power spectral density (PSD) and autocorrelation function (ACF) graphs were also directly applied. In its two-dimensional form for surface texture, PSD has been qualified as the preferred means of specifying the surface roughness on the draft international drawing standard [36]. Moreover, the PSD was applied for characterizing the turning concerning the applied cooling methods when the process of dry machining was considered [37]. While the ACF assessment provides practical advice about the autocorrelation length and its properties as a function of surface irregularities. Generally, ACF conforms to the wavelength of the surface topography irregularities. When equating the PSD and the ACF functions, ACF is more accurate for the studies of irregular surfaces and PSD for the analysis of periodic surfaces [38]. It was also found (suggested) that anisotropic characterization [39] of the surface or NS can be valuable in the selection of procedure for noise suppression (reduction).

2.3.1. Definition of the ‘Noise Surface’ and the ‘Noise Profile’

The measurement noise in the surface topography analysis is often reduced (removed) from the raw measured data by application of a various type of digital filtering methods [40]. The results of removal of noise component from the received signal are defined by the S-operator and named the S-scale elements or S-components, consequently, the filtration approach applied for the removal of the S-components from the measured signal is called the S-filter [41].
In this study, the results of S-filtering methods is defined as a ‘noise surface’ (NS). The NS is that component of the filtered raw measured data which is removed by the application of the S-filter. Five types of S-filters were proposed and compared: regular Gaussian regression filter (GF) [42], robust Gaussian regression filter (RGF) [43], regular de-noising median filter (DMF) [44,45], isotropic spline filter (SF) [46], and fast Fourier transform filter (FFTF) [47].
The main purpose of this paper is to present the procedures of application of the S-filtering methods for the detection and reduction of the high-frequency noise from the results of surface topography measurements. Many filters can be appropriate for suppression the high-frequency components from the results of surface texture measurement, however, all five proposed (and compared) algorithms are available in the commercial software of the measuring equipment. There can be many filters applied for reducing the surface topography measurement noise, nonetheless, the practical suggestion is a detailed implementation of the S-filtering approach with a careful selection of the cut-off value. Incorrectly matched bandwidth of the S-filtering scheme may cause a removal, from the analyzed surface topography data, selected features, e.g., scratches, valleys, edges of the dimples or oil pockets. This can considerably influence the values of surface topography parameters.
Examples of NS received by application of various digital filtering methods were presented in Figure 3. Analysis of the isometric view of the NS (or NP) can provide some useful information what is the NS consist of, what type of features (frequencies) are those dominant. In the recent (newest) commercial software the ‘dominant frequency’ was defined when PSD graphs are calculated. Moreover, some of the features (e.g., scratches, valleys) from the cylinder liner surface textures can be directly noticed from the isometric view of the surface. The properly defined NS, received by application of proper filter with appropriate bandwidth, should contain only the high-frequency components and the ‘dominant frequency’ should be also in the high-frequency domain. The less of non-high-frequencies are found in the NS the better results in the definition and, simultaneously, suppression) of the high-frequency measurement noise may be received.
From all of the above practical suggestions, the NSs presented in Figure 3 might be classified as an inadequately defined, the properties, especially the values of surface topography parameters, of analyzed surface texture might be distorted and properly made parts (e.g., cylinder liners) can be classified as a lack thereof.

2.3.2. Feature-Based Characterization of the High-Frequency Measurement Noise

It was found in the previous papers that the detection process of high-frequency measurement noise, based on the characteristics of an isometric view of surface topography, PSDs and ACFs, is dependent on the size and distribution of the selected features of surface texture, e.g., dimples, oil pockets, valleys, scratches. Consequently, when the depth, diameter and density of the features in the surface texture detail are relatively huge (the range had been defined previously), the three above methods for noise detection are not entirely convincing. The out-of-dimple method was proposed. This method was based on the analysis of this area of surface texture detail that does not contain dimples, valleys or other, usually deep and wide, features. This approach may be exceedingly valuable when the surface contains areas which can be easily excluded or not the whole measured detail (area) needs to be studied. This technique may not be especially suitable when surface texture does not contain the wholes (dimples, oil pockets), which in many cases are located separately and are easy to be extracted, but many of deep or wide valleys or scratches that are intersecting and extremely difficult to be split. Therefore, in this paper, the plateau-valley threshold separation method (PVTM) was proposed. The PVTM technique is based on the threshold (remove) process of the valley part of the surface topography and taking into consideration the plateau section of the analyzed detail. However, one condition must be met. The surface should be flat or after the areal form removal process. The effect of form and waviness removal on the thresholding method was not studied in this paper that the procedures of a selection of reference plane for ‘engineering’ surfaces were discussed exhaustively in many research items [48,49,50,51,52]. Moreover, the plateau-valley characterization of the surface was already proposed for the analysis of two-process textures [53] or topographies with deterministic pattern [54]. Nevertheless, this procedure was not efficiently performed for the definition of the measurement errors.
In Figure 4 the cylinder liner surface texture containing two wide (approximately depth 85 µm and width 0.9 mm) dimples was presented with PSDs characterization. It was found that the presence of the relatively huge oil pockets caused a false estimation of the noise occurrence (a,c). The difference between PSDs graph for surfaces measured with various conditions (speed) did not exist or, usually, were negligible. It was very complicated to observe any dissimilarity for the PSDs charts (b,d). Noise definition might be, in this case, rather only intuitive, e.g., based on the analysis of the isometric view of considered surface topography detail. When PVTM was proposed (e,g) and the high-frequency noise occurred, the variance in the PSDs diagrams was easy to observe (f,h).
The method of selection of the value for trunsuation was presented in Figure 5. For defining the value of the threshold, the Abbott-Firestone curve (a) [55], commonly known as a material ratio curve (b) [56], proposed in an analysis of cylinder liner [57,58] or ground [59,60] textures, was processed. It was suggested to select the point of trunsuation (c, indicated as A) according to the values of Sk and Svk parameters. The effect of thresholding value on the valley depth (and vice versa) was not examined in the present studies.
The PVTM scheme might be also fairly effective for the noise definition of the results of measurements of plateau-honed cylinder liner surface topography with no burnished oil pockets. In Figure 6 the PSD-based characterization of the high-frequency measurement noise with the PVTM technique was introduced. It was established that the detection of noise with the analysis of PSD graphs did not allow to define the presence of high-frequency errors (c,d), even the velocity of measurement was enlarged (from 0.3 mm/s to 0.7 mm/s) and the noise was directly visible on the isometric view of the received results from the process of areal surface topography measurements (a,b). Application of the PVTM approach made it possible to notice the (high-) frequencies of the studied measurement noise on the PSD graph (h). The effect of the thresholding method on the accuracy of the noise detection by the PSD graph may be enhanced when the number of valley suppression would be enlarged. In the analyzed example only the deepest valleys were removed.

3. Results and Discussion

3.1. Problems in the Detection of the High-Frequency Errors

When cylinder liners after the plateau-honing process and plateau-honed cylinder liners with additionally added dimples created by the burnishing techniques were analyzed, it was found that some of the features, e.g., valleys, dimples or oil pockets, have a considerable influence on the process of definition of the high-frequency measurement errors by an application of commonly available (in commercial software) methods, e.g., PSD or ACF graphs, or filtering methods, e.g., various Gaussian (regular regression or robust regression), median (de-noising), spline (regular areal isotropic) or fast Fourier transform filters.
In Figure 7 the profiles of plateau-honed cylinder liner surface topographies were presented for various size of oil pockets included in the analyzed detail. When the oil pockets were located in the considered profile (a), the detection of high-frequency noise with the analysis of PSD graph was exceedingly difficult. The decreasing of the depth of the dimple (b) did not always cause an increasing the ability to detect the high-frequency errors with an assessment of the PSD graph. Application of analysis of free-of-dimple detail or profile (c) gave some more direct results in the characterization of the measurement noise occurrence. The differences might have been seen with the ACF graph studies, presented in the right column of the figure below. It was indicated that when the profile did not contain the dimples, oil pockets, or other deep valleys, features in general, the maximum value of the ACF increases more rapidly. Therefore for the detection (description) of considered type of measurement errors, the non-valley areas of profile (detail) are suggested to be analyzed when the PSD and ACF values are taken into account.

3.2. Feature-Based Definition (Detection) of the High-Frequency Measurement Noise

The direction of the extraction process of profile (2D) from the analysed areal (3D) detail has a profound impact on the procedure of definition (detection in particular) of the high-frequency measurement noise. In Figure 8 two profiles received by the vertical extraction from areal surface topography of the plateau-honed cylinder liner detail was presented. Results were obtained with two various velocities of the measurement process.
It was found that the detection of high-frequency errors was difficult to be described with analysis of PSD graphs when the vertical direction of profile extraction was performed. Furthermore, similar results were observed when horizontal extraction was applied. Therefore, it was suggested to extract the profiles, for the process of definition of the high-frequency measurement errors, by the non-vertical and non-horizontal directions. In Figure 9 profiles obtained by the vertical (P1), valley (P2) and plateau (P3) directions of extraction method were proposed. It was found that non-vertical (e.g., valley or plateau) directions can be more effective in measurement noise detection than vertical.
Generally, profiles described by the smaller value of amplitude can be particularly useful for the definition of high-frequency noise from the measurement results of plateau-honed cylinder liner surface textures. This minimised value of the profile amplitude can be received directly when the direction of the profile extraction process is defined rather along the direction of the selected features, e.g., scratches or valleys than the horizontal or vertical.

3.3. Selection of the Cut-Off Value in the Process of Suppression of the High-Frequency Measurement Noise

Selection of value of the cut-off of S-filtering method was proposed with extensive studies of the noise surface (NS). Therefore, it was initially proposed that the NS, received for minimization of the high-frequency noise, should be defined according to the following characteristics:
(1)
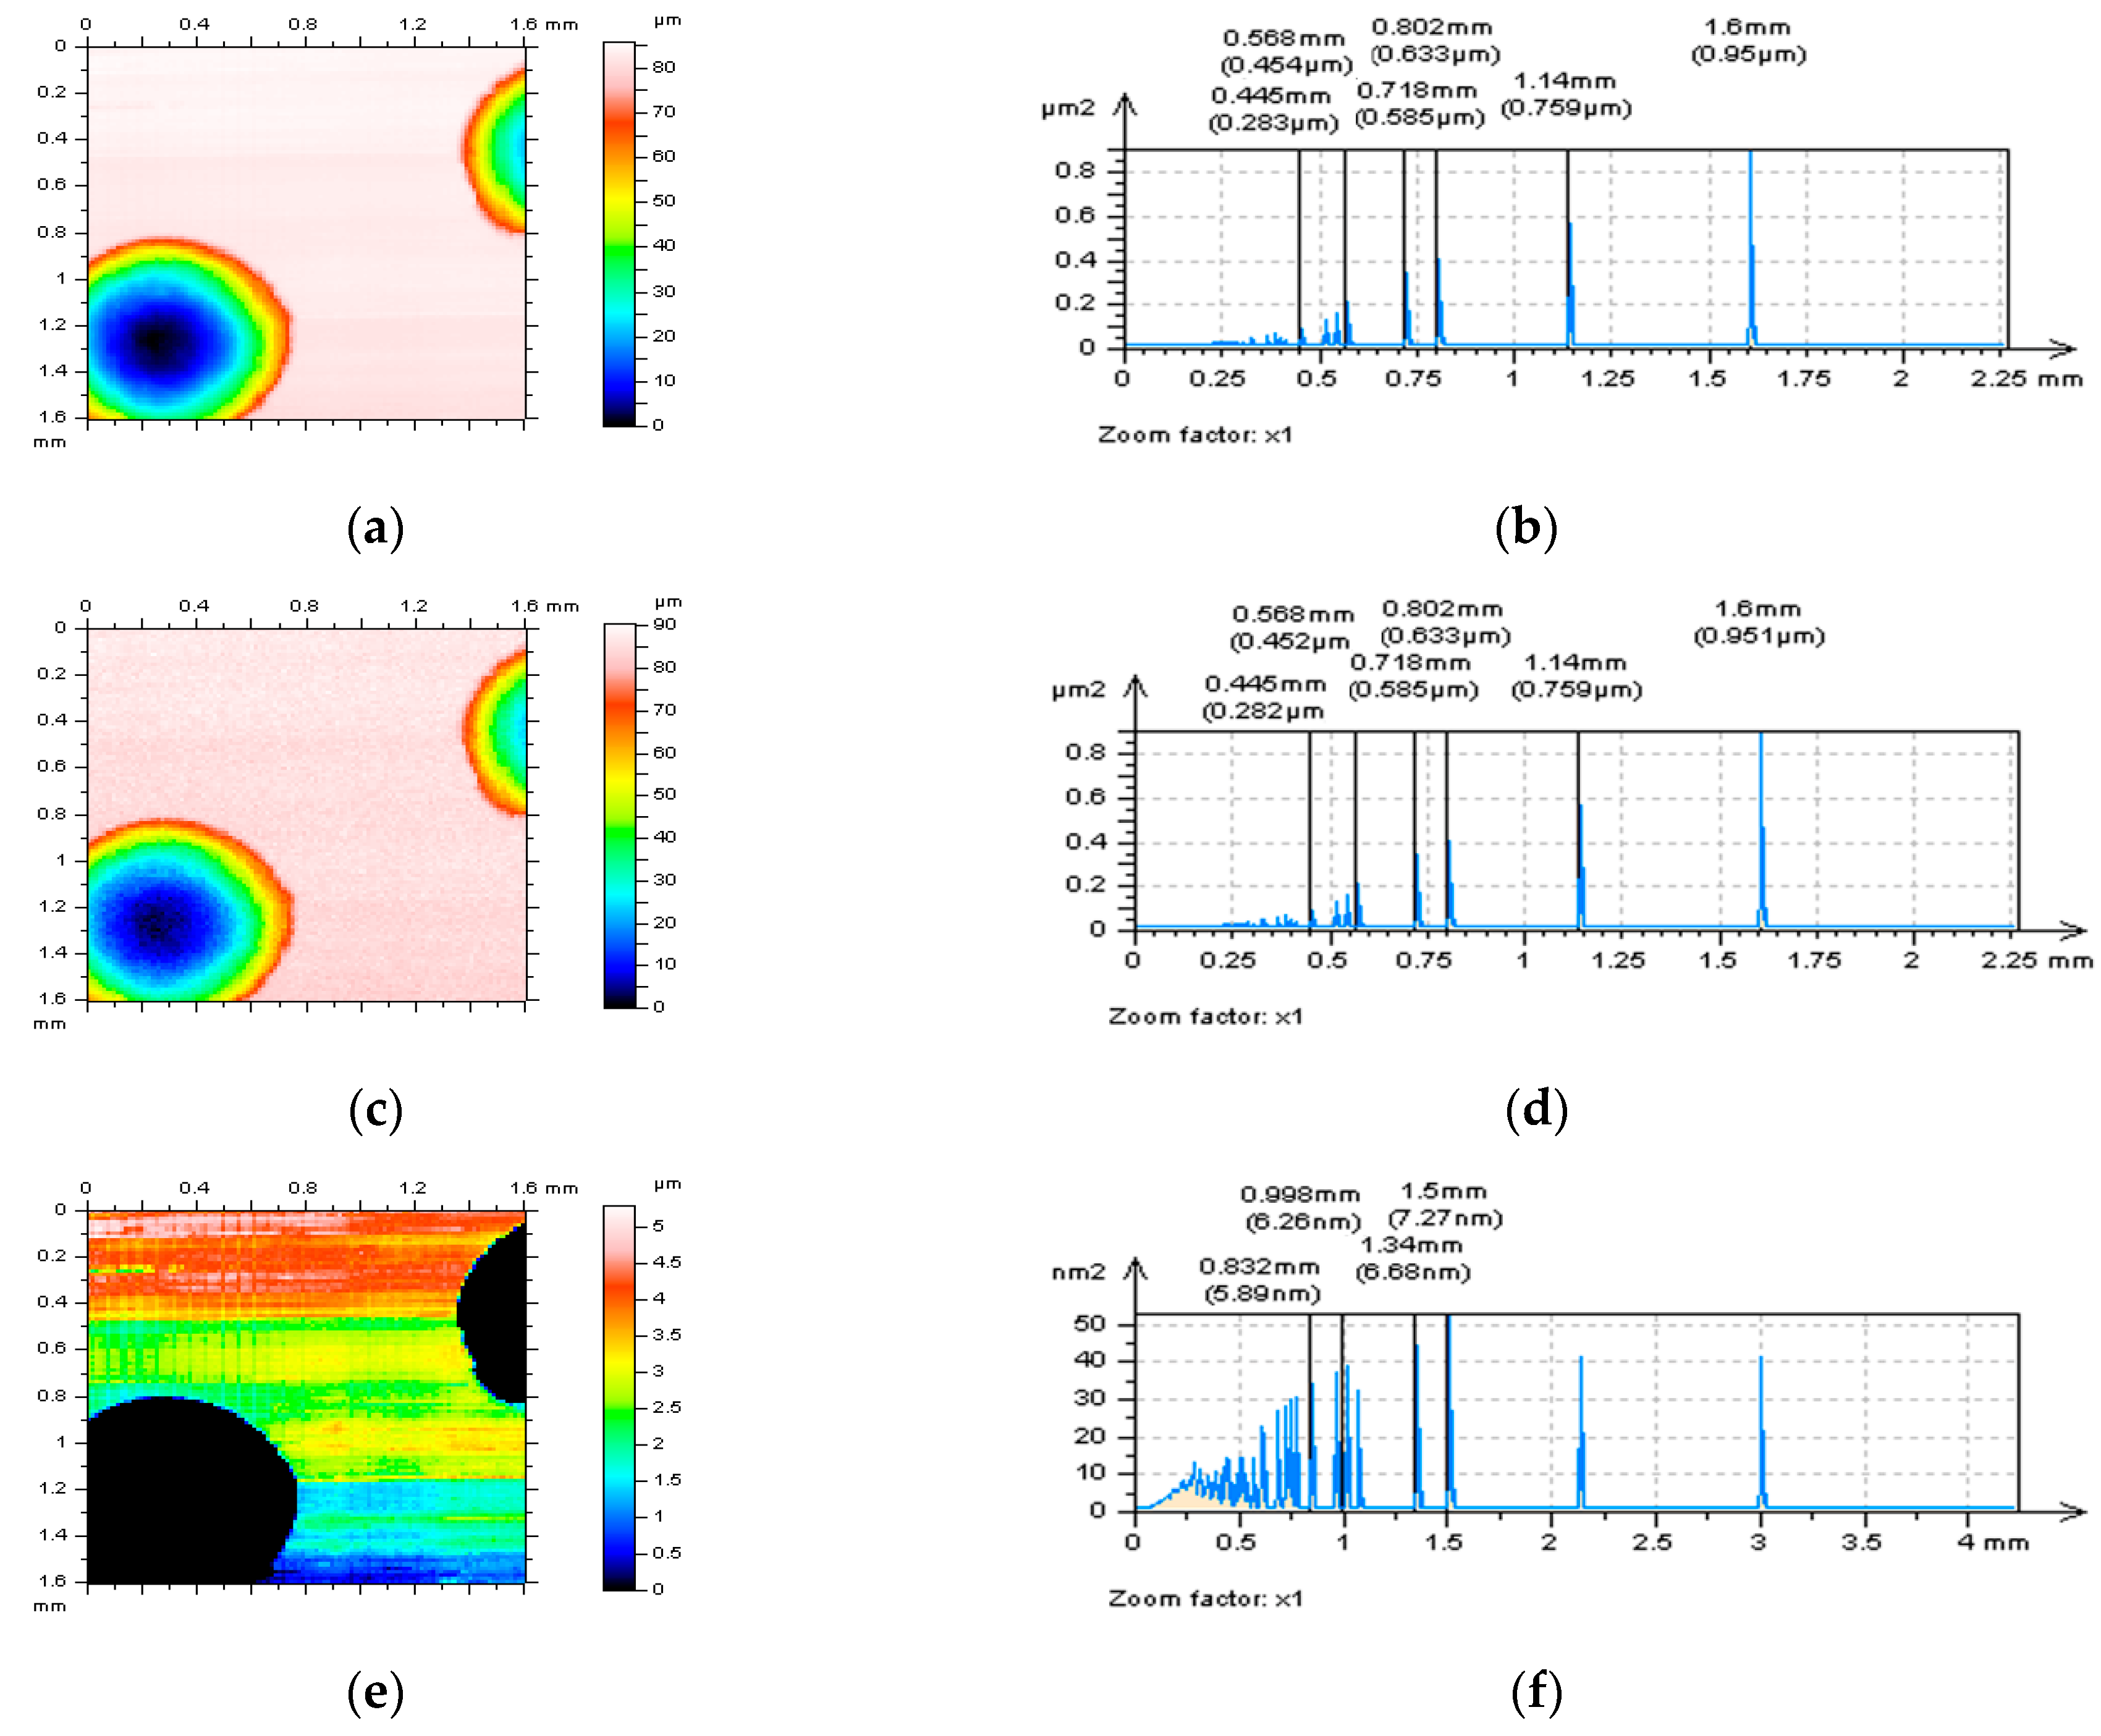
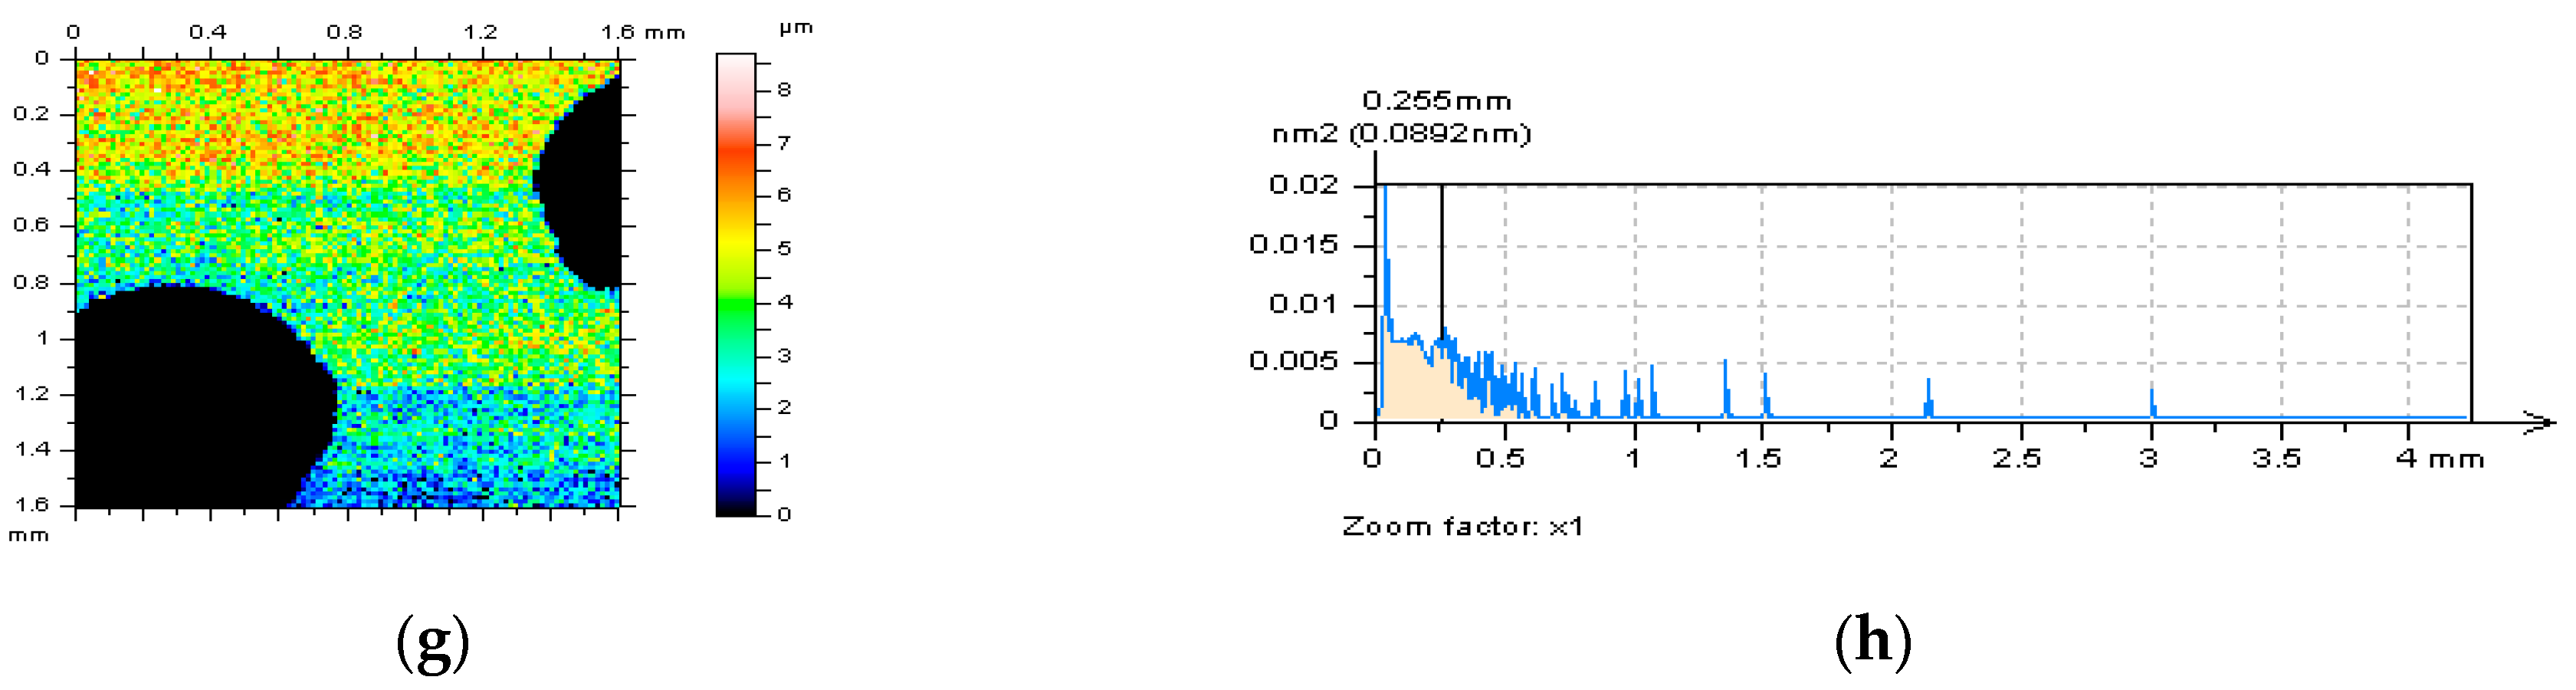
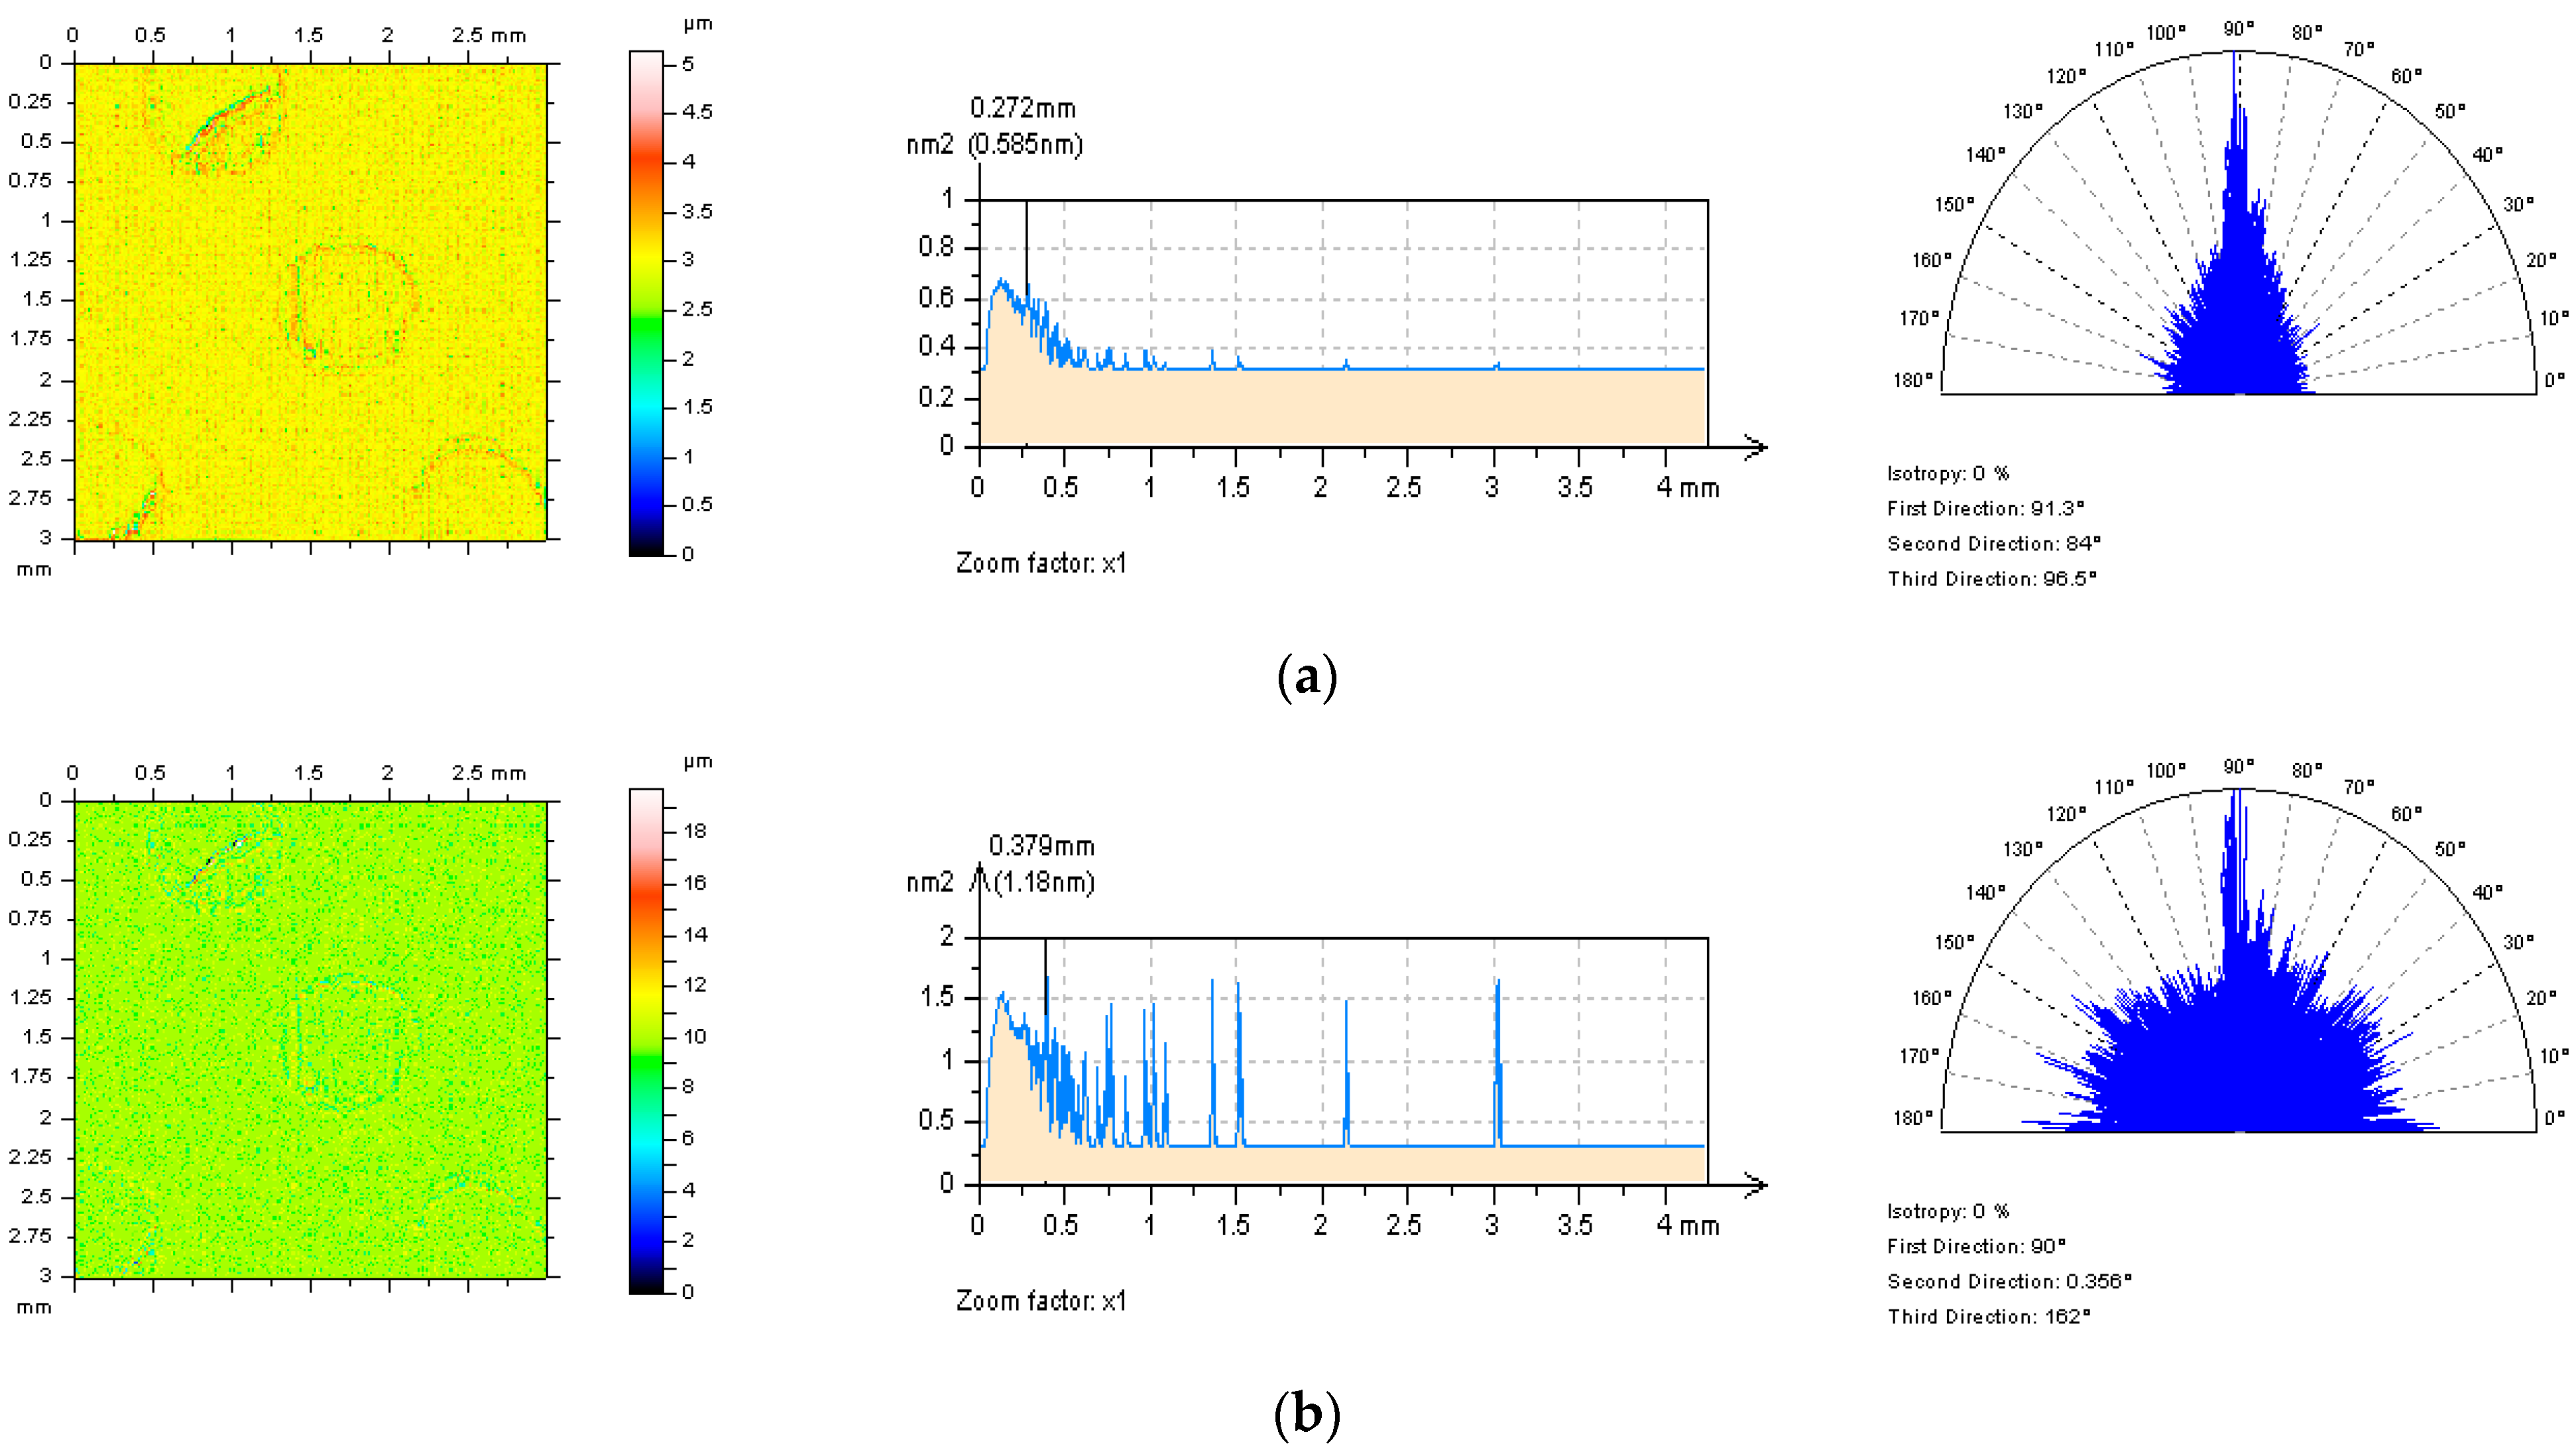
NS should be consist of the high-frequencies and no other frequencies should be placed on the NS or their influence should be minimized, simplifying, the high-frequency should be this ‘dominant’. This can be easily visible by the analysis of PSD graph.
(2)
On the NS, no features should be found, e.g., scratches, valleys, dimples, oil pockets or other traces of treatment process, in particular.
(3)
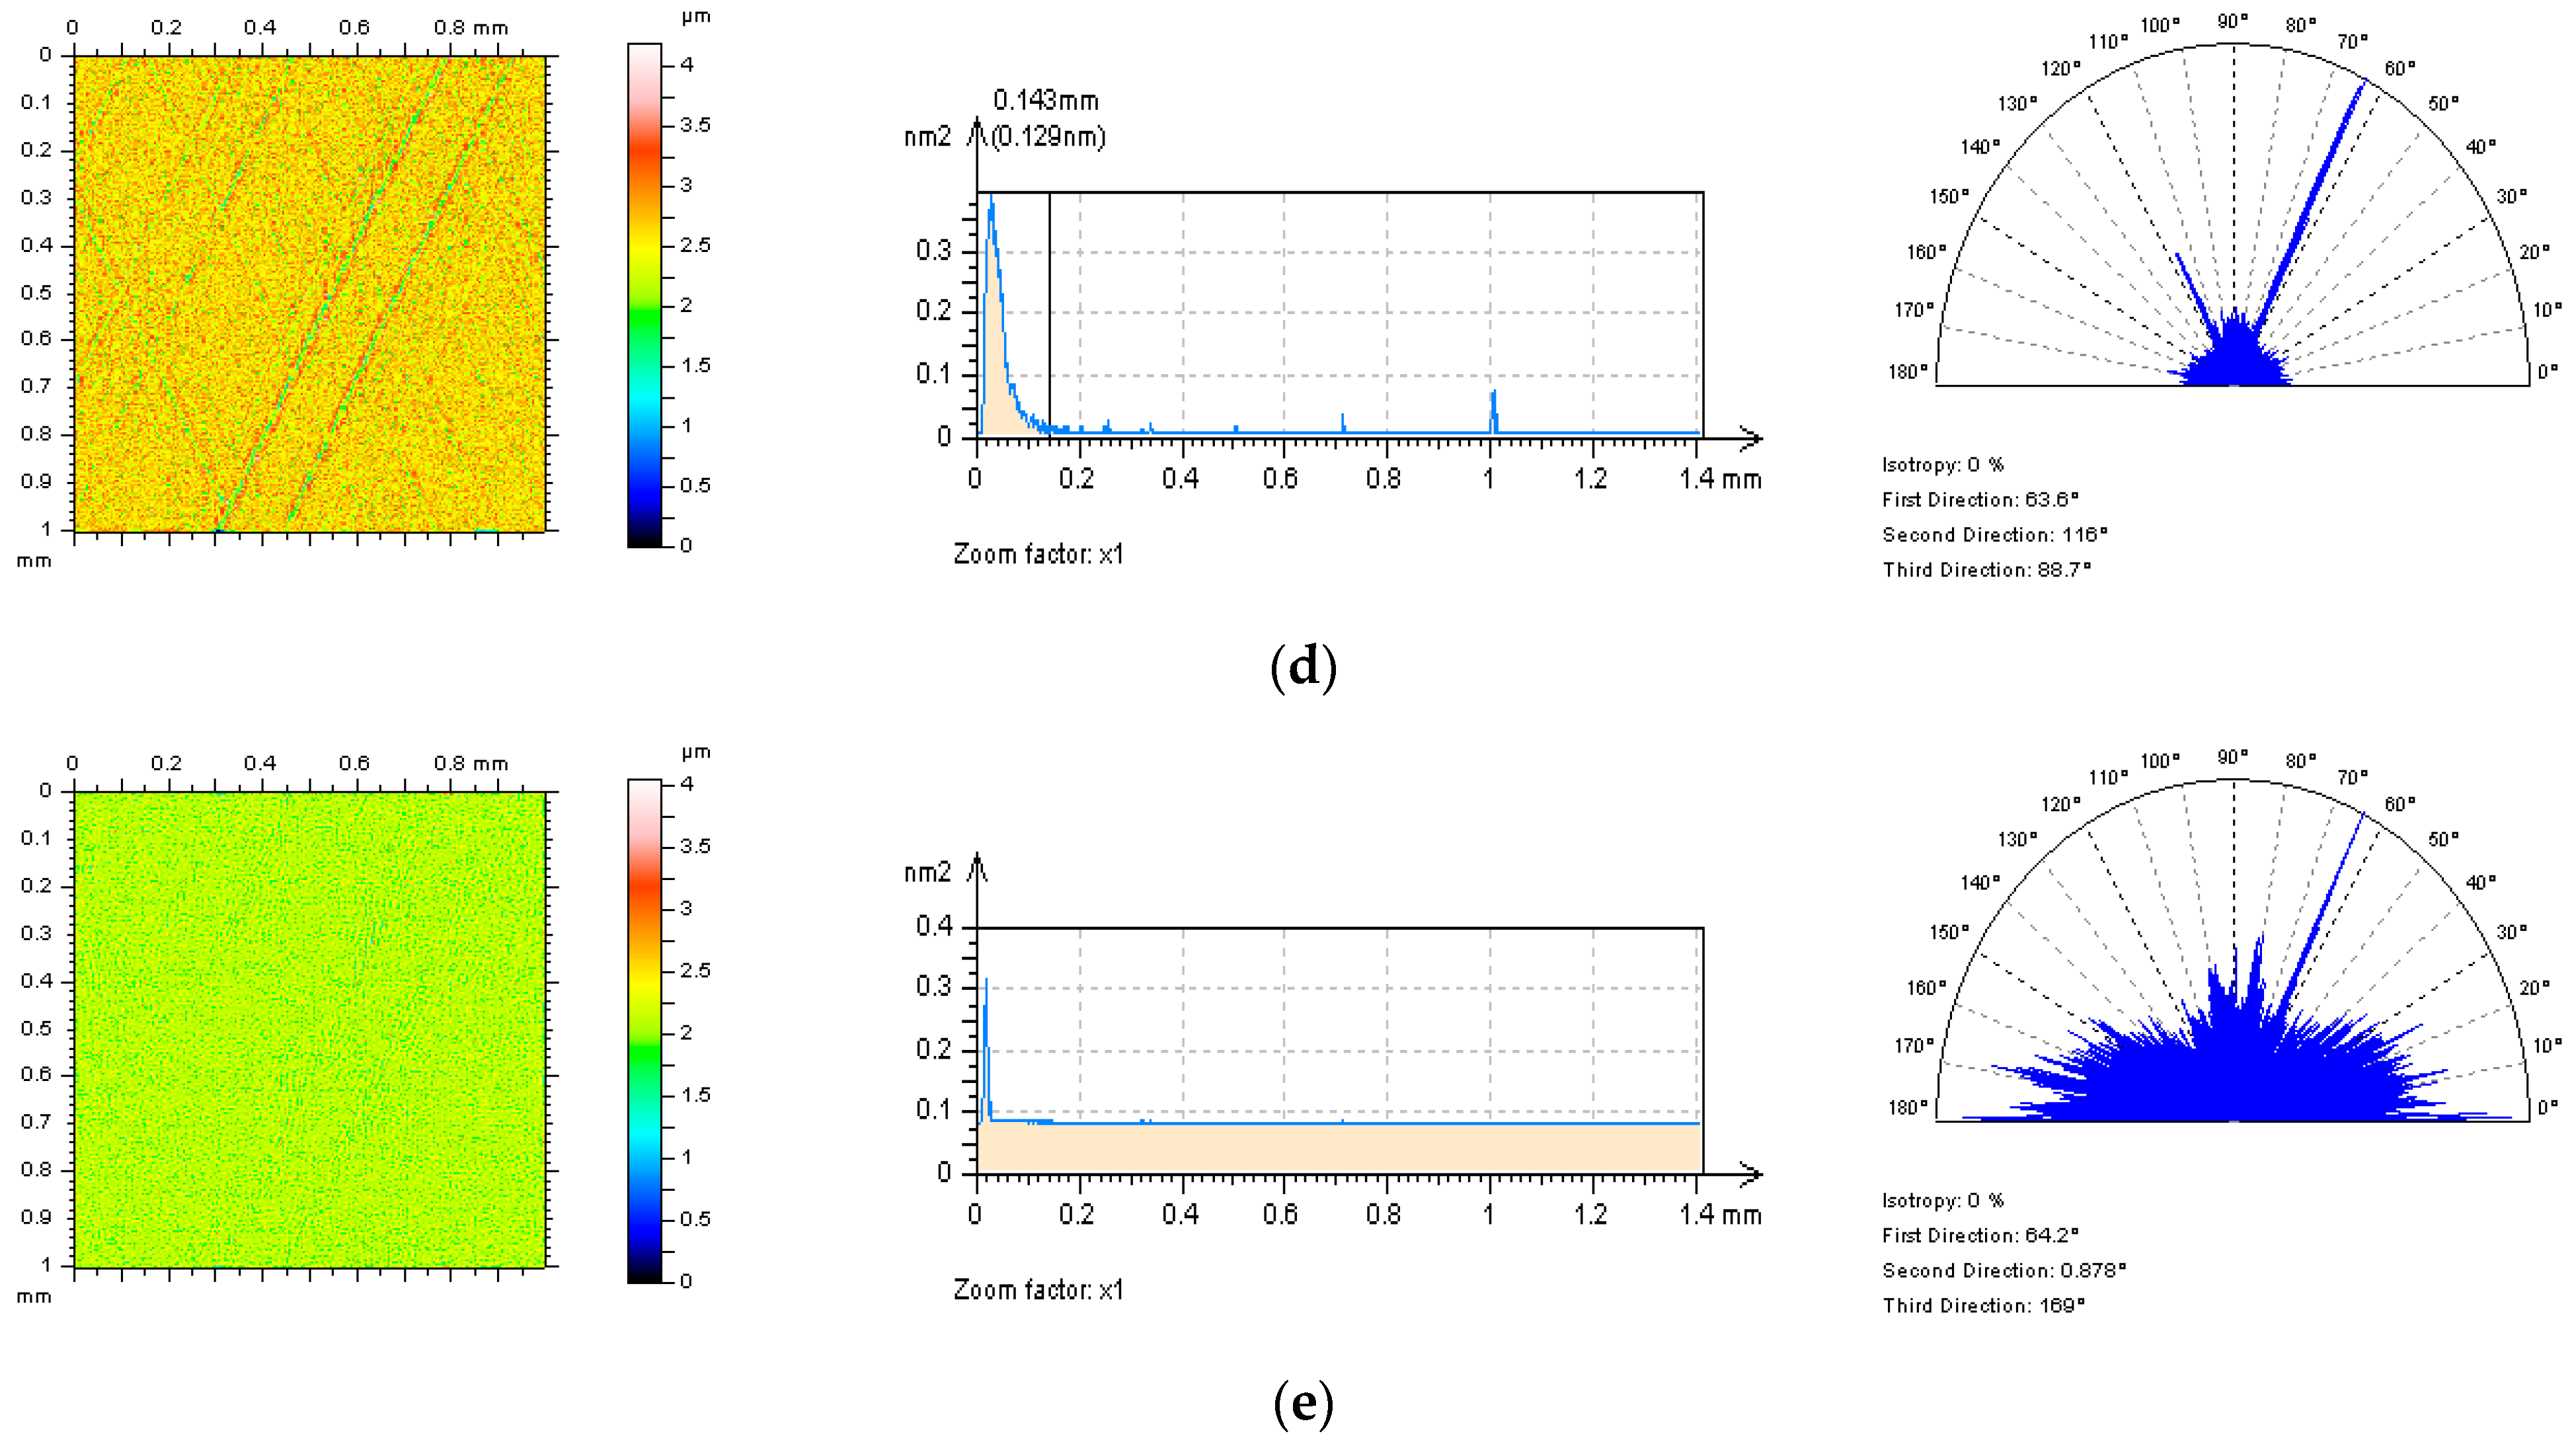
The NS should be isotropic in general. The isotropy can be defined by the analysis of texture direction graph.
All the above features of NS were required in the comprehensive evaluation of the suppression process of the high-frequency measurement noise. One of the main limitations in the noise minimization approach was a selection of the cut-off value of the S-filtering methods.
Plateau-honed cylinder liner surface is characterized by plenty of scratches that, usually, are designated in two separated directions at a suitably set angle [61], crosshatch [62,63] angle. When the proper NS is defined, all of the features from a surface texture can be decisive in the non-feature characterization of the received S-filtering results. For plateau-honed zero-wear cylinder liner surface (Figure 10), it was assumed that the application of the regular noise-separation algorithms, GF (a), RGF (b) or SF (d) caused the removal of some surface texture features from the raw measured data, consequently, the size (especially depth) of the scratches might have been reduced as well. It can be effortlessly noticed in the isometric view of received NSs (left column in the mentioned figure). This can lead to the false estimation of surface properties that values of the parameters can be calculated inaccurately. The smallest number of surface features on the NS contour map plots can be found when the DMF (c) filtration method was applied with 0.035 mm value of the cut-off. The frequency in the high domain was this ‘dominant’ for DMF, SF and FFTF schemes applications (PSD graph analysis) but only the NSs created by the DMF method was isotropic, indicated with the assessment of the texture direction graph.
When the running-in cylinder liner topographies were studied, the most encouraging results were obtained after application of the FFTF method with 0.025 mm cut-off value. All of the required NS characteristics, contour map plots and graphs of PSD or texture directions, have been met—detailed description is presented in Figure 11.
Analysis of worn cylinder liner texture (Figure 12) indicates that the FFTF procedure might be the most suitable (among all five of the ones considered in this research) for reduction of the influence of the high-frequency errors on the results of surface topography measurements. SF may also be applied alternatively. Application of the regular Gaussian filters (GF, RGF) can cause an increase in the errors of the valley (size) analysis.
Moreover, when the value of cut-off of S-filtering method was reduced (e.g., from 0.035 mm to 0.015 mm) the amplitude of the NS (NP) also usually decreased. Therefore, a greater value of the cut-off of the S-filtering scheme can be applied for surface textures where the main amplitude of the analysed detail (and profile) is relatively huge, or, in particular, texture contains some deep features, e.g., dimples or holes in general. Although, this remark requires a broad assessment of the influence of measurement errors on the analysis of the size of considered surface topography features that was not the scope of this paper. Evaluation of the high-frequency measurement noise can be supported considerably by the analysis of the noise profile (NP). The NP is the counterpart of the NS but, accordingly, described for the profiles. NP can be both extracted from the NS or received by the profile filtering of the results obtained. In Figure 13 examples of NP were recently introduced with a thorough analysis of the PSDs and ACFs graphs for the various value of cut-offs. Some unexpected features described with a circle or an ellipse indicator in the figure were detected in the NPs (a,c,d). The NP characterization may be fairly advantageous when some of the surface features in the raw measured data, are not deep and, consequently, barely recognizable with the NSs characterization.

4. Conclusions and Prospects

It is very difficult to determine the high-frequency measurement noise, especially in the wear analysis of cylinder liners. Despite this, some conclusions can be drawn:
  • For improving suppression of the high-frequency measurement noise from the results of cylinder liner surface topography measurements the definition of the noise surface (NS) and noise profile (NP) as a result of the application of S-filtering methods, can be fairly effective.
  • Precisely determined NS should be characterized by a few very significant features, e.g., components should be located in the high-frequency domain, the NS should contain only the high-frequencies or any surface texture features (edges of dimples or oil pockets, scratches, valleys) should not be found on the NS. The NS ought to be isotropic as well.
  • The occurrence and size (width and depth) of the selected surface texture features (valleys in general) affect the accuracy of detection of the high-frequency noise. Therefore, the out-of-feature (area of analysed detail where the deep/width features did not occur) characterization was performed. However, when the density (especially the scratches in plateau-honed cylinder liner texture) of features was also excessive, other procedures was reasonably required.
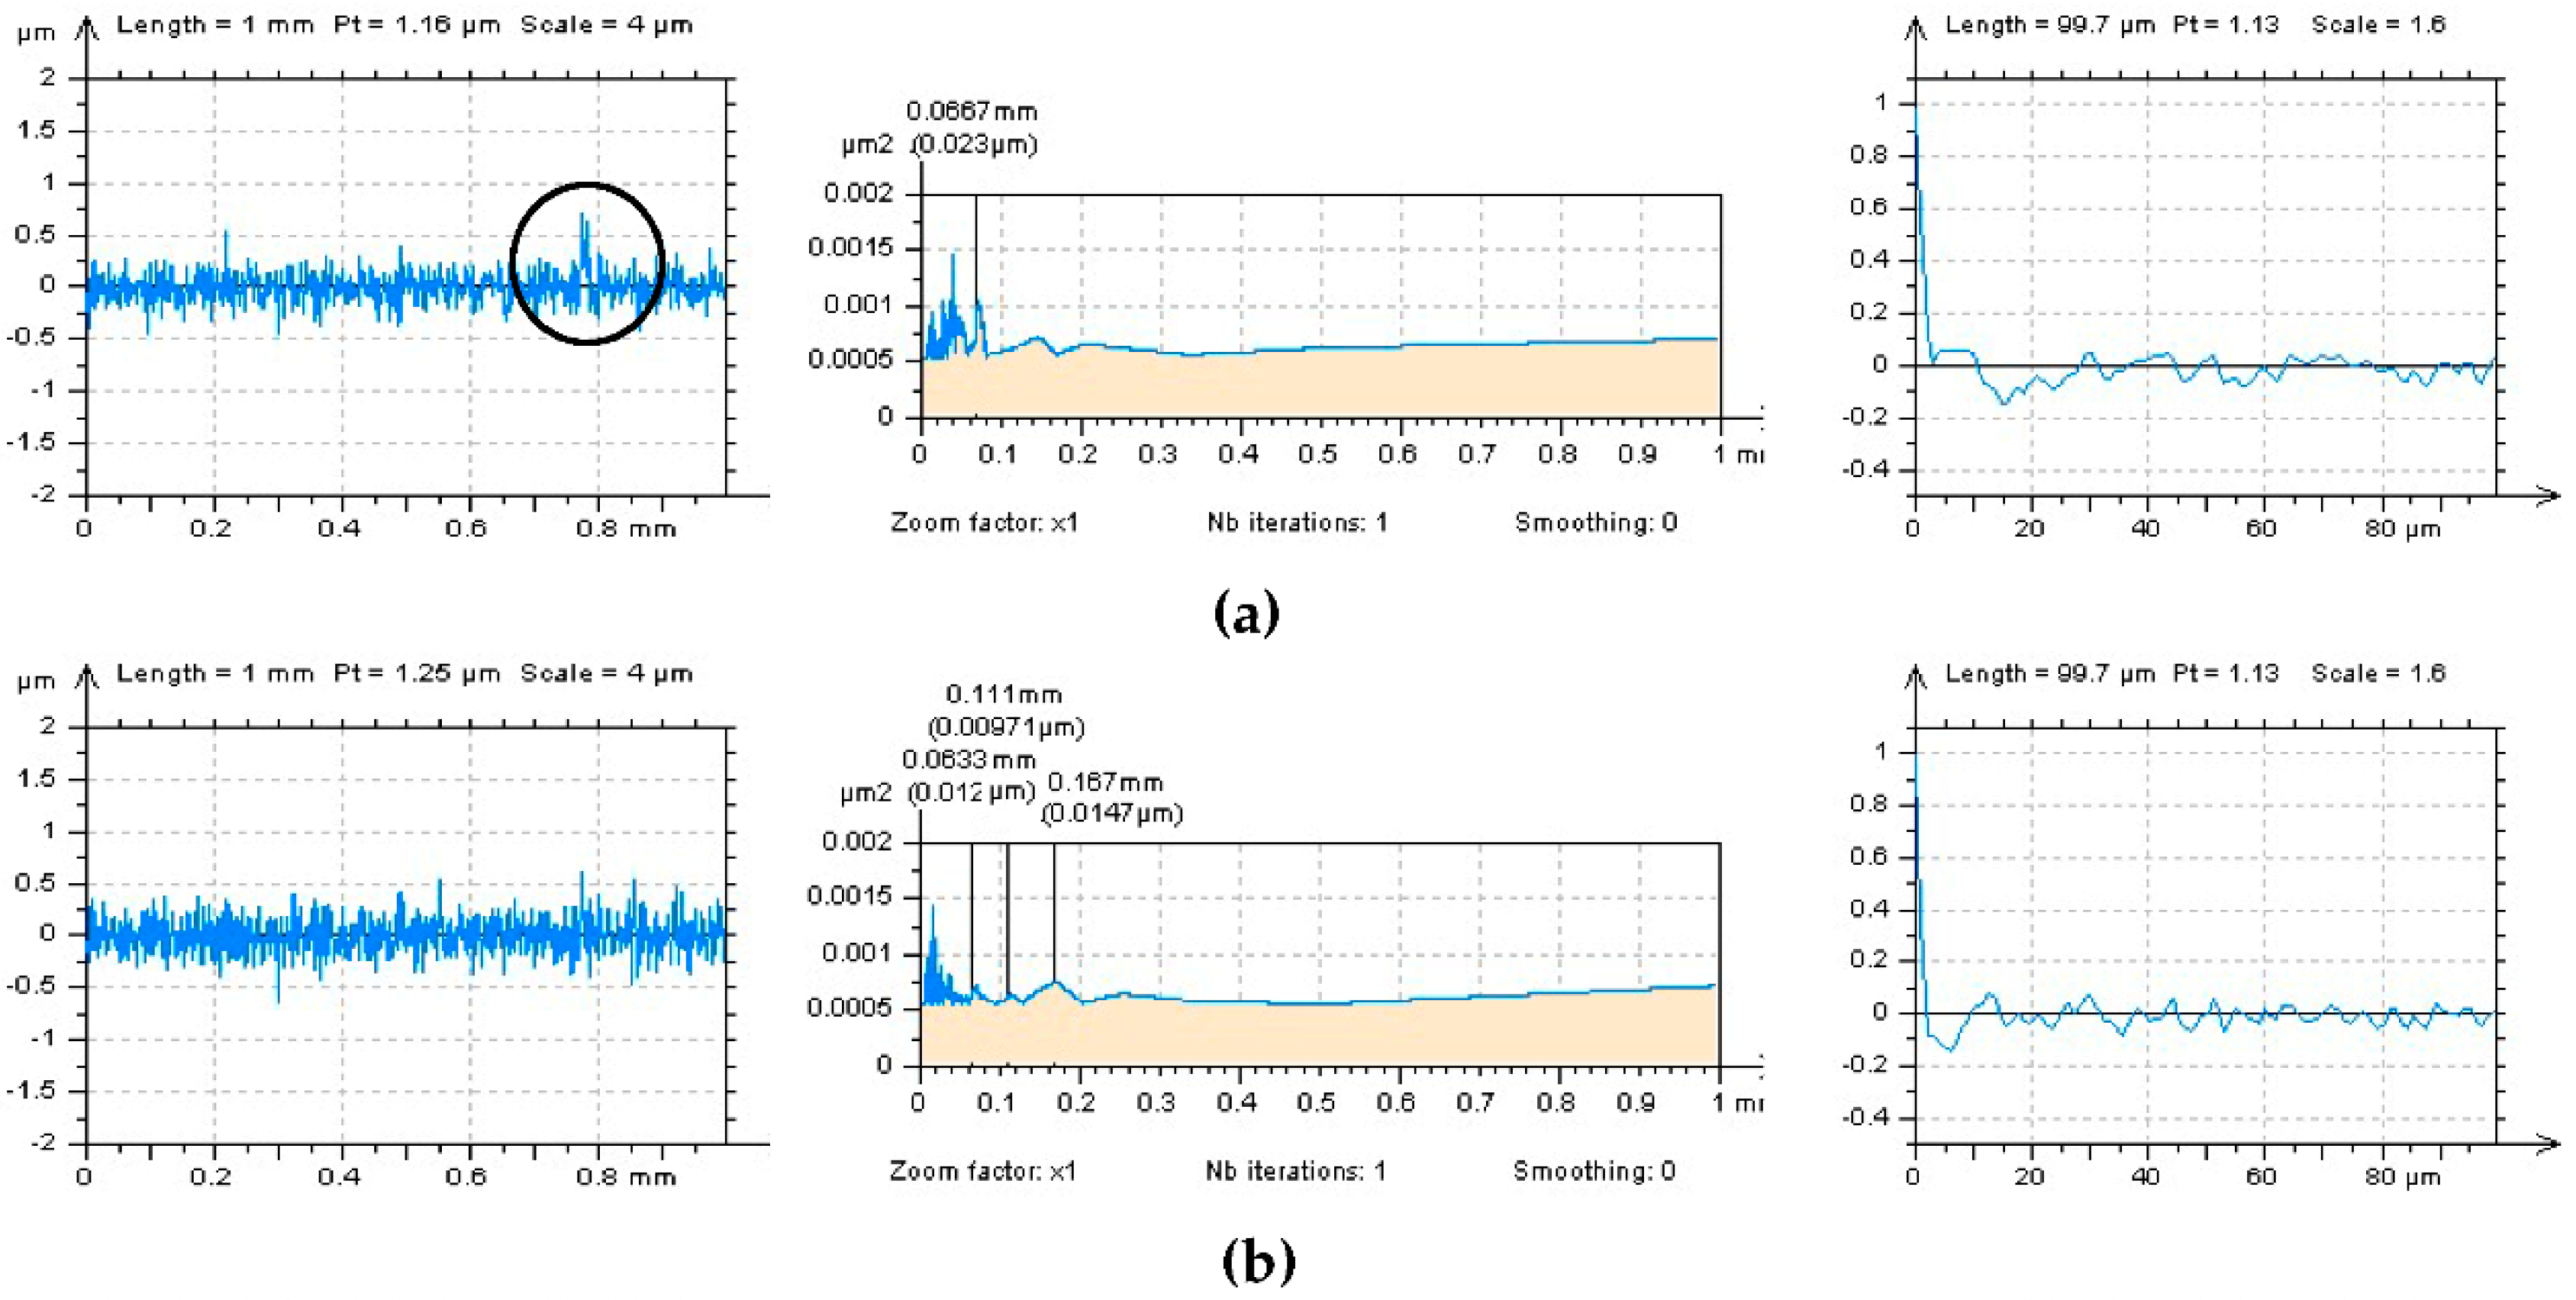
  • Consequently, the plateau-valley threshold separation method (PVTM), based on the threshold (remove) process of the valley part of the surface topography, was proposed. The PVTM technique can be completed with the valley- or plateau- separation method with different direction of extraction approach. It was found that profile (2D) definition of noise can be more useful than areal (3D), that the PSD graphs described for NP, is more exactly (directly) defined with the high-frequency components.
  • Selection of value of the cut-off of S-filtering method may be proposed with a detailed analysis of the NS. When the NS is characterized by the three, mentioned above, features, the noise suppression methods can be classified as relevant for reduction of the high-frequency errors. Generally, for zero-wear cylinder liner topographies, the median de-noising filter with cut-off equal to 0.035 mm was proposed, further, for running-in or worn details, the filter based on the Fast Fourier transform was suggested with value of cut-off equal to 0.025 mm, and consequently, the spline filters can give similar results for worn surfaces.
  • Generally, when S-filtration techniques and their cut-off values are selected, the comprehensive analysis of the NS should be directly applied. All the commonly-used, available in the commercial software, algorithms might be applied for suppression (detection and then reduction) of the high-frequency errors from the results of surface topography measurement of plateau-honed cylinder liners after a different stage of worn.
In the future, the results of detection and suppression of the high-frequency measurement noise from the raw measured data of milled, laser-textured, composite or ceramic topographies will be published by the author.

Funding

This research received no external funding.

Institutional Review Board Statement

Not applicable.

Informed Consent Statement

Not applicable.

Data Availability Statement

Data sharing is not applicable to this article.

Acknowledgments

Author kindly acknowledge Waldemar Koszela (Rzeszow University of Technology) for sharing all his tribological research results of plateau-honed cylinder liner textures containing additionally burnished dimples.

Conflicts of Interest

The author declares no conflict of interest.

Abbreviations and Parameters

The following abbreviations (first) and parameters (second section) are used in the manuscript:
ACF autocorrelation function
DMF regular de-noising Median filter
FFTF Fast Fourier Transform filter
GF Gaussian regression filter
NP noise profile
NS noise surface
PSD power spectral density
PVTM plateau-valley threshold separation method
RGF robust Gaussian regression filter
SEC surface emptiness coefficient, calculated as Sp/Sz
SF regular isotropic spline filter
SWLI Scanning White-Light Interferometry
Sa arithmetic mean height Sa, µm
Sal auto-correlation length, mm
Sbisurface bearing index
Sci core fluid retention index
Sda mean dale area, mm2
Sdq root mean square gradient
Sdr developed interfacial areal ratio, %
Sdv mean dale volume, mm3
Sk core roughness depth, µm
Sku kurtosis
Smc inverse areal material ratio, µm
Smr areal material ratio, %
Sp maximum peak height, µm
Spc arithmetic mean peak curvature, 1/mm
Spd peak density, 1/mm2
Spk reduced summit height, µm
Sq root mean square height, µm
Ssk skewness
Std texture direction, °
Str texture parameter
Sv maximum valley depth, µm
Svi valley fluid retention index
Svk reduced valley depth, µm
Sxp extreme peak height, µm
Sz the maximum height of the surface, µm

References

  1. Kubiak, K.; Wilson, M.; Mathia, T.; Carval, P. Wettability versus roughness of engineering surfaces. Wear 2011, 271, 523–528. [Google Scholar] [CrossRef] [Green Version]
  2. Grabon, W.; Pawlus, P.; Wos, S.; Koszela, W.; Wieczorowski, M. Effects of cylinder liner surface topography on friction and wear of liner-ring system at low temperature. Tribol. Int. 2018, 121, 148–160. [Google Scholar] [CrossRef]
  3. Guo, Z.; Yuan, C.; Liu, P.; Peng, Z.; Yan, X. Study on Influence of Cylinder Liner Surface Texture on Lubrication Performance for Cylinder Liner–Piston Ring Components. Tribol. Lett. 2013, 51, 9–23. [Google Scholar] [CrossRef]
  4. Rao, X.; Sheng, C.; Guo, Z.; Yuan, C. Effects of thread groove width in cylinder liner surface on performances of diesel engine. Wear 2019, 426, 1296–1303. [Google Scholar] [CrossRef]
  5. Kapsiz, M.; Durat, M.; Ficici, F. Friction and wear studies between cylinder liner and piston ring pair using Taguchi design method. Adv. Eng. Softw. 2011, 42, 595–603. [Google Scholar] [CrossRef]
  6. Johansson, S.; Nilsson, P.H.; Ohlsson, R.; Rosén, B.-G. Experimental friction evaluation of cylinder liner piston ring contact. Wear 2011, 271, 625–633. [Google Scholar] [CrossRef]
  7. Agarwa, A.K. Biofuels (alcohol sandbio diesel) applications as fuels for internal combustion engines. Prog. Energy Combust. Sci. 2007, 33, 233–271. [Google Scholar] [CrossRef]
  8. Lenauer, C.; Tomastik, C.; Wopelka, T.; Jech, M. Piston ring wear and cylinder liner tribofilm in tribotests with lubricants artificially altered with ethanol combustion products. Tribol. Int. 2015, 82, 415–422. [Google Scholar] [CrossRef]
  9. Jia, B.; Mikalsen, R.; Smallbone, A.; Roskilly, A.P. A study and comparison of frictional losses in free-piston engine and crankshaft engines. Appl. Therm. Eng. 2018, 140, 217–224. [Google Scholar] [CrossRef]
  10. Sabri, L.; Mezghani, S.; El Mansori, M.; Zahouani, H. Multiscale study of finish-honing process in mass production of cylinder liner. Wear 2011, 271, 509–513. [Google Scholar] [CrossRef]
  11. Jeng, Y.-R. Impact of Plateaued Surfaces on Tribological Performance. Tribol. Trans. 1996, 39, 354–361. [Google Scholar] [CrossRef]
  12. Koszela, W.; Pawlus, P.; Galda, L. The effect of oil pockets size and distribution on wear in lubricated sliding. Wear 2007, 263, 1585–1592. [Google Scholar] [CrossRef]
  13. Dzierwa, A. Influence of surface preparation on surface topography and tribological behaviours. Arch. Civ. Mech. Eng. 2017, 17, 502–510. [Google Scholar] [CrossRef]
  14. Kapłonek, W.; Mikołajczyk, T.; Pimenov, D.Y.; Gupta, M.K.; Mia, M.; Sharma, S.; Patra, K.; Sutowska, M. High-Accuracy 3D Optical Profilometry for Analysis of Surface Condition of Modern Circulated Coins. Materials 2020, 13, 5371. [Google Scholar] [CrossRef] [PubMed]
  15. Boedecker, S.; Rembe, C.; Schmid, H.; Hageney, T.; Köhnlein, T. Calibration of the z-axis for large-scale scanning white-light interferometers. J. Phys. Conf. Ser. 2011, 311, 012027. [Google Scholar] [CrossRef]
  16. Whitehouse, D. Surface metrology today: Complicated, confusing, effective. In Proceedings of the 13th International Conference on Metrology and Properties of Engineering Surfaces, Twickenham, UK, 12–15 April 2011; pp. 1–10. [Google Scholar]
  17. Pawlus, P.; Wieczorowski, M.; Mathia, T.G. The Errors of Stylus Methods in Surface Topography Measurements; Zapol: Szczecin, Poland, 2014. [Google Scholar]
  18. Grochalski, K.; Wieczorowski, M.; Pawlus, P.; H’Roura, J. Thermal Sources of Errors in Surface Texture Imaging. Materials 2020, 13, 2337. [Google Scholar] [CrossRef]
  19. Pawlus, P. Digitisation of surface topography measurement results. Measurement 2007, 40, 672–686. [Google Scholar] [CrossRef]
  20. Podulka, P. Proposal of frequency-based decomposition approach for minimization of errors in surface texture parameter calculation. Surf. Interface Anal. 2020, 52, 882–889. [Google Scholar] [CrossRef]
  21. Magdziak, M.; Wdowik, R. Coordinate Measurements of Geometrically Complex Ceramic Parts. Appl. Mech. Mater. 2014, 627, 172–176. [Google Scholar] [CrossRef]
  22. Wang, Y.; Yuan, P.; Ma, J.; Qian, L. Scattering noise and measurement artifacts in a single-shot cross-correlator and their suppression. Appl. Phys. A 2013, 111, 501–508. [Google Scholar] [CrossRef]
  23. ISO 25178-605. Geometrical Product Specification (GPS). In Surface Texture: Areal—Part 605: Nominal Characteristics of Non-Contact (Point Autofocus Probe) Instruments, 1st ed.; International Organization for Standardization: Geneva, Switzerland, 2004. [Google Scholar]
  24. De Groot, P.J. The meaning and measure of vertical resolution in optical surface topography measurement. Appl. Sci. 2017, 7, 54. [Google Scholar] [CrossRef]
  25. Wang, C.; D’Amato, R.; Gomez, E. Confidence Distance Matrix for outlier identification: A new method to improve the characterisations of surfaces measured by confocal microscopy. Measurement 2019, 137, 484–500. [Google Scholar] [CrossRef]
  26. Haitjema, H. Uncertainty in measurement of surface topography. Surf. Topogr. Metrol. Prop. 2015, 3, 35004. [Google Scholar] [CrossRef]
  27. Zuo, X.; Peng, M.; Zhou, Y. Influence of noise on the fractal dimension of measured surface topography. Measurement 2020, 152, 107311. [Google Scholar] [CrossRef]
  28. Creath, K.; Wayant, J.C. Absolute measurement of surface roughness. Appl. Opt. 1990, 29, 3823–3827. [Google Scholar] [CrossRef] [PubMed]
  29. ISO 2016 25178-600. Geometrical Product Specification (GPS). In Surface Texture: Areal Part 600: Metrological Characteristics for Areal-Topography Measuring Methods; International Organization for Standardization: Geneva, Switzerland, 2016. [Google Scholar]
  30. Giusca, C.L.; Leach, R.K.; Helary, F.; Gutauskas, T.; Nimishakavi, L. Calibration of the scales of areal surface topography-measuring instruments: Part 1. Measurement noise and residual flatness. Meas. Sci. Technol. 2012, 23, 035008. [Google Scholar] [CrossRef]
  31. Pawlus, P.; Reizer, R.; Wieczorowski, M. Problem of Non-Measured Points in Surface Texture Measurements. Metrol. Meas. Syst. 2017, 24, 525–536. [Google Scholar] [CrossRef]
  32. Grabon, W.; Pawlus, P.; Sep, J. Tribological characteristics of one-process and two-process cylinder linerhoned surfaces under reciprocating sliding conditions. Tribol. Int. 2010, 43, 1882–1892. [Google Scholar] [CrossRef]
  33. Pawlus, P. A study on the functional properties of honed cylinders surface during running-in. Wear 1994, 176, 247–254. [Google Scholar] [CrossRef]
  34. Galda, L.; Koszela, W.; Pawlus, P. Surface geometry of slide bearings after percussive burnishing. Tribol. Int. 2007, 40, 1516–1525. [Google Scholar] [CrossRef]
  35. Reizer, R.; Galda, L.; Dzierwa, A.; Pawlus, P. Simulation of textured surface topography during a low wear process. Tribol. Int. 2011, 44, 1309–1319. [Google Scholar] [CrossRef]
  36. Elson, J.M.; Bennett, J.M. Calculation of the power spectral density from surface profile data. Appl. Opt. 1995, 34, 201–208. [Google Scholar] [CrossRef] [PubMed]
  37. Królczyk, G.M.; Maruda, R.W.; Nieslony, P.; Wieczorowski, M. Surface morphology analysis of Duplex Stainless Steel (DSS) in Clean Production using the Power Spectral Density. Measurement 2016, 94, 464–470. [Google Scholar] [CrossRef]
  38. Whitehouse, D.J. Surface metrology. Meas. Sci. Technol. 1997, 8, 955–972. [Google Scholar] [CrossRef]
  39. Bartkowiak, T.; Berglund, J.; Brown, C.A. Multiscale Characterizations of Surface Anisotropies. Materials 2020, 13, 3028. [Google Scholar] [CrossRef] [PubMed]
  40. Podulka, P. Comparisons of envelope morphological filtering methods and various regular algorithms for surface texture analysis. Metrol. Meas. Syst. 2020, 27, 243–263. [Google Scholar]
  41. ISO 25178-3:2012. Geometrical Product Specifications (GPS). In Surface Texture: Areal—Part 3: Specification Operators; International Organization for Standardization: Geneva, Switzerland, 2012. [Google Scholar]
  42. Yuan, Y.-B.; Qiang, X.-F.; Song, J.-F.; Vorburger, T. A fast algorithm for determining the Gaussian filtered mean line in surface metrology. Precis. Eng. 2000, 24, 62–69. [Google Scholar] [CrossRef]
  43. Dobrzański, P.; Pawlus, P. Modification of Robust Filtering of Stratified Surface Topography. Metrol. Meas. Syst. 2013, 20, 107–118. [Google Scholar] [CrossRef]
  44. Zanini, F.; Pagani, L.; Savio, E.; Carmignato, S. Characterisation of additively manufactured metal surfaces by means of X-ray computed tomography and generalised surface texture parameters. CIRP Ann. 2019, 68, 515–518. [Google Scholar] [CrossRef]
  45. Podsiadlo, P.; Stachowiak, G. Characterization of surface topography of wear particles by SEM stereoscopy. Wear 1997, 206, 39–52. [Google Scholar] [CrossRef]
  46. Huang, S.; Tong, M.; Huang, W.; Zhao, X. An Isotropic Areal Filter Based on High-Order Thin-Plate Spline for Surface Metrology. IEEE Access 2019, 7, 116809–116822. [Google Scholar] [CrossRef]
  47. Podulka, P. Fast Fourier Transform detection and reduction of high-frequency errors from the results of surface topography profile measurements of honed textures. Eksploat. Niezawodn. 2021, 23, 84–93. [Google Scholar] [CrossRef]
  48. Raja, J.; Muralikrishnan, B.; Fu, S. Recent advances in separation of roughness, waviness and form. Precis. Eng. 2002, 26, 222–235. [Google Scholar] [CrossRef]
  49. Mathia, T.; Pawlus, P.; Wieczorowski, M. Recent trends in surface metrology. Wear 2011, 271, 494–508. [Google Scholar] [CrossRef]
  50. Kumar, J.; Shunmugam, M. Fitting of robust reference surface based on least absolute deviations. Precis. Eng. 2007, 31, 102–113. [Google Scholar] [CrossRef]
  51. Podulka, P. Bisquare robust polynomial fitting method for dimple distortion minimisation in surface quality analysis. Surf. Interface Anal. 2020, 52, 875–881. [Google Scholar] [CrossRef]
  52. Podulka, P. The effect of valley depth on areal form removal in surface topography measurement. Bull. Pol. Ac: Tech. 2019, 67, 391–400. [Google Scholar]
  53. Grabon, W.; Pawlus, P. Distinguishing the Plateau and Valley Components of Profiles From Various Types of Two-Process Textures. Metrol. Meas. Syst. 2016, 23, 593–602. [Google Scholar] [CrossRef] [Green Version]
  54. Godi, A.; Kühle, A.; De Chiffre, L. A plateau-valley separation method for textured surfaces with a deterministic pattern. Precis. Eng. 2014, 38, 190–196. [Google Scholar] [CrossRef]
  55. Schmähling, J.; Hamprecht, F. Generalizing the Abbott–Firestone curve by two new surface descriptors. Wear 2007, 262, 1360–1371. [Google Scholar] [CrossRef]
  56. Pawlus, P.; Reizer, R.; Wieczorowski, M.; Krolczyk, G.M. Material ratio curve as information on the state of surface topography—A review. Precis. Eng. 2020, 65, 240–258. [Google Scholar] [CrossRef]
  57. Lawrence, K.D.; Shanmugamani, R.; Ramamoorthy, B. Evaluation of image based Abbott-Firestone curve parameters using machine vision for the characterization of cylinder liner surface topography. Measurement 2014, 55, 318–334. [Google Scholar] [CrossRef]
  58. Corraln, I.B.; Calvet, J.V.; Salcedo, M.C. Use of roughness probability parameters to quantify the materialremoved in plateau-honing. Int. J. Mach. Tool Manu. 2010, 50, 621–629. [Google Scholar] [CrossRef]
  59. Savio, G.; Meneghello, R.; Concheri, G. A surface roughness predictive model in deterministic polishing of ground glass moulds. Int. J. Mach. Tools Manuf. 2009, 49, 1–7. [Google Scholar] [CrossRef]
  60. Laheurte, R.; Darnis, P.; Darbois, N.; Cahuc, O.; Neauport, J. Subsurface damage distribution characterization of ground surfaces using Abbott-Firestone curves. Opt. Express 2012, 20, 13551–13559. [Google Scholar] [CrossRef] [Green Version]
  61. Ma, S.; Liu, Y.; Wang; Huang, R.; Xu, J.; Ma; Liu; Xu; Wang, Z.; Wang, Z. The Effect of Honing Angle and Roughness Height on the Tribological Performance of CuNiCr Iron Liner. Metals 2019, 9, 487. [Google Scholar] [CrossRef] [Green Version]
  62. Feng, C.X.; Wang, X.; Yu, Z. Neural Networks Modeling of Honing Surface Roughness Parameters Defined by ISO 13565. J. Manuf. Sys. 2002, 21, 395–408. [Google Scholar] [CrossRef]
  63. Mezghani, S.; Demirci, I.; Yousfi, M.; El Mansori, M. Mutual influence of crosshatch angle and superficial roughness of honed surfaces on friction in ring-pack tribo-system. Tribol. Int. 2013, 66, 54–59. [Google Scholar] [CrossRef] [Green Version]
Figure 1. Areas with selected parameters, correspondingly, and profiles of measured by the stylus (a,b) or optical (c,d) instruments surface topographies of zero-wear (a,c) and running-in (b,d) plateau-honed cylinder liner textures.
Metals 11 00143 g001aMetals 11 00143 g001b
Figure 2. Isometric views (a,b), material ratio curves (c,d) and selected parameters (e,f) of plateau-honed cylinder liner surface topographies, containing oil pockets, in the running-in (a,c,e) and worn (b,d,f) stage of life, measured by the stylus instrument.
Metals 11 00143 g002aMetals 11 00143 g002b
Figure 3. Examples of NS (a,c,e) and their PSDs (b,d,f) received from plateau-honed cylinder liner surface texture by application of GF (a,b), RGF (c,d) and SF (e,f), cut-off = 0.025 mm.
Metals 11 00143 g003
Figure 4. Examples of isometric views (left column) cylinder liner surface textures and its PSDs (right column) with two separate dimples, measured by stylus instrument with 0.3 mm/s (a,b,e,f) and 0.7 mm/s (c,d,g,h) velocity and the same details after application of the PVTM (eh) correspondingly.
Metals 11 00143 g004aMetals 11 00143 g004b
Figure 5. Method of selection of the thresholding value A (c) with the Abbott-Firestone curve (a) (material ratio curve (b)) for plateau-honed cylinder liner surface containing dimples, the approach is based on the Sk and Svk parameter descriptions.
Metals 11 00143 g005
Figure 6. Cylinder liner surface measured with 0.3 mm/s (a,e) and 0.7 mm/s (b,f) speed, with the PSDs (c,d,g,h) respectively, received for the regular (ad) and PVTM (eh) methods.
Metals 11 00143 g006aMetals 11 00143 g006b
Figure 7. Profiles, their PSDs and ACFs (defined for 1 mm bandwidth) respectively, extracted from cylinder liner (running-in) surface texture measured with 0.5 mm/s velocities, containing the dimples (wide oil pockets) with a depth equal to 80 µm (a), 20 µm (b) and free-of-dimple profile (c).
Metals 11 00143 g007
Figure 8. Isometric views of cylinder liner plateau-honed surface texture measured with 0.3 mm/s (a) and 0.7 mm/s (d) velocities with vertically extracted profiles (b,e), indicated by the dash lines in the views of measured detail, and their PSDs (c,f) correspondingly.
Metals 11 00143 g008
Figure 9. Isometric view (a) of the plateau-honed cylinder liner surface texture after stylus measurement with 0.5 mm/s velocity, and profiles P1 (b), P2 (c) and P3 (d) with PSDs respectively, defined for the various directions of profile extraction method.
Metals 11 00143 g009
Figure 10. NSs (left), PSDs (middle) and texture direction graphs (right column), defined for results of measurement (0.7 mm/s) of the zero-wear plateau-honed cylinder liner surface topography, received by the application of GF (a), RGF (b), DMF (c), SF (d) and FFTF (e), cut-off = 0.035 mm.
Metals 11 00143 g010aMetals 11 00143 g010b
Figure 11. NSs (left column), PSDs (middle column) and texture direction graphs (right column), specified for results of 0.7 mm/s measurements of the running-in plateau-honed cylinder liner surface texture, obtained by the application of various S-filtering methods (cut-off = 0.025 mm), as follows: GF (a), RGF (b), DMF (c), SF (d) and FFTF (e).
Metals 11 00143 g011aMetals 11 00143 g011b
Figure 12. In the left column NSs, middle PSDs, right column the graphs of the texture direction, determined for measurement results with 0.7 mm/s speed of worn plateau-honed cylinder liner surface topography with oil pockets with width 0.9 mm and depth 75 µm (in averages), received by the following S-filtering schemes: GF (a), RGF (b), DMF (c), SF (d) and FFTF (e), cut-off = 0.015 mm.
Metals 11 00143 g012aMetals 11 00143 g012b
Figure 13. NPs (left column), their PSDs (middle) and ACFs (right), described for profiles from zero wear (a,b), running-in (c,d) and worn (e,f) cylinder liner surface topography measured with 0.5 mm/s velocity and received by GF (a), FFTF (b), DMF (c), SF (d,e) and RGF (f) approach, with cut-off equal to 0.015 mm (a,b), 0.035 mm (c,d) and 0.025 mm (e,f).
Metals 11 00143 g013aMetals 11 00143 g013b
Publisher’s Note: MDPI stays neutral with regard to jurisdictional claims in published maps and institutional affiliations.

