Article

The Effect of Laser Offset Welding on Microstructure and Mechanical Properties of 301L to TA2 with and without Cu Intermediate Layer

1
Key Laboratory of Automobile Materials, School of Materials Science and Engineering, Jilin University, Changchun 130025, China
2
School of Mechanical and Aerospace Engineering, Jilin University, Changchun 130025, China
*
Author to whom correspondence should be addressed.
Metals 2020, 10(9), 1138; https://doi.org/10.3390/met10091138
Submission received: 22 July 2020 / Revised: 14 August 2020 / Accepted: 14 August 2020 / Published: 24 August 2020

Abstract

:
Based on dissimilar materials of 301L/TA2, the effect of laser offset and copper intermediate layer on welded joints was investigated. First, the process optimization of laser offsets indicated that the tensile strength of welded joint without intermediate layer was reached to the highest value when the laser was applied on the TA2 side. On the other hand, the tensile strength of welded joint with intermediate layer performed well when laser was applied in the middle position. Then, microstructural characterization and mechanical properties of welded joints were observed and tested. Based on eutectic reaction and peritectic reaction: TiFe and TiFe2 compounds were produced for welded joint without intermediate layer. Cu-Fe solid solutions and Cu-Ti compounds were generated when copper was used as the intermediate layer. The maximum tensile strength of welded joint with and without copper intermediate layer were 396 and 193 MPa, respectively. Finally, fracture mechanism of 301L/TA2 welded joint was studied: Fe-Ti compounds caused brittle fracture of welded joints without intermediate layer; brittle fracture took place in rich copper and Cu-Ti compounds area of welded joints with copper intermediate layer.

1. Introduction

Pure titanium and stainless steel are often used in clinical medical field for the high mechanical strength, fatigue resistance, excellent resistance to physiological corrosion, and biocompatibility [1]. At present, the medical implants with stainless steel and titanium-based alloys have been approved. The hip joint prosthesis are made of stainless steel. Industrial pure titanium is also used to make artificial bone, knee, and elbow joints. Besides, they are used as stamping parts and corrosion-resistant structural parts with a working temperature below 360 °C, which are not stressed but require high plasticity, such as: aircraft frame partitions, engine accessories, marine corrosion-resistant pipelines, and heat exchangers in chemical industry. The composite component formed by stainless steel and titanium can fully take advantage of the complementary performance and economic advantages.
Because of the differences in physical and chemical properties of titanium and stainless steel, there are many technical difficulties in the welding process. First of all, the huge difference in the linear expansion coefficient results in a different deformation capacities during welding heating and cooling process. Therefore, a large tensile residual stress will be produced in the welded joint, and it is difficult to be removed. Second, the strong interdiffusion between titanium and iron atoms will occur under the action of high temperature during welding process, so a large amount of brittle and hard intermetallic compounds (TiFe, TiFe2, Ti2Fe) are formed in the welded joint during cooling process. In addition, titanium is easy to form intermetallic compounds (TiC, TiCr2, TiNi, TiNi2, TiNi3) with carbon, chromium, and nickel in the stainless steel matrix, which increases the brittleness of welded joints [2,3,4].
In order to obtain the welded joint with excellent performance of pure titanium and stainless steel, it is necessary to adopt appropriate welding methods and welding processes to reduce internal stress and avoid formation of brittle phase. Ridha Mohammed [5] studied the fiber laser welding of dissimilar 2205/304 stainless steel plates. The results suggest that fiber laser welding is effectively employed to produce austenitic-duplex stainless steel weldment. Landowski [6] had investigated the autogenous fiber laser welding of 316L austenitic and 2304 lean duplex stainless steels. Cao [7] experimented on the effect of beam offset on macro defects, microstructure and mechanical behaviors in dissimilar laser beam welds of SDSS2502/Q235. The study reports that a good weld formation could be obtained when a suitable laser beam offset toward the SDSS2507. From the previous investigations, laser welding and laser offset are conducive to the connection of dissimilar materials. In addition, a suitable intermediate layer can greatly affect the interdiffusion of elements and hinder the direct reaction of iron and titanium. As for the selection of intermediate layer, copper is currently the best choice because of its excellent ductility and low cost [8,9,10,11]. Under the action of welding heat source, a part of molten copper reacts with titanium and iron to form compounds, the other part exists in welded seam in the form of solid solution, which hinders the metallurgical reaction of titanium and iron. Therefore, copper as an intermediate layer greatly restrains the formation of brittle compounds [12,13]. In the past 10 years, considerable attention has been paid to Cu intermediate layer. Pardal [14] had performed welding of Ti and stainless by Cu as transition metal using cold metal transfer technology. The results suggest that the intermetallic compounds formed are less and mechanical properties improved are higher. Tomashchuk [11] had performed dissimilar welding of titanium alloy to stainless steel using copper as an interlayer on a Nd:YAG laser. The study showed that the insertion of copper obtained good mechanical properties. Zhang [15] also had performed dissimilar welding of titanium alloy with stainless steel using laser welding technique by Cu intermediate layer. The study shows that a good weld quality was obtained for joints having Cu as a filler material. However, there are a few reports and studies on the effect of laser offset on joints 301L to TA2 with and without Cu intermediate layer.
In this study, the effect of laser offset on welded joints of 301L to TA2 with and without Cu intermediate layer was investigated. Microstructural characterization and mechanical properties of welded joints were observed and tested. The fracture mechanism of welded joints was investigated.

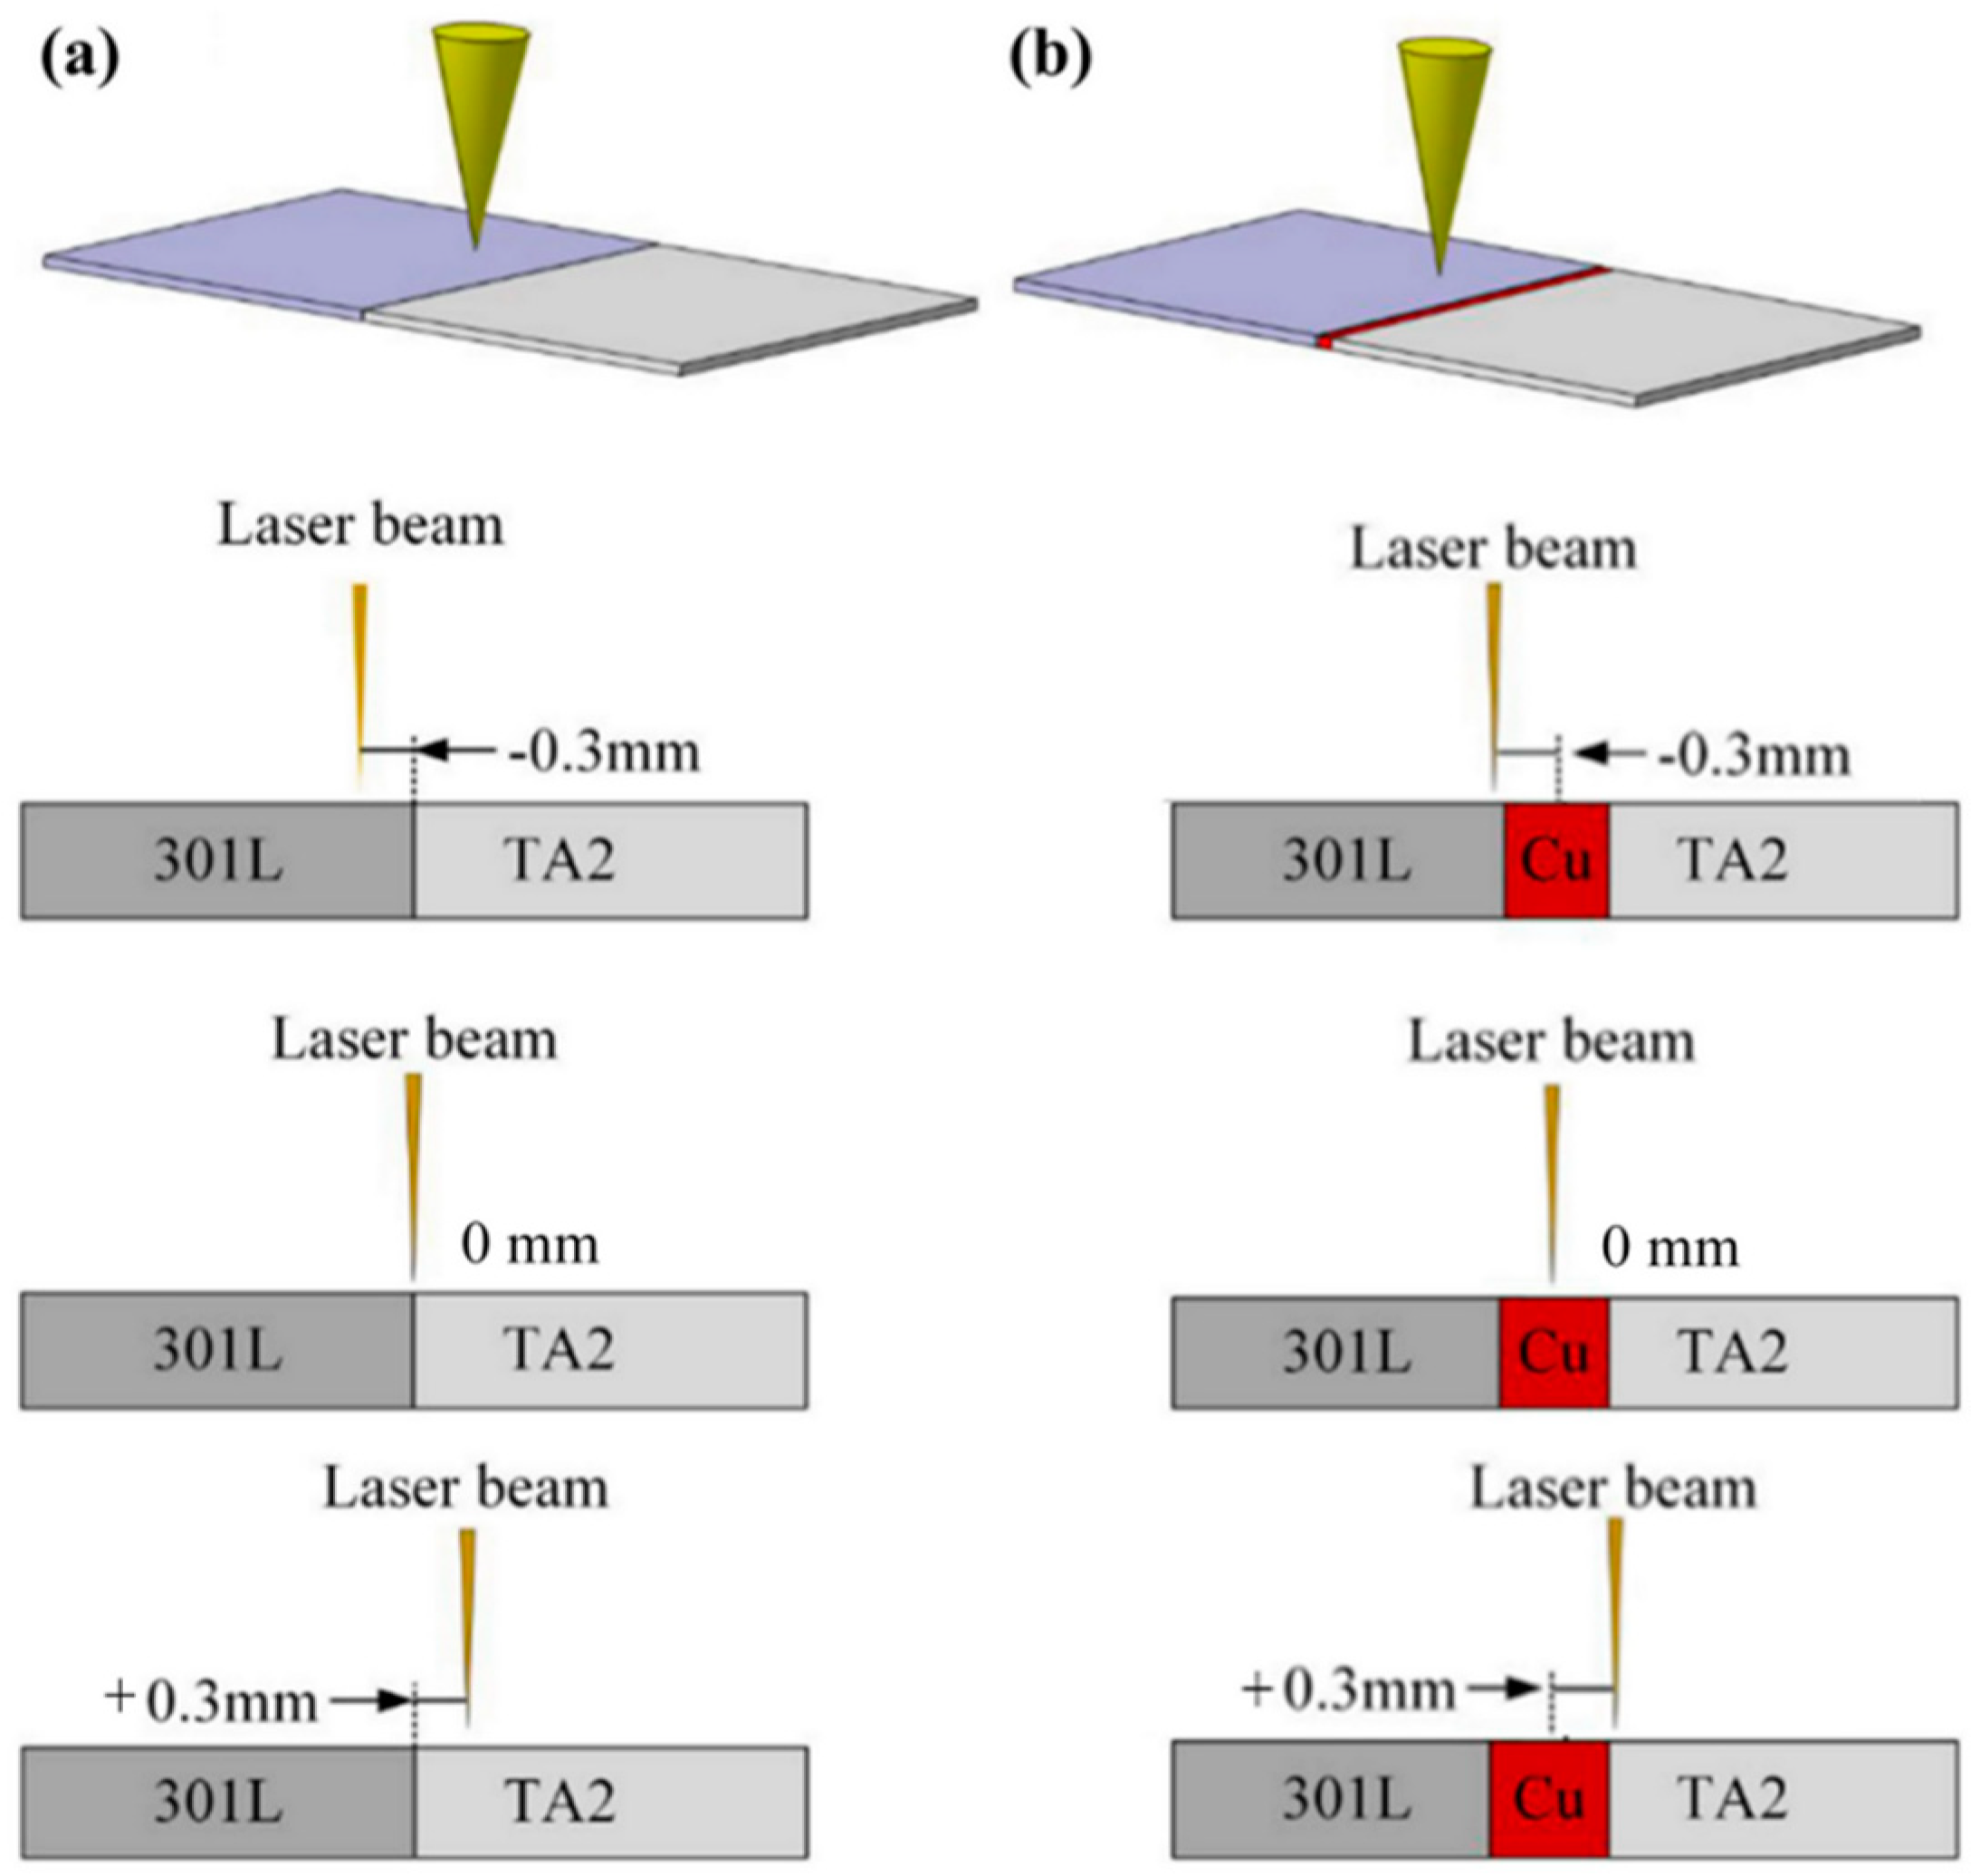
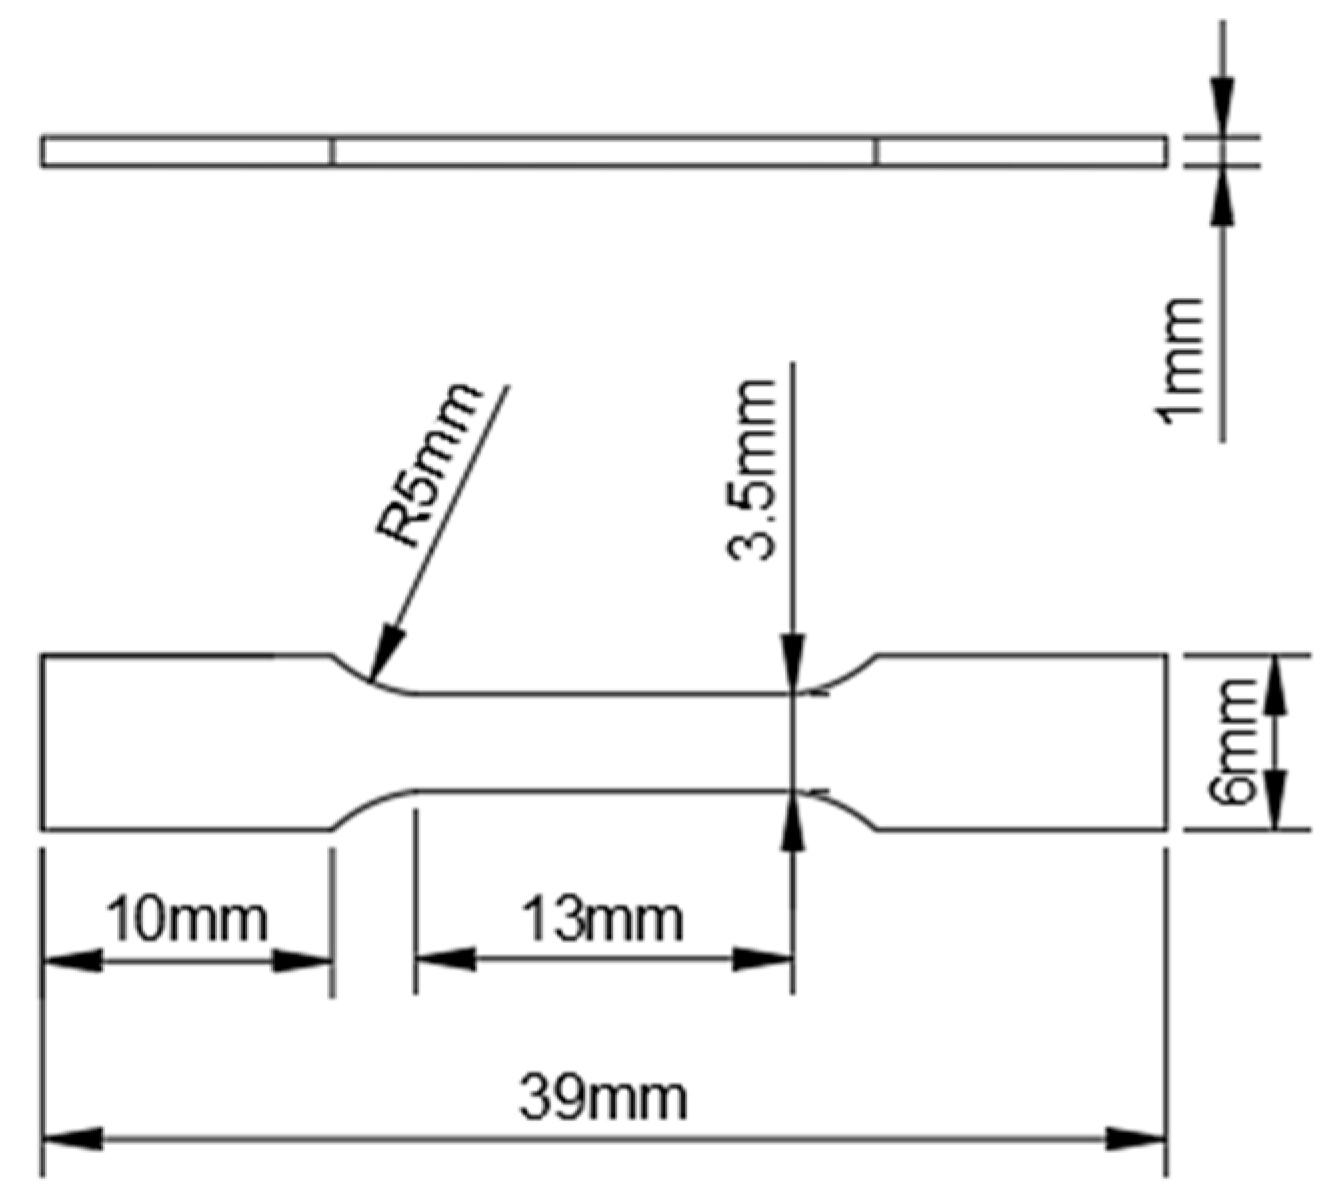
2. Materials and Methods

Pulsed Nd:YAG laser system (Changchun New Industries Optoelectronics Technology Co. Ltd., Changchun, China) was used in this study. The parameters were laser power of 1.05 kW, wavelength of 1.064 μm, beam spot diameter of 0.1 mm, and focal length of 150 mm. Stainless steel of 301 and pure titanium of TA2 were used. The chemical composition and physical properties are shown in Table 1, Table 2 and Table 3 [16,17].
The workpieces were machined into 50 mm × 40 mm × 1 mm plates, and then were cleaned mechanically and chemically before welding. The laser beam offset is the distance between laser spot center and 301L/TA2 interface. When the laser beam center was irradiated on 301L side, the offset was recorded as a negative value, on the contrary, the offset was recorded as a positive value. Three kinds of offsets, i.e., −0.3 mm, 0 mm, and +0.3 mm were employed, as shown in Figure 1. Different offsets mean that the heat input and temperature field are different.
In the process of setting welding parameters, we not only should ensure the completely melting of intermediate layer, but also control the partial melting of base metal. In this study, the adopted laser welding parameters of TA2/301L is current of 110 A, welding speed of 200 mm/min, pulse width of 9.0 ms, defocus amount of 19.6 mm, pulse frequency of 6.0 Hz and argon (99.99%) gas flow of 15 L/min. Based on the above welding parameters, three kinds of laser offsets (−0.3 mm, 0 mm, 0.3 mm) were applied. In order to better observe the microstructure, the welded joint was etched by corrosive liquid (10 g FeCl3 + 30 mL HCl + 120 mL H2O). Microstructure was observed with OM (Scope Axio ZEISS, Jena, Germany) and SEM (S-3400, HITACHI, Tokyo, Japan). Phase composition was investigated by X-ray diffraction (XRD) analysis (D8 DISCOVER GDDDS, Bruker, Karlsruhe, Germany). Micro-hardness was evaluated by Nano-indentation test (MH-3, Xi’an Minks Testing Equipment Co. Ltd., Xi’an, China). Tensile strength was measured by Electro-hydraulic servo universal testing machine (MIS8/0.22M, MTS Systems Corporation 14000 Technology Drive, Eden Prairie, MN, USA).

3. Results and Discussions

3.1. Characterization of 301L/TA2 Welded Joint

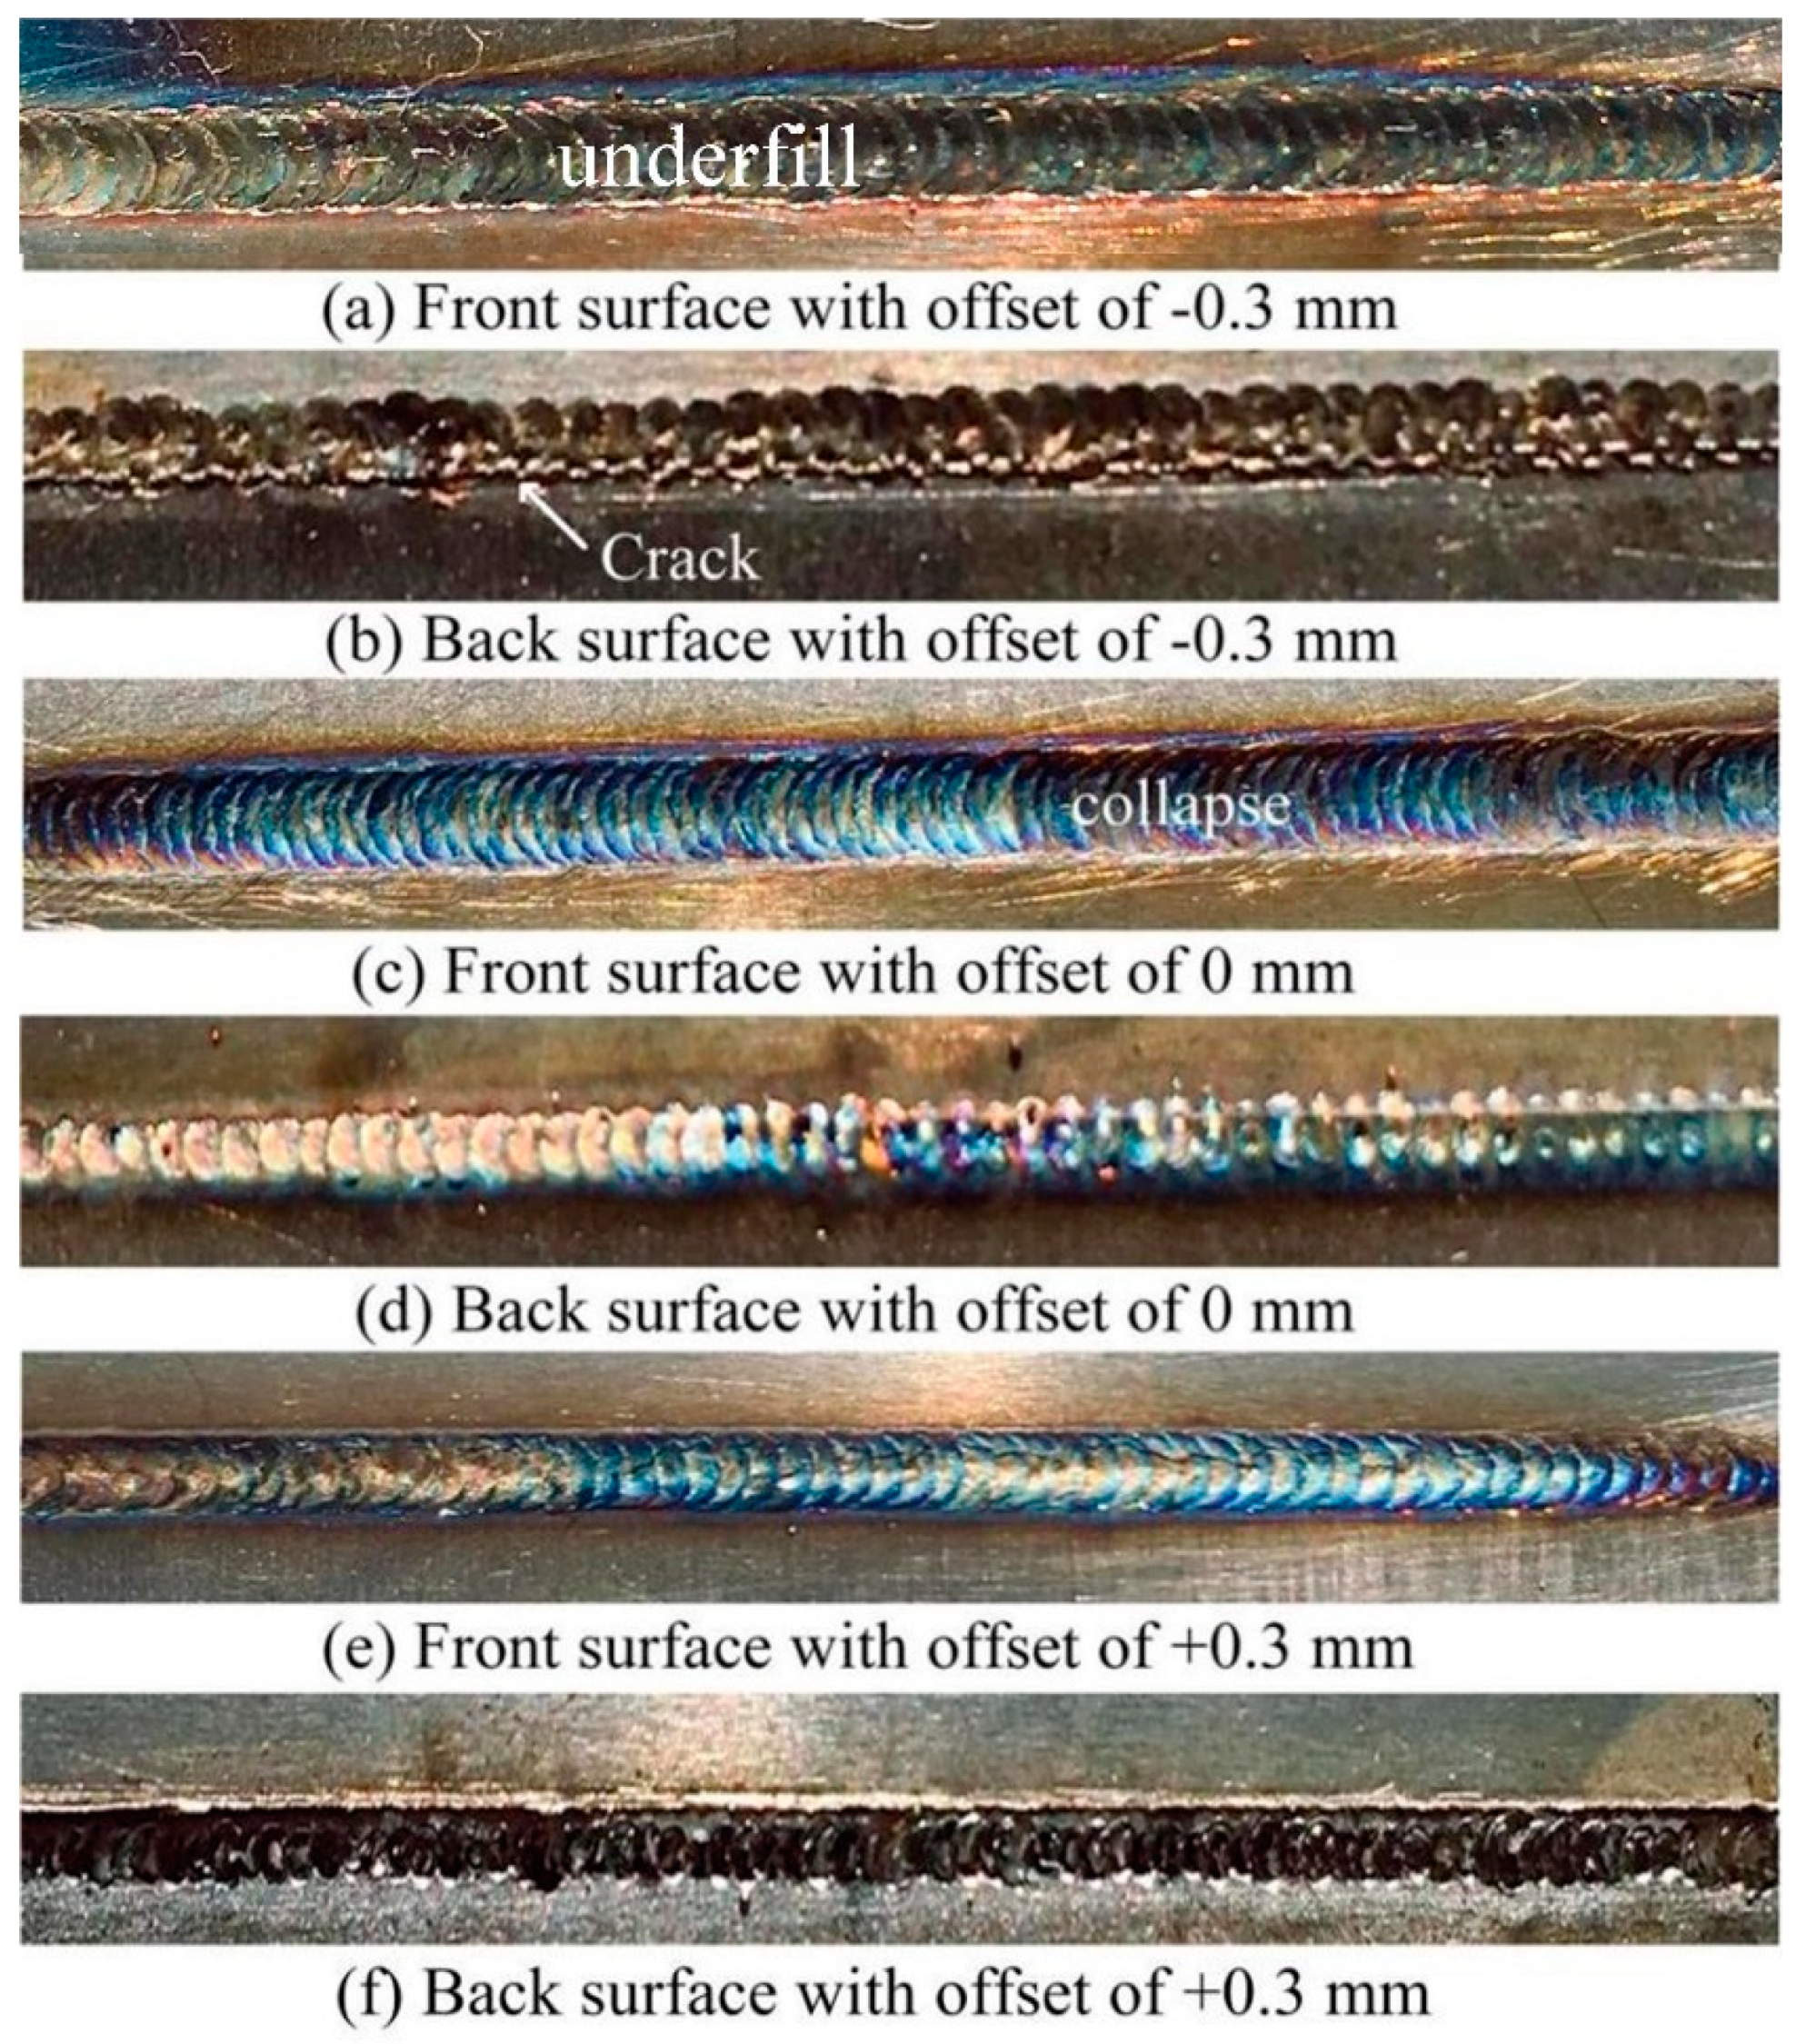
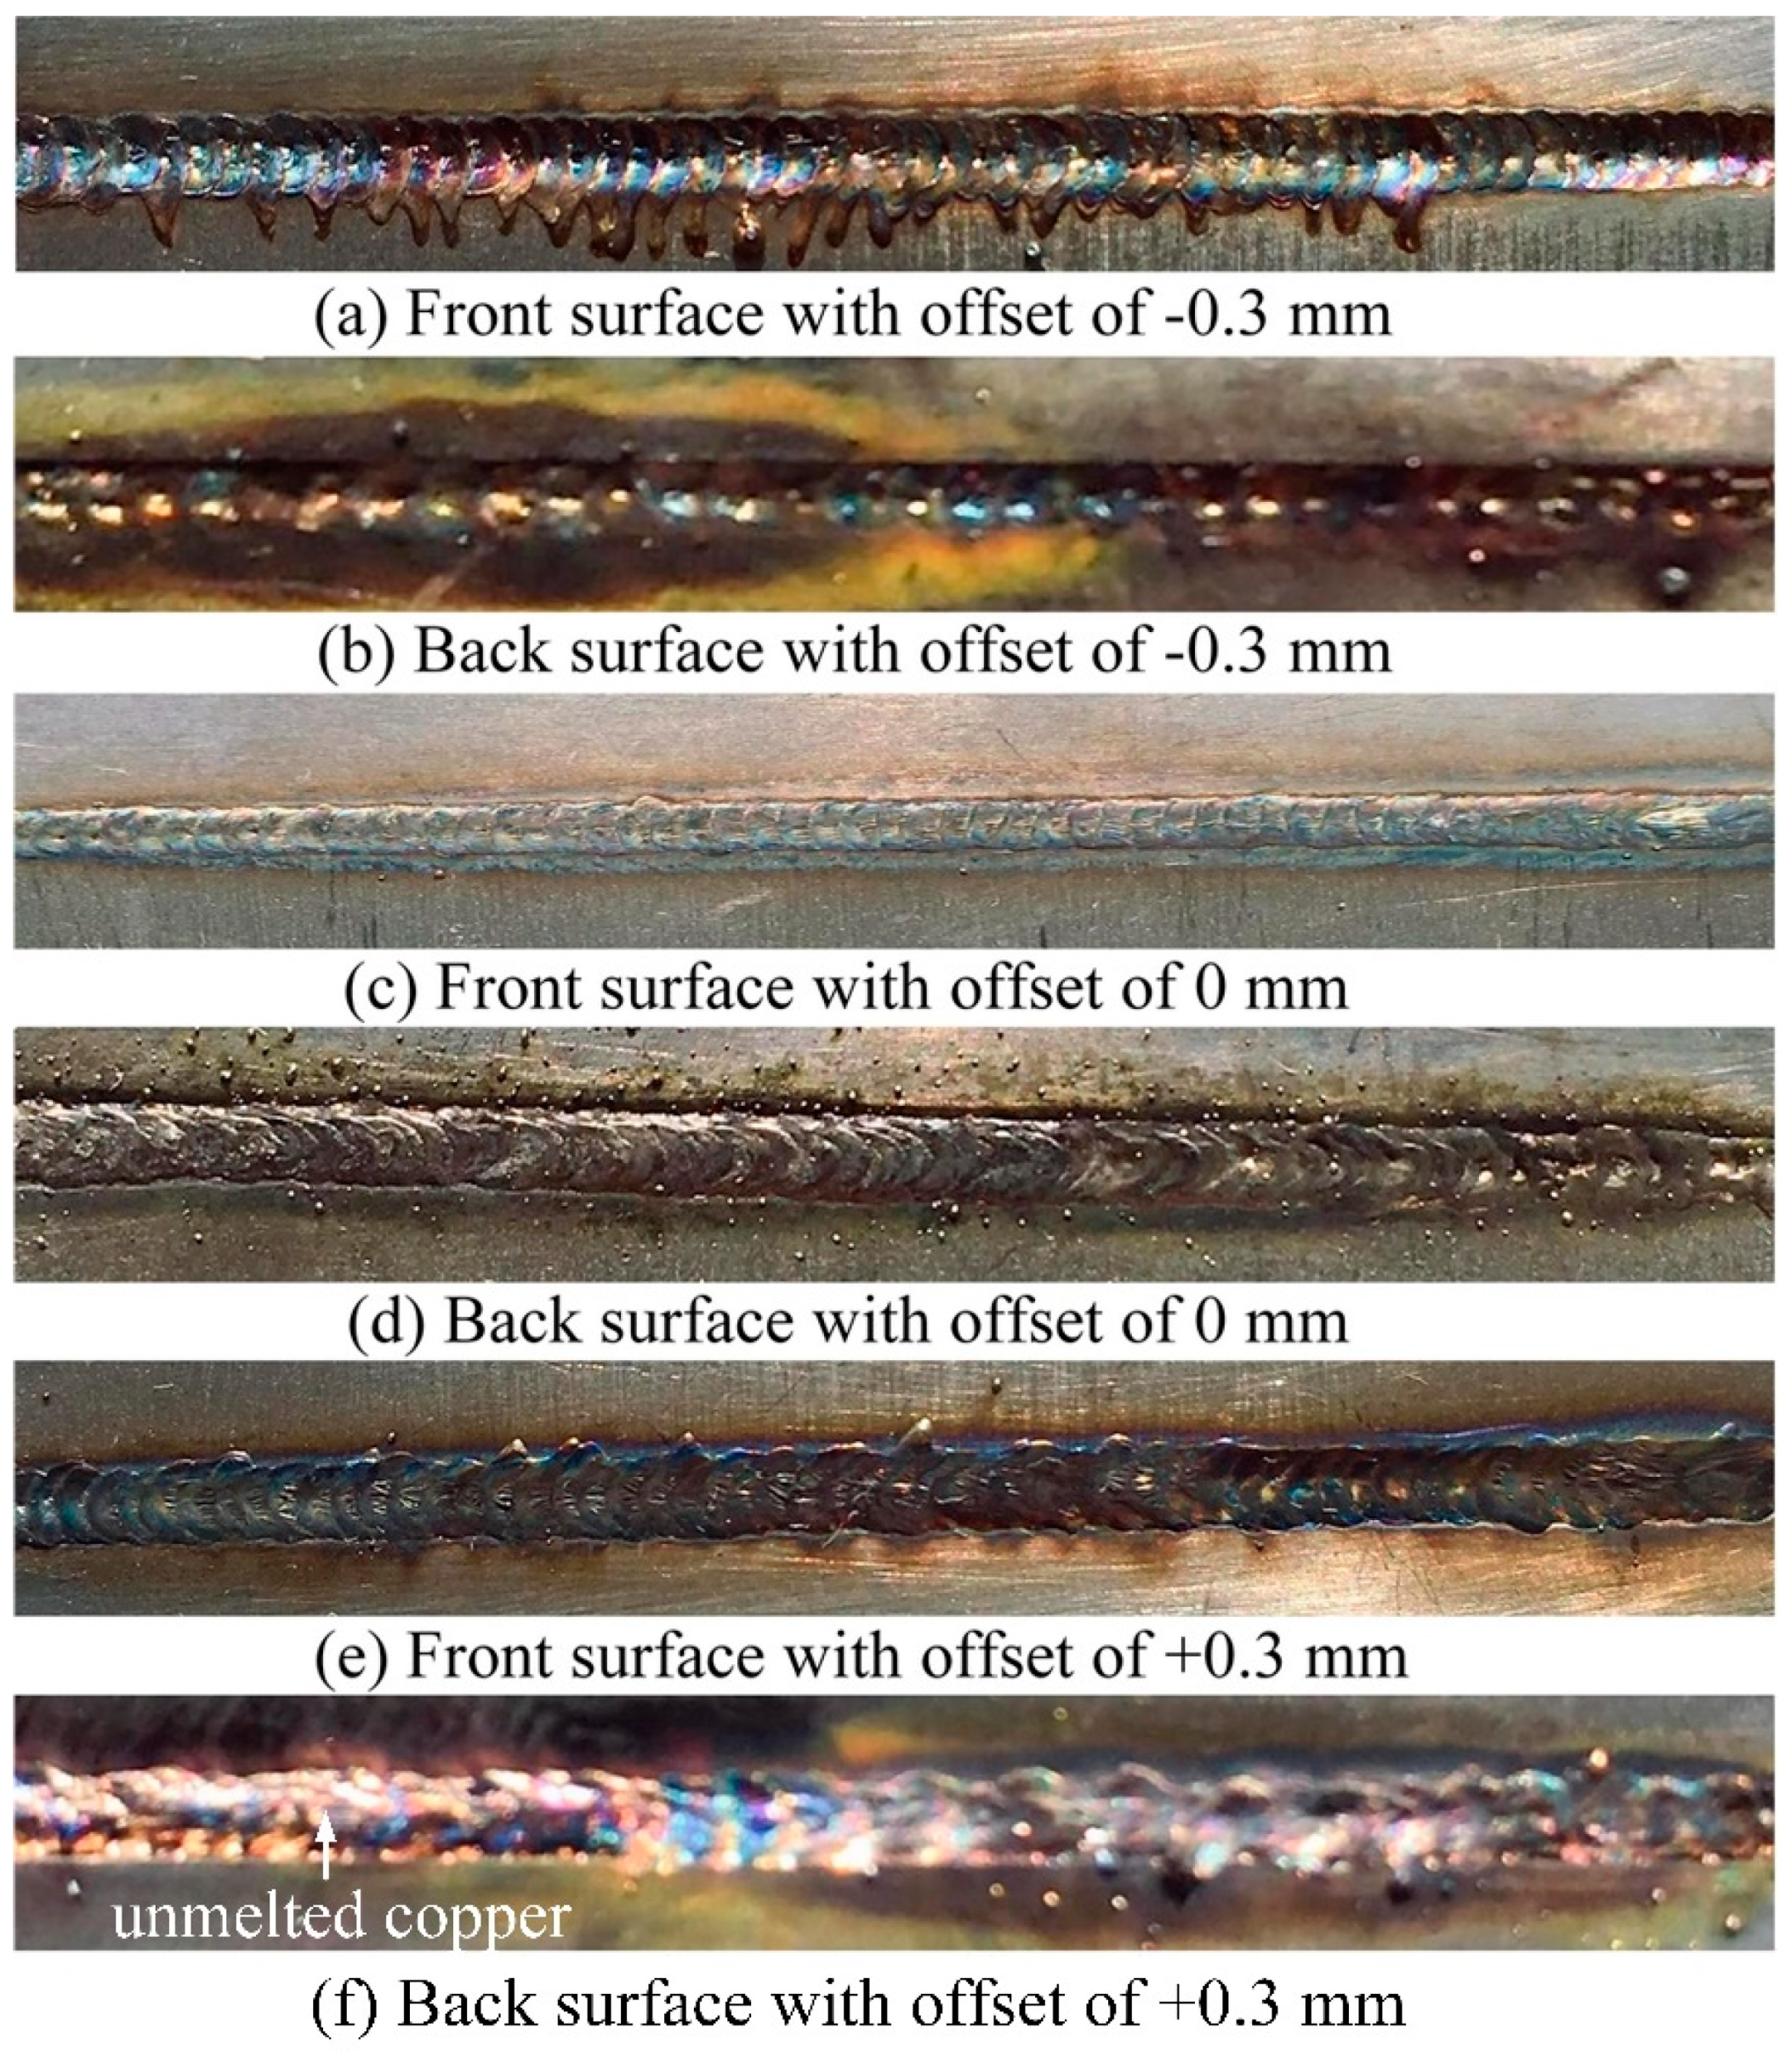
3.1.1. Surface Morphologies

Figure 2 shows the front and back surfaces morphologies of 301L/TA2 welded joints with different laser offsets. From Figure 2 we can know that laser offsets greatly affected the appearance of welded joints. When the offset was −0.3 mm, there was no obvious metal luster and welding ripples, while the obvious underfill (Figure 2a) exists on the front of welded joint. In addition, the linear expansion coefficient of 301L was greater than that of TA2. When the offset was −0.3 mm, the greater deformation and residual stress were produced because the more heat input was applied to 301L side, so the crack can be observed on the back surface (Figure 2b). When the offset was 0 mm, there are good welding ripples, but the obvious collapse still exists (Figure 2c). When the offset was +0.3 mm, a favorable morphology (obvious welding ripples and metallic luster) of welding surface without collapse was formed (Figure 2e). In Figure 2d,f, the obvious welding flaws were not found, and the quality of back welding surface were good.

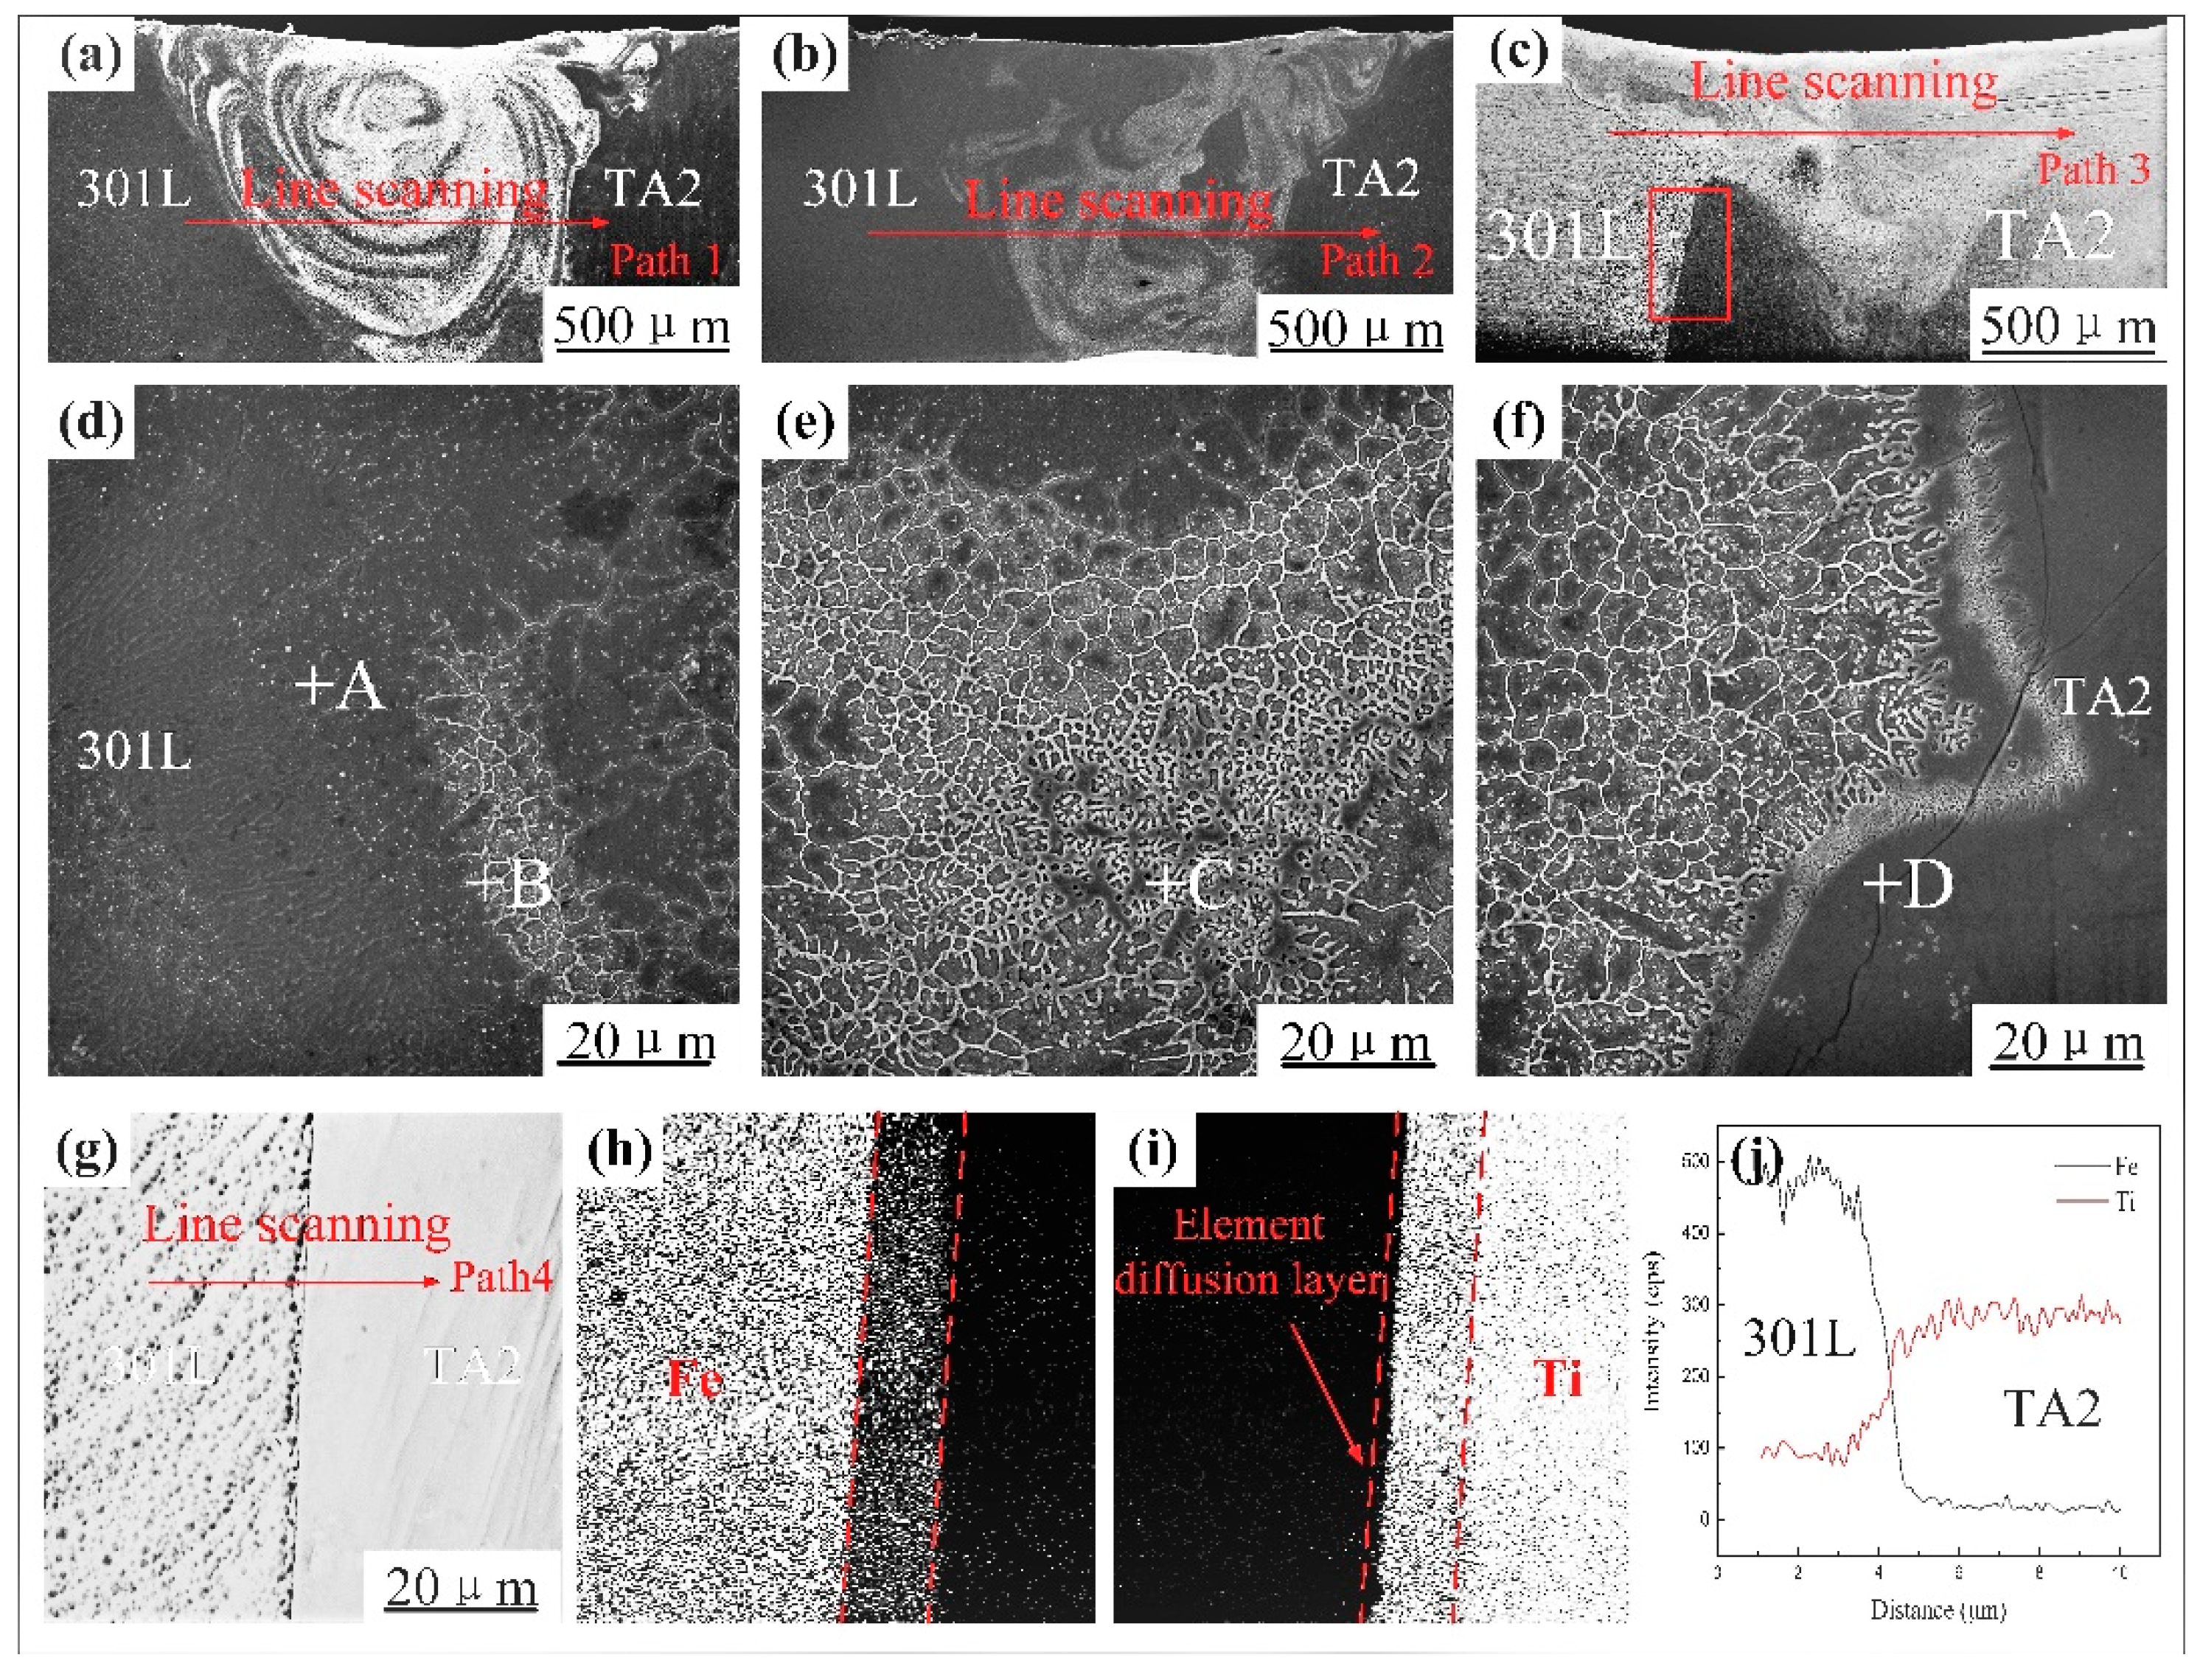
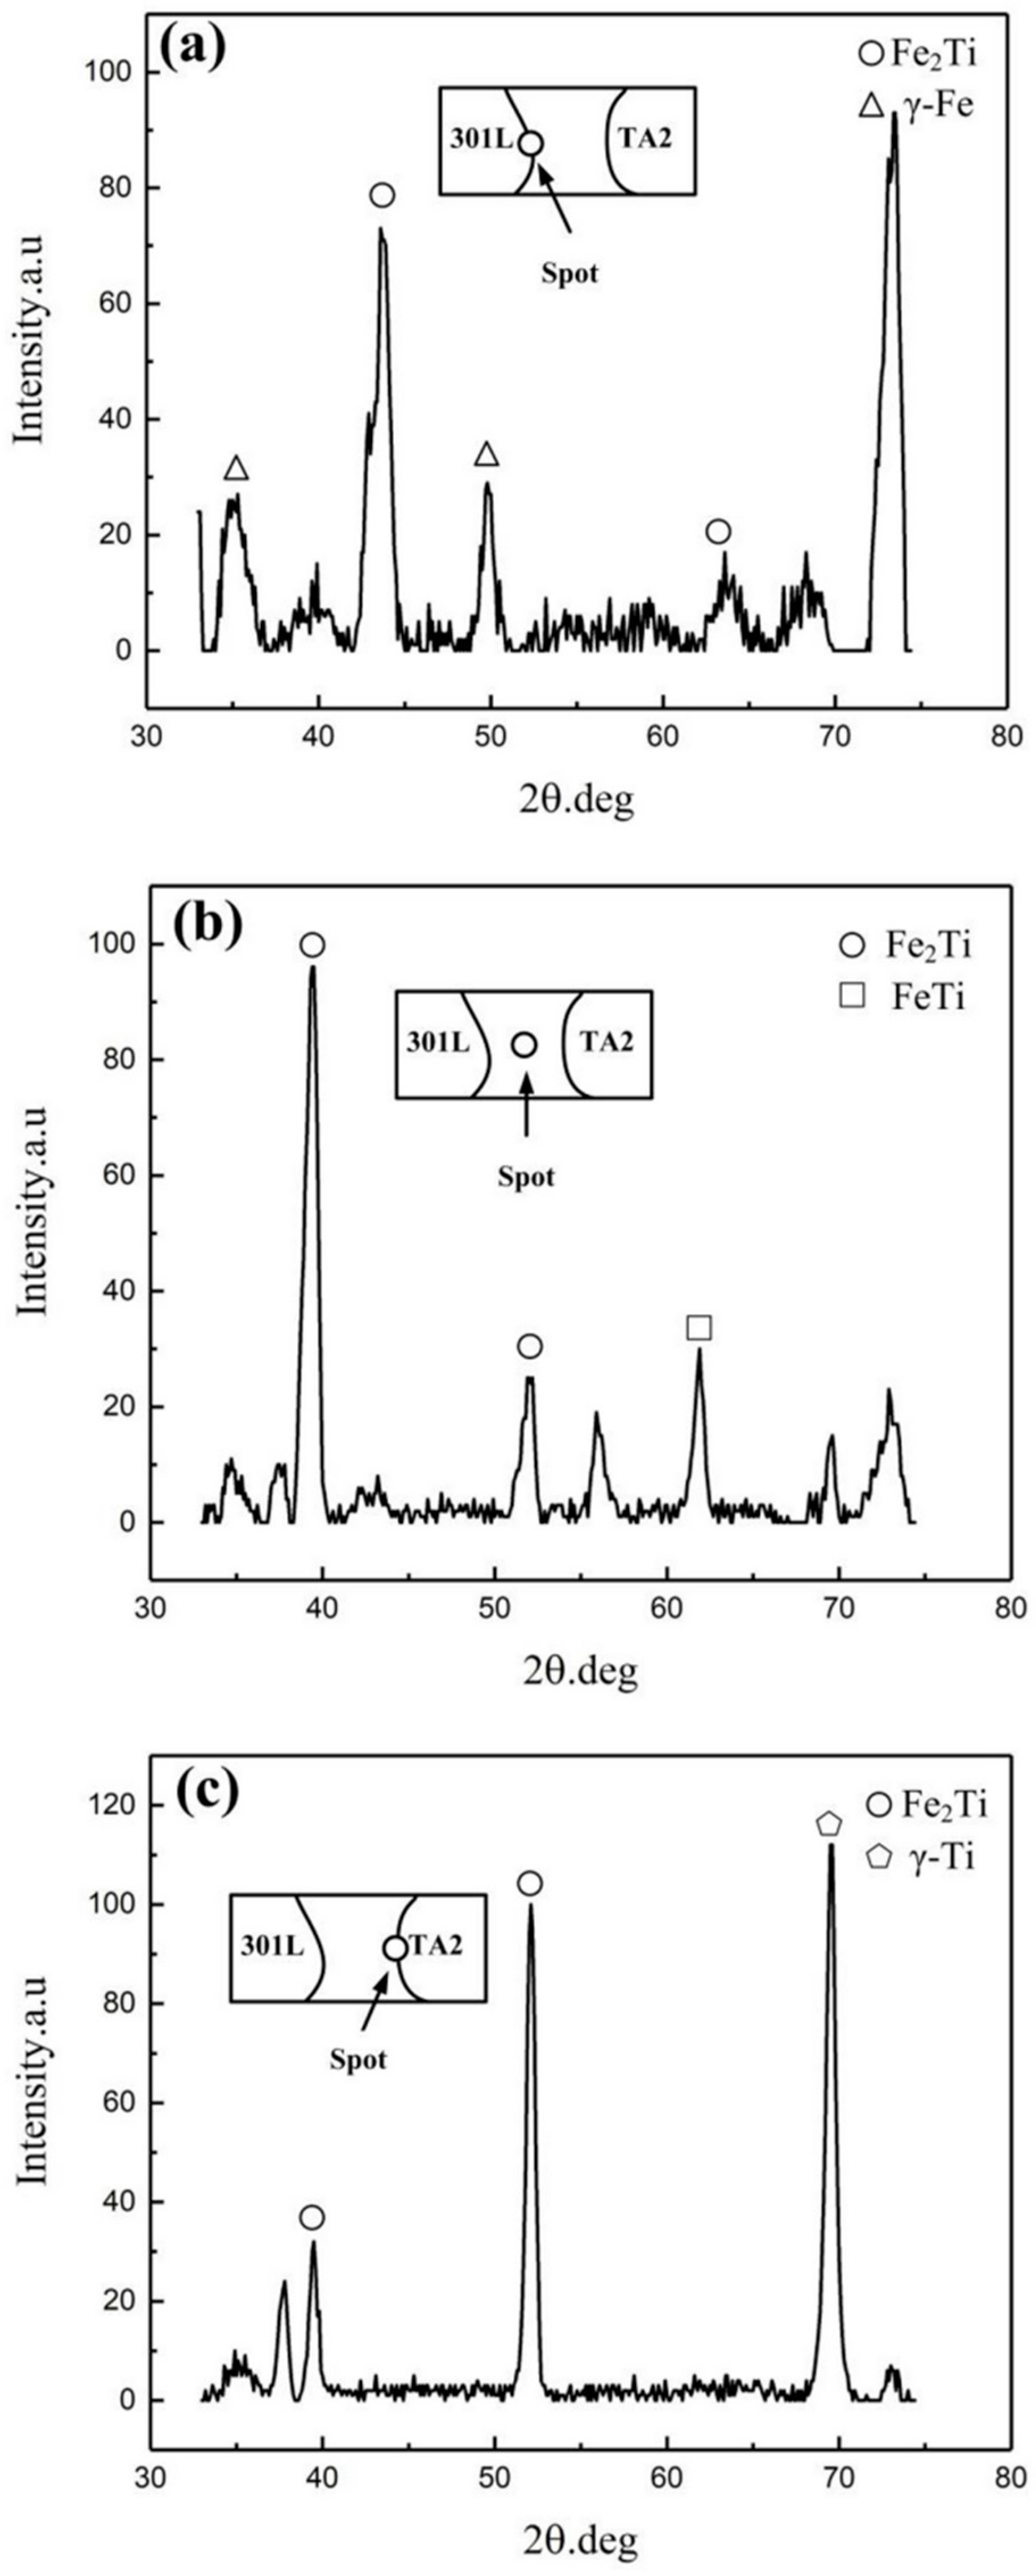
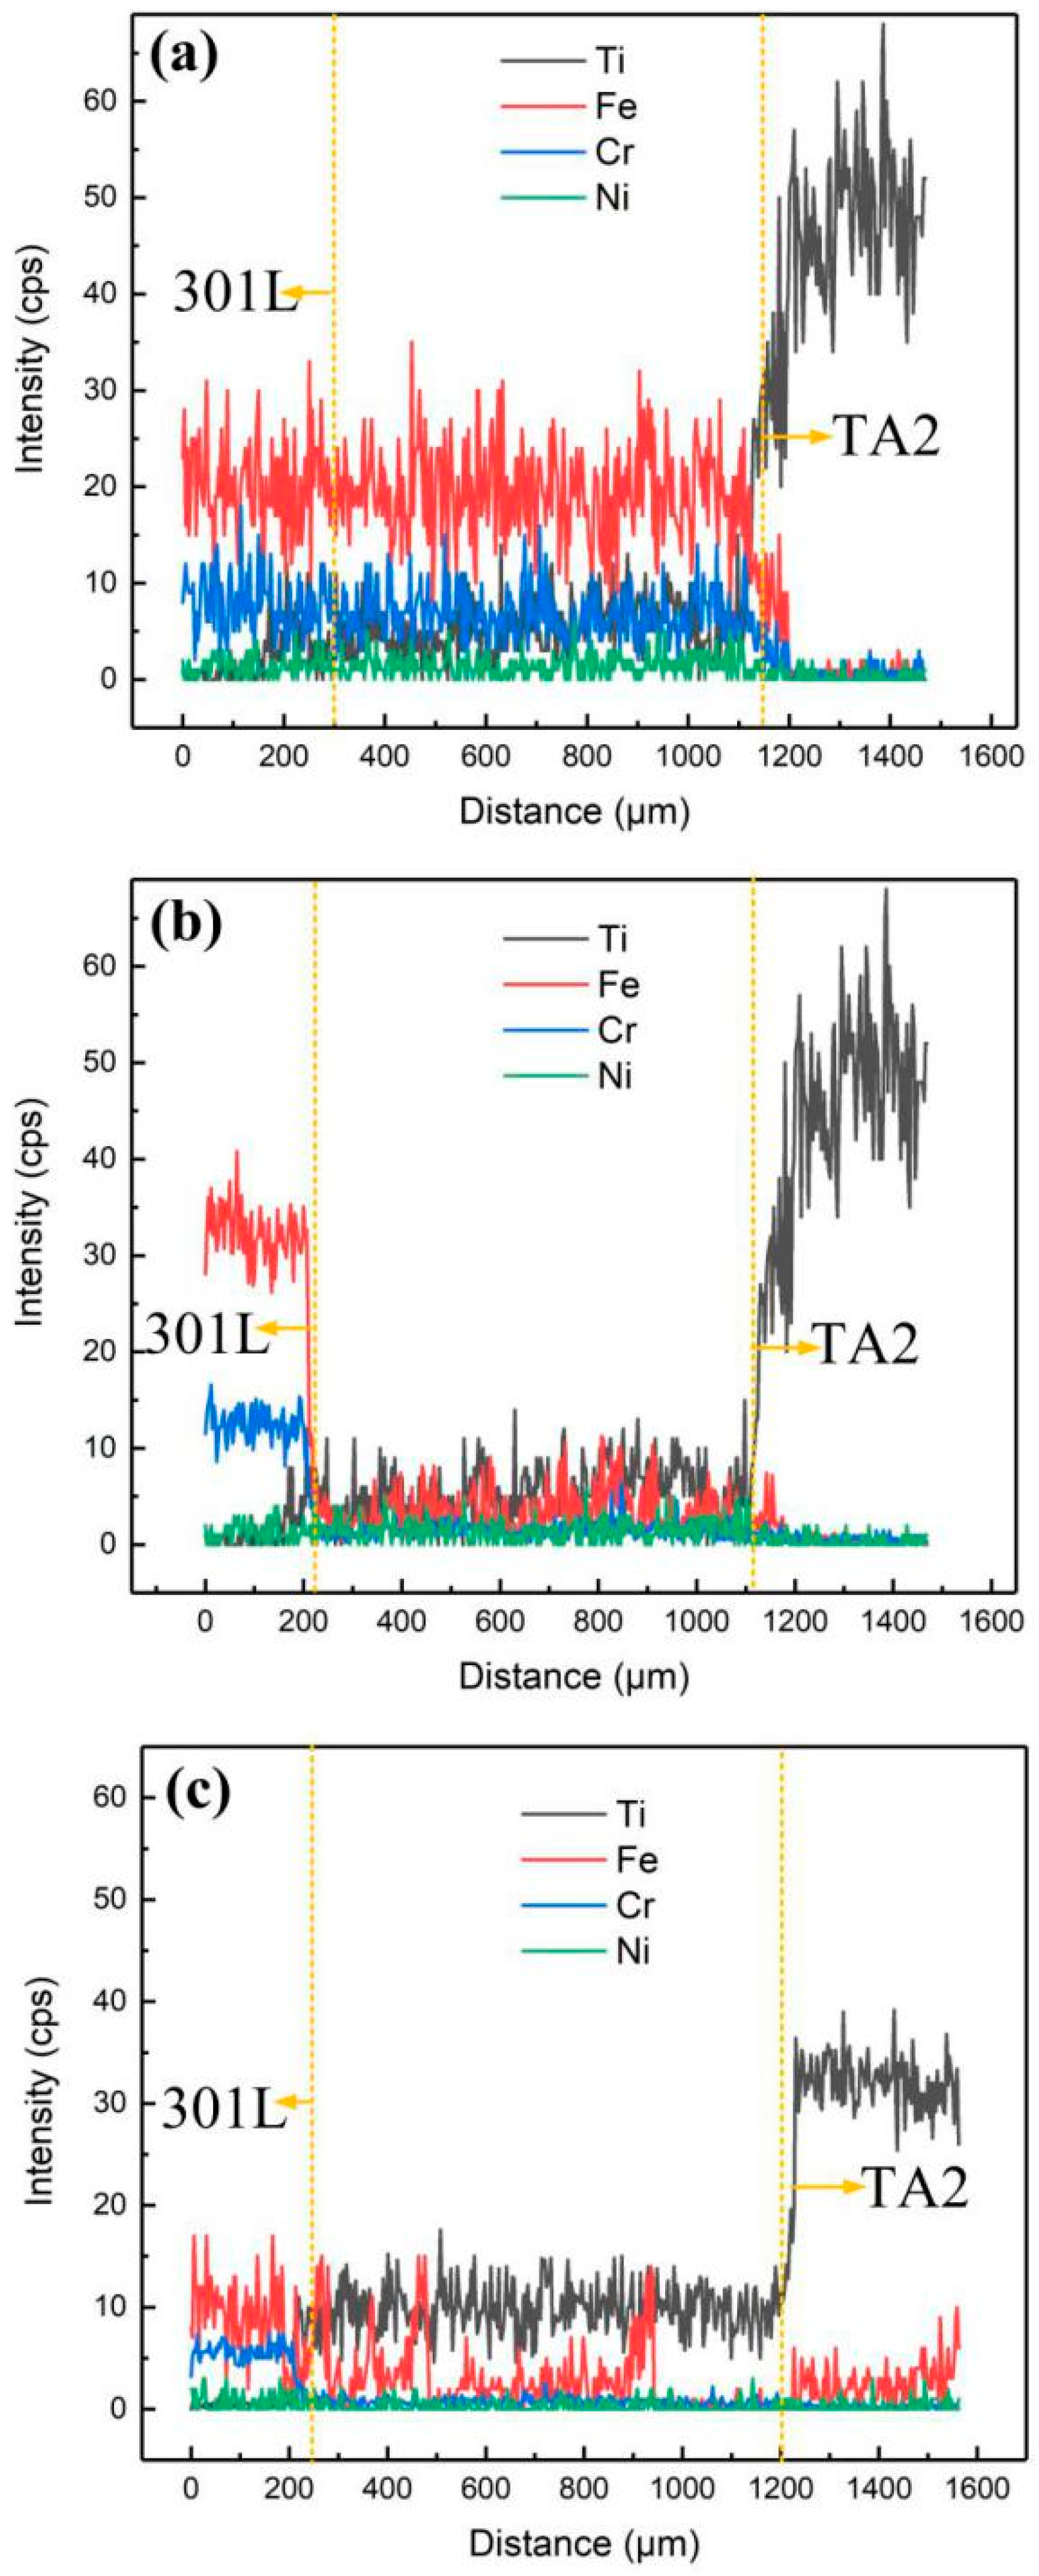
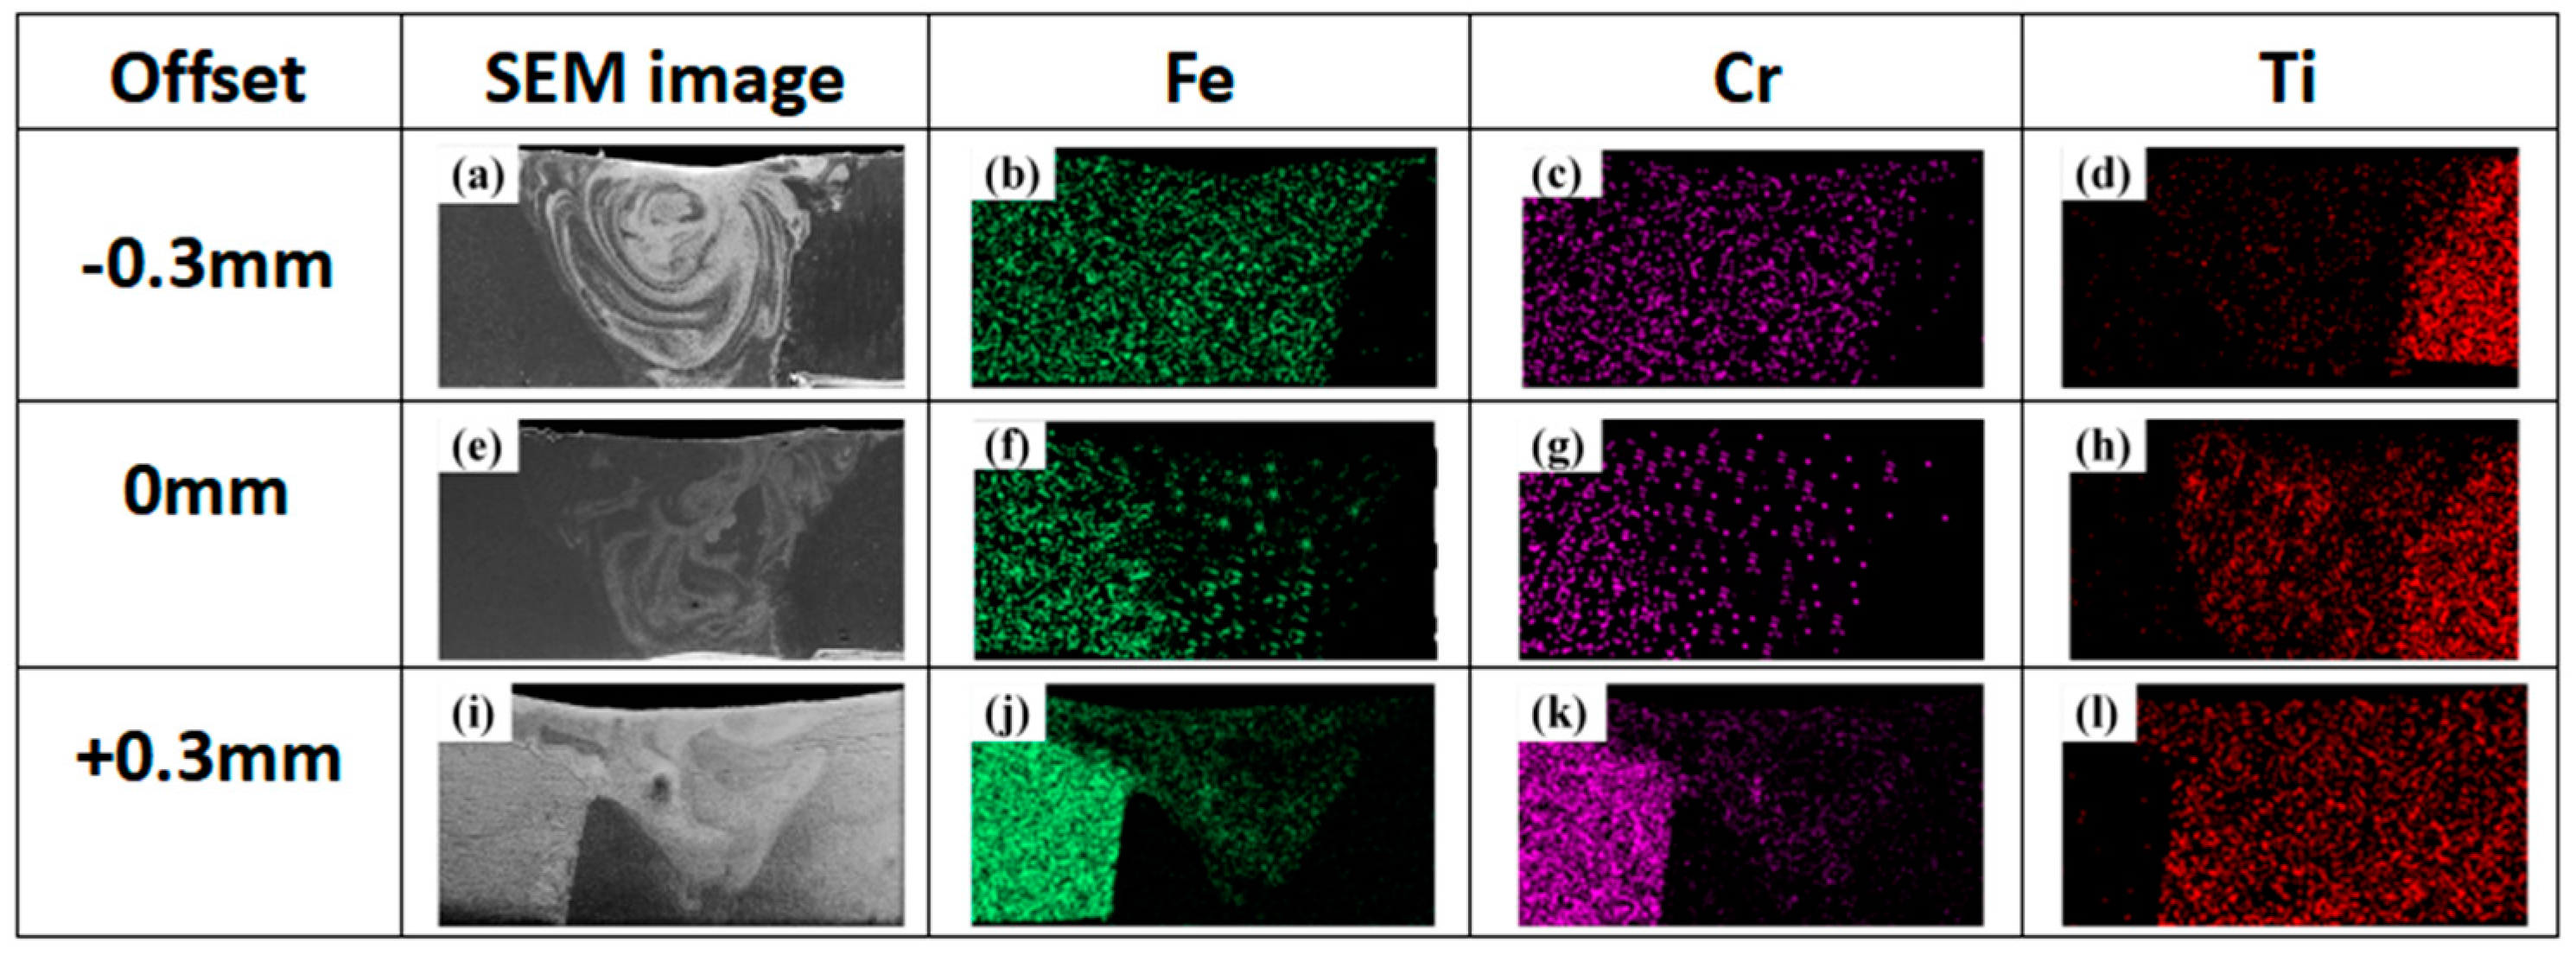
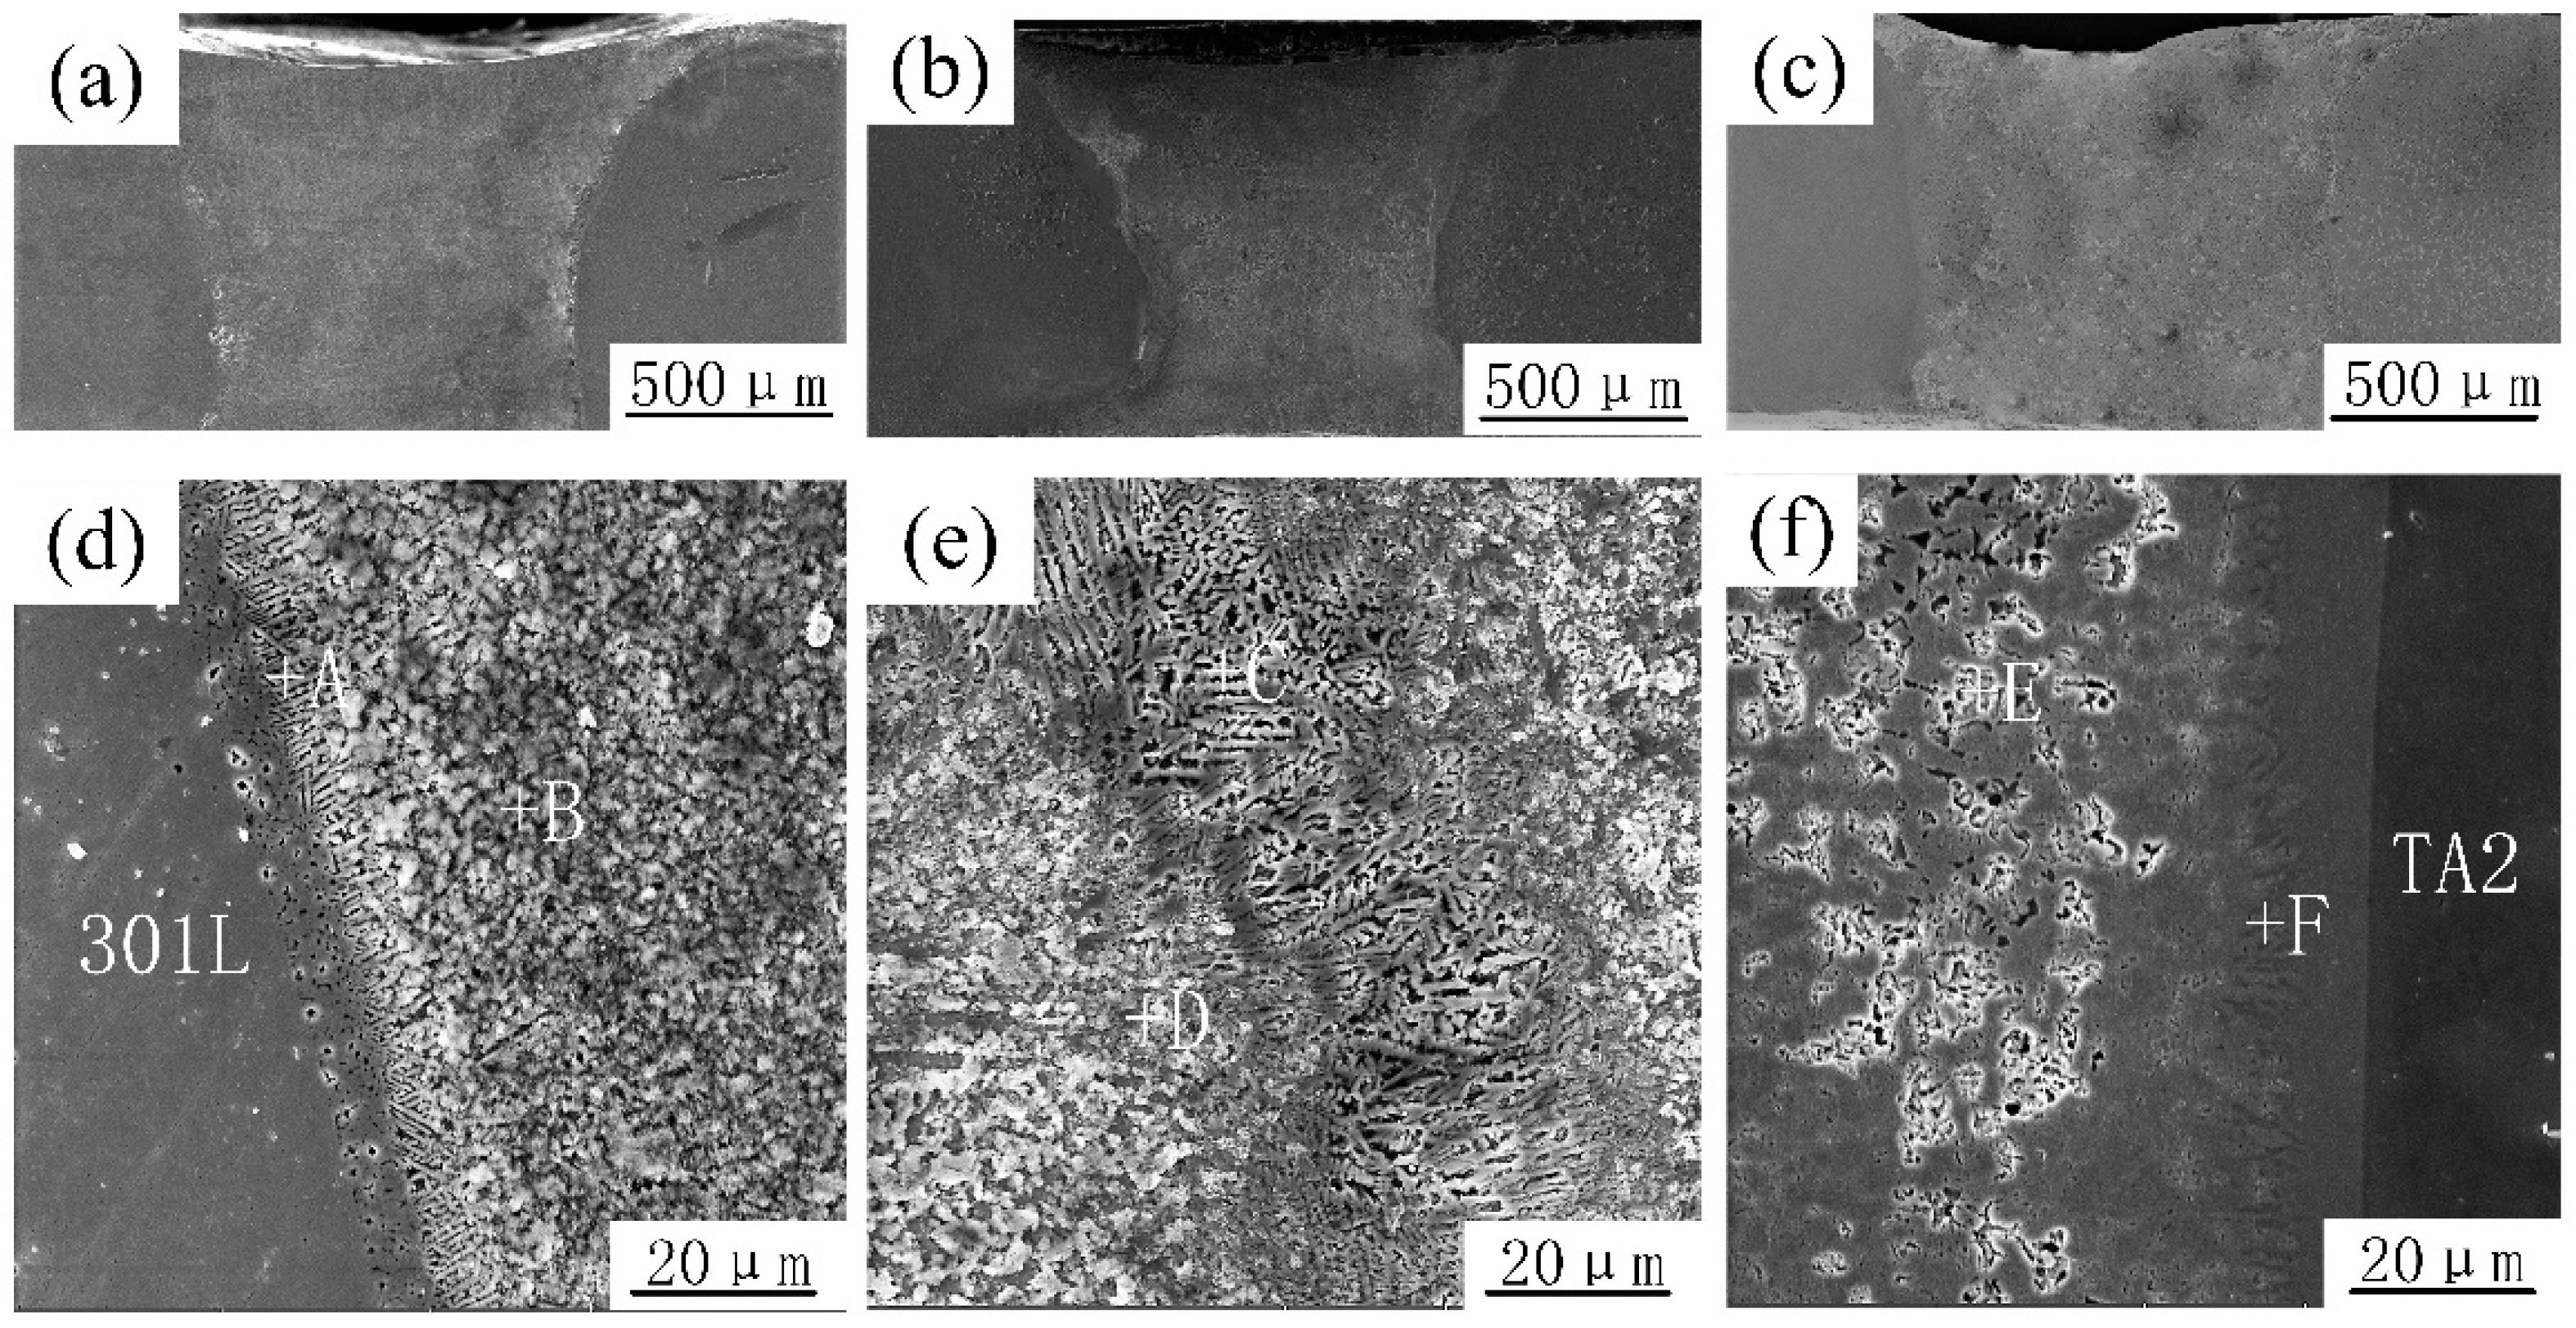
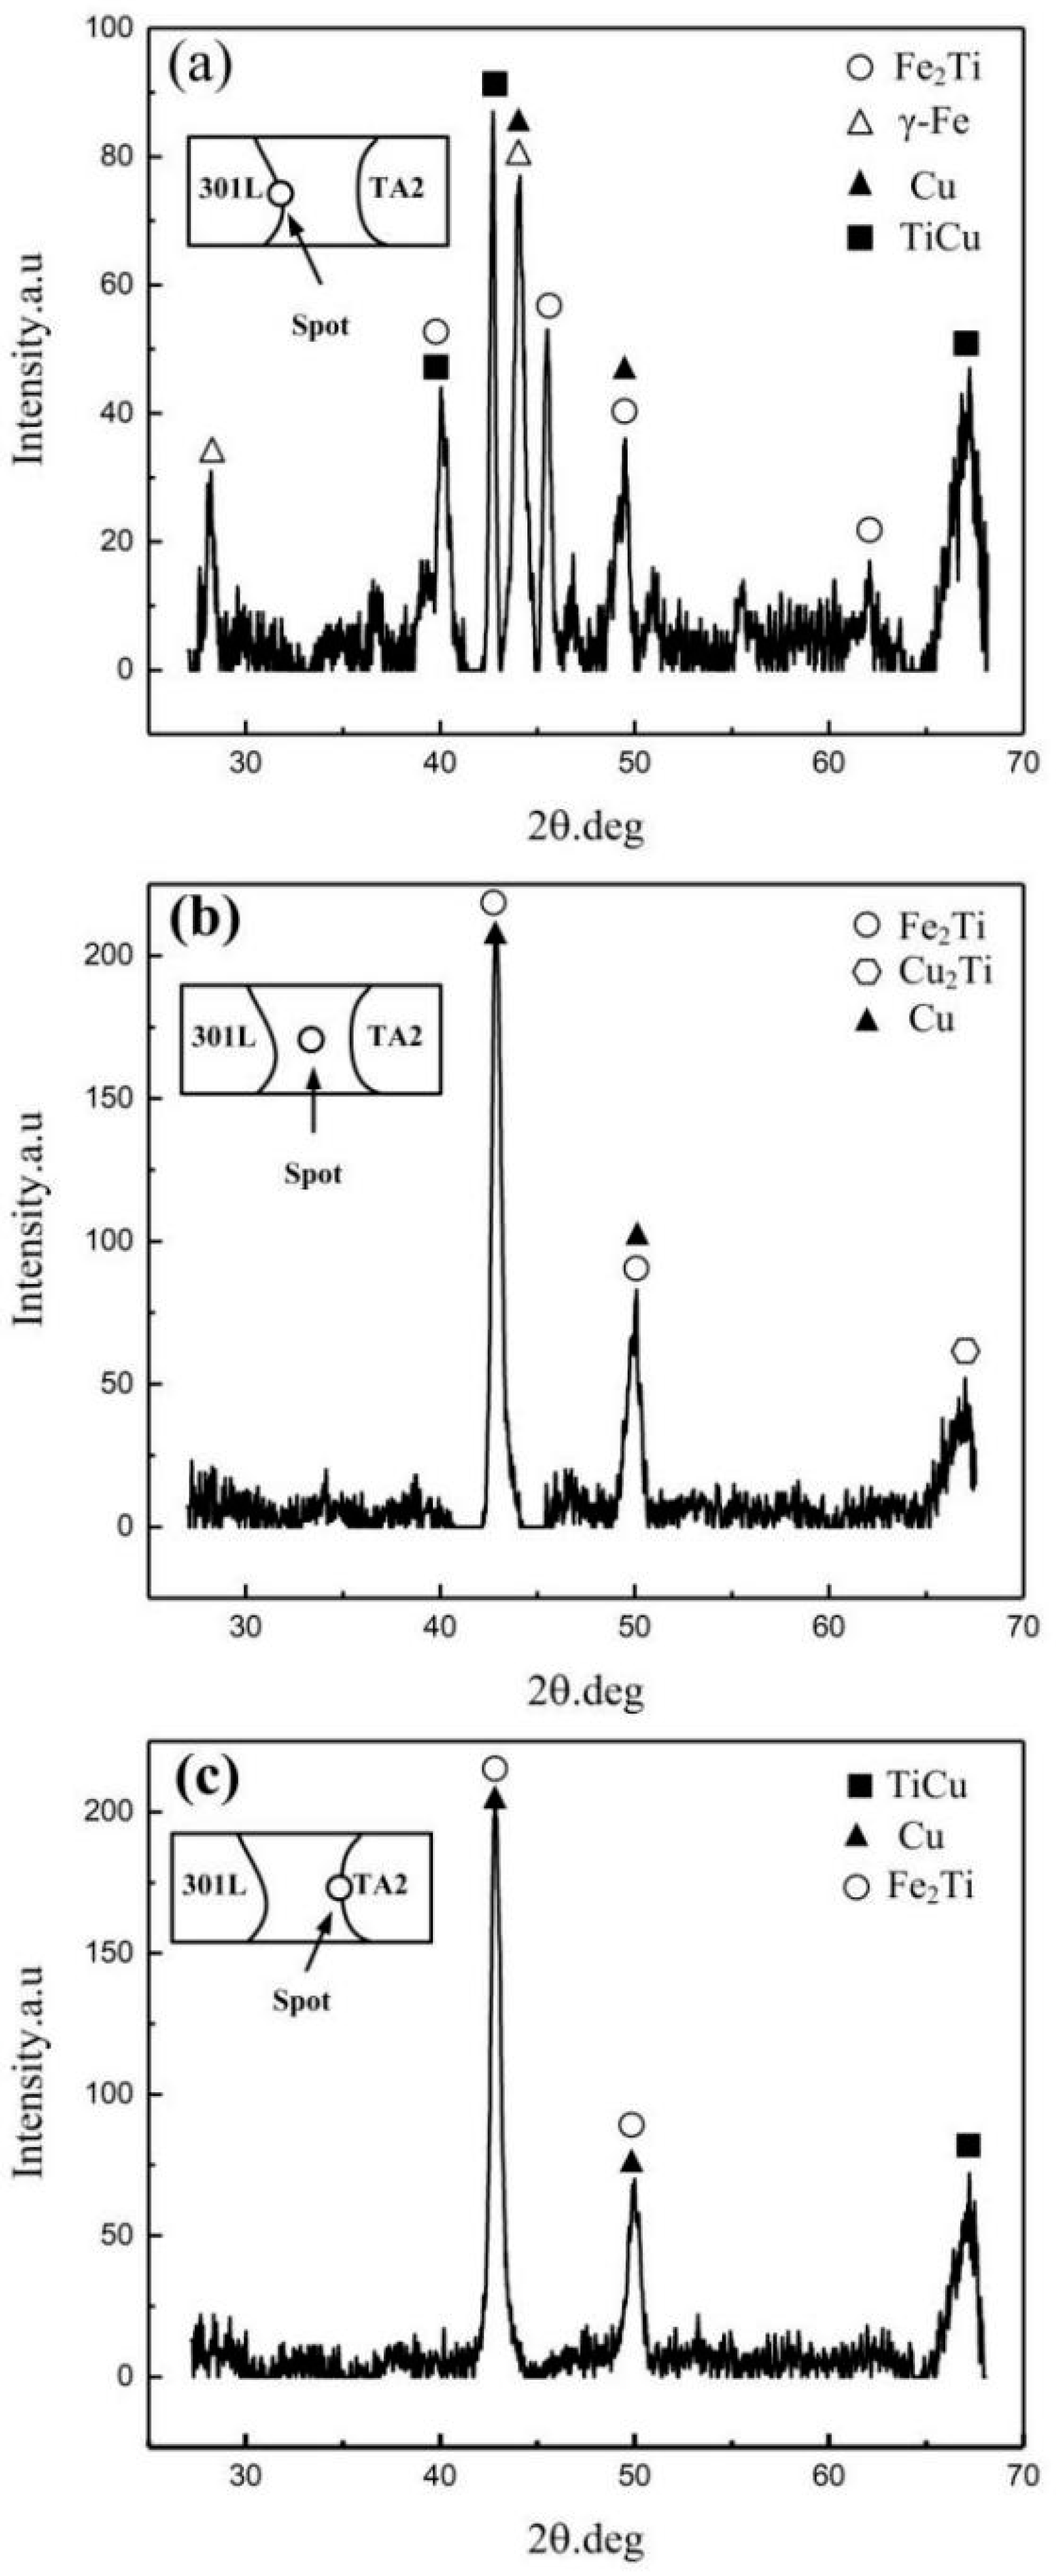
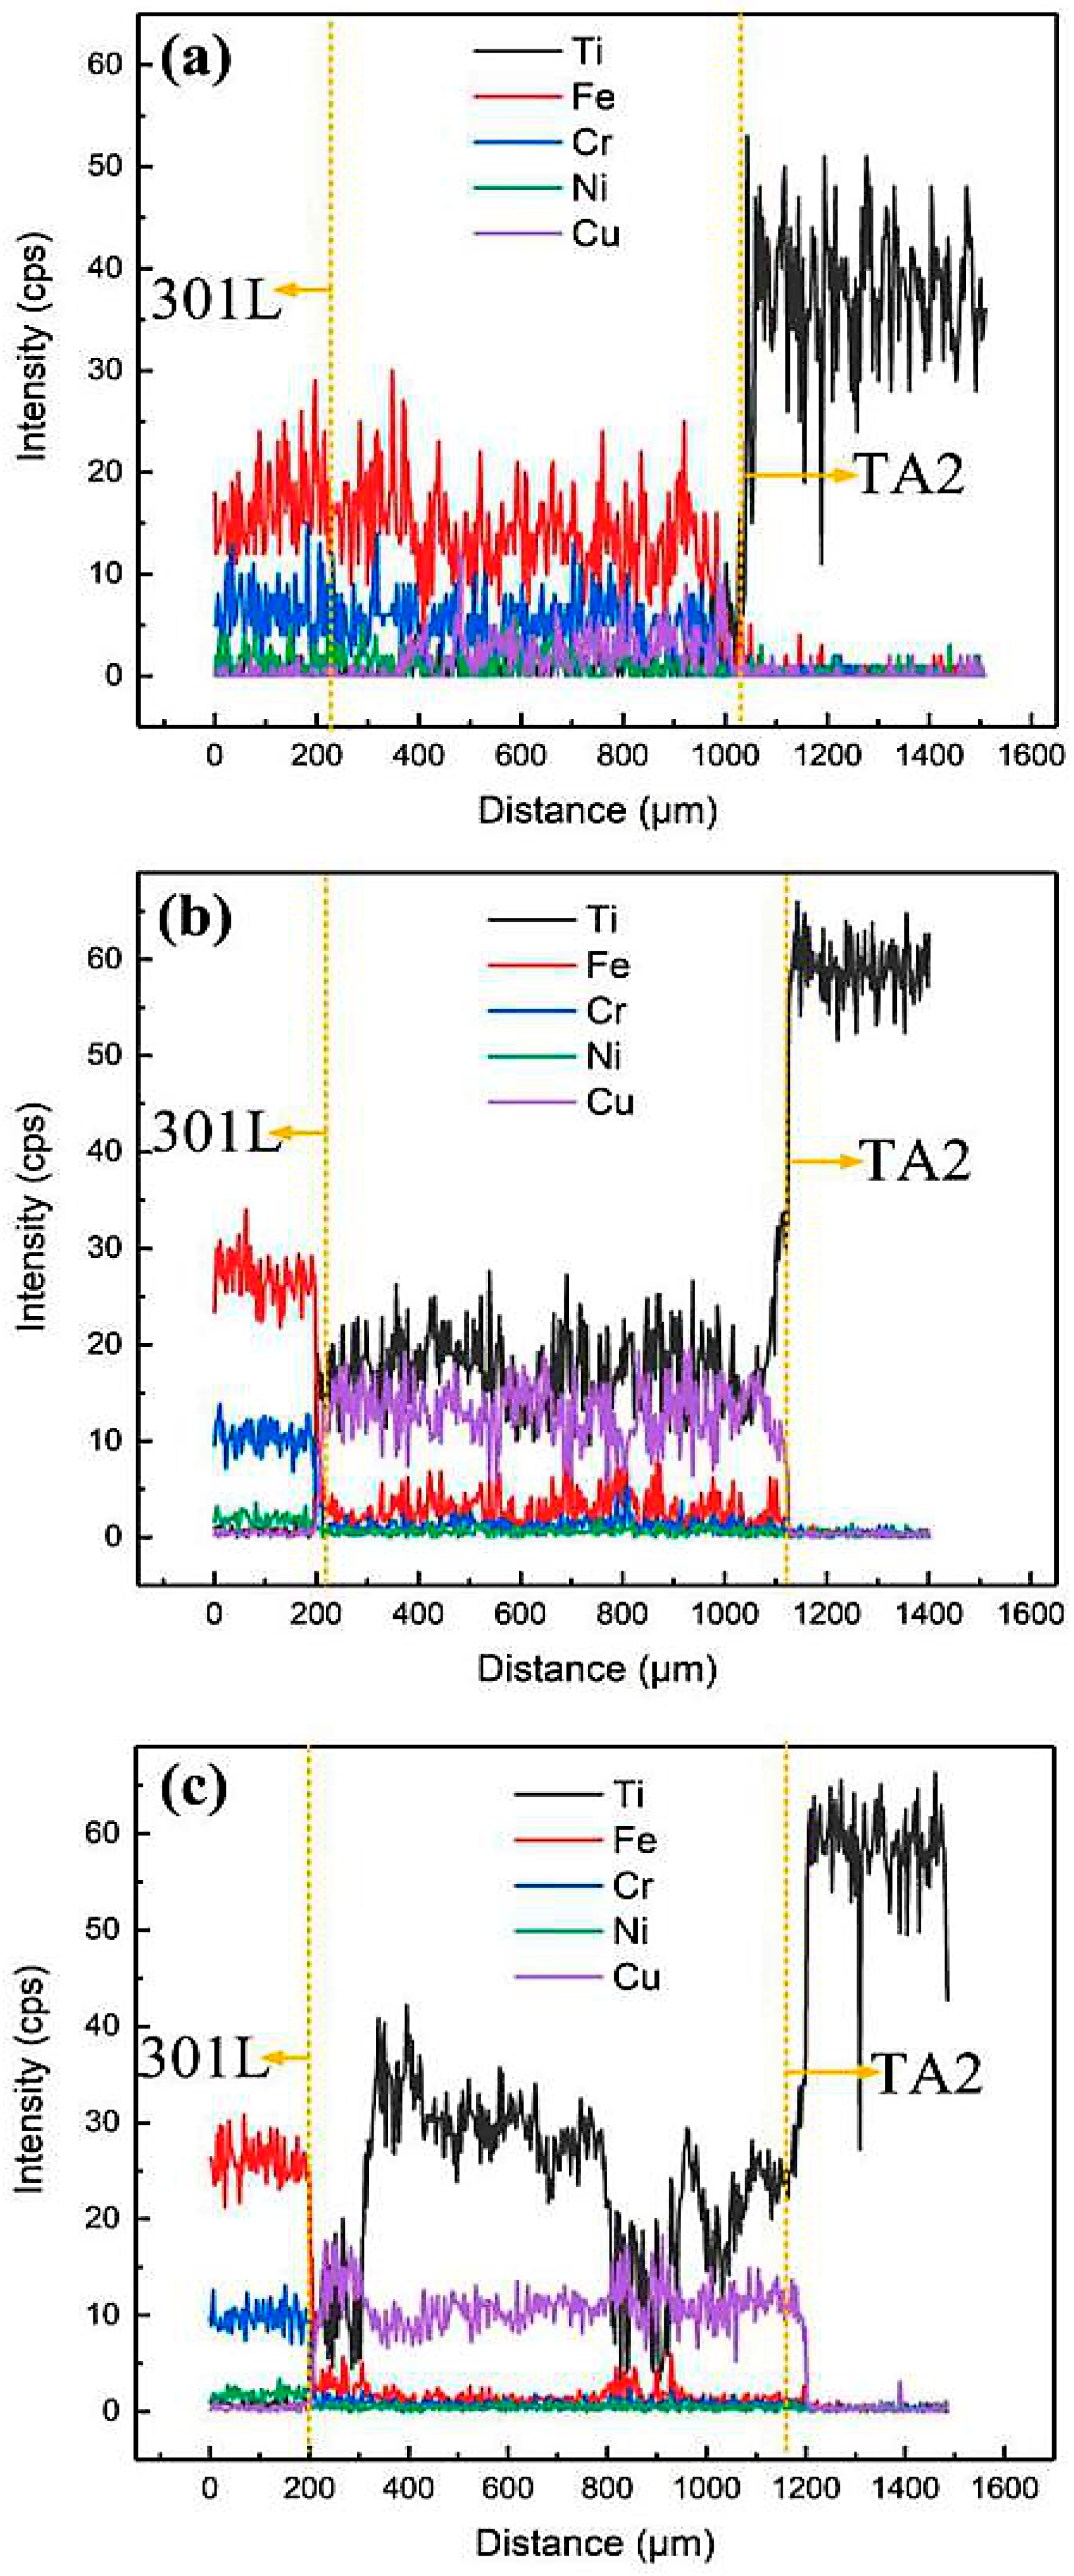
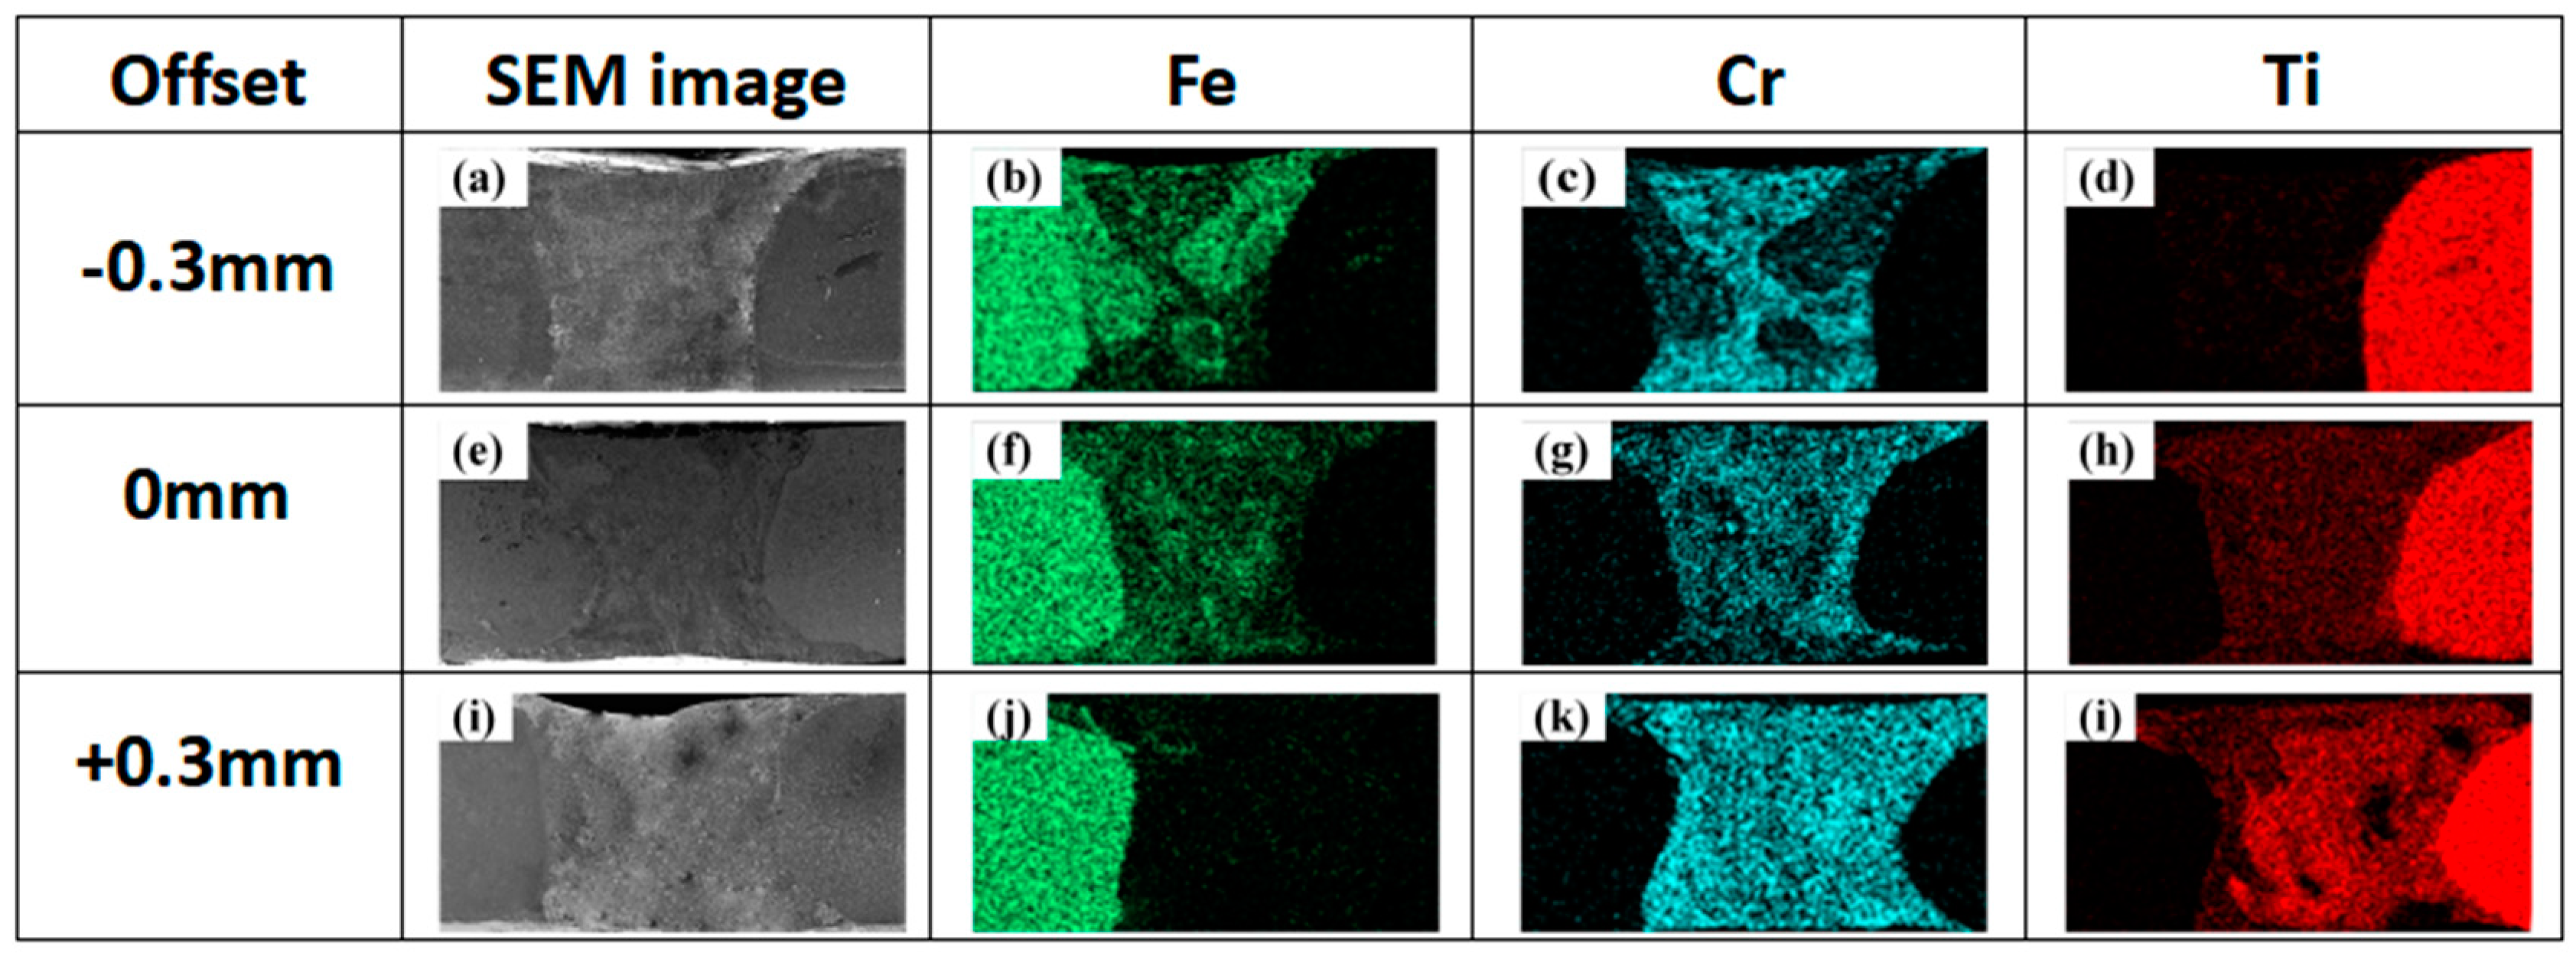
3.1.2. Microstructures and Elements Distribution

The cross-sectional morphologies of 301L/TA2 welded joints are shown in Figure 3. As displayed in Figure 3a,b, welded joints showed full penetration when laser offsets were −0.3 mm and 0 mm because stainless steel has low heat capacity and a high thermal conductivity as compared with TA2 (Table 3). However, welded joint with offset of +0.3 mm showed lack of penetration (Figure 3c). 301L and TA2 form a welded joint through two ways of fusion welding at the top and diffusion bonding at the bottom (red box in Figure 3c). Figure 3d–f show the microstructures of welded joint on 301L side, welding center and TA2 side, respectively. Figure 3d mainly contained gray region A and white region B. According to the results of Energy Disperse Spectroscopy (EDS) analysis (Table 4), the main element in region A was Fe with a content of approximately 72.18%, and the gray region A was γ-Fe. The Micro-XRD analysis results further confirmed that γ-Fe existed on 301L side (see Figure 4a below). Based on the analysis of EDS and XRD, region B was mainly composed of γ-Fe + FeTi. According to Fe-Ti binary phase diagram [12], the FeTi compound was formed by eutectic reaction (L → β-Ti + FeTi). Figure 3e mainly contains the white region C. According to the results of EDS analysis, the Fe-Ti atomic ratio in the region C was close to the stoichiometric ratio of Fe2Ti. Based on the Fe-Ti binary phase diagram, the Fe2Ti compound was formed by the eutectic reaction (L → α-Fe+ Fe2Ti). Micro-XRD analysis also confirmed the existence of Fe2Ti (Figure 4b). As shown in Figure 3f, region D was close to base metal TA2 and mainly contained Ti. Region D was identified as β-Ti based on the results of Micro-XRD analysis (Figure 4c) and EDS analysis (Table 4). Figure 3g shows the enlarged view of red box region in Figure 3c. A thin diffusion layer was observed in Figure 3h,i, indicating that diffusion of Fe in TA2 and existence of Ti in 301L stainless steel. Figure 3j shows the line scanning results of Path 4, the transition of elements is characterized by diffusion welding and the curve overlap at the interface does not exist, which is different from the line scanning results of Path 3 (see Figure 5c), indicating that no intermetallic compounds were formed. In addition, Figure 5a,b also present curve overlap phenomenon. The above results indicate that 301L/TA2 welded joint contains two connection types that is fusion welding at the top and diffusion bonding at the bottom (red box in Figure 3c), which was conducive to enhance tensile strength of 301L/TA2 welded joint [18].
From Figure 5, it is clear that a large fluctuation exists in the Fe and Ti distribution curves. When the offset was +0.3 mm, the peak of Fe curve corresponds with the trough of Ti curve (Figure 5c), indicating that Fe-Ti compound was formed in the welding zone. Little amount of curve overlap means that only a small amount of intermetallic compounds (Fe-Ti) were generated in the welded joints. Owing to the uneven temperature field distribution and little melting amount of 301L when the laser beam was located on TA2 side, the diffusion rate and diffusion amount of Fe element were reduced. Then a small amount of Fe-Ti compounds were generated, which was beneficial to improve the tensile strength of the welded joint.
Figure 6 shows the map scanning results of elements distribution on the cross-sections of 301L/TA2 welded joints. It is obvious that both Fe and Ti are evenly distributed. As the offset changes from −0.3 mm to +0.3 mm, the content of Fe decreases, and the content of Ti increases.

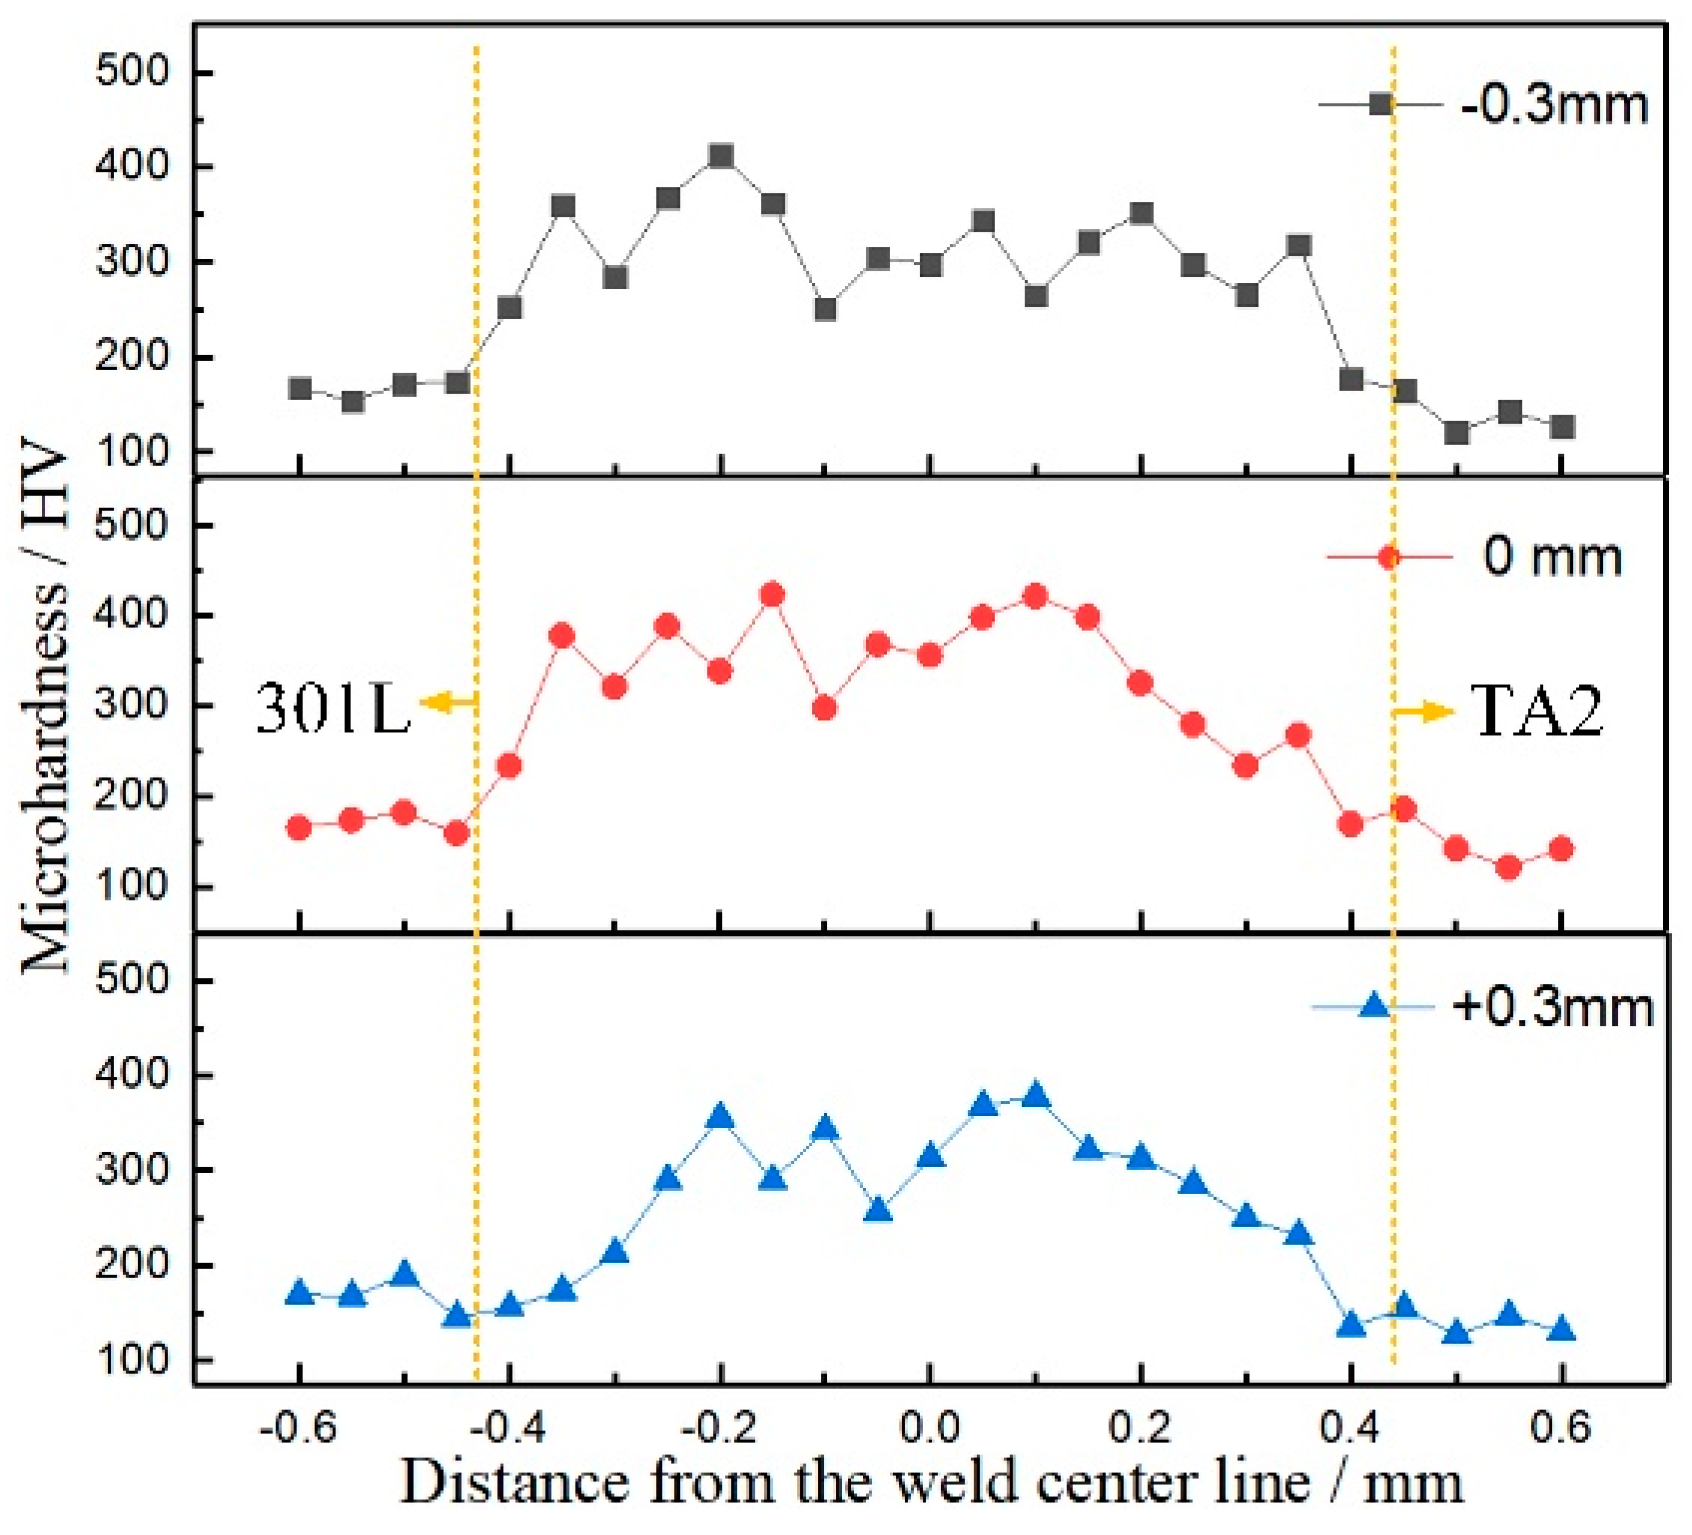
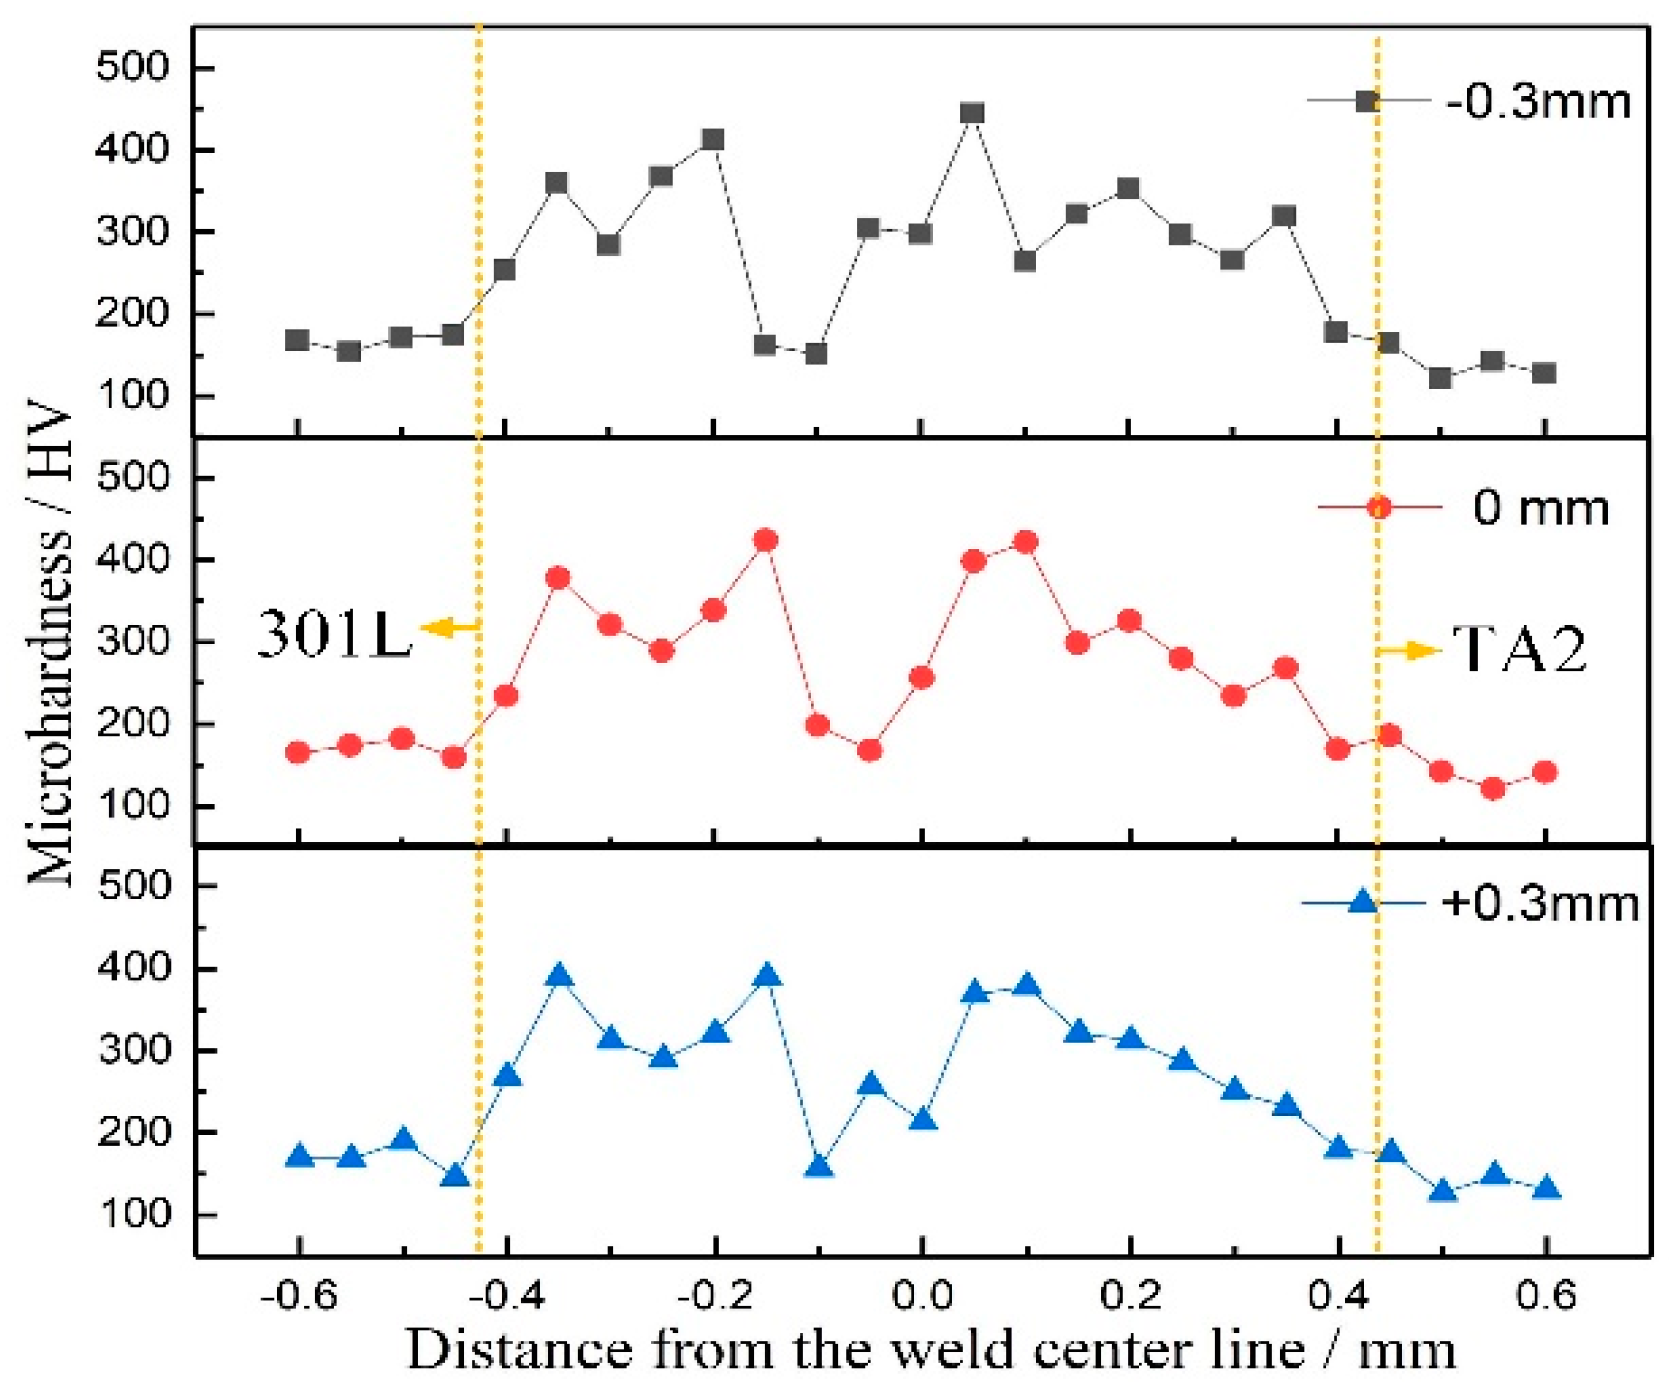
3.1.3. Microhardness

As shown in Figure 7, the hardness value of welding seam was higher than that of base metal. Because of the formation of Fe-Ti intermetallic compounds by element diffusion in the welding process, the hardness of welding seam was enhanced [19].

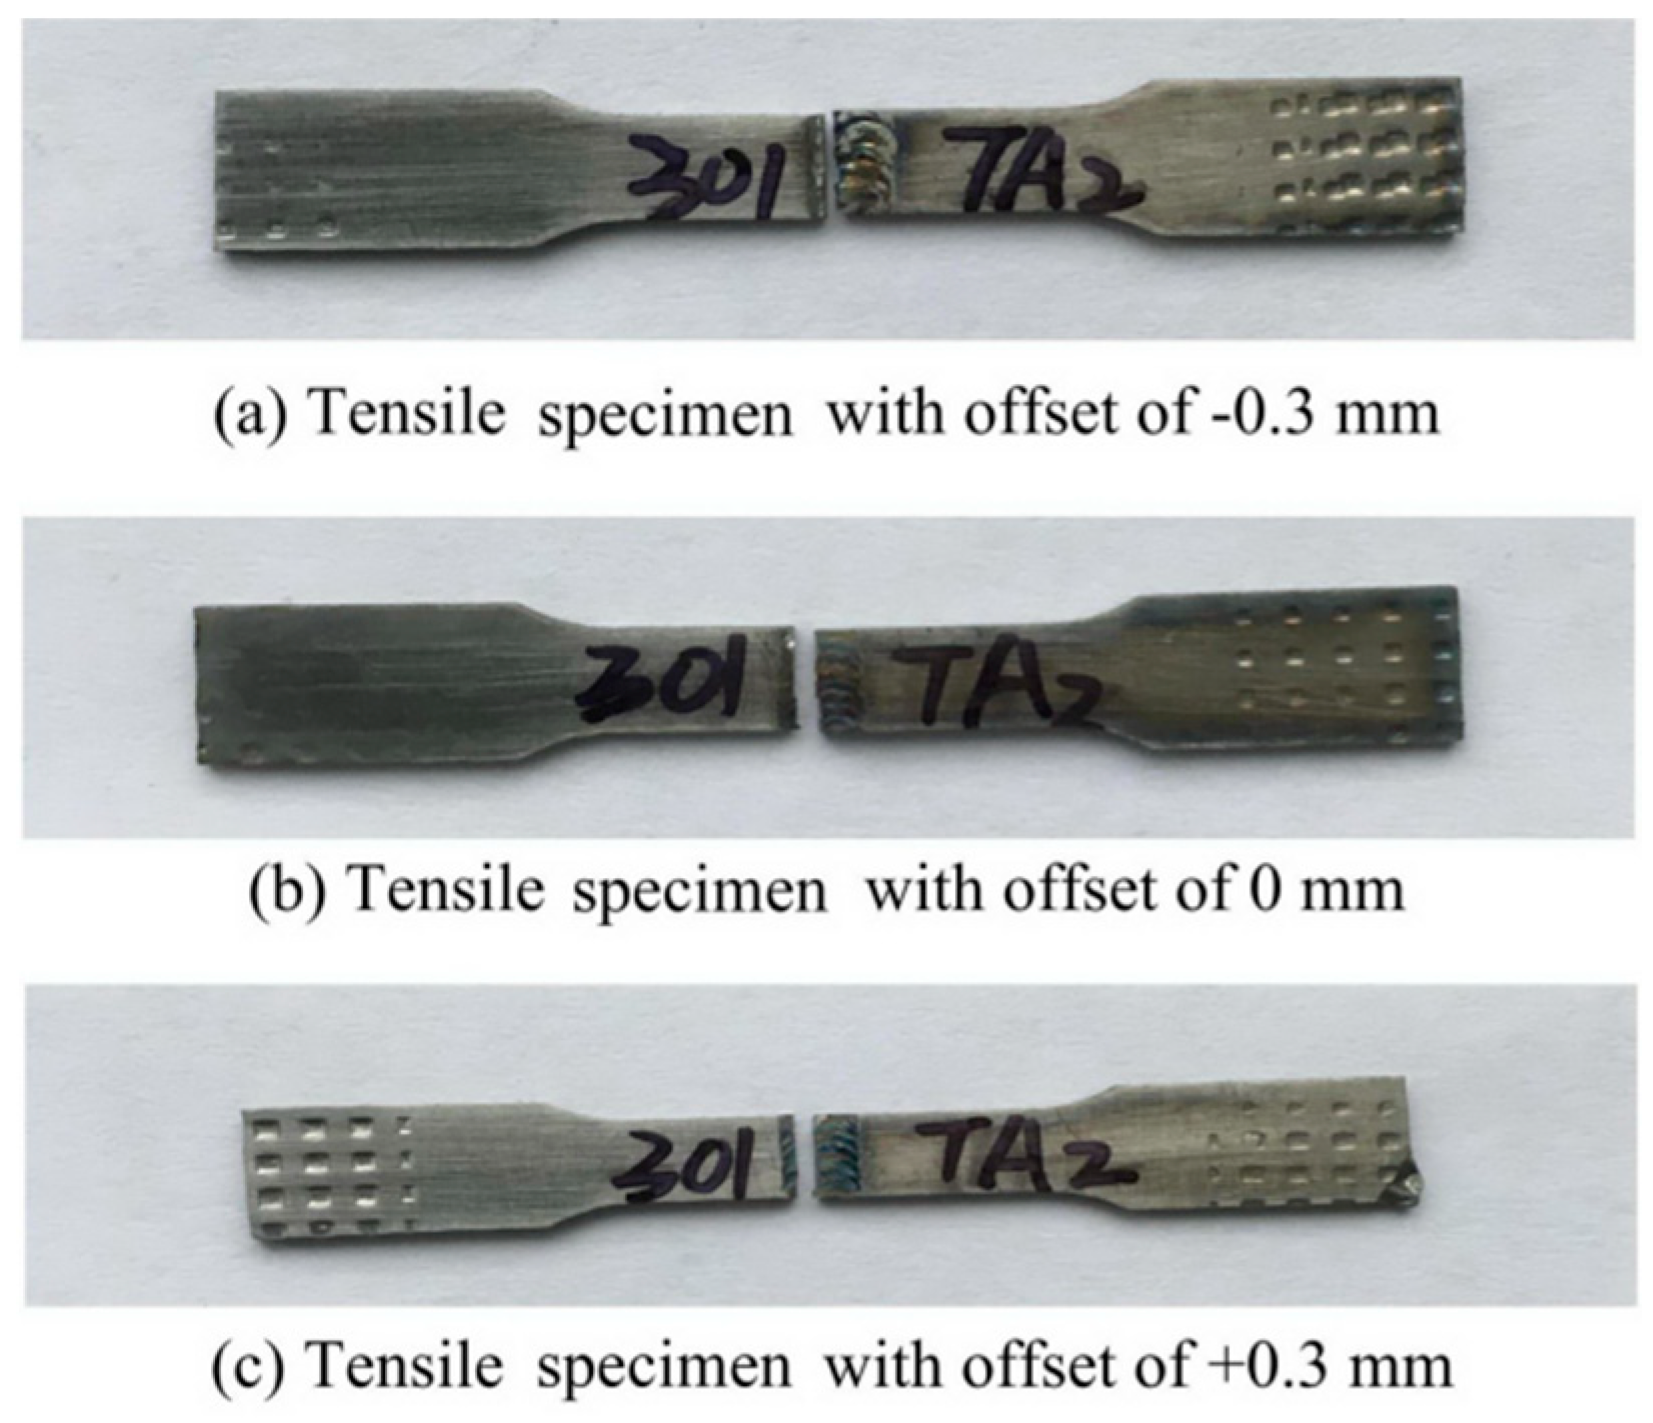
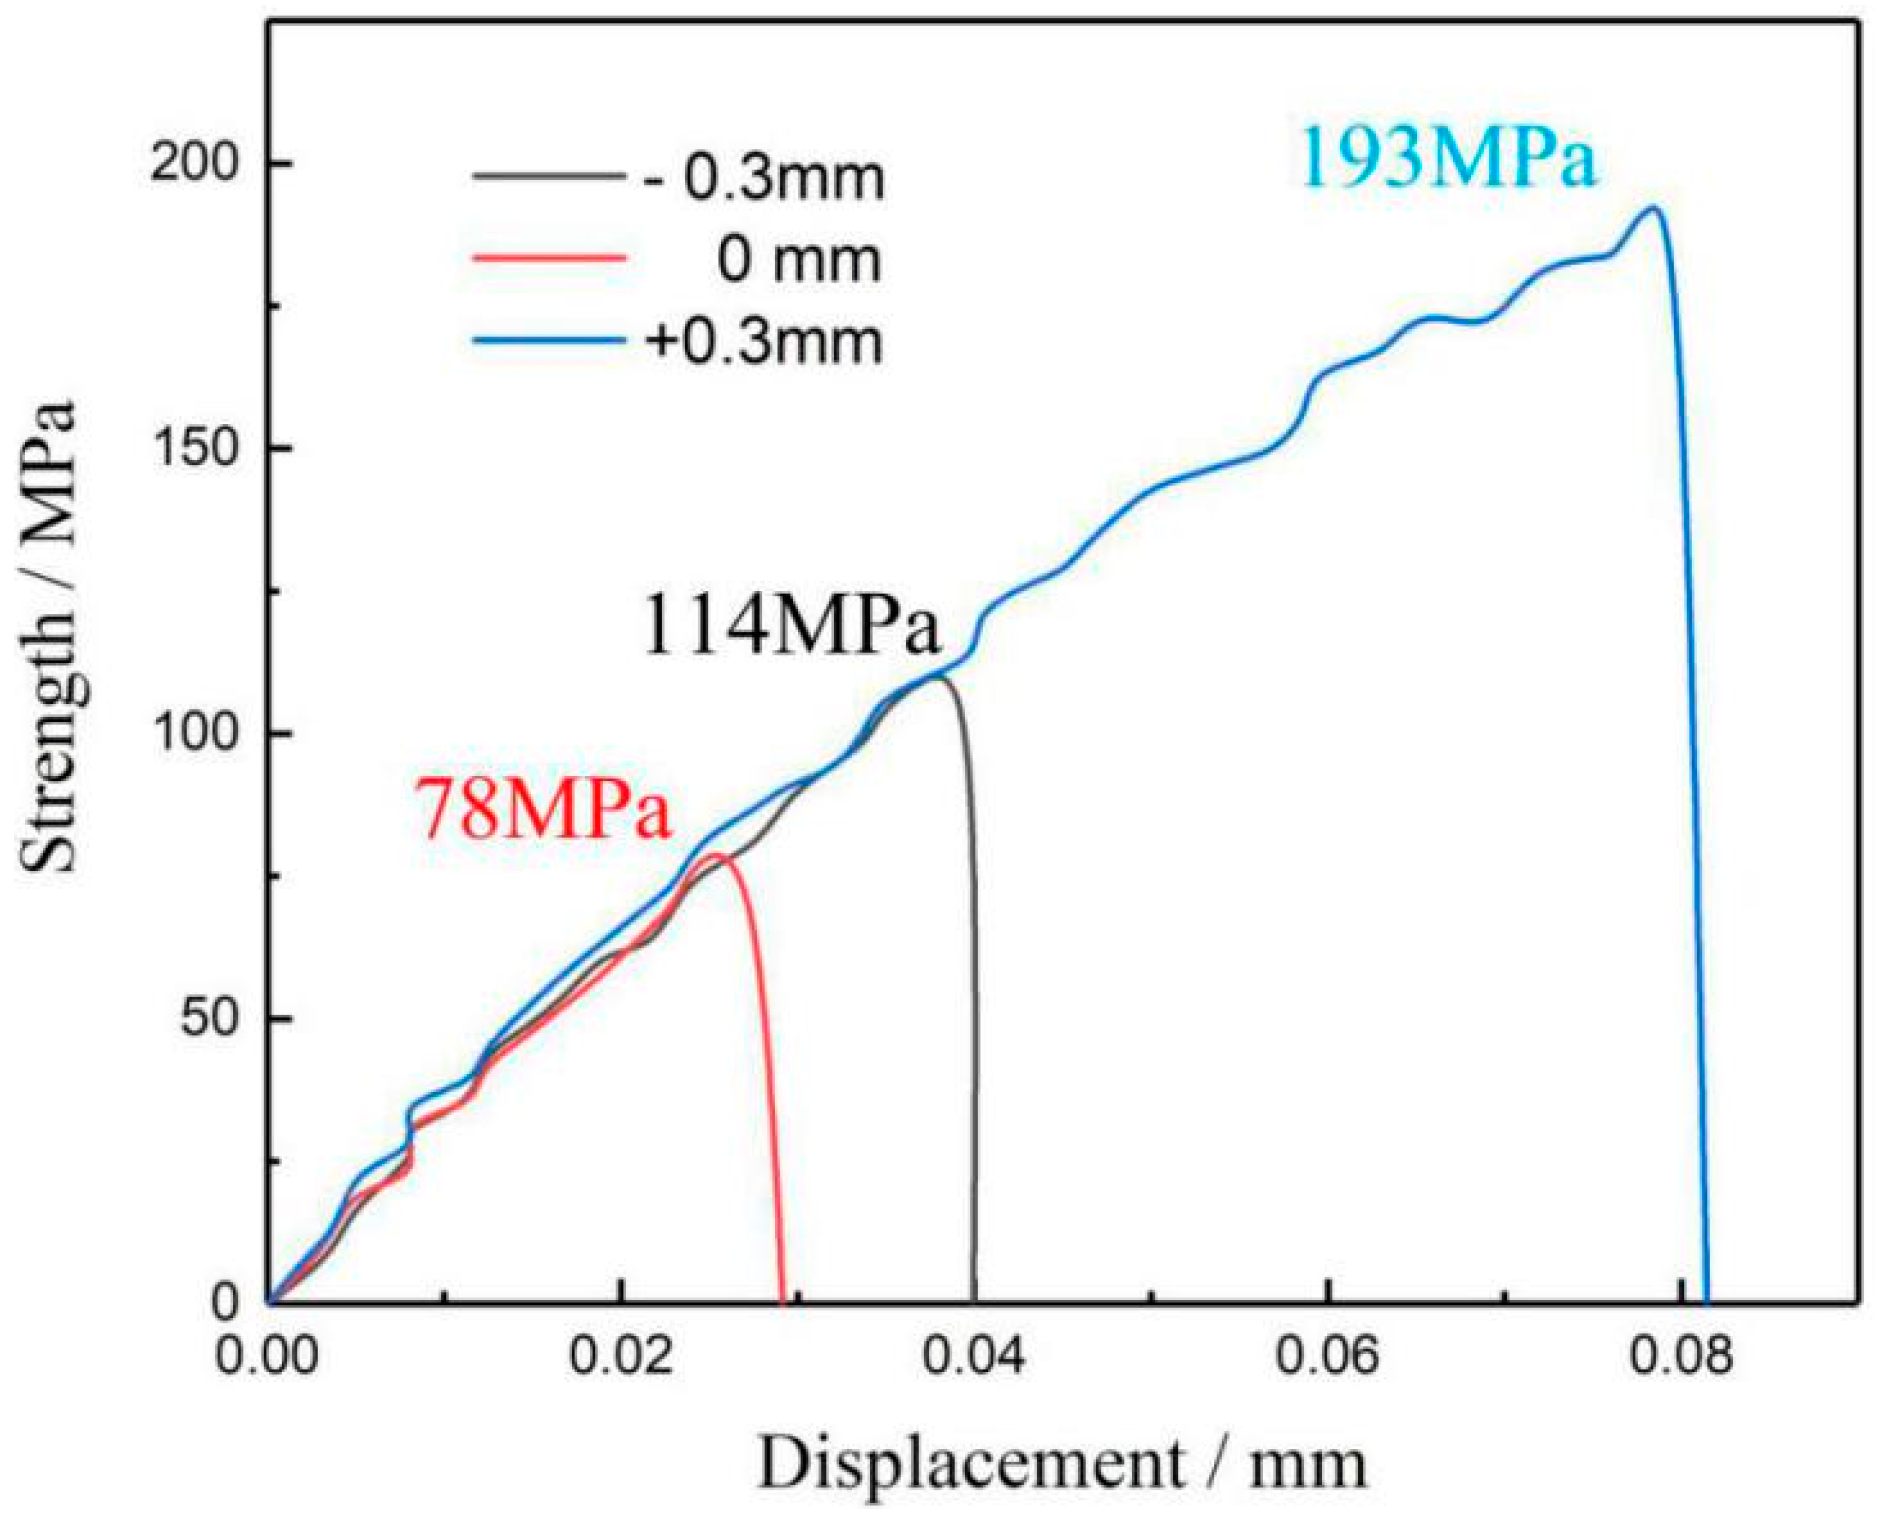
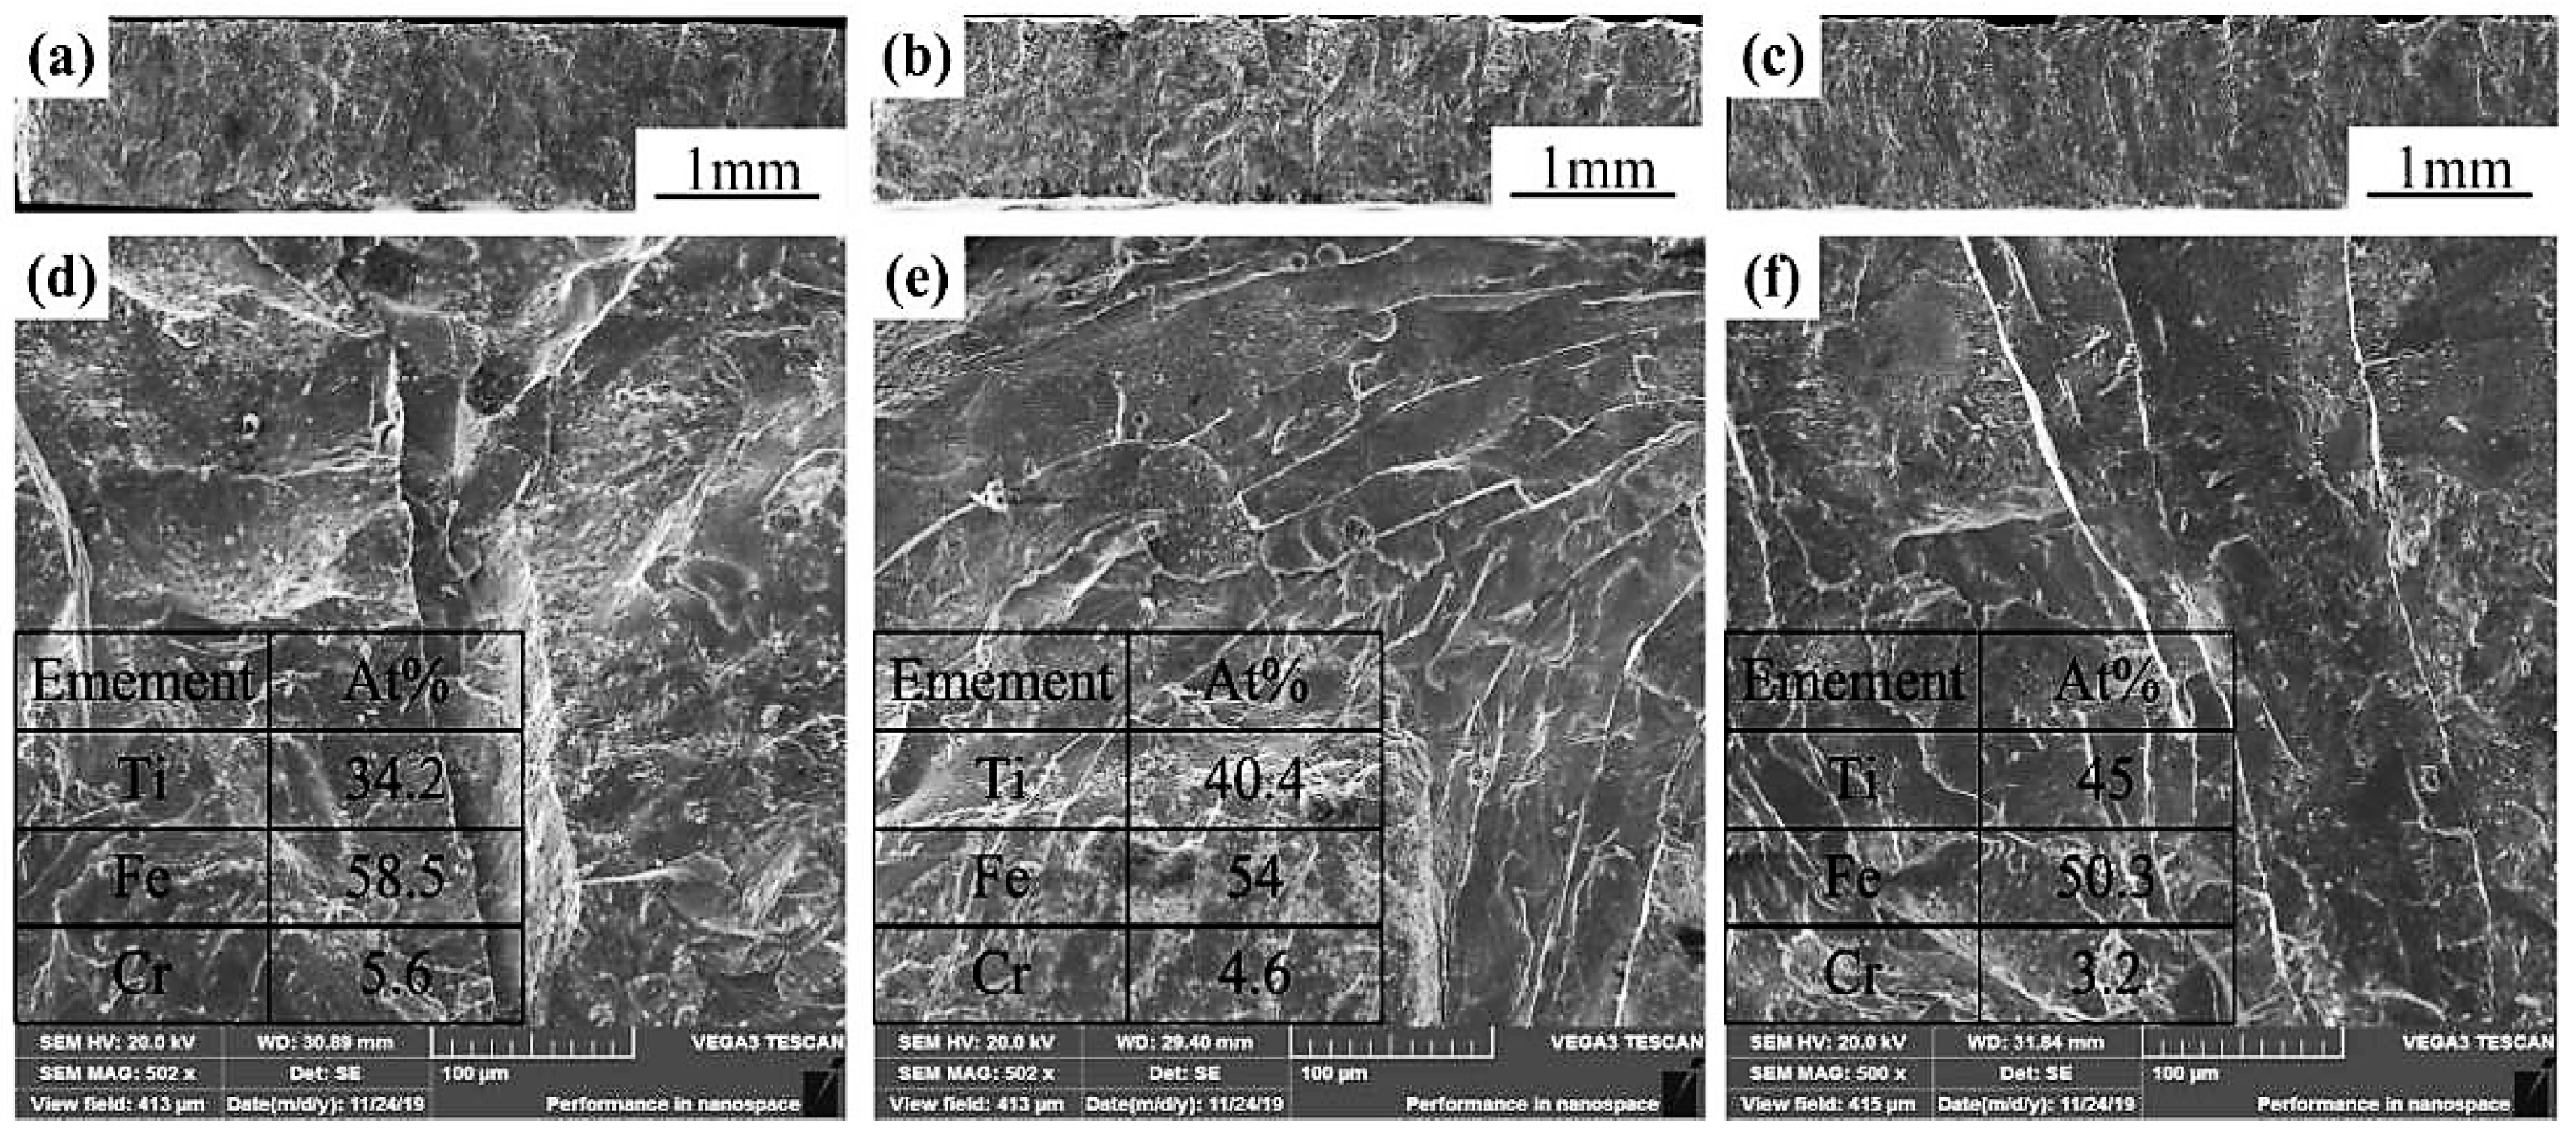
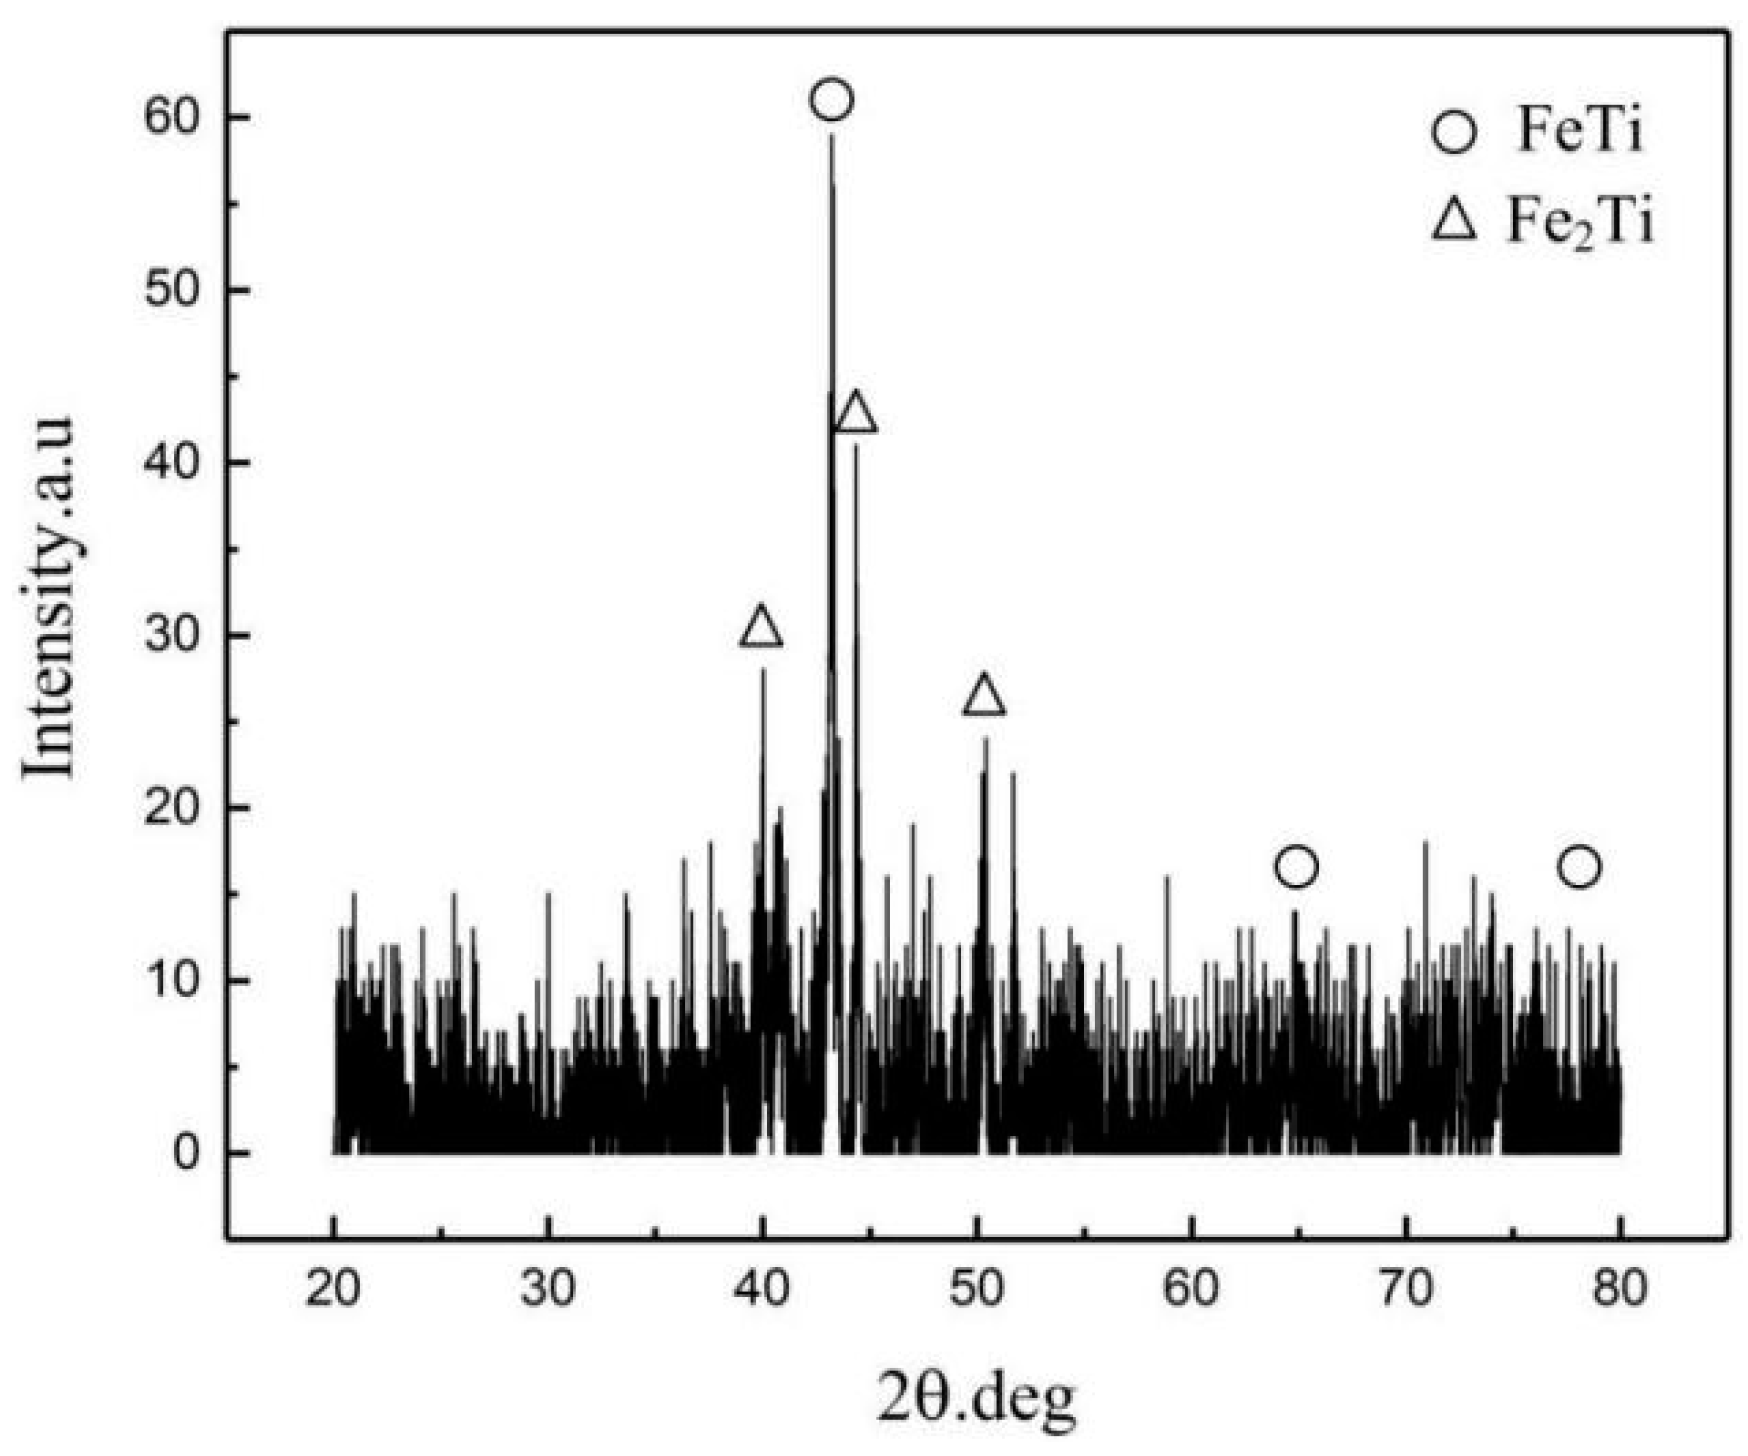
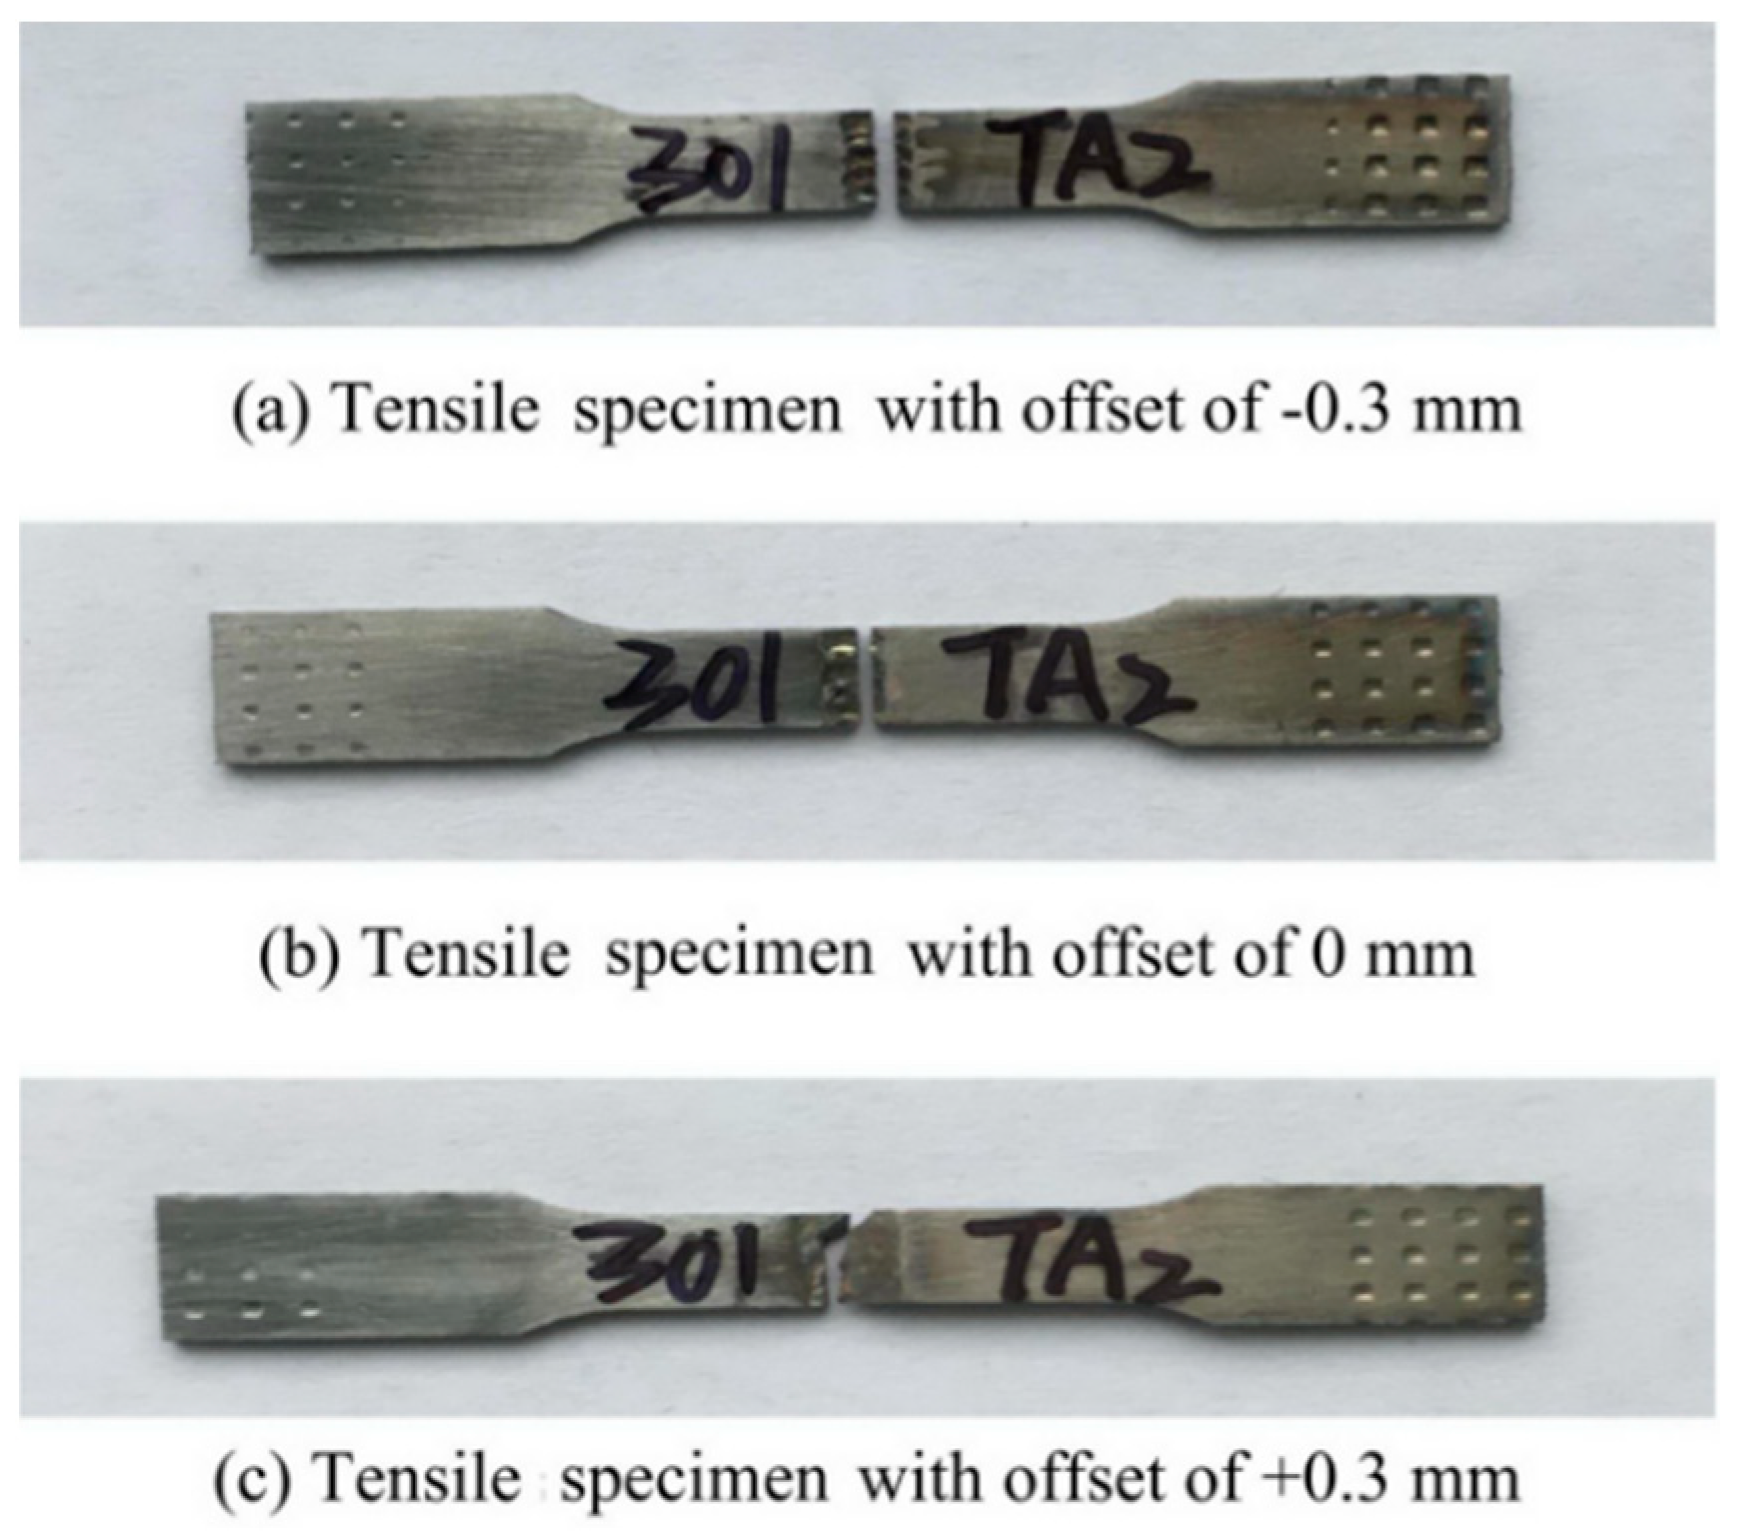
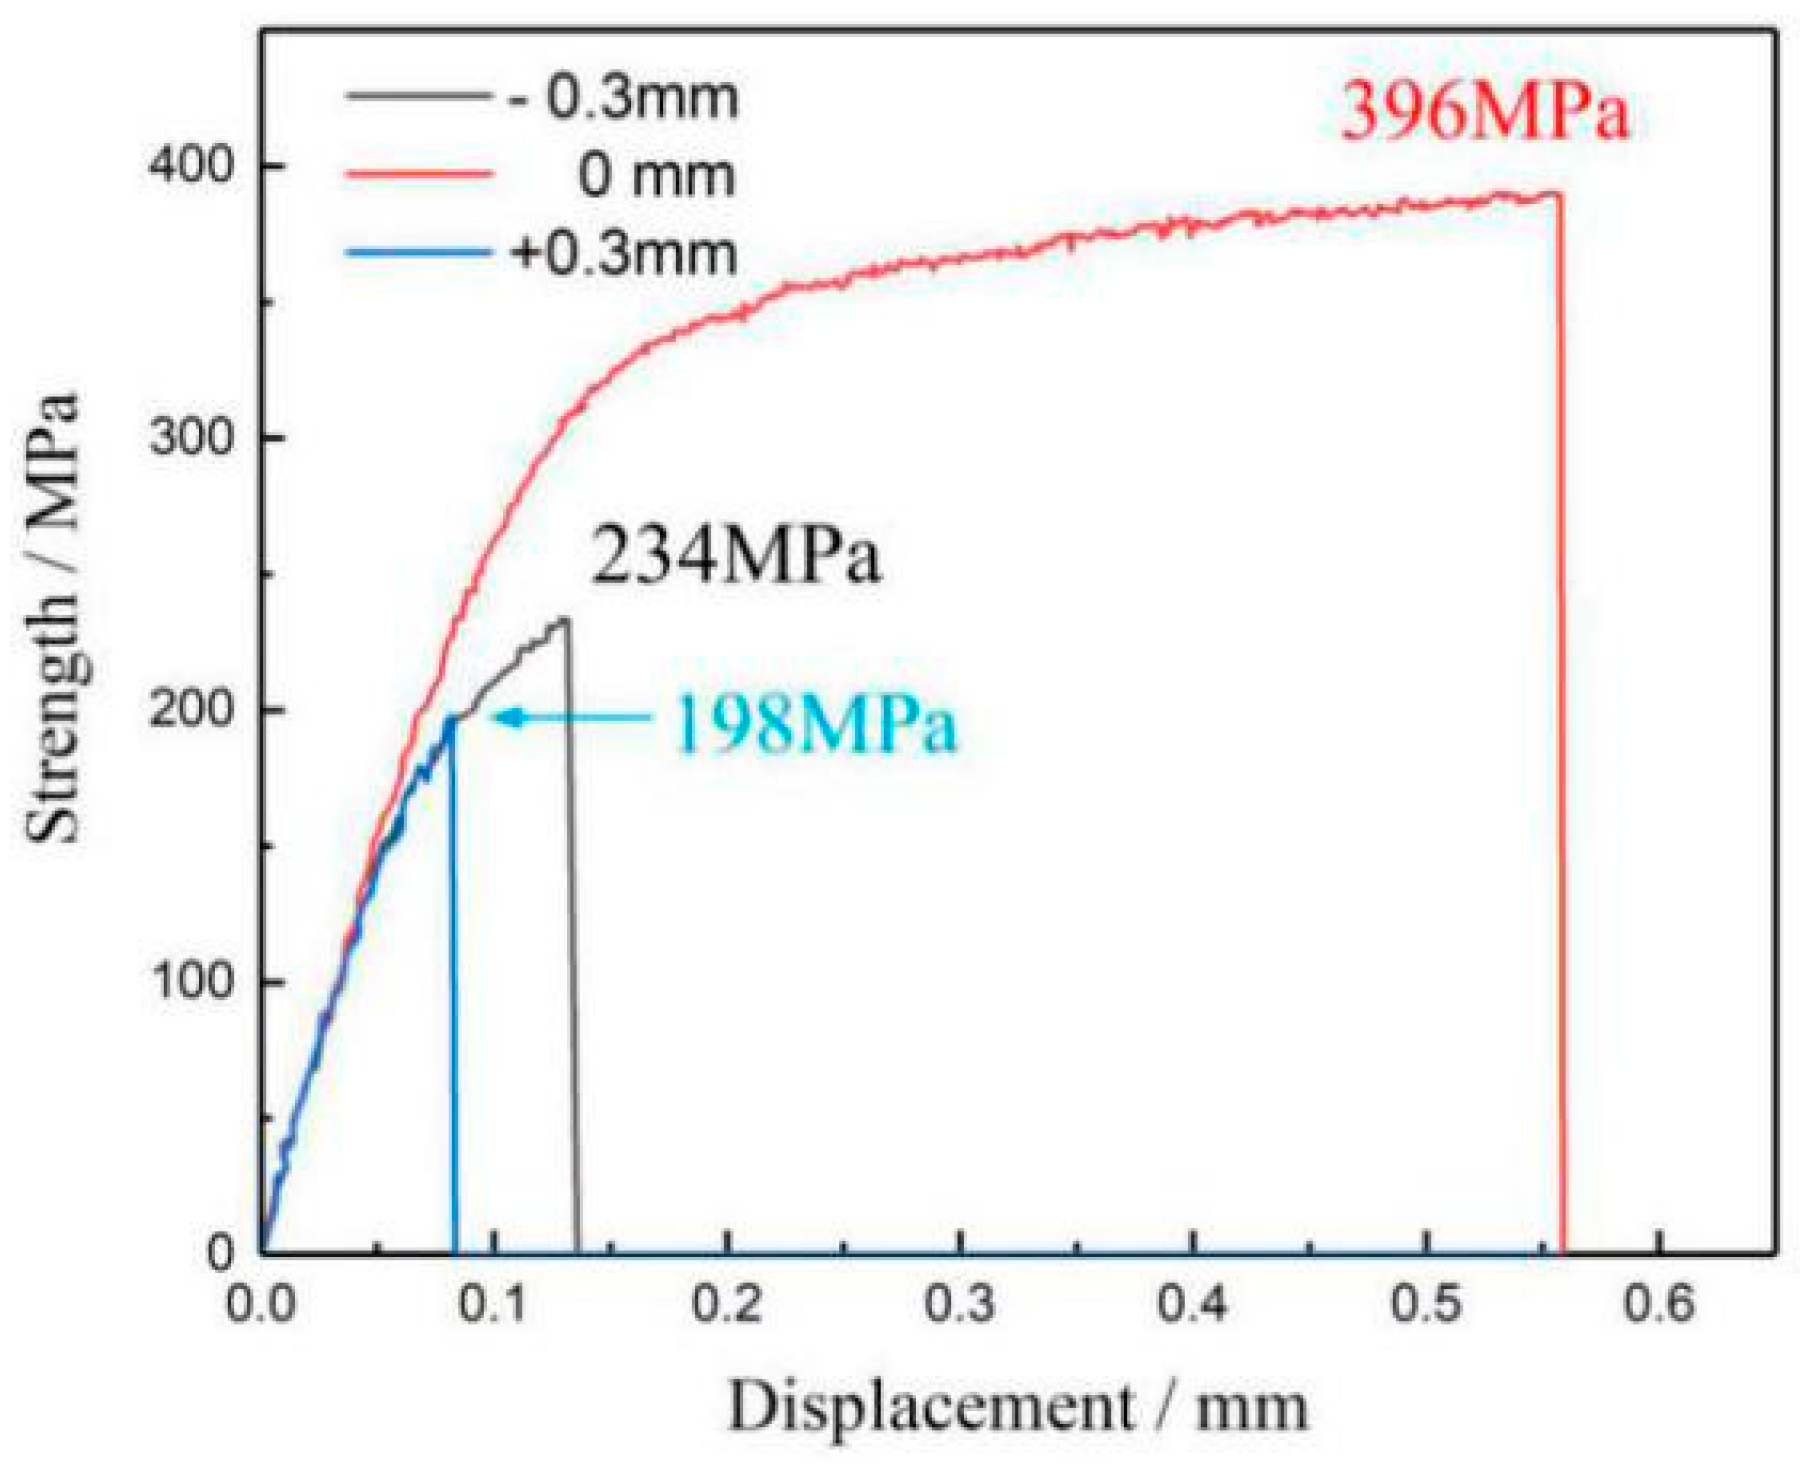
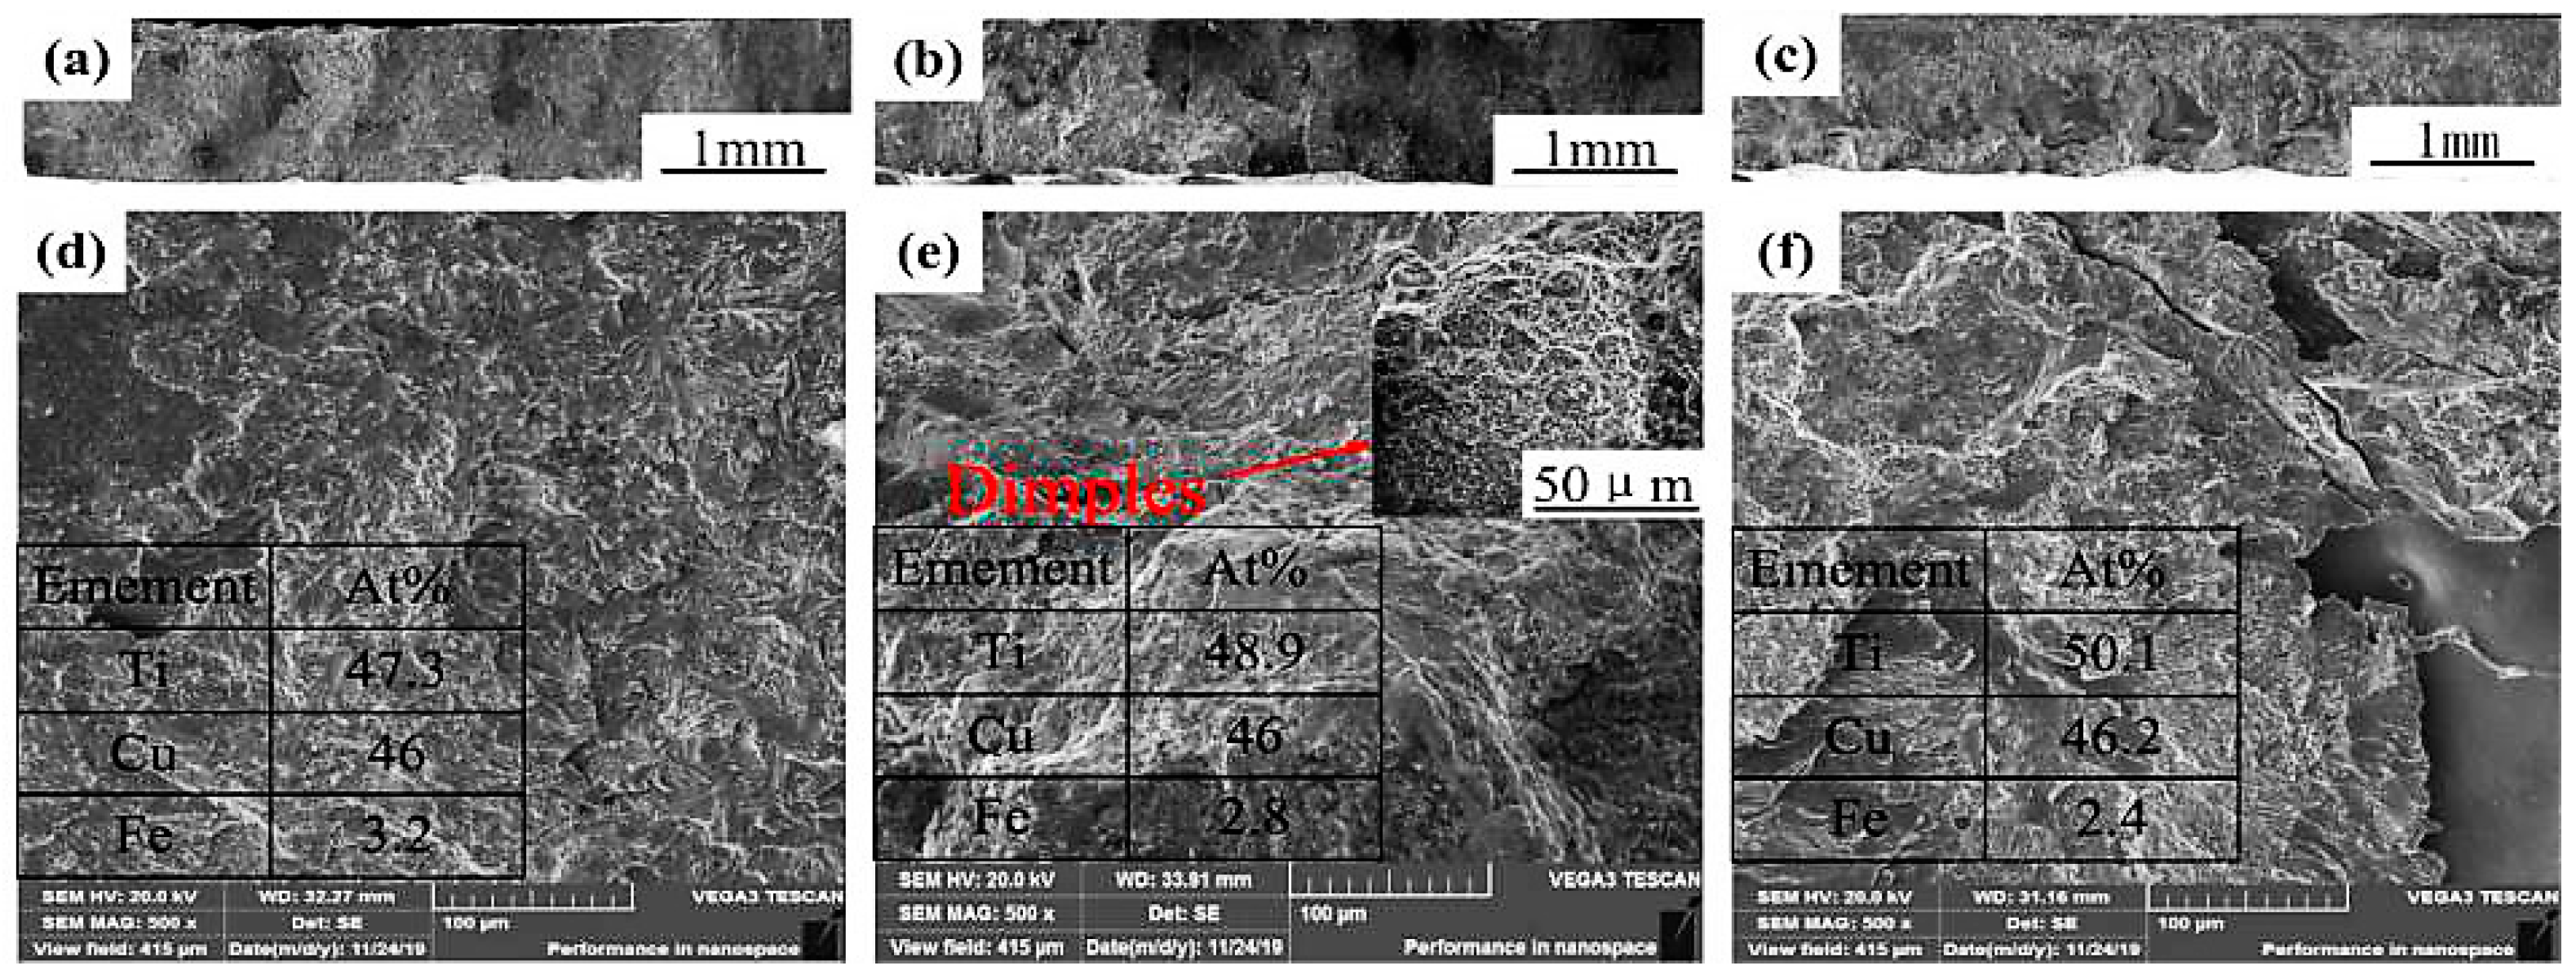
3.1.4. Tensile Strength and Fracture Surface Observation

Figure 8 shows the dimensions of the tensile specimens. In order to ensure the accuracy of the test data, under the same welding parameters, the average value of the tensile test results of three samples is taken as the final tensile strength value. The tensile specimens with different laser offsets are shown in Figure 9. Although offsets were different, the fracture position was always close to 301L side. On the one hand, the linear expansion coefficient of 301L was about twice as that of TA2, which leads to a large deformation of 301L during welding process and a high tensile residual stress in the welded joint. On the other hand, brittle intermetallic compounds (FeTi) were formed in the welded joint near 301L side.
The results of tensile tests are shown in Figure 10, the tensile strength of 301L/TA2 welded joint with offset of +0.3 mm was reached to 193 MPa.
Figure 11 is SEM images of tensile fracture surfaces of 301L/TA2 welded joints. As shown in Figure 11d–f, a relatively smooth fracture surface with a river patterns appears, exhibiting a typical brittle fracture characteristic, attributing to the formation of brittle intermetallic compounds consisting of Fe and Ti. The EDS map scanning results indicated that the phase on fracture surface mainly consisted of Ti (40.4 at.%) and Fe (54 at.%)(Figure 11e). Besides, TiFe and Fe2Ti compounds were detected in XRD analysis of fracture surface (Figure 12). It can be concluded that the fracture position of welded joint was in the Fe-Ti compounds zone.
It is well-known that the tensile strength of welded joint was reduced with the formation of Fe-Ti compounds. In the following research, the effect of laser offset welding on microstructure and mechanical properties of 301L to TA2 with a copper intermediate layer was studied.

3.2. Characterization of 301L/Cu/TA2 Welded Joint

3.2.1. Surface Morphologies

Figure 13 shows the front and back surfaces of welded joints with copper intermediate layer under the different laser offsets. From Figure 13, the overall welding formation with copper intermediate layer is better than that of weld joints without intermediate layer (Figure 2). When the laser beam was located on 301L side with offset of −0.3 mm, a minor spatter exits on the welding surface. When the laser offset was +0.3 mm on TA2 side, the unmelted copper regions can be observed on the back surface of welded joint (Figure 13f). When the offset was 0 mm, the welding surface is better.

3.2.2. Microstructures and Elements Distribution

Figure 14 shows SEM images of pulsed laser welded joints with copper intermediate layer. As displayed in Figure 14a–c, the welded joint was characterized by full penetration. Under the influence of pulsed laser, the molten copper and the partially molten base metal begin to fuse and react. Figure 14d–f show the microstructures on 301L side, welding center and TA2 side, respectively. Figure 13d mainly includes white region A and gray region B. During welding cooling process, the columnar grain was formed, which can be seen in region A. Table 5 presents EDS results, the content of Fe was 70.10% in white region A, indicating that the microstructure of region A could be solid solution of Fe (γ-Fe). Micro-XRD analysis results (Figure 14a) confirmed the presence of γ-Fe in the welded joints. Table 5 shows that the atomic ratio of Fe-Ti in the region B was close to the stoichiometric ratio of Fe2Ti, so the region B may be Fe2Ti. According to Fe-Cu binary phase diagram, Cu could not produce brittle intermetallic compounds with Fe [20]. Thus, Fe element here and Ti element will form Fe2Ti. Furthermore, Fe2Ti embedded in a solid solution of Cu and then formed coarse granule phase (region B). Such distribution pattern reduced the brittleness of Fe-Ti intermetallic compound, enhanced the plasticity of Cu solid solution, and improved the mechanical properties of welded joints [21]. Figure 13e mainly included gray region C and white region D. Combined with the results of EDS analysis, the main microstructure of C region was Cu2Ti, the main microstructure of D region was Cu and TiFe2. The Micro-XRD results (Figure 15b) demonstrated the presence of phases above in the welded joints. However, it can be seen from C region that Cu2Ti was honeycomb-shaped, and its formation can be explained according to Ti-Cu binary phase diagram. First, TiCu was produced (Cu + Ti → TiCu). Then, Cu4Ti3 phase was formed through peritectic reaction (L + TiCu → Cu4Ti3). Finally, the generated Cu4Ti3 continues to undergo a peritectic reaction with the liquid phase to form Cu2Ti (L + Cu4Ti3 → Cu2Ti) [19]. It was worth noting that the brittleness of Cu-Ti intermetallic compound was lower than Fe-Ti [22], so the formation of Cu2Ti helps to reduce the brittleness of welded joint [23]. As shown in Figure 14f, we can see a white region E and a gray region F, which was adjacent to base metal of TA2. The content of Ti near base metal of TA2 was higher than that of welding center, combining with EDS results, we can conclude that microstructure of region E was solid solution of Cu and the phase of region F was TiCu compounds. Micro-XRD analysis results (Figure 15c) also confirmed the presence of phases above in the weld joints.
Based on the analysis above, the formation of Cu-Ti is better than that of Ti-Fe in the welded joint, but the formation of Ti-Fe brittle phases cannot be completely eliminated. In other words, the mechanical property of welded joint with copper intermediate layer is better.
Figure 16 shows the line scanning results of elements distribution for welded joints with different offsets. Overall, Ti distribution curve has a lager fluctuation in the seam-titanium interface. When the offset was +0.3 mm, the fluctuation of Ti distribution curve was obvious at the welding seam. In addition, owing to the similar atomic distance between Cu and Fe, the solid solution can be formed easily, more copper atoms would diffuse to 301L side instead of TA2 side (Figure 16c) [22].
Figure 17 shows the map scanning results of elements distribution on the cross-sections of 301L/Cu/TA2 welded joints. Obviously, Fe and Ti are evenly distributed on both sides of the welding seam. As the offset changes from −0.3 mm to +0.3 mm, the content of Fe is decreased (Figure 17b,f,j), and Ti is increased in the welded seam (Figure 17d,h,i).

3.2.3. Microhardness

In Figure 18, the hardness value of welding seam was higher than that of base metal, and the fluctuation of hardness value was larger. As discussed above, the composition of welding seam was complex, including copper-iron solid solution, copper-titanium compounds, and a small amount of titanium-iron compounds. In summary, the inhomogeneity of microstructure leads to an uneven distribution of hardness value, which ultimately affects the mechanical properties of welded joint [16].

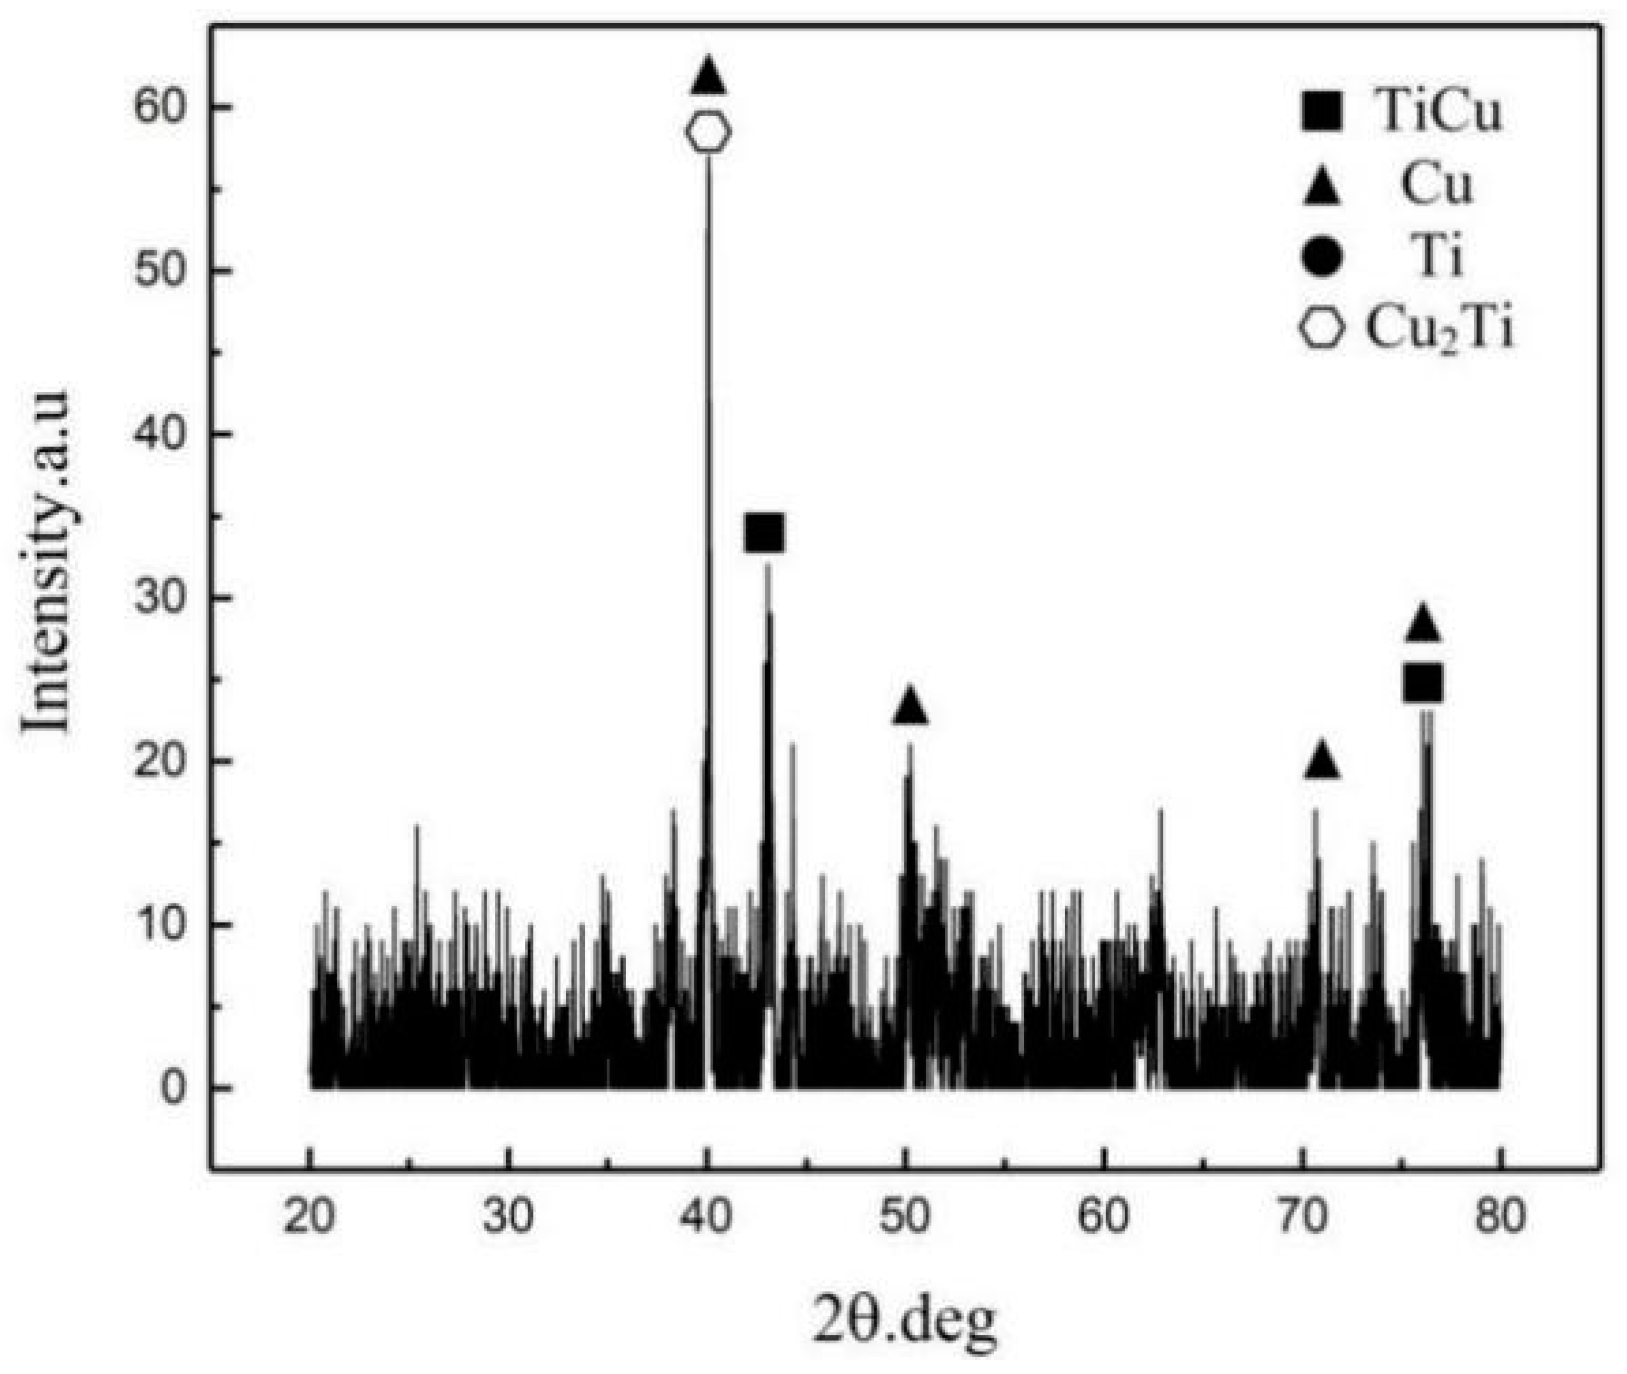
3.3. Tensile Strength and Fracture Surface Observation

Figure 8 is the dimension of tensile specimens. As shown in Figure 19, when copper was added as an intermediate layer during welding process, the fracture position of welded joint was close to TA2 side with offset of –0.3 mm and 0 mm. As analyzed above, Ti-Cu compounds formed on TA2 side, resulting in fracture on the TA2 side. When the offset was +0.3 mm, the position of fracture was close to 301L. It is because there is an unmelted copper in the welding seam, which causes the decrease of connecting strength of 301L and Cu.
Tensile tests results are shown in Figure 20, the tensile strength can reach the maximum value of 396 MPa when the offset was 0 mm with Cu intermediate layer.
Figure 21 displays SEM images of tensile fracture surfaces of 301L/Cu/TA2 welded joints. In Figure 21d–f, a relatively rough fracture surface with river pattern appears, which exhibits a typical brittle fracture characteristic. It is clear that a small number of dimples can be observed on the fracture surface (Figure 21e), the fracture morphology was copper-rich, and XRD analysis results confirmed the presence of Cu (Figure 22). In addition, when copper was used as the intermediate layer, the EDS map scanning results indicated that the phase on fracture surface was mainly composed of Ti (48.9 at.%) and Cu (46 at.%) (Figure 21e). Fracture occurred at the Ti-Cu compounds. As shown in Figure 22, the XRD analysis results also confirmed the presence of Cu-Ti compounds on the fracture surface.

4. Conclusions

In conclusion, the joint properties of with and without Cu intermediate layer were actually affected by the laser offset in welding process, and joint with Cu intermediate showed a relatively high strength. Besides, the element diffusion of the dissimilar joint with different laser offsets (−0.3 mm, 0 mm, and +0.3 mm) has been analyzed. The main conclusions can be summarized as follows:
(1) The process optimization of laser offsets indicated that the tensile strength of welded joints without intermediate layer reached to the highest value of 197 MPa when the laser was applied on TA2 side.
(2) Intermediate layer of Cu restrained the formation of Ti-Fe compounds and it was beneficial to the tensile strength of welded joints. The tensile strength of welded joints with Cu intermediate layer reached to 396 MPa.
(3) Because of the characteristics of fast heat and cooling in the pulse laser welding process, the distributions of hardness were uneven in welding seam. The fluctuation of hardness value was low in welding seam without intermediate layer. On the contrary, the fluctuation of hardness value was obvious in welding seam with Cu intermediate layer.
(4) Element diffusion was actually affected by the laser offset in welding process. In the weld, the content of Fe decreases, and Ti increases, as the offset changes from −0.3 mm to +0.3 mm.
(5) When the Cu was not used as an intermediate layer in the welding process, Fe and Ti formed the Fe-Ti compounds by a eutectic reaction (L → β-Ti + FeTi), which led to brittle fracture of welded joints; brittle fracture took place in the rich copper and Cu-Ti compounds area of welded joints with copper intermediate layer.

Author Contributions

Conceptualization, Y.L. and X.L.; methodology, X.Z.; software, Z.S.; validation, X.Z., Z.S. and C.D.; formal analysis, X.Z.; investigation, X.Z.; resources, Y.L.; data curation, X.Z.; writing—original draft preparation, X.Z.; writing—review and editing, X.L.; visualization, X.Z.; supervision, X.Z.; project administration, X.Z.; funding acquisition, X.Z. All authors have read and agreed to the published version of the manuscript.

Funding

This research was funded by the National Nature Science Foundation of China, the grant number is 51875246, the Natural Science Foundation of Jilin Province through Grant no. 20180101323JC, the “13th Five Year Plan” Science and Technology Research of the Education Department of Jilin Province through Grant no. (2016) 415.

Conflicts of Interest

The authors declare no conflict of interest. The funders had no role in the design of the study; in the collection, analyses, or interpretation of data; in the writing of the manuscript, or in the decision to publish the results.

References

  1. Schutz, R.W.; Watkins, H.B. Recent developments in titanium alloy application in the energy industry. Mater. Sci. Eng. A 1998, 243, 305–315. [Google Scholar] [CrossRef]
  2. Chen, H.C.; Bi, G.J.; Lee, B.Y.; Cheng, C.K. Laser welding of CP Ti to stainless steel with different temporal pulse shapes. J. Mater. Process. Technol. 2016, 231, 58–65. [Google Scholar] [CrossRef]
  3. Xian, A.P.; Si, Z.Y. Interlayer design for joining pressureless sintered sialon ceramic and 40Cr steel brazing with Ag57Cu38Ti5 filler metal. J. Mater. Sci. 1992, 27, 1560–1566. [Google Scholar] [CrossRef]
  4. Chen, C.; Liu, Z.; Zou, L.; Liu, X.; Chai, C.; Zhao, H.; Yan, Y.; Wang, C. Quality evaluation of Apocyni Veneti folium from different habitats and commercial herbs based on simultaneous determination of multiple bioactive constituents combined with multivariate statistical analysis. Molecules 2018, 23, 1–14. [Google Scholar]
  5. Ridha Mohammed, G.; Ishak, M.; Ahmad, S.N.A.S.; Abdulhadi, H.A. Fiber laser welding of dissimilar 2205/304 stainless steel plates. Metals 2017, 7, 546. [Google Scholar] [CrossRef] [Green Version]
  6. Landowski, M.; Świerczyńska, A.; Rogalski, G.; Fydrych, D. Autogenous fiber laser welding of 316L austenitic and 2304 lean duplex stainless steels. Materials 2020, 13, 2930. [Google Scholar] [CrossRef] [PubMed]
  7. Cao, F.J.; Zhang, Y.; Shen, Y.F.; Jin, Y.J.; Li, J.P.; Hou, W.T. Effects of beam offset on the macro defects, microstructure and mechanical behaviors in dissimilar laser beam welds of SDSS2507 and Q235. J. Manuf. Processes 2020, 55, 335–347. [Google Scholar] [CrossRef]
  8. Kundu, S.; Chatterjee, S. Microstructure and mechanical properties of diffusion bonded joints between titanium and stainless steel with copper interlayer. Sci. Technol. Weld. Joining 2007, 12, 572–578. [Google Scholar] [CrossRef]
  9. Chen, S.; Zhang, M.; Huang, J.; Cui, C.; Zhang, H.; Zhao, X. Microstructures and mechanical property of laser buttwelding of titanium alloy to stainless steel. Mater. Des. 2014, 53, 504–511. [Google Scholar] [CrossRef]
  10. Zhang, Z.T.; Wang, L.; Chen, Q.F. Revisions of the diterpenoid alkaloids reported in a JNP paper. Tetrahedron 2013, 69, 5859–5866. [Google Scholar] [CrossRef]
  11. Tomashchuk, I.; Sallamand, P.; Belyavina, N.; Pilloz, M. Evolution of microstructures and mechanical properties during dissimilar electron beam welding of titanium alloy to stainless steel via copper interlayer. Mater. Sci. Eng. A 2013, 585, 114–122. [Google Scholar] [CrossRef]
  12. Elrefaey, A.; Tillmann, W. Solid state diffusion bonding of titanium to steel using a copper base alloy as interlayer. J. Mater. Process. Technol. 2009, 209, 2746–2752. [Google Scholar] [CrossRef]
  13. Zhang, B.G.; Zhao, J.; Li, X.P.; Feng, J.C. Electron beam welding of 304 stainless steel to QCr0.8 copper alloy with copper filler wire. Trans. Nonferrous Met. Soc. China 2014, 24, 4059–4066. [Google Scholar] [CrossRef]
  14. Pardal, G.; Ganguly, S.; Williams, S.; Vaja, J. Dissimilar metal joining of stainless steel and titanium using copper as transition metal. Int. J. Adv. Manuf. Technol. 2016, 86, 1139–1150. [Google Scholar] [CrossRef] [Green Version]
  15. Zhang, Y.; Sun, D.Q.; Gu, X.Y.; Li, H. Characterization of laser-welded Ti alloy and stainless steel joint using Cu interlayer. J. Mater. Eng. Perform. 2019, 28, 6092–6101. [Google Scholar] [CrossRef]
  16. Zhang, Y.; Sun, D.Q.; Gu, X.Y.; Liu, Y.J. Nd/YAG pulsed laser welding of TC4 titanium alloy to 301L stainless steel via pure copper interlayer. Int. J. Adv. Manuf. Technol. 2016, 90, 1–9. [Google Scholar] [CrossRef]
  17. Liu, X.; Zhu, L.; Zhang, Q. Analysis of TA2 hot deformation behavior and corrected TA2 constitutive model based on dynamic recrystallization. Mater. Res. Express 2019, 6, 046531. [Google Scholar] [CrossRef]
  18. Wesemann, I.; Hoffmann, A.; Mrotzek, T.; Martin, U. Investigation of solidsolution hardening in molybdenum alloys. Int. J. Refract. Met. Hard Mater. 2010, 28, 709–715. [Google Scholar] [CrossRef]
  19. Zhang, B.; Wang, T.; Chen, G.; Feng, J. Contact reactive joining of TA15 and 304 stainless steel via a copper interlayer heated by electron beam with a beam deflection. J. Mater. Eng. Perform. 2012, 21, 2067–2073. [Google Scholar] [CrossRef]
  20. Kurt, B.; Orhan, N.; Evin, E.; Calik, A. Diffusion bonding between Ti-6Al-4V alloy and ferritic stainless steel. Mater. Lett. 2007, 61, 1747–1750. [Google Scholar] [CrossRef]
  21. Gao, M.; Chen, C.; Wang, L.; Zeng, X. Laser-arc hybrid welding of dissimilar titanium alloy and stainless steel using copper wire. Metall. Mater. Trans. A 2015, 46, 2007–2020. [Google Scholar] [CrossRef]
  22. Hao, X.; Li, P.; Xia, Y.; Dong, H.; Wang, P.; Yan, D. Microstructure and mechanical properties of dissimilar TC4 titanium alloy/304 stainless steel joint using copper filler wire. Metall. Mater. Trans. A 2019, 50, 688–703. [Google Scholar] [CrossRef]
  23. Song, Y.Q.; Li, S.C.; Du, G.H. Microstructure and forming rule of Ti/Cu diffusion solution zone. Mater. Sci. Technol. 2010, 18, 420–424. [Google Scholar]
Figure 1. Schematic diagram of laser welding with three kinds of offsets: (a) without intermediate layer; (b) with Cu intermediate layer of 0.5 mm thick.
Metals 10 01138 g001
Figure 2. Surface morphologies of 301L/TA2 welded joints with different offsets: (a,c,e) front surface with offset of −0.3 mm, 0 mm and +0.3 mm, respectively; (b,d,f) back surface with offset of −0.3 mm, 0 mm and +0.3 mm, respectively.
Metals 10 01138 g002
Figure 3. The cross-sectional morphologies and microstructures of 301L/TA2 welded joints: (ac) Morphologies with laser offsets of −0.3 mm, 0 mm, +3 mm, respectively; (df) microstructures with laser offsets of 0 mm on 301L side, welding center, TA2 side, respectively; (g) the enlarged view of red box region in Figure 3c and the path of line scanning; (h,i) the map scanning results of Figure 3g; (j) the line scanning results of Figure 3g.
Metals 10 01138 g003
Figure 4. Micro-XRD analysis results of 301L/TA2 welded joints: (a) 301L side; (b) welding center; (c) TA2 side.
Metals 10 01138 g004
Figure 5. The cross-sectional line scanning results of 301L/TA2 welded joints with different laser offsets: (a) Path 1 with offset of −0.3 mm; (b) Path 2 with offset of 0 mm; (c) Path 3 with offset of +0.3 mm.
Metals 10 01138 g005
Figure 6. Map scanning results of elements distribution for 301L/TA2 welded joints with different offsets: (a,e,i) SEM images of scanning areas; (b,f,j) Fe distribution; (c,g,k) Cr distribution; (d,h,l) Ti distribution.
Metals 10 01138 g006
Figure 7. Microhardness distribution of 301L/TA2 welded joints.
Metals 10 01138 g007
Figure 8. Dimension of tensile specimens.
Metals 10 01138 g008
Figure 9. The tensile fracture specimens of 301L/TA2 welded joints: (ac) tensile specimen with offset of −0.3 mm, 0 mm and +0.3 mm, respectively.
Metals 10 01138 g009
Figure 10. Tensile test results of 301L/TA2 welded joints.
Metals 10 01138 g010
Figure 11. SEM images of fracture surfaces of 301L/TA2 welded joints: (ac) Overall morphology of fracture surface with offset of −0.3 mm, 0 mm, and +0.3 mm, respectively; (df) magnified images of fracture surface with offset of −0.3 mm, 0 mm, and +0.3 mm, respectively.
Metals 10 01138 g011
Figure 12. XRD analysis results of fracture surfaces for 301L/TA2 welded joints.
Metals 10 01138 g012
Figure 13. Surface morphologies of 301L/Cu/TA2 welded joints under different offsets: (a,c,e) front surface with offset of −0.3 mm, 0 mm and +0.3 mm, respectively; (b,d,f) back surface with offset of −0.3 mm, 0 mm and +0.3 mm, respectively.
Metals 10 01138 g013
Figure 14. The cross-sectional morphologies and microstructures of 301L/Cu/TA2 welded joints: (ac) The cross-sectional morphologies of 301L/Cu/TA2 welded joints based on laser offsets of −0.3 mm, 0 mm, +3 mm, respectively; (df) microstructures of welded joints on 301L side, welding center, TA2 side, respectively.
Metals 10 01138 g014
Figure 15. Micro-XRD analysis results of 301L/Cu/TA2 welded joints: (a) 301L side; (b) welding center; (c) TA2 side.
Metals 10 01138 g015
Figure 16. Line scanning results of element for 301L/Cu/TA2 welded joints with various laser offsets: (a) offset of −0.3 mm; (b) offset of 0 mm; (c) offset of +0.3 mm.
Metals 10 01138 g016
Figure 17. (al) Map scanning results of elements distribution for 301L/Cu/TA2 welded joints.
Metals 10 01138 g017
Figure 18. Microhardness distribution of 301L/Cu/TA2 welded joints.
Metals 10 01138 g018
Figure 19. The tensile fracture specimens of 301L/Cu/TA2 welded joints: (ac) tensile specimen with offset of −0.3 mm, 0 mm and +0.3 mm, respectively.
Metals 10 01138 g019
Figure 20. Tensile test results of 301L/Cu/TA2 welded joints.
Metals 10 01138 g020
Figure 21. SEM images of tensile fracture surfaces of 301L/Cu/TA2 welded joints: (ac) Overall morphology of fracture surface with offset of −0.3 mm, 0 mm, and +0.3 mm, respectively; (df) magnified images of fracture surface with offset of −0.3 mm, 0 mm, and +0.3 mm, respectively.
Metals 10 01138 g021
Figure 22. XRD analysis results of fracture surfaces for 301L/Cu/TA2 welded joints.
Metals 10 01138 g022
Table 1. The chemical composition of 301L stainless steel (wt.%).
CSiMnPSCrNiFe
≤0.030≤1.00≤2.00≤0.045≤0.03016.0–18.06.0–8.0Base
Table 2. The chemical composition of TA2 pure titanium (wt.%).
FeNHOTi
0.0450.0180.00130.124Base
Table 3. The physical properties of 301L and TA2.
MaterialMelting Point
(°C)
Tensile Strength
(MPa)
Specific Heat Capacity
(J·kg−1·K−1)
Thermal Conductivity
(W·m−1·K−1)
Linear Expansion Coefficient
(10−6·K−1)
301L145055050016.316.3
TA2166850052215.048.4
Table 4. The cross-sectional spot energy disperse spectroscopy (EDS) analysis of 301L/TA2 welded joints.
SpotComposition (at.%)Potential Phases
FeCrNiTi
Spot A in Figure 3d72.1817.335.153.97γ-Fe
Spot B in Figure 3d61.6516.460.9320.27FeTi + γ-Fe
Spot C in Figure 3e56.787.333.0030.55Fe2Ti
Spot D in Figure 3f24.106.462.0468.18β-Ti
Table 5. Spot EDS analysis of 301L/Cu/TA2 welded joints.
RegionComposition (%)Potential Phases
FeCrNiCuTi
A70.1014.441.773.561.0γ-Fe
B45.9711.453.6116.7021.45Fe2Ti + Cu
C24.335.062.4742.1026.14Cu2Ti
D18.662.231.1167.9010.09Cu + TiFe2
E7.911.330.6281.908.21Cu
F2.600.830.3942.8752.80TiCu

