Article

Effects of Wire Drawing and Annealing Conditions on Torsional Ductility of Cold Drawn and Annealed Hyper-Eutectoid Steel Wires

1
School of Advanced Materials Engineering, Kookmin University, Seoul 02707, Korea
2
KISWIRE R&D Center, Pohang 37872, Gyeongbuk, Korea
*
Author to whom correspondence should be addressed.
Metals 2020, 10(8), 1043; https://doi.org/10.3390/met10081043
Submission received: 15 July 2020 / Revised: 28 July 2020 / Accepted: 1 August 2020 / Published: 3 August 2020
(This article belongs to the Special Issue Heat Treatment of Iron- and Aluminum-Based Alloys)

Abstract

:
The effects of microstructural features on torsional ductility of cold drawn and annealed hyper-eutectoid steel wires were investigated. The patented wire rods were successively dry drawn to ε = 0.79 (54.7%) ~ 2.38 (90.7%). To examine the effects of hot-dip galvanizing conditions on torsional ductility, steel wires with ε = 1.95 were annealed at 500 °C for 30 s for ~1 h in a salt bath. In cold drawn wires, the number of turns to failure increased steadily, showing the maximum peak, and then decreased with drawing strain. During the post-deformation annealing at 500 °C, torsional ductility of steel wires decreased with annealing time, except for the rapid drop due to the occurrence of delamination for 10 s annealing. The decrease of the number of turns to failure would be attributed to the microstructural evolutions, accompanying the spheroidization and growth of cementite particles and the recovery of ferrite in cold drawn steel wires. From the relationship between microstructural evolution and torsional ductility, it was found that among microstructural features, the shape and orientation of lamellar cementite showed the significant effect on torsional ductility of cold drawn and annealed hyper-eutectoid steel wires.

1. Introduction

Tensile strength (TS) of cold drawn steel wires can be effectively increased by the refinement of interlamellar spacing, the increase of carbon content, and the increase of drawing strain [1,2,3,4,5,6]. Recently, cold drawn cable wires for a suspension bridge achieved a high tensile strength above 2 GPa. The adoption of the cold drawing process to pearlitic steel wires improves the fatigue property as well as TS. Besides the improvement of TS, the cold drawing process decreases the crack growth rate under cyclic loading conditions, since the cementite lamellae, aligned along the wire axis, behave as obstacles for dislocation movement and, therefore, crack propagation [7,8]. However, the increased strength of cold drawn steel wires generally entails the degradation of ductility. The ductility of cold drawn steel wires is evaluated as reduction of area (RA), elongation to failure (EL) in a tensile test, the occurrence of delamination, and the number of turns to failure (NT) in a torsion test.
When steel wires are subject to further plastic deformation during stranding steel wires for bridge cables or tire cords, or coiling springs, the torsional ductility becomes particularly important. Especially, steel wires for bridge cable need to have good torsional ductility, since the manufacturing process of cable wires for bridges includes cold drawing, hot-dip galvanizing, to improve its anti-corrosion properties of cold drawn steel wires, and stranding. The condition of hot-dip galvanizing is important, since microstructural evolution during galvanizing, which is related to the occurrence of age hardening or age softening, alters strength and ductility of cold drawn steel wires remarkably. Thus, it is expected that the static strain aging behavior during post-deformation annealing as well as the dynamic strain aging behavior during wire drawing would have the substantial contribution to torsional properties in cold drawn and annealed steel wires [9,10,11,12,13,14].
The occurrence of delamination, known as the longitudinal splitting along the wire axis, is one of the qualitative indications of bad ductility. There have been a number of works [15,16,17,18,19,20,21] on the occurrence of delamination in conjunction with the development of texture, the formation of tensile residual stress on the wire surface, the partial decomposition of cementite, and drawing conditions. To prevent the occurrence of delamination, many works about improving ductility and drawability of cold drawn wires by changing manufacturing conditions, such as the modification of pass schedule [22], the control of galvanized coating layer structure [23], and the adoption of a fast heating treatment by using electro-pulsing [24,25], have been reported. However, the occurrence of delamination is not adequate to evaluate the torsional ductility of steel wire, since the occurrence of delamination acts as a simple indicator of brittle fracture during a torsion. Meanwhile, NT reflects the gradual variation of torsional ductility with manufacturing conditions of steel wires [20,21,26,27]. Thus, NT in a torsion test would become a good parameter to examine torsional ductility of cold drawn steel wires. However, most research [15,16,17,18,19] has focused on the effects of manufacturing conditions and microstructures on the occurrence of delamination. Even in a few works providing the variations of NT with drawing or galvanizing conditions, the role of NT data was an indicator of the specific drawing strain or annealing conditions, where delamination occurred in cold drawn and annealed steel wires [26,27]. Thus, to improve torsional ductility, the variations of NT with drawing strain or annealing conditions need to be explained in terms of microstructural features. In spite of the importance of NT compared with the occurrence of delamination, the effect of microstructural features, evolved during wire drawing and/or post-deformation annealing, on NT has not been clarified yet.
In the present work, the effects of microstructural features on torsional ductility of cold drawn and annealed hyper-eutectoid steel wires were examined. Particularly, to find the major microstructural feature controlling number of torsion to failure, the relationship between microstructural evolution during drawing and annealing, and the number of torsion to failure were investigated.

2. Materials and Methods

The chemical composition of steel wire rods used in this work was Fe-0.92%C-1.3%Si-0.5%Mn-0.3%Cr (wt.%). Hot rolled wire rods with an initial diameter of 13 mm were cold drawn to 4.9 mm. The total cross-sectional reduction was 85.8% (ε = 1.95). To investigate the effect of drawing strain on torsional ductility, the 4.9-mm-diameter wires were austenitized at 1000 °C for 3 min, followed by isothermal transformation in a salt bath at 600 °C for 3 min. The transformed wires were pickled and successively dry drawn to final diameters of 3.29 mm (ε = 0.79, 54.7%) ~ 1.49 mm (ε = 2.38, 90.7%). Drawing speed was set to 3 m/min to avoid dynamic strain aging, and the average reduction per pass was about 18%. Additionally, to investigate the effects of hot-dip galvanizing conditions on torsional ductility, 4.9-mm-diameter wires were annealed at 500 °C for 30 s, 1 min, 2 min, 15 min, and 1 h in a salt bath.
Tensile tests of cold drawn wires were performed at room temperature with a cross-head speed of 70 mm/min. To examine torsional ductility, torsion tests were performed as free-end twist tests at a rotational speed of 30 rpm. Tension was applied to the specimen by using a weight of 1% of the maximum tensile load of the wire. For detailed understanding of microstructural evolution (especially, cementite morphology) during annealing, a scanning electron microscope (SEM) was used. Additionally, the fractured surfaces were examined with SEM.
To understand mechanical behavior during a torsion test, it is convenient to transform the torque–number of turns (cycle) curve obtained from a torsion test to shear stress–shear strain curve. The strain distribution during a torsion test is quite different from a tensile test. When deformation is limited within elastic range, the shear stress varies linearly with the radial distance from the center of wire. However, with increasing strain, the surface region of the wire has yielded and plastically deformed, while the center of the wire still stays in the elastic range. Beyond the yield stress, the torque–number of turns (NT) relationship is no longer linear. In the plastic region, the shear stress at the surface region of wire can be calculated by using the Equations (1) and (2). Thus, torque–NT curve obtained from a torsion test can be converted into a shear stress ( τ )–shear strain ( γ ) curve, as shown in Figure 1 [18].
γ   = R · θ L
τ   = 1 2 π R 3 ( 3 T + θ · d T d θ )
where R is the wire radius, L is the length of specimen, θ is the angle of twist (rad), and T is the torque (N∙mm).

3. Results and Discussion

3.1. Mechanical Properties of Cold Drawn and Annealed Wires

Tensile strength (TS) of cold drawn steel wires reflects the contributions of refined interlamellar spacing in deformed pearlite, increased dislocation density in lamellar ferrite, and increased carbon content dissolving in lamellar ferrite due to dynamic strain aging. TS and NT of cold drawn steel wires were plotted as a function of drawing strain in Figure 2a. TS increased with drawing strain continuously. The rapid increase of TS after ε = 2.0 was attributed to the work-hardening effect of the completely re-aligned lamellae along the wire axis. Meanwhile, NT increased steadily up to ε = 2.18, and then decreased with drawing strain. Other works [20,21] also reported the similar behavior of NT in cold drawn steel wires: Increasing continuously, showing the maximum peak, and decreasing after the peak with drawing strain. These sequential behaviors resembled that of RA in Figure 1b. The similarity of the sequential behaviors between NT and RA with drawing strain suggests that microstructural features affecting RA of cold drawn steel wires, such as the shape and orientation of lamellar cementite, the distribution of dislocations, and the dissolved carbon atoms in lamellar ferrite, would have the possibility to control NT of cold drawn steel wires. The initial increase of RA comes from the realignment of randomly oriented lamellar cementite, and the maximum peak of RA at ε = 1.5~2.0 corresponds to the completion of re-alignment of lamellar cementite along the wire axis. The subsequent decrease of RA, after the maximum peak, results from the deformation behavior of the aligned cementite such as thinned and/or fragmented cementite or work-hardened lamellar cementite. However, the observed peak strains of NT, ε = 1.5 [21], ε = 0.7 [26], and ε = 2.18 (this work), did not coincide with the peak strains obtained from RA (ε = 1.5 ~ 2.0). This means that microstructural features controlling RA of cold drawn steel wires would not contribute effectively to controlling NT in cold drawn steel wires. Although NT of cold drawn wires must be strongly related to the characteristics of microstructural features at the corresponding drawing strain, there has been little information on the effect of microstructural features on NT of cold drawn steel wires. Meanwhile, EL in Figure 1b decreased continuously with drawing strain due to work hardening of lamellar ferrite. From the above, it is obvious that the re-orientation of lamellar cementite increased NT, but the fracture of lamellar cementite, the increased dislocation density, and dissolved carbon atoms in lamellar ferrite decreased NT in cold drawn steel wires.
The static strain aging that occurred during the post-deformation annealing is divided into age hardening and age softening, according to aging conditions. Aging hardening occurs through the partial decomposition of lamellar cementite, the diffusion of carbon atoms to dislocations, and pining dislocations with carbon atoms in ferrite. Age softening includes the spheroidization and growth of cementite particles, the re-precipitation of cementite, and the recovery and recrystallization of ferrite. Thus, the variations of mechanical properties during annealing would reflect the results of the competition between aging hardening and age softening in cold drawn steel wires.
Figure 3a shows the effect of annealing time on TS and NT of steel wires cold drawn with ε = 1.95 and annealed at 500 °C. TS decreased continuously with annealing time due to the increased contribution of age softening. NT showed the steady decrease with annealing time, except for the rapid drop for 10 s annealing (circled position in Figure 3a). This rapid drop of NT in Figure 3a would be attributed to the occurrence of delamination, which is closely related to the interaction of dissolved carbon atoms with dislocations in lamellar ferrite. With increasing annealing time, the concentration of dissolved carbon atoms decreased due to the re-precipitation of carbon atoms to cementite particles. When annealing time increased from 10 s to 30 s, NT increased rapidly due to the decrease of interactions between carbon atoms and dislocations. When annealing time exceeded 30 s, NT decreased slowly with annealing time in cold drawn steel wires in spite of the increased degree of age softening. The decrease of NT with annealing time indicates that the matrix softening, i.e., the decreased number of dislocations due to the recovery, would not contribute to improve NT effectively in cold drawn steel wires. This might come from the reduction of mobile dislocation density due to the occurrence of recovery during annealing. Additionally, it was found that the decreased amount of carbon atoms dissolved in ferrite due to the re-precipitation of cementite during annealing did not contribute to the improvement of NT effectively. Thus, the noticeable changes of microstructural features, inducing the decrease of NT during annealing, would be the shape changes of lamellar cementite in cold drawn steel wires. In Figure 3b, the increase of annealing time in steel wires drawn with a strain of 1.95 resulted in the increase of EL and the decrease of RA.
By examining the variation of NT with the microstructural evolutions during wire drawing and post-deformation annealing, the effects of microstructural features on NT can be analyzed. The decrease of NT after the peak with drawing strain was accompanied with microstructural changes, re-orientation, thinning, fragmenting, and partial dissolution of lamellar cementite, and increasing dislocation density in lamellar ferrite. Microstructural changes during post-deformation annealing, responsible for the decrease of NT with annealing time, were the spheroidization and growth of cementite particles, the decrease of dislocation density due to the recovery, and recrystallization of ferrite.
Figure 4 shows the evolution of microstructures during annealing at 500 °C with annealing time. For steel wires annealed for a short annealing time of 30 s (Figure 4b), most lamellar cementite was fractured into cementite particles, while the lamellar-shaped cementite was found in cold drawn steel wires in Figure 4a. It seemed that the annealing temperature of 500 °C was high enough to progress the decomposition and spheroidization of lamellar cementite for a short annealing time. As annealing time increased to 15 min, the progress of spheroidization and growth of cementite particles were more pronounced (Figure 4c). For 1 h annealing, the spheroidization of cementite particles were almost completed and the size of cementite particles varied from 20 μm to 100 μm, although cementite particles kept the lamellar typed array (Figure 4d). Thus, it is expected that the shape and distribution of cementite [26] would become an effective factor controlling NT of cold drawn and annealed steel wires.

3.2. Torsional Ductility and Work Hardening

Under torsion deformation, principal planes are oriented at 45° to the wire axis and the maximum shear stress occurs in planes perpendicular to the wire axis. Torsion failure of ductile materials appears as a flat break perpendicular to the wire axis, while delamination failure occurs with the initiation on a plane parallel to the wire axis giving a helix fracture [28,29].
Figure 5 shows a surface of cold drawn steel wire with a strain of 2.38 and fractured during a torsion test. A flat surface in Figure 5a indicated that torsion failure occurred in a ductile mode. The dimples in Figure 5b showed that the center area received a little deformation during torsion test. But the presence of most elongated dimples in Figure 5d indicated that the surface area received the largest shear deformation and the fracture initiated at the surface of wire. Thus, during a torsion test, torsion failure initiated at the surface of wire, where the maximum shear stress was applied. In a torsion test, without the complicated fracture processes such as necking in a tensile test, relatively large plastic deformation is obtained and shear fracture occurs when torque reaches to the critical value at the maximum point of torque—NT curve, T θ = 0. Thus, the strain-hardening behavior of surface area during torsion would become one of the important factors to improve torsional ductility of the wire.
To investigate the effects of microstructural features on torsional ductility, the variations of shear stress–shear strain curves with drawing strains and annealing temperatures are shown in Figure 6. The shear stress–shear strain curves of cold drawn steel wires, converted from torque–NT curves using the Equations (1) and (2), are shown in Figure 6a. Shear stress increased steadily with drawing strain, while shear strain to failure increased from 0.28 (ε = 0) up to 1.51 (ε = 2.18), and then decreased to 1.48 (ε = 2.38). However, the post-deformation annealing of cold drawn steel wires showed the different behavior of shear stress–shear strain curves from the wire drawing process (Figure 6b). Both shear stress and shear strain to failure decreased continuously with increasing annealing time at 500 °C. It is interesting to note that steel wires with the larger strain-hardening rate in shear stress–shear strain curves showed the larger shear strain to failure in Figure 6. Assuming that after yielding, a power law relationship of the Equation (3) can be applied to shear stress–strain curves in Figure 6.
τ = k · γ n
where τ is shear stress, γ is shear strain, k is material constant, and n is strain-hardening index in a torsion. The strain-hardening index, n, can be considered as a parameter of strain-hardening behavior during torsion.
Figure 7 shows the variations of the strain–hardening index, measured from the data of Figure 6, and NT in cold drawn and annealed steel wires. In cold drawn steel wires (Figure 7a), the strain-hardening index with drawing strain showed the similar trend to NT Increasing, showing the maximum peak, and decreasing after the peak with drawing strain, in spite of a little difference at an each point. In addition, in Figure 7b, NT and strain-hardening index decreased continuously with annealing time, except for the occurrence of delamination. This suggests the possibility that the variation of NT can be explained by the strain-hardening behavior in shear stress—strain curves. Strain hardening during a deformation is controlled by the interactions of dislocations with the barriers for their movement. Thus, strain-hardening index can be controlled by the mean free path (MPF) of dislocations and the amount of dissolved carbon atoms in ferrite during torsion [30,31].
In Figure 7a, the strain-hardening behavior of steel wires during torsion would depend on the orientation of lamellar cementite to the wire axis, the fragmentation of lamellar cementite, and the increased density of dislocations generated during wire drawing [20]. The re-orientation of lamellar cementite during wire drawing would change MFP of dislocations in lamellar ferrite during torsion. In Figure 7b, the decrease of NT with annealing time can be explained by the increase of MFP due to the spheroidization and growth of lamellar cementite and the reduced mobile dislocation due to the recovery. The fracture of lamellar cementite at high drawing strain and the spheroidization and growth of cementite particles increased MPF for the dislocation movement. The decrease of strain-hardening index due to the increase of MPF resulted in the decrease of NT, torsional ductility. A schematic diagram of MPF difference due to annealing of cold drawn steel wires is shown in Figure 8.
From the above, the factors on the increase of strain hardening during torsion were the shape and orientation of lamellar cementite, dislocation density, and the amount of carbon atoms dissolved in ferrite. NT of cold drawn wires increased, and decreased after the maximum peak, in spite of the continuous increase of dislocation density during wire drawing. Meanwhile, the recovery during annealing at 500 °C reduced the density of mobile dislocations by the formation of subgrains. NT of cold drawn and annealed wires decreased as the strain-hardening rate of steel wires decreased with annealing time. Thus, it is expected that although the density of mobile dislocations contributes to NT to some degree, it could not become a major factor on NT in cold drawn and annealed wires. Additionally, the increased amount of carbon atoms in ferrite at high drawing strains decreased NT of drawn wires through the interactions between carbon atoms and dislocations. When cold drawn steel wires received the annealing treatment at 500 °C for the time longer than 30 s, the amount of dissolved carbon atoms decreased due to the re-precipitation of cementite [32] and NT decreased. These adverse effects of carbon atoms dissolved in ferrite on NT indicate that carbon atoms dissolved in ferrite would not have a significant effect on torsional ductility, except for the occurrence of delamination. However, the re-orientation of lamellar cementite increased NT of cold drawn wires and the fractured lamellar cementite and spheroidized cementite particles decreased NT of cold drawn and/or annealed wires. Thus, it is obvious that the shape and orientation of lamellar cementite would become an important factor on torsional ductility of hyper-eutectoid steel wires.

4. Conclusions

The effects of microstructural features on torsional ductility of cold drawn and annealed hyper-eutectoid steel wires were investigated. In particular, the relationship between the microstructural evolution during wire drawing and annealing and the number of turns to failure was discussed.
  • In cold drawn wires, the number of turns to failure (NT) increased steadily up to ε = 2.18, showing the maximum peak, and then decreased with drawing strain. The increase of NT with drawing strain was related to the re-alignment of lamellar cementite along the wire axis, and the decrease of NT after the peak was caused by the fracture of lamellar cementite and the occurrence of dynamic aging during wire drawing.
  • During the post-deformation annealing at 500 °C, NT of steel wires decreased with annealing time, except for the occurrence of delamination for an annealing time of 10 s. The decrease of NT would be attributed to the microstructural evolutions, accompanying the spheroidization and growth of cementite particles, and the recovery of ferrite in cold drawn steel wires.
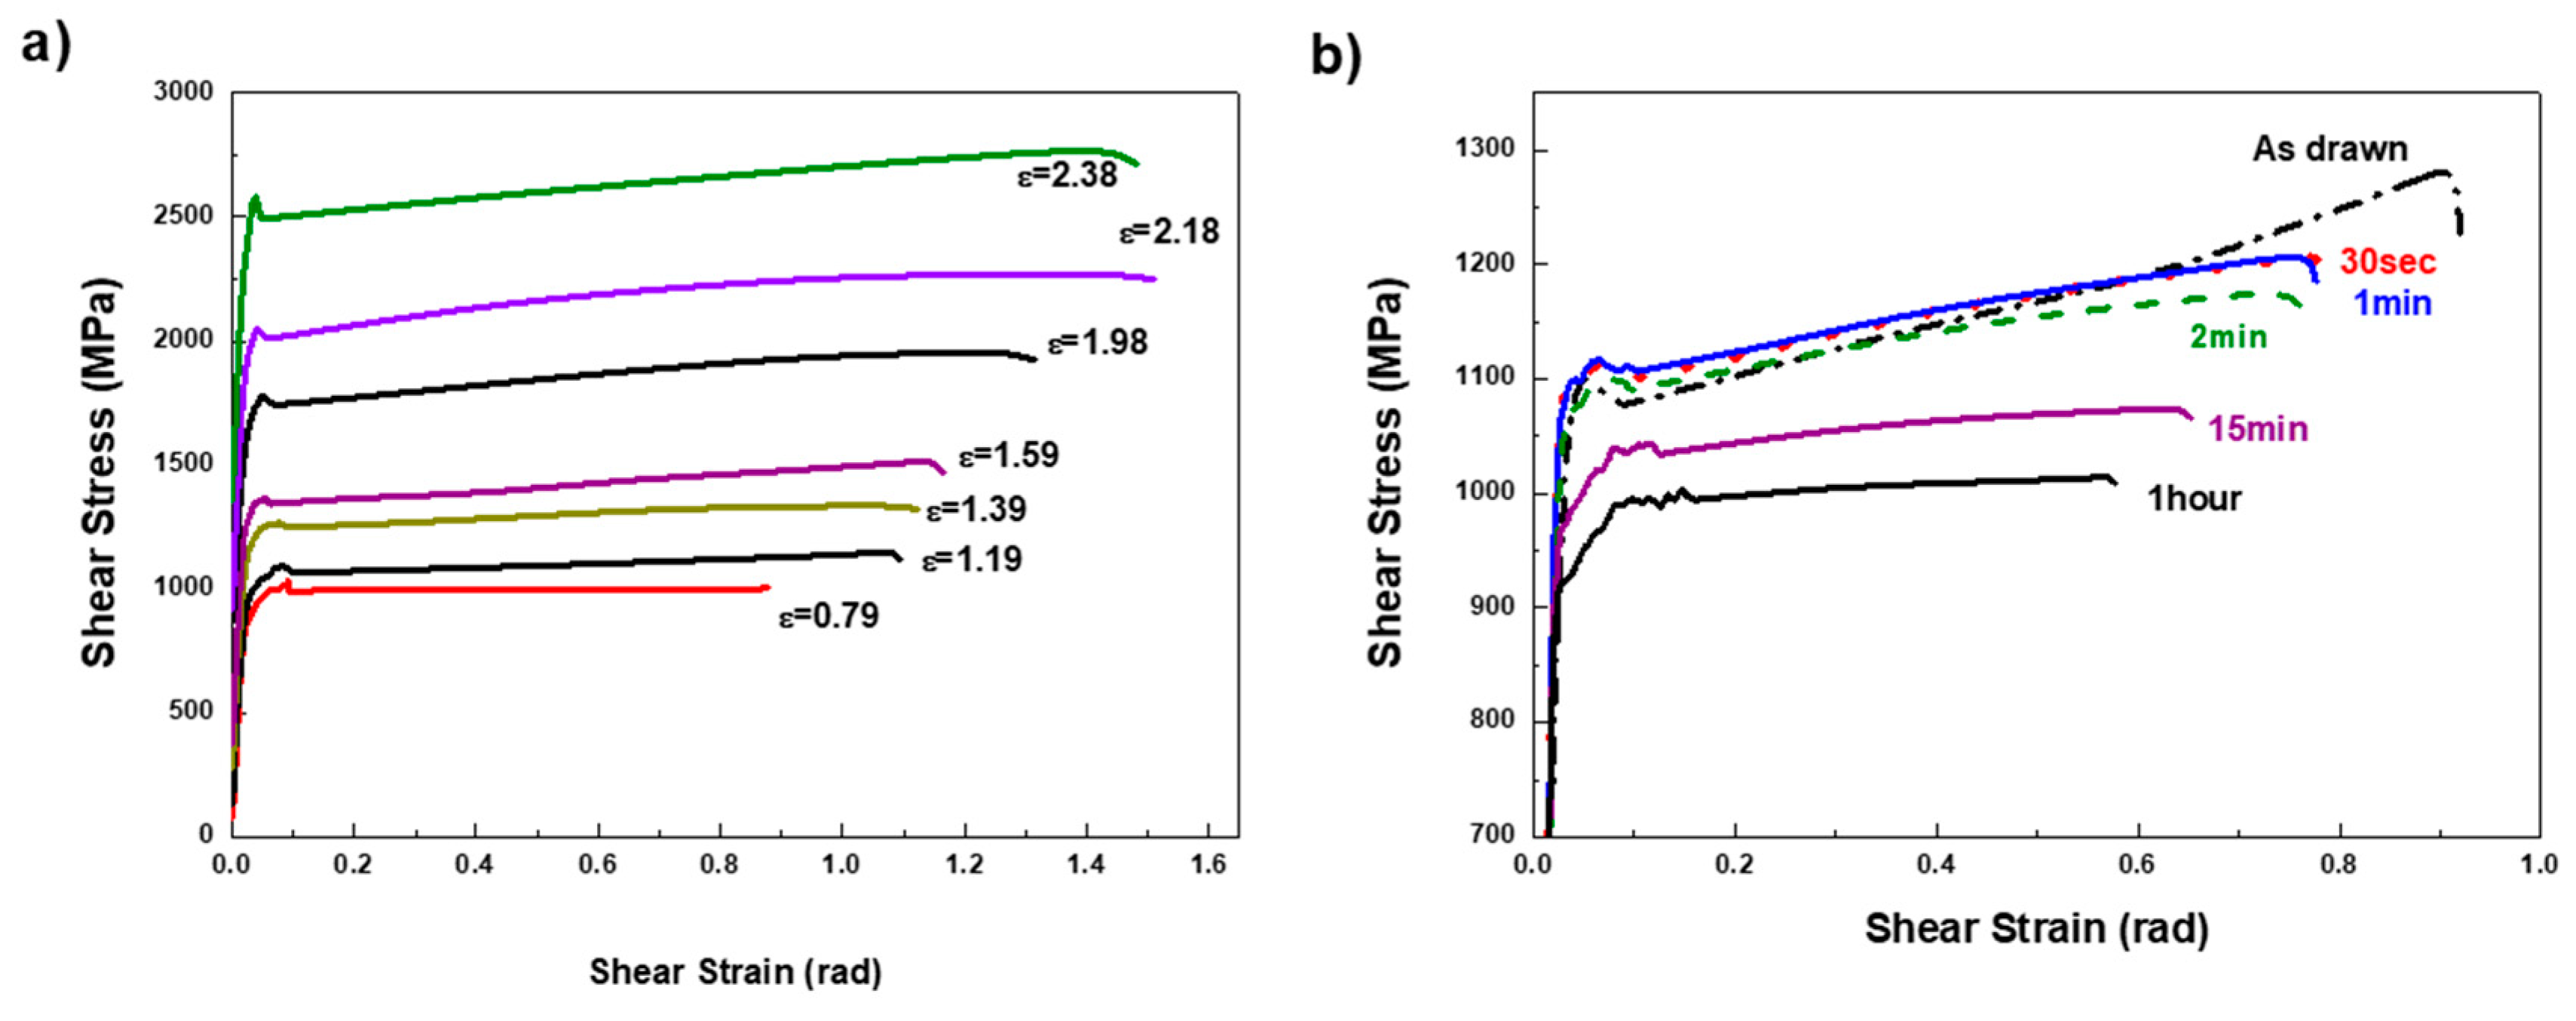
  • The variations of strain-hardening index, obtained from shear stress–shear strain curves, with drawing strain showed the similar trend to NT of cold drawn and/or annealed steel wires. When the strain-hardening index increases in shear stress–shear strain curves, the further plastic deformation is allowed in a torsion test. The behaviors of NT of cold drawn and/or annealed steel wires could be explained with the variations of mean free path (MPF) of dislocations
  • It was found that among microstructural features, the shape and orientation of lamellar cementite showed the significant effect on torsional ductility of cold drawn and annealed hyper-eutectoid steel wires.
  • Other ductility parameters of RA and EL showed the different behaviors from NT in cold drawn and/or annealed steel wires. During wire drawing, EL decreased continuously with drawing strain due to work hardening of lamellar ferrite, while the variation of RA with drawing strain was described as the sequential behavior: Increasing, showing the maximum peak, and decreasing continuously after the peak. Meanwhile, during the post-deformation annealing at 500 °C, the increase of annealing time in steel wires drawn with a strain of 1.95 resulted in the increase of EL and the decrease of RA.

Author Contributions

Conceptualization, writing draft, J.Y.J.; investigation, preparation, data interpretation, K.S.A.; supervision, writing review, P.Y.P.; study design, writing review and editing, funding acquisition, W.J.N. All authors have read and agreed to the published version of the manuscript.

Funding

This research was supported by KISWIRE.

Conflicts of Interest

The authors declare no conflict of interest.

References

  1. Borchers, C.; Kirchheim, R. Cold-drawn Pearlitic Steel Wires. Prog. Mater. Sci. 2016, 82, 405–444. [Google Scholar] [CrossRef]
  2. Li, Y.J.; Choi, P.; Goto, S.; Borchers, C.; Raabe, D.; Kirchheim, R. Evolution of Strength and Microstructure during Annealing of Heavily Cold-drawn 6.3 GPa Hypereutectoid Pearlitic Steel Wire. Acta Mater. 2012, 60, 4005–4016. [Google Scholar] [CrossRef]
  3. Zhang, X.; Godfrey, A.; Huang, X.; Hansen, N.; Liu, Q. Microstructure and strengthening Mechanisms in cold-drawn pearlitic steel wire. Acta Mater. 2011, 59, 3422–3430. [Google Scholar] [CrossRef]
  4. Zhang, X.; Godfrey, A.; Hansen, N.; Huang, X.X. Hierarchical Structures in Cold-drawn Pearlitic Steel Wire. Acta Mater. 2013, 61, 4898–4909. [Google Scholar] [CrossRef] [Green Version]
  5. Watte, P.; Humbeeck, J.V.; Aernoudt, E.; Lefever, I. Strain Ageing in Heavily Drawn Eutectoid Steel Wires. Scr. Mater. 1996, 34, 85–95. [Google Scholar] [CrossRef]
  6. Fang, F.; Zhou, L.C.; Hu, X.J.; Zhou, X.F.; Tu, Y.Y.; Xie, Z.H.; Jiang, J.Q. Microstructure and Mechanical Properties of Cold-drawn Pearlitic Wires Affect by Inherited Texture. Mater. Des. 2015, 79, 60–67. [Google Scholar] [CrossRef]
  7. Toribio, J.; González, B.; Matos, J.C. Analysis of Fatigue Crack Paths in Cold Drawn Pearlitic Steel. Materials 2015, 8, 7439–7446. [Google Scholar] [CrossRef] [Green Version]
  8. Toribio, J.; González, B.; Matos, J.C. Fatigue crack propagation in cold drawn steel. Mater. Sci. Eng. A 2007, 468–470, 267–272. [Google Scholar] [CrossRef]
  9. Park, D.B.; Lee, J.W.; Lee, Y.S.; Park, K.T.; Nam, W.J. Effect of the Annealing Temperature and Time on the Microstructural Evolution and Corresponding the Mechanical Properties of Cold-drawn Steel Wires. Met. Mater. Int. 2008, 14, 59–64. [Google Scholar]
  10. Fang, F.; Hu, J.; Chen, S.H.; Xie, Z.H.; Jiang, J.Q. Revealing Microstructural and Mechanical Characteristics of Cold-drawn Pearlitic Steel Wires undergoing Simulated Galvanization Treatment. Mater. Sci. Eng. A 2012, 547, 51–54. [Google Scholar] [CrossRef]
  11. Lee, J.W.; Lee, J.C.; Lee, Y.S.; Park, K.T.; Nam, W.J. Effects of Post-deformation Annealing Conditions on the Behavior of Lamellar Cementite and the Occurrence of Delamination in Cold-drawn Steel Wires. J. Mater. Process. Technol. 2009, 209, 5300–5304. [Google Scholar] [CrossRef]
  12. Joung, S.W.; Kang, U.G.; Hong, S.P.; Kim, Y.W.; Nam, W.J. Aging Behavior and Delamination in Cold Drawn and Post-deformation Annealed Hyper-eutectoid Steel Wires. Mater. Sci. Eng. A 2013, 586, 171–177. [Google Scholar] [CrossRef]
  13. Hono, K.; Ohnuma, M.; Murayama, M.; Nishida, S.; Yoshie, A.; Takahashi, T. Cementite Decomposition in Heavily Drawn Pearlite Steel Wire. Scr. Mater. 2001, 44, 977–983. [Google Scholar] [CrossRef]
  14. Languillaum, J.; Kapelaki, G.; Baudelet, B. Cementite Dissolution in Heavily Cold-drawn Pearlite Steel Wires. Acta Mater. 1997, 45, 1201–1212. [Google Scholar] [CrossRef]
  15. Zhou, L.C.; Fang, F.; Wang, L.; Chen, H.Q.; Xie, Z.H.; Jiang, J.Q. Torsion Delamination and Recrystallized Cementite of Heavy Drawing Pearlitic Wires After Low Temperature Annealing. Mater. Sci. Eng. A 2018, 713, 52–60. [Google Scholar] [CrossRef]
  16. Gondo, S.; Tanemura, R.; Suzuki, S.; Kajino, S.; Asakawa, M.; Takemoto, K.; Tashima, K. Microstructures and Mechanical Properties of Fiber Textures forming Mesoscale Structure of Drawn Fine High Carbon Steel Wire. Mater. Sci. Eng. A 2019, 747, 255–264. [Google Scholar] [CrossRef]
  17. He, Y.; Xiang, S.; Shi, W.; Liu, J.; Ji, X.; Yu, W. Effect of Microstructure Evolution on Anisotropic Fracture Behaviors of Cold Drawing Pearlitic Steels. Mater. Sci. Eng. A 2017, 683, 153–163. [Google Scholar] [CrossRef]
  18. Nam, W.J.; Bae, C.M.; Oh, S.J.; Kwon, S.J. Effect of Interlamellar Spacing on Cementite Dissolution during Wire Drawing of Pearlitic Steel Wires. Scr. Mater. 2000, 42, 457–463. [Google Scholar] [CrossRef]
  19. Li, Y.J.; Choi, P.; Borchers, C.; Chen, Y.Z.; Goto, S.; Raabe, D.; Kirchheim, R. Atom Probe Tomography Characterization of Heavily Cold Drawn Pearlitic Steel Wire. Ultramicroscopy 2011, 111, 628–632. [Google Scholar] [CrossRef]
  20. Zhao, T.Z.; Zhang, S.H.; Zhang, G.L.; Song, H.W.; Cheng, M. Hardening and Softening Mechanisms of Pearlitic Steel Wire under Torsion. Mater. Des. 2014, 59, 397–405. [Google Scholar] [CrossRef]
  21. Zelin, M. Microstructure Evolution in Pearlitic Steels during Wire Drawing. Acta Mater. 2002, 50, 4431–4447. [Google Scholar] [CrossRef]
  22. Lee, S.K.; Ko, D.C.; Ki, B.M. Pass schedule of wire drawing process to prevent delamination for high strength steel cord wire. Mater. Des. 2009, 30, 2919–2927. [Google Scholar] [CrossRef]
  23. Gelfi, M.; Solazzi, L.; Poli, S. Influence of the Manufacturing Process on Defects in the Galvanized Coating of High Carbon Steel Wires. Materials 2017, 10, 264. [Google Scholar] [CrossRef] [PubMed] [Green Version]
  24. Rojas, H.A.G.; Egea, A.J.S.; Hameed, S.; Bolmaro, R. An Ultra-Fast Annealing Treatment by Electropulsing during Pure Copper Wire Drawing. Metals 2019, 9, 1253. [Google Scholar] [CrossRef] [Green Version]
  25. Egea, A.J.S.; Peiro, J.J.; Signorelli, J.W.; Rojas, H.A.G.; Celentano, D.J. On the Microstructure Effects when using Electropulsing versus Furnace Treatments while Drawing Inox 308L. J. Mater. Res. Technol. 2019, 8, 2269–2279. [Google Scholar] [CrossRef]
  26. Zhou, L.; Fang, F.; Wang, L.; Hu, X.; Xie, Z.; Jiang, J. Torsion Performance of Pearlitic Steel Wires: Effects of Morphology and Crystallinity of Cementite. Mater. Sci. Eng. A 2019, 743, 425–435. [Google Scholar] [CrossRef]
  27. Lu, X. Correlation between Microstructural Evolution and Mechanical Properties of 2000 MPa Cold-Drawn Pearlitic Steel Wires during Galvanizing Simulated Annealing. Metals 2019, 9, 326. [Google Scholar] [CrossRef] [Green Version]
  28. Hu, X.; Wang, L.; Fang, F.; Ma, Z.; Xie, Z.H.; Jiang, J. Origin and Mechanism of Torsion Fracture in Cold-drawn Pearlitic Steel Wires. J. Mater. Sci. 2013, 48, 5528–5535. [Google Scholar] [CrossRef]
  29. Das, S.; Koli, P.; Mathur, J.; Dey, A.; Bhattacharyya, T.; Bhattacharyya, S. Failure Analysis of Motor Tire Bead Wires During Torsion Test. J. Fail. Anal. Preven. 2013, 13, 684–688. [Google Scholar] [CrossRef]
  30. Fan, Z.; Mingzhi, H.; Deke, S. The Relationship between the Strain-hardening Exponent n and the Microstructure of Metals. Mater. Sci. Eng. A 1989, 122, 211–213. [Google Scholar] [CrossRef]
  31. Lou, S.; Northwood, D.O. Effect of Strain Aging on the Strength Coefficient and Strain-Hardening Exponent of Construction-Grade Steels. JMEPEG 1994, 3, 344–349. [Google Scholar] [CrossRef]
  32. Takahashi, J.; Kosaka, M.; Kawakami, K.; Tarui, T. Change in Carbon State by Low-temperature Aging in Heavily Drawn Pearlitic Steel Wires. Acta Mater. 2012, 60, 387–395. [Google Scholar] [CrossRef]
Figure 1. Torsional properties of cold drawn steel wires with a strain of 1.95. (a) Torque—NT curve and (b) shear stress—shear strain curve.
Metals 10 01043 g001
Figure 2. The variations of (a) TS and NT and (b) RA and EL with drawing strain in hyper-eutectoid steel wires.
Metals 10 01043 g002
Figure 3. The variations of (a) TS and NT and (b) RA and EL with annealing time at 500 °C in hyper-eutectoid steel wires cold drawn with a strain of 1.95.
Metals 10 01043 g003
Figure 4. SEM micrographs, showing the microstructural evolution, (a) as drawn, and annealed at 500 °C for annealing time of (b) 30 s, (c) 15 min, and (d) 1 h.
Metals 10 01043 g004
Figure 5. (a) Ductile torsion fracture surface of cold drawn steel wire with a strain of 2.38, (b) dimples in the center region (marked A in (a)), (c) elongated dimples in one quarter region of a diameter (marked B in (a)), and (d) elongated dimples at the surface (marked C in (a)).
Metals 10 01043 g005
Figure 6. Shear stress–shear strain curves of steel wires (a) cold drawn with different drawing strains, (b) cold drawn with ε = 1.95 and annealed at 500 °C with different annealing time.
Metals 10 01043 g006
Figure 7. The variations of strain-hardening index and NT (a) with drawing strain in steel wires and (b) with annealing time at 500 °C in steel wires cold drawn with a strain of 1.95.
Metals 10 01043 g007
Figure 8. A schematic diagram of MPF difference due to annealing of cold drawn steel wires; (a) as drawn with a strain of 1.95, (b) annealed at 500 °C for 1 h.
Metals 10 01043 g008

