Article

Effects of Second-Phase Particles on Microstructure Evolution in Mg-2Zn Based Magnesium Alloys during Annealing Treatment

1
Institute of Engineering Technology, University of Science and Technology Beijing, Beijing 100083, China
2
China Institute of Marine Technology & Economy, Beijing 100081, China
*
Author to whom correspondence should be addressed.
Metals 2020, 10(6), 777; https://doi.org/10.3390/met10060777
Submission received: 14 May 2020 / Revised: 6 June 2020 / Accepted: 8 June 2020 / Published: 10 June 2020

Abstract

:
As an important fabrication process, annealing treatment is conducted to eliminate distortion in magnesium alloy sheets. Second-phase particles can provide nucleation sites for recrystallization grains, and the basal texture is related to the recrystallization behavior. Three experimental Mg-2Zn-based magnesium alloy sheets were investigated by the salt bath annealing process. Combined with variations in hardness softening, evolution of microstructure and basal texture, the effect of second-phase particles on microstructure evolution was analyzed. The results showed that the significant influence of size and distribution of second-phase particles on static recrystallization in magnesium alloy sheets was exhibited, which lead to the formation of two stages in the annealing process, combined with static recovery behavior. Second phase particles with coarse size were beneficial to recrystallization grains’ nucleation and increased recrystallization behavior in the initial stage of annealing. Second-phase particles with fine size inhibited recrystallization behavior and weakened the softening of hardness. The basal texture was weakened by second phase particles at the stage of recrystallization nucleation. The change in basal texture at the stage of grain growth was related to the size of second-phase particles. The regulation of basal texture enhancement can be envisioned by modifying second-phase particles.

1. Introduction

As the metal engineering material with the lowest density, magnesium alloys have attracted widespread attention in the lightweight field [1,2,3]. Due to the limited deformation ability at room temperature, the severe plastic deformation process in the fabrication process of magnesium alloys is conducted at high temperature. At the same time, the dynamic recrystallization (DRX) process can be activated to reduce the density of dislocation and promote deformation [4,5,6]. However, the degree of distortion is accumulated and internal stress is formed. The annealing treatment is conducted to eliminate internal stress induced during rolling or extrusion process. At the same time, the evolution of microstructure characterization existed with the progress of annealing process [7,8,9]. The texture characterization can be changed by the activation of recovery and static recrystallization (SRX) process during annealing treatment. The evolutions of basal texture in magnesium alloys can maintain, weaken and intensify during annealing process [10,11,12,13]. Grain orientation is the critical factor to control the mechanical property of magnesium alloys, due to the low symmetrical crystal. As an expression of orientations of massive grains, the characterization of recrystallized texture is related to the formability of magnesium alloy sheets [14,15]. The stretch formability of magnesium alloy sheets at room temperature can be enhanced by decreasing texture intensity and increasing texture distribution [16,17,18]. Therefore, the microstructure evolution during annealing process is vital to improve the comprehensive performance of magnesium alloys.
By precipitation strengthening, second-phase particle is a common strengthening mechanism in magnesium alloy [19]. Yu [20] found that the addition of Ce element into ZK60 alloys can improve the yield strength due to the Mg-Zn-Ce particles. In addition, grain growth can be effectively pinned by second-phase particles, such as Al8Mn5 [21]. The grain refinement strengthening can be achieved by the existence of second-phase particles. Moreover, as preferential nucleation sites for recrystallized grains, second-phase particles have a significant influence on recrystallization behavior. The recrystallization grains nucleate at the second phase particles, exhibiting random grain orientation and potentially weakening the basal texture [22]. Du [23] investigated the effect of the single addition of Ca and combined additions of Ca-Ce into an extruded Mg-6Zn alloy on microstructure and mechanical property. The results indicated that refined DRXed microstructure, promoted dynamic precipitation and modified texture component were obtained by alloying addition. The texture modification was attributed to particle-stimulated nucleation (PSN) mechanism. The positive effects of the PSN mechanism on weakening texture were frequently found in the DRX process [24,25,26]. The PSN mechanism in the SRX process is also noticeable for affecting the microstructure evolution during annealing treatment.
The comprehensive performance of magnesium alloys was dominated by microstructure characteristics after the annealing process. Moreover, the microstructure evolution during annealing treatment was influenced by second-phase particles. Hence, it is significant to systematically investigate the role of size or distribution of second phase particles on microstructure evolution during annealing process, and the related study is critical to developing magnesium alloy sheets with optimized performance. Although some investigations related to second-phase particles on recrystallization behavior were published, and the PSN mechanism was confirmed as an effective stimulation way to induce recrystallization process, the influence of PSN on texture evolution during whole annealing treatment is still controversial. The PSN mechanism can modify the texture component, however, PSN has been shown to be not necessary for texture randomization [27]. Therefore, the texture evolution under the effect of second-phase particles needs more systematic investigation, which contains the nucleation stage and grain growth stage. In the previous study, a novel Mg-2Zn-based magnesium alloy sheet with a balance of high strength and high formability at room temperature was fabricated [28]. The important strengthening mechanism for the balanced mechanical properties included weakened basal texture and nano-sized second-phase particles with uniform distribution. Meanwhile, the characterizations of second phase particles exhibited different size or distribution in experimental magnesium alloy sheets. Moreover, the basal texture feature under as-annealed condition presented distinctly, which was also affected by second-phase particles. Therefore, the difference of second-phase particles and texture characterization is positive to explore the effect of second-phase particles on microstructure evolution during annealing process. In the paper, hot-rolled experimental magnesium alloys with different second-phase particle characterizations were applied to conduct salt bath annealing treatment. The SRX behavior was monitored by fractional softening in hardness. Moreover, the evolution of microstructure characterization and variations in basal texture during annealing process were analyzed. Finally, the effects of second-phase particles on microstructure and basal texture were discussed, and this can provide guidance to develop magnesium alloys with a weakened basal texture and subsequent high stretch formability.

2. Materials and Experimental Procedure

2.1. Materials

In this paper, the nominal chemical compositions of experimental magnesium alloys were Mg-2Zn and Mg-2Zn-1Al-0.2Ca-0.2Gd-0.2Mn, respectively. For the convenience of description, Mg-2Zn and Mg-2Zn-1Al-0.2Ca-0.2Gd-0.2Mn alloys were abbreviated as Z2 and ZA21 alloys based on the contents of main alloying elements. The ingots of Z2 and ZA21 alloys with dimension of Φ120 mm × 150 mm were casting by conventional casting methods and defined as IC-Z2 and IC-ZA21 magnesium alloys. The raw materials of pure Mg, pure Al and master alloys (Mg-20 wt.% Ca, Mg-30 wt.% Gd) with high purity were melted in a medium frequency induction furnace under 1% CO2-99% SF6 protection gas atmosphere. After homogeneous stirring at 750 °C for 30 min, melts were transferred into steel mold which preheated at 350 °C. Moreover, twin-roll casting (TRC) technology was applied to fabricate ZA21 alloy slabs with 5.5 mm in thickness, and the slabs were defined as TRC-ZA21. The same raw materials with high purity were melted under the same mixed gas protection atmosphere of CO2 and SF6, and the temperature when molten alloys transferred into preheated tundish was set to 730 °C, followed by twin-rollers rolling with a roller gap of 5.5 mm, and subsequently air-cooled. The actual chemical compositions were detected by inductively coupled plasma atomic emission spectroscopy (ICP-AES) and exhibited in the previous study [28].
The slabs with thickness of 5.5 mm were machined from ingots of IC-Z2 and IC-ZA21 alloys by wire-electrode cutting. Furthermore, the slabs of IC-Z2, IC-ZA21 and TRC-ZA21 alloys were conducted by hot rolling process with seven passes until the thickness of magnesium alloy sheets reached 1.0 mm. The rolling temperature was 400 °C, and reduction per pass was controlled in the range from 20% to 25%. A short-term intermediate heating process for 10 min was conducted between each rolling pass. Furthermore, the rolling direction, transverse direction and normal direction of the magnesium alloy sheets were abbreviated to RD, TD and ND, respectively.
Many samples with a size of 8 mm × 6 mm (RD × TD) were machined from hot-rolled sheets of IC-Z2, IC-ZA21 and TRC-ZA21 alloys. These samples were individually sealed by aluminum foil. When the temperature in salt bath furnace reached 350 °C and maintained 4 h, the samples were placed in the salt bath furnace and conducted to salt bath annealing process to ensure the appearance of recovery and SRX process. Samples with annealing time of 5, 10, 30, 60, 120, 300, 600, 1800 and 3600 s were selected to analyze the microstructure evolution during annealing treatment. The annealed samples can be designated as seen in Table 1.

2.2. Microstructure Observation

Microstructure characterization was observed by Qutanta FEG 450 scanning electron microscope (SEM) (FEI, Hillsboro, FL, USA) with secondary electron mode. Moreover, compositions of second-phase particles were analyzed using EDAX TEAM energy dispersive X-ray spectroscopy detector (EDS) (EDAX Inc, Mahwah, NJ, USA) equipped with the SEM. The metallographic samples for SEM observation were ground with SiC papers and subsequently chemically polished in nitric acid solution (10% HNO3 + 90% alcohol), and finally etched in acetic picral solution (5 g picric acid + 5 mL acetic acid + 100 mL alcohol +10 mL distilled water). More detailed microstructure characterization was detected by Panalytical X’pert MRD X-ray diffractometer (XRD) (PANalytical, Almelo, The Netherlands) with Cu Kα radiation and Zeiss-Gemini 500 SEM (ZEISS, Jena, Germany) equipped with HKL Electron Back-Scattered Diffraction (EBSD) detector (Oxford, Oxford, UK). Samples of XRD and EBSD were ground with SiC papers and subsequently chemically polished in nitric acid solution (10% HNO3 + 90% alcohol), and further electro-polished in orthophosphoric acid solution (37.5% H3PO4 + 62.5% alcohol). The working voltages of SEM and XRD were 20 and 40 kV, respectively. The step-sizes of detection for EBSD and XRD were set as 0.5 μm and 5°.

2.3. Vickers Hardness Tests

Variations of Vickers hardness during salt bath annealing treatment were applied to investigate recrystallization behavior in three experimental magnesium alloy sheets. Vickers hardness tests were conducted in HXD-1000TM Vickers microhardness tester (Shanghai optical instrument factory, Shanghai, China). The loading force and load holding time in Vickers hardness tests were 100 gf and 10 s. The number of Vickers hardness tests for every annealing time was at least 10 times, and the average values were calculated by removing the maximum and minimum values to improve the accuracy.

3. Results and Discussion

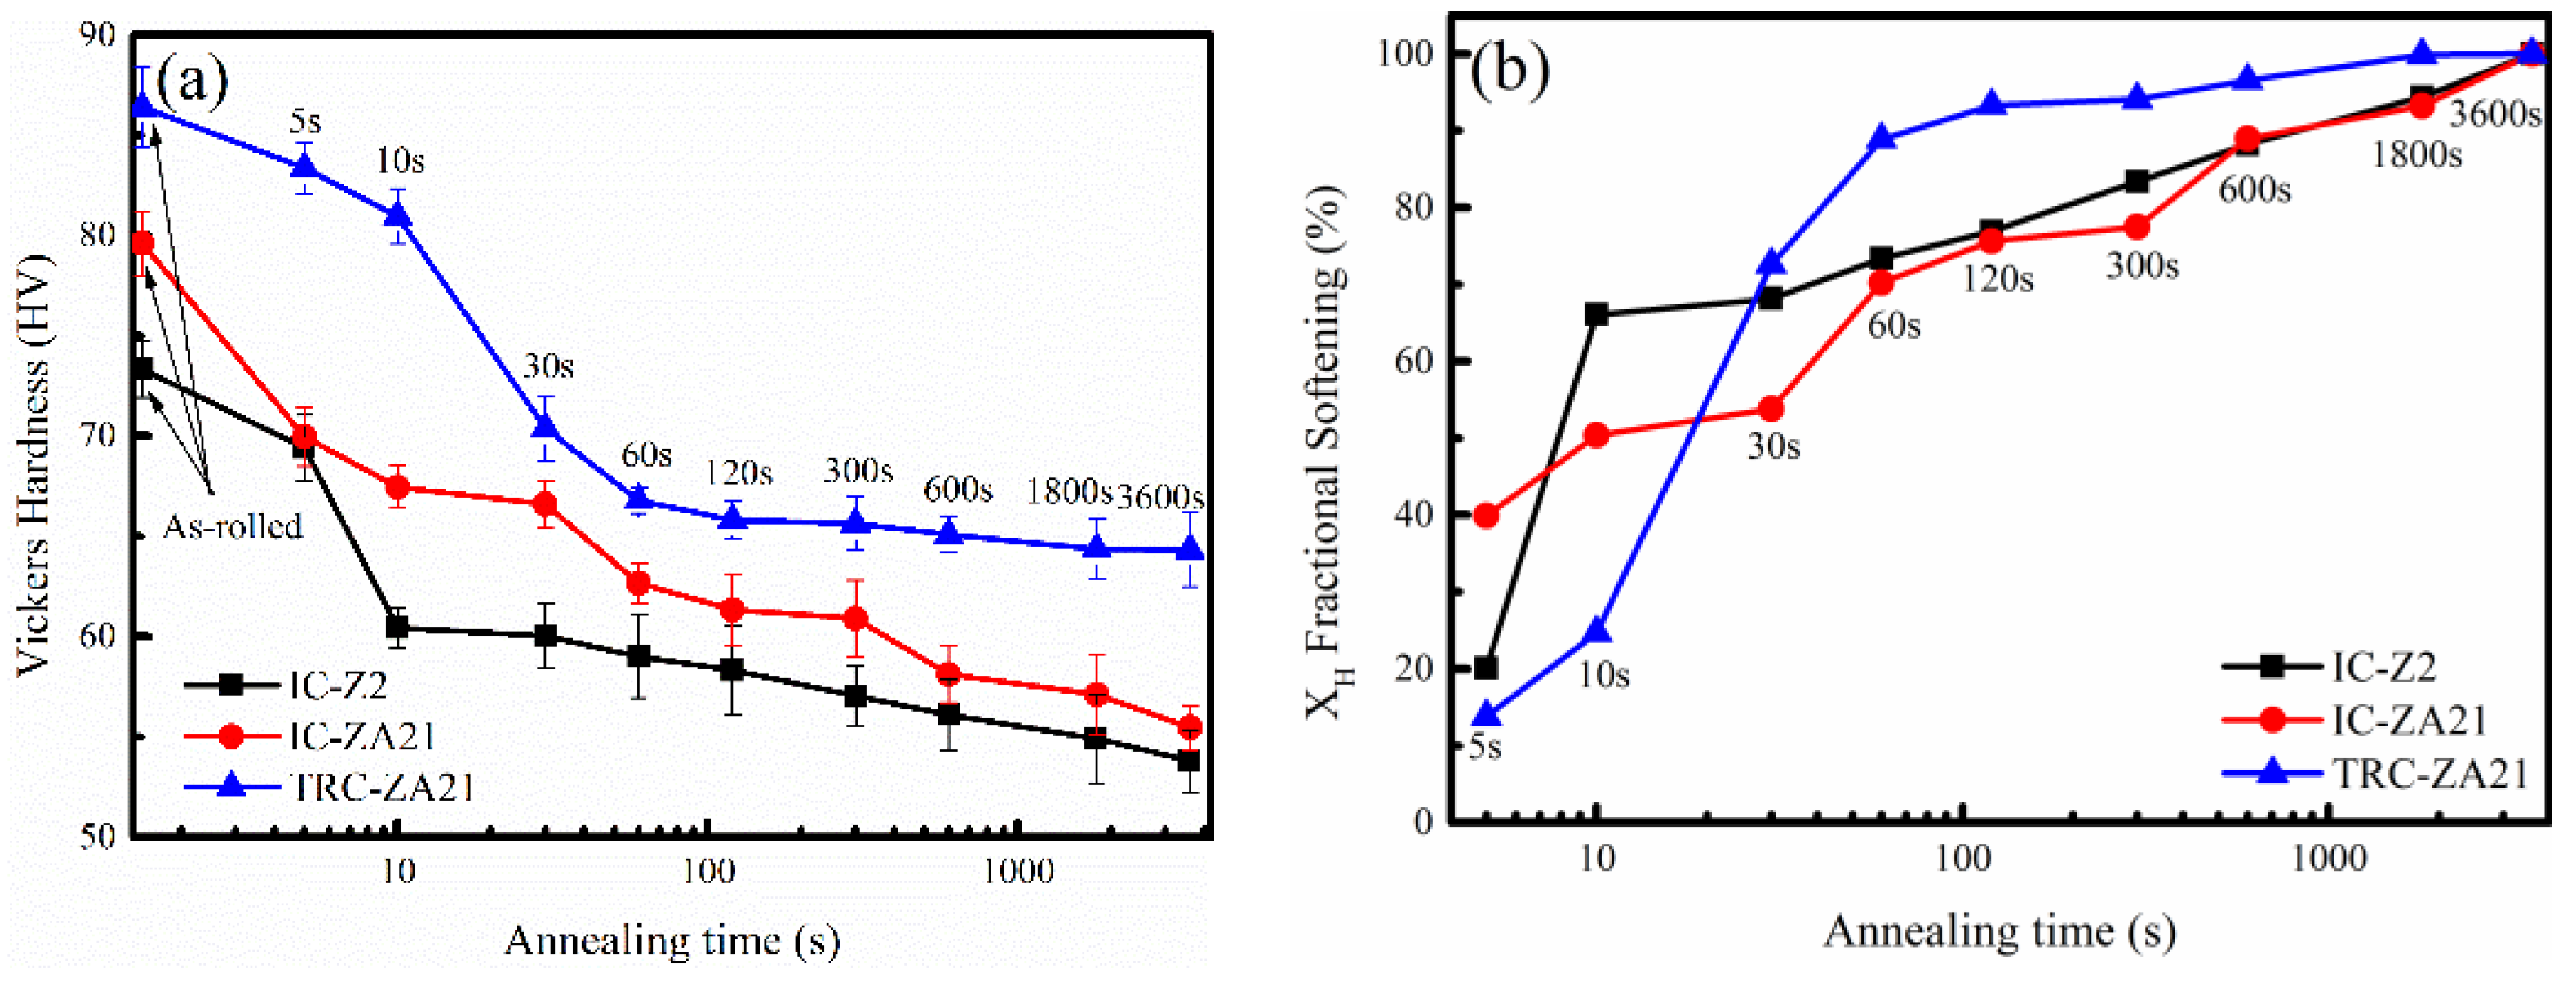
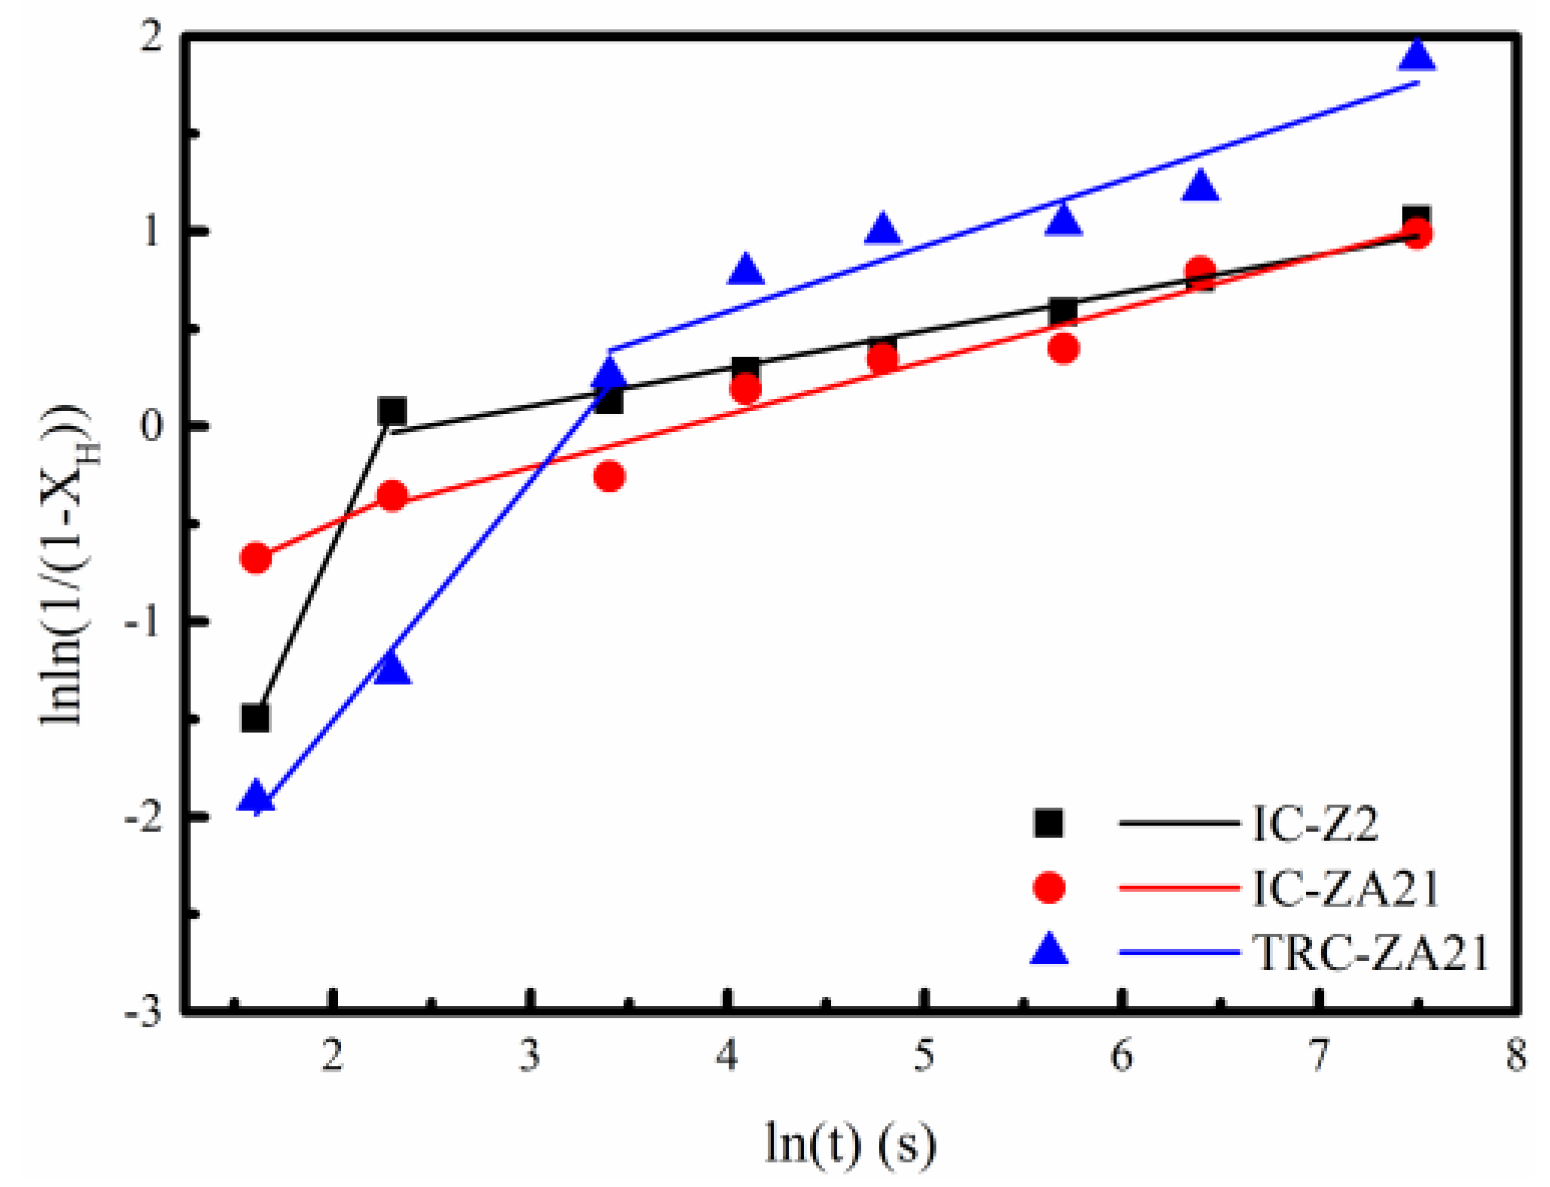
3.1. Softening Behavior during Annealing Treatment

The stored distortion energy produced by the hot rolling process was released by recovery and recrystallization mechanisms during annealing treatment at high temperature. At the same time, the transformation from deformed microstructure to recrystallization microstructure was also exhibited. The strength decreased with the SRX process. The SRX process included the nucleation and growth of recrystallization grains. The kinetics of the SRX process was generally analyzed using Johnson–Mehl–Avrami–Kolmogorov (JMAK) model, and the JMAK model was introduced as below [29,30,31]
X V = 1 exp ( 1 β t n )
where XV is the recrystallization fraction, β is the coefficient related to materials and annealing temperature, t is the annealing time, and n is the Avrami exponent.
Recrystallization grains formed by the SRX process, and the fractions of recrystallization grains gradually increased. The analysis of recrystallization fractions by microstructure characterization is too complicated, and artificial errors appeared frequently. However, the recrystallization process can be monitored by variations in Vickers hardness. The softening caused by recovery and/or recrystallization behavior can be explained in the form of fractional softening. At present, the study on the annealing behaviors using softening in hardness has been widely applied in some materials, such as AZ31 magnesium alloys and low-carbon steel [32,33].
The annealing behavior can be analyzed in the form of fractional softening in Vickers hardness and defined as below
X H = H 0 H i H 0 H r
where XH is the fractional softening in Vickers hardness, H0 is the initial hardness, Hi is the measured hardness during annealing process, Hr is the hardness in full recrystallization microstructure.
The variations in Vickers hardness of three experimental alloy sheets during salt bath annealing process were shown in Figure 1a, and corresponding fractional softening in hardness was plotted in Figure 1b. Vickers hardness of experimental alloy sheets exhibited continuous decrease during the annealing process. After 3600 s salt bath annealing treatment, the Vickers hardness in IC-Z2 magnesium alloy decreased from 73.3 HV to 53.8 HV. The Vickers hardness in IC-ZA21 alloy decreased from 79.6 HV to 55.5 HV, and the Vickers hardness in TRC-ZA21 alloy descended from 86.4 HV to 64.3 HV. The decreased ratios in IC-Z2, IC-ZA21 and TRC-ZA21 alloys were 26.6%, 30.3% and 25.5%, respectively. However, the decreasing rate of Vickers hardness exhibited difference among experimental alloy sheets. As Figure 1b shown, the fractional softening values of IC-Z2, IC-ZA21 and TRC-ZA21 alloys were 20.1%, 39.9% and 13.8%, when annealing time was 5 s. It indicated the degree of recrystallization in TRC-ZA21 alloy at the initial stage of annealing process was lower, compared with IC-Z2 and IC-ZA21 alloys. The fractional softening of TRC-ZA21 alloy increased significantly between the annealing time of 10 s and 30 s, the value rose from 24.7% to 72.6%. The decreased ratio in fractional softening of TRC-ZA21 alloy turned to gradual trend when annealing time reached 120 s. Subsequently, the decreased ratio in fractional softening of IC-Z2, IC-ZA21 and TRC-ZA21 alloys exhibited approximate linear behavior.
Avrami exponent (n-value) in the JMAK model was related to the grain nucleation mechanism and grain growth mode, equation of Equation (1) was transformed by natural logarithmic and presented as below
lnln ( 1 / ( 1 X V ) ) = ln β + n ln t
The recrystallization fraction (1/(1 − XV)) can be replaced by the form of fractional softening in hardness (1/(1 − XH)). The relationship between lnln(1/(1 − XH)) and lnt is plotted in Figure 2. The results revealed that fractional softening progress of experimental alloy sheets exhibited the characterization of two stages, with the help of two different Avrami exponents. The specific Avrami exponents are shown in Table 2; the value of n2 was obviously lower than n1, which illustrated the characterization of two stages presented during recrystallization process. High fractional softening in IC-ZA21 alloy was an exhibition at the initial stage of annealing process (the XH is 39.9% when annealing time was 5 s), and then the recrystallization behavior at the following stage was influenced. The difference between the n1 value and n2 value in the IC-ZA21 alloy was more inconspicuous than in other alloys. However, the process of softening in hardness in the IC-ZA21 alloy sheets exhibited essentially two stages. A similar softening behavior of two stages also existed in other metals, such as cold-rolled Ti, Cu and low-carbon steel, and the recrystallization phenomena were related to the heterogeneous nucleation of recrystallization grains [32]. In addition, the varied softening behavior is also attributed to the static recovery mechanism, which is the first process during annealing treatment. The dislocation density may significantly decrease, while the new nucleated recrystallized grains do not occur. The decreased density of dislocations can result in a reduced distortion degree of the magnesium matrix, and it is beneficial to softening the hardness of materials. When the static recovery process dominates the initial stage of annealing treatment, the two stages of softening behavior can show the transformation from static recovery to static recrystallization.
The close relationship is existence between Avrami exponent and grain nucleation mechanism, higher n-value indicated that a significant characterization of heterogeneous nucleation was possessed in materials. The obvious variation in the n-value of experimental alloys demonstrated that the nucleation of recrystallization grains was dominated by a heterogeneous nucleation mechanism. Grain boundary, shear band, deformation twinning and second-phase particles can act as preferential nucleation sites for recrystallization grains in deformed magnesium alloys [34,35,36]. Hot-rolled microstructures of experimental alloy sheets are shown in Figure 3; the rolling direction (RD) and transverse direction (TD) in the samples of Figure 3 are presented in Figure 3a. Different characterizations of second-phase particles are exhibited. A large amount of second phase particles with fine size and uniform distribution existed in the TRC-ZA21 alloy, which can be seen from the higher magnification in Figure 3d, and the amount of second-phase particles with coarse size was extremely limited. The EDS results of second-phase particles indicated that the main alloying elements in these particles contained Al, Mn. A certain content of Ca and Gd concentration was found in the second-phase particles due to the high affinity between Ca, Gd atoms and Al-Mn series compound in magnesium alloys [37,38]. The second-phase particles with a coarse size can be observed in IC-Z2 and IC-ZA21 alloys; further, the distribution of coarse particles in IC-ZA21 exhibited aggregation phenomenon. Moreover, second-phase particles with a fine size were also found in the IC-ZA21 alloy.
The relationship between second-phase particles and the SRX process is still controversial [39]. On the one hand, the movements of grain boundary and sub-grain boundary can be inhibited by the pinning effect from second phase particles, and the recrystallization behavior is restrained. According to the Zener pinning mechanism, the retarded effect of fine particles on recrystallization is determined by the average pinning force by dispersed particles [40].
On the other hand, second-phase particles are conducive to promoting the nucleation rate of recrystallization grains under the facilitation role in the formation of high-density dislocations and shear bands in the vicinity of the grain boundary and sub-grain boundary. The isolated particle with coarse size (d > 1 μm) can provide a nucleation site by the PSN mechanism [24]. Moreover, recrystallization behavior can be enhanced by the distribution of particles in close proximity. The cluster of fine particles can induce the activation of the PSN mechanism [41].
Second-phase particles of three experimental alloy sheets in Figure 3 can play the role of heterogeneous nucleation and result in recrystallization characterizations of two stages. At the same time, the difference in second-phase particles of experimental alloy sheets leads to different softening behaviors. The SRX process of the TRC-ZA21 alloy was blocked by the dispersed particle with a fine size. The coarse second-phase particles of IC-Z2 and IC-ZA21 alloys increased the nucleation of recrystallization grains, which led to more significant fractional softening in hardness at the initial stage of annealing treatment. In addition, aggregated distribution of second phase particles in IC-ZA21 alloys further boosted recrystallization behavior, which was contributed to the formation of high fractional softening in hardness with an annealing time of 5 s-39.9%. Under the effect of second-phase particles with fine size in the IC-ZA21 alloy, the growth rate of IC-ZA21 was lower than that of the IC-Z2 alloy. Hence, the fractional softening of the IC-Z2-10s alloy was higher than that of the IC-ZA21-10s alloy. This indicated that the characterization of second-phase particles, including size, distribution and density, had a significant effect on the SRX process.

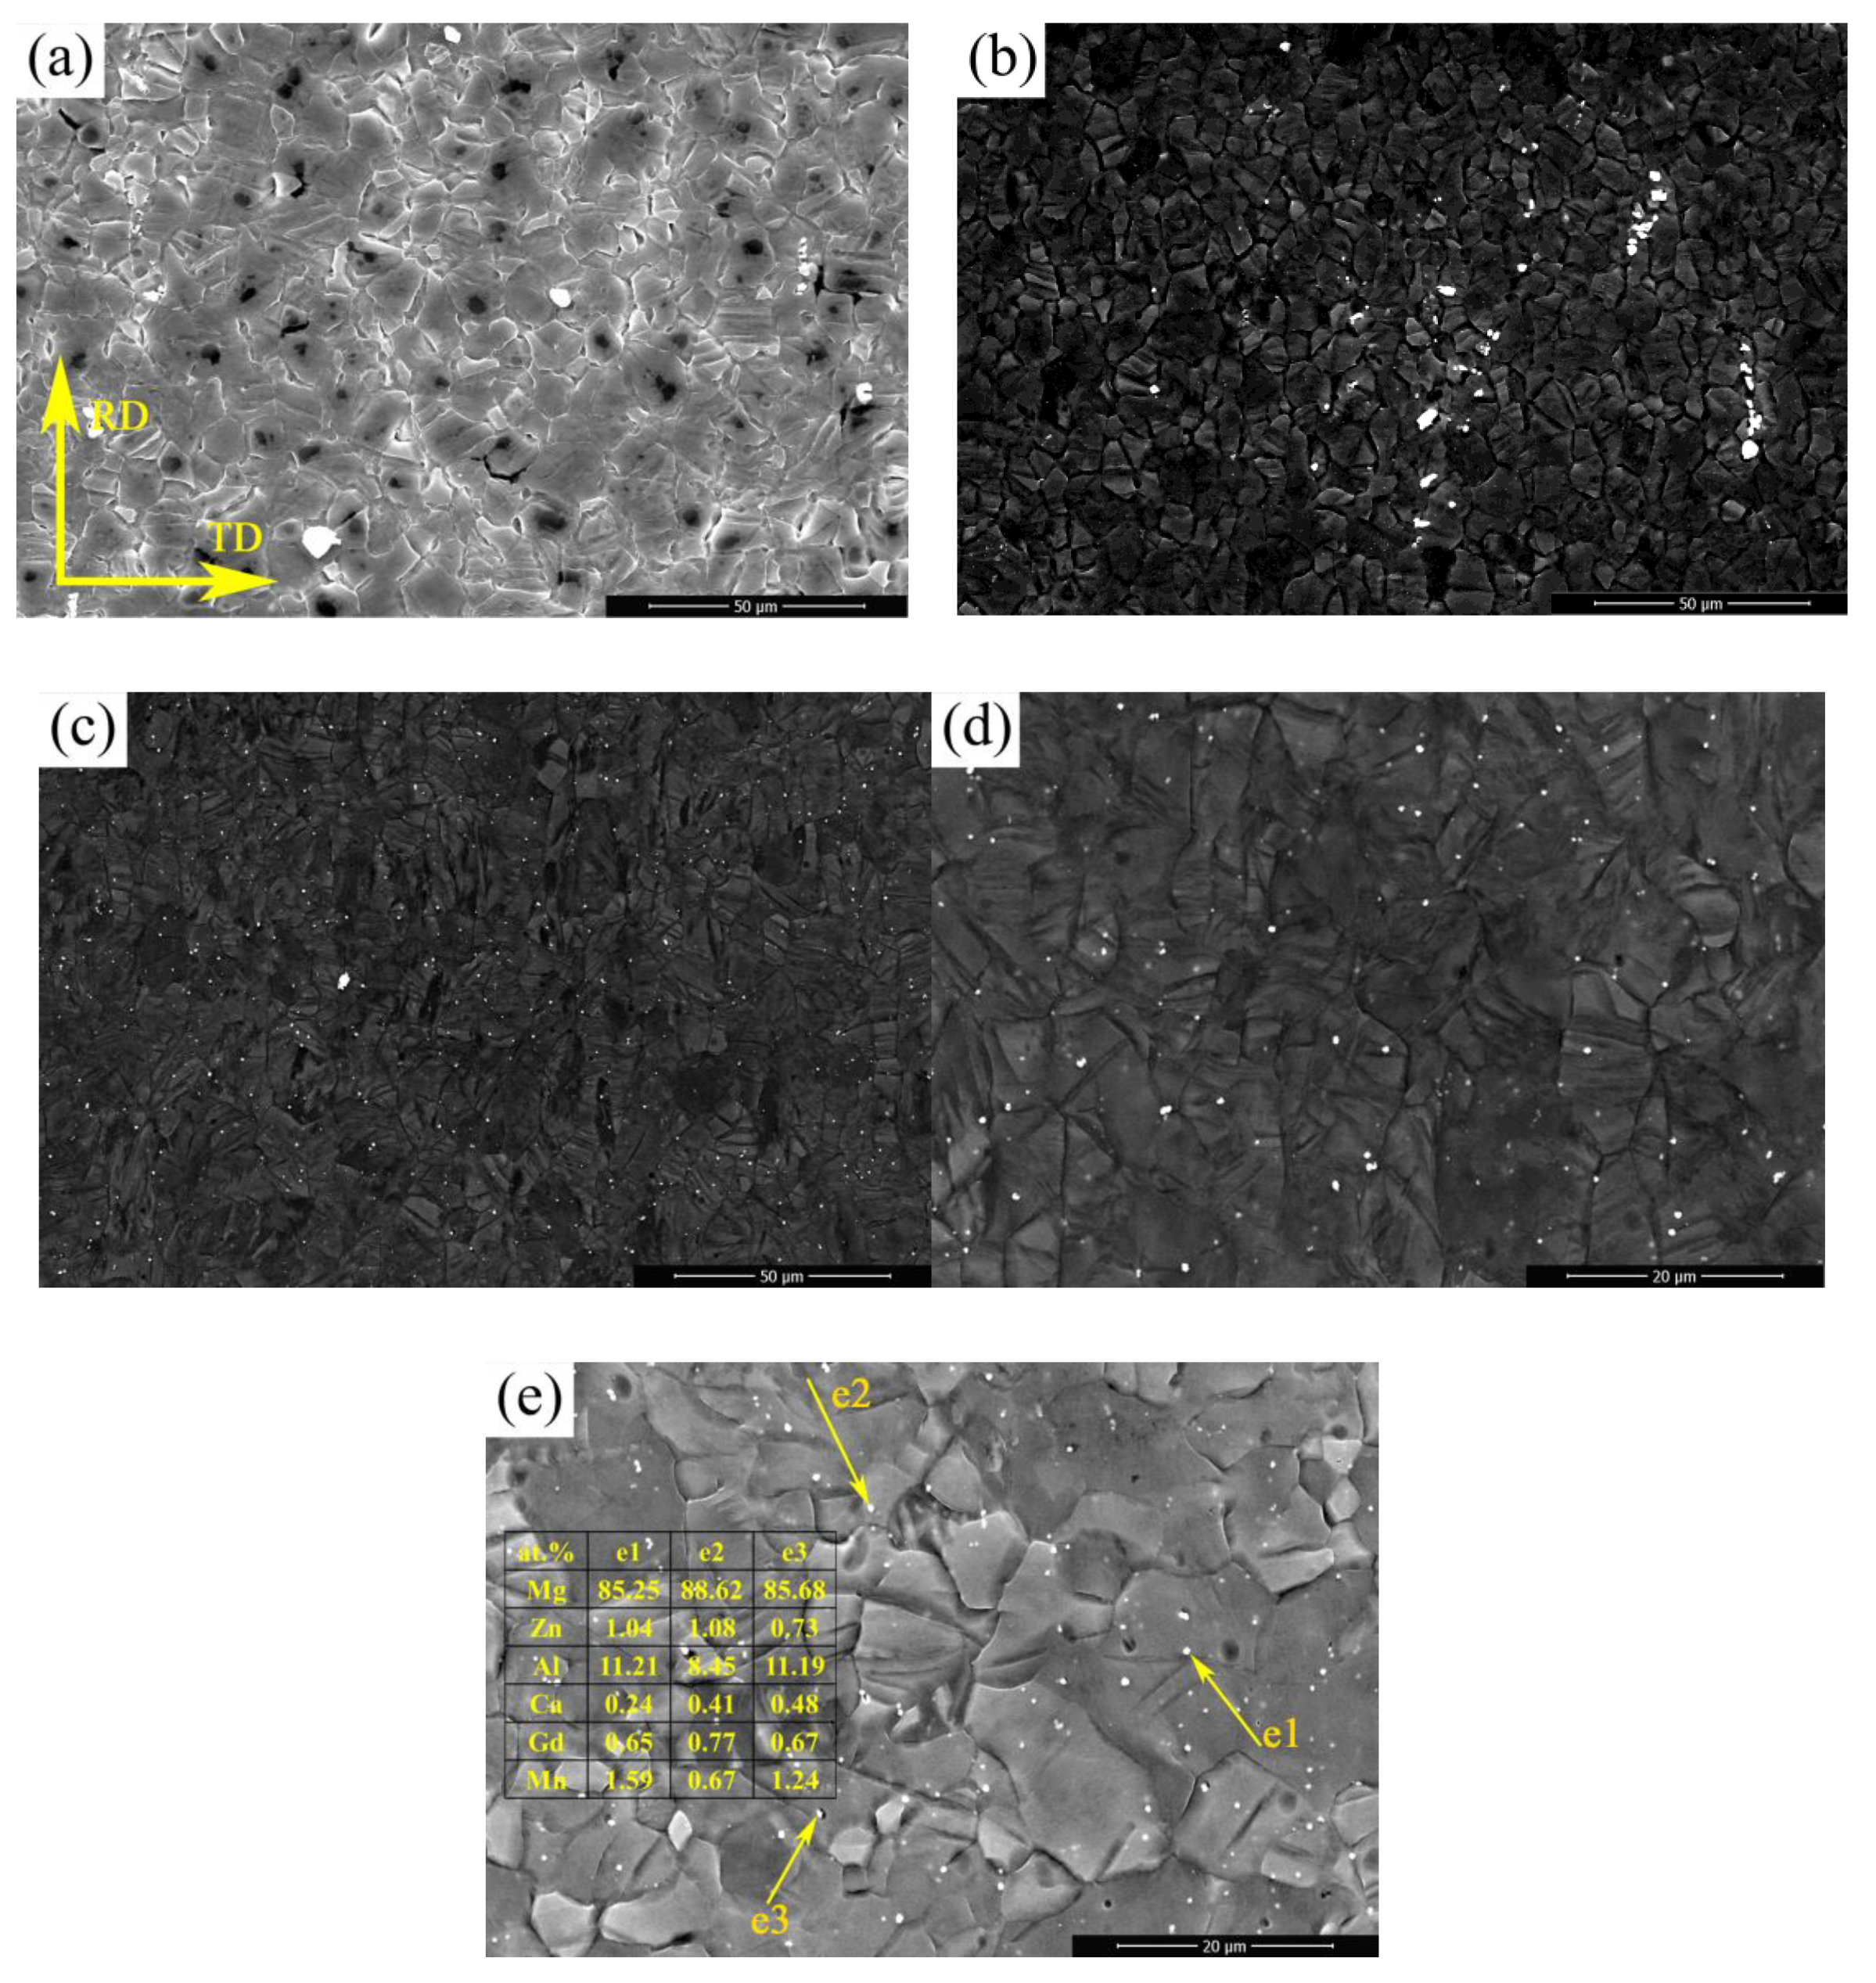
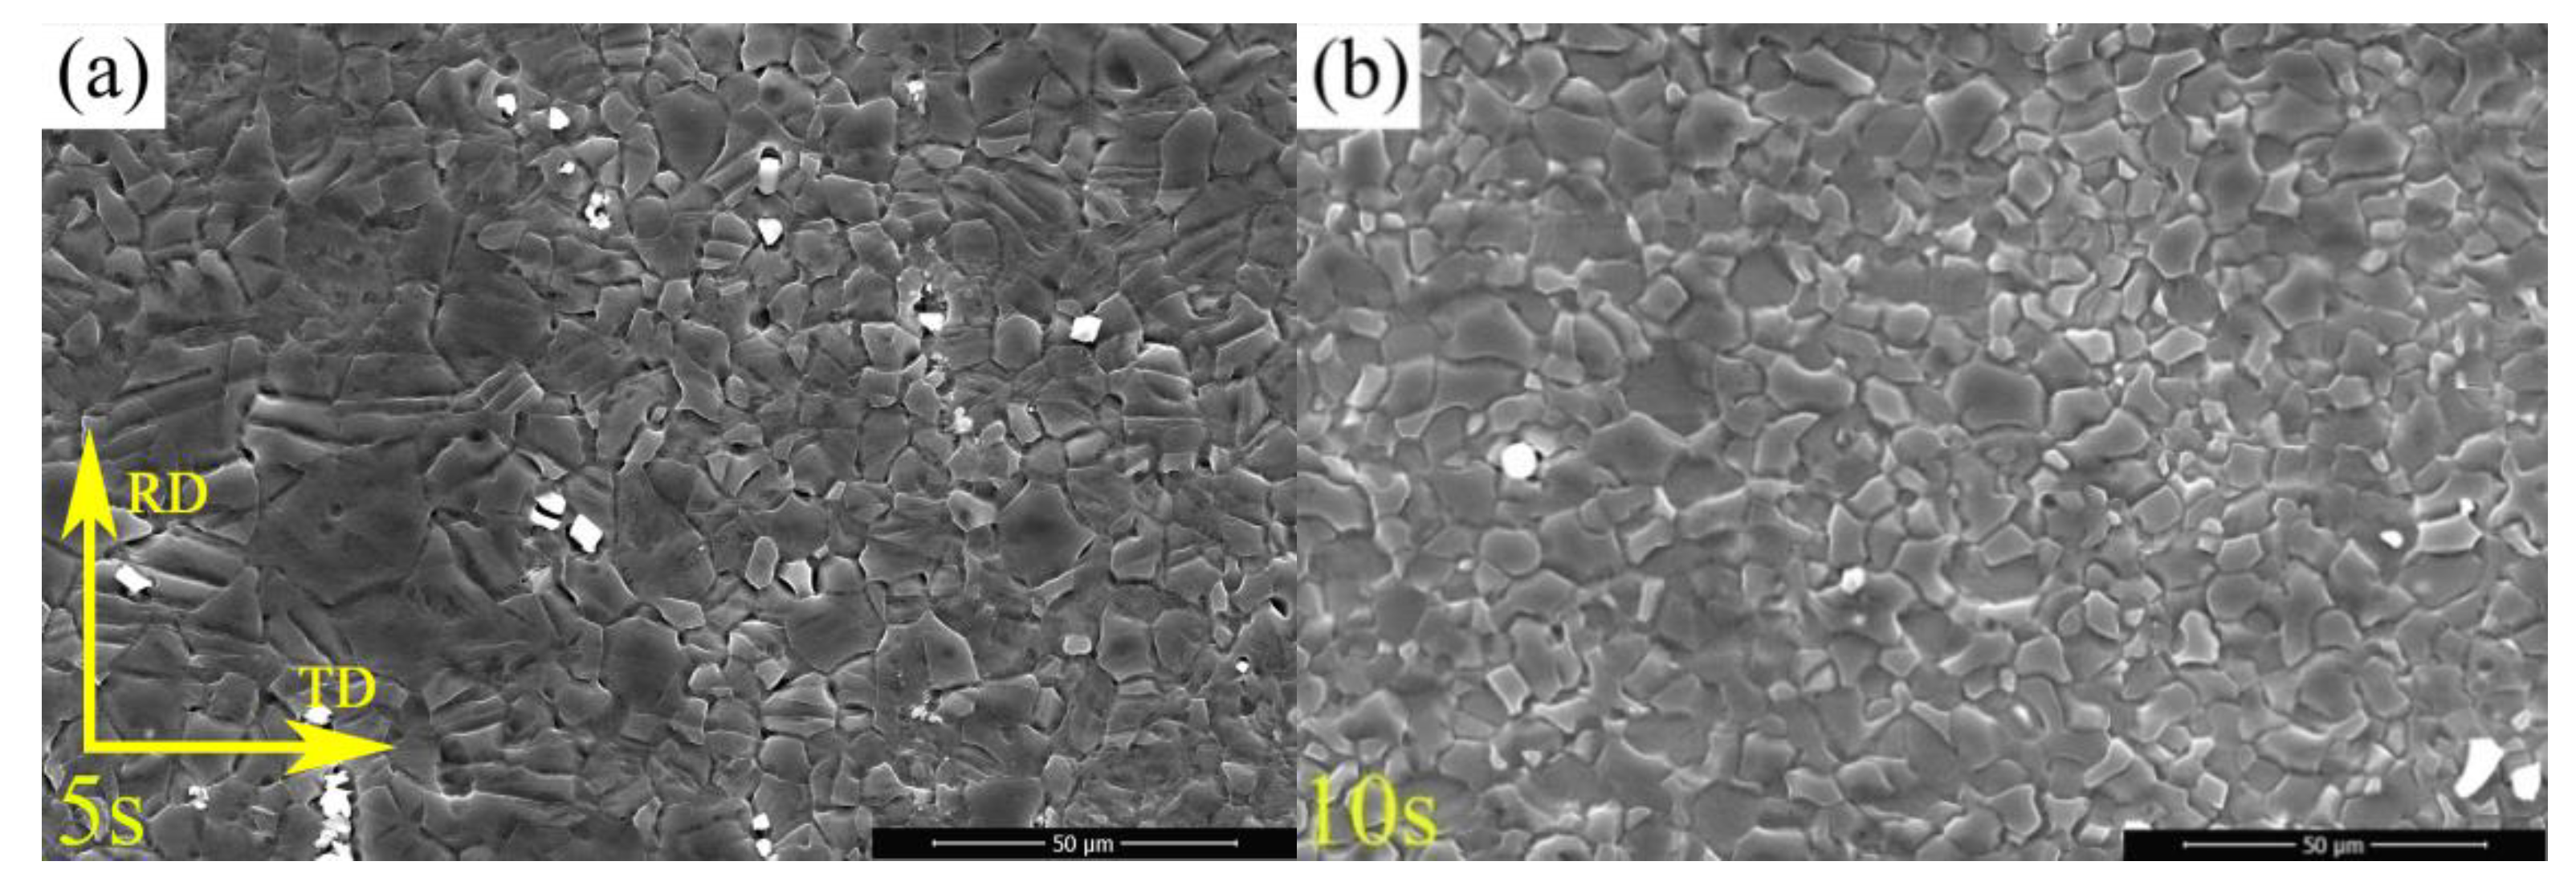
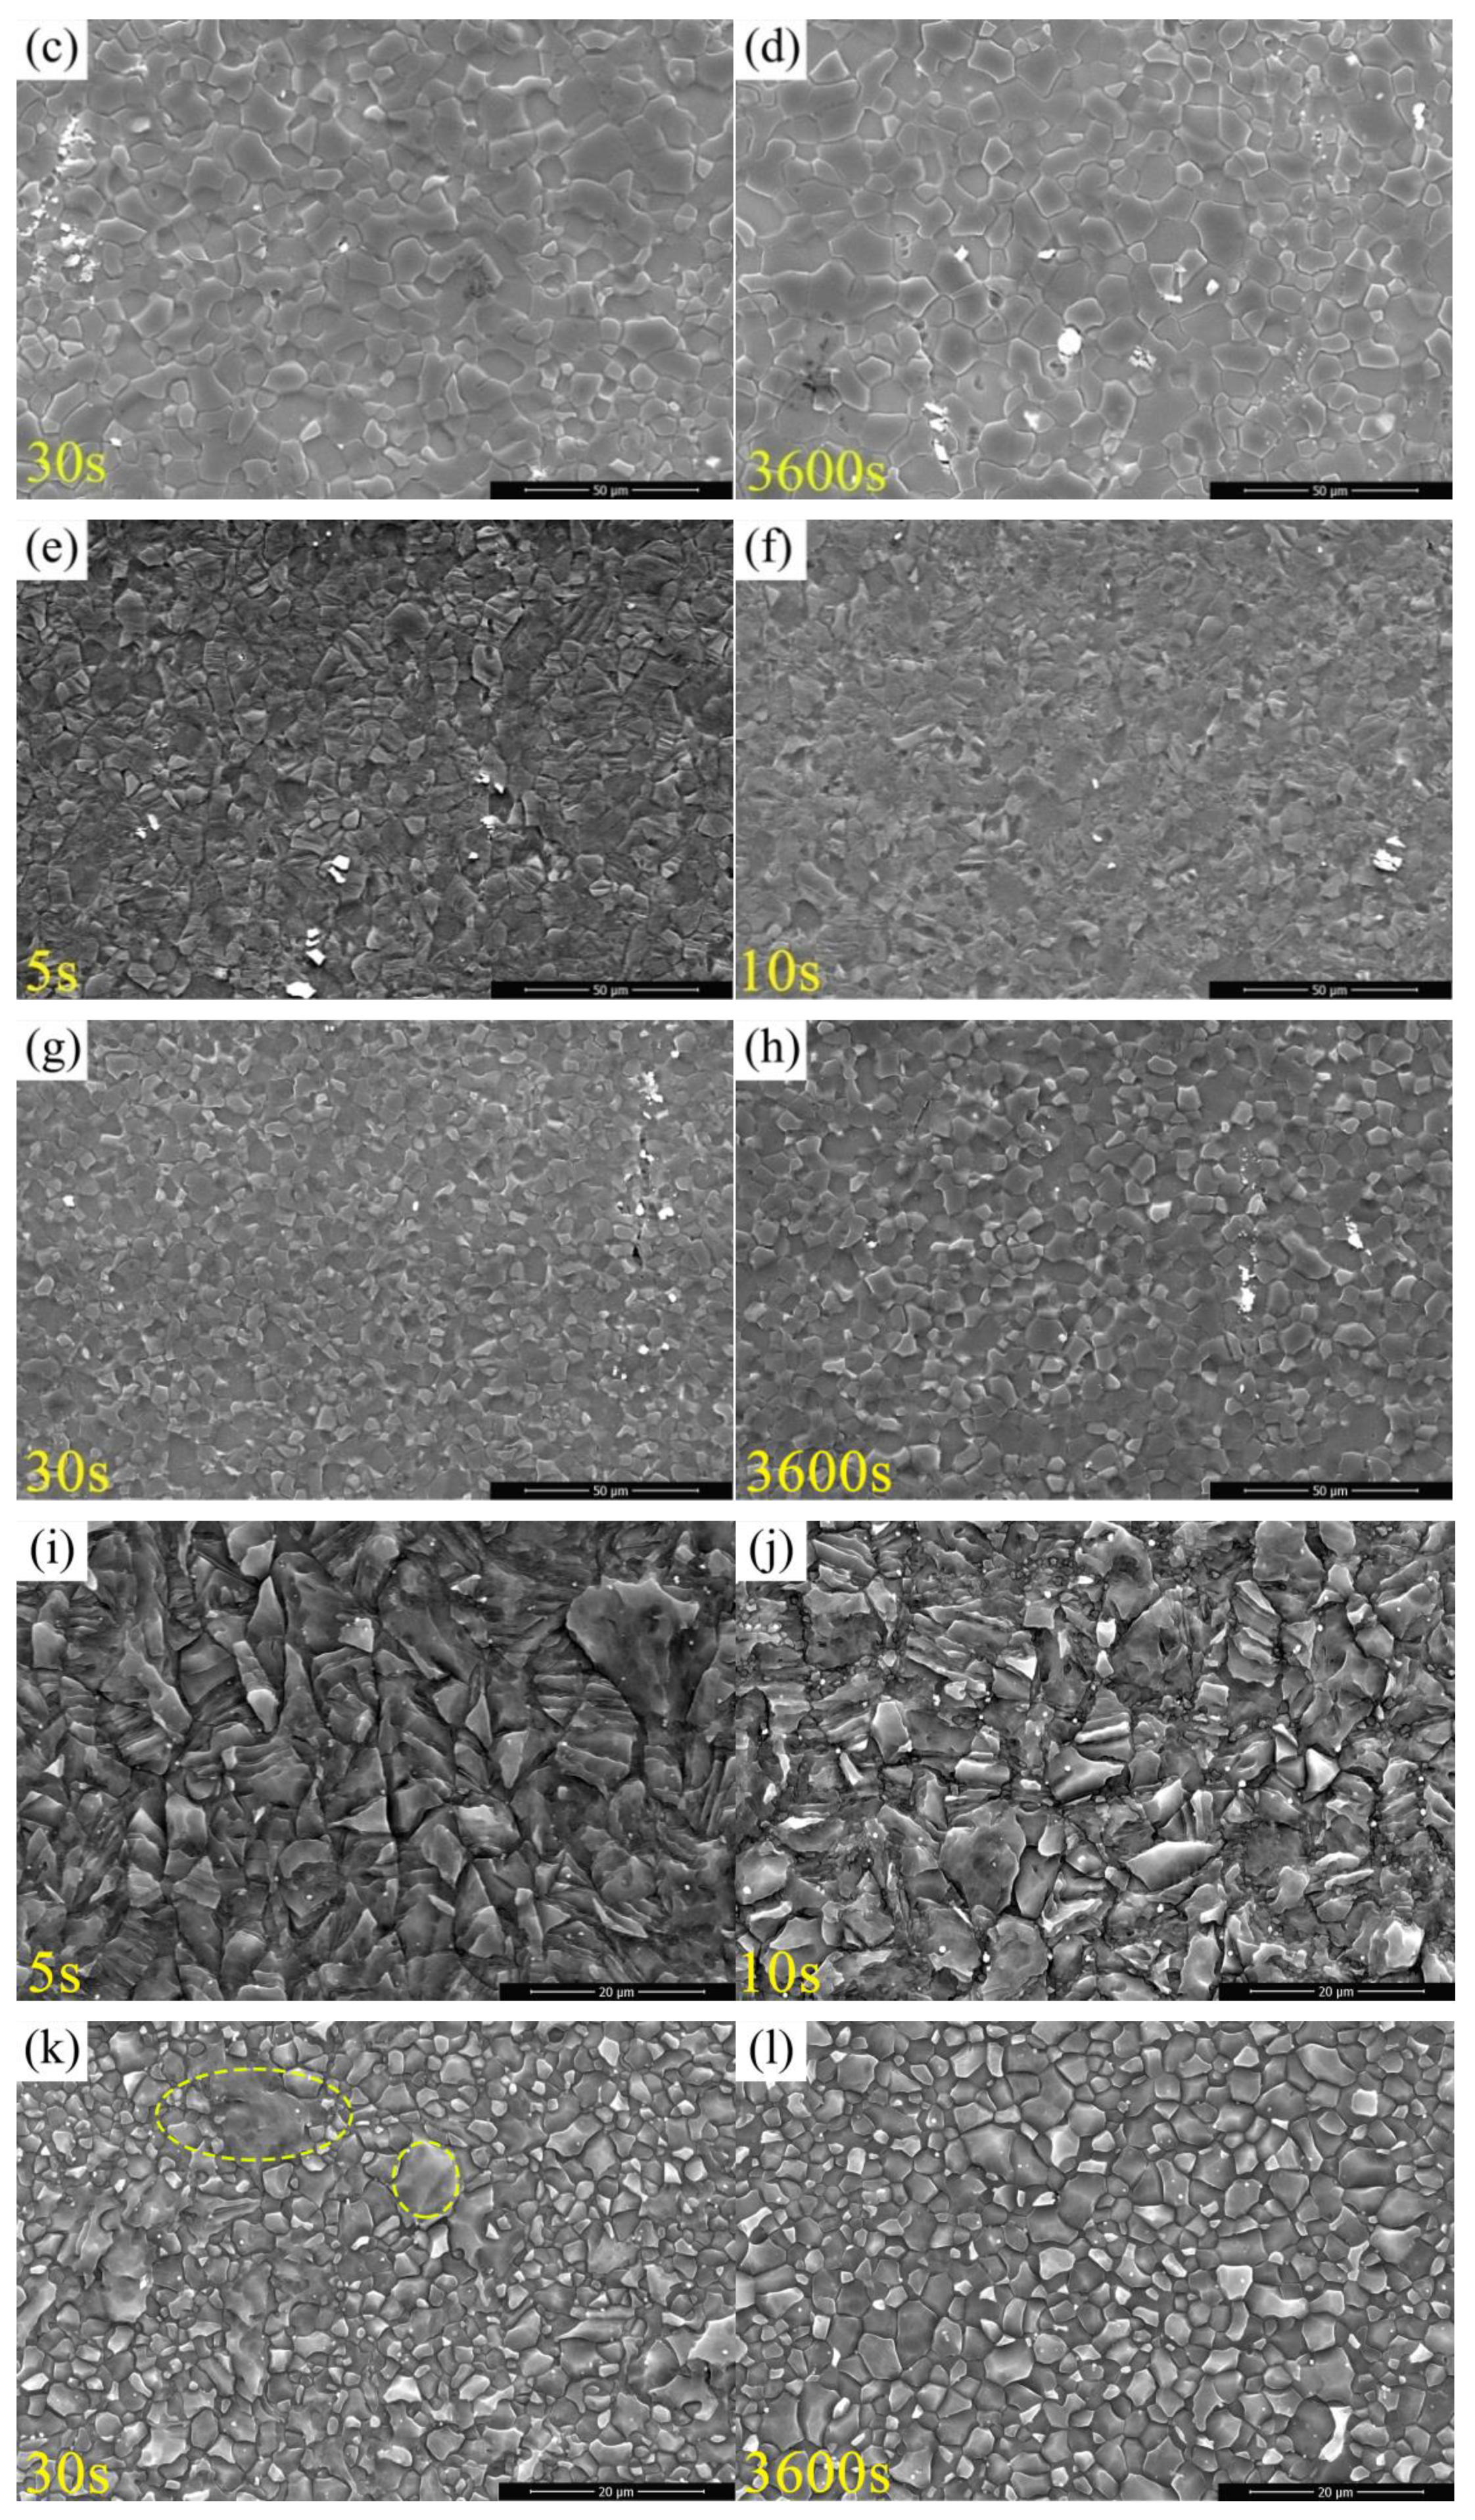
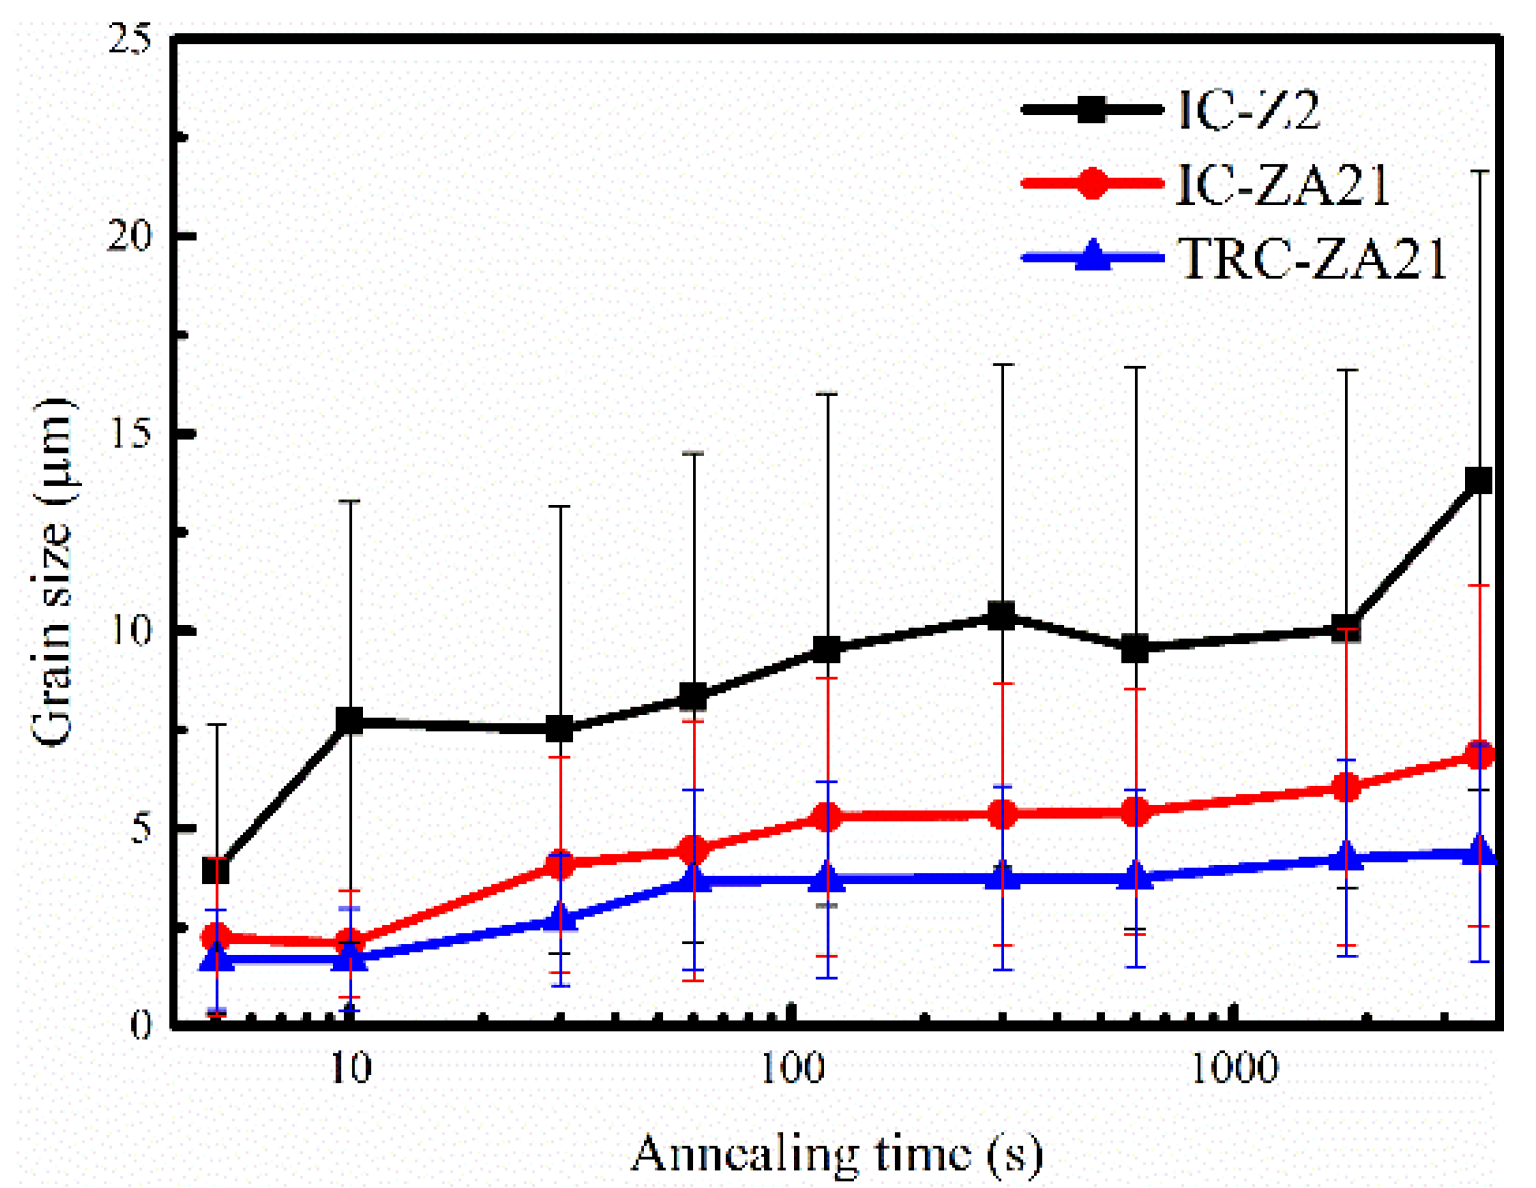
3.2. Evolution of Microstructural Morphology

The SRX behavior includes the nucleation and growth of recrystallized grains. The nucleation mechanism governs SRX behavior at the initial stage of the annealing process. The growth of recrystallized grains turns to dominant after SRX lasts for a period of time. The microstructure evolution of experimental alloy sheets during annealing treatment is shown in Figure 4, the rolling direction (RD) and transverse direction (TD) in the samples of Figure 4 are presented in Figure 4a. The microstructural morphologies at annealing time of 5, 10, 30, and 3600 s are displayed. On the whole, the microstructure evolutions of experimental alloy sheets during the annealing process exhibited similar characterization. A large amount of deformed grains were maintained in microstructure at the initial annealing process. Accompanied by the activation of dynamic recrystallization in hot-rolling process, few equiaxed grains existed. The deformed grains were consumed with the progress of annealing treatment. When the salt bath annealing process lasted 3600 s, the microstructures of the three alloys comprised of equiaxed grains released their stored energies induced by the rolling process. However, the trends of microstructure evolution presented distinctly. As Figure 4a,e,i shows, the fractions of equiaxed grains in IC-Z2 and IC-ZA21 alloys were much higher than in the TRC-ZA21 alloy, when the annealing time was 5 s. Deformed grains in the TRC-ZA21 alloy still occupied a dominant proportion. When the annealing time reached 10 s, equiaxed grains in IC-Z2-10s alloy became the dominant fractions (Figure 4b), and the contents of equiaxed grains in IC-ZA21-10s and TRC-ZA21-10s alloys increased slightly (Figure 4f,j). As Figure 4c,g shows, the transformation of recrystallized grains in IC-Z2 and IC-ZA21 alloys was basically accomplished under the annealing time of 30 s. The fraction of equiaxed grains in TRC-ZA21 also increased significantly, however, some deformed grains were observed by the encircled yellow arc in Figure 4k. As Figure 4d,h,l shows, the microstructures of the experimental alloys were formed by equiaxed grains when the annealing treatment was completed. The SRX behavior in the TRC-ZA21 alloy was limited at the initial stage of the annealing process. The degree of recrystallization in IC-Z2 alloy was higher than that in the IC-ZA21 alloy when the annealing time was 10 s. This indicated that the evolution behavior of the microstructure was consistent with variations in fractional softening.
After hot-rolling process, a large amount of internal stress stored, which increased the level of distortion. Moreover, the SRX process was accelerated under the effect of the driving force from stored energy. The EBSD microstructure characterizations of IC-Z2, IC-ZA21 and TRC-ZA21 alloy sheets were exhibited in Figure 5 at the initial stage in the annealing process of 5 s. The rolling direction (RD) and transverse direction (TD) in the samples of Figure 5 were presented in Figure 5a. The microstructure information included inverse pole figure (IPF), kernel average misorientation (KAM), grain boundary figures and the distribution of misorientation angles. The IPF (top left) showed the crystallographic directions to be parallel to the normal direction of the sheet. The KAM (top right) displayed the misorientation profile of the grains by calculating the misorientation of neighboring pixels. The grain boundary figures (bottom left) exhibited the grain boundaries and special boundaries with different colors in the microstructure, including 2–15° low-angle grain boundaries (LAGB) and >15° high-angle grain boundaries (HAGB). Moreover, the colors blue, green, yellow and red lines in grain boundary images denoted {10 1 ¯ 2} tensile twinning, {10 1 ¯ 1} compression twinning, {10 1 ¯ 3} compression twinning and {10 1 ¯ 1}-{10 1 ¯ 2} secondary twinning according to the special misorientation angle. The distribution of misorientation angles (bottom right) presented the misorientation date between neighboring points in the microstructure from the EBSD data. The black areas in microstructure were related to unindexed during EBSD detection due to the local stress concentration of stored energy. The colors in IPF revealed that the majority of grains in experimental alloys exhibited red, belonging to basal orientation. Meanwhile, variations in colors in some grains can be observed in IPF figures, which indicated that high-misorientation existed. The KAM figures proved the appearance of high-misorientation due to high distortion energy. Abundant low-angle grain boundaries (LAGBs) and few tensile-twinning boundaries presented in grain boundary figures. The fractions of {10 1 ¯ 2} tensile twinning in IC-Z2, IC-ZA21 and TRC-ZA21 alloys were 1.9, 1.8 and 3.8%, respectively. Two obvious peaks existed in the distribution of misorientation angles, at around 5° and 86°. Obviously, the peak at the low misorientation angle was related to LAGBs, and {10 1 ¯ 2} tensile twinning resulted in another peak at around 86°. At the same time, {10 1 ¯ 1} compression twinning, {10 1 ¯ 3} compression twinning and {10 1 ¯ 1}-{10 1 ¯ 2} secondary twinning were scarce in grain boundary figures. Hence, the distribution of misorientation angles around 38°, 56° and 64° resulted in low fractions. By the severe plastic deformation, compression twinning and secondary twinning were formed in the vicinity of the inhomogeneous deformation area or local deformation area. High deformation stored energy was a characterization of compression twinning and secondary twinning [42,43,44]. The interface of tensile twinning was instable and mobile. Tensile twinning boundary can propagate easily and release internal stress, which is a disadvantage to stress concentration and dislocation accumulation [44,45,46]. Compared with tensile twinning, compression twinning and secondary twinning were more effective nucleation sites for recrystallization due to high stored energy [47,48]. In addition, the high stored energies in compression twinning and secondary twinning may make related areas unrecognizable. Therefore, the fractions of compression twinning and secondary twinning at the initial stage of the SRX process were low.
As IPF figures in Figure 5 shown, changes in grain orientation were found in the interior of some grains. For monitoring the variation in crystal distortion during the annealing process, the local enlarged IPF figures of TRC-ZA21 alloy at different annealing times were derived from corresponding EBSD-IPF maps and shown in Figure 6a,b; the rolling direction (RD) and transverse direction (TD) in the samples of Figure 6a,b are presented in Figure 6a. An annealing time of 10 s corresponded to the initial stage of annealing treatment (Figure 6a), and an annealing time of 3600 s was the later period. At the initial stage of annealing treatment, significant variations in colors in small grains were easily found, and orientation gradient was formed. As Figure 6c shows, the misorientation angle between point A and point B was 24.3°. Large orientation gradient formed in microstructure at the initial stage was attributed to lattice rotation by rolling pressure [49]. In addition, the accumulations of deformation and dislocation in the interior of the same grains were inhomogeneous. LAGBs were formed by the rearrangement and merging of cumulative dislocations [50]. Therefore, high KAM values were formed under the effect of high misorientation in grains. The orientation gradient was eliminated with the formation of recrystallized grains. The misorientation between point C and point D in Figure 6d was less than 1°.
Under the effect of annealing process, internal stress was released by recovery and recrystallization mechanism, and the distortion degree of microstructure decreased. The relationship between KAM values in experimental alloy sheets and annealing time was plotted in Figure 7a. The average KAM values in experimental alloys decreased from 1.7 at the initial stage to 0.25~0.35 with the annealing treatment. Moreover, the average KAM value in TRC-ZA21 alloy was higher than that in IC-Z2 and IC-ZA21 alloys at the initial stage of annealing process. KAM value indicated local misorientation degree determined by density of geometrically necessary dislocation (GND) [51]. Higher KAM value illustrated that higher density of GND existed in microstructure, and pointed out higher residual stress. It also revealed that the SRX behavior in TRC-ZA21 alloy was limited at the initial stage of the annealing process.
Grain orientation spread (GOS) was obtained by the calculated average misorientation of pixel points in grains to analyze plastic strain in the EBSD system [52]. The GOS was higher in deformed grains due to the occurrence of distortion, and recrystallization grains without distortion exhibited a lower GOS [53]. As Figure 4k shows, obvious grains with coarse size were found in TRC-ZA21 microstructure under an annealing time of 30 s, and the relationship between grain size and GOS is depicted in Figure 7b. For comparison, the grain size and GOS values of individual grains in TRC-ZA21 alloy after 3600 s annealing treatment are shown in Figure 7c. Intuitively, the average GOS value in the TRC-ZA21-30s alloy was higher than that in the TRC-ZA21-3600s alloy; the specific GOS values were 1.99° and 0.75°, respectively. The related GOS values of different grain sizes are exhibited in Figure 7d,e. With decreasing grain size, GOS a presented reduced trend, especially for the grains whose GOS value of lower than 0.5° belonged to a fine grain size. The variations in GOS values with annealing times of 30 and 3600 s in the TRC-ZA21 alloy demonstrated that salt bath annealing treatment had the potential to release deformation stored energy. The energy releasing efficiency in the TRC-ZA21 alloy was lower than that in the IC-Z2 and IC-ZA21 alloys due to the restricted SRX behavior, and it also led to higher KAM values in the TRC-ZA21 alloy at the initial stage of annealing treatment.

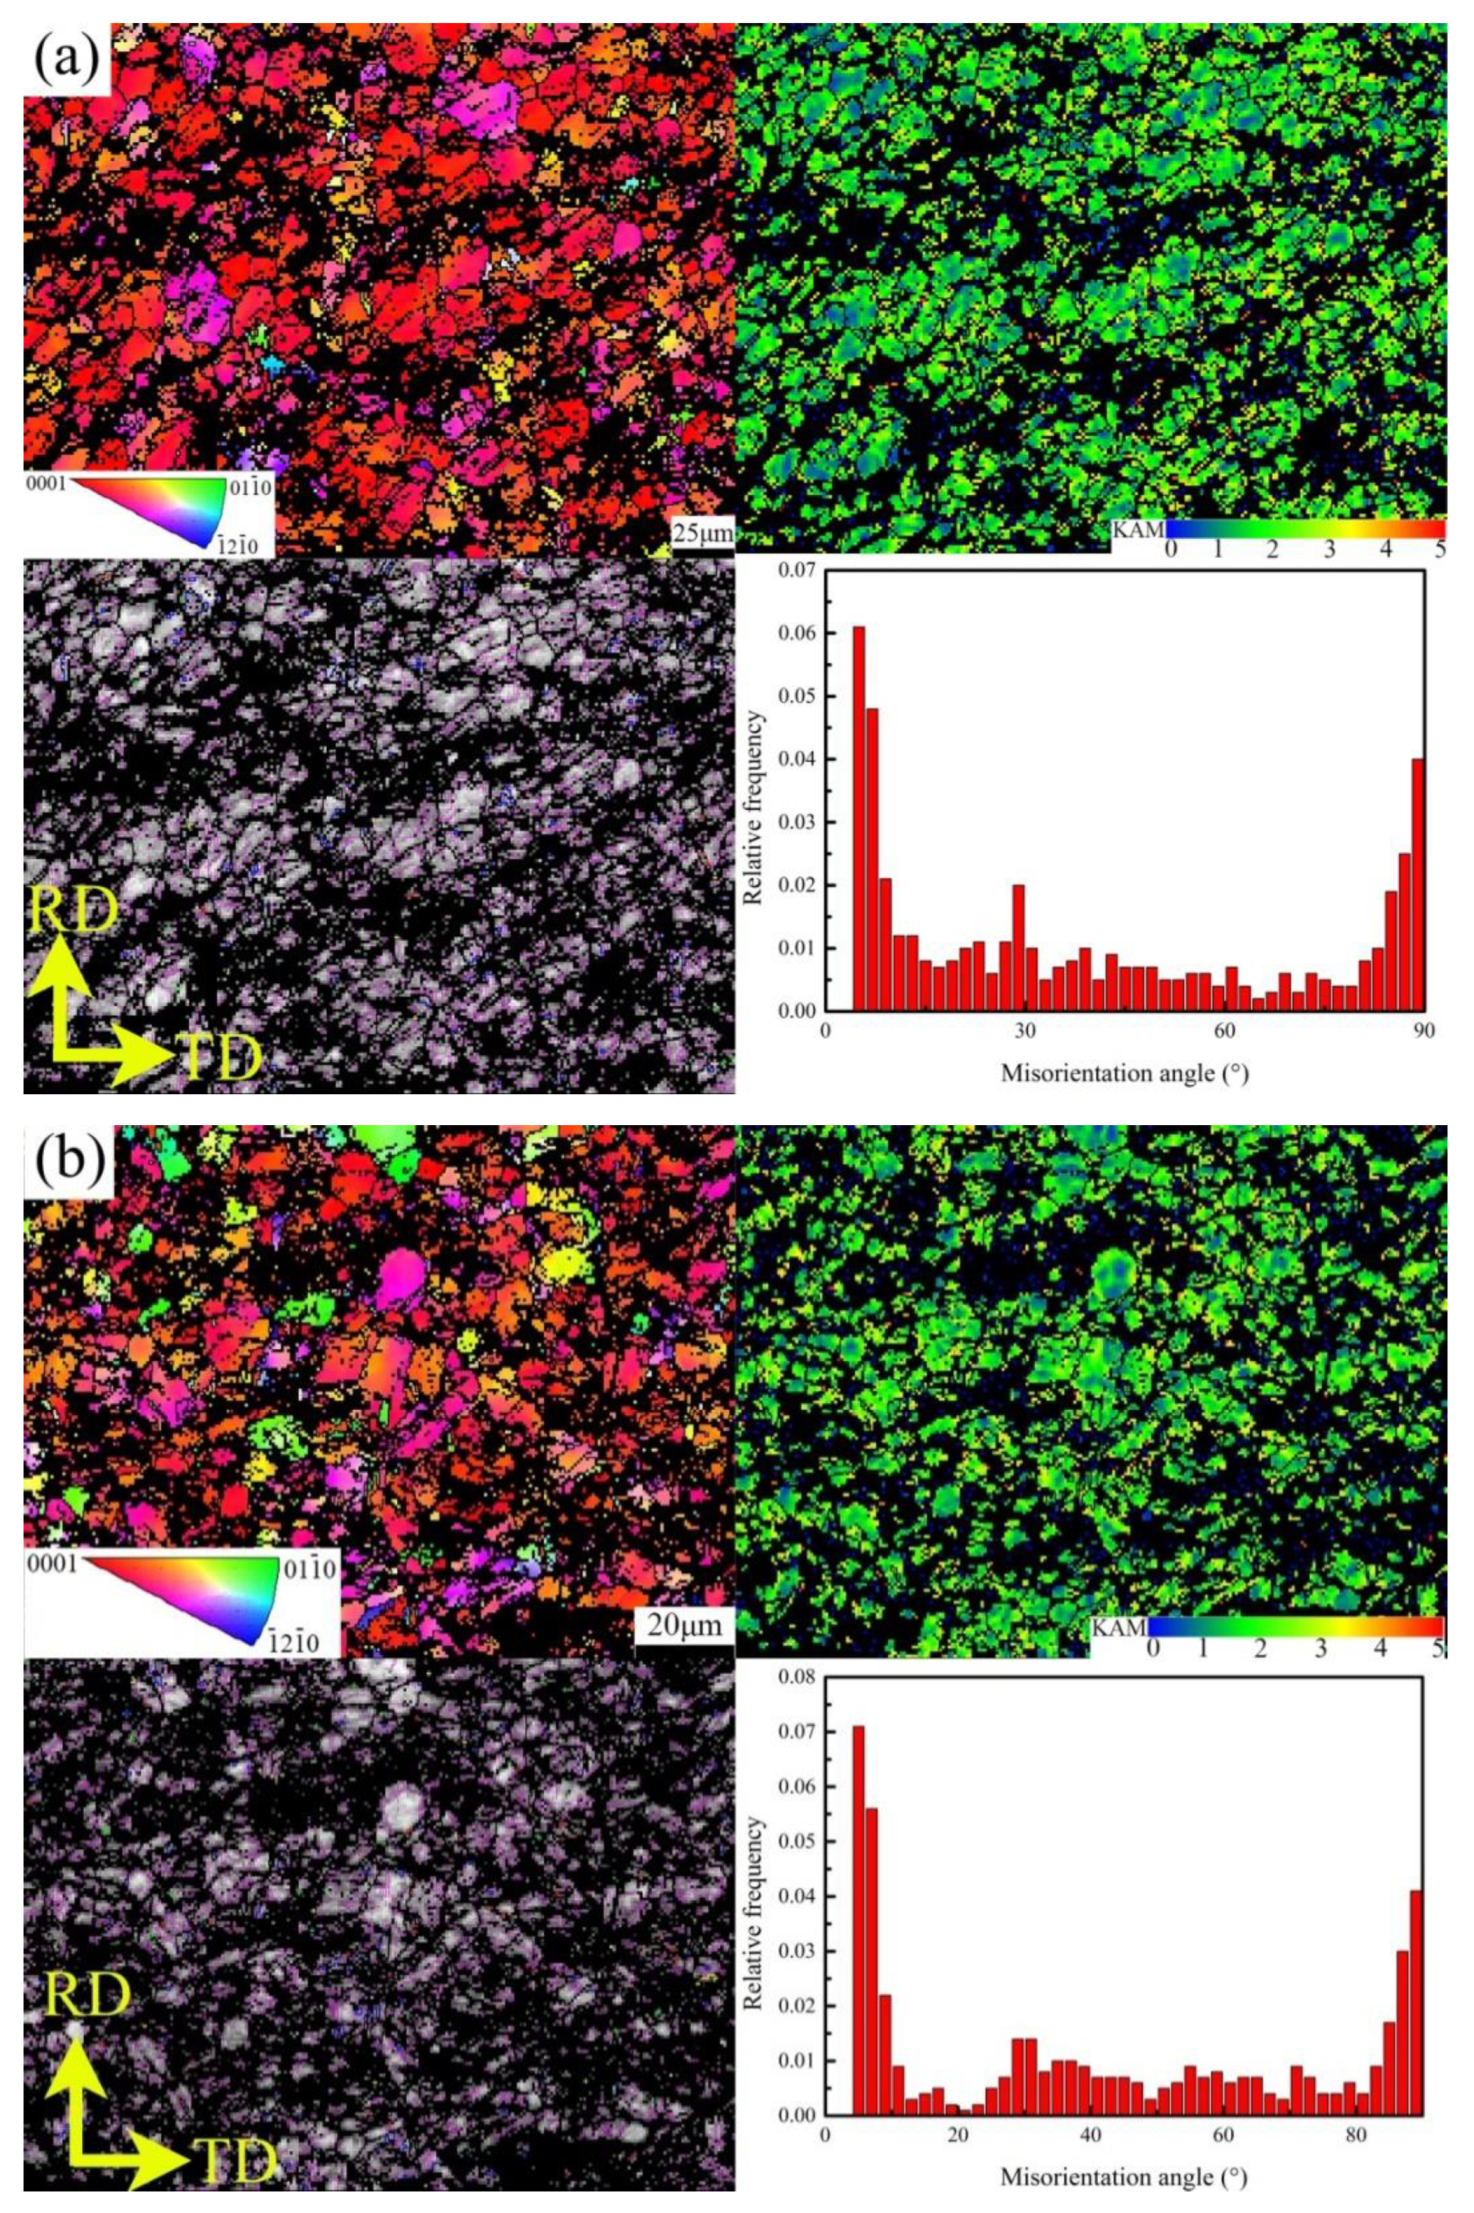
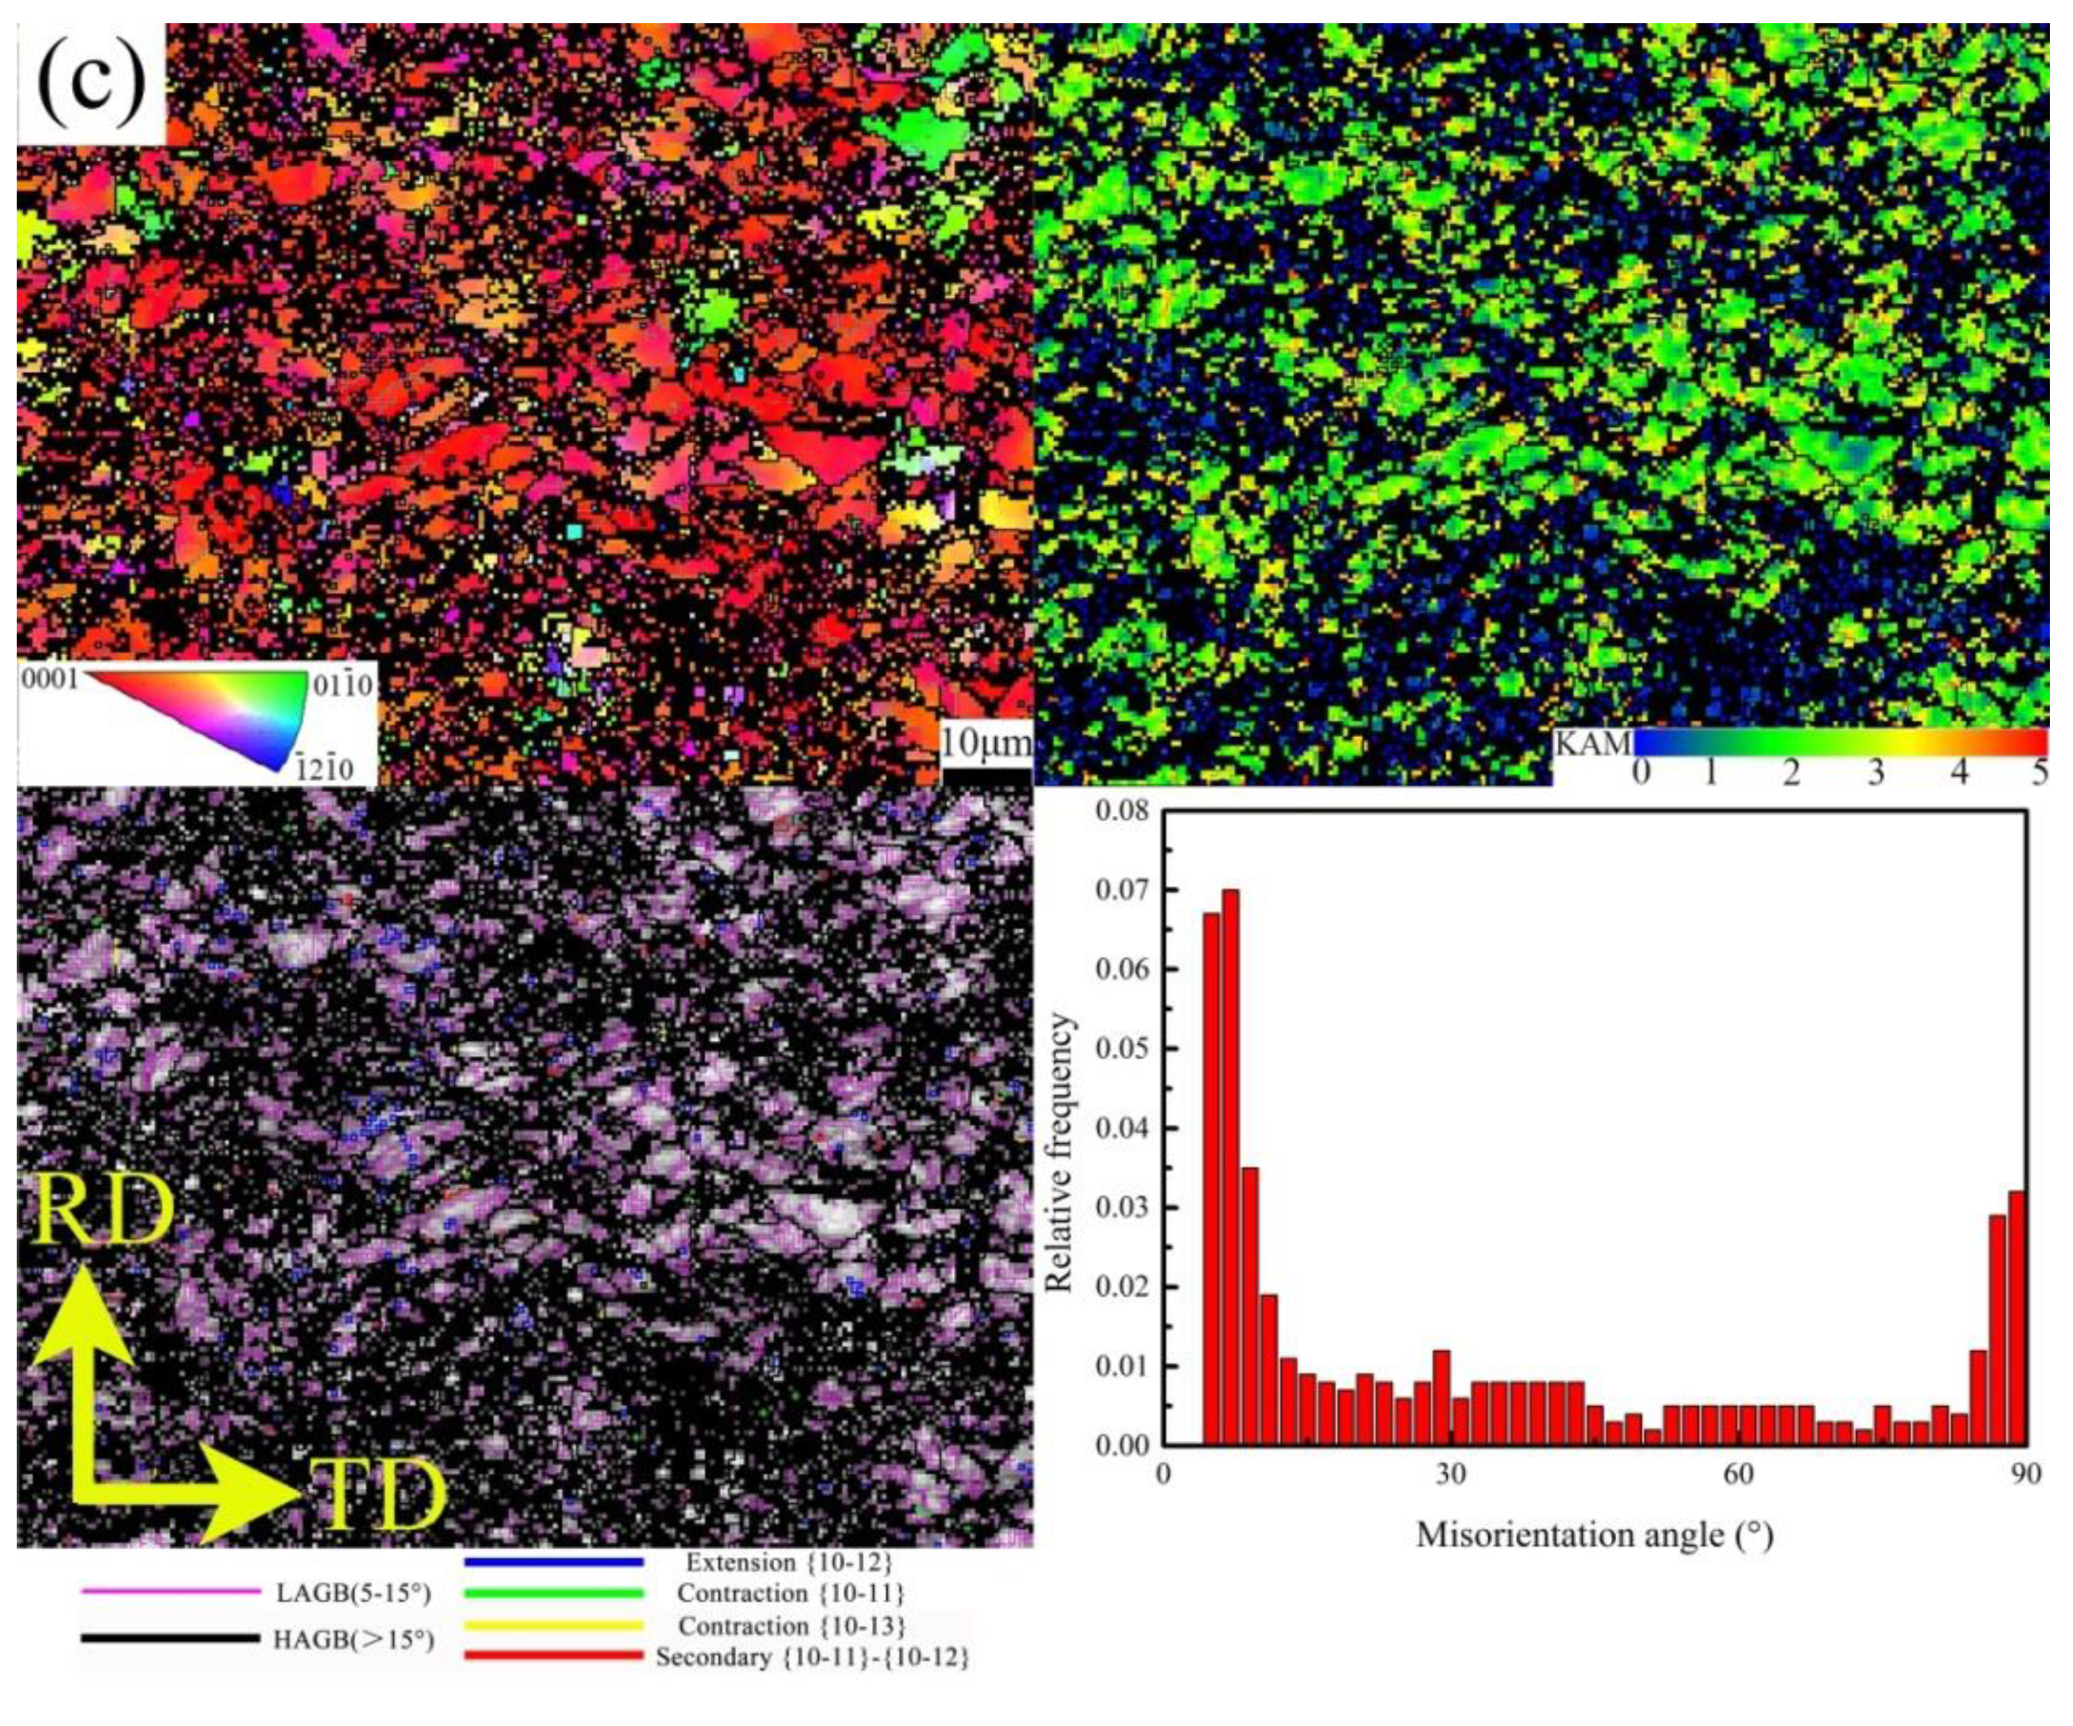
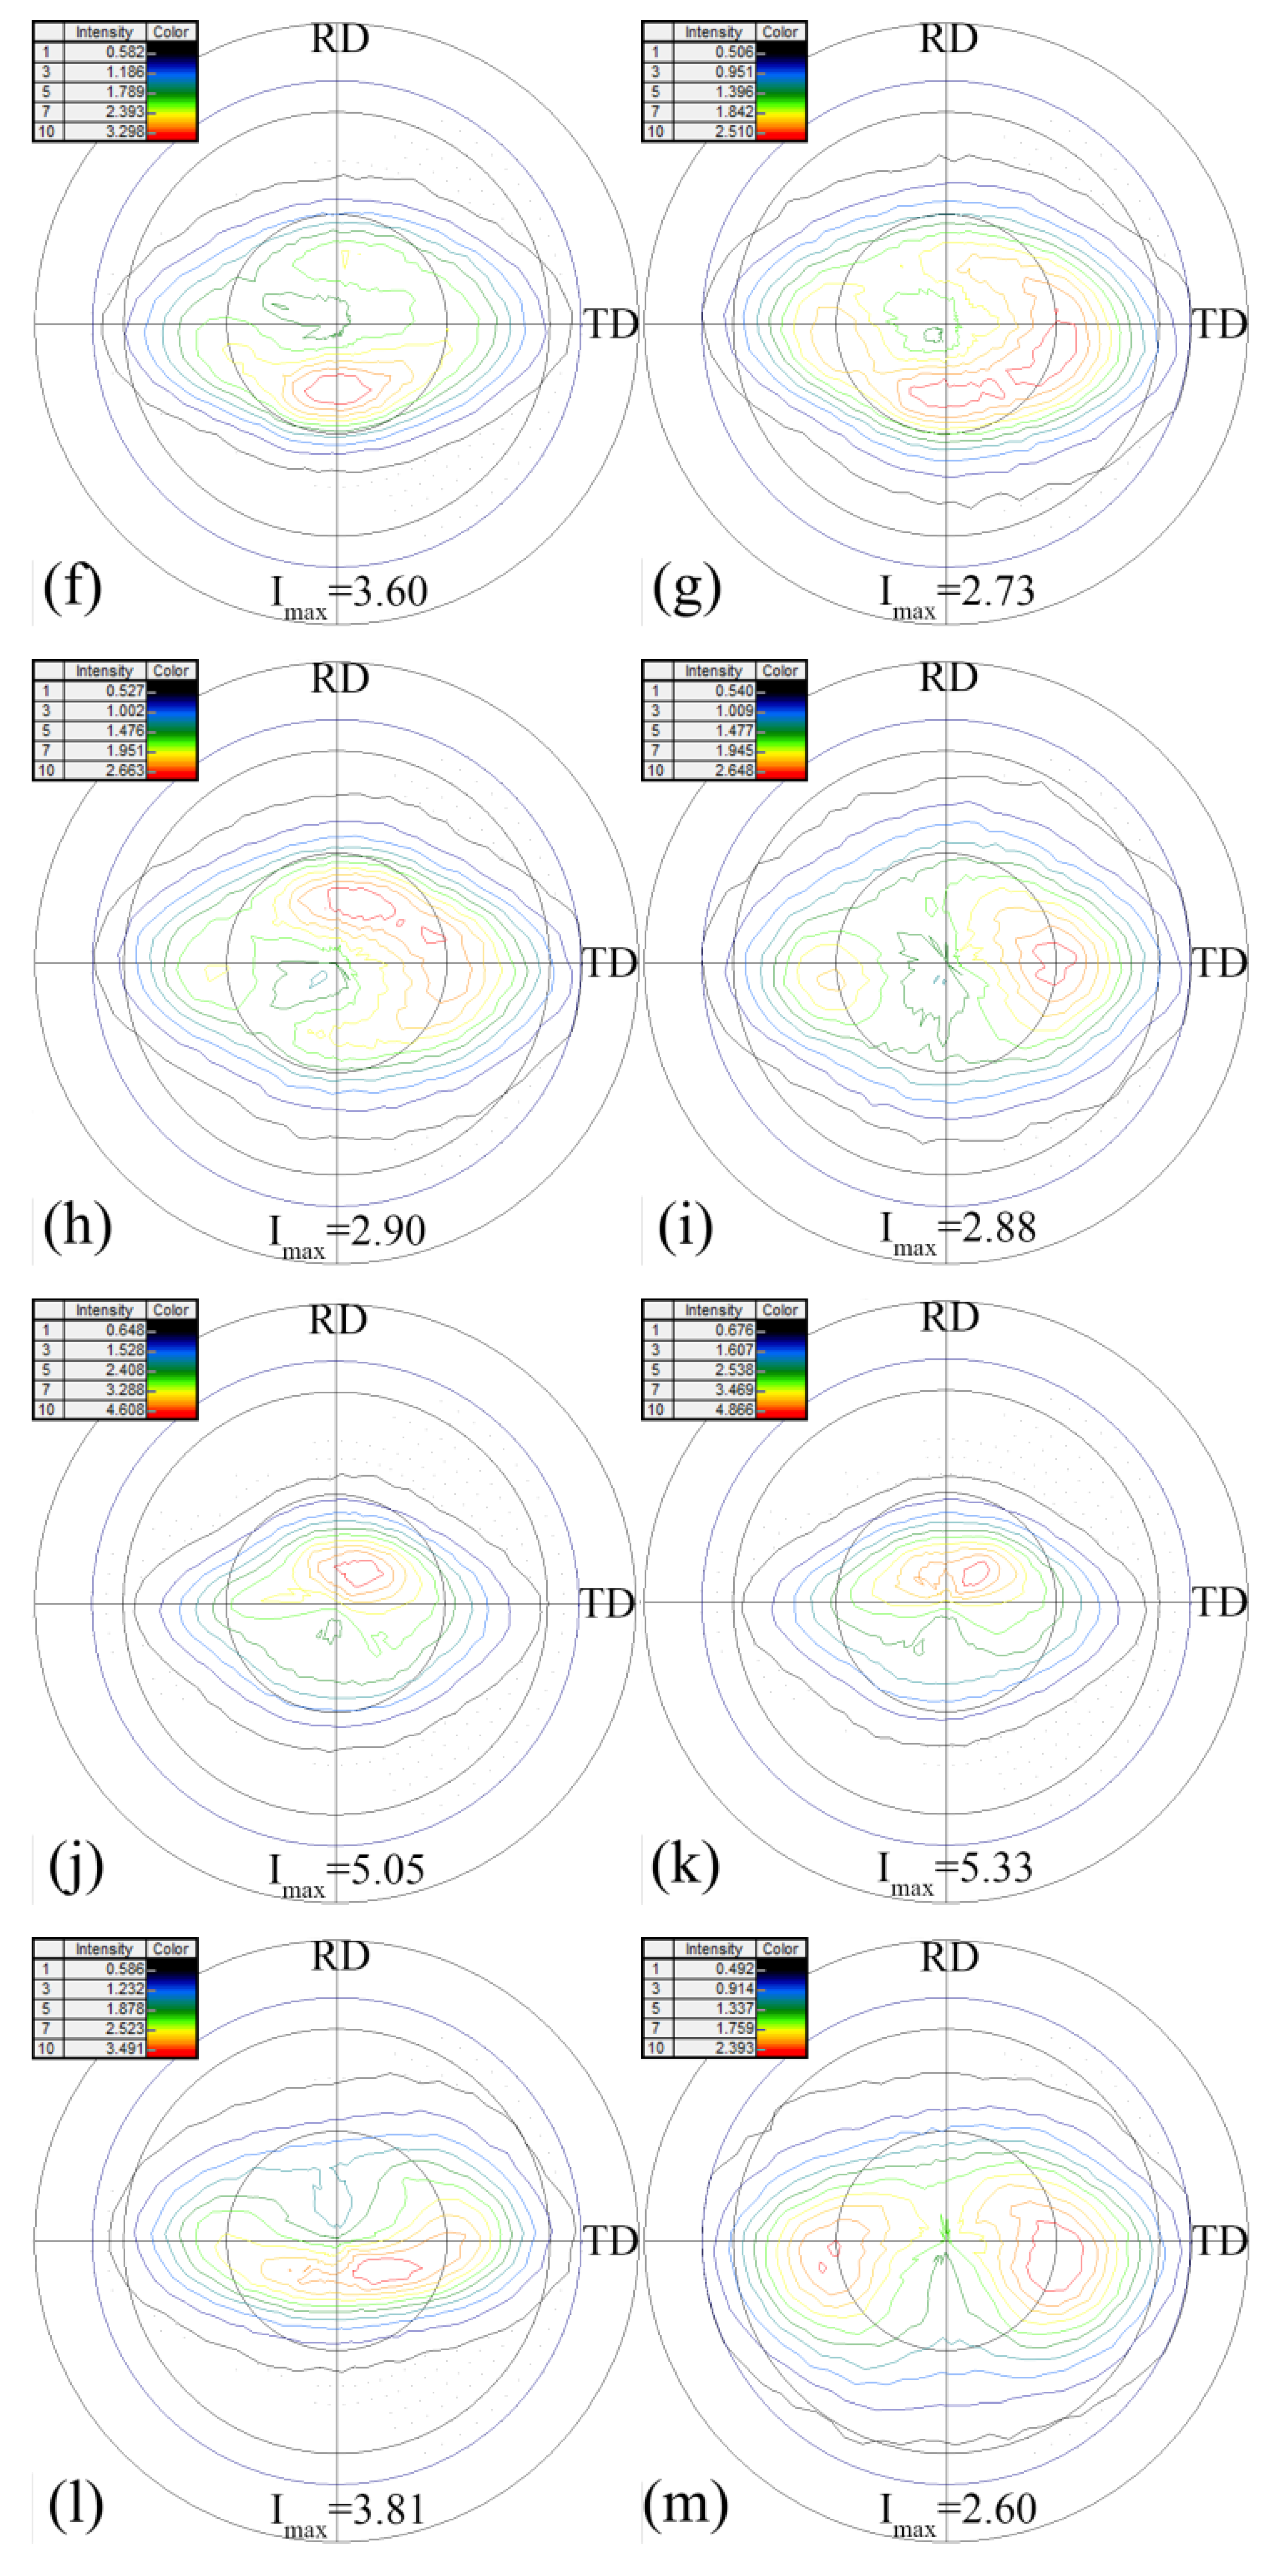
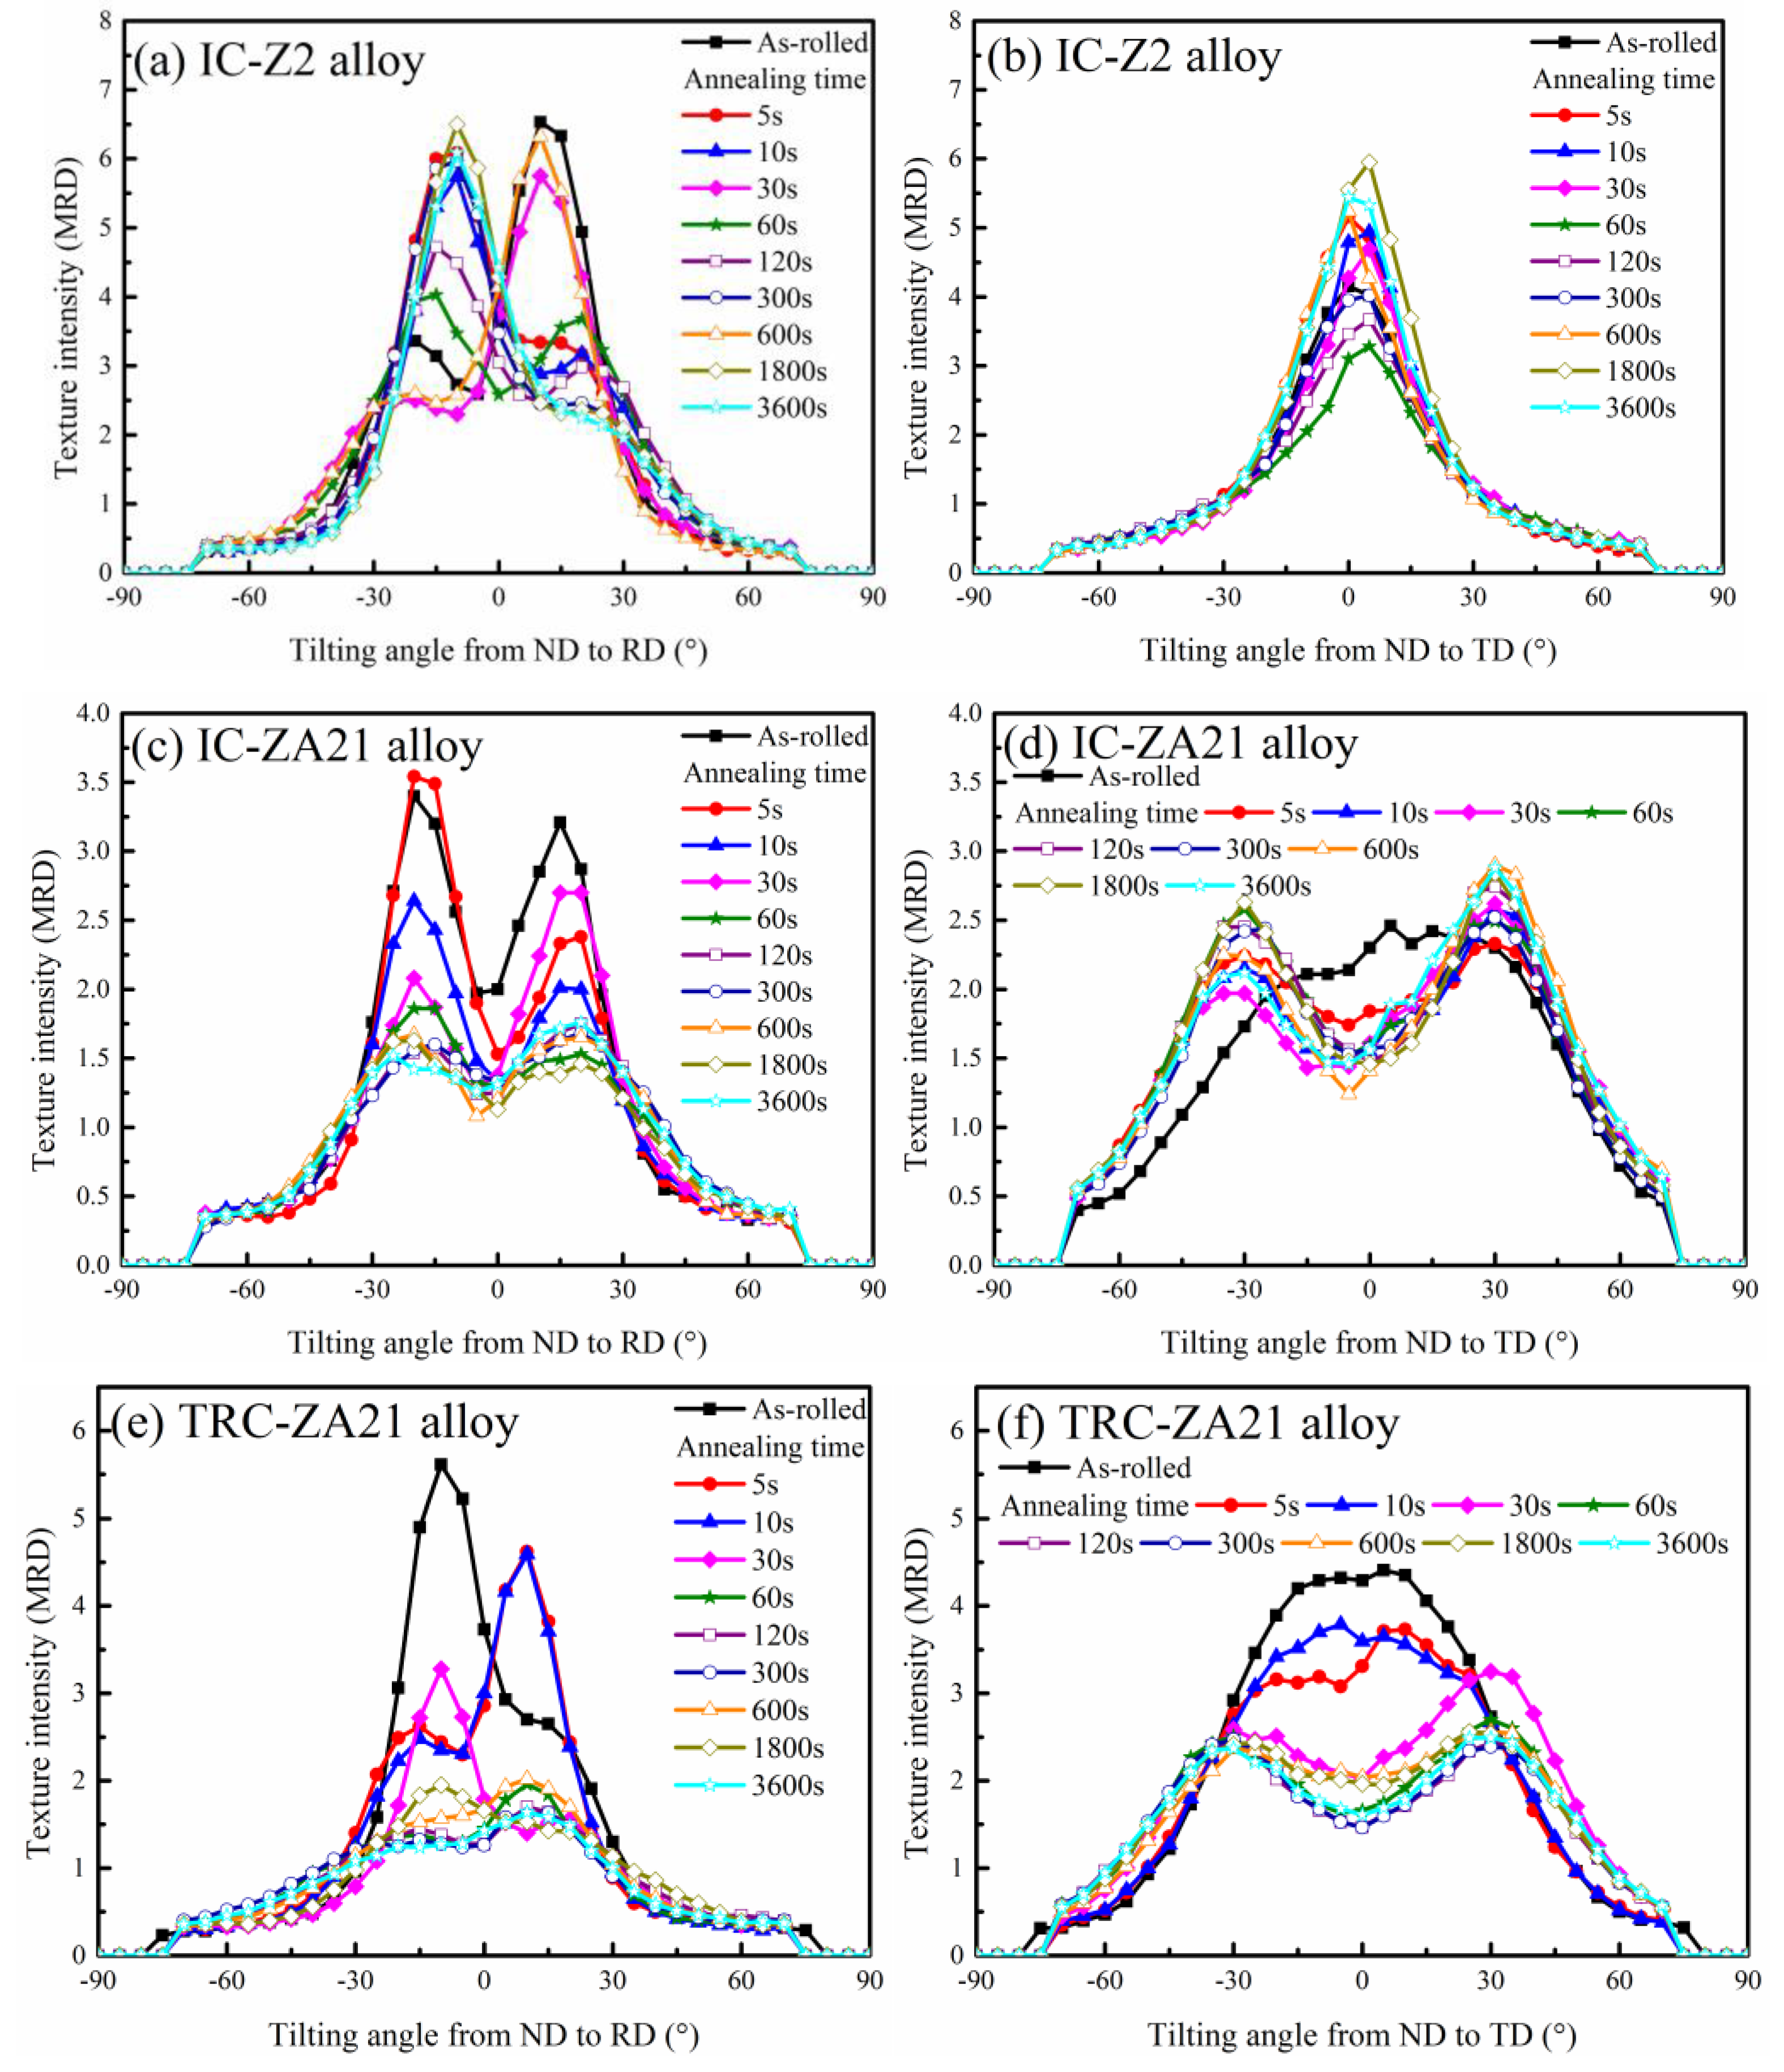
3.3. Evolution of Basal Texture

The variations in the maximum intensity in (0001) pole figures of experimental alloy sheets during annealing treatment are shown in Figure 8a, and different trends of three alloy sheets are presented. The maximum intensities in (0001) pole figures of IC-Z2 alloy firstly decreased and subsequently increased. The maximum intensity of IC-Z2 alloy under hot-rolled condition was 6.68 multiple random density (MRD), the lowest value occurred at annealing for 60 s and reached 4.03 MRD. However, the maximum intensity increased again and achieved 6.51 MRD at annealing for 3600 s. After annealing treatment, the maximum intensity of IC-Z2 alloy did not weaken compared with hot-rolling condition. The maximum intensities of IC-ZA21 and TRC-ZA21 exhibited a significant decrease during the annealing process. The maximum intensities of IC-ZA21 and TRC-ZA21 under the hot-rolled condition were 3.56 and 6.14 MRD, and the maximum intensities weakened to 2.88 and 2.60 MRD after annealing treatment for 3600 s. The variations in maximum intensities in (0001) pole figures also indicated intensities in the basal texture of experimental alloys that exhibited weakened phenomena at the initial stage of annealing treatment. This demonstrated that the nucleation stage of recrystallization grains had an important effect on weakening basal texture and optimizing the texture component. During subsequent annealing treatment, evolutions of intensities in the basal texture of experimental alloys exhibited different tendencies. The basal texture of IC-Z2 alloy strengthened again, however, the basal texture of the IC-ZA21 and TRC-ZA21 alloys maintained weakened trends. Obviously, the grain growth behaviors with different orientations were distinct tendencies, which led to the occurrence of disparity in basal texture intensity.
Figure 8b–e shows the (0001) pole figures of IC-Z2 alloy sheets with annealing times for 5, 10, 60 and 3600 s, and the maximum intensities were 6.21, 6.17, 4.03 and 6.51 MRD, respectively. At the same time, the basal texture of the IC-Z2 alloy maintained the characterization of RD tilting during whole annealing treatment, and the spreading contents along RD were stronger than that along TD. When annealing time lasted 60 s, the maximum intensity in basal pole of IC-Z2 alloy achieved the lowest value observed, as seen in Figure 8d. It was clear that IC-Z2 alloy with annealing for 60 s had a tilting angle of 15–20° from ND toward RD in Figure 9a, which plotted the intensity variations in (0001) pole tilting from ND to RD in IC-Z2 alloy. However, the IC-Z2 alloy exhibited only one peak from ND toward TD in the intensity profile of (0001) pole figures during annealing treatment, as seen in Figure 9b. The TD titling did not take place during the annealing process for the IC-Z2 alloy.
Compared with the IC-Z2 alloy, the evolution of basal texture in ZA21 alloy sheets exhibited a difference during salt bath annealing treatment. Moreover, the diversity of basal texture characterization existed between the IC-ZA21 and TRC-ZA21 alloy sheets. The (0001) pole figures of IC-ZA21 alloy sheets with annealing time for 5, 10, 30 and 3600 s are shown in Figure 8f–i; related maximum intensities were 3.60, 2.73, 2.90 and 2.88 MRD. The basal texture of the IC-ZA21 alloy exhibited RD tilting and stronger spreading along TD in hot-rolling condition and the initial stage of the annealing process. As Figure 8f shows, the diffusion content in the basal pole along TD was significantly higher than that along RD in the IC-ZA21 alloy with annealing of 5 s. The intensity variations in (0001) pole figures in the IC-ZA21 alloy from ND to RD and TD were plotted in Figure 9c,d. The intensity profiles from ND to RD in IC-ZA21 alloy exhibited double peaks at the initial stage of annealing. However, the peak intensity decreased with the increase of annealing time. Meanwhile, TD tilting characterization gradually emerged with titling angle of 25–30°, as seen in Figure 9d. The variations in the intensity profiles in IC-ZA21 indicated that a noticeable transformation of grain orientation occurred during the annealing process. The characterization of basal texture in the IC-ZA21 alloy changed from RD tilting to TD tilting.
The (0001) pole figures of TRC-ZA21 alloy sheets with annealing time for 5, 10, 30 and 3600 s were shown in Figure 8j–m; related maximum intensities were 5.05, 5.33, 3.81 and 2.60 MRD. The more apparent weakening phenomenon existed in the TRC-ZA21 alloy during the annealing process. Combined with the evolution of basal texture characterization (Figure 8j–m) and variations in intensity profiles from ND to RD and TD (Figure 9e,f), the TRC-ZA21 alloy also exhibited a change in grain orientation. However, the TRC-ZA21 alloy exhibited slight texture component with tilting to RD at the initial stage of the annealing process, as seen in Figure 9e. The tilting content of TD in TRC-ZA21 alloy was enhanced during the annealing process by comparing variations in the basal pole figures in Figure 8j,m. The variations of intensity profiles in (0001) pole from ND to TD indicated that the TD tilting angle in TRC-ZA21 alloy increased from 5° to 35° by annealing treatment. The non-basal texture components were formed in TRC-ZA21 during the annealing process. However, the transformation rate of grain orientation in TRC-ZA21 alloy was slower than that in the IC-ZA21 alloy. TD titling in the TRC-ZA21 alloy exhibited significant changes until annealing time reached 30 s, as seen in Figure 9f. The significant difference in the texture characterization of TRC-ZA21 alloys was related to the recrystallization behavior at the initial stage of annealing treatment. Moreover, the difference in the characterization of second-phase particles resulted in different recrystallization behavior. Due to the gap in the number of recrystallization grains at the initial stage of the annealing process, the different transformation rates of grain orientation were created. Compared with the evolution difference between Z2 and ZA21 alloys, this also indicated that the nucleation stage of the SRX process contributed to weakened basal texture. Moreover, more random orientation of grains was achieved by formation of second-phase particles with fine size.

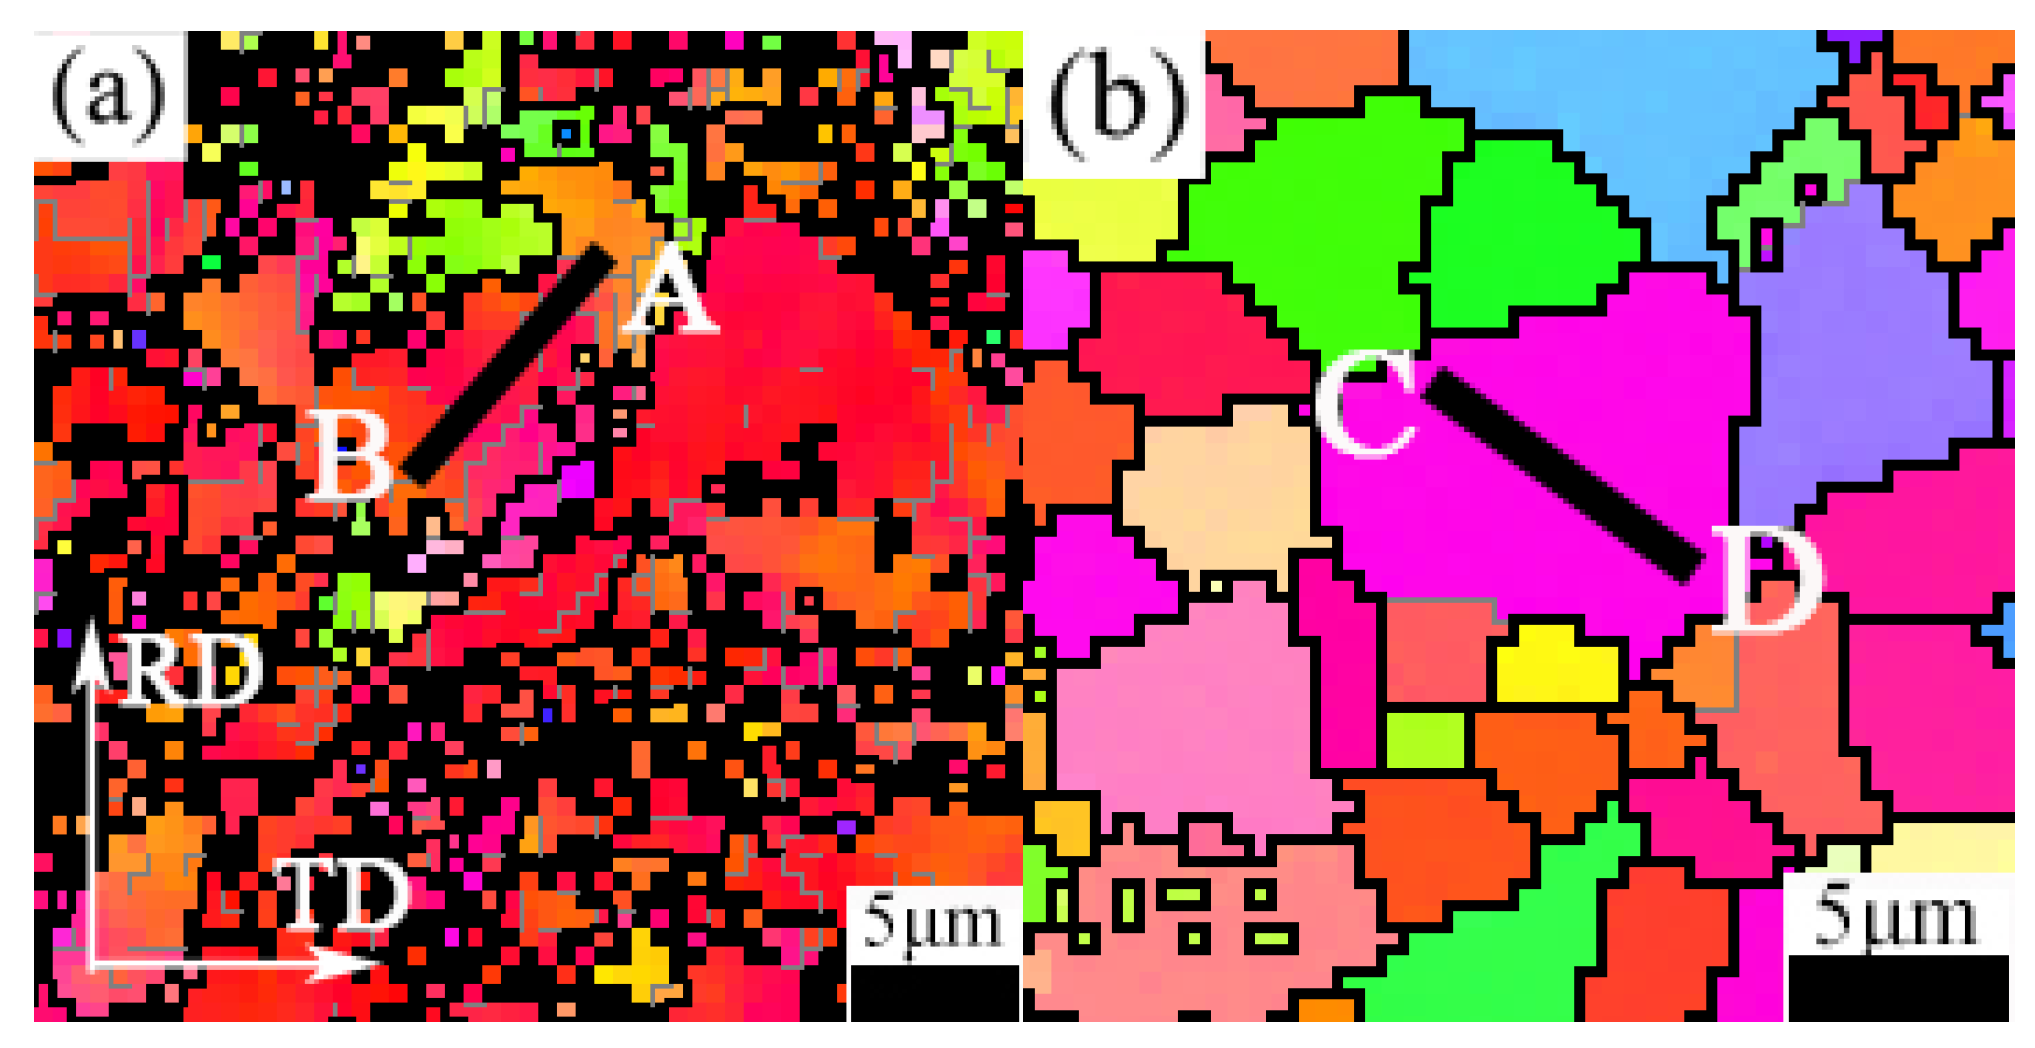
3.4. Effects of Second-Phase Particles on Microstructure and Basal Texture

The average grain sizes of experimental alloys calculated by EBSD information were shown in Figure 10. The results indicated that the grain growth behavior of experimental alloys exhibited differences. The average grain size increased with increases in annealing time, and the sequence of grain size was IC-Z2 > IC-ZA21 > TRC-ZA21. For example, the average grain sizes with an annealing time of 3600 s in IC-Z2, IC-ZA21 and TRC-ZA21 alloy sheets were 13.8, 6.9 and 4.4 μm, respectively. The difference in grain growth behavior was related to microstructure characterization, especially second-phase particles. According to the size, spacing and volume fraction of second phase particles in magnesium alloys, the effects of second-phase particles on the recrystallization process divided into a promoting role and inhibition influence. Nano-sized second-phase particles existed in IC-ZA21 and TRC-ZA21 alloy sheets, which was beneficial to pinning the movement of the grain boundary and restricting grain growth. Moreover, the recrystallization behavior in the IC-ZA21 alloy was promoted under the effect of the PSN mechanism, due to the second-phase particles with coarse size. The lowest grain growth rate was obtained in the TRC-ZA21 alloy, which was attributed to the finer size of second-phase particles. The effect on preventing grain growth in IC-Z2 alloy was weak due to the second-phase particles with a coarse size. Hence, the grain growth rate of IC-Z2 alloy was higher than that of the IC-ZA21 alloy.
At high temperature, the SRX behavior in magnesium alloys included nucleation and the growth of recrystallization grains during the annealing process. Combined with microstructure evolution and basal texture variations in experimental alloy sheets (Figure 4 and Figure 8), the basal texture significantly weakened at the initial stage of annealing process due to the nucleation mechanism. According to the different second-phase particles, experimental alloy sheets exhibited different weakened rates of basal texture. With the progress of annealing treatment, variations in basal texture in IC-Z2, IC-ZA21 and TRC-ZA21 alloy sheets exhibited differently, and the grain growth mechanism gradually governed the microstructure evolution. The intensity of basal pole figure in IC-Z2 alloy increased; however, the weakened basal textures were maintained in IC-ZA21 and TRC-ZA21 alloys. The formation of recrystallization texture was related to nuclei orientation of recrystallization grains, and influenced by subsequent grain growth behavior. Therefore, many studies indicated that the formation of a rare-earth texture was related to the preferential growth of orientated grains [8,54,55].
Due to the drag effect on motion of grain boundary from solute atoms, weakened basal texture can be obtained in some dilute RE-containing and/or Ca-containing magnesium alloys [12,56,57]. In Mg-RE alloys, Stanford reported that the minimum concentration required to noticeably weaken the basal texture is 0.06 at.% Gd [12]. The enhancement of the solute drag of grain boundaries and dislocation provide the main contributions to modifying the texture component. By alloying addition, the difference in texture characterization between the IC-Z2 alloy and IC-ZA21 alloy can be observed. Undoubtedly, dilute Ca and Gd atoms had a positive effect on weakening basal texture in the IC-ZA21 alloy. In addition, extended solubility can be obtained under the interaction of fast solidification rate and massive defects from TRC process, however, the content of solute atoms segregation reduces [58,59]. Therefore, further texture modification by solute atoms was attenuated. At the same time, for experimental alloy sheets, the second-phase particle was the most significant difference in microstructural characterization. The IC-Z2 alloy possessed second-phase particles with a coarse size. Coarse particles and fine particles both were found in the IC-ZA21 alloy, however, the distribution of second-phase particles exhibited an aggregation trend (Figure 3b). The number of second-phase particles with a coarse size in the TRC-ZA21 alloy was obviously less than that in the IC-Z2 and IC-ZA21 alloys. The second-phase particles with fine size uniformly distributed in the TRC-ZA21 magnesium alloy. Based on the difference in the size and distribution of second phase particles, the PSN mechanism was promoted during the SRX process in the IC-Z2 alloy. In addition to the PSN mechanism by coarse particles and clusters of fine particles, some fine particles with uniform distribution can block the movement of the grain boundary. The inhibition effect on the movement of grain boundary by second-phase particles with fine size is dominated in the TRC-ZA21 alloy. Therefore, different SRX behaviors were exhibited in experimental alloys, and variations in basal texture were discrepant.
At the initial stage of the annealing process, more second-phase particles with coarse size in IC-Z2 and IC-ZA21 alloys promoted recrystallization softening behavior. The fractional softening in the hardness of the TRC-ZA21 alloy was lower than that of the IC-Z2 and IC-ZA21 alloys. Therefore, the fractions of recrystallized grains in IC-Z2 and IC-ZA21 alloys were higher than that in the TRC-ZA21 alloy. The basal texture of TRC-ZA21 alloy was weakened when the nucleation stage was basically completed. As Figure 8l shown, the maximum intensity of (0001) pole figure significantly weakened; this was obviously related to the completion of nucleation of a large amount of recrystallized grains. The PSN mechanism was not triggered by fine particles. This indicated that the PSN mechanism was not necessary for weakening basal texture in magnesium alloys. As preferential nucleation sites in magnesium alloys, second-phase particles promoted the formation of recrystallized grain nuclei with random grain orientation and had a positive effect on weakening basal texture [35,36,60].
However, the basal texture of the IC-Z2 alloy was intensified by grain growth. The basal texture of IC-ZA21 and TRC-ZA21 alloys still maintained a weaker basal texture. The different variations in basal texture indicated that the growth rate of basal orientation grains was influenced by second-phase particles. During the SRX process, fine second-phase particles can block the movement of the grain boundary and have a pinning effect. Thermodynamically, the mobility of the grain boundary decreased with the reduction in grain boundary energy. Kinetically, stronger dragging effect and a more apparent pinning force were obtained at the grain boundary with higher energy [54,61]. The formation of recrystallization basal texture in conventional magnesium alloys was related to the preferential growth of basal orientation grains. This also indicated that basal orientation grains exhibited higher grain boundary energy [8]. The pinning effect on the movement of basal orientation grains was enhanced by second-phase particles with uniform distribution in the TRC-ZA21 alloy. Hence, grains with other orientations had opportunity for growing up, and the basal texture maintained a weakened characterization. In general, second-phase particles with a fine size can promote grain nuclei with a more random orientation and pin the growth of basal orientation grains, thus weakening basal texture. This also indicated that modifying the size and distribution of second phase particles can adjust the basal texture. At the same time, the nucleation sites of recrystallization grains provided by PSN mechanism effectively weaken the basal texture. Moreover, the effect of PSN mechanism on basal texture seemed to be ignored, combined with the different texture evolution in experimental alloy sheets during the later stage of annealing treatment. However, fine second-phase particles can make the basal texture maintain a weakened characterization of broad distribution, and it is positive on formability in magnesium alloys, which is consistent with our previous study [28]. Hence, the microstructure and texture evolution can be modified by second-phase particles, which is useful to promote comprehensive performance and subsequently develop the application of magnesium alloy products.

4. Conclusions

In the paper, static recrystallization behaviors in IC-Z2, IC-ZA21 and TRC-ZA21 alloy sheets were investigated by salt bath annealing to analyze the effect of second-phase particles on microstructure evolution and basal texture variation. The softening of hardness, microstructure evolution and basal texture variation during the annealing process were studied. The following conclusions are made:
(1) The annealing process of experimental alloy sheets exhibited characterization of two stages. The nucleation of recrystallized grains was promoted by second-phase particles with coarse size due to a particle-stimulated nucleation mechanism. Finally, the fractional softening in the hardness of the TRC-ZA21 alloy was lower than that of the IC-Z2 and IC-ZA21 alloy at the initial stage of the annealing process;
(2) With the progress of the annealing process, microstructure transformations in experimental alloy sheets existed from deformed grains to equiaxed recrystallization grains. Meanwhile, the misorientation gradient and distortion degree both decreased. Under the effect of second-phase particles with coarse size, the fractions of recrystallization grains in IC-Z2 and IC-ZA21 alloys were higher than that in the TRC-ZA21 alloy at the initial stage of the annealing process;
(3) Different variations in basal texture in experimental alloy sheets were presented. The maximum intensity IC-Z2 alloy firstly decreased and subsequently increased. However, IC-ZA21 and TRC-ZA21 alloys exhibited weakened basal texture;
(4) The nucleation of recrystallized grains by second-phase particles was weakened basal texture. The growth rate of basal orientation grains can be controlled by second-phase particles. After annealing treatment, the IC-Z2 alloy maintained basal texture characterization; IC-ZA21 and TRC-ZA21 alloys exhibited non-basal texture components.

Author Contributions

Y.Z. and H.J. designed the experiment; Y.Z. and Y.W. conducted the experiment testing; Y.Z. and Z.X. analyzed data; Y.Z. wrote the paper; H.J. checked and modified the paper. All authors have read and agreed to the published version of the manuscript.

Funding

This paper was supported by the Fundamental Research Funds for the Central Universities (No. 2302019FRF-IC-19-018) and Aviation Science Foundation Project (No. 20181174001).

Conflicts of Interest

The authors declare no conflict of interest.

References

  1. Song, J.F.; She, J.; Chen, D.; Pan, F. Latest research advances on magnesium and magnesium alloys worldwide. J. Magnes. Alloy. 2020, 8, 1–41. [Google Scholar] [CrossRef]
  2. Joost, W.; Krajewski, P.E. Towards magnesium alloys for high-volume automotive applications. Scr. Mater. 2017, 128, 107–112. [Google Scholar] [CrossRef]
  3. Wang, X.J.; Xu, D.K.; Wu, R.Z.; Chen, X.B.; Peng, Q.M.; Jin, L.; Xin, Y.C.; Zhang, Z.Q.; Liu, Y.; Chen, X.H.; et al. Where is going on in magnesium alloys? J. Mater. Sci. Technol. 2018, 34, 245–247. [Google Scholar] [CrossRef]
  4. Li, H.; Hsu, E.; Szpunar, J.; Utsunomiya, H.; Sakai, T. Deformation mechanism and texture and microstructure evolution during high-speed rolling of AZ31B Mg sheets. J. Mater. Sci. 2008, 43, 7148–7156. [Google Scholar] [CrossRef]
  5. Maier, P.; Clausius, B.; Wicke, J.; Hort, N. Characterization of an extruded Mg-Dy-Nd alloy during stress corrosion with C-ring tests. Metals 2020, 10, 584. [Google Scholar] [CrossRef]
  6. Kang, Y.; Huang, Z.; Zhao, H.; Gan, C.; Zhou, N.; Zheng, K.; Zhang, J.; Pan, F.; Huang, J.; Wang, S.; et al. Comparative study of hot deformation behavior and microstructure evolution of as-cast and extruded WE43 magnesium alloy. Metals 2020, 10, 429. [Google Scholar] [CrossRef] [Green Version]
  7. Zeng, Z.; Zhu, Y.; Xu, S.; Bian, M.; Davies, C.H.J.; Birbilis, N.; Nie, J.F. Texture evolution during static recrystallization of cold-rolled magnesium alloys. Acta Mater. 2016, 105, 479–494. [Google Scholar] [CrossRef]
  8. Wu, W.; Jin, L.; Zhang, Z.; Ding, W.; Dong, J. Grain growth and texture evolution during annealing in an indirect-extruded Mg–1Gd alloy. J. Alloy. Compd. 2014, 585, 111–119. [Google Scholar] [CrossRef]
  9. Chen, X.; Wang, L.; Xiao, R.; Zhong, X.; Huang, G.; Liu, Q. Comparison of annealing on microstructure and anisotropy of magnesium alloy AZ31 sheets processed by three different routes. J. Alloy. Compd. 2014, 604, 112–116. [Google Scholar] [CrossRef]
  10. Gottstein, G.; Al Samman, T. Texture development in pure Mg and Mg alloy AZ31. Mater. Sci. Forum 2005, 495, 623–632. [Google Scholar] [CrossRef]
  11. Bhattacharyya, J.; Agnew, S.; Muralidharan, G. Texture enhancement during grain growth of magnesium alloy AZ31B. Acta Mater. 2015, 86, 80–94. [Google Scholar] [CrossRef] [Green Version]
  12. Stanford, N. Micro-alloying Mg with Y, Ce, Gd and La for texture modification—A comparative study. Mater. Sci. Eng. A 2010, 527, 2669–2677. [Google Scholar] [CrossRef]
  13. Li, N.; Yan, H. The effects of rare earth Pr and heat treatment on the wear properties of AZ91 alloy. Crystals 2018, 8, 256. [Google Scholar] [CrossRef] [Green Version]
  14. Stráská, J.; Minárik, P.; Šašek, S.; Veselý, J.; Bohlen, J.; Král, R.; KUBÁSEK, J. Texture hardening observed in Mg–Zn–Nd alloy processed by Equal-Channel Angular Pressing (ECAP). Metals 2019, 10, 35. [Google Scholar] [CrossRef] [Green Version]
  15. Miller, V.M.; Berman, T.D.; Beyerlein, I.J.; Jones, J.W.; Pollock, T.M. Prediction of the plastic anisotropy of magnesium alloys with synthetic textures and implications for the effect of texture on formability. Mater. Sci. Eng. A 2016, 675, 345–360. [Google Scholar] [CrossRef] [Green Version]
  16. Iwanaga, K.; Tashiro, H.; Okamoto, H.; Shimizu, K. Improvement of formability from room temperature to warm temperature in AZ-31 magnesium alloy. J. Mater. Process. Technol. 2004, 155, 1313–1316. [Google Scholar] [CrossRef]
  17. Liu, H.; Li, W.; Pei, Z.; Yan, M. Mg-based materials with Quasiamorphous phase produced by vertical twin-roll casting process. Metals 2020, 10, 452. [Google Scholar] [CrossRef] [Green Version]
  18. Yi, S.; Victoria-Hernández, J.; Kim, Y.M.; Letzig, D.; You, B.S. Modification of microstructure and texture in highly non-flammable Mg-Al-Zn-Y-Ca alloy sheets by controlled Thermomechanical processes. Metals 2019, 9, 181. [Google Scholar] [CrossRef] [Green Version]
  19. Nie, J.-F. Precipitation and hardening in magnesium alloys. Met. Mater. Trans. A 2012, 43, 3891–3939. [Google Scholar] [CrossRef] [Green Version]
  20. Yu, H.; Kim, Y.M.; You, B.S.; Yu, H.S.; Park, S.H. Effects of cerium addition on the microstructure, mechanical properties and hot workability of ZK60 alloy. Mater. Sci. Eng. A 2013, 559, 798–807. [Google Scholar] [CrossRef]
  21. Laser, T.; Nürnberg, M.; Janz, A.; Hartig, C.; Letzig, D.; Schmid-Fetzer, R.; Bormann, R. The influence of manganese on the microstructure and mechanical properties of AZ31 gravity die cast alloys. Acta Mater. 2006, 54, 3033–3041. [Google Scholar] [CrossRef] [Green Version]
  22. Stanford, N.; Barnett, M. The origin of “rare earth” texture development in extruded Mg-based alloys and its effect on tensile ductility. Mater. Sci. Eng. A 2008, 496, 399–408. [Google Scholar] [CrossRef]
  23. Du, Y.; Zheng, M.; Qiao, X.; Wang, D.; Peng, W.; Wu, K.; Jiang, B. Improving microstructure and mechanical properties in Mg–6 mass% Zn alloys by combined addition of Ca and Ce. Mater. Sci. Eng. A 2016, 656, 67–74. [Google Scholar] [CrossRef]
  24. Robson, J.; Henry, D.; Davis, B. Particle effects on recrystallization in magnesium–manganese alloys: Particle-stimulated nucleation. Acta Mater. 2009, 57, 2739–2747. [Google Scholar] [CrossRef]
  25. Fatemi, S.M.; Aliyari, S.; Miresmaeili, S. Dynamic precipitation and dynamic recrystallization during hot deformation of a solutionized WE43 magnesium alloy. Mater. Sci. Eng. A 2019, 762, 138076. [Google Scholar] [CrossRef]
  26. Jin, Z.Z.; Cheng, X.M.; Zha, M.; Rong, J.; Zhang, H.; Wang, J.G.; Wang, C.; Li, Z.G.; Wang, H.Y. Effects of Mg17Al12 s phase particles on twinning-induced recrystallization behavior in Mg-Al-Zn alloys during gradient hot rolling. J. Mater. Sci. Technol. 2019, 35, 2017–2026. [Google Scholar] [CrossRef]
  27. Imandoust, A.; Barreett, C.; Oppedal, A.; Whittington, W.; Paudel, Y.; El Kadiri, H. Nucleation and preferential growth mechanism of recrystallization texture in high purity binary magnesium-rare earth alloys. Acta Mater. 2017, 138, 27–41. [Google Scholar] [CrossRef]
  28. Zhang, Y.; Jiang, H.; Wang, Y.; Kang, Q.; Wang, J.; Lin, H.; Zhang, G. Effects of alloying addition and twin-roll casting process on Mg–2Zn based-alloys with high strength and high formability. Mater. Res. Express 2019, 6, 086576. [Google Scholar] [CrossRef]
  29. Johnson, W.A.; Mehl, R.F. Reaction kinetics in process of nucleation and growth. Trans. Metall. Soc. AIME 1939, 135, 416–458. [Google Scholar]
  30. Avrami, M. Granulation, phase change, and microstructure kinetics of phase change. J. Chem. Phys. 1941, 9, 177. [Google Scholar] [CrossRef]
  31. Kolmogorov, A.N.; Kolmogorov, A. A statistical theory for the recrystallization of metals. Izv. Akad. Nauk. USSR Ser. Mat. 1937, 1, 355–359. [Google Scholar]
  32. Oyarzábal, M.; De Guereñu, A.M.; Gutierrez, I. Effect of stored energy and recovery on the overall recrystallization kinetics of a cold rolled low carbon steel. Mater. Sci. Eng. A 2008, 485, 200–209. [Google Scholar] [CrossRef]
  33. Chao, H.; Sun, H.; Chen, W.; Wang, E. Static recrystallization kinetics of a heavily cold drawn AZ31 magnesium alloy under annealing treatment. Mater. Charact. 2011, 62, 312–320. [Google Scholar] [CrossRef]
  34. Suh, B.-C.; Shim, M.-S.; Shin, K.; Kim, N.J. Current issues in magnesium sheet alloys: Where do we go from here? Scr. Mater. 2014, 84, 1–6. [Google Scholar] [CrossRef]
  35. Basu, I.; Al-Samman, T. Twin recrystallization mechanisms in magnesium-rare earth alloys. Acta Mater. 2015, 96, 111–132. [Google Scholar] [CrossRef]
  36. Drouven, C.; Basu, I.; Al-Samman, T.; Korte-Kerzel, S. Twinning effects in deformed and annealed magnesium–neodymium alloys. Mater. Sci. Eng. A 2015, 647, 91–104. [Google Scholar] [CrossRef]
  37. Wang, W.; Ma, L.; Chai, S.; Zhang, W.; Chen, W.; Feng, Y.; Cui, G. Role of one direction strong texture in stretch formability for ZK60 magnesium alloy sheet. Mater. Sci. Eng. A 2018, 730, 162–167. [Google Scholar] [CrossRef]
  38. Qin, P.; Yang, Q.; Guan, K.; Meng, F.; Lv, S.; Li, B.; Zhang, D.; Wang, N.; Zhang, J.; Meng, J.; et al. Microstructures and mechanical properties of a high pressure die-cast Mg-4Al-4Gd-0.3Mn alloy. Mater. Sci. Eng. A 2019, 764, 138254. [Google Scholar] [CrossRef]
  39. Huang, K.; Marthinsen, K.; Zhao, Q.L.; Logé, R.E. The double-edge effect of second-phase particles on the recrystallization bahaviour and associated mechanical properties of metallic materials. Prog. Mater. Sci. 2018, 92, 284–359. [Google Scholar] [CrossRef]
  40. Smith, C.S. Grains, phases, and interfaces-an interpretation of microstructure. Trans. Am. Inst. Min. Metall. Petrol. Eng. 1948, 175, 15–51. [Google Scholar]
  41. Wang, S.; Ma, R.; Yang, L.; Wang, Y.; Wang, Y. Precipitates effect on microstructure of as-deformed and as-annealed AZ41 magnesium alloys by adding Mn and Ca. J. Mater. Sci. 2010, 46, 3060–3065. [Google Scholar] [CrossRef]
  42. Su, J.; Sanjari, M.; Kabir, A.S.H.; Jung, I.-H.; Yue, S. Dynamic recrystallization mechanisms during high speed rolling of Mg–3Al–1Zn alloy sheets. Scr. Mater. 2016, 113, 198–201. [Google Scholar] [CrossRef]
  43. Zhu, S.; Yan, H.; Liao, X.; Moody, S.; Sha, G.; Wu, Y.; Ringer, S.P. Mechanisms for enhanced plasticity in magnesium alloys. Acta Mater. 2015, 82, 344–355. [Google Scholar] [CrossRef]
  44. Li, X.; Yang, P.; Wang, L.; Meng, L.; Cui, F. Orientational analysis of static recrystallization at compression twins in a magnesium alloy AZ31. Mater. Sci. Eng. A 2009, 517, 160–169. [Google Scholar] [CrossRef]
  45. Barnett, M. Twinning and the ductility of magnesium alloys: Part I: “Tension” twins. Mater. Sci. Eng. A 2007, 464, 1–7. [Google Scholar] [CrossRef]
  46. Li, X.; Yang, P.; Meng, L.; Cui, F.-E. Analysis of the static recrystallization at tension twins in az31 magnesium alloy. Acta Met. Sin. 2010, 2010, 147–154. [Google Scholar] [CrossRef]
  47. Barnett, M. Twinning and the ductility of magnesium alloys: Part II. “Contraction” twins. Mater. Sci. Eng. A 2007, 464, 8–16. [Google Scholar] [CrossRef]
  48. Su, J.; Sanjari, M.; Kabir, A.S.H.; Jonas, J.J.; Yue, S. Static recrystallization behavior of magnesium AZ31 alloy subjected to high speed rolling. Mater. Sci. Eng. A 2016, 662, 412–425. [Google Scholar] [CrossRef]
  49. Su, J.; Kabir, A.S.H.; Sanjari, M.; Yue, S. Correlation of static recrystallization and texture weakening of AZ31 magnesium alloy sheets subjected to high speed rolling. Mater. Sci. Eng. A 2016, 674, 343–360. [Google Scholar] [CrossRef]
  50. Park, C.H.; Oh, C.-S.; Kim, S. Dynamic recrystallization of the H- and O-tempered Mg AZ31 sheets at elevated temperatures. Mater. Sci. Eng. A 2012, 542, 127–139. [Google Scholar] [CrossRef]
  51. Kamaya, M.; Wilkinson, A.J.; Titchmarsh, J.M. Measurement of plastic strain of polycrystalline material by electron backscatter diffraction. Nucl. Eng. Des. 2005, 235, 713–725. [Google Scholar] [CrossRef]
  52. Wang, W.; Cui, G.; Zhang, W.; Chen, W.; Wang, E. Evolution of microstructure, texture and mechanical properties of ZK60 magnesium alloy in a single rolling pass. Mater. Sci. Eng. A 2018, 724, 486–492. [Google Scholar] [CrossRef]
  53. Allain-Bonasso, N.; Wagner, F.; Berbenni, S.; Field, D. A study of the heterogeneity of plastic deformation in IF steel by EBSD. Mater. Sci. Eng. A 2012, 548, 56–63. [Google Scholar] [CrossRef]
  54. Robson, J. Effect of rare-earth additions on the texture of wrought magnesium alloys: The role of grain boundary segregation. Met. Mater. Trans. A 2013, 45, 3205–3212. [Google Scholar] [CrossRef] [Green Version]
  55. Basu, I.; Al-Samman, T. Triggering rare earth texture modification in magnesium alloys by addition of zinc and zirconium. Acta Mater. 2014, 67, 116–133. [Google Scholar] [CrossRef]
  56. Jung, I.-H.; Sanjari, M.; Kim, J.; Yue, S. Role of RE in the deformation and recrystallization of Mg alloy and a new alloy design concept for Mg–RE alloys. Scr. Mater. 2015, 102, 1–6. [Google Scholar] [CrossRef]
  57. Ding, H.; Shi, X.; Wang, Y.; Cheng, G.; Kamado, S. Texture weakening and ductility variation of Mg–2Zn alloy with CA or RE addition. Mater. Sci. Eng. A 2015, 645, 196–204. [Google Scholar] [CrossRef]
  58. Park, Y.S.; Lee, S.B.; Kim, N.J. Microstructure and mechanical properties of strip cast Al-Mg-Si-X alloys. Mater. Trans. 2003, 44, 2617–2624. [Google Scholar] [CrossRef] [Green Version]
  59. Park, S.S.; Park, W.-J.; Kim, C.H.; You, B.S.; Kim, N.J. The twin-roll casting of magnesium alloys. JOM 2009, 61, 14–18. [Google Scholar] [CrossRef]
  60. Ma, Q.; Li, B.; Whittington, W.; Oppedal, A.; Wang, P.; Horstemeyer, M.F. Texture evolution during dynamic recrystallization in a magnesium alloy at 450 °C. Acta Mater. 2014, 67, 102–115. [Google Scholar] [CrossRef]
  61. Guan, D.; Liu, X.; Gao, J.; Ma, L.; Wynne, B.; Rainforth, W.M. Effect of deformation twinning on crystallographic texture evolution in a Mg-6.6Zn-0.2Ca (ZX70) alloy during recrystallization. J. Alloy. Compd. 2019, 774, 556–564. [Google Scholar] [CrossRef]
Figure 1. Variations of Vickers hardness and fractional softening during annealing. (a) Vickers hardness; (b) Fractional softening.
Metals 10 00777 g001
Figure 2. lnln(1/(1-XH))-lnt curves of experimental alloy sheets during annealing process.
Metals 10 00777 g002
Figure 3. Hot-rolled microstructure of experimental alloy sheets. (a) IC-Z2 alloy; (b) IC-ZA21 alloy; (c) TRC-ZA21 alloy; (d) TRC-ZA21 alloy with higher magnification; (e) Energy dispersive X-Ray spectroscopy detector (EDS) results of second-phase particles in TRC-ZA21 alloy.
Metals 10 00777 g003
Figure 4. Microstructure during salt bath annealing treatment. IC-Z2 alloy (a) 5 s; (b) 10 s; (c) 30 s; (d) 3600 s; IC-ZA21 alloy (e) 5 s; (f) 10 s; (g) 30 s; (h) 3600 s; TRC-ZA21 alloy (i) 5 s; (j) 10 s; (k) 30 s; (l) 3600 s.
Metals 10 00777 g004aMetals 10 00777 g004b
Figure 5. Electron Back-Scattered Diffraction (EBSD) Microstructures of experimental alloy sheets with annealing time of 5 s. (a) IC-Z2 alloy; (b) IC-ZA21 alloy; (c) TRC-ZA21 alloy.
Metals 10 00777 g005aMetals 10 00777 g005b
Figure 6. Local enlarged inverse pole figure (IPF) figures and misorientation variation. Local enlarged IPF (a) TRC-ZA21-10s alloy; (b) TRC-ZA21-3600s alloy; Misorientation variation (c) TRC-ZA21-10s alloy; (d) TRC-ZA21-3600s alloy.
Metals 10 00777 g006aMetals 10 00777 g006b
Figure 7. Variation in kernel average misorientation (KAM) values during annealing process and grain orientation spread of TRC-ZA21 alloy at 30 s and 3600 s annealing time: (a) variations in KAM values of experimental alloy sheets; relationship between grain size and grain orientation spread in TRC-ZA21 (b) 30 s; (c) 3600 s; grain orientation spread of different grains size in TRC-ZA21 (d) 30 s; (e) 3600 s.
Metals 10 00777 g007aMetals 10 00777 g007b
Figure 8. Evolution of basal texture during annealing treatment: (a) variations of maximum intensity during annealing treatment (0001) pole figures of IC-Z2 alloy, (b) 5 s; (c) 10 s; (d) 60 s; (e) 3600 s (0001) pole figures of IC-ZA21 alloy (f) 5 s; (g) 10 s; (h) 30 s; (i) 3600 s (0001) pole figures of TRC-ZA21 alloy (j) 5 s; (k) 10 s; (l) 30 s; (m) 3600 s.
Metals 10 00777 g008aMetals 10 00777 g008b
Figure 9. The variations in intensity profiles in (0001) pole figures IC-Z2 alloy sheets (a) From ND to RD; (b) From ND to TD IC-ZA21 alloy sheets (c) From ND to RD; (d) From ND to TD TRC-ZA21 alloy sheets (e) From ND to RD; (f) From ND to TD.
Metals 10 00777 g009
Figure 10. Variations in grain size during annealing process.
Metals 10 00777 g010
Table 1. Designated labels for samples with annealing treatment.
Annealing Time (s)IC-Z2IC-ZA21TRC-ZA21
5IC-Z2-5 sIC-ZA21-5 sTRC-ZA21-5 s
10IC-Z2-10 sIC-ZA21-10 sTRC-ZA21-10 s
30IC-Z2-30 sIC-ZA21-30 sTRC-ZA21-30 s
60IC-Z2-60 sIC-ZA21-60 sTRC-ZA21-60 s
120IC-Z2-120 sIC-ZA21-120 sTRC-ZA21-120 s
300IC-Z2-300 sIC-ZA21-300 sTRC-ZA21-300 s
600IC-Z2-600 sIC-ZA21-600 sTRC-ZA21-600 s
1800IC-Z2-1800 sIC-ZA21-1800 sTRC-ZA21-1800 s
3600IC-Z2-3600 sIC-ZA21-3600 sTRC-ZA21-3600 s
Table 2. Avrami exponent of experimental alloy sheets during annealing process.
Alloysn1n2
IC-Z22.270.19
IC-ZA210.460.27
TRC-ZA211.230.34

