Article

Influence of Elastomer Layers in the Quality of Aluminum Parts on Finishing Operations

1
TECNALIA, Basque Research and Technology Alliance, Paseo Mikeletegi 7, E-20009 Donostia-San Sebastian, Spain
2
Department of Mechanical Engineering, University of the Basque Country, C/ Alameda de Urquijo s/n, E-48013 Bilbao, Spain
*
Author to whom correspondence should be addressed.
Metals 2020, 10(2), 289; https://doi.org/10.3390/met10020289
Submission received: 31 January 2020 / Revised: 17 February 2020 / Accepted: 20 February 2020 / Published: 22 February 2020
(This article belongs to the Special Issue Metal Machining—Recent Advances, Applications and Challenges)

Abstract

:
In finishing processes, the quality of aluminum parts is mostly influenced by static and dynamic phenomena. Different solutions have been studied toward a stable milling process attainment. However, the improvements obtained with the tuning of process parameters are limited by the system stiffness and external dampers devices interfere with the machining process. To deal with this challenge, this work analyzes the suitability of elastomer layers as passive damping elements directly located under the part to be machined. Thus, exploiting the sealing properties of nitrile butadiene rubber (NBR), a suitable flexible vacuum fixture is developed, enabling a proper implementation in the manufacturing process. Two different compounds are characterized under axial compression and under finishing operations. The compression tests present the effect of the feed rate and the strain accumulative effect in the fixture compressive behavior. Despite the higher strain variability of the softer rubber, different milling process parameters, such as the tool feed rate, can lead to a similar compressive behavior of the fixture regardless the elastomer hardness. On the other hand, the characterization of these flexible fixtures is completed over AA2024 floor milling of rigid parts and compared with the use of a rigid part clamping. These results show that, as the cutting speed and the feed rate increases, due to the strain evolution of the rubber, the part quality obtained tend to equalize between the flexible and the rigid clamping of the workpiece. Due to the versatility of the NBR for clamping different part geometries without new fixture redesigns, this leads to a competitive advantage of these flexible solutions against the classic rigid vacuum fixtures. Finally, a model to predict the grooving forces with a bull-nose end mill regardless of the stiffness of the part support is proposed and validated for the working range.

Graphical Abstract

1. Introduction

Monolithic aluminum components are widely employed in the aeronautical sector due to their good strength-to-weight ratio [1]. The final quality of these parts is normally obtained or improved in the finishing operation and it is influenced by static and dynamic phenomena [2].
On the one hand, from the static point of view, cutting forces and part clamping produce elastic deformation that can lead to deteriorating the final dimension and the surface of the workpiece [3]. On the other hand, vibrations increase the roughness of the parts. These dynamic instabilities become frequent in the milling operation and are produced by the lack of dynamic stiffness in one or more components of the system [4]. The most characteristic vibrations appeared in the milling operation are the self-excited vibrations or chatter [5,6]. However, even in the absence of chatter, it almost always exists forced vibrations derived from the periodic excitation of the intermittent cutting engagement of the milling cutter on the workpiece [7].
Thus, in order to improve the part quality different approach has been studied. First, the tuning of the cutting parameters can lead to static and dynamic improvements. Thus, a process forces reduction leads to a decrease of the elastic deformation of the workpiece that it is reflected in the part accuracy. For instance, Perez et al. [8] obtained a machining forces reduction and an improvement of the compressive residual stresses with the increase of the cutting speed. On the other hand, in terms of vibrations, different surveys have been developed for the improvement of the system dynamic stability and the obtained surface quality. Different stability models have been developed for the milling operations of compliant systems [9,10] and the effect of the cutting parameters on the process damping have been analyzed [11]. However, these solutions are limited for the inherent stiffness of the system.
The key element for the increase of the system stiffness is the workpiece clamping. Thus, different part-fixture systems have been employed to guarantee a suitable part positioning and fixing [12]. Due to the lack of dynamic stability of some of these solutions, different damping features have been implemented in the system in order to improve the machining process. Thus, different active features based on the use of eddy currents [13,14], pivot mechanism [15,16] and piezoelectric dampers [17] have been studied. These solutions are cost efficient and their implementation is limited to certain applications.
The use of passive damping elements is increasing for milling operations as they are more cost efficient compared to the active developments. The passive damping systems are based in the implementation of different elements or fluids with outstanding damping properties to stabilize dynamically the system. Thus, by employing electrorheological [18] or magnetorheological [19] fluids, the vibration amplitude of the cutting processes varies and the part quality is improved. Moreover, in order to increase the narrow vibration band of these passive dampers, Yang et al. [20] developed a tunable passive devices. However, the industrial implementation of these passive solutions are challenging as they interfere with the clamping of the workpiece and the machining process.
In the present study, the use of an elastomer layer employed as a passive damping element is proposed and characterized. Elastomers, particularly rubber materials, are ideal materials for vibrations isolation as they are low in cost with high internal friction [21]. Moreover, the industrial implementation of these compounds for machining applications is feasible as they are employed as passive control of vibration [22,23,24]. In fact, the damping properties of these elastomers have been analyzed for low frequency [25] and high frequency applications [26], including under certain machining operations. For instance, Kolloru et al. [27] employed neoprene layers combined with torsion springs to reduce up to eight times the vibration in the milling process of circular thin-wall components. On the other hand, Liu et al. [28] implemented a viscoelastic material in the toolholder to increase by 99% its damping ratio. Nevertheless, there is no study of the direct application of rubber materials as the clamping element of workpieces in milling operations.
In this case, in order to combine a fixture and a passive damping system the use of a nitrile butadiene rubber (NBR) layer is proposed. This sort of elastomers is one of the most employed seal component in the oil and gas industry [29], and the proposed development benefitted from these outstanding sealing properties [30,31] to transform a flexible layer into a suitable vacuum table. Hence, these solutions enable milling in aggressive environments, with capacity to clamp different geometries. Moreover, as the passive damping element act as a fixture, its industrial implementation is feasible as the interference with the rest of the machining system is reduced.
In order to characterize the behavior of these elastic polymers under the machining processes loads, compression tests and milling tests have been performed. Thus, these flexible solutions have been characterized in terms of chatter and forced vibrations performed by the milling tool.
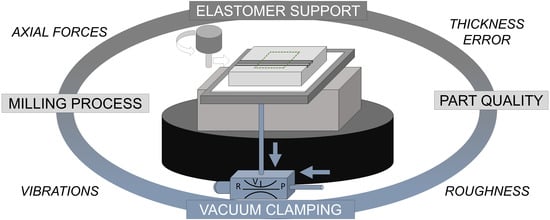
Regardless the milling strategy, the most aggressive machining zone is the entrance of each pocketing where the tool machines with an axial pitch equal to its diameter. Thus, the analysis is focused in the grooving application with depth of cuts defined by finishing operations. The suitability survey is performed in terms of part quality. First, the machined depth is measured to quantify the groove thickness error. Then, the floor roughness is measured and analyzed. Finally, the dynamic behavior of each system is characterized, and a universal force model is developed for the grooving operation in finishing applications.

2. Materials and Methods

Two different NBR layers were selected for the analysis as these passive elements are defined by different vibration bands. The mechanical properties of both vulcanized rubber materials are shown on Table 1. Besides the hardness and the density, the compounds ingredients are given, where the carbon black is a form of elemental carbon that is used to increase the resistance of rubber and also to improve the tensile strength [32].
The mechanical behavior of rubber depends on the amplitude, feed rate and frequency of the applied load, combined with the temperature of the material [33]. In the case of milling operations, the amplitude and feed rate of the applied forces are completely defined by the machining conditions.
Similarly, the load frequencies suffered by the part are generated by the milling tool rotation and by the workpiece fundamental modes. Finally, the temperature of the material is influenced by the heat generated on the cutting zone and the room temperature.
Based on the load application strategies employed on this survey, some simplifications were considered. For instance, the decrease in stiffness during the first few cyclic loads, the so-called Mullins effect [34], was neglected. Therefore, different loads prior to each test were performed over each elastomer layer. The characteristics of these loads were defined in terms of the test to perform. Thus, for compression tests, a compression load was performed prior to each test. Likewise, prior to each milling test, a previous groove was performed to reduce the Mullins effect on the rubber and to level the upper side of each slot.
Finally, due to the reduced compression loads during the machining operation and the wide part area in contact with the elastomer layer, the expected strain amplitudes are minimal. Therefore, it is not considered a rubber heat up due to material damping derived from large harmonic loads [33]. Hence, due to the part thickness located between the cutting zone and the rubber layer, the temperature of the rubber was considered as the room value.
Tests were performed in a standard 5-axis numeric control (NC) center. The selected geometry for the elastomer layers was a 300 × 300 mm2. The mean value of the thickness for both cases was 14.2 mm with a tolerance of ±5%. In order to guarantee a uniform contact and clamping conditions between the part and the elastic material, a slot grid was machined in each rubber layer (Figure 1a). Thus, the vacuum clamping force was distributed along the contact area by means of the channels. Then, the air was removed through a unique orifice and the part could be safely clamped during the machining operation, as shown in Figure 1b.
Both, the compression of the rubber and the part profile before and after each milling tests were monitored with a GT1000 type linear variable differential transformer (LVDT) gauging transducer (RDP Group, Wolverhampton, UK). The forces were registered with Kistler 9257B measurement equipment (Kistler Ibérica S.L., Granollers, Spain). In each test, following another similar set-up [35], the part and the elastic element were attached to the force sensor with a synthetic rubber adhesive. This double-sided filmic tape TESA 64620 (Tesa Tape S.A., Argentona, Spain) guaranteed a homogeneous clamping due to the compressive nature of the axial loads in compression and milling tests.

2.1. Compression Tests

For most of engineering rubbers, material damping is caused by two different mechanism, resulting in amplitude and rate dependent behavior [36]. Thus, the objective of these compression tests is characterizing the effect of the feed rate on the strain and comparing the influence of the strain cycles on each rubber. In general, compression tests on rubber materials are performed with circular samples [37]. However, in order to include the effect of the slots in the material deformation, the tests are implemented in the same elastic layer employed as vacuum fixture, see Figure 2.
The axial loads were applied by the machine head by means of a cylindrical punch and its position was monitored with a LVDT. The feed rates conditions were selected based on the most extreme cases tested in the milling tests. Three repetitions were performed for each condition and, in order to evaluate the strain accumulative effect, a 15 min relaxation period was guaranteed between the successive tests.

2.2. Milling Tests

For the milling survey, the same adapted rubber layers were employed. The part samples to be machined were 20 mm thick AA2024-T3 rigid blocks. These parts were 240 × 240 mm2 wide and were located in the center of the elastic support. Hence, any rubber edge effect could be neglected, and its local thickness tolerance was diminished from ±5% to ±3%. In order to reduce the vacuum leaks a 290 × 290 × 0.7 mm3 sacrificial porous layer was included between the elastic element and the specimen to be machined. Hence, the vacuum leaks depended on the part area and it was not influenced by the part contour. Thus, different part geometries could be clamped without any fixture redesign.
The air from the channels was removed through the hole with a standard Venturi guaranteeing a proper vacuum union between the rubber and the aluminum part sample for all the working range, see Figure 3. Then, the rubber was held to the dynamometric table with the double-sided filmic tape. In the tests with no rubber, the part sample was stuck directly to the Kistler by the same token.
Groove milling was the selected machining operation. These slots were dry machined side to side, in two steps. First, a previous 0.2 mm groove was performed in order to guarantee the same initial profile between tests. Then, the test with each condition was milled. The separation between each groove was 10 mm.
The selected tool was a two flutes bull-nose end-mill Kendu 4400 (Kendu, Segura, Spain), with a diameter of 10 mm and a 2.5 mm edge radius. Table 2 shows the tests conditions. Therefore, the effect of the depth of cut ( a p ), feed per tooth ( f z ), spindle speed ( n ) or cutting speed ( v c ) and the tool feed rate ( f ) on both elastic polymers could be studied and compared with the use of a rigid clamping. Two different depth of cuts were selected based on the values employed in finishing operations in the aeronautic field [38]. On the other hand, three different tool rotation values were studied in order to reduce vibrations generated out of the tool-part system while two feed per tooth values were selected for maintaining a suitable milling process of aluminum parts [9,38]. Hence, based on the feed per tooth and spindle speed configurations, six different milling conditions were analyzed for each depth of cut.
For each milling condition, three repetitions were performed in different random positions relative to the center of the part. The analyzed zone was restricted to each groove middle area. Then, the real machined thickness was evaluated by measuring the part profile beforehand and afterward each milling operation. This measure was performed with the previously presented LVDT attached to the machine tool head with an adaptor. Besides, the roughness of the floor of each slot was measured in four different zones equally separated by 20 mm. Thus, the R a value was evaluated with a Mitutoyo Surftest SV-2000 (Mitutoyo, Kawasaki, Japan) roughness measure station. As a reference, the typical tolerance values in the aeronautical industry were about ±0.1 mm for final thickness and under 1.6 µm for the R a [39].

2.3. Force Mechanistic Model in the Tool Axis Direction with a Bull-Nose Mill

In order to evaluate the stability for each set-up, stability lobe diagrams (SLD) were calculated in the specimen center with an impact hammer test. A uniaxial PCB accelerometer model 352C22 (PCB Piezotronics, Inc, Depew, NY, USA) with a measuring range from 1 kHz to 10 kHz and a sensitivity of 1.0 mV/(m/s2) was employed to register the tool and part vibration. The maximum acceptable a p in the stable regime is calculated with the model described by Altintas and Budak [10]. The cutting forces (tangential ( t ), radial ( r ) and axial ( a )) over the cutting edge i could be considered as a function of the friction coefficients ( K t e , K r e and K a e ) and the shearing cutting coefficients ( K t c , K r c and K a c )
{ F t F r F a } =   { K t e K r e K a e } × S +   { K t c K r c K a c } × f z × s i n ϕ i × z
In this equation, S is the length of the differential chip edge, ϕ i is the angular position of the cutting edge i measured from axis Y , perpendicular to the tool feed direction, and z is the depth of cut.
Compared with other tool geometries, bull-nose end mills have a variable radius and helix angle along the tool axis. Likewise, the lead angle increases its value from 0° to 90° in the toroidal part, and then kept constant and equal to 90° all along the flank [40].
This geometrical variation combined with cutting speed and the depth of cut leads to variable cutting coefficients. This nonlinearity could be solved using a linear model to calculate the SLD [9]. However, Altintas [41], simplified a circular insert geometry taking an average edge angle of 45°.
In this case, the model was oriented to the floor finishing application. For these cases machined depths were usually focused in a range between 0.2 mm and 1.2 mm, mainly in low stiffness parts. This means that the edge angle was located between 11° and 29°. Thus, for this survey, the average edge angle was defined as 20°.
The friction and shearing cutting coefficients were obtained by solving the equation by using the force values obtained in the milling tests. These coefficients were considered constant for all the milling conditions. The model results were employed to predict the SLD for each flexible fixture and compared with the use of a rigid clamping underneath the part sample. Moreover, with the axial forces obtained in these tests, a model was proposed regardless of the hardness of the support.

3. Results

3.1. Rubbers Compressive Behaviour

The differences in the composition of each tested rubber led to a completely different stress-strain behavior. In the Figure 4 it can be observed the strain variation of each rubber based on the stress and feed rate evolution. This evolution is presented with a fifth-degree interpolation in order to visualize the more linear behavior of rubber B compared with rubber A.
Both elastomers increased their elastic modulus as the feed rate rose. The rate effect was usually attributed to the resistance in reorganizing the polymeric chains during the loading period. Since this reorganization cannot occur instantaneously, the loss of energy is rate dependent [33]. Moreover, the polymeric chains in the rubber A lacked time in the relaxing period to return to the original state and, thus, the elastic modulus decreased for the second and third trial. This effect was not noticeable in the rubber B. However, it can be observed that, as the feed rates increased, the behavior of both elastomers tended to match for stresses under 0.4 MPa, which was within the work range for the milling tests. Hence, regardless of the rubber composition, these flexible fixtures presented stress-strain behavior influenced by the load amplitude and feed rate transmitted by the tool and by the previous deformation implemented on the rubber.

3.2. Thickness Error

The thickness error is defined as the difference between the experimental and theoretical thickness. In addition to the static and dynamic phenomena that occurred when applying loads over the elastic layers, other effects such as the machine precision, repeatability and the thermal expansion of the spindle had an influence over the real machined thickness. For instance, the repeatability for the rubber A was within ±9 µm, for the rubber B was within ±19 µm and for the use of no rubber was within ±8 µm.
In order to analyze this parameter, an analysis of variance (ANOVA) was employed. Thus, the influence of the main machining parameters in the thickness error was evaluated. Therefore, first, the normal distribution of the data was checked by the Anderson-Darling (AD) test, and the variance homogeneity with the Bartlett’s test. In both cases, the confidence interval of 95% (α = 0.05) was employed. As it can be observed in the Table 3, for all the tests their p-values were over α and, thus, were suitable for an ANOVA.
On the other hand, a variance analysis was performed to determine the main parameters affecting the machined depth inaccuracy. In this case, the null hypothesis was that the factors or their combination have no influence over the thickness error. As it is detailed in the Table 4, from this survey it was obtained that, with a 95% confidence, the null hypothesis was proved to be true. The only exception was the effect of spindle speed in the case of the rubber A as its p-value was under α, see Table 4 values in bold.
This result was coherent with the compression tests, as the rubber A was the most sensible to strain changes. Furthermore, as it can be observed in the Figure 5, there was a global decrease in the thickness mean error as the v c increased. In this case, the positives values meant that the system was compressed, and the depth of cut was lower than programmed. This effect, as expected, was more noticeable with the use of rubber as a support. In the other hand, if the thickness error had a negative value, it meant that the tool machined more depth than expected. This last effect was mainly caused by the thermal expansion of the spindle, as it increased combined with the revolutions [42]. This error can be compensated previous to the machining [43] or even with in-process tool position adjustments [44,45].
Another noticeable effect was that, as the cutting speed increased, the thickness errors tended to equalize. This effect matched with the fact that, due to the cutting conditions tested, as the cutting speed rose, the feed rates increased accordingly. Then, as it is observed in the compression analysis, the elastic modulus of the rubbers rose as the feed rates increased, leading to a more rigid-like support. This is aligned with the industrial implementation of this system in milling operations of aluminum, as the productivity of these applications tend to the employment of these or even higher cutting speeds.
Finally, there was a thickness error component that was caused by the system vibration and that produced the difference in the variability of each system. This vibration was analyzed in terms of roughness in the next section.

3.3. Roughness

In order to analyze the effect of the machining parameters on the floor R a on the slots, another ANOVA was performed. Likewise in the thickness error analysis, the data suitability was analyzed with an AD and a Bartlett’s test. As shown in the Table 5, it was demonstrated that data met, with 95% of confidence, the requirements for a valid ANOVA.
With this data, a variance analysis was replicated based on the effect of the machining parameter on the roughness obtained on the groove floor. As it is can be observed in the Table 6 in bold, compared with the thickness error, more parameters and their combination affected the part vibration. This influence was more noticeable in the rubber A, as it happened with the thickness error, due to a higher sensibility to strain variations.
Despite the dependence on the machining parameters of the roughness, there was no direct influence of a single parameter into the behavior of the three systems at a time. However, it was clear that the most influential parameters were the spindle speed and the feed rate. Thus, in the Figure 6, it can be observed the evolution of the roughness with the increase of the cutting speed and the feed per tooth. In this case the repeatability for the rubber A was within ±0.13 µm, for the rubber B was within ±0.17 µm and for the use of no rubber was within ±0.11 µm.
Results show that roughness obtained with rubber A tended to match the one obtained with the part robustly clamped to the machine as the cutting speed increased. This effect, as explained in the case of the thickness error, was caused by the increase of the elastic modulus. However, this increase in the cutting speed has to be balanced with the feed rate in order to maintain the feed per tooth.
On the other hand, rubber B tests suffered higher roughness and wider variability. As the stiffness of rubber B was above the rubber A’s, the instability must be caused by the vacuum union between the part and the rubber. Thus, due to the higher hardness of the rubber B, the contact with the part did not perform proper clamping conditions as the rubber A.
This analysis indicates that cutting loads applied by the machining tool did not affect exclusively the rubber compression but the clamping suitability as well. Despite rubber A having more variable compression behavior, its lower hardness improved the fixture clamping capacity and the obtained part quality.

3.4. Force Model

The SLD performed over the three systems, as shown in the Figure 7, presented the identical behavior of them. The reason was the combination of a hammer shot at a high feed rate and a wide supporting area of the rigid part. Then, as observed in the compression tests, these fixtures based on elastomers, at high feed rates behaved as a rigid system in terms of chatter vibrations. Thus, these results proved that there was no chatter on the performed milling tests as the maximum depths of the cut were below these curves.
The analysis of the force harmonics, see Figure 8, confirmed that the vibration was mainly influenced by the tool cutting loads. The case of rubber A and no rubber had similar behavior, with lower amplitudes and with the cutting per tooth as the main driver of the vibration. However, the forced vibrations at different harmonics were higher in rubber B. Once again, this evidence confirmed that the union between rubber B and the part was not completely suitable.
Then, the main cutting forces in the axial direction were studied following an empirical approach in order to provide a suitable model able to relate them with the machining parameters regardless the part support. The repeatability for all the tests was within ±2 N. The process parameters were grouped around the material removal rate (MRR), where N is the number of teeth, and a r is the radial depth of cut:
M R R = n × f z × a p × N × a r
The model is based on a potential regression, see Equation (3). The R 2 of this model is 0.984. This equation emphasized, once again, the strong influence of the cutting speed on the machining process
F z = 67.22 × n 0.58 × M R R 0.49
Figure 9 presents how the model fits with the analyzed data. As it can be observed, the main forces could be modeled regardless of the part support. López de Lacalle et al. [46] noticed that the cutting forces decreased due to the reduction of stiffness. However, by using a rubber underneath a high stiffness part sample, the system flexibility can be considered not compromised as the cutting forces are maintained.
Finally, this model demonstrated that the process axial forces in finishing of the aluminum parts did not depend on the material hardness or the accumulative strain state of the rubber. This facilitates the implementation of these flexible fixtures in the industry and provides a calculation tool for the improvement of the milling process productivity.

4. Conclusions

In this paper the effect of clamping high stiffness aluminum part samples over elastomer layers was analyzed. The machining application was groove milling, simulating finishing conditions in the aeronautic field. First, by a compression test the influence of stress amplitude, feed rate and cycles were examined. Thus, the rise of the elastic modulus as the strain rates increased and the strong dependence of the stress cycles were proved, especially for the soft rubber.
Then, the effect of cutting speed, tool feed and depth of the cut were analyzed in terms of the machined thickness error, roughness and axial forces. The results show that, as the cutting speed increases combined with the feed rate, the rubbers tended to behave like a rigid support, guaranteeing the thickness and roughness tolerances required in certain aeronautic applications. Moreover, as on these applications high speed machining operations were performed with higher cutting speeds and feed rates, the results of this solutions could improve compared to the actual rigid clamping solutions. In terms of hardness, the softer rubber tended to provide more stable machining conditions due to a better clamping capacity.
Finally, an axial force model was developed and validated regardless the support stiffness and accumulative strain. This could lead to facilitate the implementation and improve the productivity of this solution into certain industrial applications, including the milling of aeronautical aluminum parts.

Author Contributions

Conceptualization, A.R.-M., A.R. and A.L.; methodology, A.R.-M., E.U. and A.L.; software, A.R.-M.; validation A.R.-M. and E.U.; formal analysis, A.R.-M.; investigation A.R.-M.; resources, A.R. and A.L.; data curation, A.R.-M.; writing—original draft preparation, A.R.-M.; writing—review and editing, A.R.-M. and E.U.; visualization, A.R.-M.; supervision, A.R., E.U. and A.L.; project administration, A.R. and A.L; funding acquisition, A.R. All authors have read and agreed to the published version of the manuscript.

Funding

This research was funded by Basque Government (Eusko Jaurlaritza) under the ELKARTEK Program, SMAR3NAK project, grant number KK-2019/00051.

Conflicts of Interest

The authors declare no conflict of interest. The funders had no role in the design of the study; in the collection, analyses, or interpretation of data; in the writing of the manuscript, or in the decision to publish the results.

References

  1. Herranz, S.; Campa, F.J.; De Lacalle, L.L.; Rivero, A.; Lamikiz, A.; Ukar, E.; Sánchez, J.A.; Bravo, U. The milling of airframe components with low rigidity: A general approach to avoid static and dynamic problems. Proc. Inst. Mech. Eng. Part B J. Eng. Manuf. 2005, 219, 789–801. [Google Scholar] [CrossRef]
  2. Del Sol, I.; Rivero, A.; López de Lacalle, L.N.; Gamez, A.J. Thin-Wall Machining of Light Alloys: A Review of Models and Industrial Approaches. Materials 2019, 12, 2012. [Google Scholar] [CrossRef] [Green Version]
  3. Chen, W.; Xue, J.; Tang, D.; Chen, H.; Qu, S. Deformation prediction and error compensation in multilayer milling processes for thin-walled parts. Int. J. Mach. Tools Manuf. 2009, 49, 859–864. [Google Scholar] [CrossRef]
  4. Yue, C.; Gao, H.; Liu, X.; Liang, S.Y.; Wang, L. A review of chatter vibration research in milling. Chin. J. Aeronaut. 2019, 32, 215–242. [Google Scholar] [CrossRef]
  5. Eynian, M. Vibration frequencies in stable and unstable milling. Int. J. Mach. Tools Manuf. 2015, 90, 44–49. [Google Scholar] [CrossRef]
  6. Gurdal, O.; Ozturk, E.; Sims, N.D. Analysis of Process Damping in Milling. Procedia CIRP 2016, 55, 152–157. [Google Scholar] [CrossRef] [Green Version]
  7. Huang, C.-Y.; Wang, J.-J.J. A pole/zero cancellation approach to reducing forced vibration in end milling. Int. J. Mach. Tools Manuf. 2010, 50, 601–610. [Google Scholar] [CrossRef]
  8. Perez, I.; Madariaga, A.; Cuesta, M.; Garay, A.; Arrazola, P.J.; Ruiz, J.J.; Rubio, F.J.; Sanchez, R. Effect of cutting speed on the surface integrity of face milled 7050-T7451 aluminium workpieces. Procedia CIRP 2018, 71, 460–465. [Google Scholar] [CrossRef]
  9. Campa, F.J.; Lopez de Lacalle, L.N.; Celaya, A. Chatter avoidance in the milling of thin floors with bull-nose end mills: Model and stability diagrams. Int. J. Mach. Tools Manuf. 2011, 51, 43–53. [Google Scholar] [CrossRef] [Green Version]
  10. Altintaş, Y.; Budak, E. Analytical Prediction of Stability Lobes in Milling. CIRP Ann. 1995, 44, 357–362. [Google Scholar] [CrossRef]
  11. Huang, C.-Y.; Wang, J.-J.J. Effects of cutting conditions on dynamic cutting factor and process damping in milling. Int. J. Mach. Tools Manuf. 2011, 51, 320–330. [Google Scholar] [CrossRef]
  12. Gameros, A.; Lowth, S.; Axinte, D.; Nagy-Sochacki, A.; Craig, O.; Siller, H.R. State-of-the-art in fixture systems for the manufacture and assembly of rigid components: A review. Int. J. Mach. Tools Manuf. 2017, 123, 1–21. [Google Scholar] [CrossRef]
  13. Butt, M.A.; Yang, Y.; Pei, X.; Liu, Q. Five-axis milling vibration attenuation of freeform thin-walled part by eddy current damping. Precis. Eng. 2018, 51, 682–690. [Google Scholar] [CrossRef]
  14. Yang, Y.; Xu, D.; Liu, Q. Milling vibration attenuation by eddy current damping. Int. J. Adv. Manuf. Technol. 2015, 81, 445–454. [Google Scholar] [CrossRef]
  15. Fei, J.; Lin, B.; Yan, S.; Ding, M.; Xiao, J.; Zhang, J.; Zhang, X.; Ji, C.; Sui, T. Chatter mitigation using moving damper. J. Sound Vib. 2017, 410, 49–63. [Google Scholar] [CrossRef]
  16. Matsubara, A.; Taniyama, Y.; Wang, J.; Kono, D. Design of a support system with a pivot mechanism for suppressing vibrations in thin-wall milling. CIRP Ann. 2017, 66, 381–384. [Google Scholar] [CrossRef]
  17. Zhang, Y.; Sims, N.D. Milling workpiece chatter avoidance using piezoelectric active damping: A feasibility study. Smart Mater. Struct. 2005, 14, N65. [Google Scholar] [CrossRef]
  18. Wang, M.; Fei, R. Chatter suppression based on nonlinear vibration characteristic of electrorheological fluids. Int. J. Mach. Tools Manuf. 1999, 39, 1925–1934. [Google Scholar] [CrossRef]
  19. Ma, J.; Zhang, D.; Wu, B.; Luo, M.; Chen, B. Vibration suppression of thin-walled workpiece machining considering external damping properties based on magnetorheological fluids flexible fixture. Chin. J. Aeronaut. 2016, 29, 1074–1083. [Google Scholar] [CrossRef] [Green Version]
  20. Yang, Y.; Xie, R.; Liu, Q. Design of a passive damper with tunable stiffness and its application in thin-walled part milling. Int. J. Adv. Manuf. Technol. 2017, 89, 2713–2720. [Google Scholar] [CrossRef]
  21. Shoyama, T.; Fujimoto, K. Direct measurement of high-frequency viscoelastic properties of pre-deformed rubber. Polym. Test. 2018, 67, 399–408. [Google Scholar] [CrossRef]
  22. Chung, D.D.L. Review: Materials for vibration damping. J. Mater. Sci. 2001, 36, 5733–5737. [Google Scholar] [CrossRef]
  23. Ge, C.; Rice, B. Impact damping ratio of a nonlinear viscoelastic foam. Polym. Test. 2018, 72, 187–195. [Google Scholar] [CrossRef]
  24. Albooyeh, A.R. The effect of addition of Multiwall Carbon Nanotubes on the vibration properties of Short Glass Fiber reinforced polypropylene and polypropylene foam composites. Polym. Test. 2019, 74, 86–98. [Google Scholar] [CrossRef]
  25. Zhao, X.; Yang, J.; Zhao, D.; Lu, Y.; Wang, W.; Zhang, L.; Nishi, T. Natural rubber/nitrile butadiene rubber/hindered phenol composites with high-damping properties. Int. J. Smart Nano Mater. 2015, 6, 239–250. [Google Scholar] [CrossRef] [Green Version]
  26. Shit, S.C.; Shah, P. A Review on Silicone Rubber. Natl. Acad. Sci. Lett. 2013, 36, 355–365. [Google Scholar] [CrossRef]
  27. Kolluru, K.; Axinte, D. Novel ancillary device for minimising machining vibrations in thin wall assemblies. Int. J. Mach. Tools Manuf. 2014, 85, 79–86. [Google Scholar] [CrossRef]
  28. Liu, Y.; Liu, Z.; Song, Q.; Wang, B. Analysis and implementation of chatter frequency dependent constrained layer damping tool holder for stability improvement in turning process. J. Mater. Process. Technol. 2019, 266, 687–695. [Google Scholar] [CrossRef]
  29. Patel, H.; Salehi, S.; Ahmed, R.; Teodoriu, C. Review of elastomer seal assemblies in oil & gas wells: Performance evaluation, failure mechanisms, and gaps in industry standards. J. Pet. Sci. Eng. 2019, 179, 1046–1062. [Google Scholar] [CrossRef]
  30. Mitra, S.; Ghanbari-Siahkali, A.; Almdal, K. A novel method for monitoring chemical degradation of crosslinked rubber by stress relaxation under tension. Polym. Degrad. Stab. 2006, 91, 2520–2526. [Google Scholar] [CrossRef]
  31. Da Rocha, E.B.D.; Linhares, F.N.; Gabriel, C.F.S.; De Sousa, A.M.F.; Furtado, C.R.G. Stress relaxation of nitrile rubber composites filled with a hybrid metakaolin/carbon black filler under tensile and compressive forces. Appl. Clay Sci. 2018, 151, 181–188. [Google Scholar] [CrossRef]
  32. Mallipudi, P.K.; Ramanaiah, N. Effect of Carbon Black on the Performance of Nitrile Rubber For Analyzing Free Layered Surface Damping Treatment. Mater. Today Proc. 2019, 18, 3371–3379. [Google Scholar] [CrossRef]
  33. Olsson, A.K. Finite Element Procedures in Modelling the Dynamic Properties of Rubber; Department of Construction Sciences, Structural Mechanics, Lund University: Lund, Sweden, 2007. [Google Scholar]
  34. Mullins, L. Softening of Rubber by Deformation. Rubber Chem. Technol. 1969, 42, 339–362. [Google Scholar] [CrossRef]
  35. Balasubramanian, P.; Ferrari, G.; Amabili, M. Identification of the viscoelastic response and nonlinear damping of a rubber plate in nonlinear vibration regime. Mech. Syst. Signal Process. 2018, 111, 376–398. [Google Scholar] [CrossRef]
  36. Austrell, P.-E.; Olsson, A.K. Modelling procedures and properties of rubber in rolling contact. Polym. Test. 2013, 32, 306–312. [Google Scholar] [CrossRef]
  37. ASTM D 395. Standard test method for rubber. In Philadelphia: Annual Book of ASTM Standards; American Society for Testing and Materials: West Conshohocken, PA, USA, 1955. [Google Scholar]
  38. Del Sol, I.; Rivero, A.; Salguero, J.; Fernández-Vidal, S.R.; Marcos, M. Tool-path effect on the geometric deviations in the machining of UNS A92024 aeronautic skins. Procedia Manuf. 2017, 13, 639–646. [Google Scholar] [CrossRef] [Green Version]
  39. Del Sol, I.; Rivero, A.; Gamez, A.J. Effects of Machining Parameters on the Quality in Machining of Aluminium Alloys Thin Plates. Metals 2019, 9, 927. [Google Scholar] [CrossRef] [Green Version]
  40. Engin, S.; Altintas, Y. Mechanics and dynamics of general milling cutters.: Part I: Helical end mills. Int. J. Mach. Tools Manuf. 2001, 41, 2195–2212. [Google Scholar] [CrossRef]
  41. Altintas, Y. Analytical Prediction of Three Dimensional Chatter Stability in Milling. JSME Int. J. Ser. C Mech. Syst. Mach. Elem. Manuf. 2001, 44, 717–723. [Google Scholar] [CrossRef] [Green Version]
  42. Chen, J.-S.; Hsu, W.-Y. Characterizations and models for the thermal growth of a motorized high speed spindle. Int. J. Mach. Tools Manuf. 2003, 43, 1163–1170. [Google Scholar] [CrossRef]
  43. Ratchev, S.; Liu, S.; Huang, W.; Becker, A.A. Milling error prediction and compensation in machining of low-rigidity parts. Int. J. Mach. Tools Manuf. 2004, 44, 1629–1641. [Google Scholar] [CrossRef]
  44. Rubio-Mateos, A.; Rivero, A.; del Sol, I.; Ukar, E.; Lamikiz, A. Capacitation of flexibles fixtures for its use in high quality machining processes: An application case of the industry 4.0. paradigm. DYNA 2018, 93, 608–612. [Google Scholar] [CrossRef] [Green Version]
  45. Bi, Q.; Huang, N.; Zhang, S.; Shuai, C.; Wang, Y. Adaptive machining for curved contour on deformed large skin based on on-machine measurement and isometric mapping. Int. J. Mach. Tools Manuf. 2019, 136, 34–44. [Google Scholar] [CrossRef]
  46. De Lacalle, L.N.L.; Lamikiz, A.; Sánchez, J.A.; de Bustos, I.F. Recording of real cutting forces along the milling of complex parts. Mechatronics 2006, 16, 21–32. [Google Scholar] [CrossRef]
Figure 1. Adapted rubber: (a) vacuum channels distribution. (b) Rubber layer implementation as a vacuum fixture on milling tests.
Metals 10 00289 g001
Figure 2. Compression test procedure: (a) set-up scheme. (b) Load application zone.
Metals 10 00289 g002
Figure 3. Milling test set-up with and without a rubber layer.
Metals 10 00289 g003
Figure 4. Accumulative stress and feed rate increase effects on both rubber materials: (a) rubber A and (b) rubber B.
Metals 10 00289 g004
Figure 5. Thickness error evolution based on the v c variation.
Metals 10 00289 g005
Figure 6. Roughness evolution: (a) based on the cutting speed and (b) based on the feed per tooth.
Metals 10 00289 g006
Figure 7. Stability Lobe Diagrams (SLD) variation: (a) complete and (b) zoomed on the studied zone.
Metals 10 00289 g007
Figure 8. Fast Fourier Transform of the F z signal for the test at f z = 0.1 mm/tooth and a p = 0.8 mm, under different spindle speeds: (a) No rubber - 2000 rpm, (b) No rubber - 4000 rpm, (c) No rubber - 6000 rpm, (d) Rubber A - 2000 rpm, (e) Rubber A - 4000 rpm, (f) Rubber A - 6000 rpm, (h) Rubber B - 2000 rpm, (i) Rubber B - 4000 rpm and (j) Rubber B - 6000 rpm.
Metals 10 00289 g008
Figure 9. Axial mean loads predicted (lines) and experimental data against the material removal rate (MRR) as a function of the cutting speed ( v c ).
Metals 10 00289 g009
Table 1. Materials mechanical properties.
PropertiesRubber ARubber B
Hardness (Sh·A)6590
Density (g/cm3)1.451.43
Polymer (wt.%)37.354.6
Carbon black (wt.%)3.514.4
Other inorganic charges (wt.%)59.231.0
Table 2. Machining tests conditions.
ParametersLevel 1Level 2Level 3
Clamping materialRubber ARubber BNo rubber
a p (mm)0.20.8-
f z (mm/tooth)0.060.1-
n (rpm)200040006000
v c (m/min)63126189
f (mm/min)240; 400480; 800720; 1200
Table 3. Analysis of the suitability of the thickness error data.
AnalysisParameterRubber ARubber BNo Rubber
Normal distributionAD0.2760.3220.447
p-value0.6280.5100.257
Homogeneity of varianceBartlett’s4.4805.1602.310
p-value0.7230.6400.941
Table 4. Analysis of variance of the thickness error data.
FactorParameterRubber ARubber BNo Rubber
n F-value7.0403.2001.990
p-value0.0170.0930.178
f z F-value0.6800.4300.350
p-value0.4200.5200.562
a p F-value1.5401.9400.050
p-value0.2330.1820.830
n × f z F-value0.0000.0800.090
p-value0.9900.7870.770
n × a p F-value0.3000.0900.140
p-value0.5930.7740.716
f z × a p F-value0.5400.2800.060
p-value0.4750.6060.804
n × f z × a p F-value1.2000.0100.350
p-value0.2890.9360.563
Table 5. Analysis of the suitability of the roughness data.
AnalysisParameterRubber ARubber BNo Rubber
Normal distributionAD0.2510.4970.305
p-value0.6940.1810.528
Homogeneity of varianceBartlett’s3.40012.7505.510
p-value0.8460.0780.599
Table 6. Analysis of variance of the thickness error data.
FactorParameterRubber ARubber BNo Rubber
n F-value54.1002.88017.360
p-value0.0000.1280.003
f z F-value42.24013.9104.850
p-value0.0000.0060.059
a p F-value0.8202.6900.790
p-value0.3910.1400.399
n × f z F-value16.7402.2802.990
p-value0.0030.1700.122
n × a p F-value1.0700.1100.590
p-value0.3310.7460.464
f z × a p F-value8.3200.4600.040
p-value0.0200.5190.844
n × f z × a p F-value0.4500.0000.100
p-value0.5210.9940.755

