Article

Microstructure and Mechanical Properties of Low-Carbon High-Strength Steel Fabricated by Wire and Arc Additive Manufacturing

1
Key Laboratory of Superlight Materials & Surface Technology, Ministry of Education, College of Materials Science and Chemical Engineering, Harbin Engineering University, Harbin 150001, China
2
Harbin Welding Institute Limited Company, Harbin 150028, China
*
Author to whom correspondence should be addressed.
Metals 2020, 10(2), 216; https://doi.org/10.3390/met10020216
Submission received: 15 January 2020 / Revised: 27 January 2020 / Accepted: 29 January 2020 / Published: 3 February 2020
(This article belongs to the Special Issue Additive Manufacturing of Metals)

Abstract

:
Wire and arc additive manufacturing (WAAM) is a novel technique for fabricating large and complex components applied in the manufacturing industry. In this study, a low-carbon high-strength steel component deposited by WAAM for use in ship building was obtained. Its microstructure and mechanical properties as well as fracture mechanisms were investigated. The results showed that the microstructure consisted of an equiaxed zone, columnar zone, and inter-layer zone, while the phases formed in different parts of the deposited component were different due to various thermal cycles and cooling rates. The microhardness of the bottom and top varied from 290 HV to 260 HV, caused by temperature gradients and an inhomogeneous microstructure. Additionally, the tensile properties in transversal and longitudinal orientations show anisotropy characteristics, which was further investigated using a digital image correlation (DIC) method. This experimental fact indicated that the longitudinal tensile property has an inferior performance and tends to cause stress concentrations in the inter-layer areas due to the inclusion of more inter-layer zones. Furthermore, electron backscattered diffraction (EBSD) was applied to analyze the difference in Taylor factor between the inter-layer area and deposited area. The standard deviation of the Taylor factor in the inter-layer area was determined to be 0.907, which was larger than that in the deposited area (0.865), indicating nonuniform deformation and local stress concentration occurred in inter-layer area. Finally, as observed from the fracture morphology on the fractured surface of the sample, anisotropy was also approved by the comparison of the transversal and longitudinal tensile specimens.

1. Introduction

Low-carbon high-strength steel has been applied in many fields such as shipbuilding, automobiles, mining instruments, and railways due to its unique characteristics of mechanical properties and weldability [1]. However, it is difficult to manufacture large scale fabrications with a complex structure by means of conventional methods, and it is also time consuming with high costs. When facing these problems, additive manufacturing (AM) may be a better choice as a promising technology [2].
AM refers to a technology that usually joins materials together by layers, which has been developed rapidly due to its high material utilization and high geometric freedom [3]. Compared with conventional technologies, AM is good at manufacturing complex components, especially those that can be performance-customized within a certain time [4,5]. When considering AM technique used for metallic alloys, wire and arc additive manufacturing (WAAM) offers better competitive advantages over other techniques such as a higher deposition rate, lower cost, and high buy-to-fly ratio of components that can be realized within a shorter delivery time. Meanwhile, WAAM can also overcome many difficulties associated with manufacturing special alloys [6,7,8], such that it has increasingly shown the great potential in the manufacture of large metal parts by an arc-based process [9]. The typical WAAM can be divided into gas tungsten arc welding (GTAW), plasma arc welding (PAW), and gas metal arc welding (GMAW) as heat sources. As a modified GMAW process, cold metal transfer (CMT) has some advantages, such as low energy input, high deposition rate, no spattering, and extremely stable arc, therefore this AM technique has become a popular as well as widely used technique. The excellent characteristics of CMT make it to be an ideal process for fabricating a large-scale part, which can overcome common troubles encountered during conventional welding process [10,11]. In this study, it was adopted as the heat source during the deposition process.
Although WAAM is widely employed in AM due to its advantages, several challenges remain to be addressed such as poor surface quality, inhomogeneous microstructure, and the anisotropy of mechanical properties caused by different thermal history [12,13,14]. As a result, researchers have paid even more attention to the analysis of microstructure evolution, mechanical properties, and fracture behavior in the process of WAAM. This analysis is vital for its application in the ship building industry. Tiago A. Rodrigues et al. [15] studied the microstructure and mechanical properties of a high-strength low-alloy (HSLA) steel fabricated by WAAM. The same microstructural constituents of ferrite, bainite, martensite, and retained austenite were obtained for all heat inputs. Average values for the ultimate tensile strength ranged between 700 MPa and 795 MPa. Dai Yili et al. [16] investigated the microstructure and mechanical properties of multi-directional pipe joints using WAAM and pointed out that the microstructure consisted of 71.8% ferrite and 28.2% pearlite, while the average grain size did not exceed 15 μm. The tensile strength of the forming part reached 562 MPa. Youheng Fu et al. [17] explored the microstructure and mechanical properties of the bainitic steel WAAM part post-treated by rolling, and illustrated that hybrid deposition and micro-rolling treatment provided a novel way for the full transformation of columnar dendrites to equiaxed grains in the production of multi-pass multi-layer specimens. The maximum tensile strength reached 1309 MPa after optimizing.
As aforementioned, numerous studies have been conducted on the microstructure and mechanical properties of high-strength steel. However, few researchers have addressed the fundamental aspects of the solidification behavior and microstructure evolution as well as local strain concentration near inter-layer zones using DIC technology. In this study, a low-carbon high-strength steel developed for ship building was deposited as a thin wall component. It also analyzed the surface quality, microstructure evolution, microhardness, and transversal and longitudinal tensile properties. Finally, the relationship between fractography and the anisotropy of tensile properties was revealed.

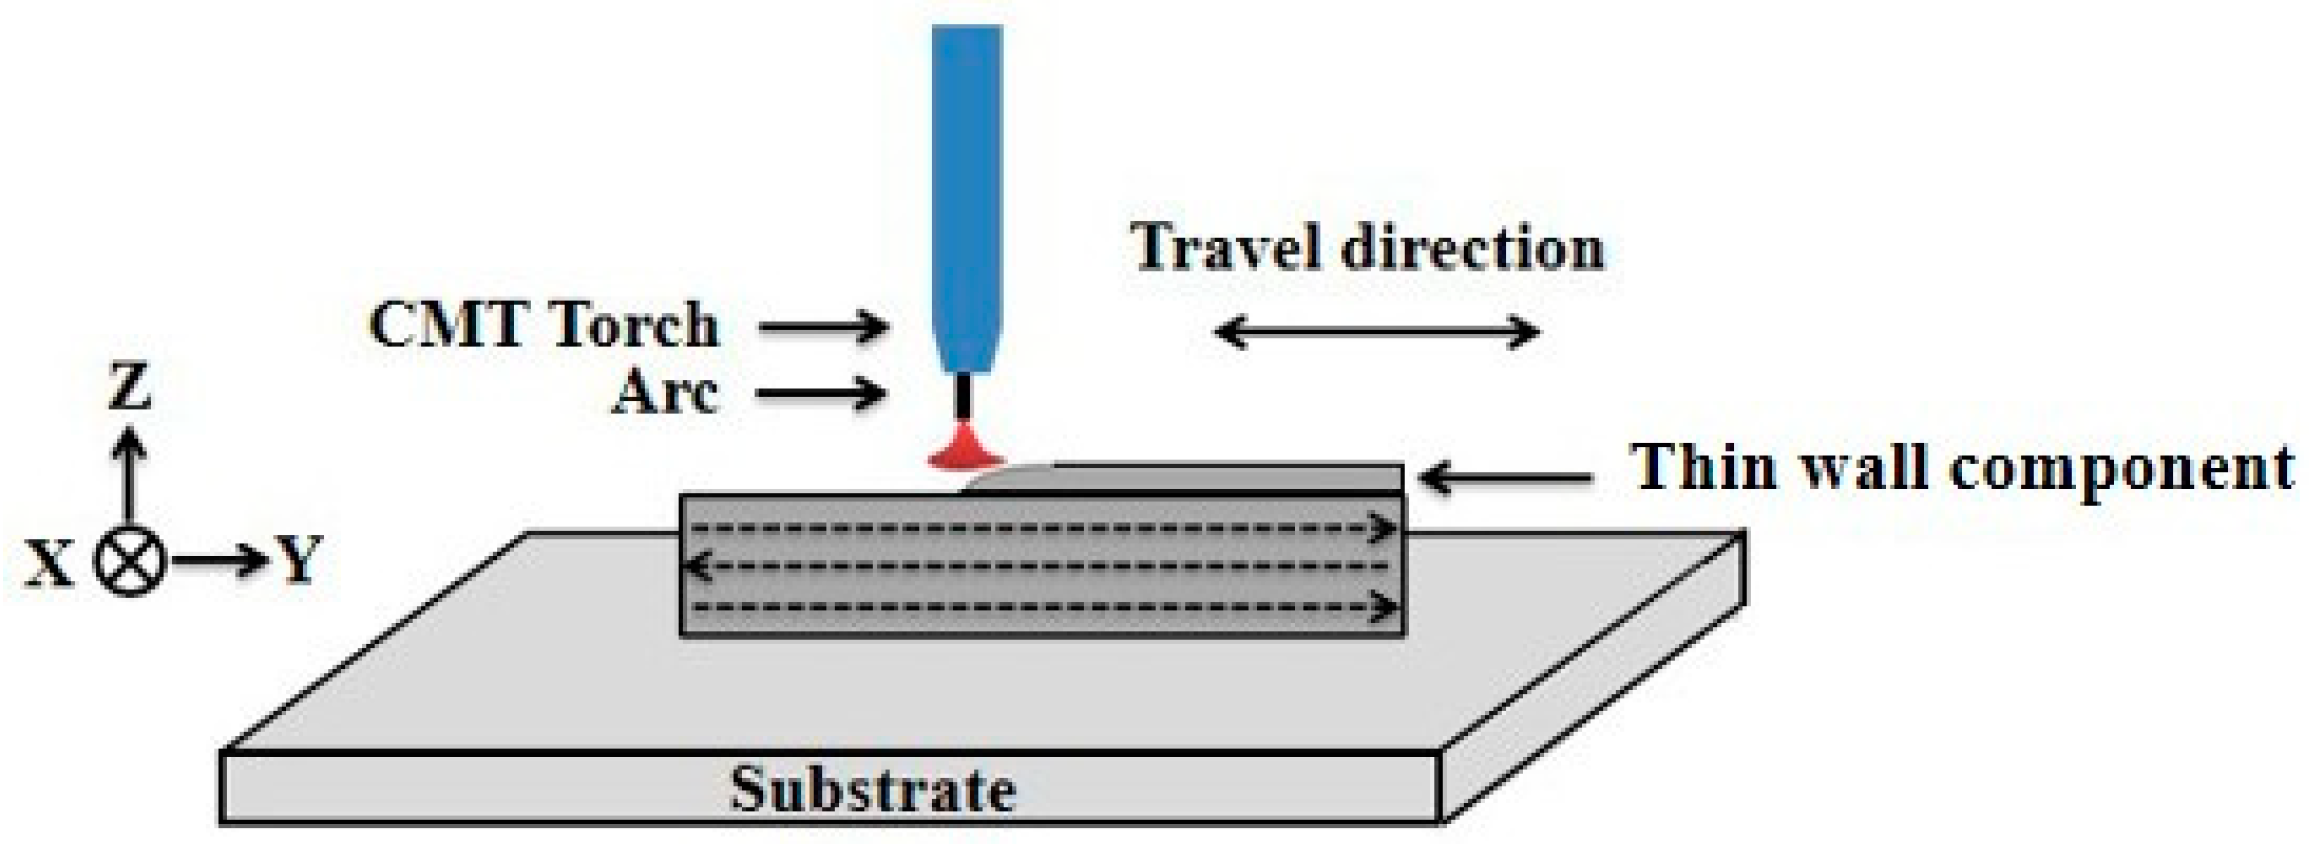
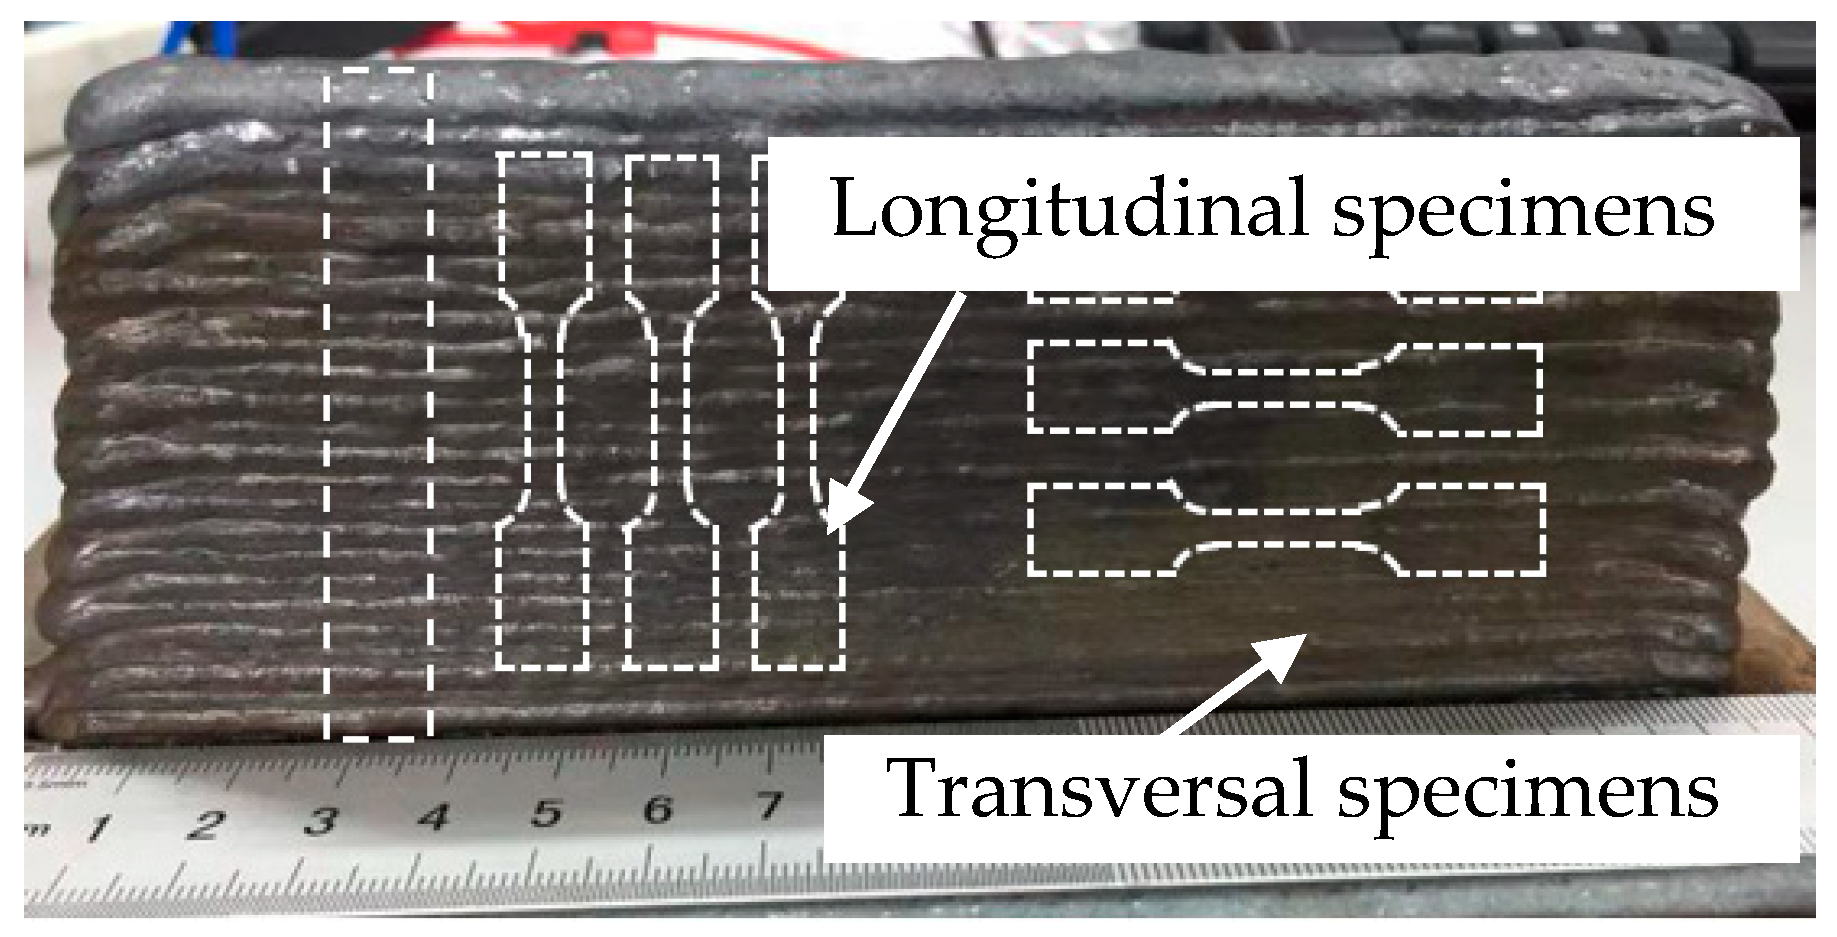
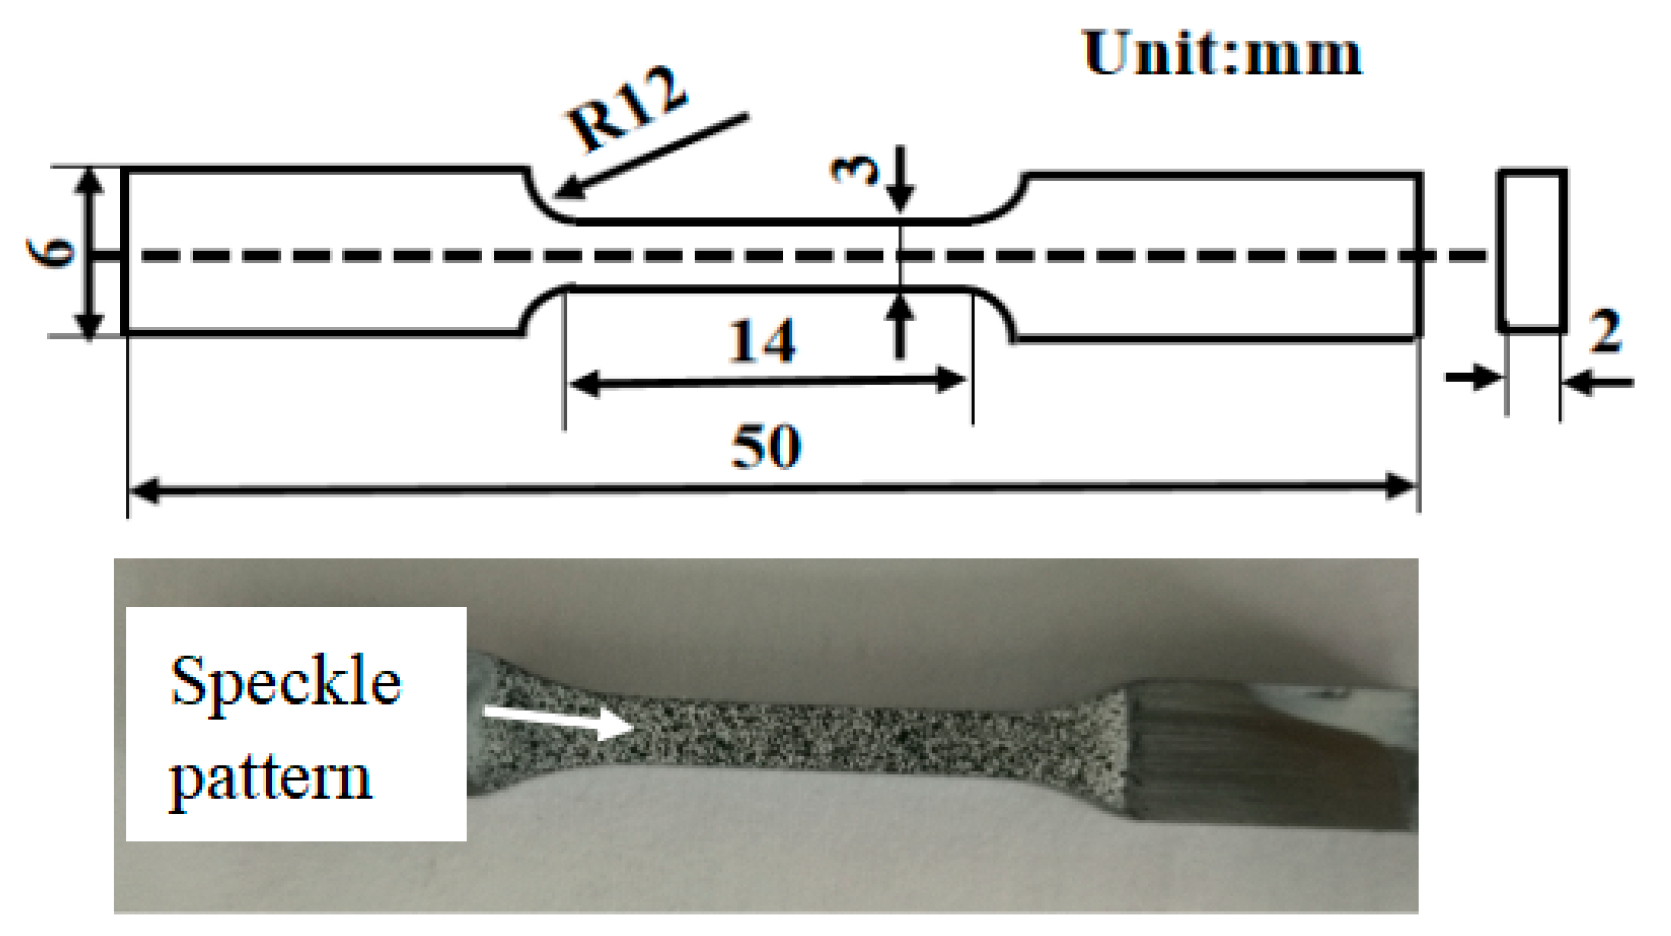
2. Materials and Methods

The experiments were conducted on a fixed substrate plate of 907 shipbuilding steel with dimensions of 150 mm × 300 mm × 10 mm. The alloy wire, called A-Fe-W-86, was developed for specific projects and used as a welding material with a 1.2 mm diameter. The chemical compositions of the tested materials are listed in Table 1.
During the deposition process, the CMT RCU 5000i (Fronius, Vienna, Austria) was used as a welding power supply and the welding wire was fed to the welding torch, which was kept stationary for each layer. The process parameters are listed in Table 2.
The deposition started from the end point of the previous layer for each subsequent layer. The path strategy was chosen in order to ensure the thickness and width of the start and end portions similar to that of the central portion, thus avoiding significant deviation from the originally expected shape [18]. The schematic diagram is shown in Figure 1.
The deposited component was prepared for the analysis of the microstructure and mechanical properties. For consistency, all specimens were adopted from the homogeneous and stable parts of the component. The specimens, which were used to analyze the surface quality, microstructure evolution, and Vickers hardness (HV 0.2) of the top and the bottom, were drawn from the cross section of the component by a ZwickRoell Indentec (ZwickRoell, Ulm, Germany) testing machine. The tensile experiments were carried out using a Shimadzu AG-X plus (Shimadzu Scientific Instruments, Shanghai, China) as the tester with a displacement rate of 0.02 mm/s. All tests were performed at room temperature. The specific sampling location is shown in Figure 2. Both transversal and longitudinal tensions were performed to obtain the data of strain evolution during the testing to reveal the anisotropy behavior. Before the tests, specimens were sprayed with a randomized speckle pattern that consisted of black micron size speckles on a white background to achieve high contrast. The size and surface treatment condition of the specimen is shown in Figure 3.
During the testing, the strain and surface displacements were calculated by tracking the speckle pattern on the specimen surface. Images were captured using an iX i-SPEED 7 CCD camera (iX Cameras, Shanghai, China) at the rate of 10 fps (frames per second), with a pixel array of 350 × 750 pixels. Then, the data were analyzed by DIC software to obtain the strain field distribution [19]. The experimental setup is shown in Figure 4.

3. Results and Discussion

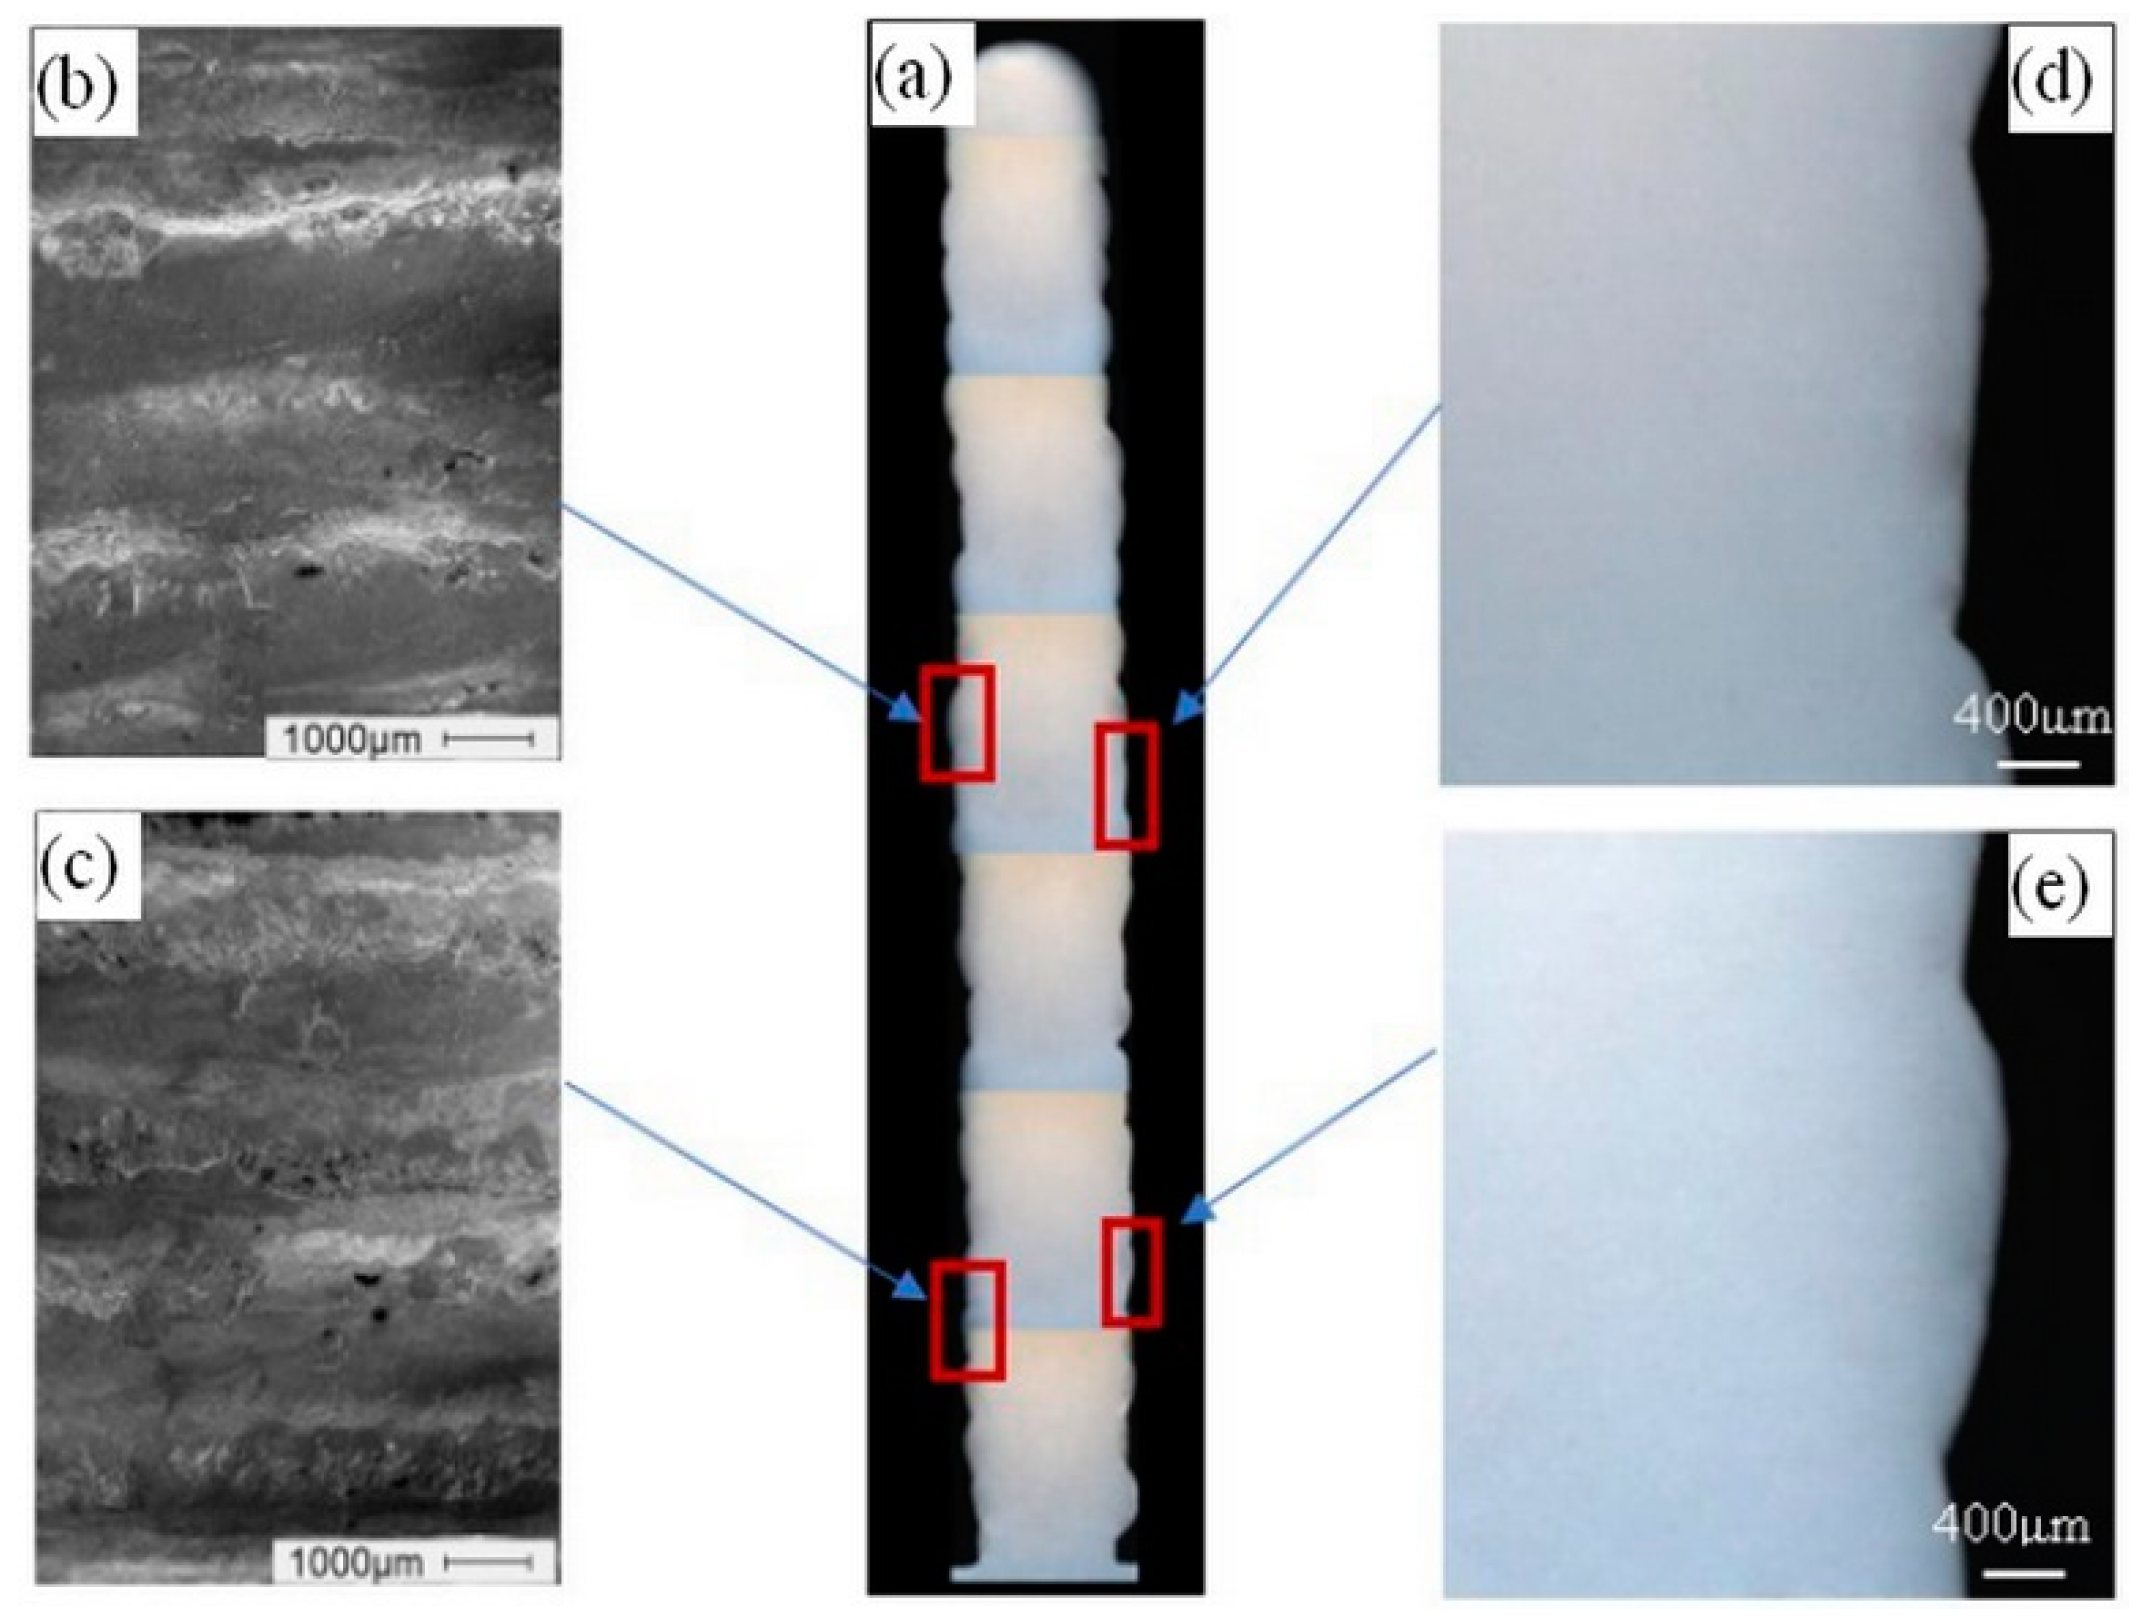
3.1. Surface Quality Assessment

It is well known that the components manufactured by WAAM have poor surface roughness and dimension accuracy. Additionally, cracks between the inter-layer adjacent region, lack of fusion and inclusions are usually visible. To meet industrial requirements, surface quality is a critical consideration in the manufacturing process [20].
Figure 5 shows the typical thin-wall cross section of the as-deposited component. It can be noted that the surface of the thin wall is uniform and well formed with good quality. The deposition strategy can improve the deposition quality by filling the arc craters that are frequently caused at the arc start and end points. The so-called step effect can be shown at two sides of the thin-wall, which results from the layer-by-layer deposition model. The cross section of the polished state is shown in Figure 5a, and it can be observed that the condition of the as-built deposition is steady, indicating that each part of the component shows the same size. Figure 5b,c demonstrate the surface conditions after the scanning electron microscope (SEM) analysis, which has a smooth surface and full fusion, although there are some oxides or impurities brought from the prepared specimen. At the same time, the juncture between layers is reported in Figure 5d,e. Optical microscopy (OM) analysis shows that cracks, inclusions, and pores are not found in the bonding areas. Generally, the deposited part is well formed without unfused effects, cracks, inclusions, and pores observed under the condition in the present experimental method.

3.2. Microstructure

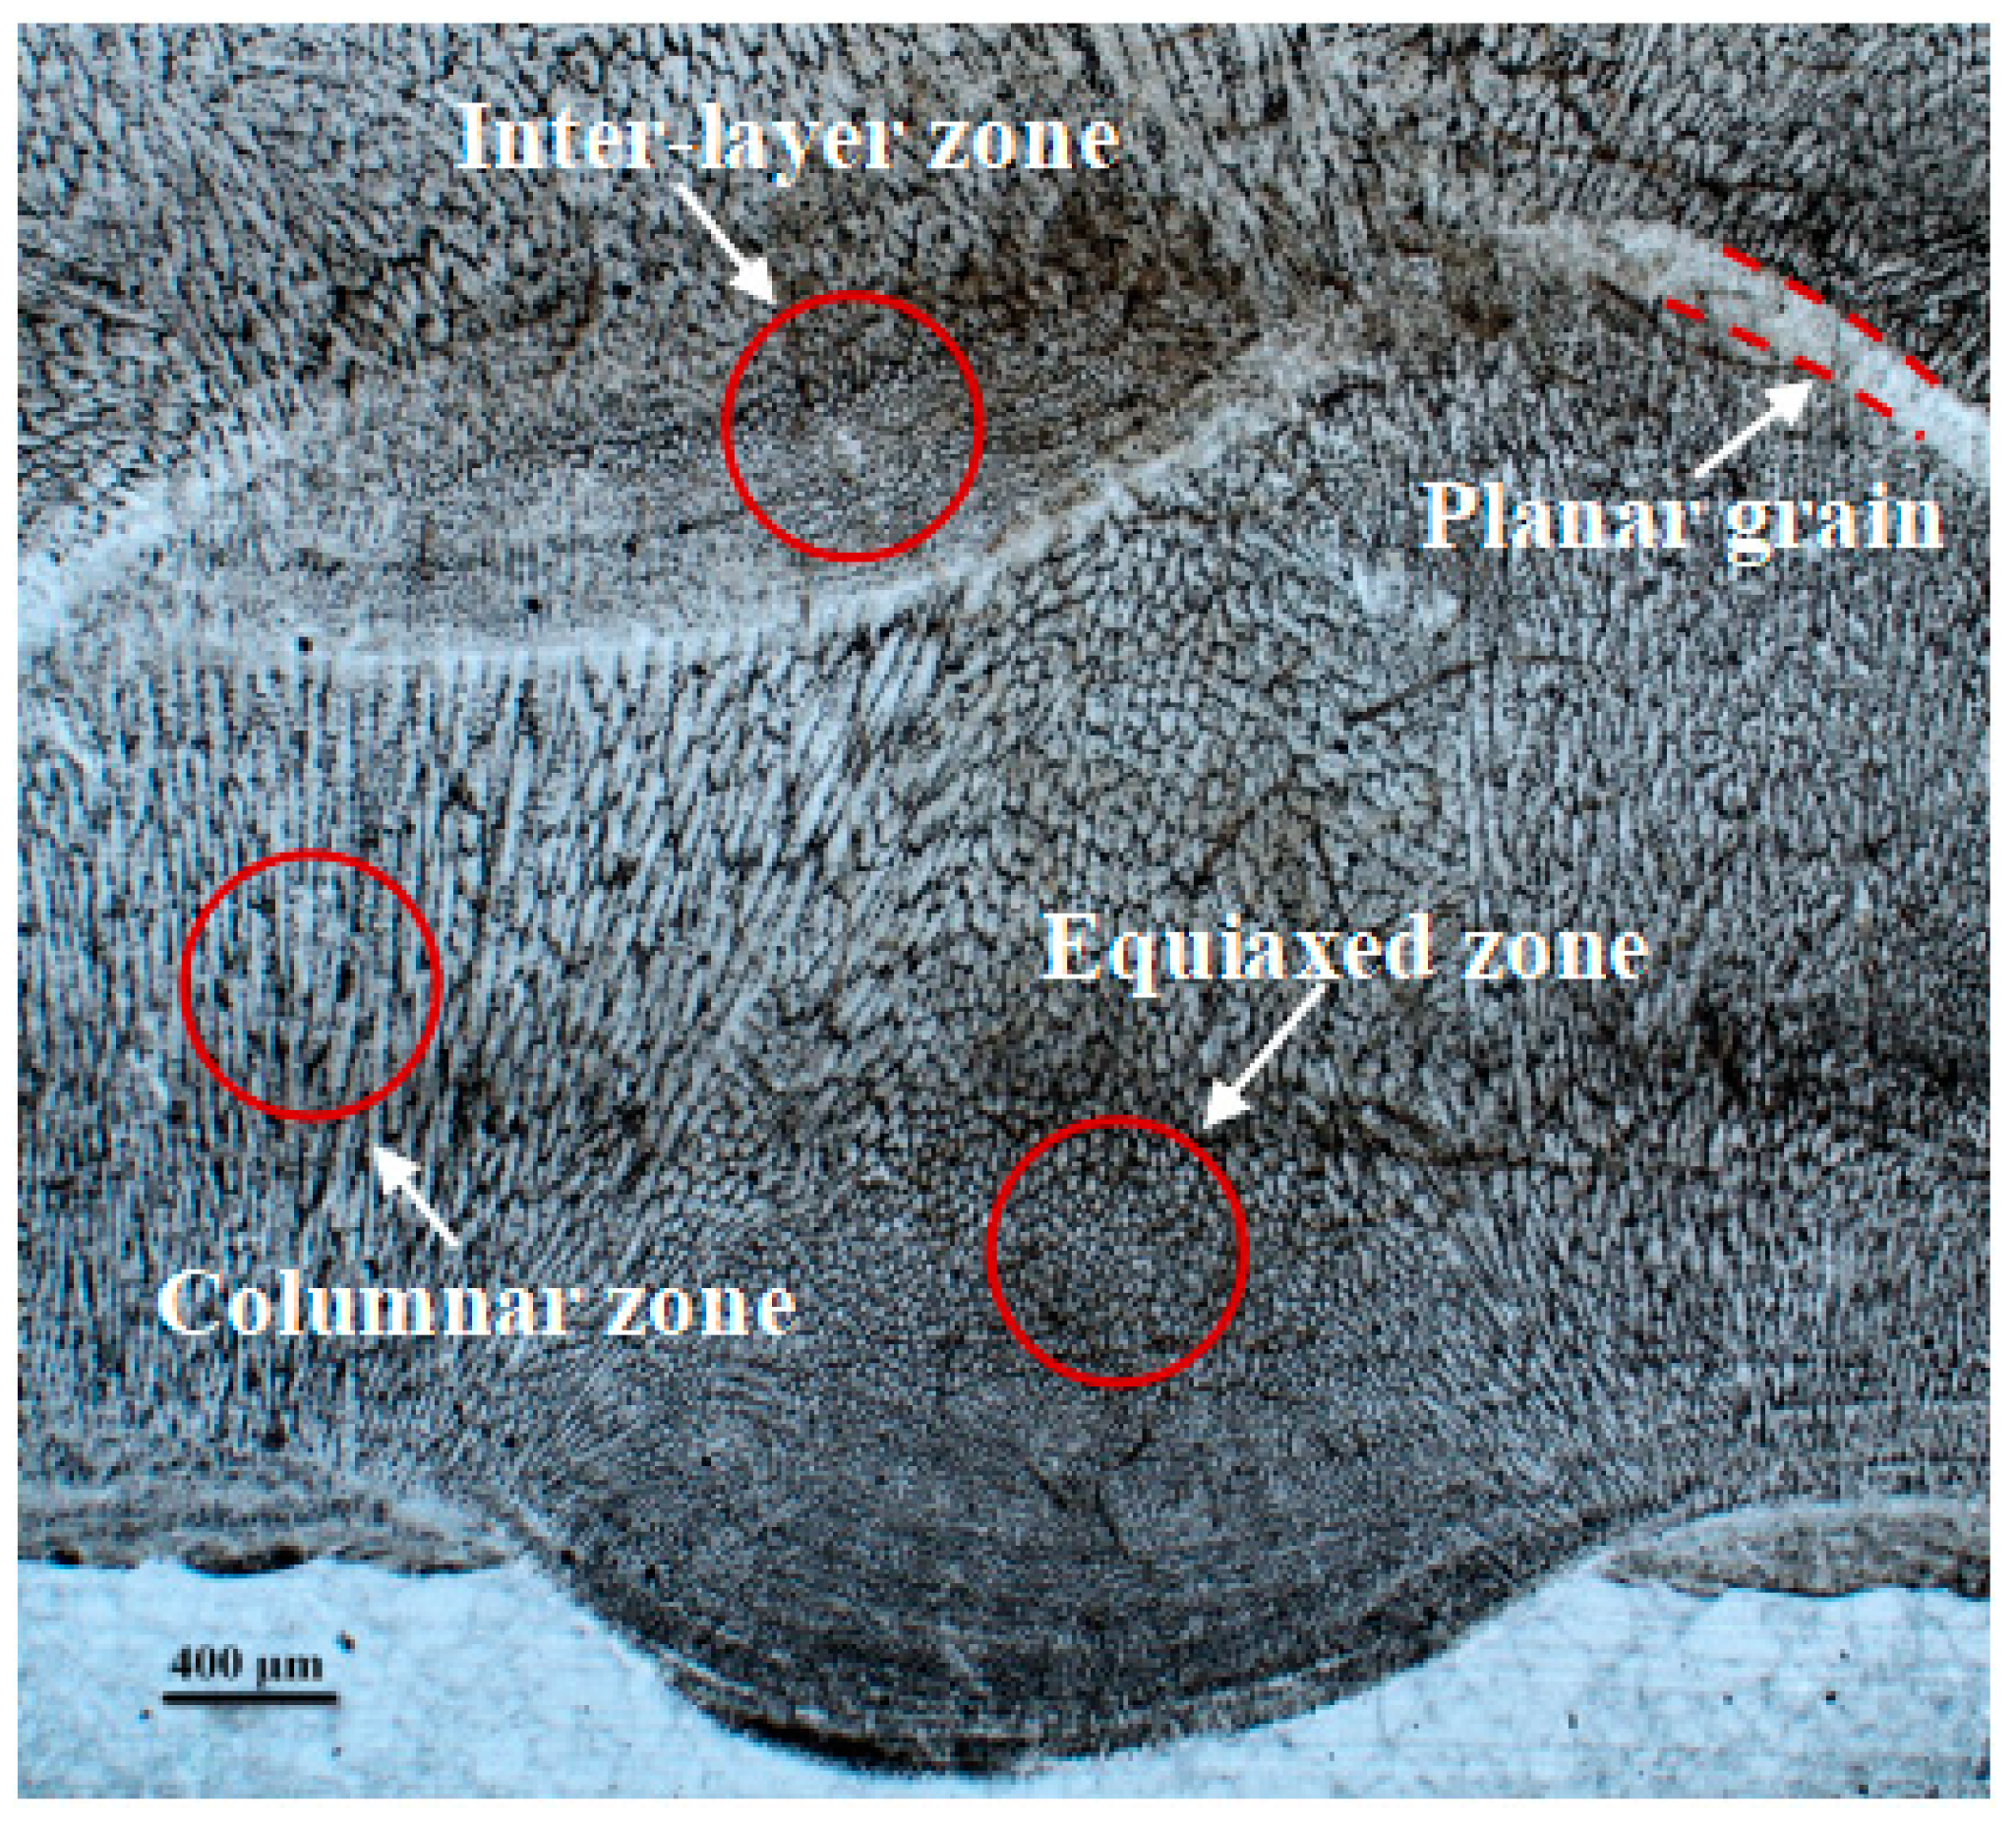
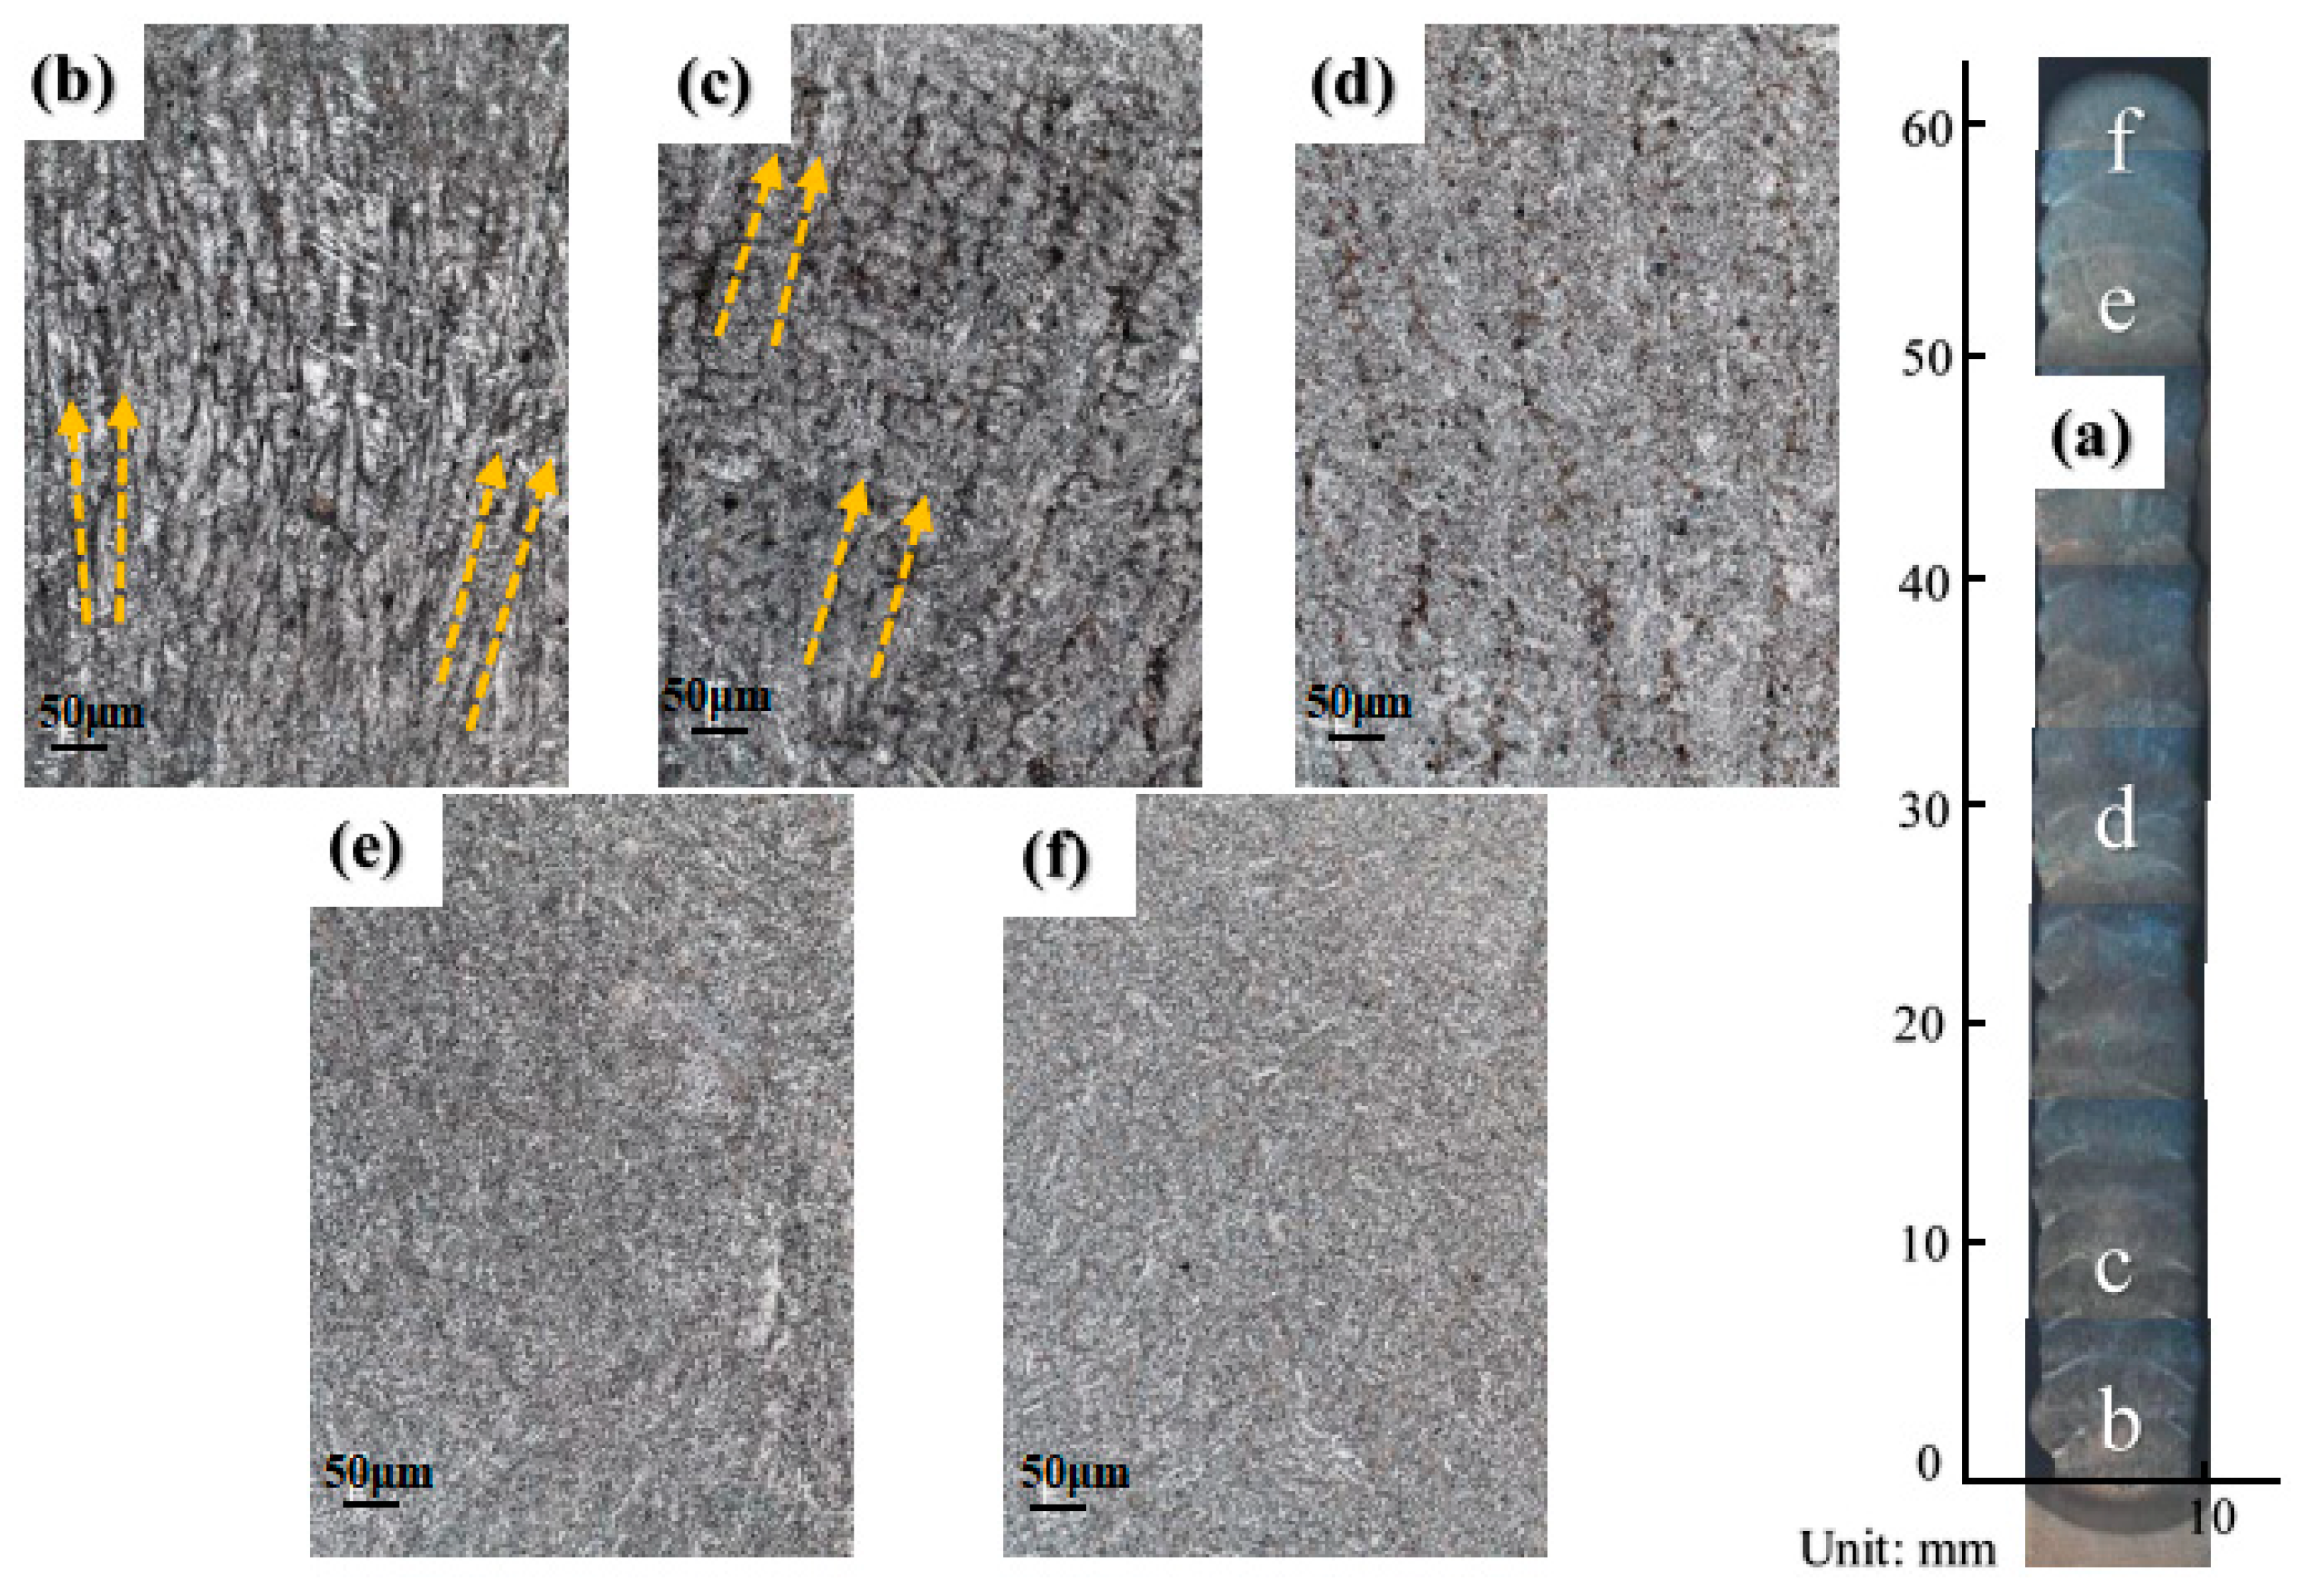
3.2.1. Microstructure Evolution

In the process of WAAM, the heat cycle repeats over and over again. Some typical phenomena are caused by complex thermal cycles such as rapid heating, fast solidification in the fusion zone, various temperature gradients, a large amount of heat accumulated, reheated, and then recooled. The non-equilibrium thermodynamics governs the physical characteristics of microstructure formation in the WAAM process. Thus, analyzing microstructural characteristics and evolution is helpful for describing the manufacturing process [21]. Based on the thermal history illustrated above, the microstructure can be divided into three main morphologies: (1) columnar, (2) mixture of columnar and equiaxed, and (3) equiaxed. In other words, during the WAAM process, the microstructure can be divided into three different regions: (1) columnar grain zone, (2) boundary zone, and (3) equiaxed grain zone, as shown in Figure 6. The evolution of the microstructure is influenced by two crucial control parameters including the temperature gradient (G) and solidification velocity (SV) [22]. Based on solidification theory, the ratio of the G to SV determines the forms of the microstructure. When the G/SV is extremely large, the solidification microstructure contains planar grains, as shown in Figure 6. In this condition, the melt metal acts upon the former solidified layer and solidifies rapidly, G tends to be infinite, and VS tends to be zero. When the G/SV is a relatively high value, the major solidification microstructure is columnar grain, as shown in Figure 6; at that moment, the heat dissipation that comes from the substrate results in a rapid cooling speed and high temperature gradient. The melt metal solidifies quickly and then the columnar grain is obtained. In a general way, the core of the molten pool is finally solidified. The temperature gradient and solidification velocity tend to be low, resulting in smaller G/SV values, giving rise to the equiaxed grains as shown in Figure 6. In a word, heat is mostly transmitted through the substrate or formerly deposited layers, and different regions of the molten pool appear to have various temperature gradients and solidification velocities, which eventually influences the evolution of the microstructure.
During the deposition process, the temperature gradient dominates the directional growth of the microstructure and affects its morphology. The growth direction is usually perpendicular to the boundary of the molten pool [23]. The shape and growth of dendrites in different deposited layers vary as a function of heat dissipation, as shown in Figure 7. In this work, the component consists of deposited layers and its macrostructure at cross section is shown in Figure 7a. Region b is close to the substrate, representing a rapid cooling rate and large heat dissipation, which indicates a high temperature gradient. In this region, the heat dissipation of metal liquid is perpendicular to the substrate during the cooling and solidification processes. The direction of heat flow is therefore perpendicular to the interface, leading to the fact that solidification is directional. Thus, the structure of columnar grain formed is vertical to the fused interface. The typical and directional columnar microstructure in region b is shown in Figure 7b. Along with the deposition progress, the effect of heat dissipation from the substrate decreases by increasing the distance to the substrate, resulting in the decrease in the temperature gradient. The columnar microstructure formed appeares less typical than that in region b, and the details of the microstructure in region c are shown in Figure 7c. As deposition continued, region d is hardly influenced by the substrate, but is only affected by the thermal cycles between layers. At that time, the temperature gradient is relatively low, resulting in the inapparent directional growth of the microstructure. Simultaneously, region d undergoes a long period of heating, leading to a coarse microstructure. The conditions of region d are shown in Figure 7d. At the end of the deposition, the microstructure of regions e and f on the top of component are presented in Figure 7e,f, separately. In both regions, the columnar grain is rarely observed, while a uniform and fine microstructure appeare. To some extent, the characteristics of the microstructure are disclosed due to rapid cooling resulting from contact with the environment and no subsequent heating.

3.2.2. Phase Transformation
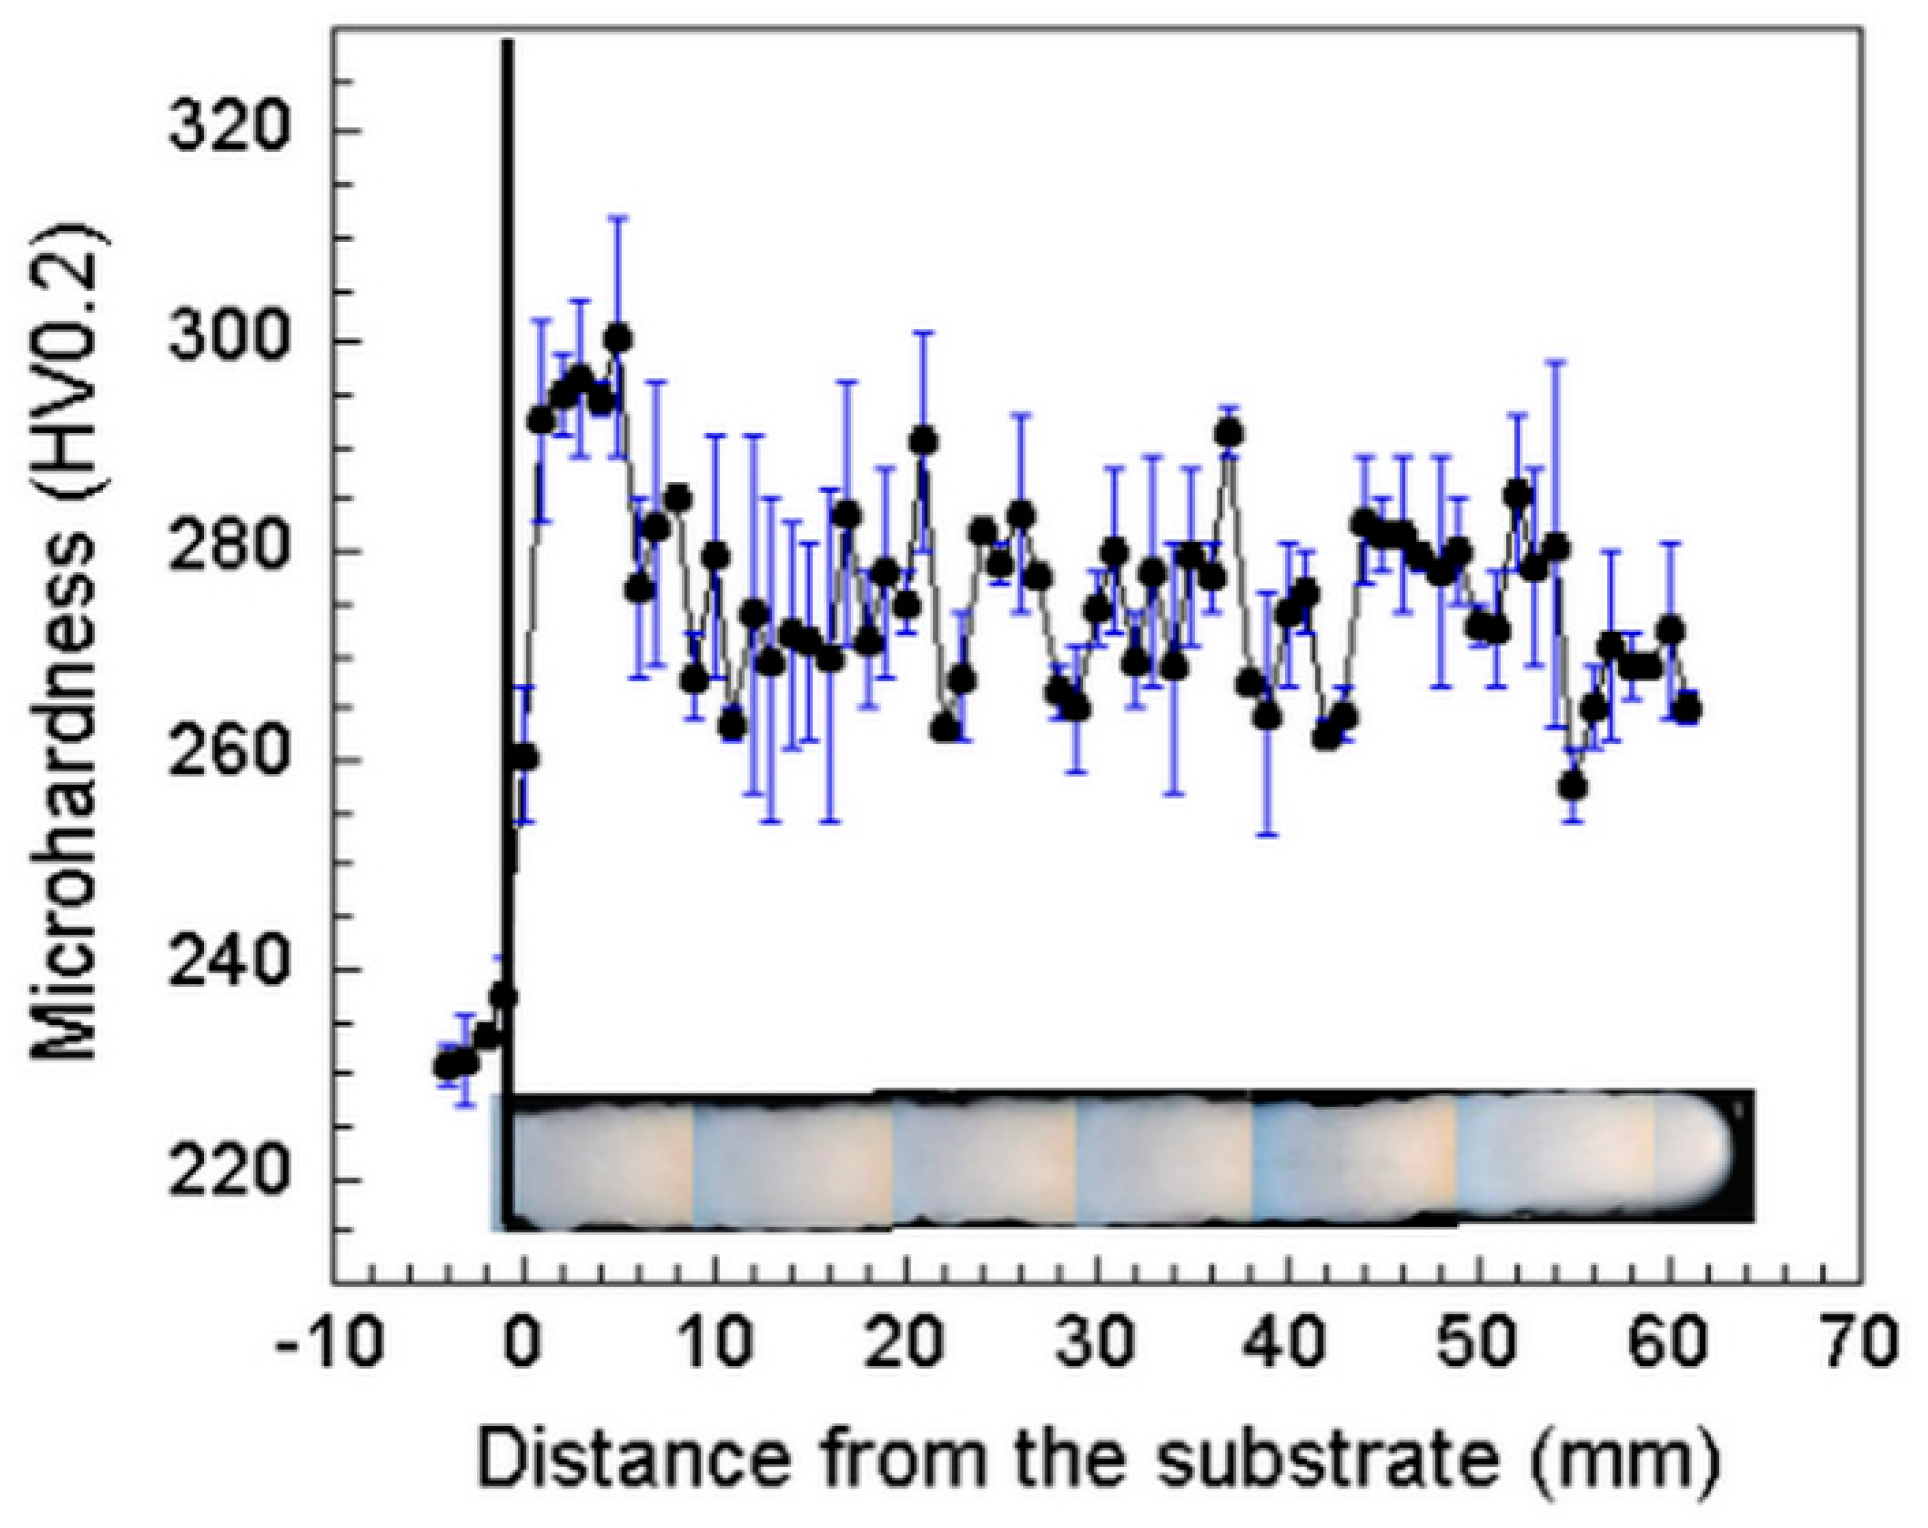
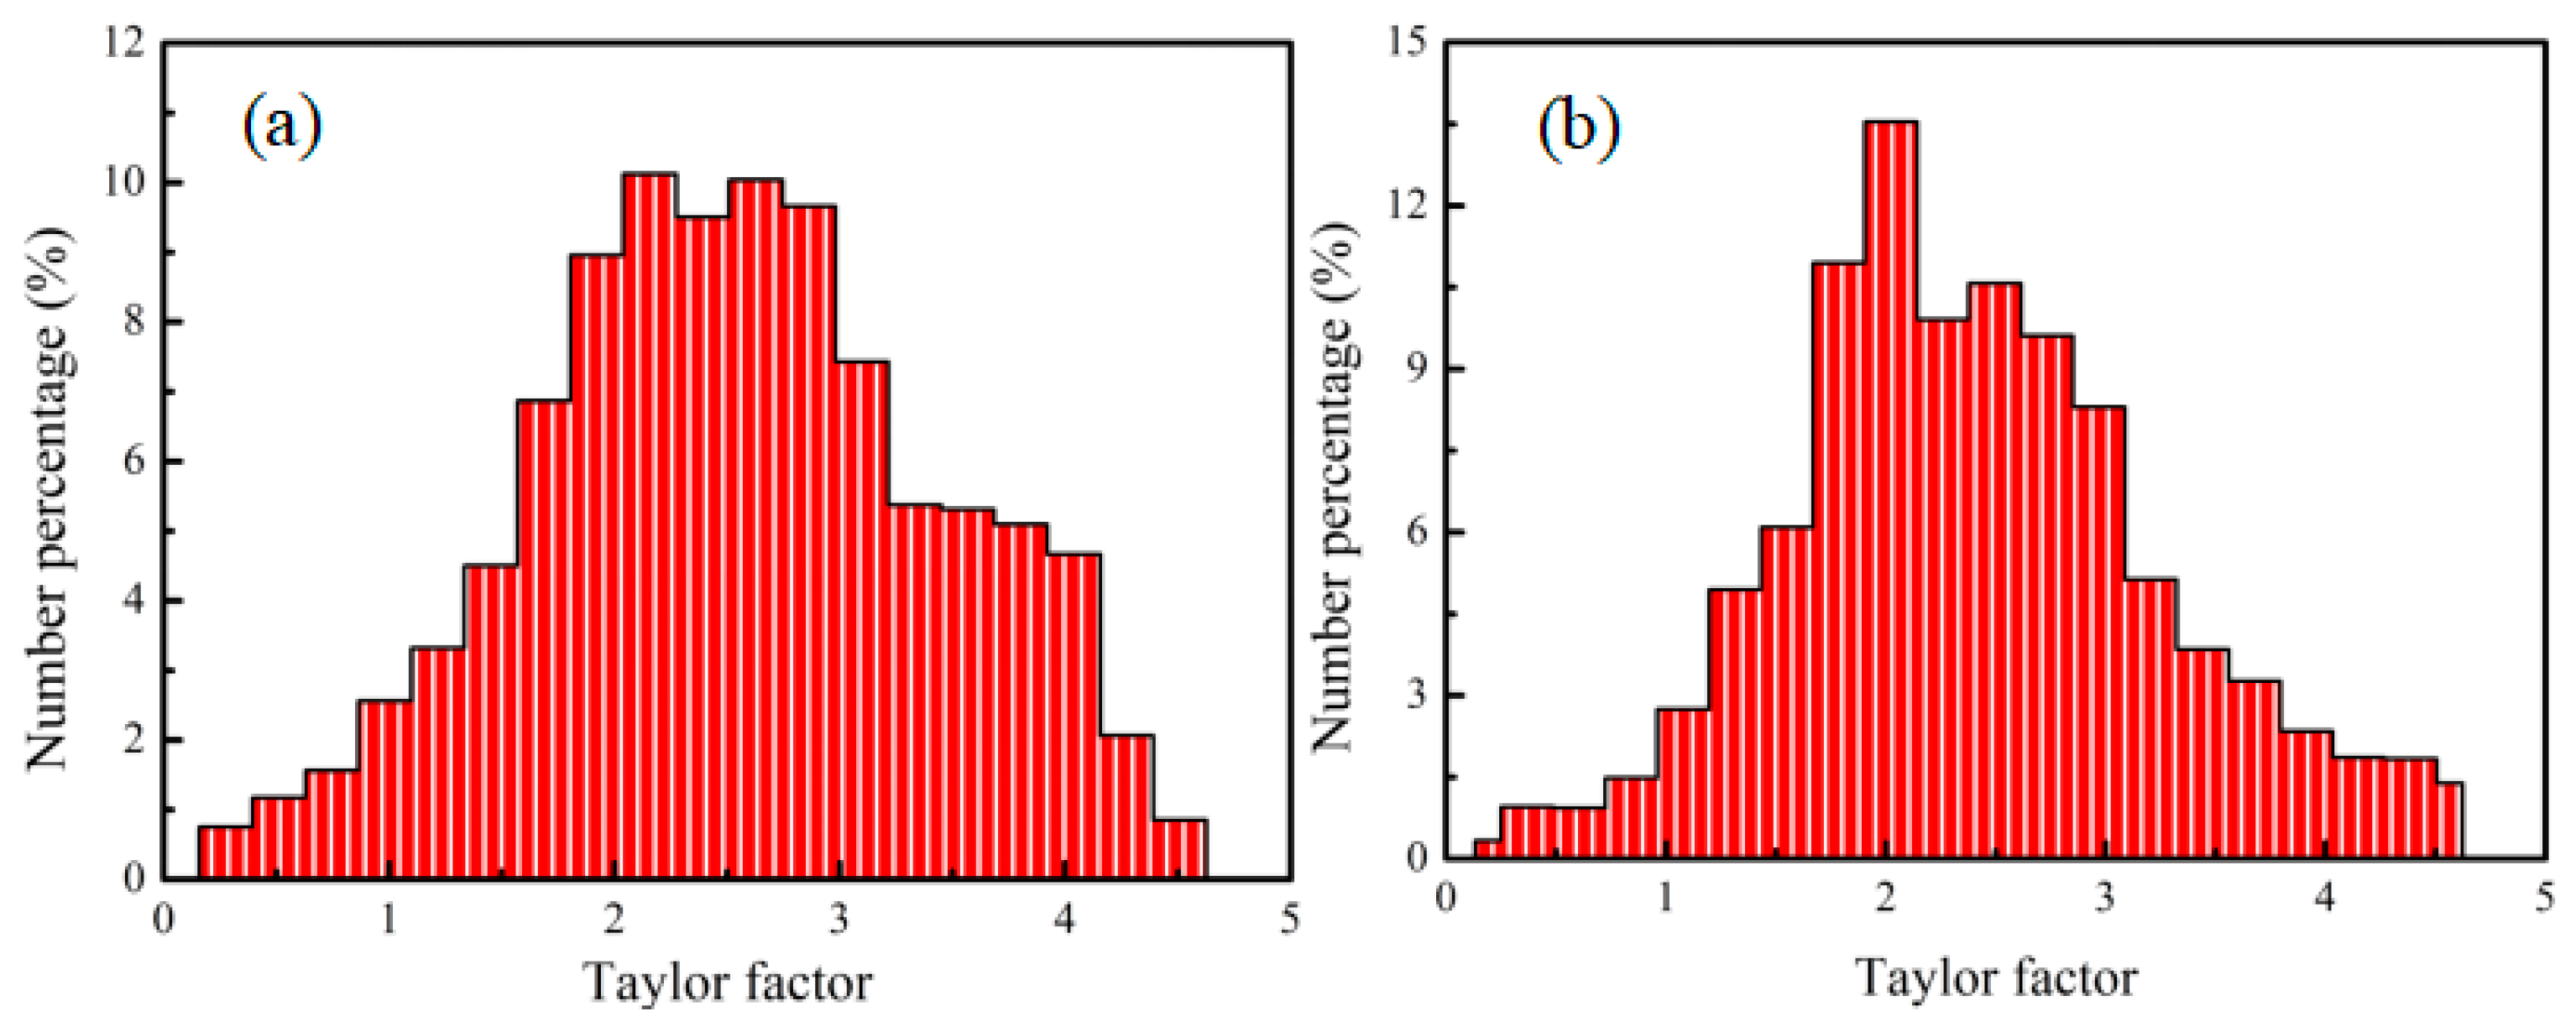
It is well know the phase transformation and microstructure development of the metal component fabricated by WAAM are completely different compared to that of conventional manufacturing. The WAAM fabricated components undergo a slower cooling rate and gradual/equilibrium thermodynamics processes, thereby obtaining more homogeneous properties. In this study, the phase transformation at different positions of (from bottom to top) the component is investigated and reported in Figure 8, in which Figure 8a shows the details of the typical phases of the bottom part. Here, the phase transformation analysis is based on phase morphology and the continuous cooling transformation diagram of a high strength steel with a similar chemical composition [24]. At the beginning of deposition, since the bottom layer is affected by the substrate and is then cooled rapidly, thus martensite transformation occures. It plays a tempering role under the influence of a long-term thermal cycle in the subsequent deposition layer, with the occurrence of tempered sorbite transformation. Along with the tempered sorbite transformation, the major phase transformation is bainite due to the intermediate cooling rate. Under the action of tempering, tempered bainite is achieved. Thus, the phase composition at the bottom is tempered bainite and tempered sorbite. As deposition continues, the part close to the bottom moves away from the substrate gradually, lowering the cooling rate and heat dissipation, thereby reducing the content of tempered sorbite. At this time, the phase composition at the bottom is tempered bainite and less tempered sorbite, as shown in Figure 8b. As deposition height increases heat accumulation approaches saturation state, while the heat input and output are in balance, which presents a lower temperature gradient and cooling rate, resulting in the fact that it could not achieve the transformation requirement of tempered sorbite. As a consequence, the phase composition at the middle is almost made up of tempered bainite, as shown in Figure 8c. When deposition arrives at the end, the melt pool emerges at a rapid cooling rate due to mass heat dissipation with the environment, which allows the tempered sorbite transformation to occur again [25]. At the same time, some ferrite transformation takes place due to the lack of subsequent heating. Under this circumstance, the phases on the top are composed of tempered bainite, tempered sorbite, and ferrite, as reported in Figure 8d. In general, the complex phase transformation is caused by distinct thermal cycles and various cooling rates. This phenomenon eventually results in different phase transformation in diverse regions.

3.3. Microhardness

In this study, the average microhardness is measured from the bottom to the top, the changes in the microhardness of the vertical cross section of the as-deposited component are measured, the results are reported in Figure 9. It can be seen that the maximum value of microhardness is found to be around 290 HV near the bottom part. As the height of deposition increases, the microhardness decreases slightly and fluctuats between 280 HV and 270 HV. Then, the microhardness varies between 270 HV and 260 HV when measured near the top part. Generally, the deposited material goes through complex thermal cycles, which is expected to affect the microhardness [26,27]. It has been confirmed that the fluctuation of the microhardness comes from various thermal cycles and cooling rates in diverse parts of the component, and the microhardness values of multilayers are influenced by the heating at previous layers [28]. Furthermore, the compositions of the microstructure at the bottom, in the middle, and on the top also play a significant role on microhardness. As depicted from the previous analysis on phase transformation, the phase at the bottom is made up of tempered bainite and tempered sorbite, the phase in the middle is composed of tempered bainite, and the phase on the top is comprised of tempered bainite, tempered sorbite, and ferrite. In terms of the microhardness, tempered bainite + tempered sorbite > tempered bainite > tempered bainite + tempered sorbite + ferrite, hence, the microhardness of the components shows such a characteristic, which is in line with the microstructure results.

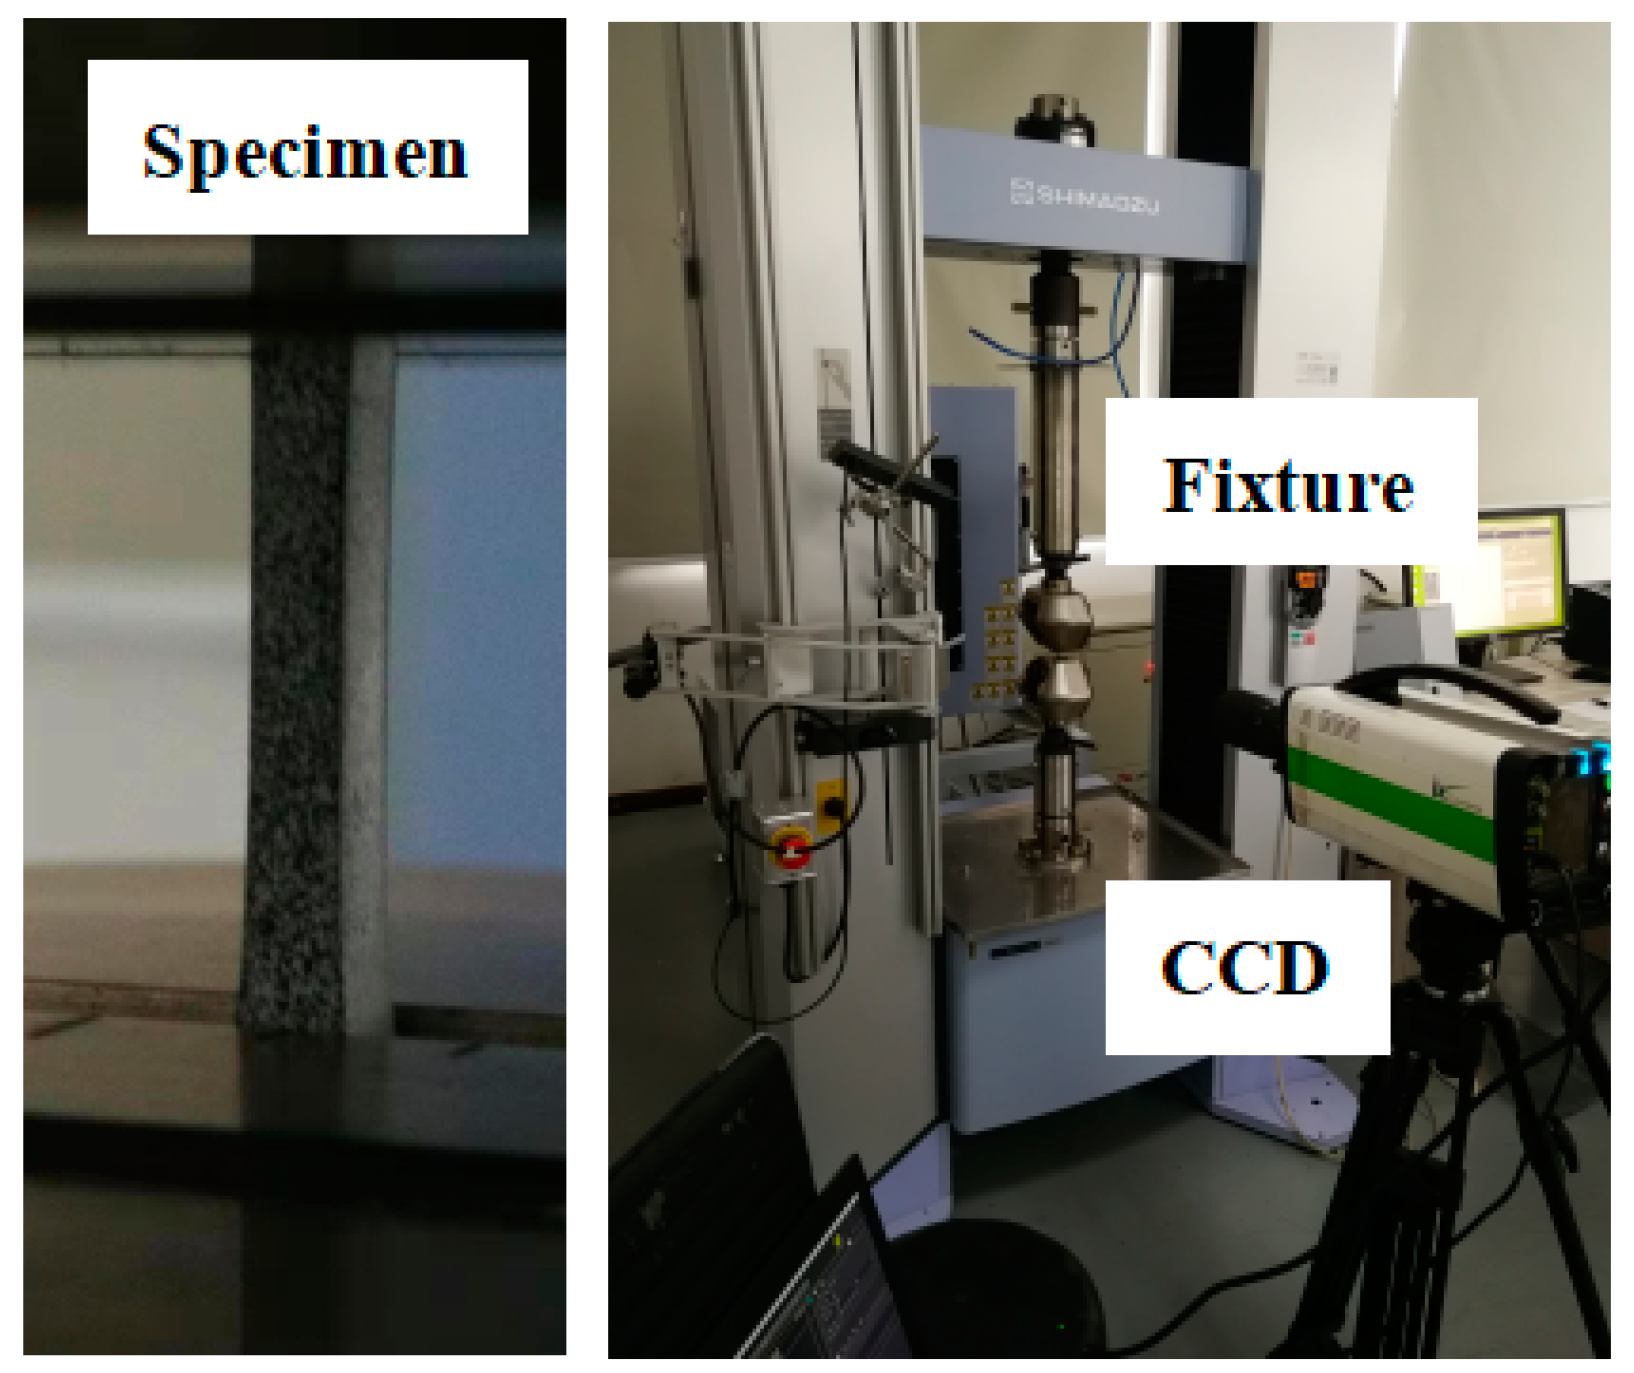
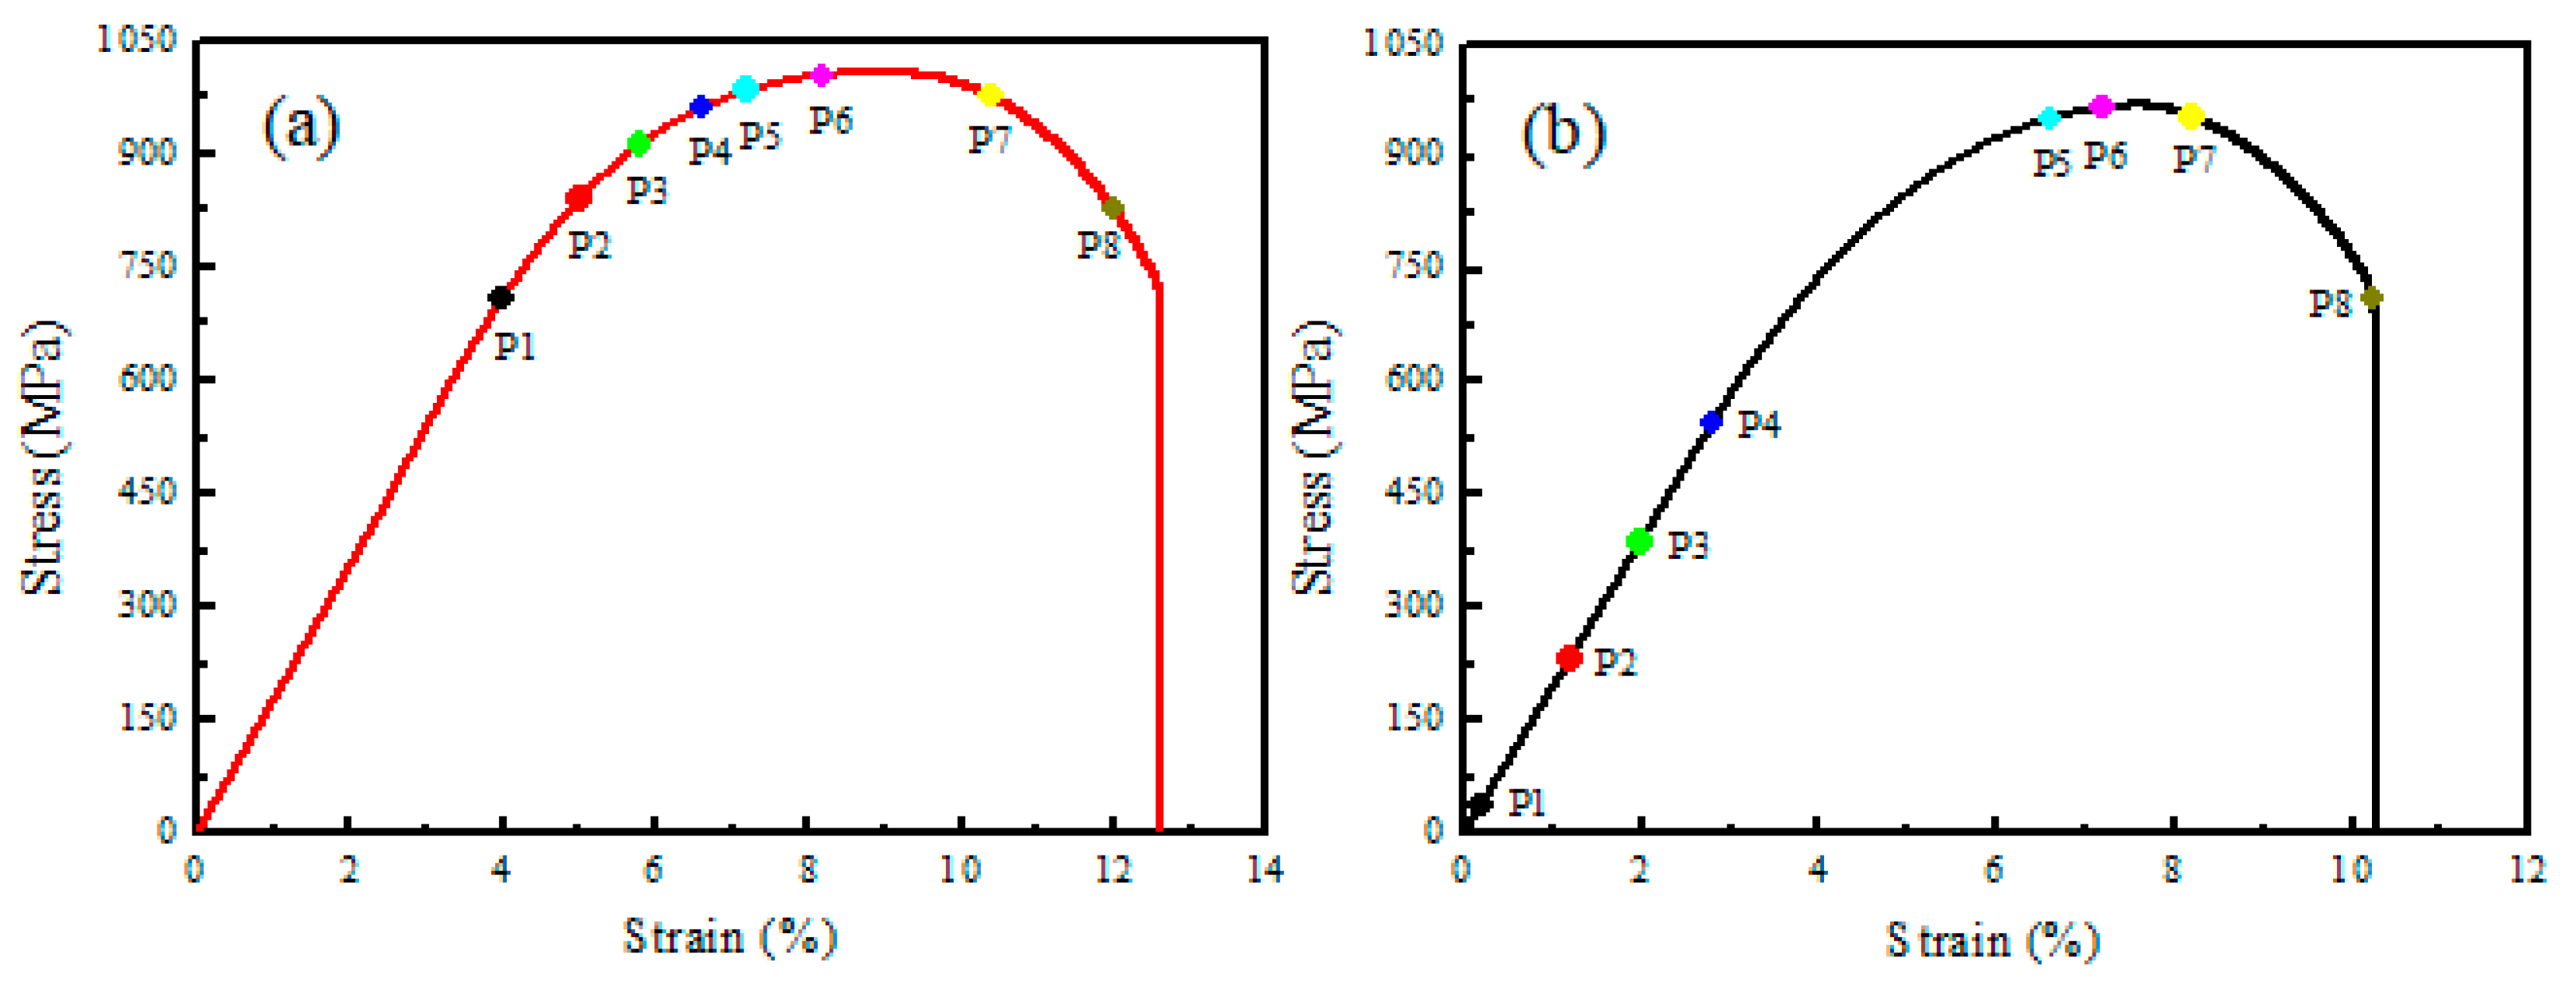
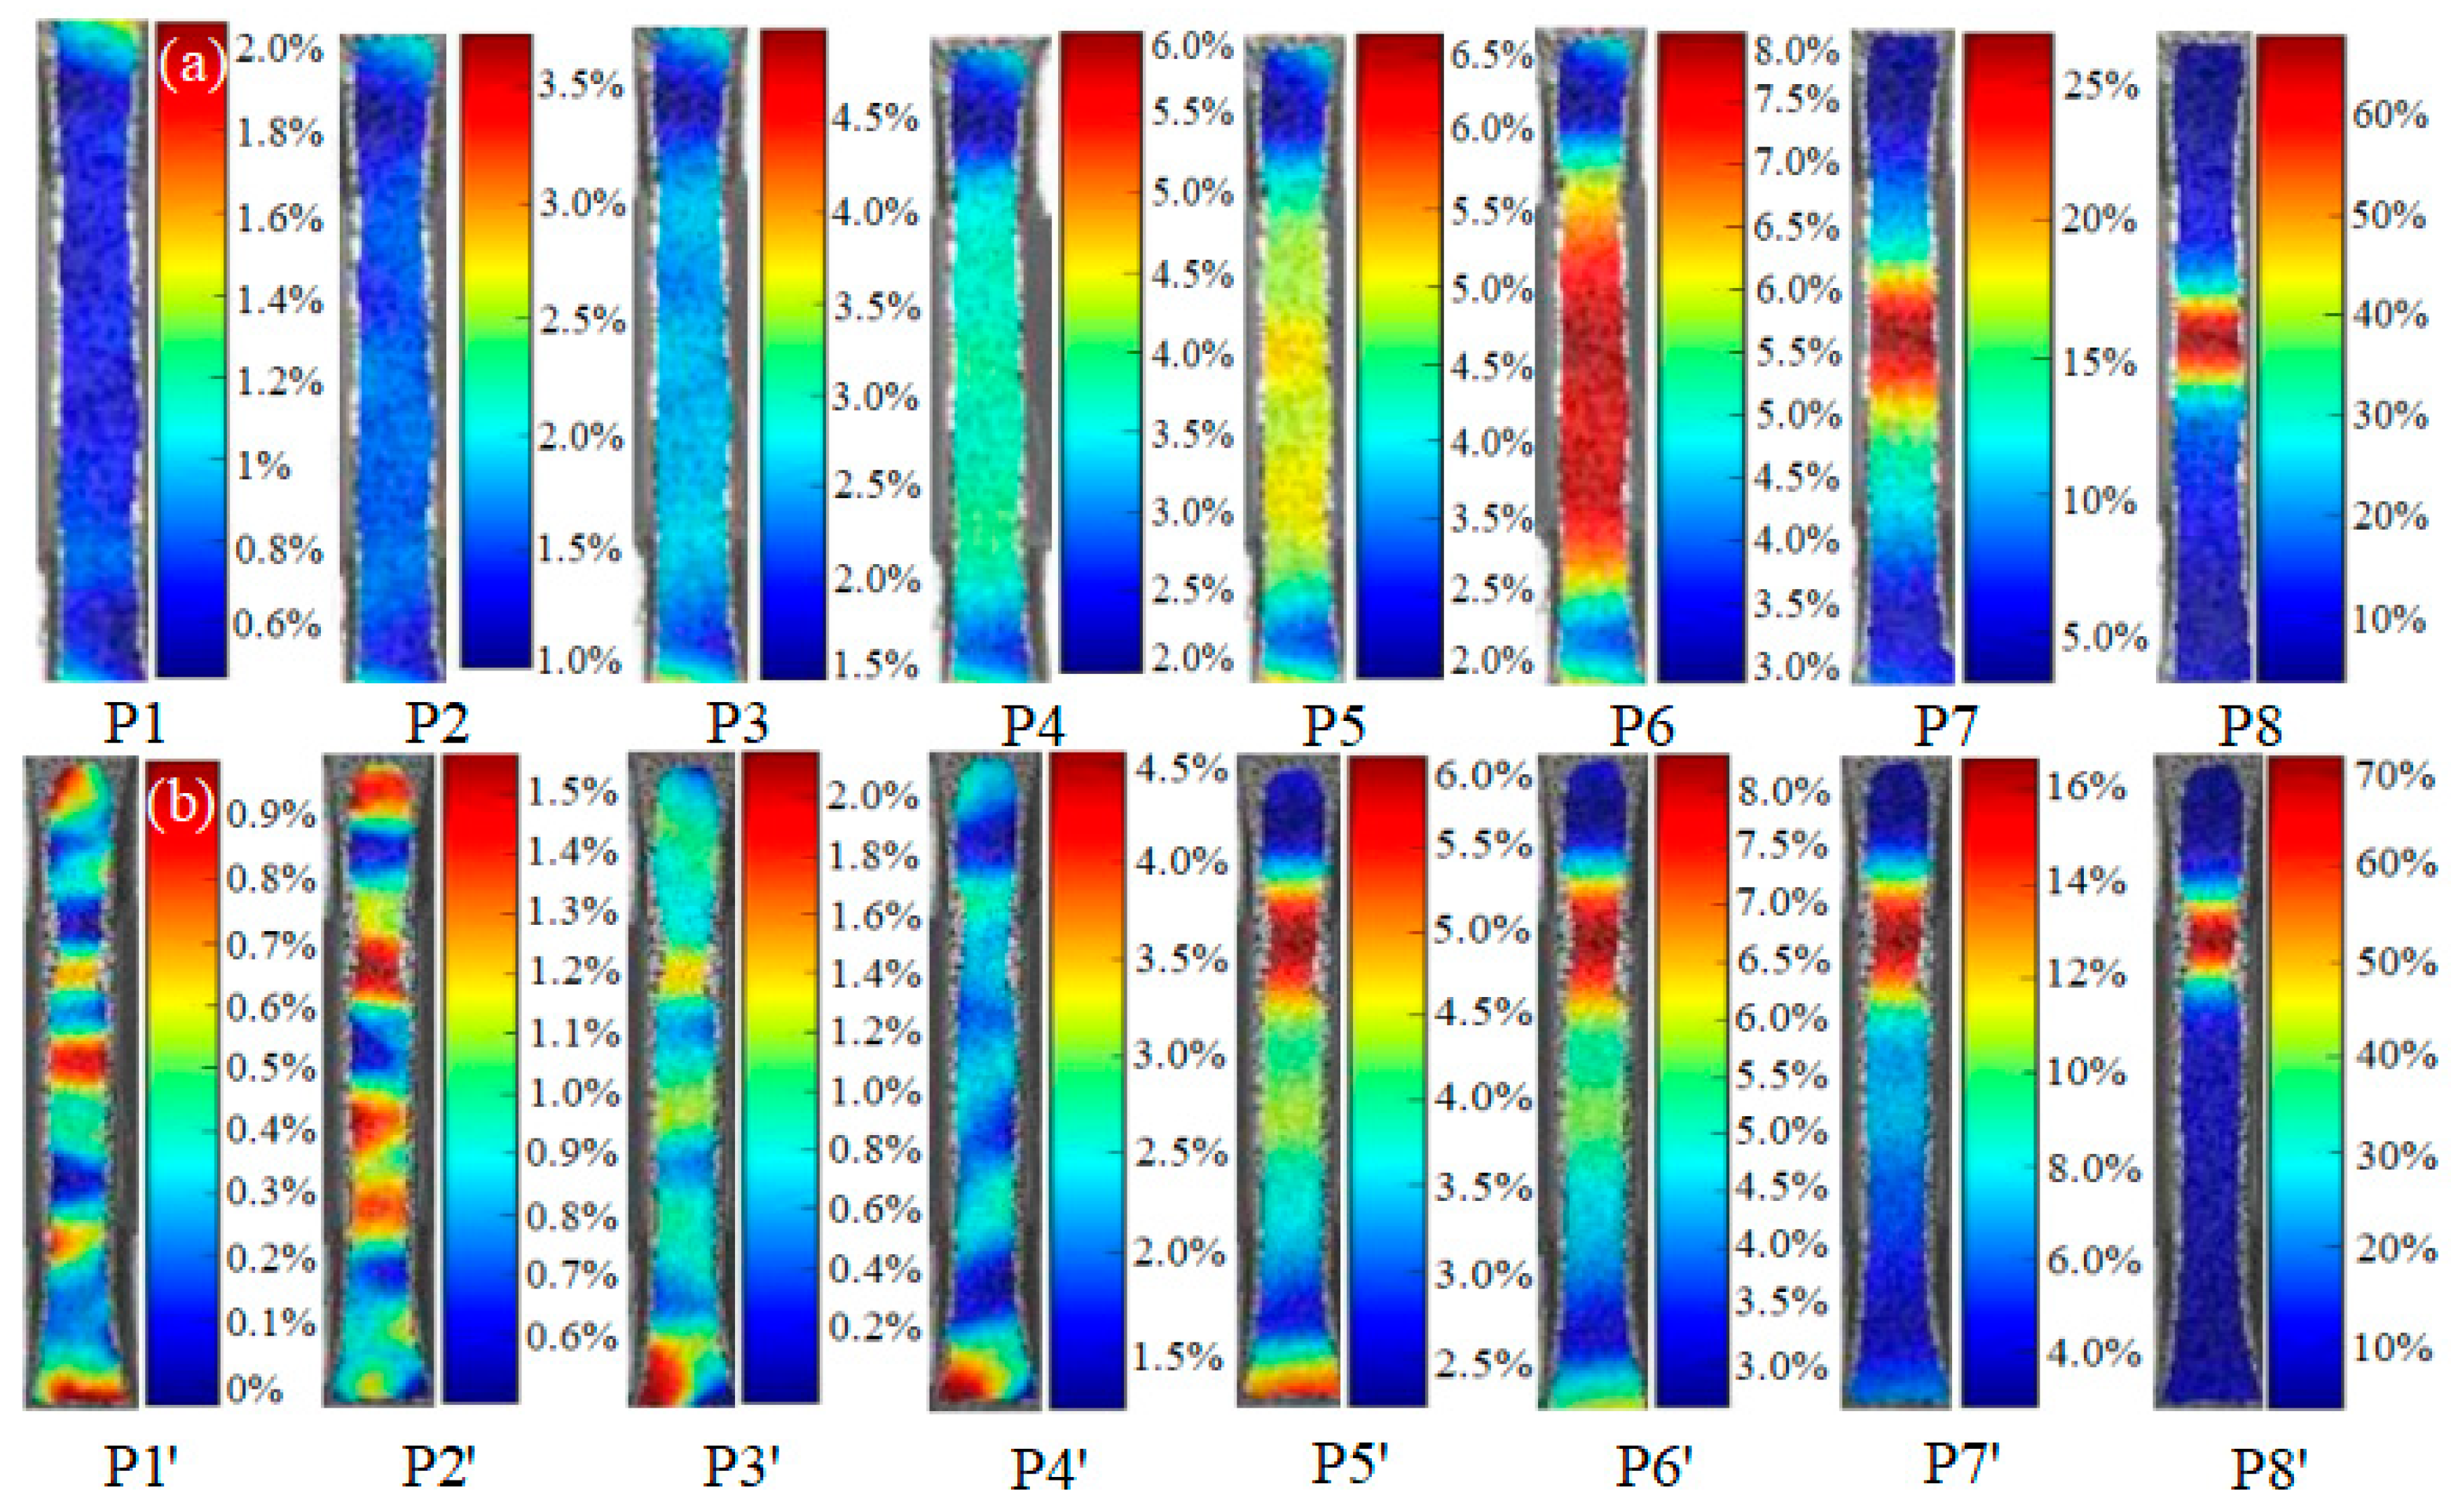
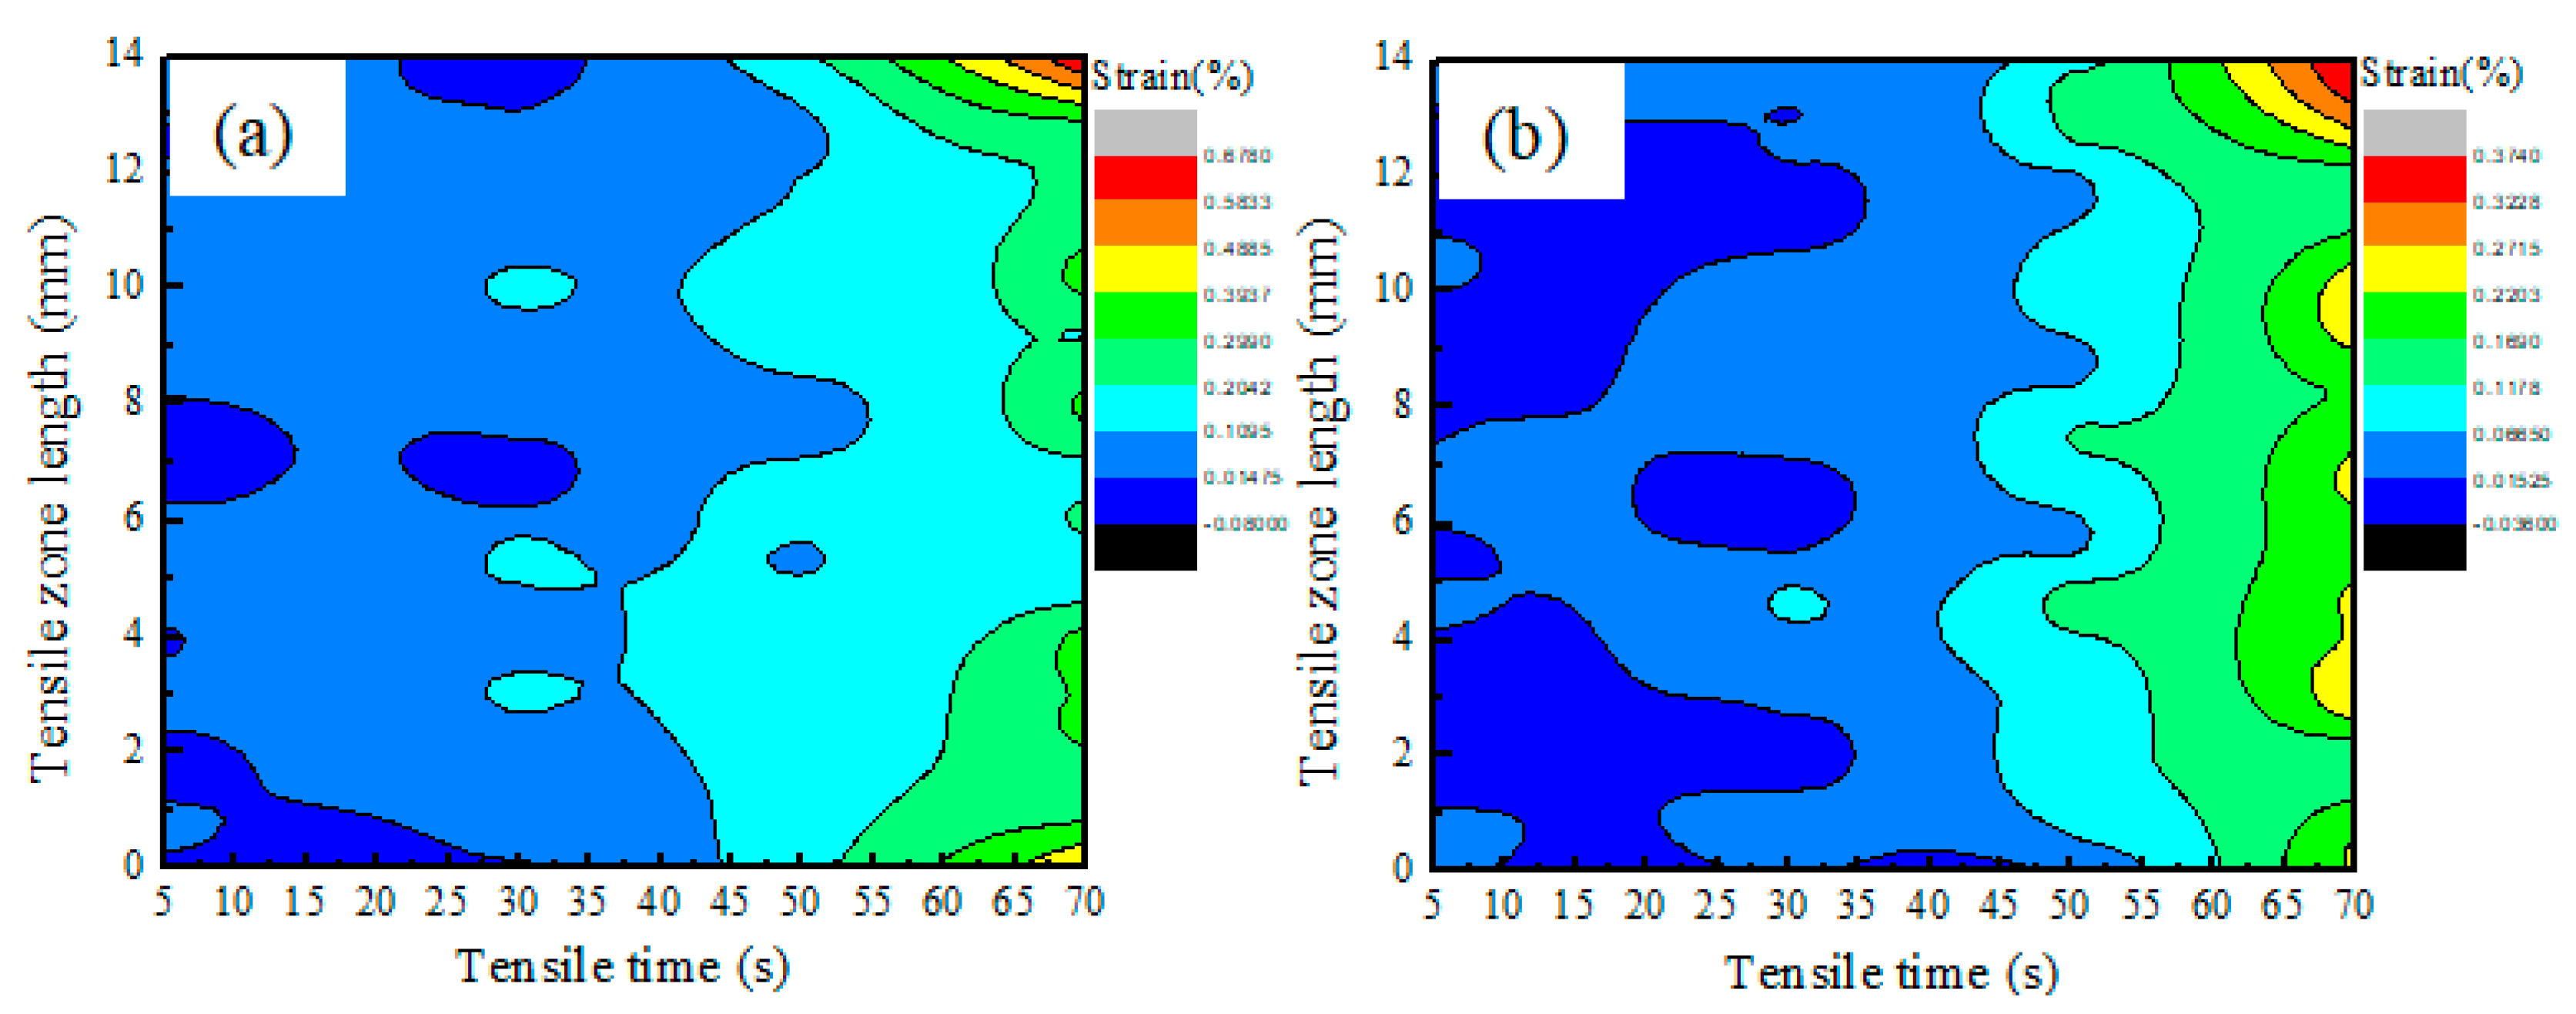
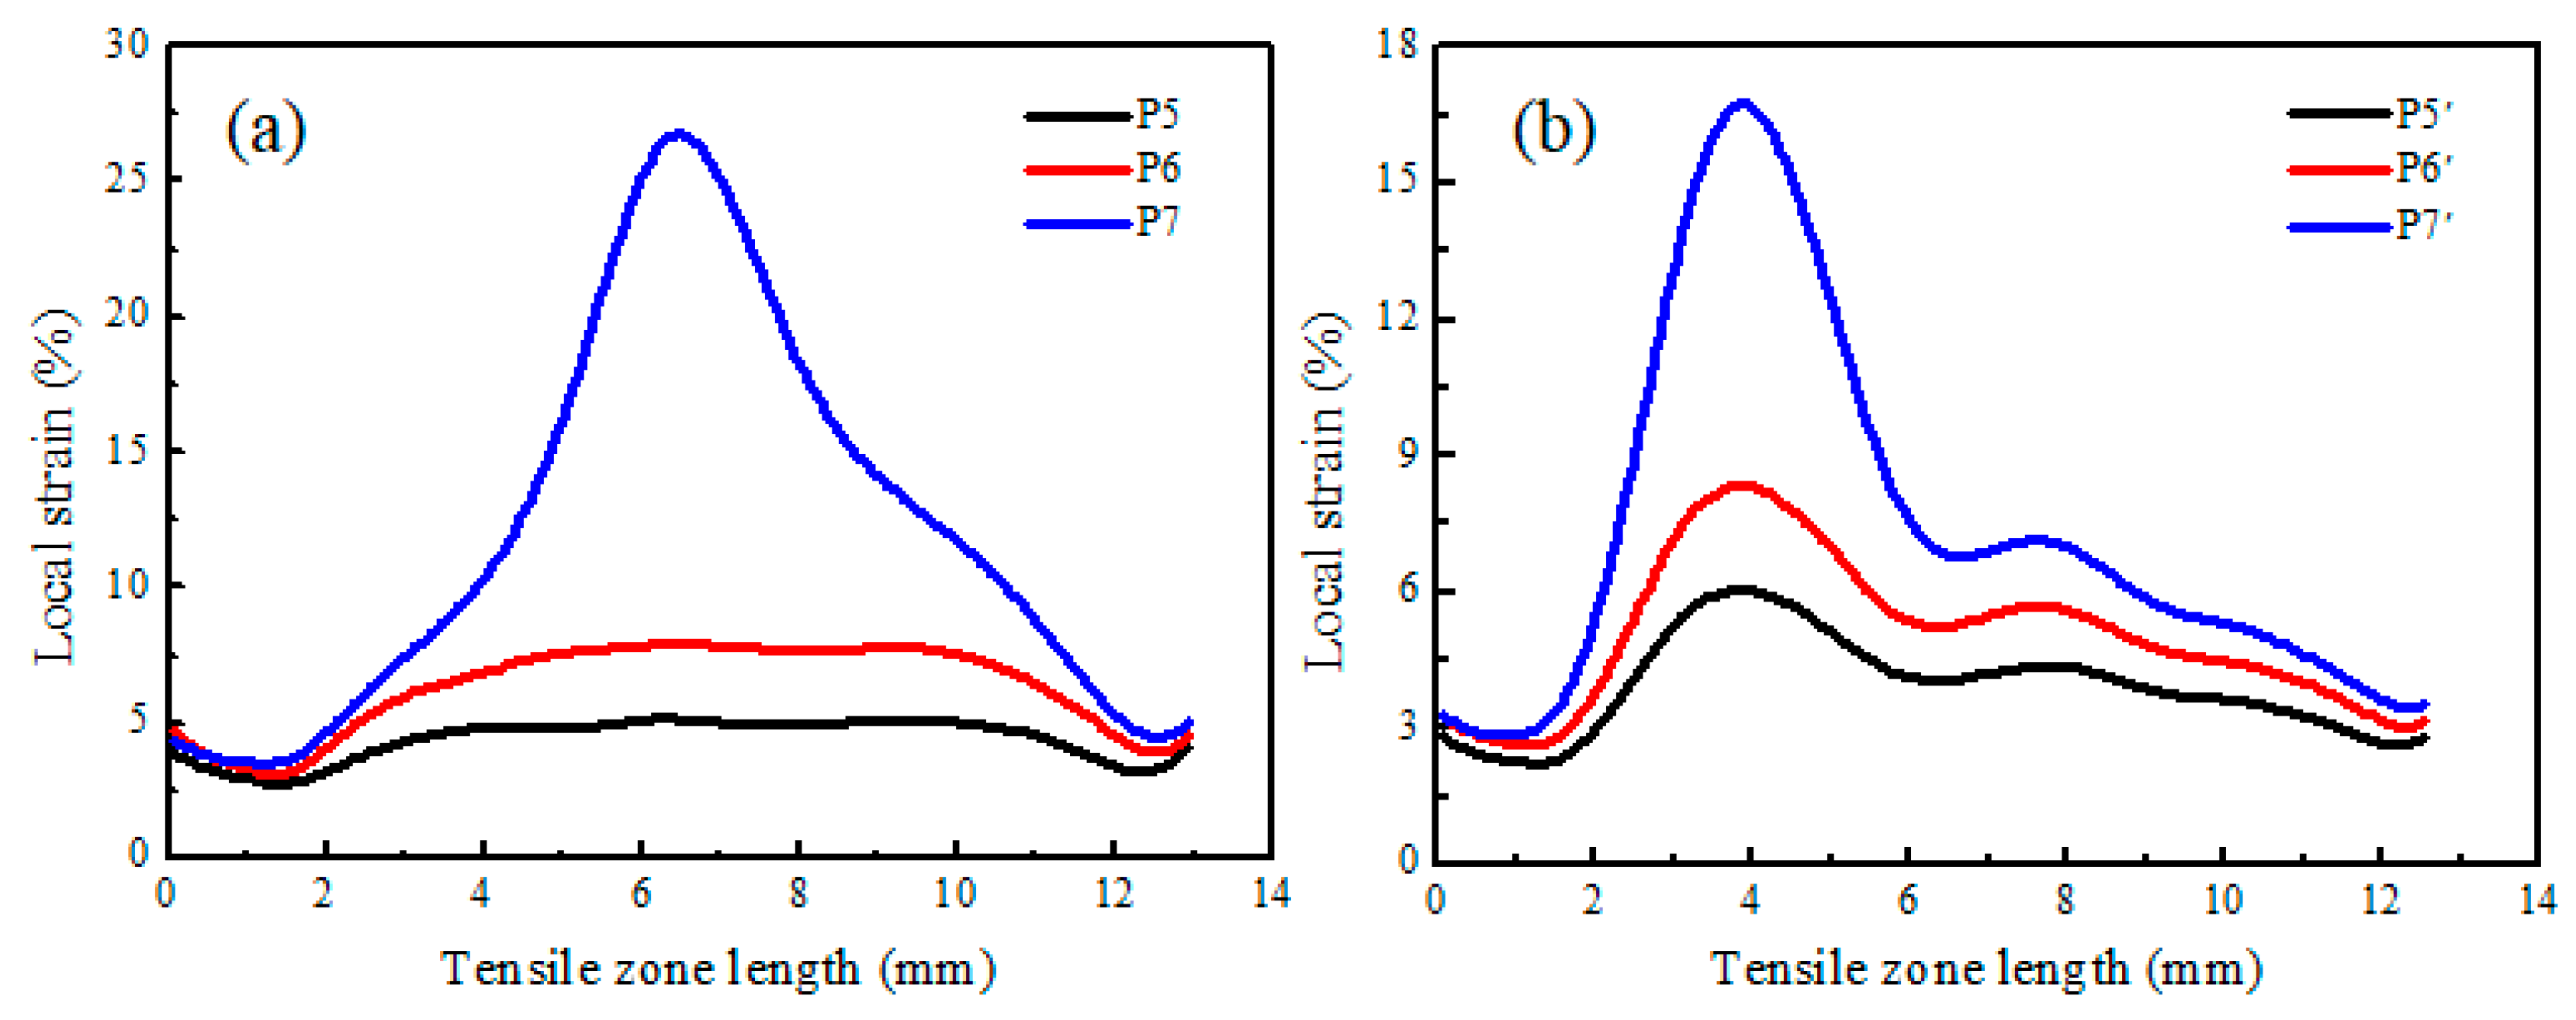
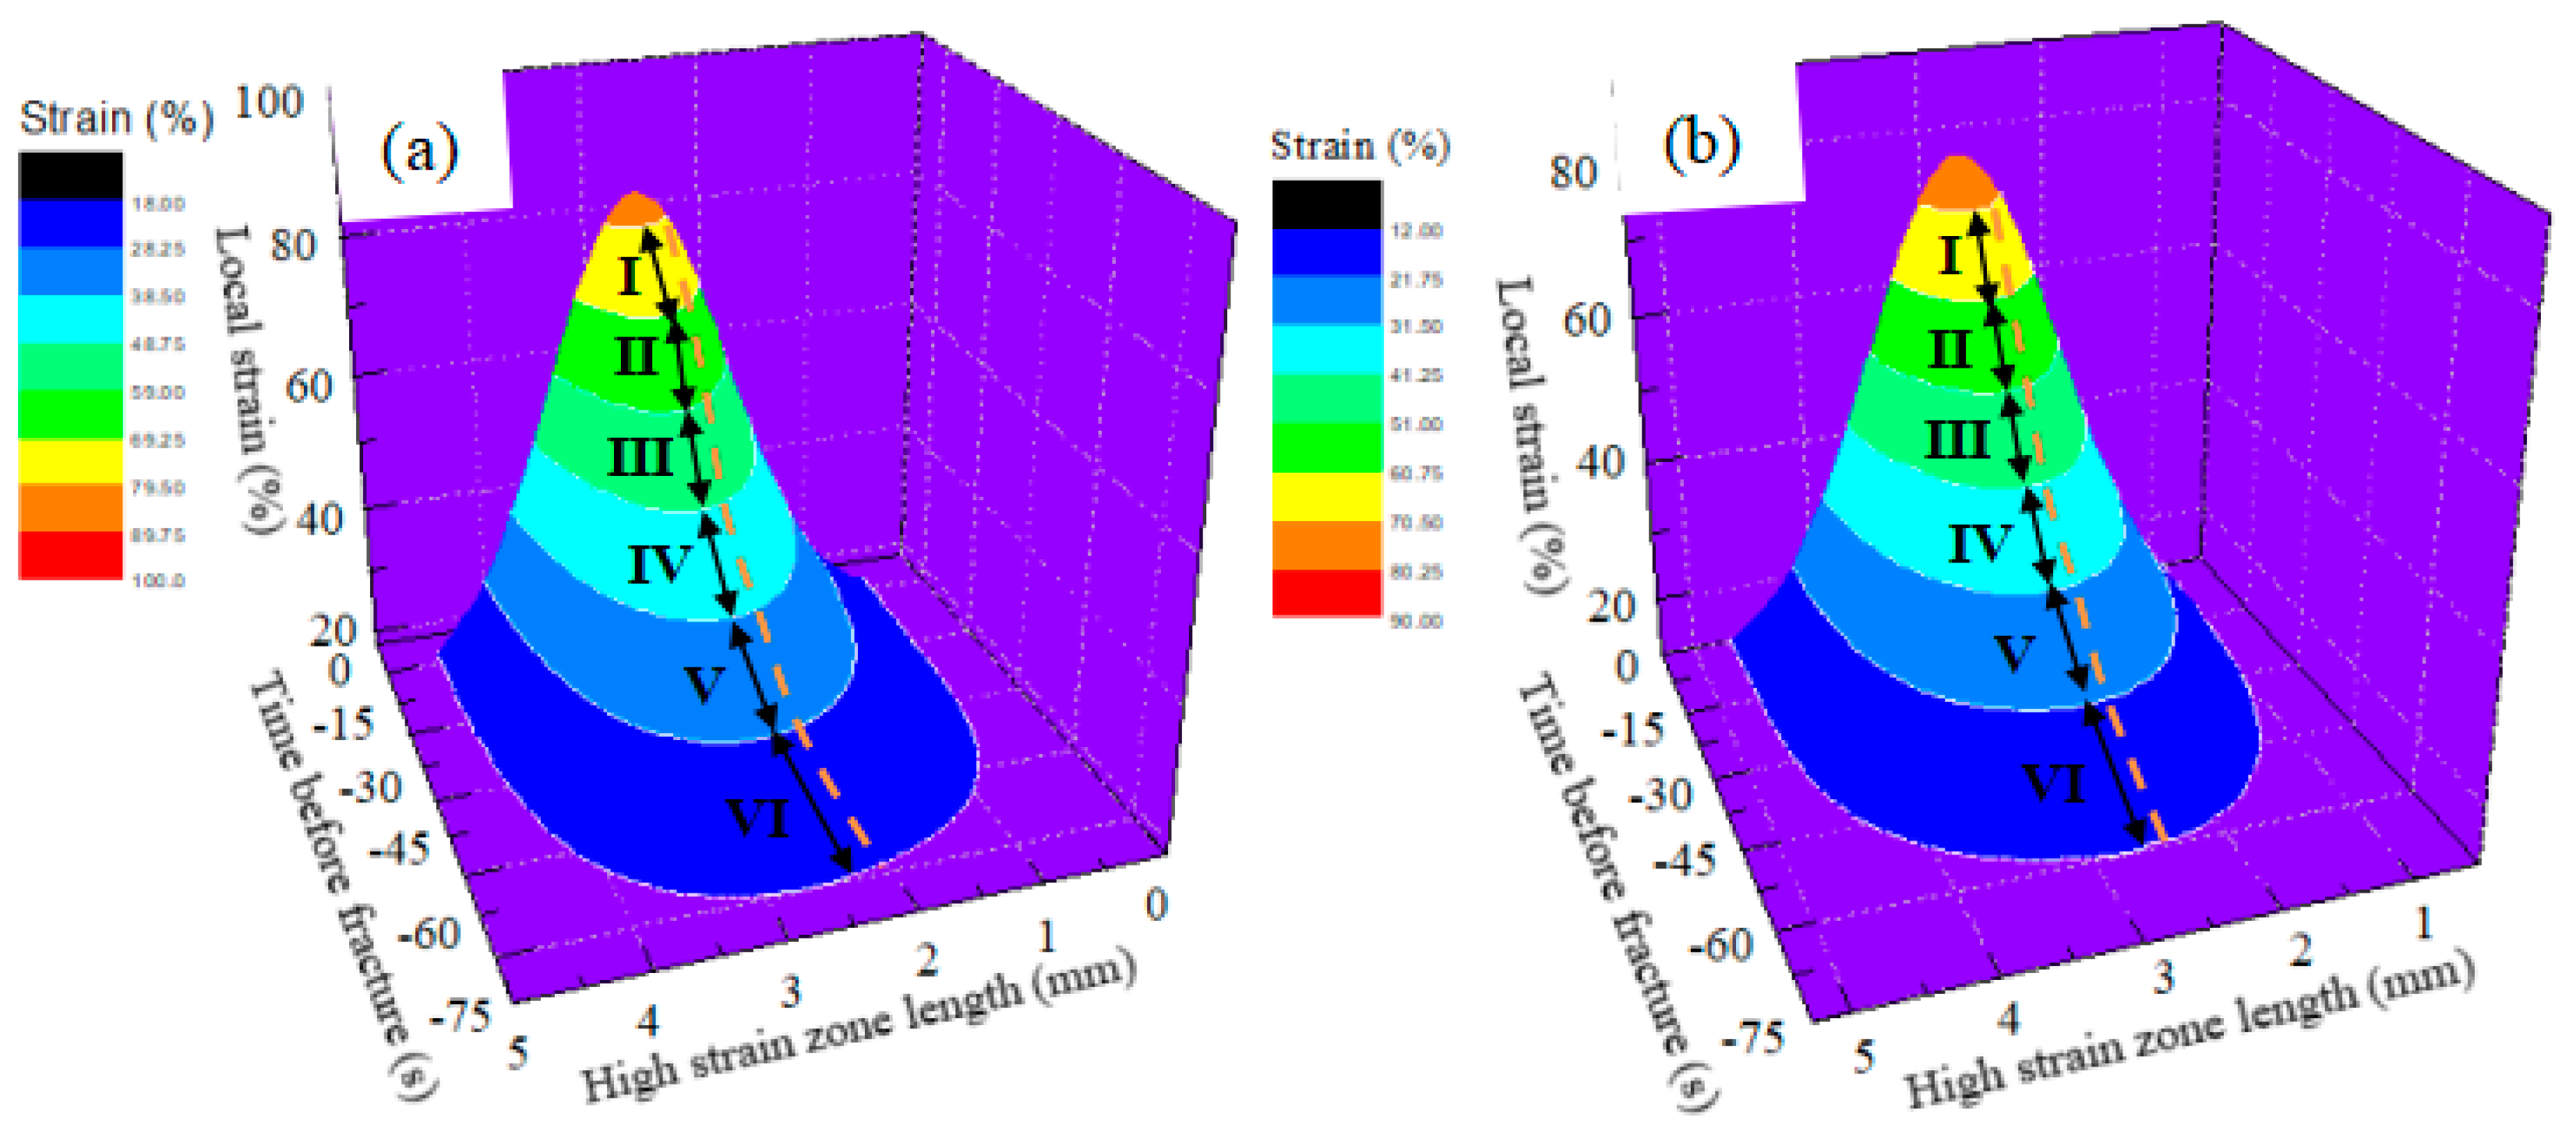
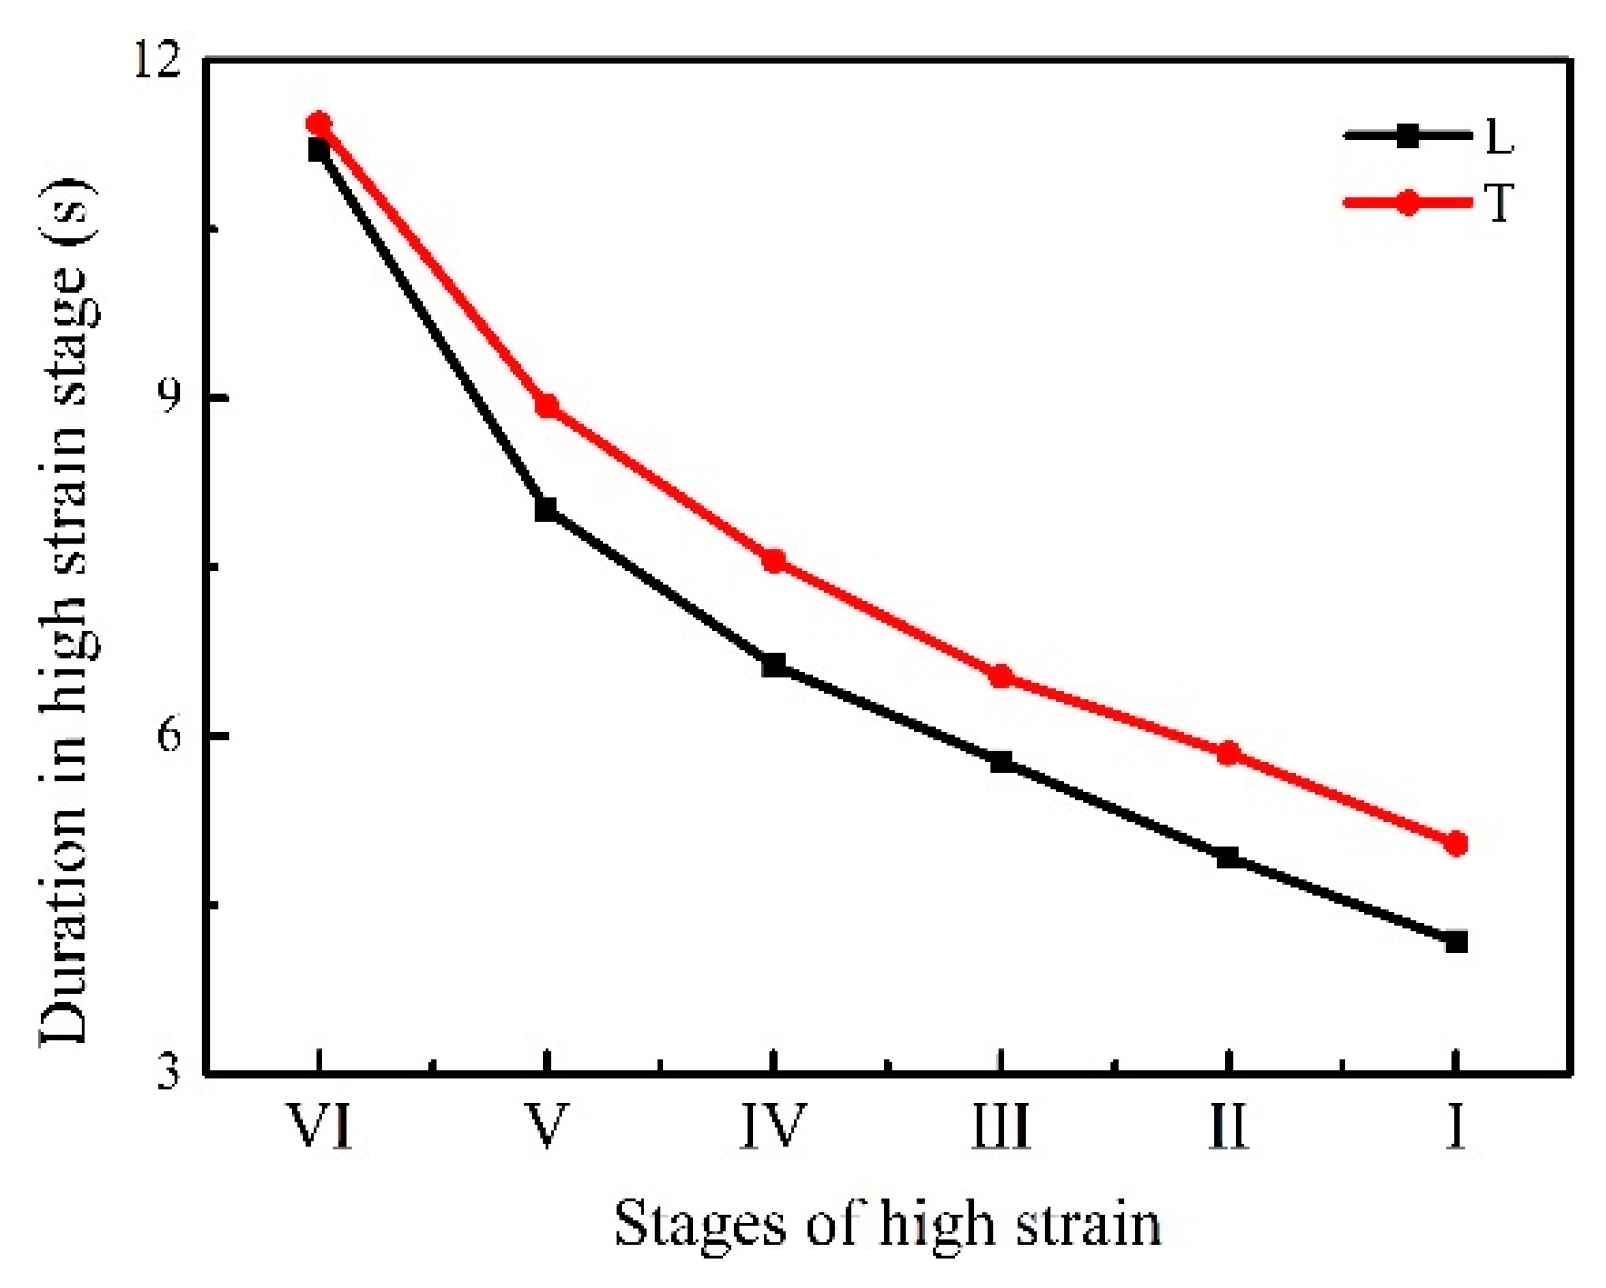
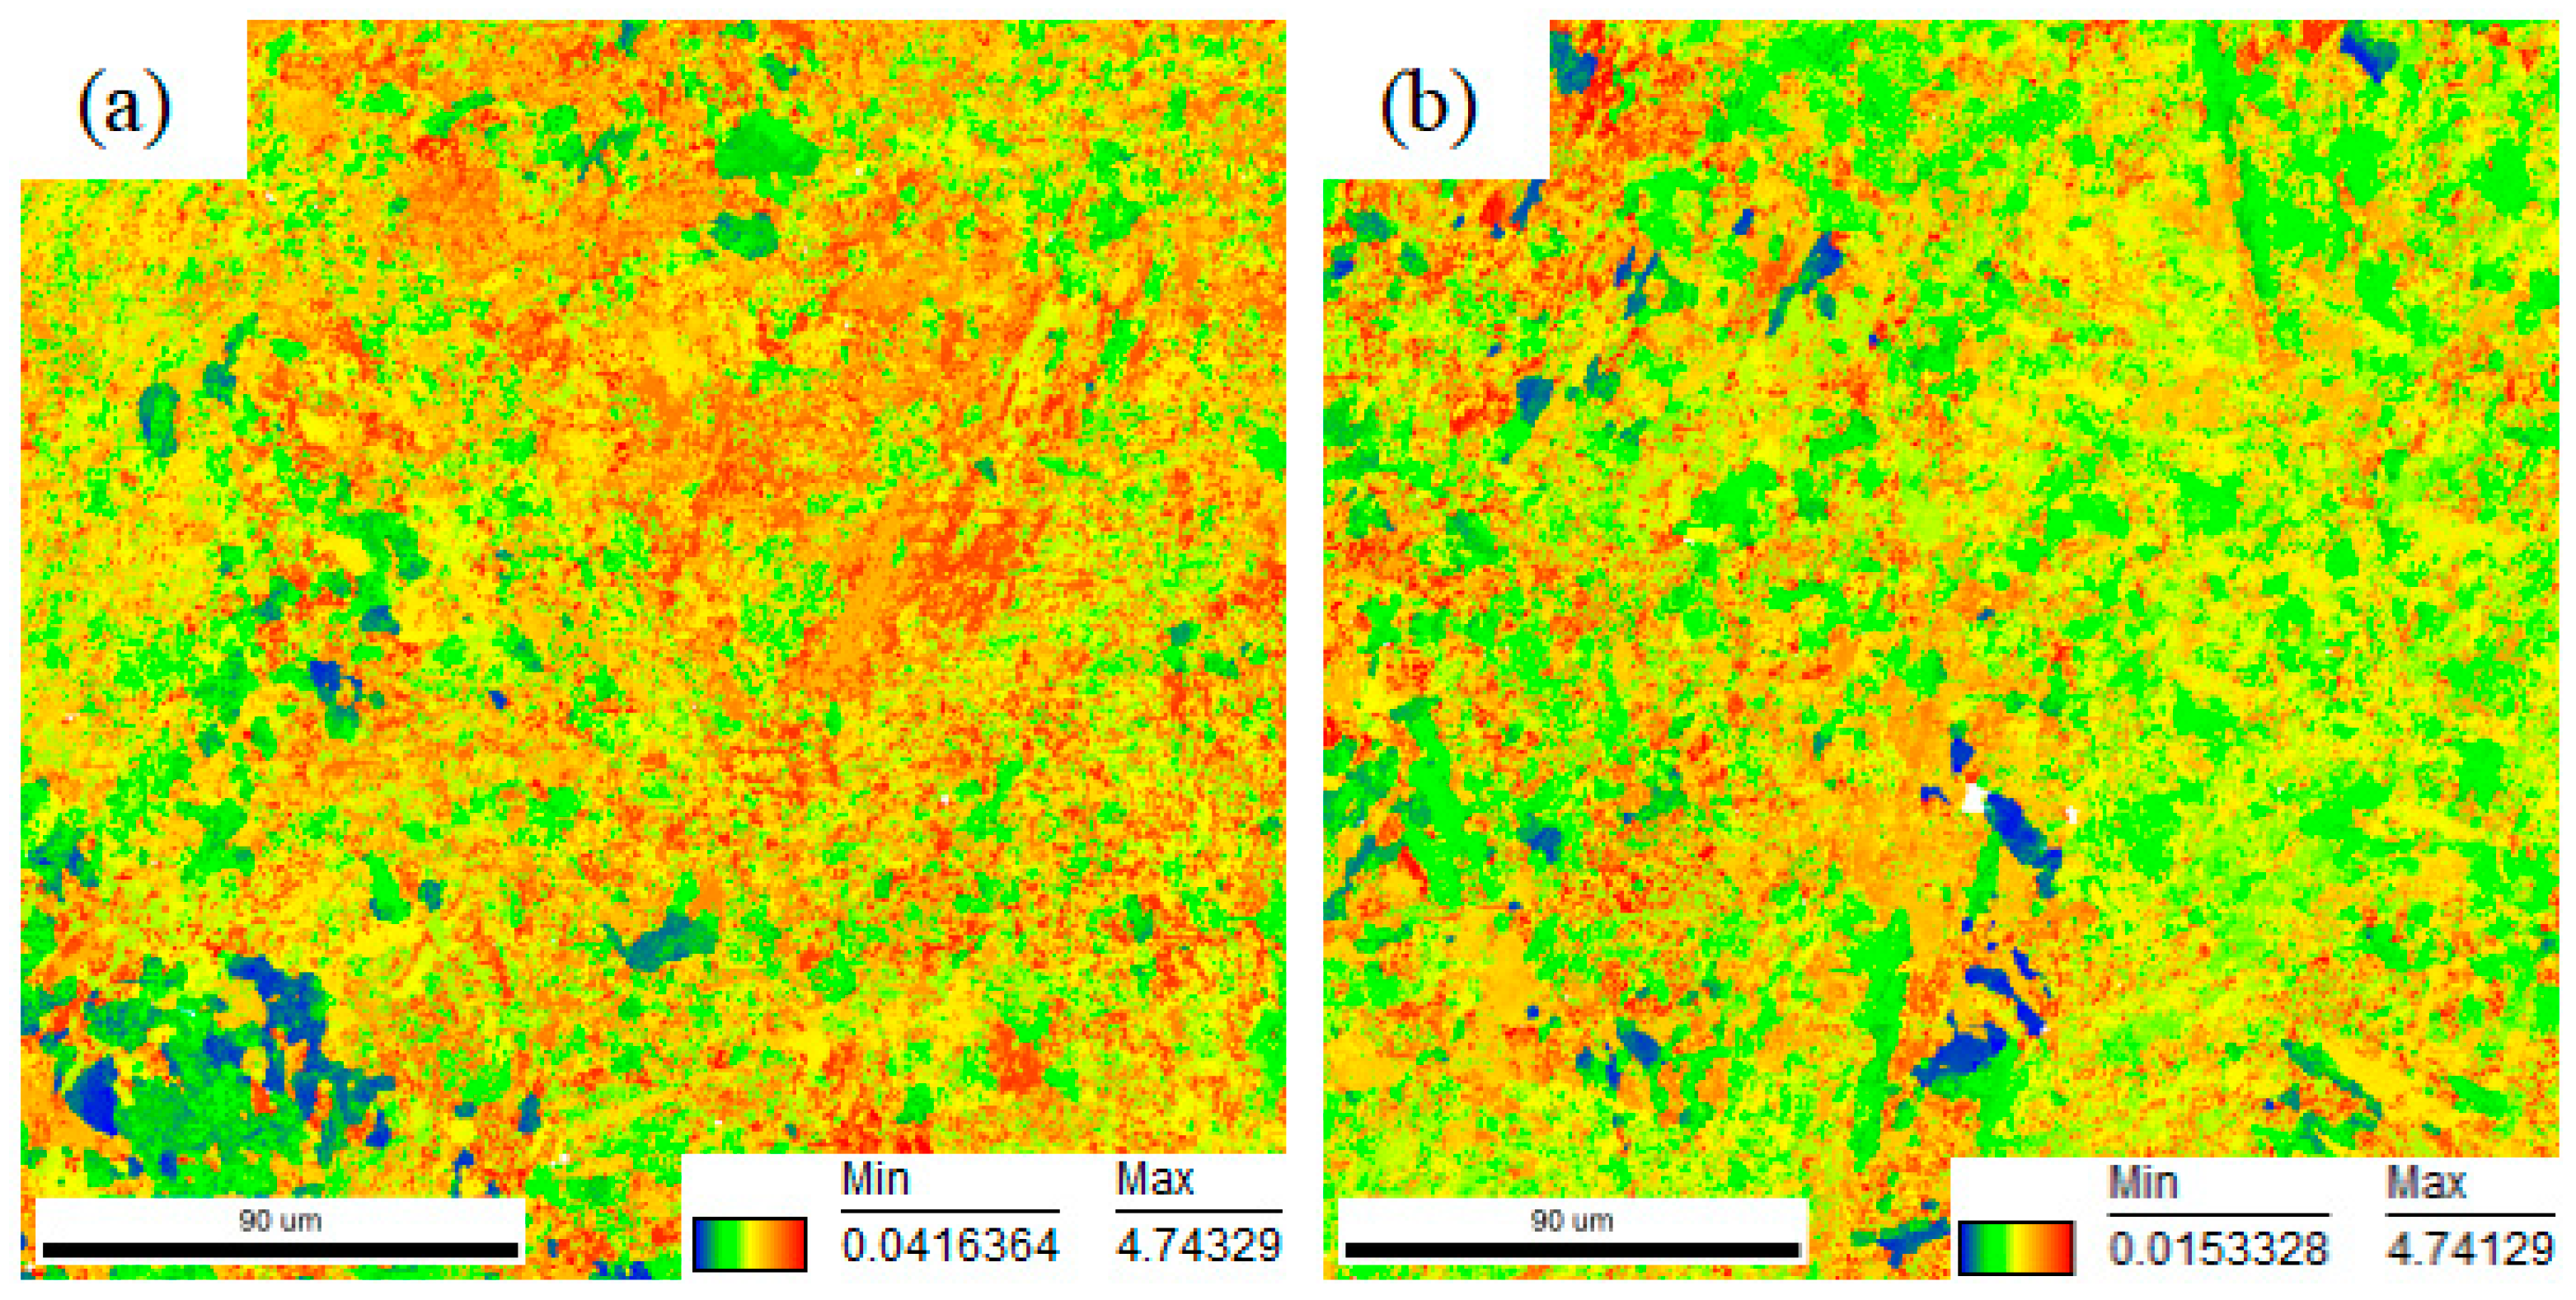
3.4. Tensile Test and DIC Analysis

The results of transversal and longitudinal tensile tests are listed in Table 3. As summarized from the data, the transversal tensile property obtained is better than that of the longitudinally stretched, indicating an anisotropy behavior, which usually occurs in the process of WAAM [29].
To reveal the anisotropy mechanisms, a DIC analysis is performed on a typical group of specimens and eight typical points are selected to represent the strain evolution during the transversal and longitudinal tensile tests separately. The selected experimental points can be seen from the stress–strain curves, as shown in Figure 10.
Figure 11 shows the strain evolution of the transversal and longitudinal specimens during the tensile testing. Each typical point selected in Figure 10 corresponds to the point in Figure 11. For the tensile test of the transversal specimen, strain evolution can be seen from P1 to P8, as shown in Figure 11a. Before the global strain reaches a certain extent, uniform strain distribution can be observed in the deformation area such as P1 and P2. This means that every area of the gauge section is involved in uniform deformation during the tensile process. As the tensile test proceeds, the applied load begins to increase. Local stress concentrations can be obtained from P3 to P6. Then, when necking takes place in the area of deformation, the local stress concentration intensifies and the macro stress reduces, as shown as P7 and P8. The strain evolution of the transversal tensile process is the same as that of the classic homogeneous material. In contrast, the strain evolution of the longitudinal specimen can be summarized by P1’ to P8’, as shown in Figure 11b. It can be seen that a high local strain occurred around several areas of the gauge section, shown as P1’ to P4’. This means that nonuniform strain distribution happens due to inhomogeneous stress. As the experiment continued, local stress concentration can be seen, but is markedly different from that of the transversal specimen. During this stage of deformation, the maximum strain existes while combined with local high strain near other areas, which can be observed as P5’ and P6’. At the end of the experiment, necking emerged, leading to stress concentration, which reduces the effect of the inhomogeneous strain distribution of the specimen, seen as P7’ and P8’. From the comparison of the strain evolution between the transversal and longitudinal specimens, the latter one shows inferior properties and a nonuniform strain distribution.
It is well known that the anisotropy of AM leads to different transversal and longitudinal behaviors and properties, mainly influenced by temperature gradients that are varied in successive layers and the penetration of the molten pool in the previous deposited layer [30,31,32]. As heat dissipation is higher in the forming direction than that in other directions, its solidified direction results in the anisotropy of grain morphology and mechanical properties. Additionally, longitudinal specimens are parallel with the building direction, implying that more inter-layer areas will be included within the test region. As a weakness, phase mutation and residual stress can usually be found near the inter-layer area, which results from the element interaction and large temperature gradient [33,34]. Researchers have also pointed out that the inter-layer area is considered as the weak link and that the strain tends to be focused in this region [35]. The cracks and material failure usually take place around these areas in the non-uniform specimen [36].
To give a further illustration of anisotropy, the strain cloud images of the transversal and longitudinal tensile specimens during the first 70 s of the experiment are shown in Figure 12. It can be seen from the differences in Figure 12b that they exhibit a nonuniform and intermittent strain distribution of the longitudinal tensile specimen because several interlayers are included, and that of the transversal specimen is relatively uniform, as shown in Figure 12a.
Additionally, after investigation on the initial stage of deformation, a comparison of the local strain distributed in the gauge section of the transversal and longitudinal tensile specimens is also made. Referred to as P5, P6, P7 and P5’, P6’, P7’, the results are shown in Figure 13. A high local strain region of the transversal specimen lay in the middle part and the local strain concentration reaches the maximum at P7, as shown in Figure 13a, while more than one region with a high local strain can be observed from the longitudinal specimens. With the experiment proceeding, the local strain difference increases and the local strain concentration is aggravated and reaches a peak at P7’, as shown in Figure 13b. Therefore, nonuniform local strain distribution of the longitudinal specimen is obvious, regardless of whether it is at the beginning or end of the deformation.
The high strain zone is used to refer to all zones of strain concentration and treated as a significant consideration during the tensile test [37]. In this study, the strain distribution condition in the high strain zones before fracture on the transversal and longitudinal tensile specimens is shown in Figure 14.
Based on the strain distribution condition, high strain zones can be divided into six high strain gradients and a comparison of the duration of high strain gradients is made to reveal the differences between the transversal and longitudinal tensile specimens. The results are shown in Figure 15. It can be seen from Figure 15, that the duration in the high strain zone (from stage I to VI) of the transversal specimen is longer than that of the longitudinal specimen. Furthermore, as high strain varied from stage VI to I (close to fracture), the duration gap between the transversal and longitudinal specimens gradually expands, suggesting that in high strain zones, the transversal specimen performed better, and the higher strain stage the tensile test experiences, the more remarkable the duration superiority of the transversal specimen.

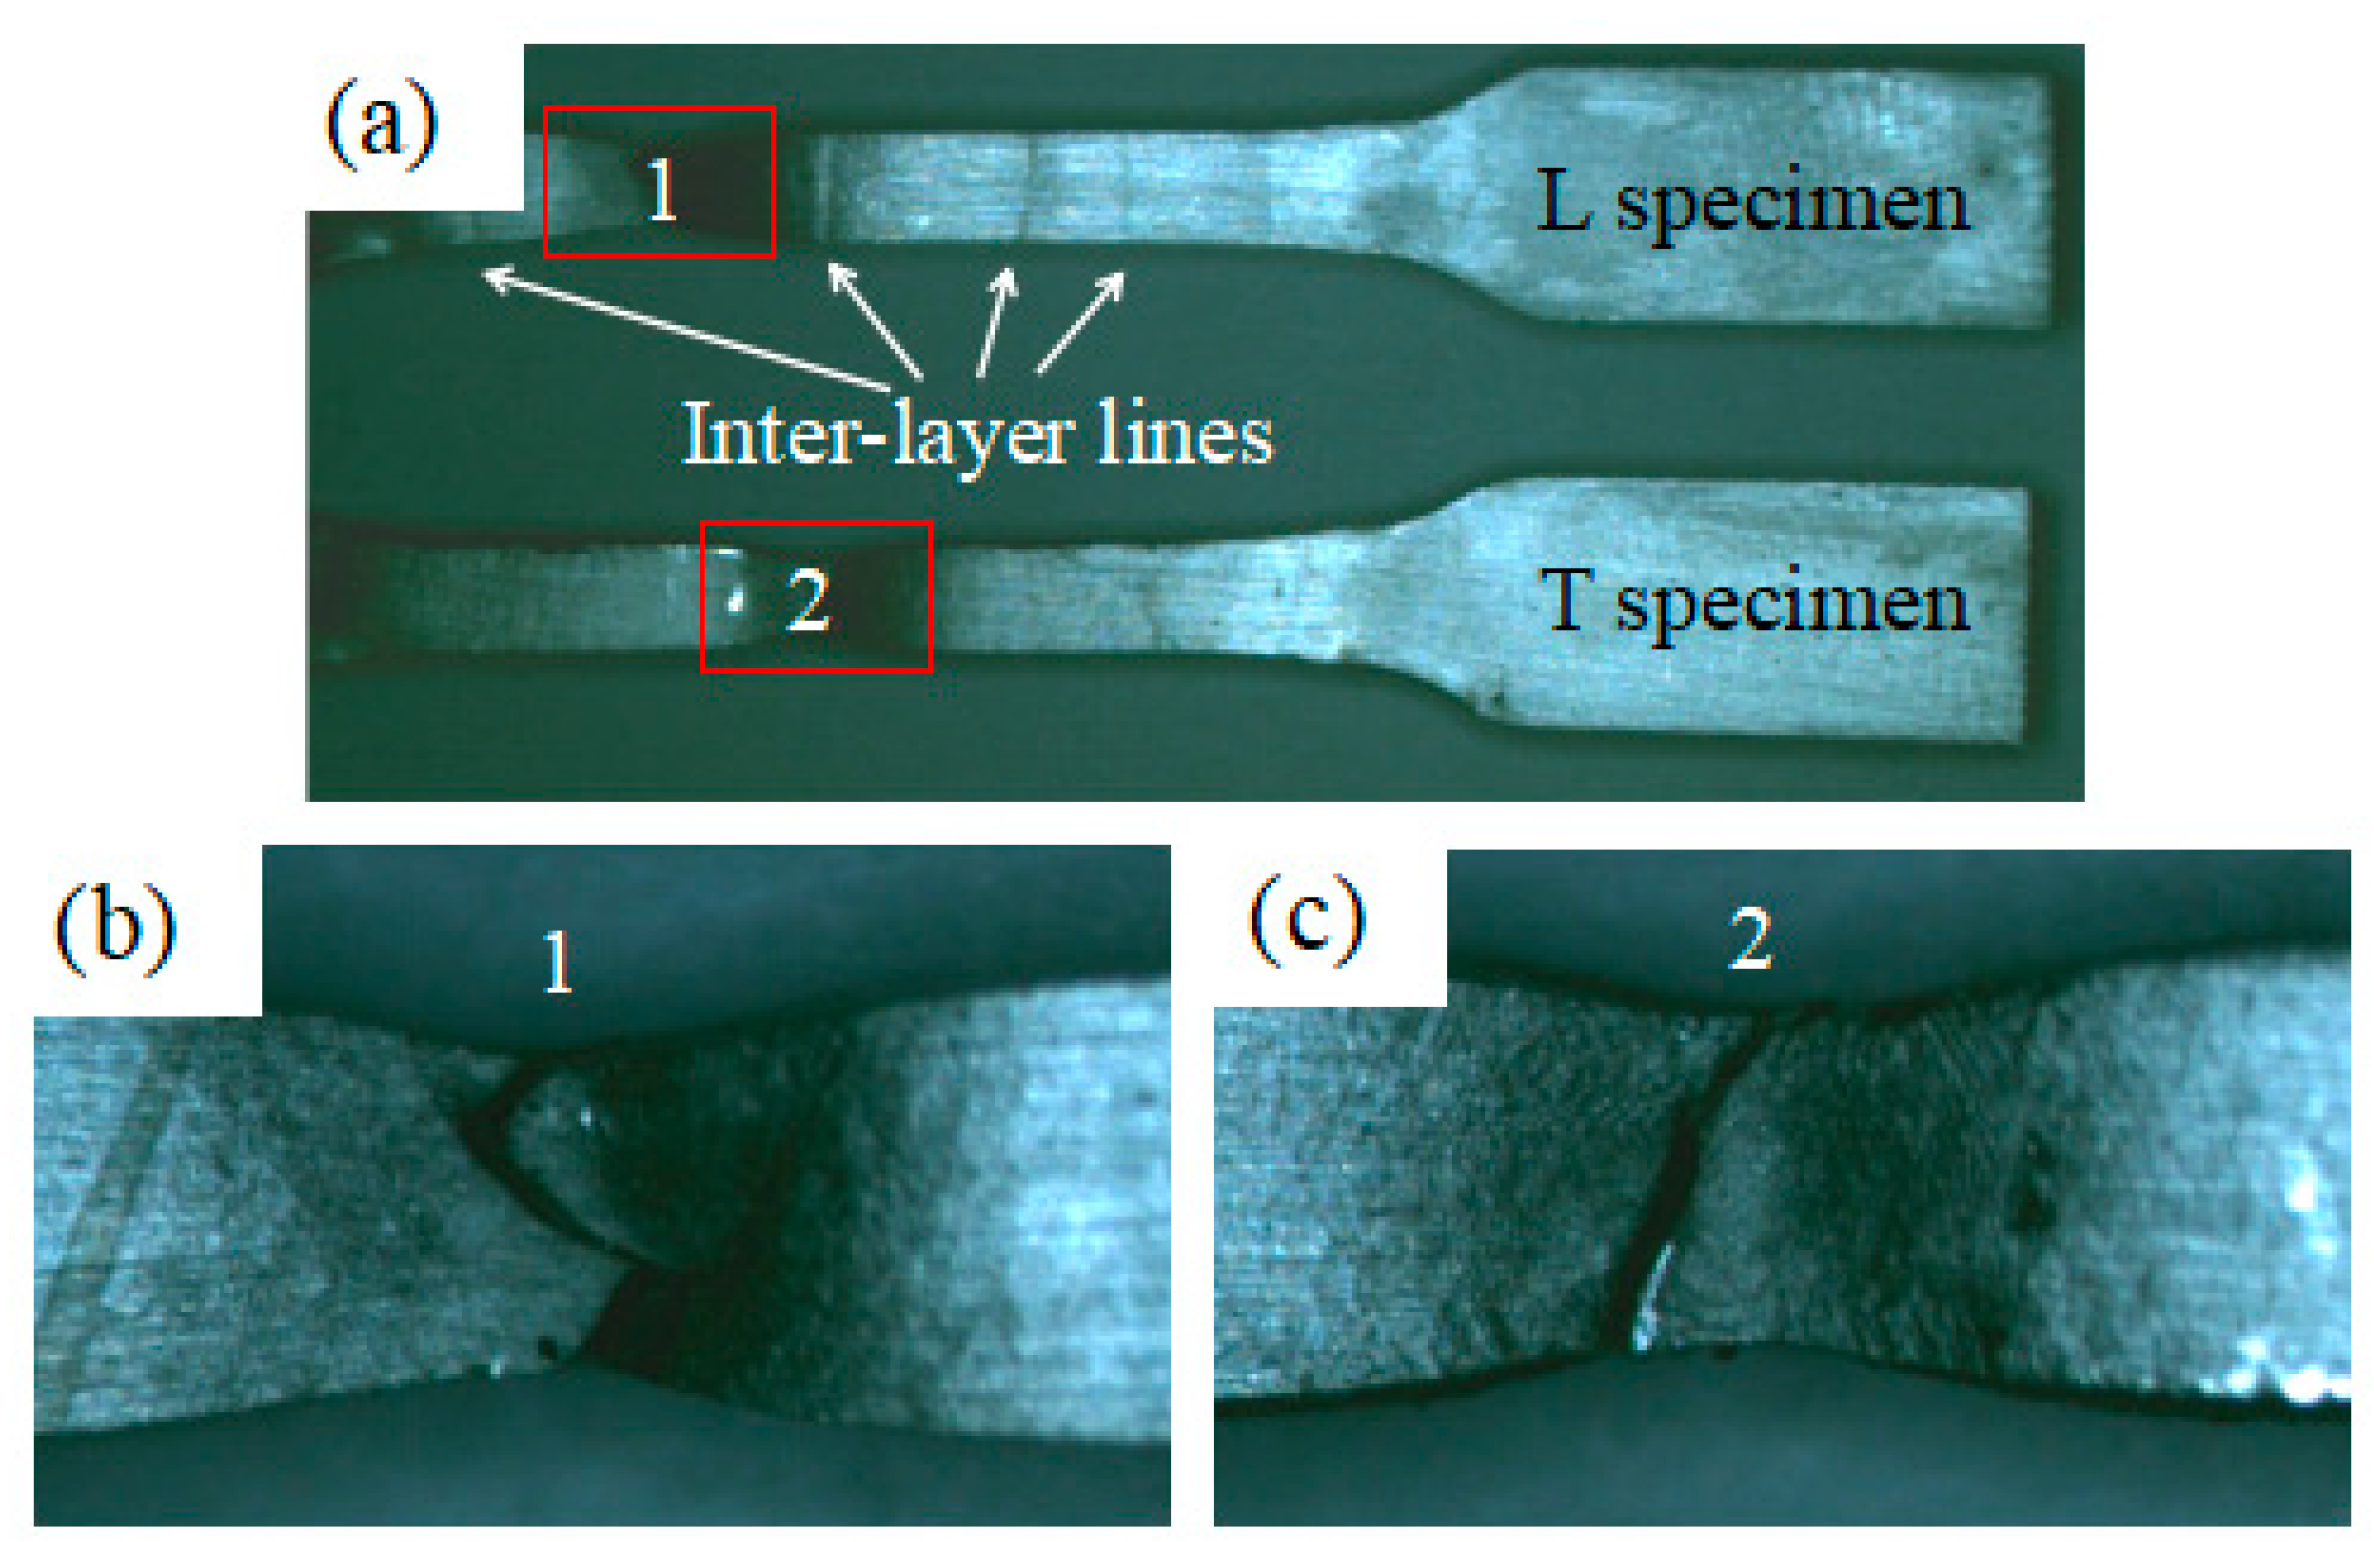
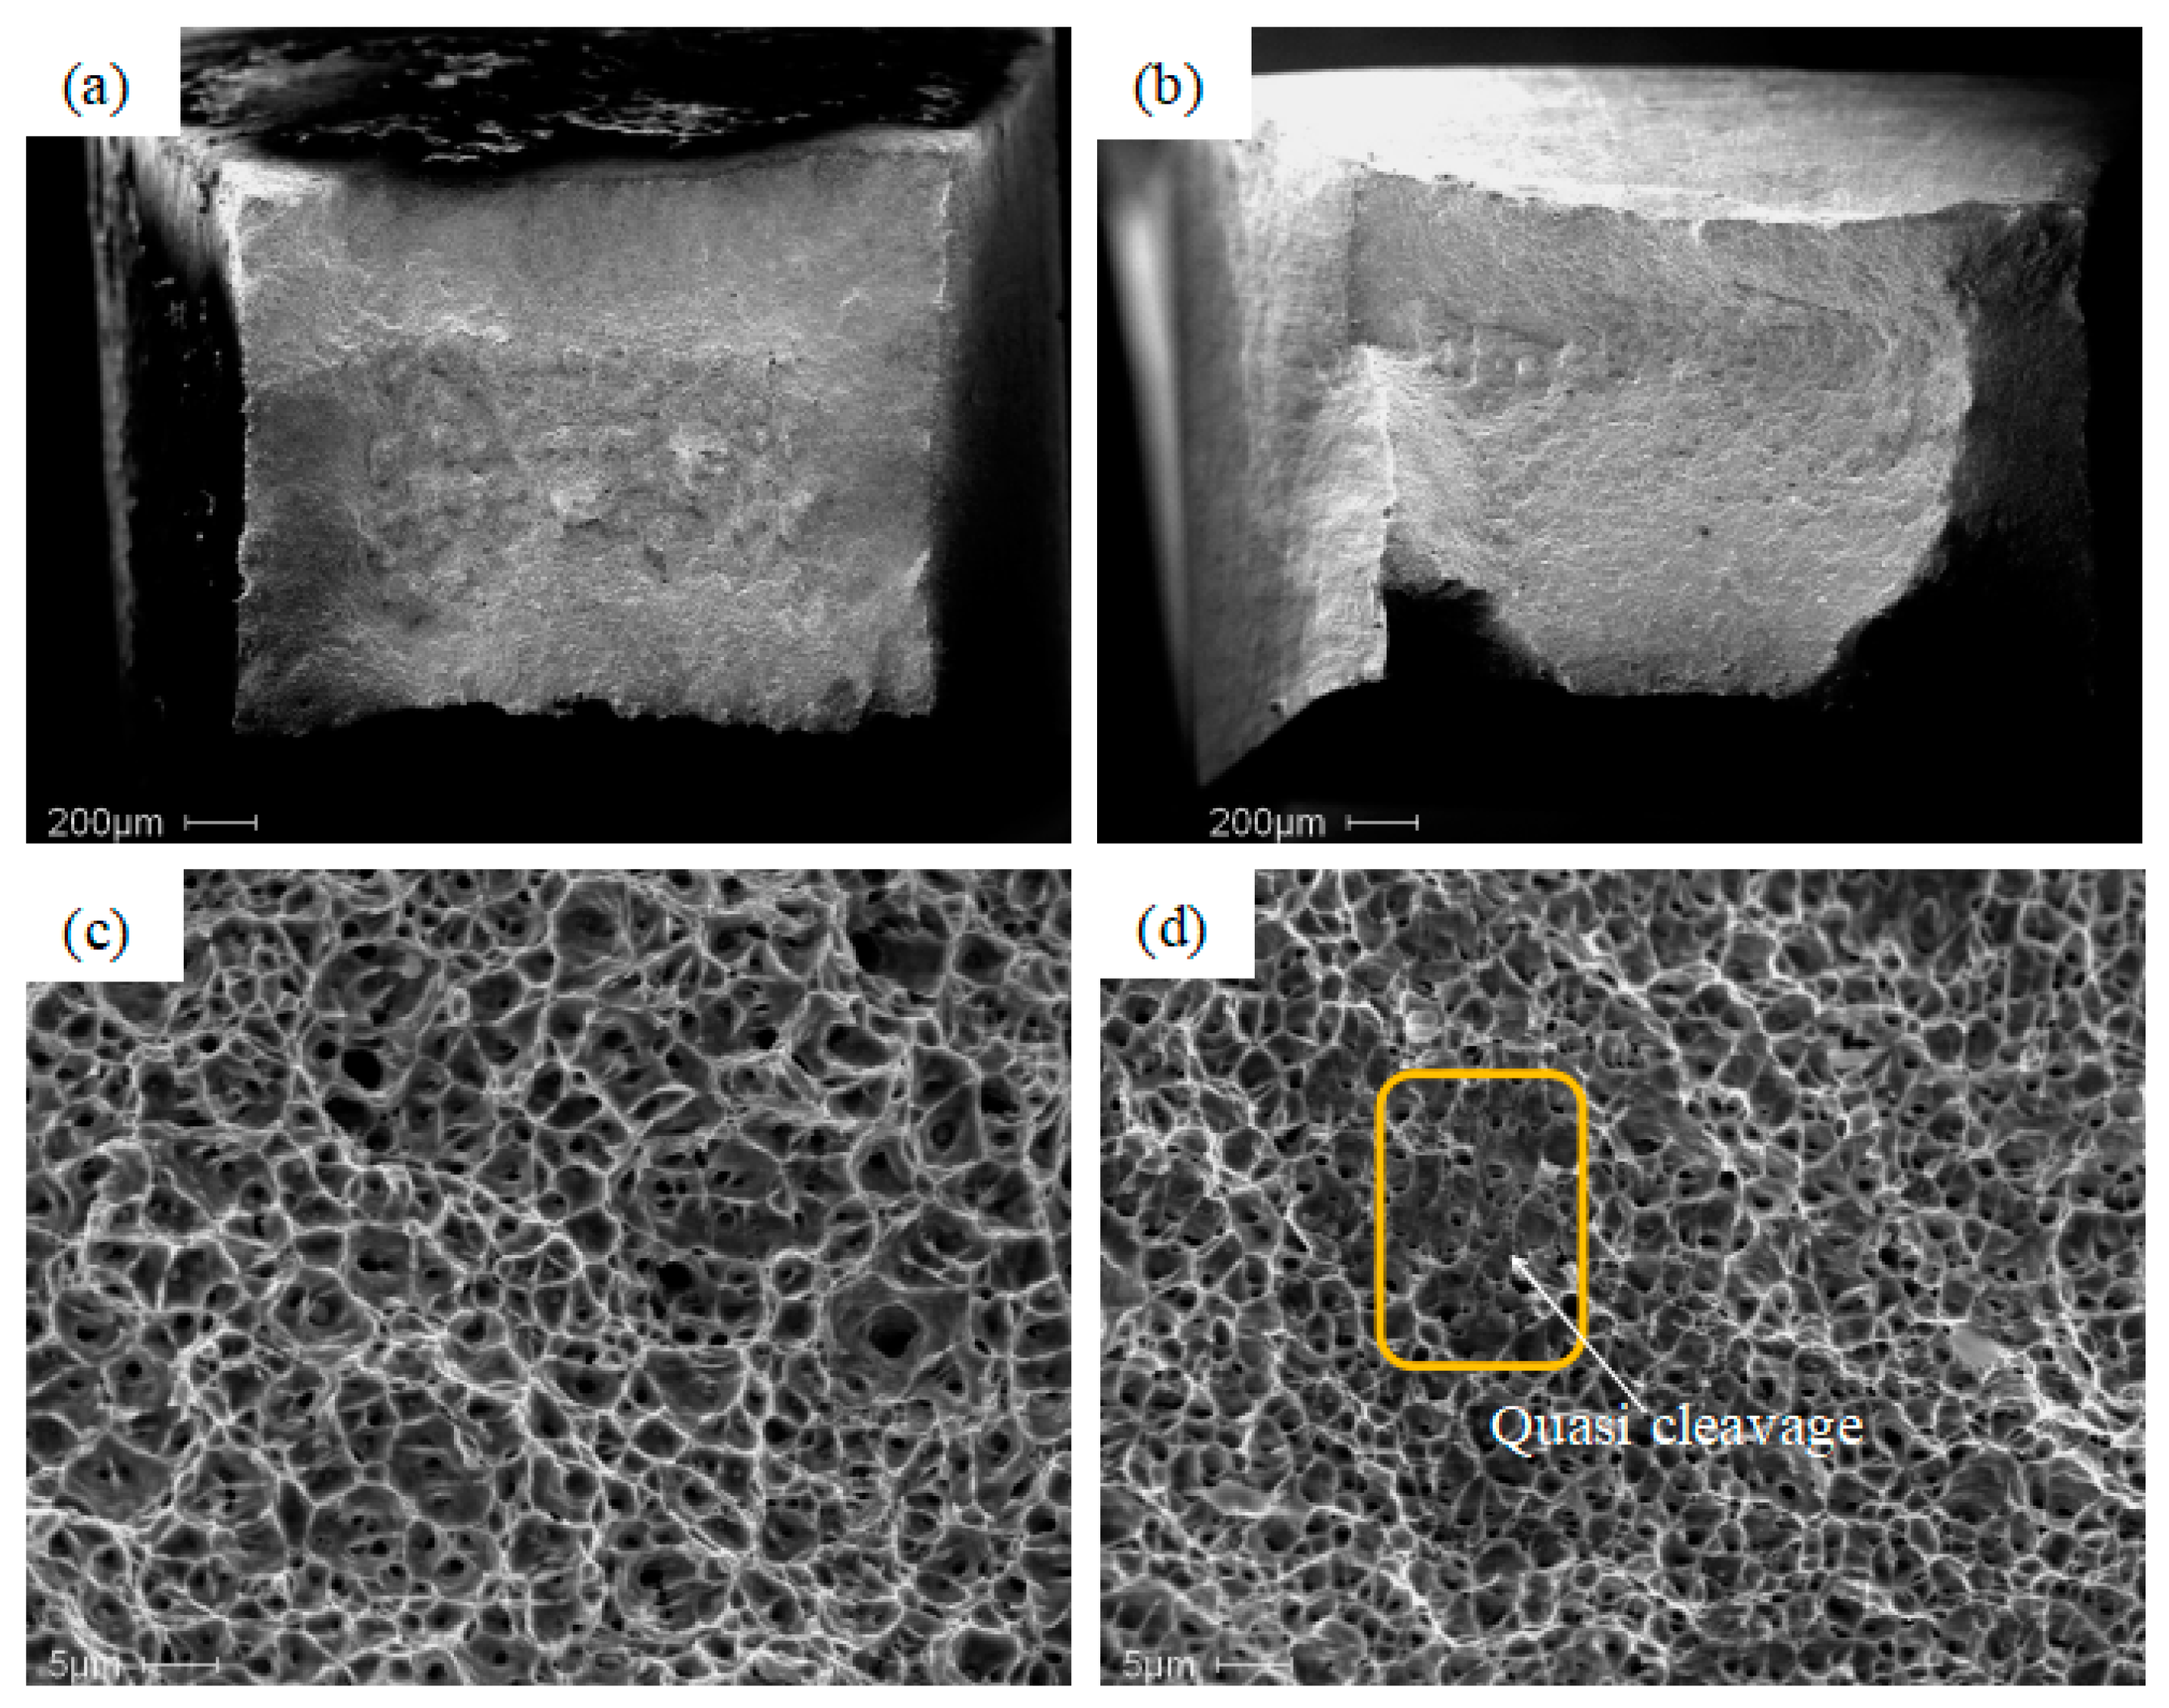
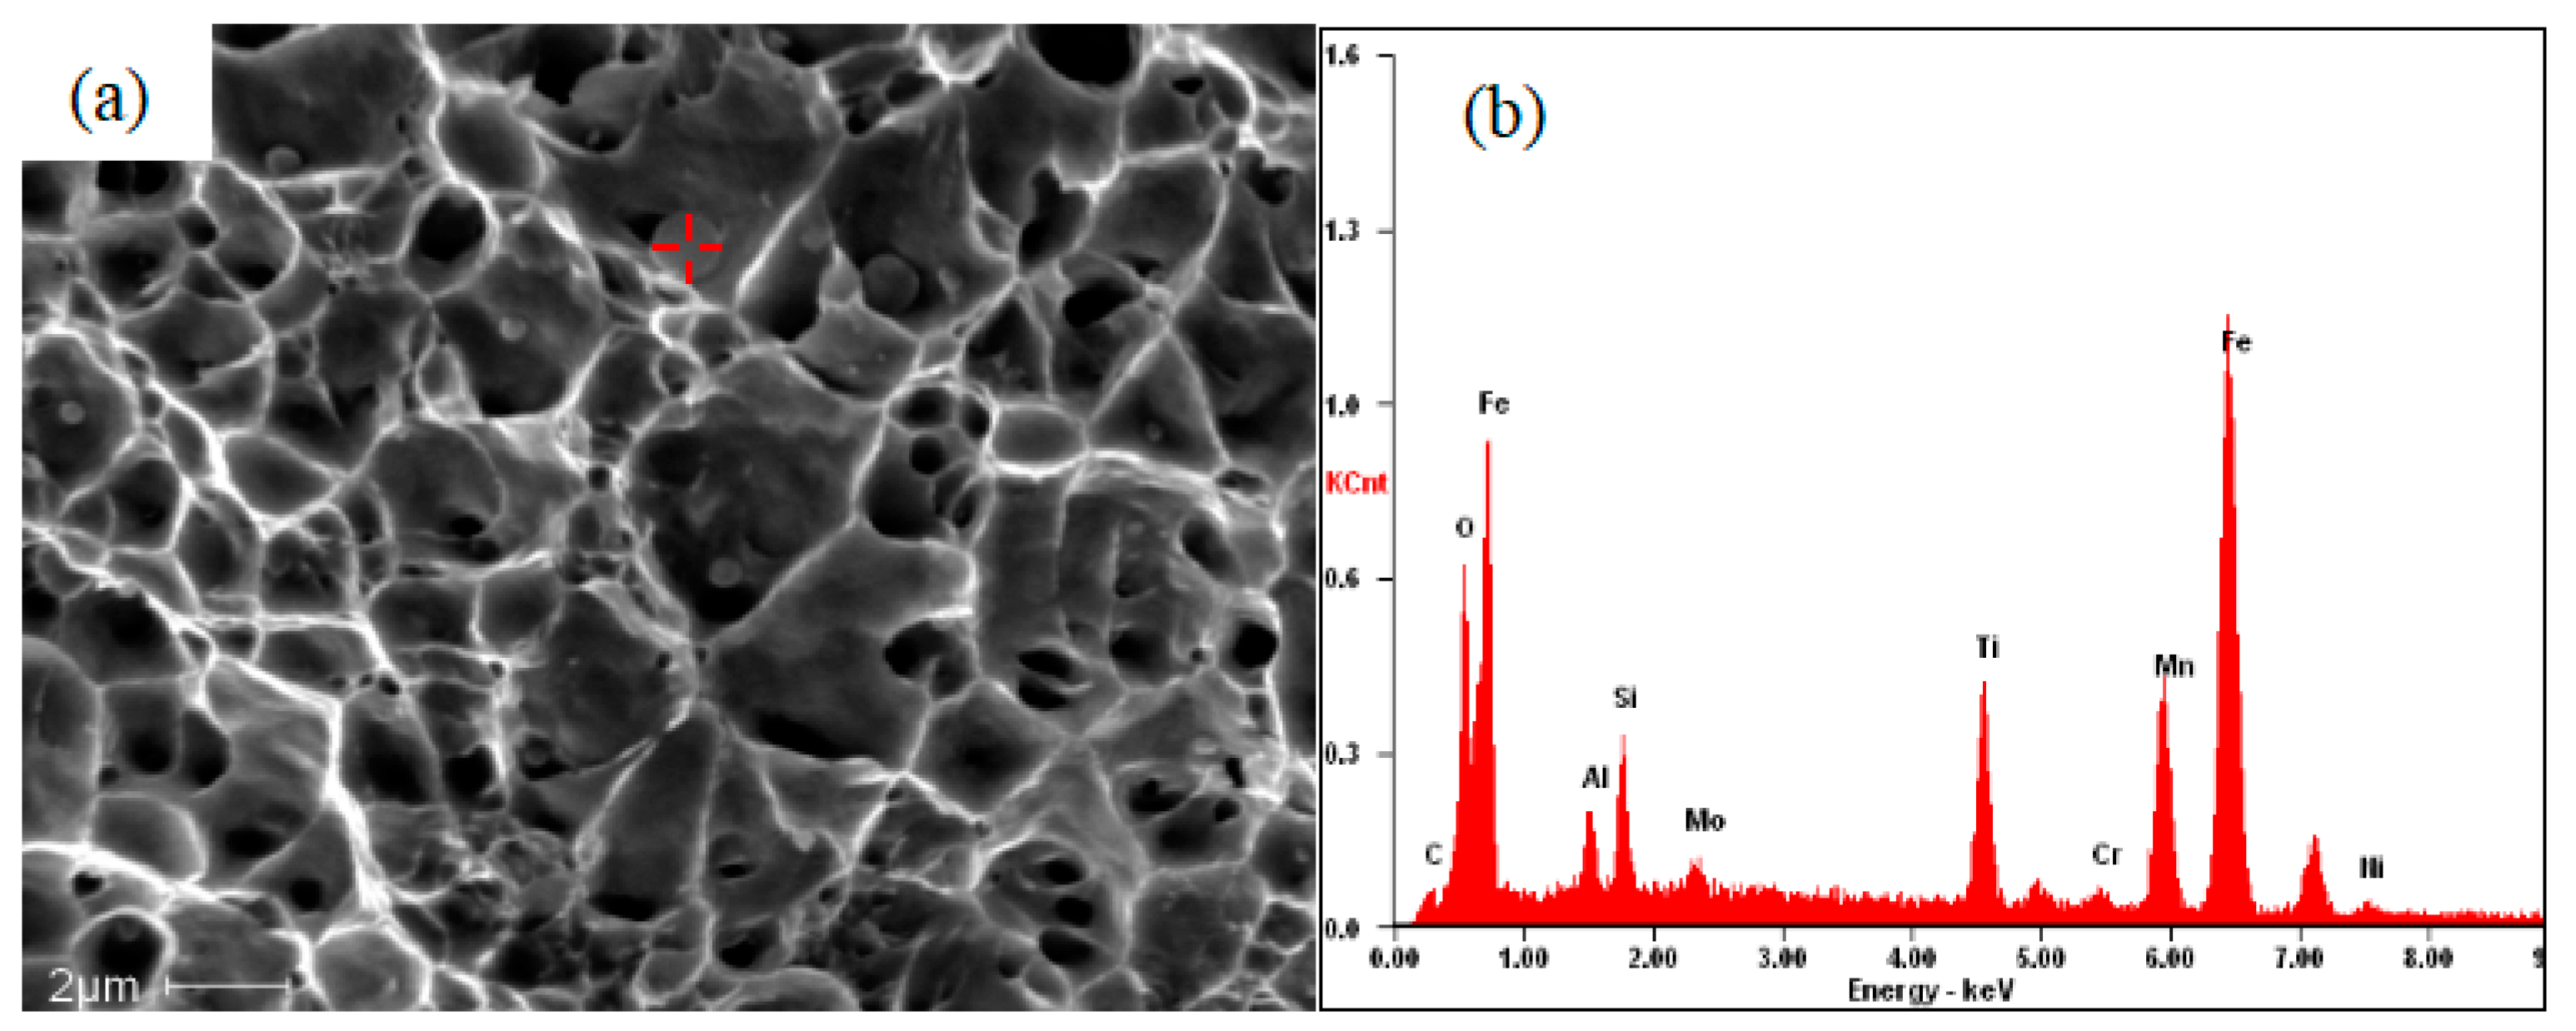
3.5. Fractography Observation

Fracture property is one of the critical considerations in material design and plays a significant role in the engineering field. The longitudinal and transversal fracture morphologies are analyzed via SEM. The macroscopic fracture morphology of the tensile specimens is shown in Figure 16. It can be seen that several inter-layer lines are observed from the longitudinal specimen after fracture, as shown in Figure 16a. This phenomenon results from the inferior mechanical properties of inter-layer areas, which are treated as the weak link. It has been proven that strain tends to be concentrated in the weaker areas in the non-uniform regions and cause fracture in these regions [38]. This is consistent with the strain evolution and local strain analysis that has been previously mentioned, interpreting the anisotropic mechanical properties. The surface of the macroscopic fracture of the longitudinal specimen is shown in Figure 16b where a bumpy and undulating surface morphology can be observed. The surface of the macroscopic fracture of the transversal specimen is illustrated in Figure 16c where the surface is smooth and located at a certain angle with the axial tensile stress.
In order to give a further illustration of this phenomenon, a comparison between the inter-layer area and deposited area on the Taylor factor is conducted by electron backscattered diffraction (EBSD). It is generally accepted that the Taylor factor is an important parameter, which determines the stress required to activate a slip system. This means that the Taylor factor plays an important role in tensile behavior, followed by the relationship:
σ = M τ c
where σ is the applied stress; M is Taylor factor; and τc is the critical resolved shear stress on each of the activated slip systems [39].
The comparison results of the Taylor factor distribution are shown in Figure 17. Compared with the distribution of the Taylor factor in the deposited area shown in Figure 17b, a less uniform distribution of the Taylor factor in the inter-layer area can be observed in Figure 17a. This confirms that nonuniform strength distribution takes place in the inter-layer area. The statistics for the Taylor factor distribution are depicted in Figure 18. The standard deviation of the Taylor factor in the inter-layer area is 0.907, larger than that of the deposited area (0.865).
A higher standard deviation of the Taylor factor means less uniform strength distribution in the inter-layer area. During the tensile test, to maintain the consistence of deformation, the grains located on both sides of the boundary are forced to deform consistently. Thus, nonuniform deformation and local stress concentration take place around the boundary, resulting in zigzag surface features near the fracture of the longitudinal specimen, as shown in Figure 16b, where it is constant with the strain evolution and local strain analysis that has been previously mentioned, interpreting the anisotropic mechanical properties. The result mainly corresponds to the directional growth of the microstructure, which has been confirmed by previous investigations [40].
The fracture morphologies of the transversal and longitudinal specimens are shown in Figure 19. It can be seen from Figure 19a,b that the transversal and the longitudinal fracture surfaces both present as grey and fibrous, revealing ductile fracture. Additionally, a large number of equiaxed dimples with a relative uniform distribution are apparent on the fracture surface of the transversal specimen, shown in Figure 19c. In contrast, the mixed-rupture characteristics of quasi-cleavage and small dimples emerge on the fracture surface of the longitudinal specimen, as depicted in Figure 19d. Through the comparison of the appearance of dimple dimensions and depths of the transversal and longitudinal fracture, one can find the transversal are greater, which indicates that the transversal specimen has better ductility. Although the feature of quasi-cleavage is observed from the local part of the fracture on the longitudinal specimen, it can still show high ductility. Therefore, it is concluded from the result of the fracture analysis that the longitudinal mechanical property is inferior to that of the transversal one, which is in accordance with the above analysis.
During the process of fracture analysis, a large number of uniformly distributed particles are found in the dimples, as shown in Figure 20a. The particles may be instrumental in the formation of dimples [41]. In this study, most particles are smaller than 1 μm, implying that during the process of fracture, larger stress is required for the formation of microvoids, and that the growth rate of microvoids is lower [42]. Energy dispersive X-ray spectroscopy (EDX) is applied to analyze the composition of the particles, and the results are shown in Figure 20b. It can be seen that Fe, Ti, Al, O, Mn, and Si are the main elements of the particles, which can be identified as non-metallic inclusions such as Al2O3 or Ti2O3. The existence of the particles can be considered as nucleation points for dimples.

4. Conclusions

In this investigation, a low carbon component with high strength was fabricated by WAAM without any visible detects and an analysis on its microstructure and mechanical properties was undertaken, which showed potential for industrial application. The following conclusions can be drawn:
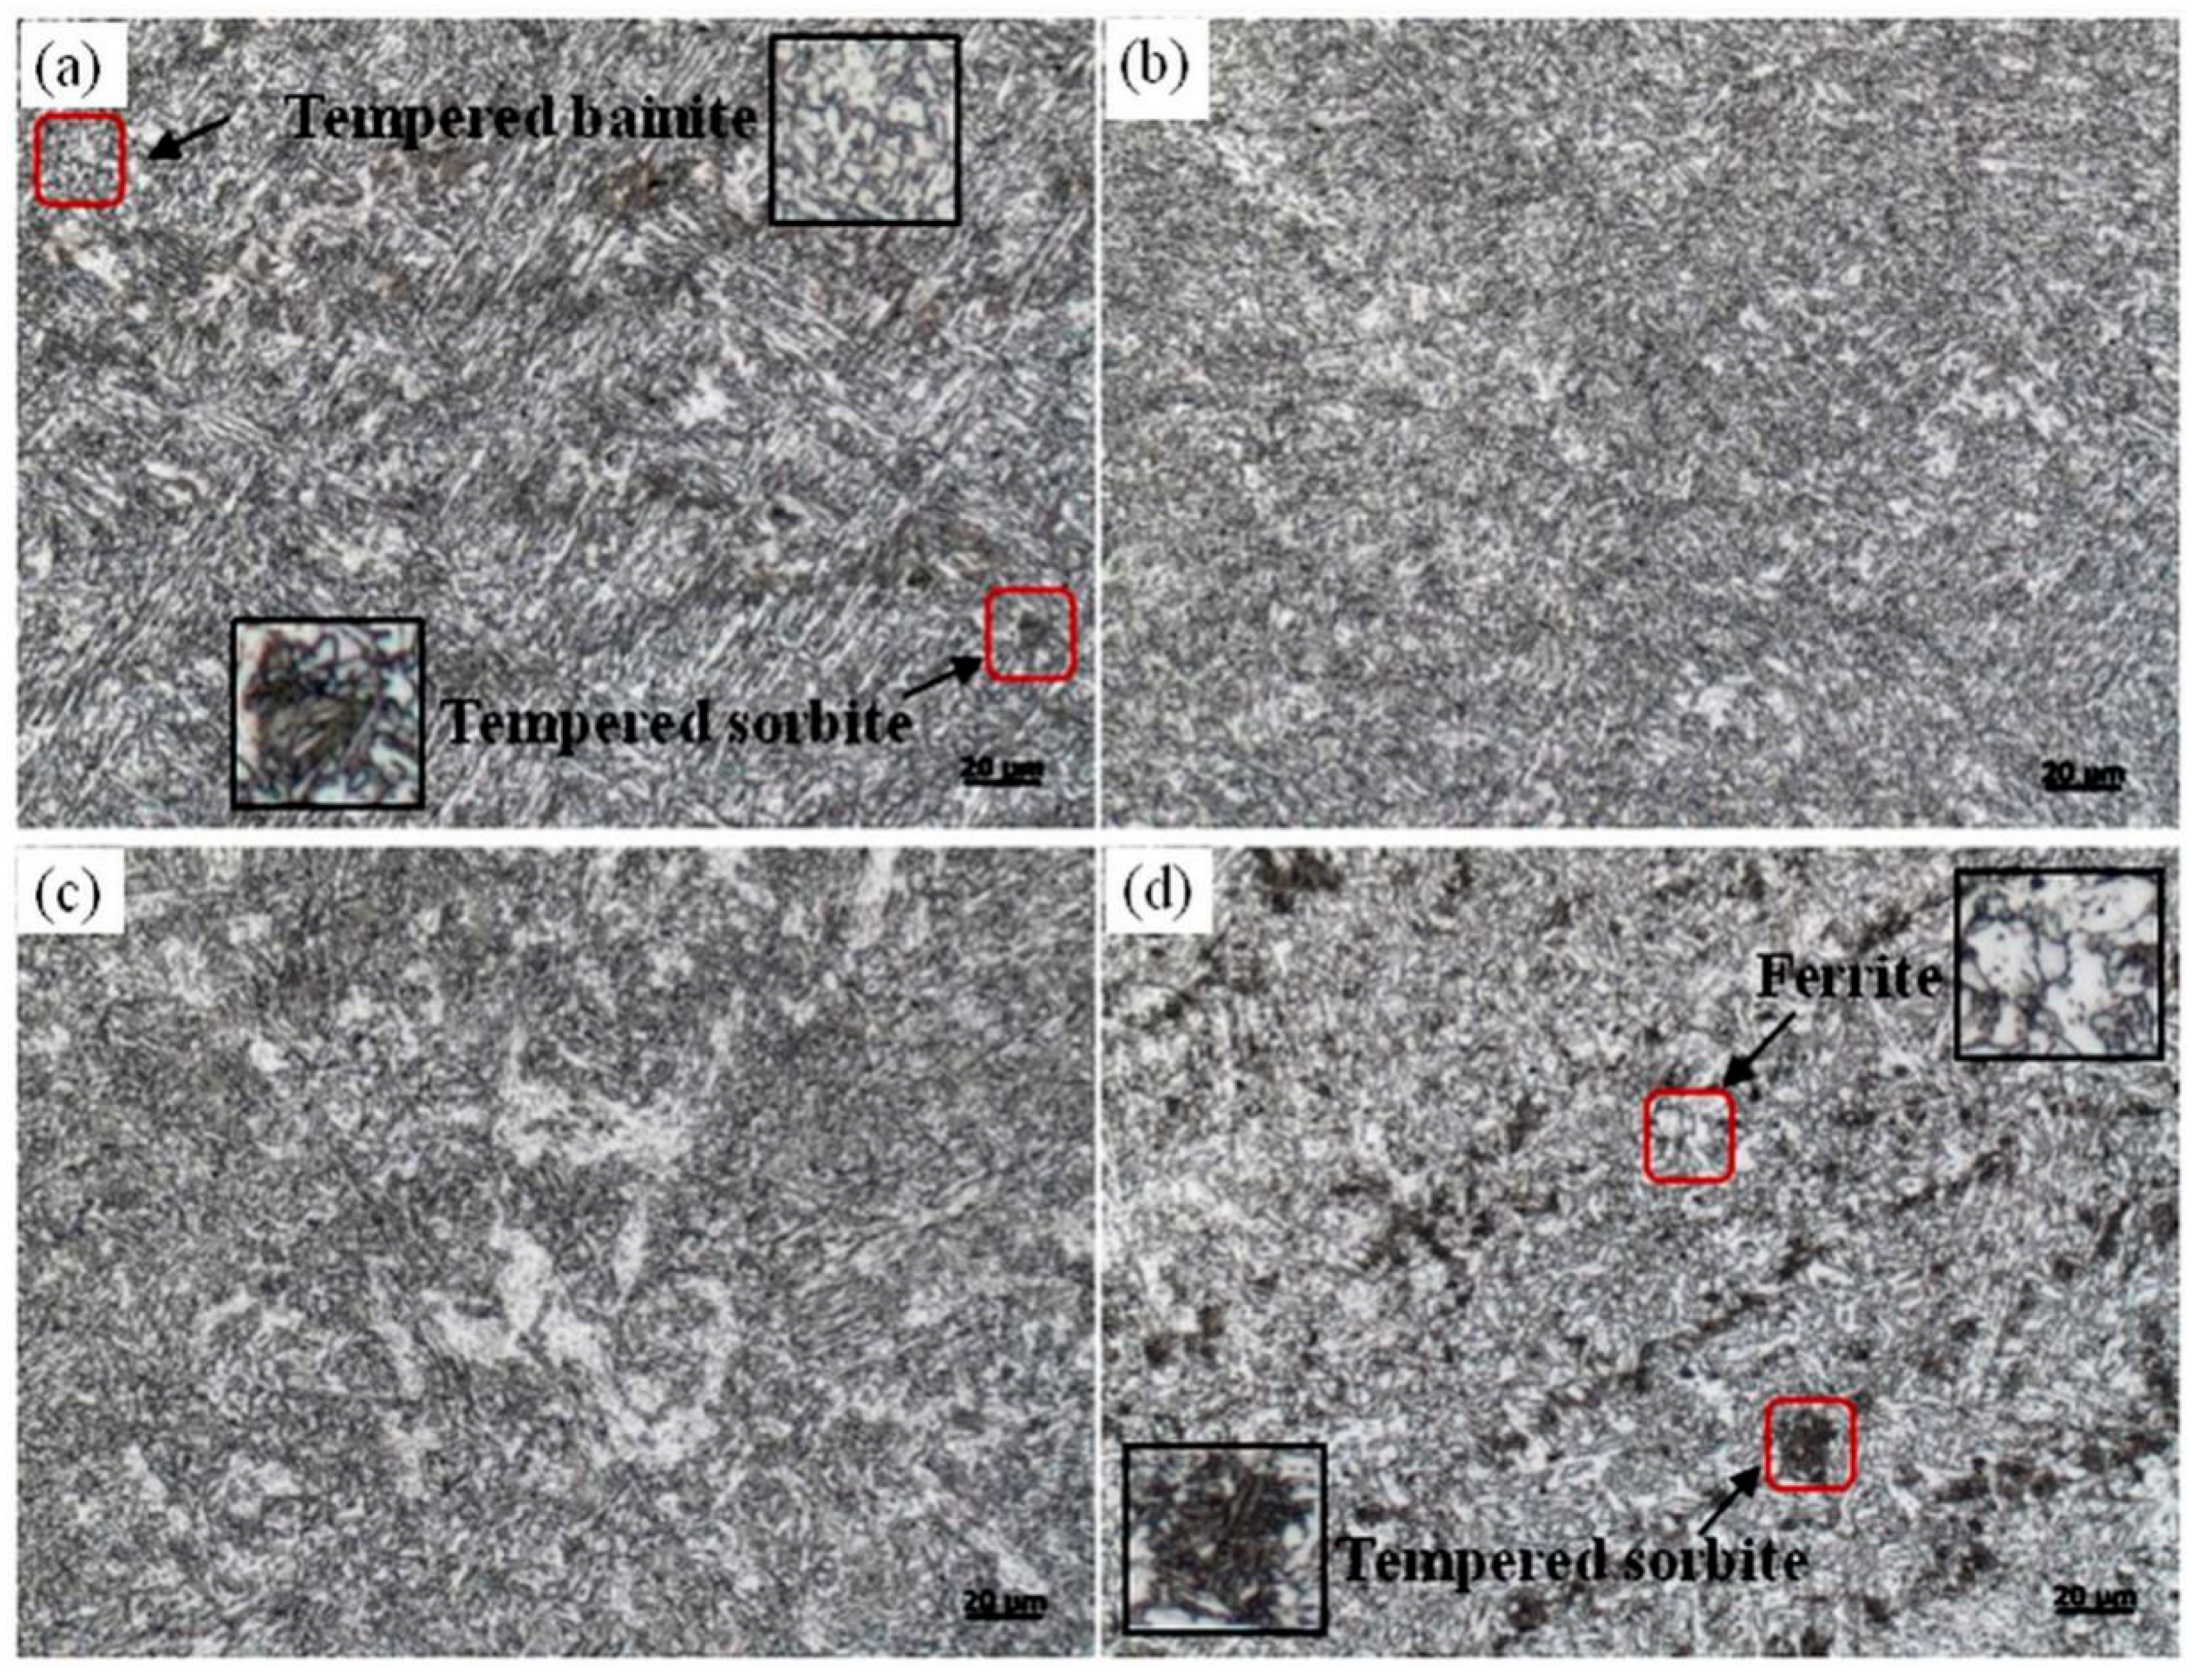
  • The microstructure of the bottom part showed a directional growth of columnar grains, and as the deposition continued, the features of the directional growth of microstructure were weakened due to the temperature gradient variation, nearly disappearing in the top part. The formation of the phase at the bottom was tempered bainite + tempered sorbite, that at the middle part was tempered bainite, and the one at the top part was composed of tempered bainite + tempered sorbite + sorbite ferrite. The transformation of the microstructure resulted from the different thermal cycles and cooling rate.
  • The microhardness varied from the bottom to the top part due to the formation of different microstructures. The bottom part showed the highest microhardness, which was around 290 HV and dropped down from 280 HV to 270 HV in the middle part. Then, it emerged as a lower value at the top part, which fluctuated from 270 HV to 260 HV.
  • The tensile strength of the longitudinal specimen had an inferior performance to that of the transversal specimen, showing anisotropy behavior. Several areas with local strain concentration of the longitudinal specimen could be found at the beginning and end stage of the tensile test when investigated using a DIC method. Additionally, the duration in the high strain stages of the longitudinal specimen was shorter and deteriorated with increasing strain.
  • A ductile fracture was revealed in both the transversal and longitudinal fracture surfaces. Several inter-layer areas as weak regions could be observed from the surface of the longitudinal specimen after fracture, resulting in local strain concentration. It was confirmed that the longitudinal mechanical property was inferior to that of the transversal specimen, showing anisotropy characteristics. Some particles existing as inclusions such as Al2O3 or Ti2O3 were found on the fracture surface.

Author Contributions

Methodology, C.G. and D.Y.; writing-original draft preparation, L.S.; project administration and funding acquisition, F.J. and R.H.; data curation, J.W.; writing—review and editing, providing ideas, C.G and F.J. All authors have read and agreed to the published version of the manuscript.

Funding

This work was supported by the National Key R&D Program of China (No. 2017YFB1103701); the National Natural Science Foundation of China (No. 51671065); the Equipment Development Department for Commission of Science and Technology (No. 41423030504); the Applied Technology Research and Development Plan of Heilongjiang (No. GA18A403); and the Natural Science Fund of Heilongjiang Province (No. ZD2019E006).

Acknowledgments

Authors appreciate the help of Research & Development Centre and Quality Inspection Office, Harbin Welding Institute Limited Company.

Conflicts of Interest

The authors declare no conflict of interest.

References

  1. Xue, Q.; Benson, D.; Meyers, M.; Nesterenko, V.; Olevsky, E. Constitutive response of welded HSLA 100 steel. Mater. Sci. Eng. A 2003, 354, 166–179. [Google Scholar] [CrossRef]
  2. Guo, N.; Leu, M.C. Additive manufacturing: Technology, applications and research needs. Front. Mech. Eng. 2013, 8, 215–243. [Google Scholar] [CrossRef]
  3. Frazier, W.E. Metal Additive Manufacturing: A Review. J. Mater. Eng. Perform. 2014, 23, 1917–1928. [Google Scholar] [CrossRef]
  4. Dilberoglu, U.M.; Gharehpapagh, B.; Yaman, U.; Dolen, M. The role of additive manufacturing in the era of industry 4.0. Procedia Manuf. 2017, 11, 545–554. [Google Scholar] [CrossRef]
  5. Cunningham, C.R.; Flynn, J.M.; Shokrani, A.; Dhokia, V.; Newman, S. Invited review article: Strategies and processes for high quality wire arc additive manufacturing. Addit. Manuf. 2018, 22, 672–686. [Google Scholar] [CrossRef]
  6. DebRoy, T.; Wei, H.L.; Zuback, J.S.; Mukherjee, T.; Elmer, J.W.; Milewski, J.O.; Beese, A.M.; Wilson-Heid, A.; De, A.; Zhang, W. Additive manufacturing of metallic components–process. structure and properties. Prog. Mater. Sci. 2018, 92, 112–122. [Google Scholar] [CrossRef]
  7. Ding, J.; Colegrove, P.; Mehnen, J.; Ganguly, S.; Sequeira Almeida, P.M.; Wang, F.; Williams, S. Thermo-mechanical analysis of wire and arc additive layer manufacturing process on large multi-layer parts. Comput. Mater. Sci. 2011, 50, 3315–3322. [Google Scholar] [CrossRef] [Green Version]
  8. Ding, D.; Pan, Z.; Cuiuri, D.; Li, H. Wire-feed additive manufacturing of metal components: Technologies, developments and future interests. Int. J. Adv. Manuf. Technol. 2015, 81, 465–481. [Google Scholar] [CrossRef]
  9. Williams, S.W.; Martina, F.; Addison, A.C.; Ding, J.; Pardal, G.; Colegrove, P. Wire + arc additive manufacturing. J. Mater. Sci. Technol. 2016, 32, 641–647. [Google Scholar] [CrossRef] [Green Version]
  10. Gomez Ortega, A.; Corona Galvan, L.; Deschaux-Beaume, F.; Mezrag, B.; Rouquette, S. Effect of Process Parameters on the Quality of Aluminium Alloy Al5Si Deposits in Wire and Arc Additive Manufacturing Using a Cold Metal Transfer Process. Sci. Technol. Weld. Join. 2018, 23, 316–332. [Google Scholar] [CrossRef] [Green Version]
  11. Kazanas, P.; Deherkar, P.; Almeida, P.; Lockett, H.; Williams, S. Fabrication of Geometrical Features using Wire and Arc Additive Manufacture. J. Eng. Manuf. 2012, 226, 1042–1051. [Google Scholar] [CrossRef]
  12. Xu, X.; Mi, G.; Luo, Y.; Jiang, P.; Shao, X.; Wang, C. Morphologies, microstructures, and mechanical properties of samples produced using laser metal deposition with 316L stainless steel wire. Opt. Lasers Eng. 2017, 94, 1–11. [Google Scholar] [CrossRef]
  13. Yang, D.; Wang, G.; Zhang, G. Thermal analysis for single-pass multi-layer GMAW based additive manufacturing using infrared thermography. J. Mater. Process. Technol. 2017, 244, 215–224. [Google Scholar] [CrossRef]
  14. Hermans, M.J.M.; Ouden, G.D. Process Behaviour and Stability in Short Circuit Gas Metal Arc Welding. Weld. J. 1999, 78, 137–141. [Google Scholar]
  15. Rodrigues, T.A.; Duarte, V.; Avila, J.A.; Santos, T.G.; Miranda, R.M.; Oliveira, J.P. Wire and arc additive manufacturing of HSLA steel: Effect of thermal cycles on microstructure and mechanical properties. Addit. Manuf. 2019, 27, 440–450. [Google Scholar] [CrossRef]
  16. Dai, Y.L.; Yu, S.F.; Shi, Y.S.; He, T.Y.; Zhang, L.C. Wire and arc additive manufacture of high-building multi-directional pipe joint. Int. J. Adv. Manuf. Technol. 2018, 96, 2389–2396. [Google Scholar] [CrossRef]
  17. Fu, Y.; Zhang, H.; Wang, G.; Wang, H. Investigation of mechanical properties for hybrid deposition and microrolling of bainite steel. J. Mater. Process. Technol. 2017, 250, 220–227. [Google Scholar] [CrossRef]
  18. Zhang, Y.M.; Chen, Y.; Li, P.; Male, A.T. Weld deposition-based rapid prototyping: A preliminary study. J. Mater. Process. Technol. 2003, 135, 347–357. [Google Scholar] [CrossRef]
  19. Krishnan, S.A.; Baranwal, A.; Moitra, A.; Sasikala, G.; Albert, S.K.; Bhaduri, A.K.; Harmain, G.A.; Jayakumar, T.; Rajendra Kumar, E. Assessment of deformation field during high strain rate tensile tests of RAFM steel using DIC technique. Procedia Eng. 2014, 86, 131–138. [Google Scholar] [CrossRef] [Green Version]
  20. Aris, N.F.M.; Cheng, K. Characterization of the surface functionality on precision machined engineering surfaces. J. Mater. Process. Technol. 2008, 38, 402–409. [Google Scholar] [CrossRef]
  21. Fayazfar, H.; Salarian, M.; Rogalsky, A.; Sarker, D.; Russo, P.; Paserin, V.; Toyserkani, E. A critical review of powder-based additive manufacturing of ferrous alloys: Process parameters, microstructure and mechanical properties. Mater. Des. 2018, 144, 98–128. [Google Scholar] [CrossRef]
  22. Hunt, J.D. Steady state columnar and equiaxed growth of dendrites and eutectic. Mater. Sci. Eng. 1984, 65, 75–83. [Google Scholar] [CrossRef]
  23. Zhong, Y.; Rannar, L.E.; Liu, L.; Koptiug, A.; Wikman, S.; Olsen, J.; Cui, D.; Shen, Z. Additive manufacturing of 316L stainless steel by electron beam melting for nuclear fusion applications. J. Nucl. Mater. 2017, 486, 234–245. [Google Scholar] [CrossRef]
  24. Thompson, S.W.; Vin Col, D.J.; Krauss, G. Continuous cooling transformations and microstructures in a low-carbon. high-strength low-alloy plate steel. Metall. Mater. Trans. A. 1990, 21, 1493–1507. [Google Scholar] [CrossRef]
  25. Ali, Y.; Henckell, P.; Hildebrand, J.; Reimann, J.; Bergmann, J.P.; Barnikol-Oettler, S. Wire arc additive manufacturing of hot work tool steel with CMT process. J. Mater. Process. Technol. 2019, 269, 109–116. [Google Scholar] [CrossRef]
  26. Casati, R.; Lemke, J.; Vedani, M. Microstructure and Fracture Behavior of 316L Austenitic Stainless Steel Produced by Selective Laser Melting. J. Mater. Sci. Technol. 2016, 32, 738–744. [Google Scholar] [CrossRef]
  27. Pradhan, P.; Robi, P.; Roy, S.K. Micro void coalescence of ductile fracture in mild steel during tensile straining. Fatigue Fract. Eng. Mater. 2012, 19, 51–60. [Google Scholar] [CrossRef] [Green Version]
  28. Mazumder, J.; Schifferer, A.; Choi, J. Direct materials deposition: Designed macro and microstructure. Mater. Res. Innov. 1999, 3, 118–131. [Google Scholar] [CrossRef]
  29. Carroll, B.E.; Palmer, T.A.; Beese, A.M. Anisotropic tensile behavior of Ti–6Al–4V components fabricated with directed energy deposition additive manufacturing. Acta Mater. 2015, 87, 309–320. [Google Scholar] [CrossRef]
  30. Baufeld, B. Effect of deposition parameters on mechanical properties of shaped metal deposition parts. Proc. Inst. Mech. Eng. Part B 2012, 226, 126–136. [Google Scholar] [CrossRef]
  31. Baufeld, B. Mechanical properties of Inconel 718 parts manufactured by shaped metal deposition (SMD). J. Mater. Eng. Perform. 2012, 21, 1416–1421. [Google Scholar] [CrossRef]
  32. Wang, F.; Williams, S.; Colegrove, P.; Antonysamy, A.A. Microstructure and mechanical properties of wire and arc additive manufactured Ti-6Al-4V. Metall. Mater. Trans. A 2013, 44, 968–977. [Google Scholar] [CrossRef]
  33. Ho, A.; Zhao, H.; Fellowes, J.W.; Martina, F.; Davis, A.E.; Prangnell, P.B. On the origin of microstructural banding in Ti-6Al4V wire-arc based high deposition rate additive manufacturing. Acta Mater. 2019, 166, 306–323. [Google Scholar] [CrossRef]
  34. Zhang, J.; Wang, X.; Paddea, S.; Zhang, X. Fatigue crack propagation behaviour in wire+arc additive manufactured Ti-6Al-4V: Effects of microstructure and residual stress. Mater. Des. 2016, 90, 551–561. [Google Scholar] [CrossRef]
  35. Liu, Y.; Dong, D.; Wang, L.; Chu, X.; Wang, P.; Jin, M. Strain rate dependent deformation and failure behavior of laser welded DP780 steel joint under dynamic tensile loading. Mater. Sci. Eng. A 2015, 627, 296–305. [Google Scholar] [CrossRef]
  36. Zhang, J.; Zhang, X.; Wang, X.; Ding, J.; Traore, Y.; Paddea, S.; Williams, S. Crack path selection at the interface of wrought and wire + arc additive manufactured Ti-6Al-4V. Mater. Des. 2016, 104, 365–375. [Google Scholar] [CrossRef] [Green Version]
  37. Jiang, D.; Williams, P.F. High-strain zones: A unified model. J. Struct. Geol. 1998, 20, 1105–1120. [Google Scholar] [CrossRef]
  38. Liu, Y.; Huang, H.; Xie, J. Anisotropic deformation behavior of continuous columnar-grained CuNi10Fe1Mn alloy. Acta Metall. Sin. 2015, 51, 40–48. [Google Scholar] [CrossRef]
  39. Bagherpour, E.; Qods, F.; Ebrahimi, R.; Miyamoto, H. Microstructure and Texture Inhomogeneity after Large Non-Monotonic Simple Shear Strains: Achievements of Tensile Properties. Metals 2018, 8, 583. [Google Scholar] [CrossRef] [Green Version]
  40. Lin, Z.; Goulas, C.; Ya, W.; Hermans, M.J.M. Microstructure and Mechanical Properties of Medium Carbon Steel Deposits Obtained via Wire and Arc Additive Manufacturing Using Metal-Cored Wire. Metals 2019, 9, 673. [Google Scholar] [CrossRef] [Green Version]
  41. Gurland, J.; Plateau, J. The mechanism of ductile rupture of metals containing inclusions. Trans. ASM 1963, 56, 442–454. [Google Scholar]
  42. Argon, A.S.; Im, J.; Safoglu, R. Cavity formation from inclusions in ductile fracture. Metal. Trans. A 1975, 6A, 825–837. [Google Scholar] [CrossRef]
Figure 1. A schematic diagram for the experimental procedure.
Metals 10 00216 g001
Figure 2. Schematic diagram for sampling location.
Metals 10 00216 g002
Figure 3. The size and surface treatment condition of the specimen.
Metals 10 00216 g003
Figure 4. The tensile process and devices.
Metals 10 00216 g004
Figure 5. Assessment of the surface quality of the component: (a) Overall condition on cross section; (b,c) surface condition analyzed by SEM; (d,e) inter-layer adjacent region condition analyzed by OM.
Metals 10 00216 g005
Figure 6. Three typical regions of microstructure in the process of WAAM.
Metals 10 00216 g006
Figure 7. Microstructure evolution for different parts of the as-deposited component: (a) Macrostructure of the cross section; (b) Region b; (c) Region c; (d) Region d; (e) Region e; (f) Region f.
Metals 10 00216 g007
Figure 8. Phase transformation of different parts of the component: (a) bottom part; (b) part close to the bottom part; (c) middle part; (d) top part.
Metals 10 00216 g008
Figure 9. Microhardness along the longitudinal direction for the cross section.
Metals 10 00216 g009
Figure 10. Transversal and longitudinal stress–strain curves and eight typical points selected. (a) Transversal curve; (b) longitudinal curve.
Metals 10 00216 g010
Figure 11. Strain evolution of transversal and longitudinal specimens during the tensile test. (a) Transversal specimen; (b) longitudinal specimen.
Metals 10 00216 g011
Figure 12. Cloud images of strain of transversal and longitudinal specimens. (a) Transversal specimen; (b) longitudinal specimen.
Metals 10 00216 g012
Figure 13. Comparison of the local strain distribution in the gauge section: (a) Transversal specimen; (b) longitudinal specimen.
Metals 10 00216 g013
Figure 14. Strain distribution condition in high strain zones before fracture. (a) Transversal specimen; (b) longitudinal specimen.
Metals 10 00216 g014
Figure 15. Comparison of the duration in high strain stages between the transversal and longitudinal specimen. T—Transversal specimen; L—longitudinal specimen.
Metals 10 00216 g015
Figure 16. Macroscopic fracture appearance of tensile specimens. (a) Longitudinal and transversal specimens after fracture; (b) macroscopic fracture of longitudinal specimen; (c) macroscopic fracture of transversal specimen.
Metals 10 00216 g016
Figure 17. Comparison between the inter-layer area and deposited area on the Taylor factor: (a) Inter-layer area; (b) deposited area.
Metals 10 00216 g017
Figure 18. Statistics between the inter-layer area and deposited area with the Taylor factor: (a) Inter-layer area; (b) deposited area.
Metals 10 00216 g018
Figure 19. Fracture morphology of the tensile specimens: (a,b) Macroscopic fracture morphology of the transversal and longitudinal specimens; (c,d) typical fracture features of the transversal and longitudinal specimens.
Metals 10 00216 g019
Figure 20. The distribution of particles and their EDX analysis: (a) distribution of second phase particles; (b) the EDX analysis.
Metals 10 00216 g020
Table 1. Chemical compositions of substrate and wire (wt.%).
AlloyCMnSiCrNiMoCuVFe
9070.121.000.800.640.670.42Balance
A-Fe-W-860.051.600.380.582.550.58≤0.10≤0.02Balance
Table 2. Process parameters for deposition.
Process ParametersDetails
Wire feed speed4.5 m/min
Travel speed0.25 m/min
Voltage152 V
Current14.7 A
Shielding GasAr (90%) + CO2 (10%)
Flow of gas15 L/min
Table 3. Transversal and longitudinal tensile properties.
Specimen TypeUltimate Tensile Strength (MPa)Yield Strength (Rp 0.2, MPa)Elongation (%)
Transversal specimens1007.6818.012.6
1020.3825.512.4
1025.5831.612.6
Longitudinal specimens968.2743.210.2
978.6749.310.1
982.8755.110.5

