The Effect of Mean Load for S355J0 Steel with Increased Strength


Abstract
:1. Introduction
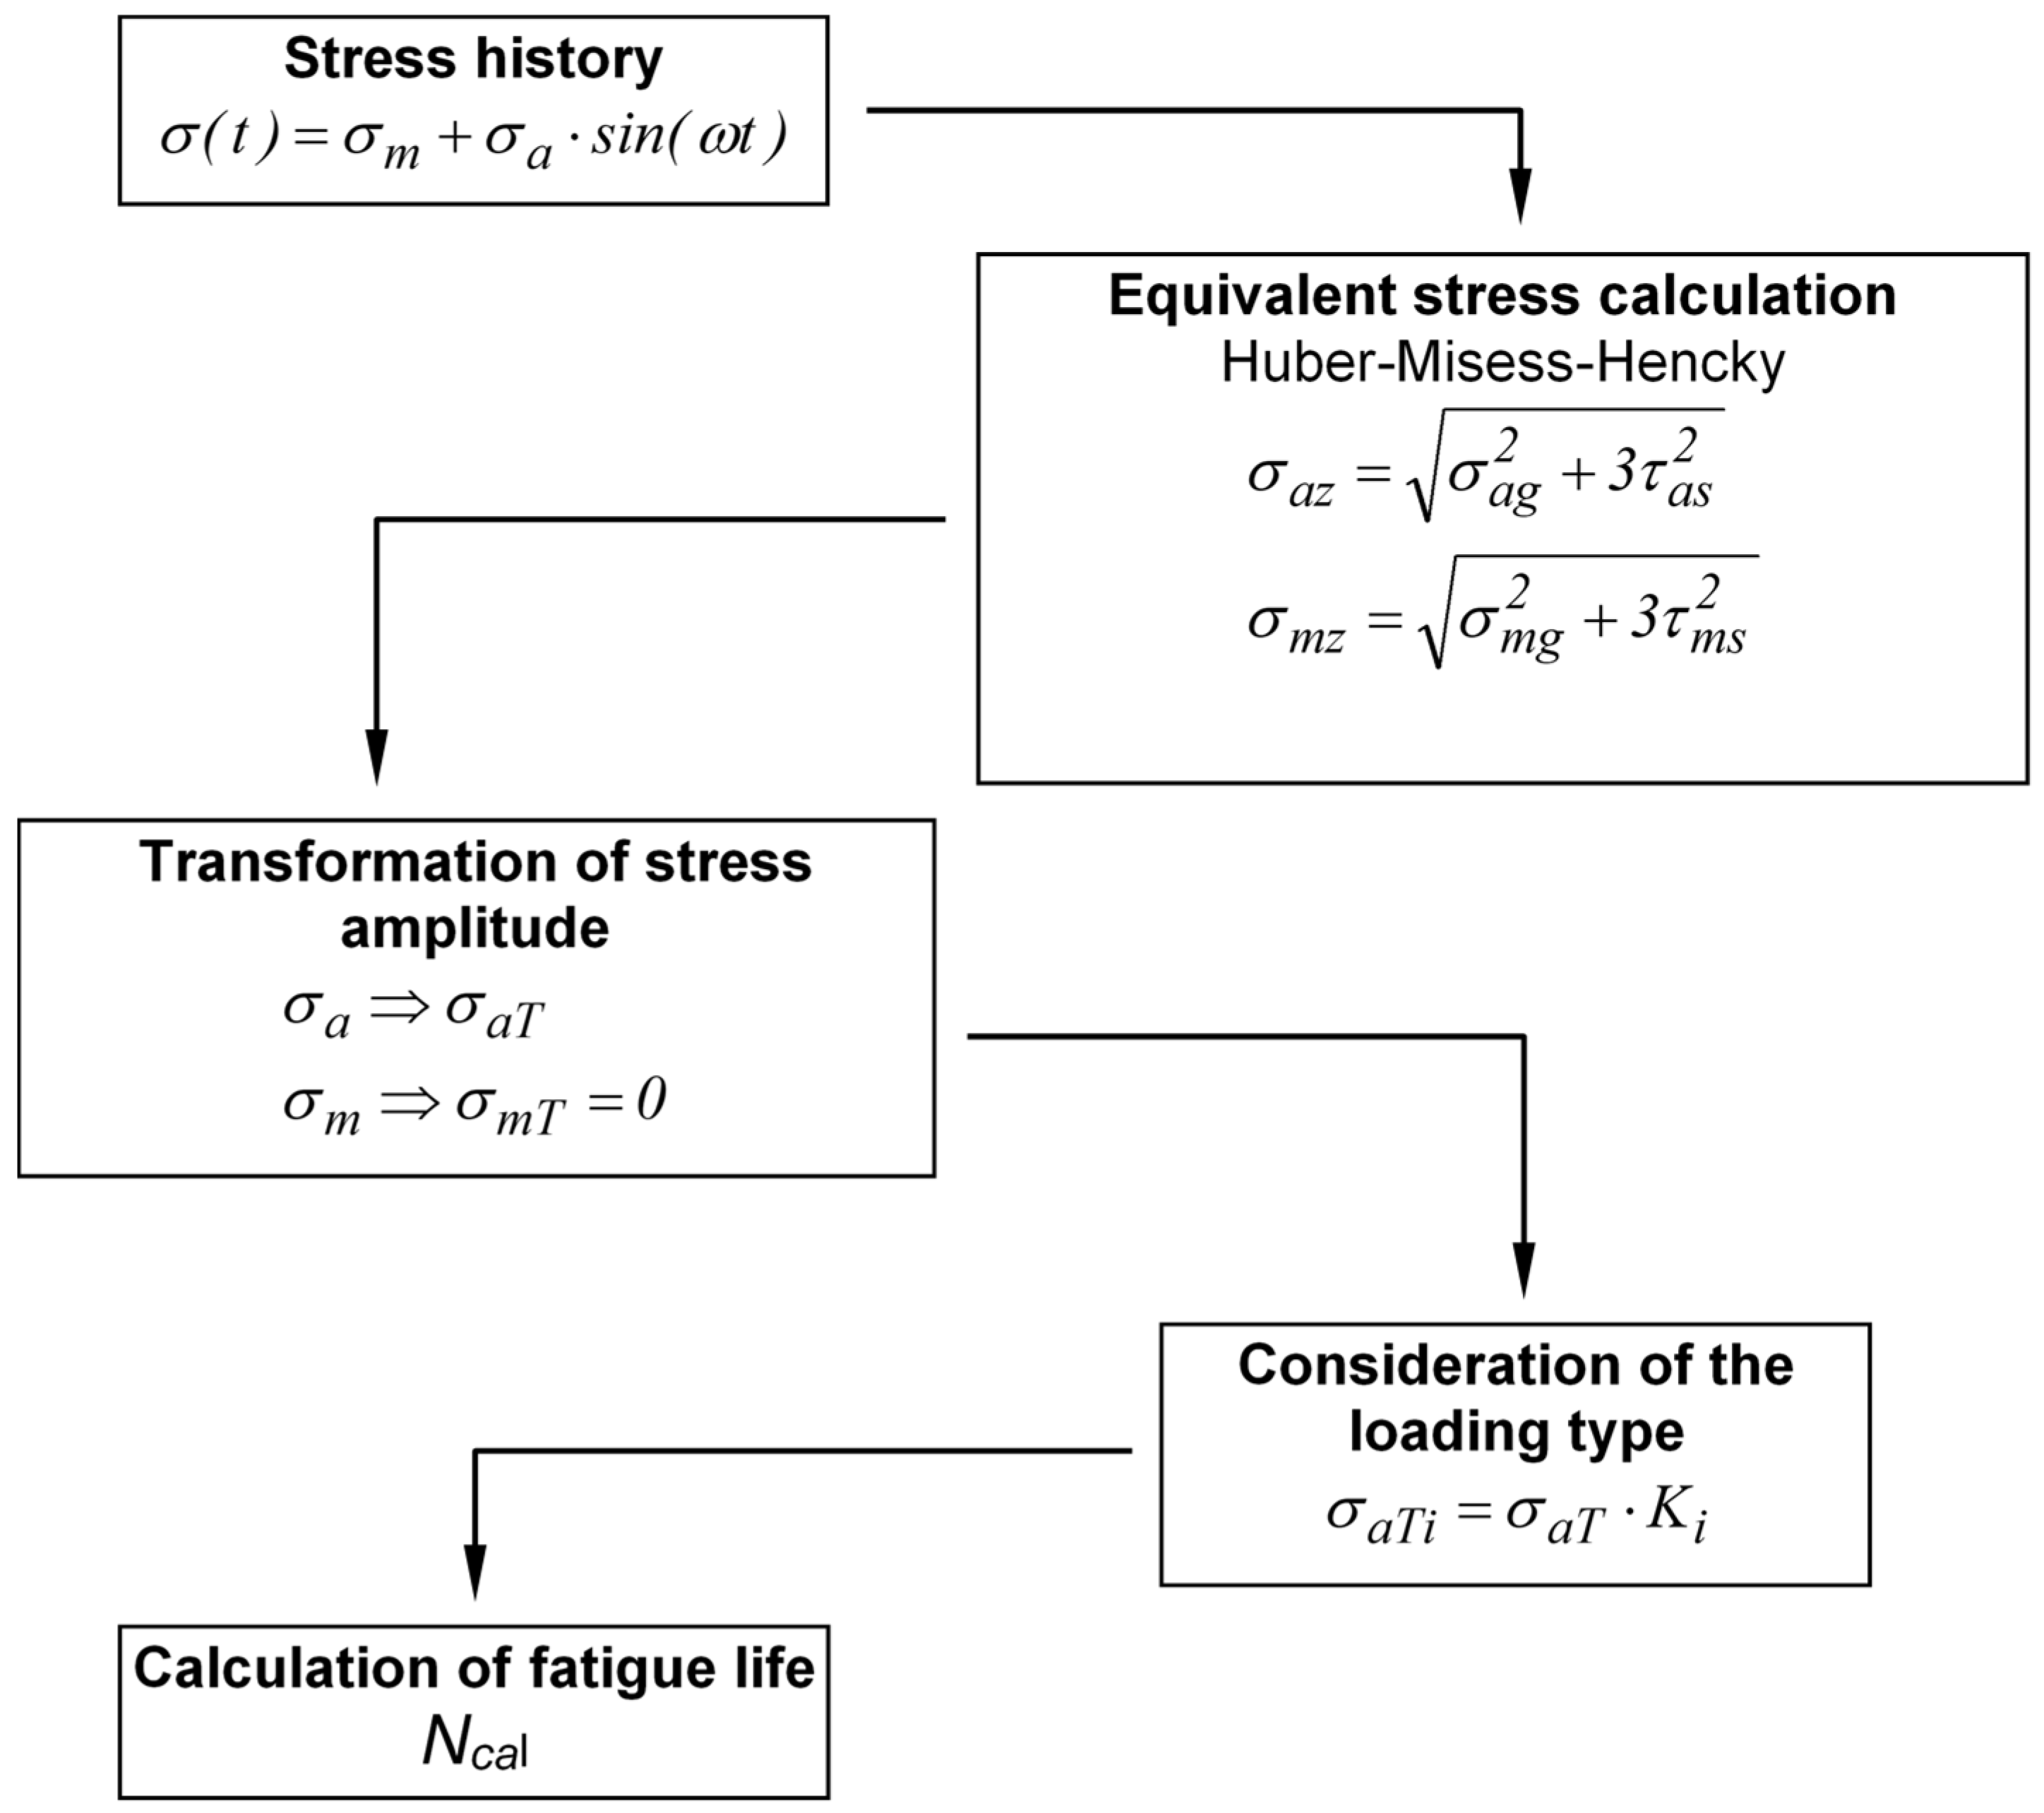
2. Analyzed Fatigue Models
3. Material and Methods
| α = 0 (rad), (0°) (bending), |
| α = 1.107 (rad), (63.5°) (combined bending with torsion), |
| α = π/2 (rad), (90°) (torsion). |
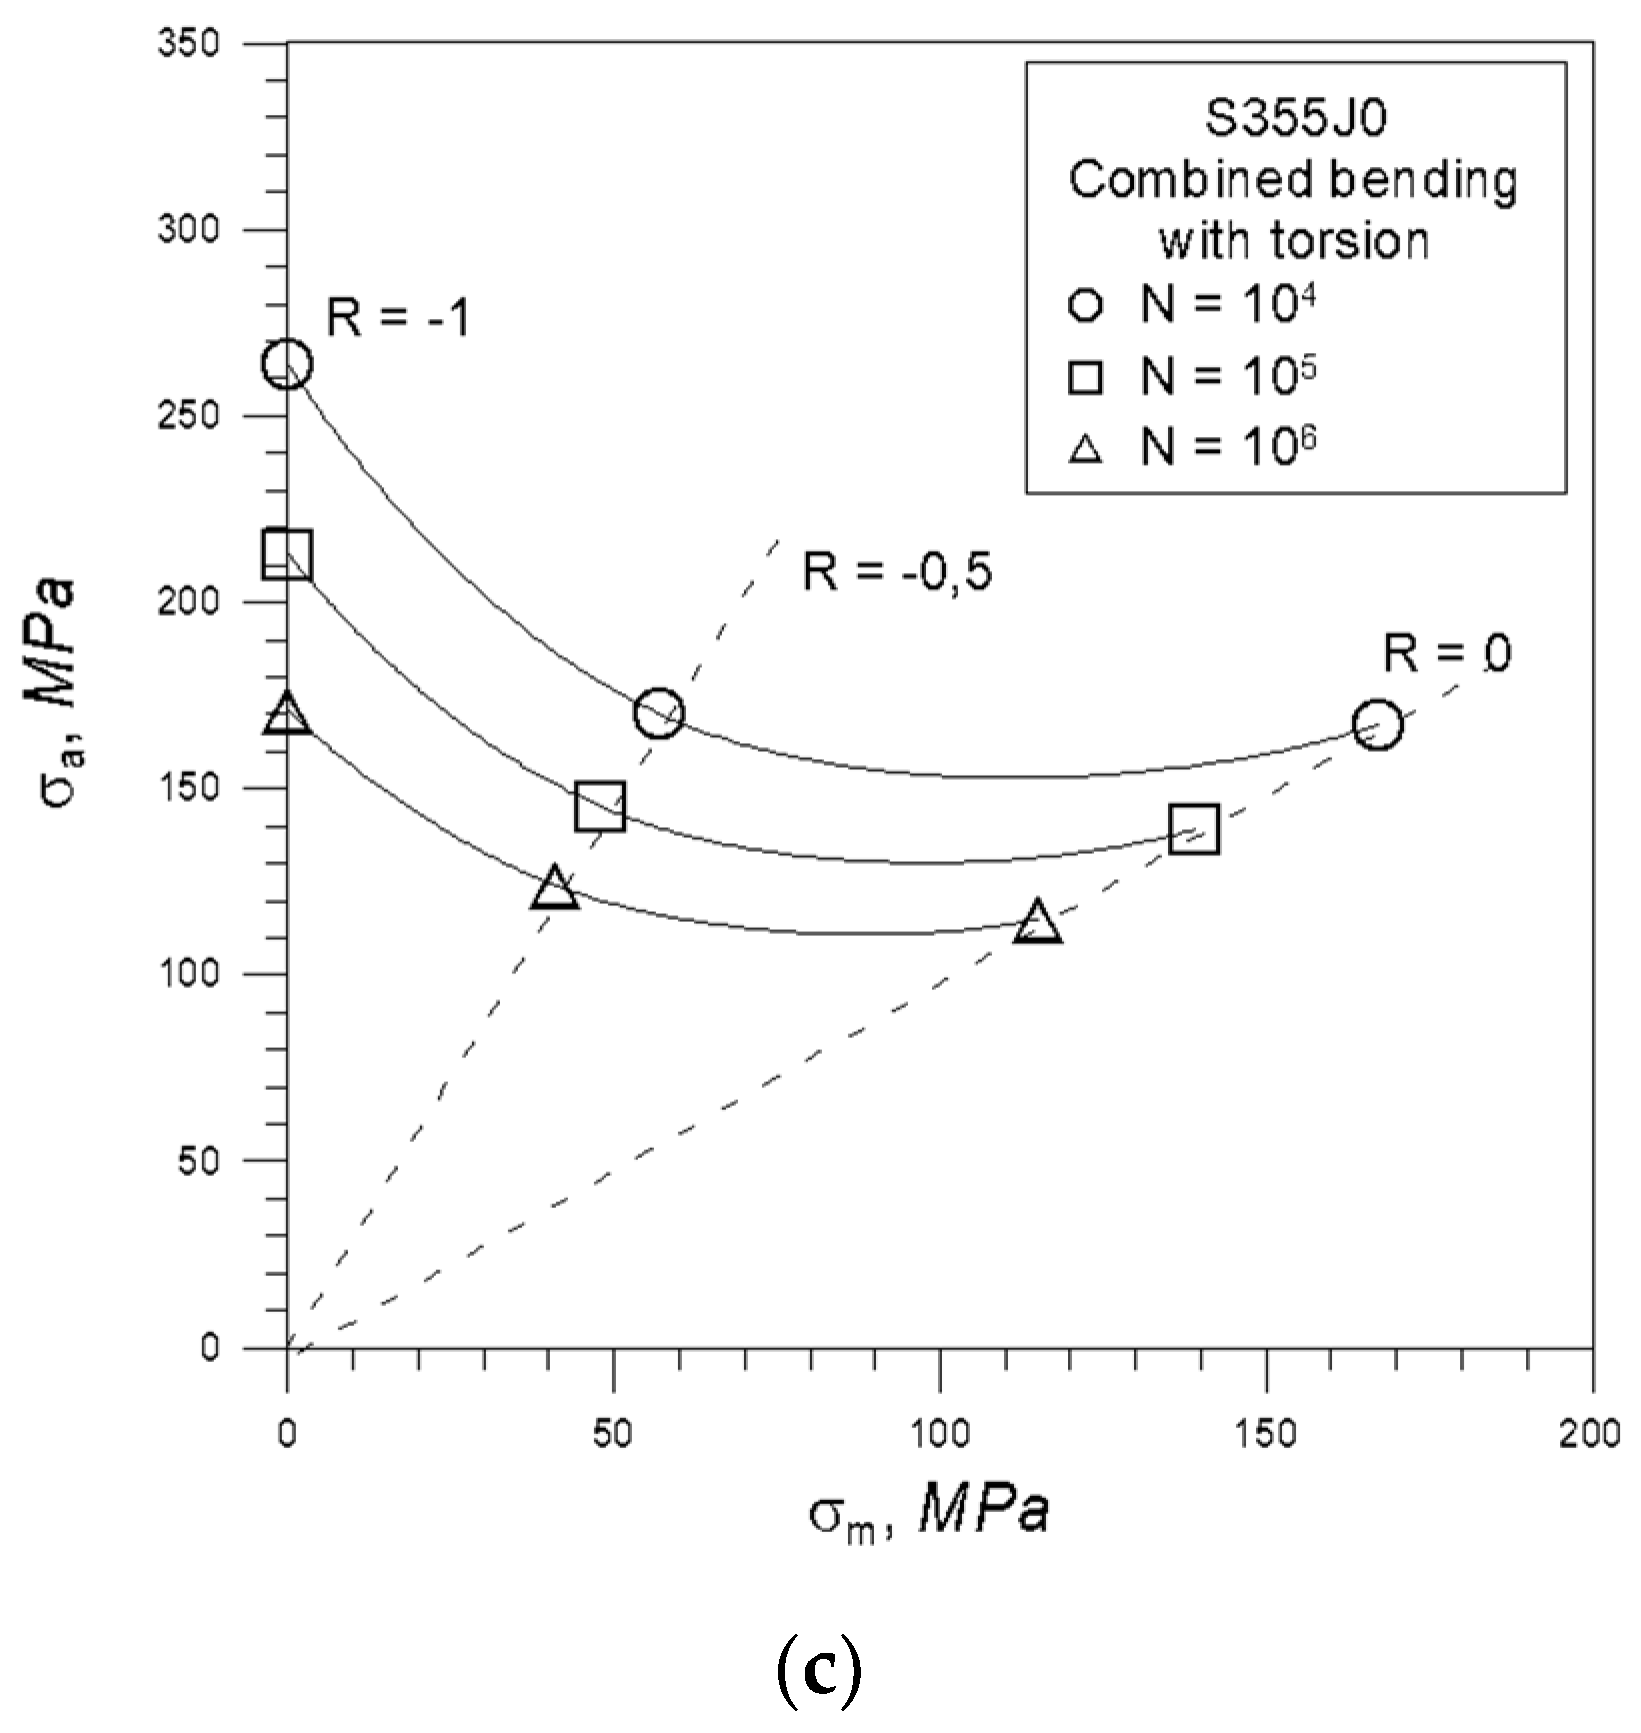
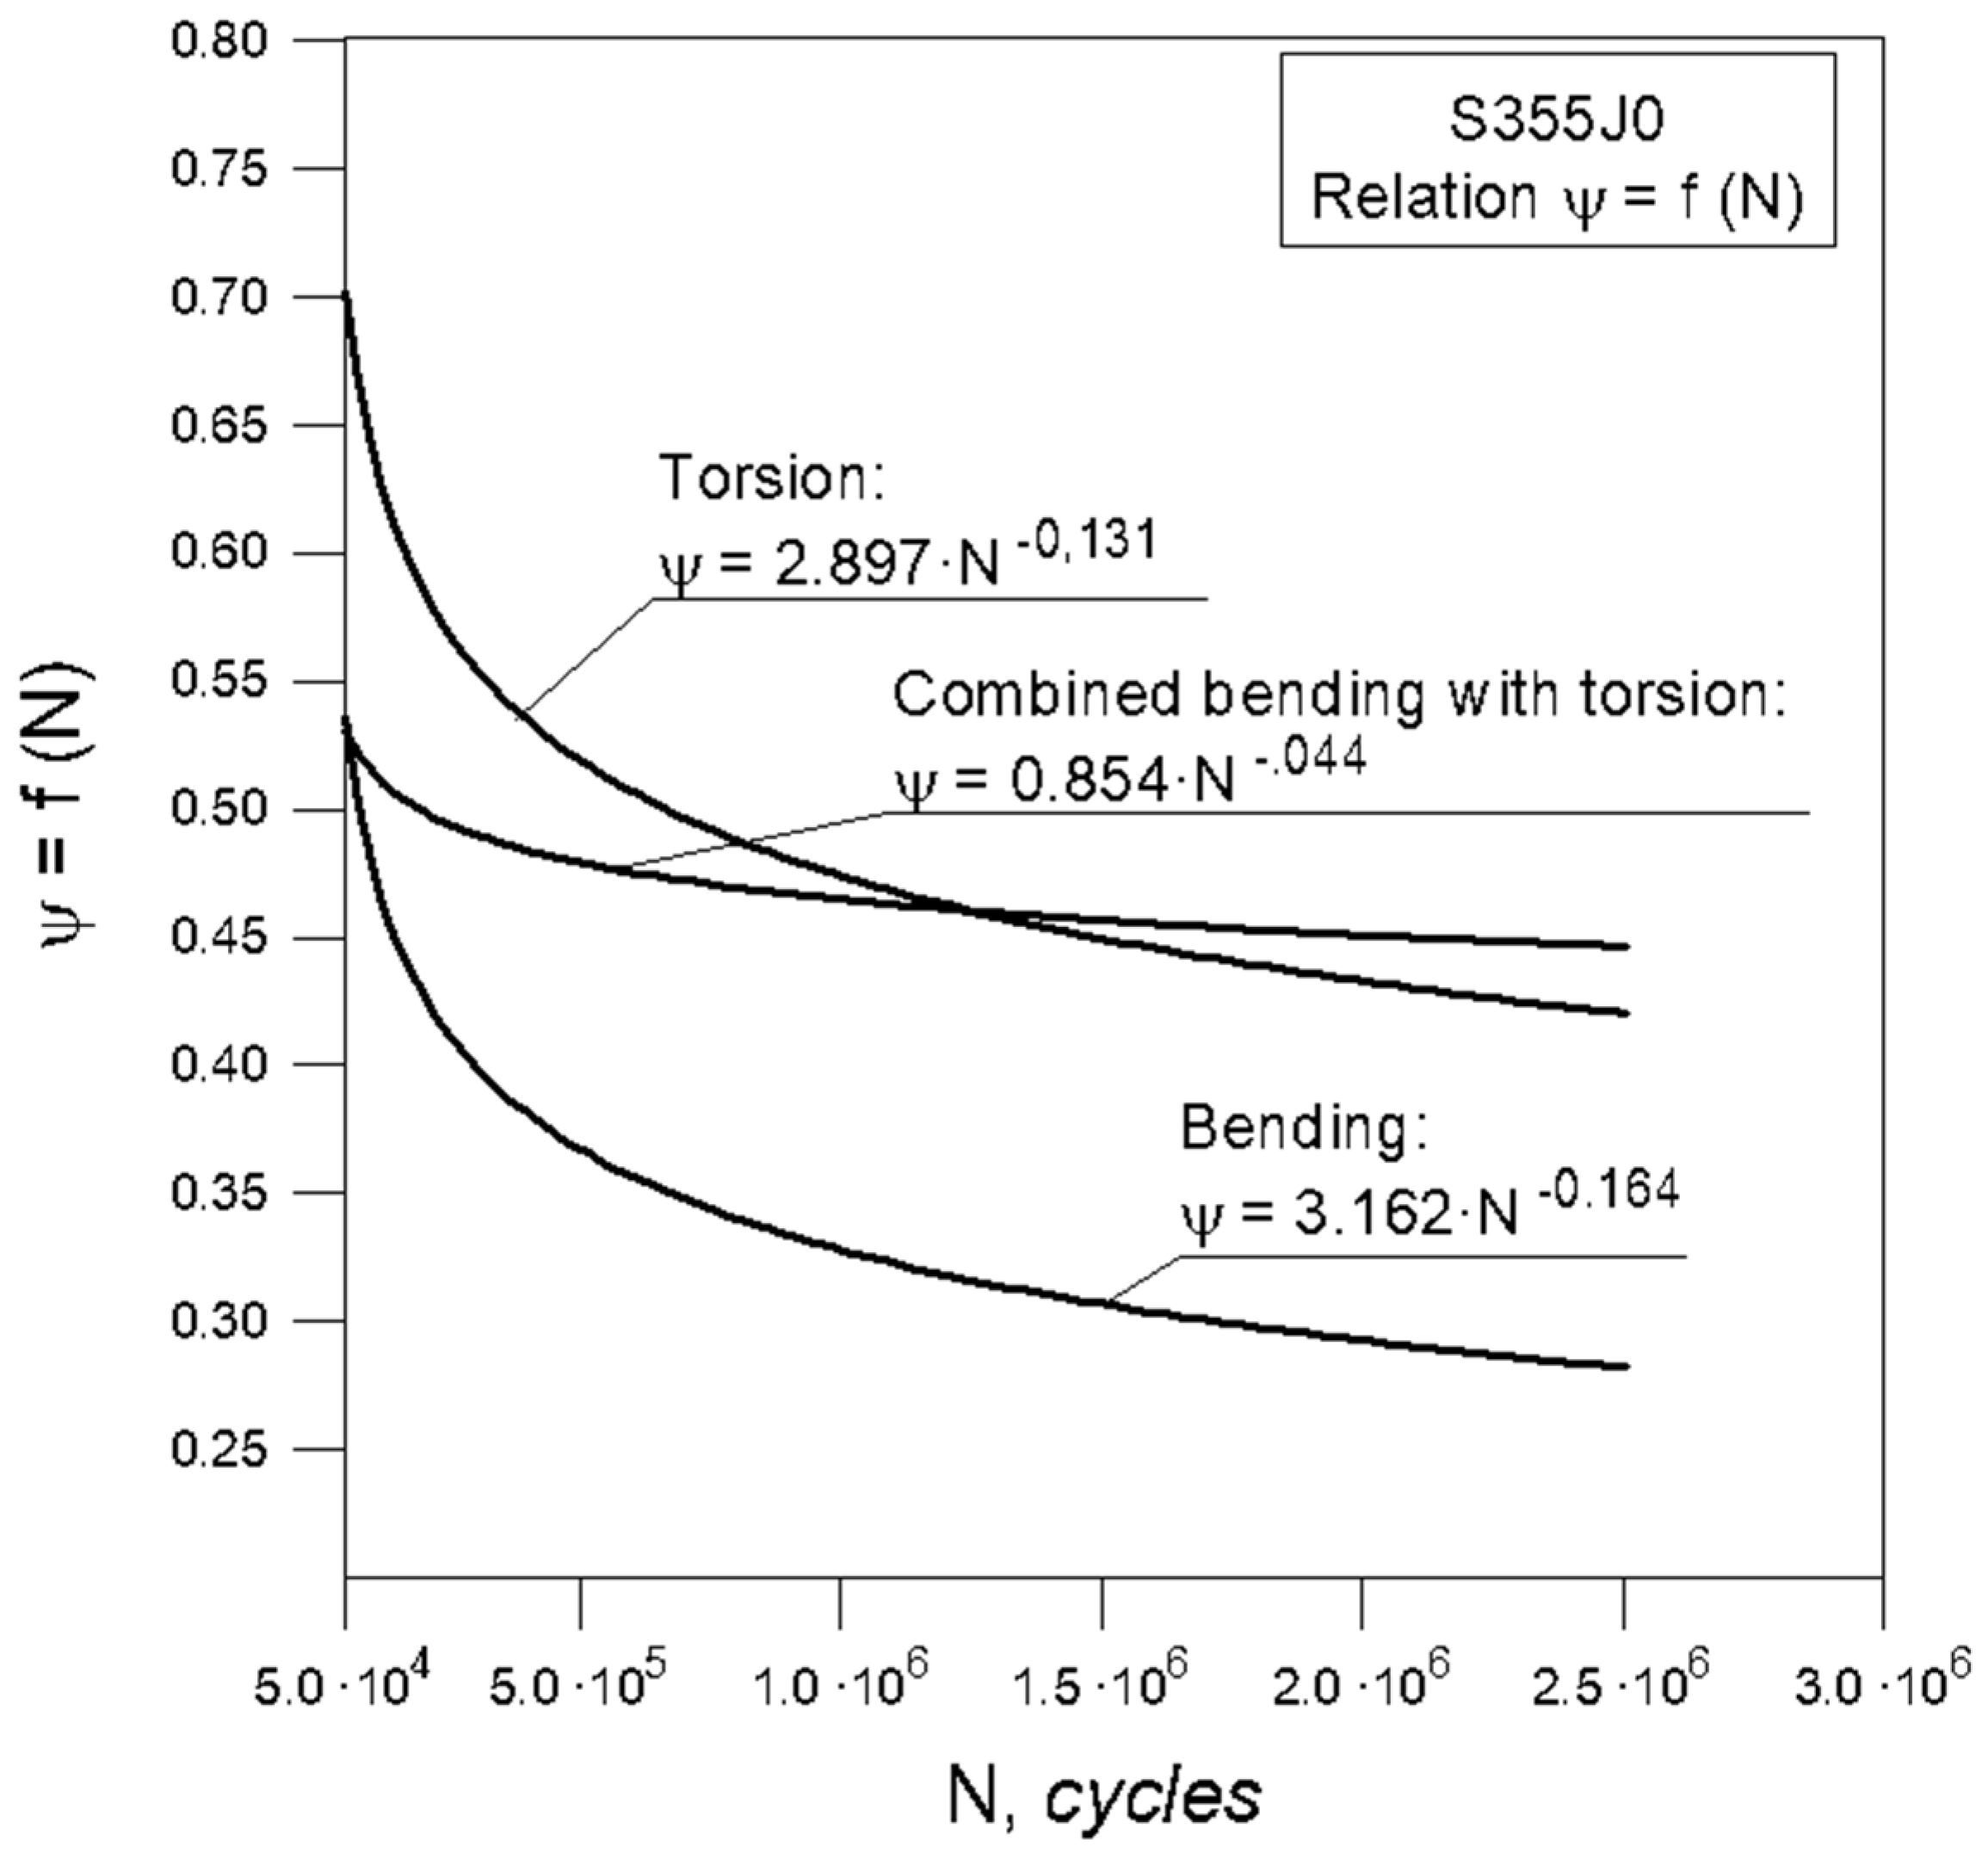
4. Results and Discussion
- for bending
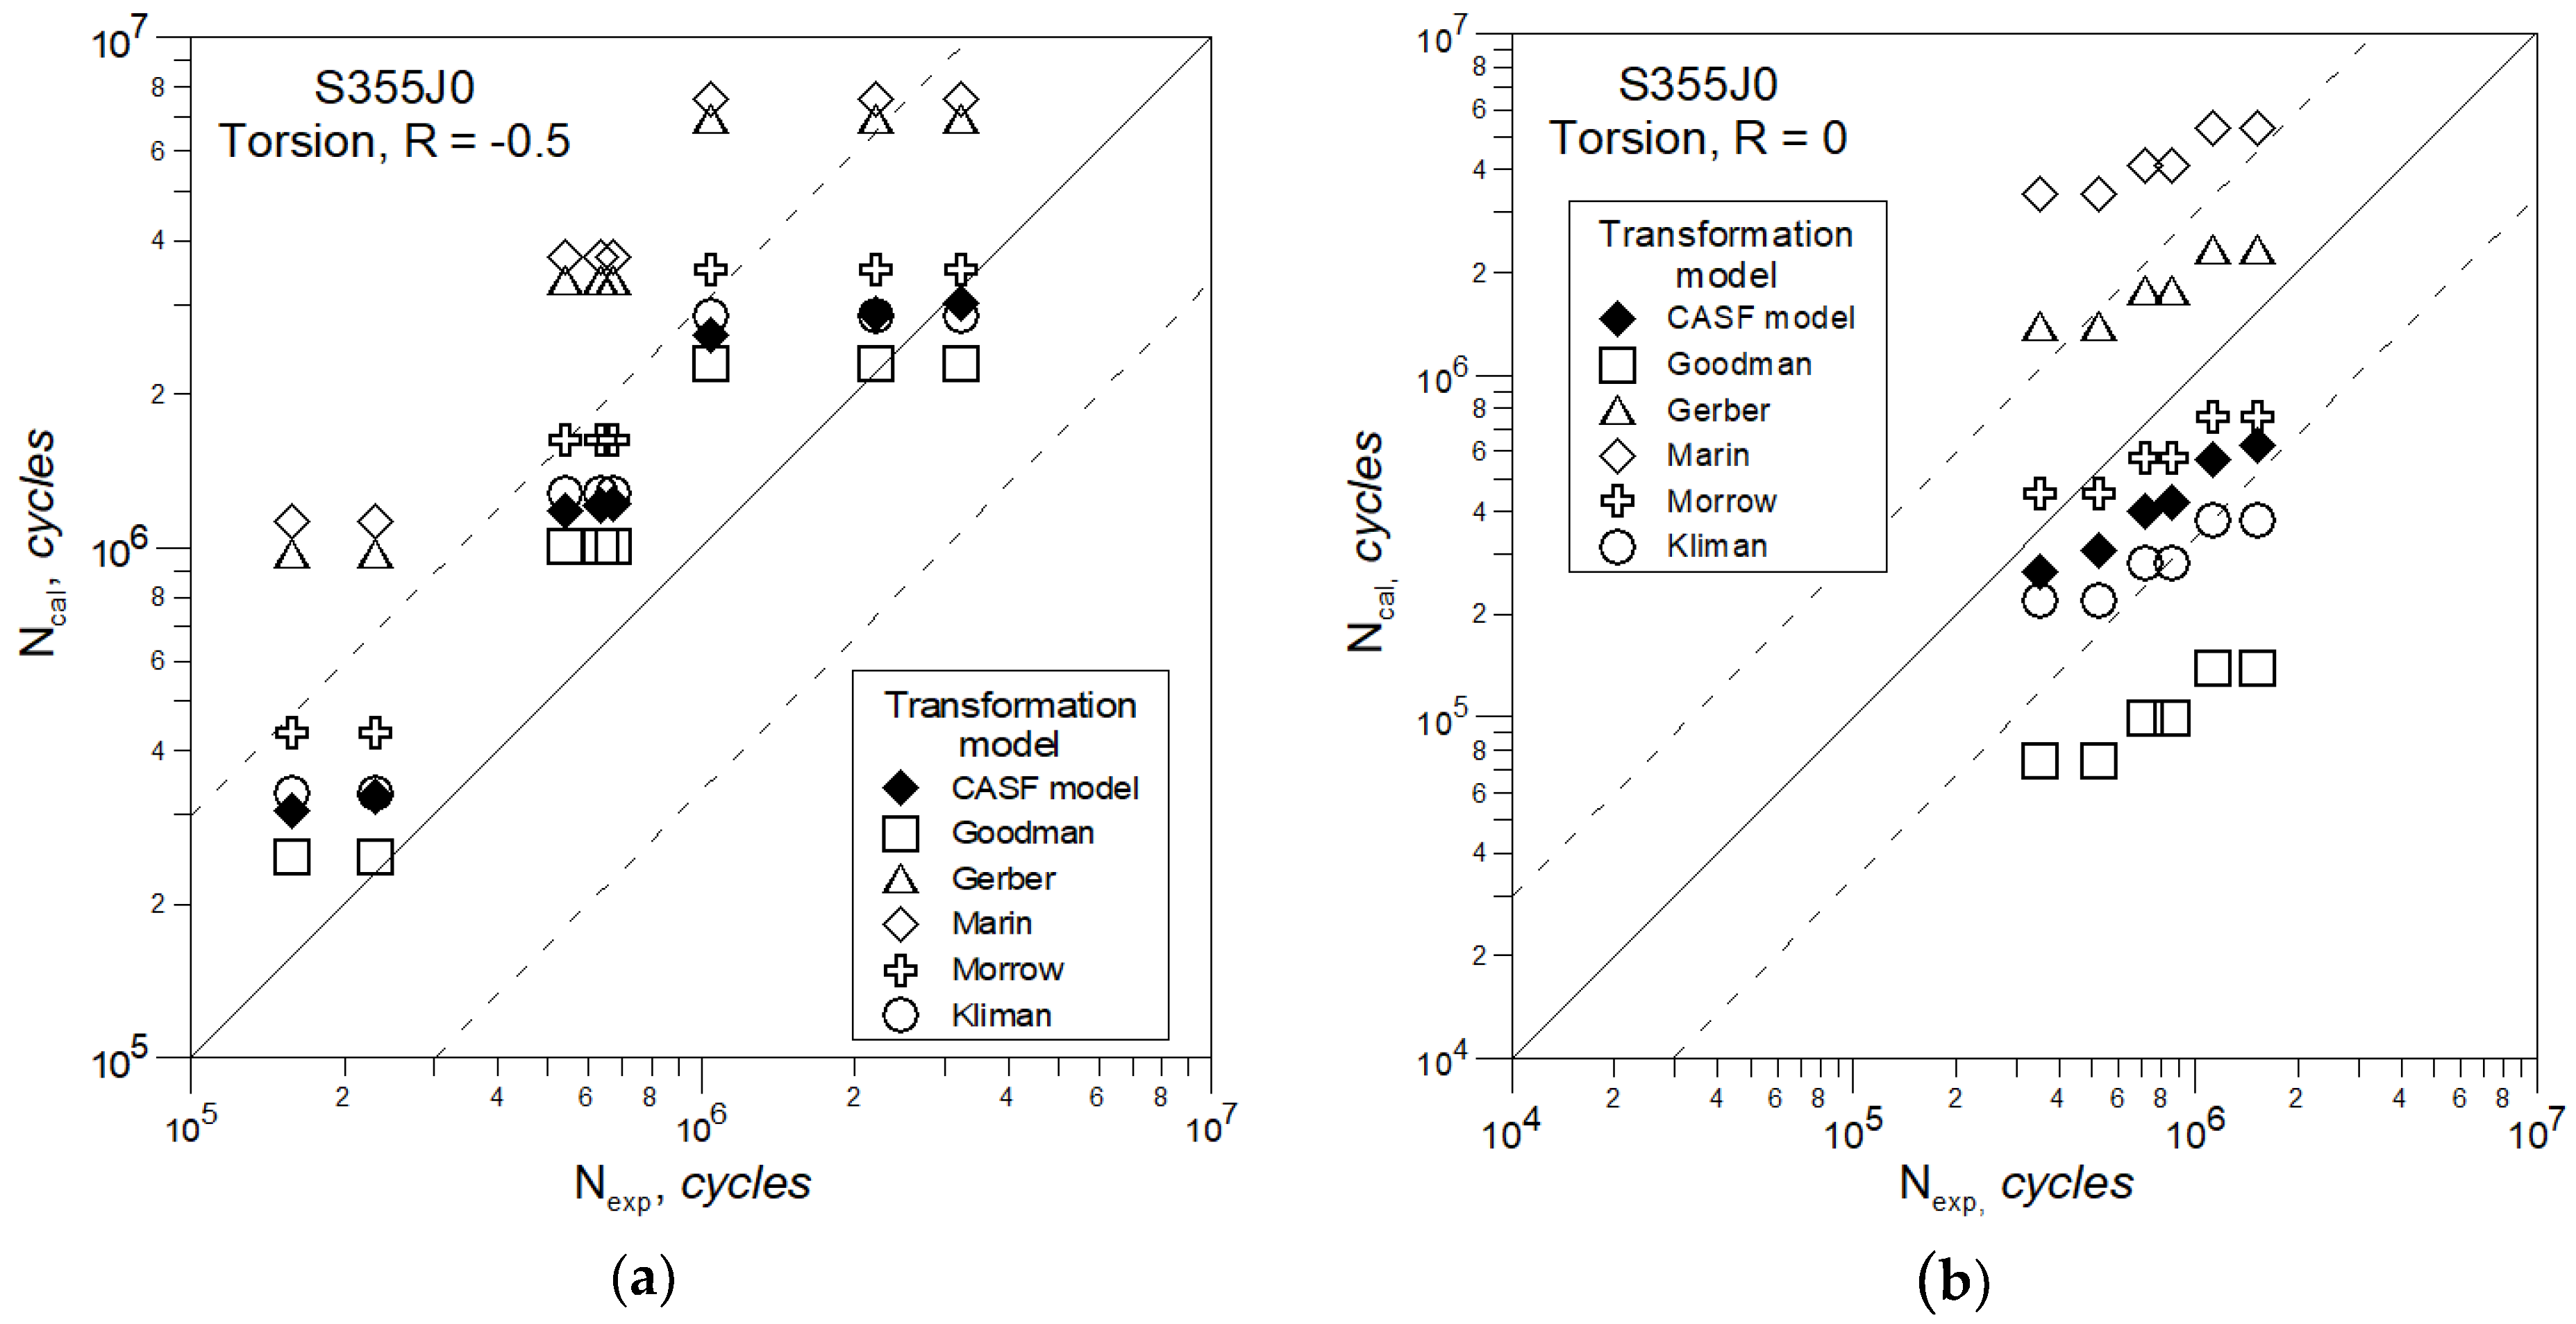
- for torsion
- for bending and torsion
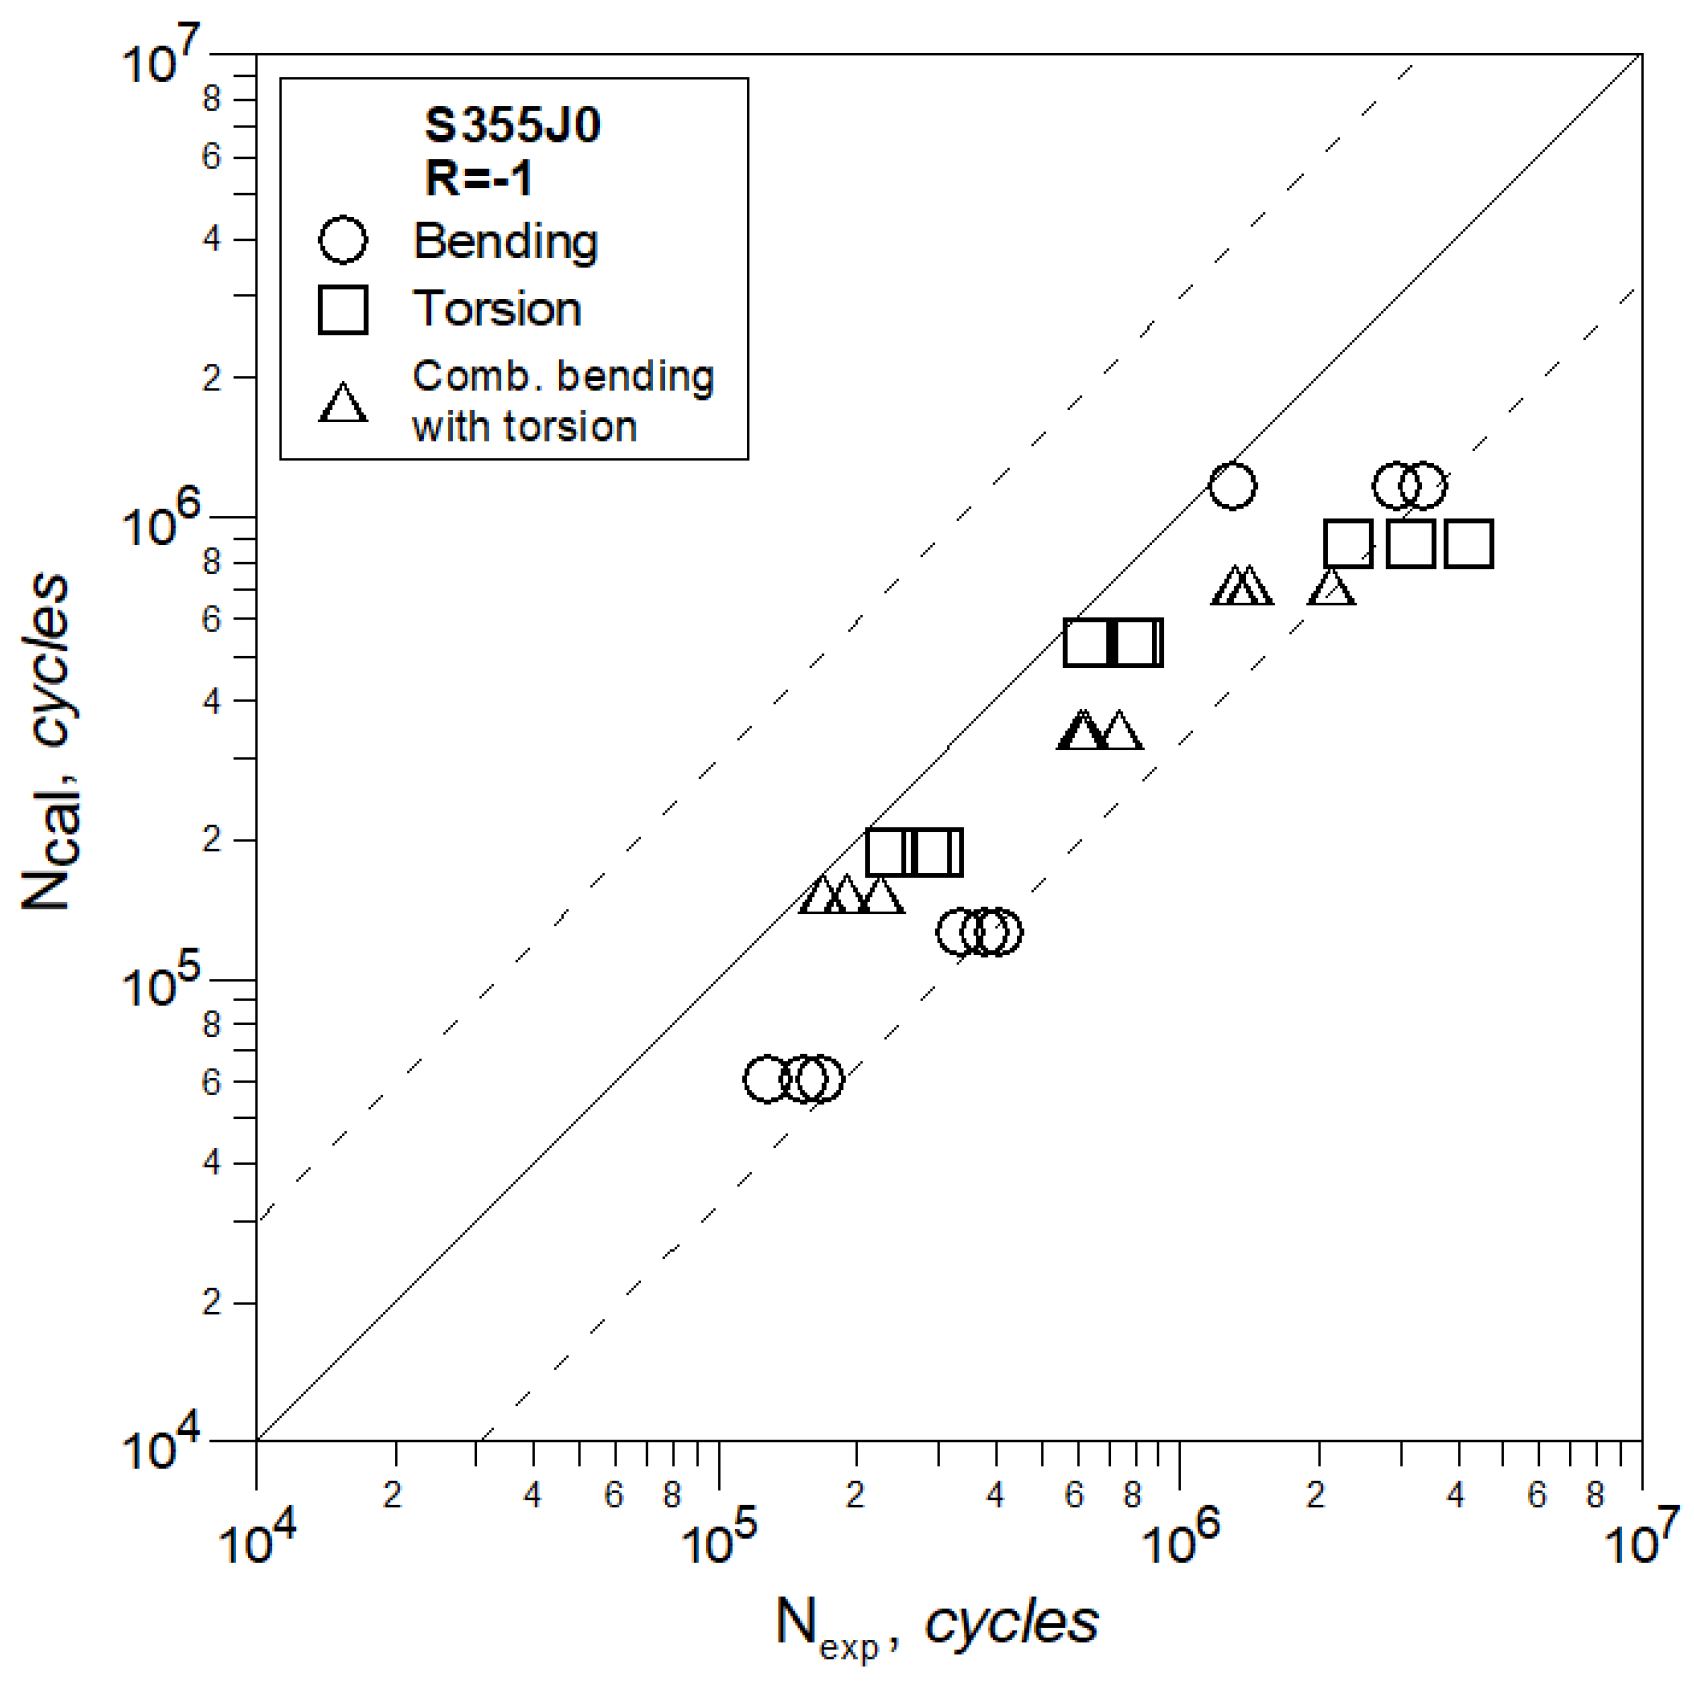
5. Conclusions
- In the case when R = −1 satisfactory results of the fatigue life assessment for bending, torsion and a combination of bending and torsion were obtained using the Ki coefficient, which is the ratio of the fatigue limit at cyclic tension-compression to the fatigue limit, calculated in accordance with the Huber–Misess–Hencky hypothesis for analyzed loads.
- For loads with a non-zero mean value, it was found that:
- satisfactory results of the fatigue life assessment for bending were obtained using the Gerber transformation dependence and the CASF model described by Equation (14),
- in the case of torsion, the best compatibility of computational fatigue life with experimental life is obtained by using Equation (15) and Morrow’s formula,
- for the combination of bending and torsion for both R = −0.5 and R = 0, the CASF model gives the best results of fatigue life assessment.
- The CASF model described by Equations (14) and (15), including the effect of the mean stress value on fatigue life using the material sensitivity factor for the asymmetry of cycle, gives good results for predicting fatigue life for all tested load cases.
Author Contributions
Funding
Conflicts of Interest
References
- Wehner, T.; Fatemi, A. Effect of mean stress on fatigue behavior of a hardened carbon steel. Int. J. Fatigue 1991, 13, 241–248. [Google Scholar] [CrossRef]
- Gołoś, K.M.; Eshtewi, S.H. Multiaxial Fatigue and Mean Stress Effect of St5 Medium Carbon Steel. In Proceedings of the 5th International Conference on Biaxial/Multiaxial Fatigue and Fracture, Cracow, Poland, 8–12 September 1997; Volume 1, pp. 25–34. [Google Scholar]
- Glinka, G.; Shen, G.; Plumtree, A. Mean stress effect in multiaxial fatigue. Fatigue Fract. Eng. Mater. Struct. 1995, 18, 755–764. [Google Scholar] [CrossRef]
- Skibicki, D.; Sempruch, J.; Pejkowski, L. Model of non-proportional fatigue load in the form of block load spectrum. Mater. Sci. Eng. Techonl. 2014, 45, 68–78. [Google Scholar] [CrossRef]
- Liu, Y.; Mahadevan, S. Multiaxial high-cycle fatigue criterion and life prediction for metals. Int. J. Fatigue 2005, 27, 790–800. [Google Scholar] [CrossRef]
- Kluger, K.; Pawliczek, R. Assessment of validity of selected criteria of fatigue life prediction. Materials 2019, 12, 2310. [Google Scholar] [CrossRef] [PubMed] [Green Version]
- Rozumek, D.; Marciniak, Z. Fatigue properties of notched specimens made of FeP04 steel. Mater. Sci. 2012, 47, 462–629. [Google Scholar] [CrossRef] [Green Version]
- Prażmowski, M.; Rozumek, D.; Paul, H. Static and fatigue tests of bimetal Zr-steel made by explosive welding. Eng. Fail. Anal. 2017, 75, 71–81. [Google Scholar] [CrossRef]
- Branco, R.; Costa, J.D.; Berto, F.; Antunes, F.V. Effect of loading orientation on fatigue behaviour in severely notched round bars under non-zero mean stress bending-torsion. Theor. Appl. Fract. Mech. 2017, 92, 185–197. [Google Scholar] [CrossRef]
- Carpinteri, A.; Kurek, M.; Łagoda, T.; Vantadori, S. Estimation of fatigue life under multiaxial loading by varying the critical plane orientation. Int. J. Fatigue 2017, 100, 512–520. [Google Scholar] [CrossRef]
- Rozumek, D.; Faszynka, S. Influence of the notch radius on fatigue crack propagation in beam specimens of 2017A-T4 alloy. Mater Sci. 2017, 53, 417–423. [Google Scholar] [CrossRef]
- Vicente, C.M.S.; Sardinha, M.; Reis, L. Failure analysis of a coupled shaft from a shredder. Eng. Fail. Anal. 2019, 103, 384–391. [Google Scholar] [CrossRef]
- Marin, J. Interpretation of fatigue strengths for combined stresses. In Proceedings of the International Conference on Fatigue of Metals, London, UK, 10–14 September 1956; pp. 184–194. [Google Scholar]
- Goodman, J. Mechanics Applied to Engineering, 9th ed.; Longmans, Green and Co.: New York, NY, USA, 1954. [Google Scholar]
- Gerber, W. Determination of permissible stresses in iron constructions. Zeitschrift des Bayerischen Architekten- und Ingenieur-Vereins 1974, 6, 101–110. (In German) [Google Scholar]
- Pawliczek, R.; Kluger, K. Influence of irregularity coefficient of loading on calculated fatigue life. J. Theor. Appl. Mech. Lett. 2013, 51, 4. [Google Scholar]
- Morrow, J. Fatigue Design Handbook, Advances in Engineering; Society of Automotive Engineers: Warrendale, PA, USA, 1968; Volume 4, p. 29. [Google Scholar]
- Kliman, V. Prediction of Random Load Fatigue Life Distribution. In Fatigue Design, ESIS 16; Mechanical Engineering Publications: London, UK, 1993; pp. 241–255. [Google Scholar]
- Kocańda, S.; Szala, J. Basics of Fatigue Calculations; PWN: Warsaw, Poland, 1997. (In Polish) [Google Scholar]
- Achtelik, H.; Kurek, M.; Kurek, A.; Kluger, K.; Pawliczek, R.; Łagoda, T. Non-standard fatigue stands for material testing under bending and torsion loadings. AIP Conf. Proc. 2018, 2029, 020001. [Google Scholar]
- Rozumek, D.; Marciniak, Z.; Lachowicz, C.T. The energy approach in the calculation of fatigue lives under non-proportional bending with torsion. Int. J. Fatigue 2010, 32, 1343–1350. [Google Scholar] [CrossRef]
- ASTM E 739-80: Standard practice for statistical analysis of linearized stress-life (S-N) and strain-life (-N) fatigue data. In Annual Book of ASTM Standards; ASTM International: Philadelphia, PA, USA, 1989; Volume 03.01, pp. 667–673.


| C | Mn | Si | P | S | Cr | Ni | Cu | Fe |
|---|---|---|---|---|---|---|---|---|
| 0.21 | 1.46 | 0.42 | 0.019 | 0.046 | 0.09 | 0.04 | 0.17 | Bal. |
| Re, MPa | Rm, MPa | A10, % | Z, % | E, GPa | v | σ′f, MPa | b | c | n′ | K′ MPa |
|---|---|---|---|---|---|---|---|---|---|---|
| 357 | 535 | 21 | 50 | 210 | 0.30 | 782 | −0.118 | −0.410 | 0.287 | 869 |
| R | Bending | Torsion | Bending and Torsion | ||||||
|---|---|---|---|---|---|---|---|---|---|
| B | A | r | B | A | r | B | A | r | |
| −1 | 23.93 | −7.19 | −0.97 | 32.81 | −11.82 | −0.94 | 29.73 | −10.62 | −0.98 |
| −0.5 | 23.71 | −7.40 | −0.96 | 27.60 | −10.01 | −0.93 | 36.73 | −14.67 | −0.99 |
| 0 | 31.40 | −10.73 | −0.96 | 59.76 | −25.25 | −0.95 | 31.62 | −12.42 | −0.94 |
| Moment and Stress | Bending | Bending and Torsion | Torsion |
|---|---|---|---|
| α = 0° | α = 63.5° | α = 90° | |
| Ma (N⋅m) | 13.59 | 16.82 | 17.53 |
| σ−1 (τ−1) (MPa) | σ−1 = 271 | σ−1 = τ−1 = 152 | τ−1 = 175 |
© 2020 by the authors. Licensee MDPI, Basel, Switzerland. This article is an open access article distributed under the terms and conditions of the Creative Commons Attribution (CC BY) license (http://creativecommons.org/licenses/by/4.0/).
Share and Cite
Pawliczek, R.; Rozumek, D. The Effect of Mean Load for S355J0 Steel with Increased Strength. Metals 2020, 10, 209. https://doi.org/10.3390/met10020209
Pawliczek R, Rozumek D. The Effect of Mean Load for S355J0 Steel with Increased Strength. Metals. 2020; 10(2):209. https://doi.org/10.3390/met10020209
Chicago/Turabian StylePawliczek, Roland, and Dariusz Rozumek. 2020. "The Effect of Mean Load for S355J0 Steel with Increased Strength" Metals 10, no. 2: 209. https://doi.org/10.3390/met10020209