Article

A Combined Pyro- and Hydrometallurgical Approach to Recycle Pyrolyzed Lithium-Ion Battery Black Mass Part 2: Lithium Recovery from Li Enriched Slag—Thermodynamic Study, Kinetic Study, and Dry Digestion

1
Institute of Recycling Technologies, Faculty of Materials, Metallurgy and Recycling, Technical University of Košice, Letna 9, 04200 Košice, Slovakia
2
IME Process Metallurgy and Metal Recycling, Institute of RWTH Aachen University, Intzestraße 3, 52056 Aachen, Germany
*
Author to whom correspondence should be addressed.
Metals 2020, 10(11), 1558; https://doi.org/10.3390/met10111558
Submission received: 28 October 2020 / Revised: 16 November 2020 / Accepted: 19 November 2020 / Published: 23 November 2020

Abstract

:
Due to the increasing demand for battery raw materials, such as cobalt, nickel, manganese, and lithium, the extraction of these metals, not only from primary, but also from secondary sources, is becoming increasingly important. Spent lithium-ion batteries (LIBs) represent a potential source of raw materials. One possible approach for an optimized recovery of valuable metals from spent LIBs is a combined pyro- and hydrometallurgical process. The generation of mixed cobalt, nickel, and copper alloy and lithium slag as intermediate products in an electric arc furnace is investigated in part 1. Hydrometallurgical recovery of lithium from the Li slag is investigated in part 2 of this article. Kinetic study has shown that the leaching of slag in H2SO4 takes place according to the 3-dimensional diffusion model and the activation energy is 22–24 kJ/mol. Leaching of the silicon from slag is causing formation of gels, which complicates filtration and further recovery of lithium from solutions. The thermodynamic study presented in the work describes the reasons for the formation of gels and the possibilities of their prevention by SiO2 precipitation. Based on these findings, the Li slag was treated by the dry digestion (DD) method followed by dissolution in water. The silicon leaching efficiency was significantly reduced from 50% in the direct leaching experiment to 5% in the DD experiment followed by dissolution, while the high leaching efficiency of lithium was maintained. The study takes into account the preparation of solutions for the future trouble-free acquisition of marketable products from solutions.

Graphical Abstract

1. Introduction

Lithium-ion batteries (LIBs) are currently considered as one of the most important energy storage systems, which is reflected in a wide range of applications, especially for portable devices [1,2,3,4,5,6,7]. Due to the extensive electrification expected in the field of electromobility, batteries will have another key role in the future ensuring the transition towards a climate-neutral economy [8]. In addition to the implementation of electromobility and their widespread use for portable applications, lithium-ion batteries are also indispensable as intermediate storage for the stabilization of decentralized power systems [2,3,4,5,9,10]. Compared to other battery types, LIBs have advantageous technical properties that substantiate their dominance as energy storage systems, including, e.g., high energy density and low self-discharge [10,11]. As a result of increasing applications of lithium-ion batteries, a significantly higher demand for battery containing critical or strategic raw materials, such as cobalt, lithium, and nickel, is to be expected. Those crucial metals are only available in limited quantities and are currently obtained mainly from primary sources [2]. Recycling is an essential aspect of closing the entire substance cycle of LIBs and securing the supply of raw materials for new battery production. To meet the increasing demand for strategic metals, the development of a raw material recycling economy, in addition to the expansion of mining capacities, is therefore unavoidable [5].
In the European Union, Directive 2006/66/EC applies to the recycling of LIBs. This directive requires the recycling of fifty percent of the average weight of used batteries, including spent LIBs [12]. The extensive recycling of battery components that exceed the recycling quota of fifty percent is of central importance to ensure the supply of materials for the new battery production and consequently the transition to a climate-neutral economy. This also requires consideration of battery components such as lithium.
In 2020, lithium was newly included among the European Union (EU)’s critical raw materials, which made its recovery, especially in the battery systems, where lithium is an indispensable cathode component, essential [13]. In the field of battery recycling, research projects have been carried out for several years dealing with both single and combined mechanical, pyrometallurgical, and hydrometallurgical processes as well as pyrolysis to recover battery components [5,10,11,14,15,16,17,18,19,20,21,22,23,24]. However, the focus is mainly set on more valuable metals, which is the reason why lithium as a component has not been sufficiently considered [25]. Overall, the recovery of lithium from active electrode mass has not been solved satisfactorily since the recovery is made more difficult by the ignoble character of the spent LIBs. Only about 20 tons of lithium were reported in 2016 as secondary raw material on a global scale [13,26]. In the EU, 4 tons were produced from secondary raw materials, representing an end-of-life recycling-input rate of less than 1% [13,27]. In pyrometallurgical processes, lithium is converted into slag, which is either used as construction material, undergoes further hydrometallurgical treatment, or can be sold, e.g., for the cement industry [28]. Hydrometallurgical processes allow lithium to be recovered from black mass, for example as lithium carbonate [29].
Within the scope of this work, a combined pyro- and hydrometallurgical process was designed, which enables a complete recovery of the valuable elements present in the active mass of spent LIBs. In a first process step presented in part 1 of this article, the melting of pellets with SiO2 and CuO in the electric arc furnace was realized, where metal alloy and Li slag were produced. Production of the slag enabled the recovery of lithium, while more valuable components, such as cobalt, copper, and nickel, were enriched in a metal alloy [30].
In part 2 of this article, the optimal leaching conditions of Li slag in sulfuric acid were studied. The design of the leaching step was adapted for the subsequent trouble-free recovery of lithium from the obtained solution. The main complication of leaching of materials with a higher silicon content is the formation of silicon gels [31,32,33,34,35]. In addition to the thermodynamic and kinetic study of the slag leaching process, the work also describes the conditions of gel formation and proposes the leaching method, in which the formation of gels does not occur.

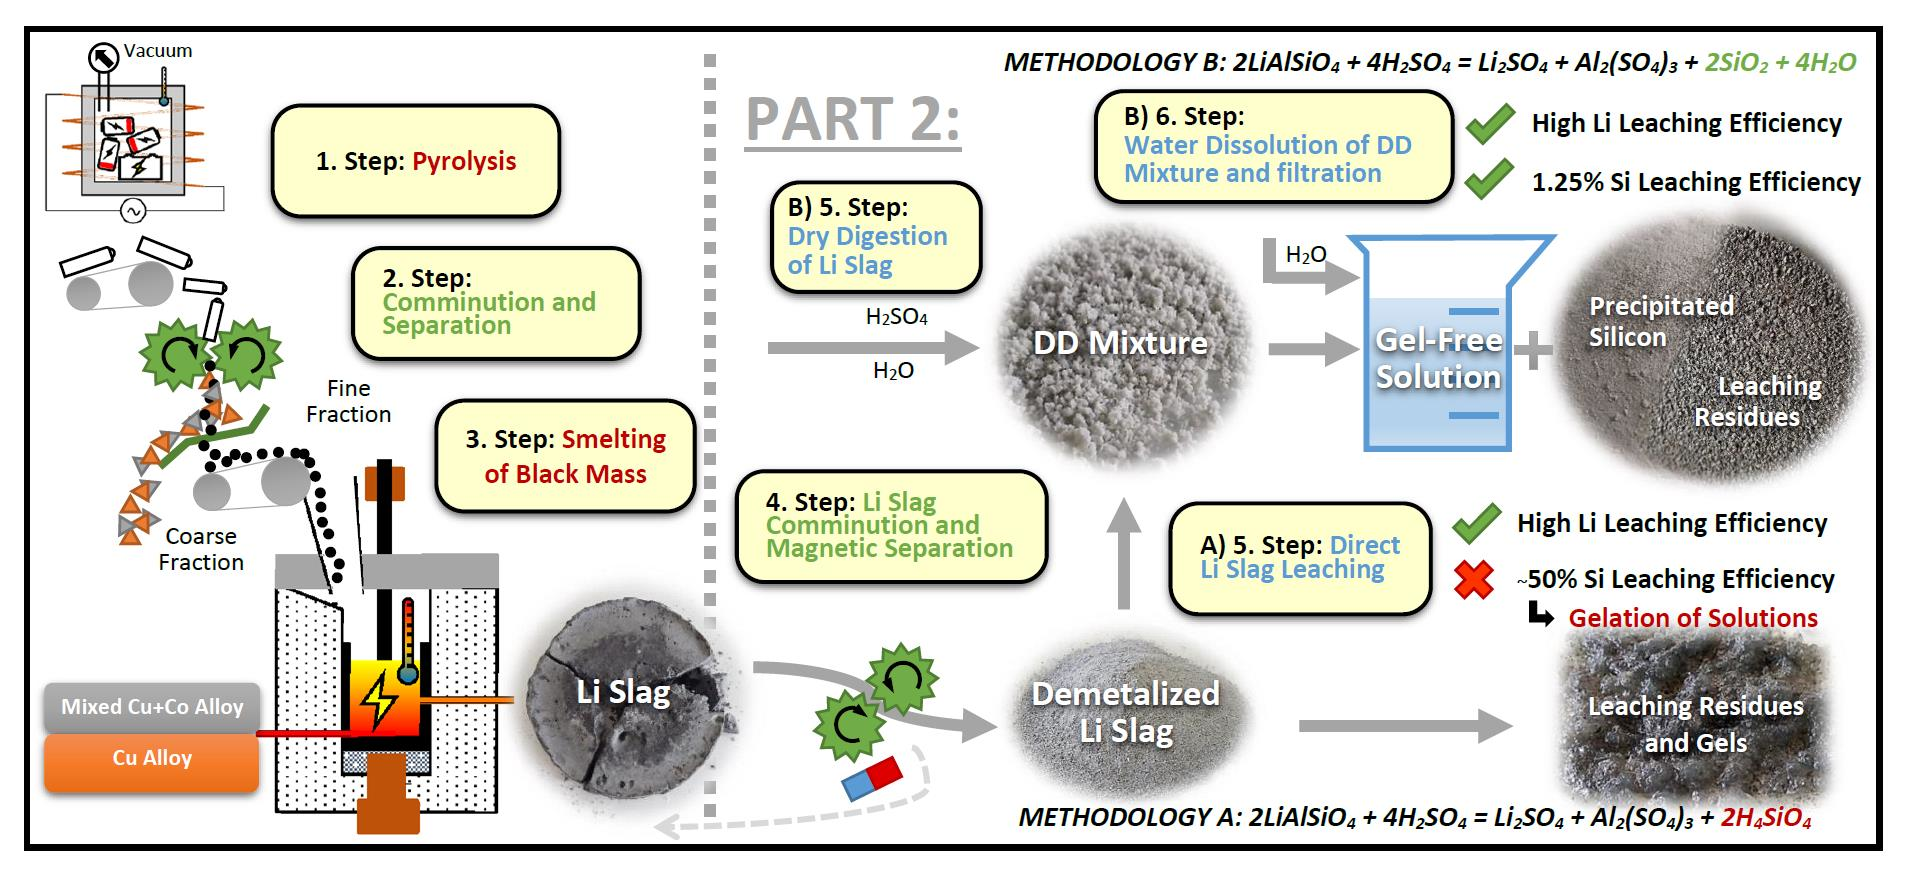
2. Materials and Methods

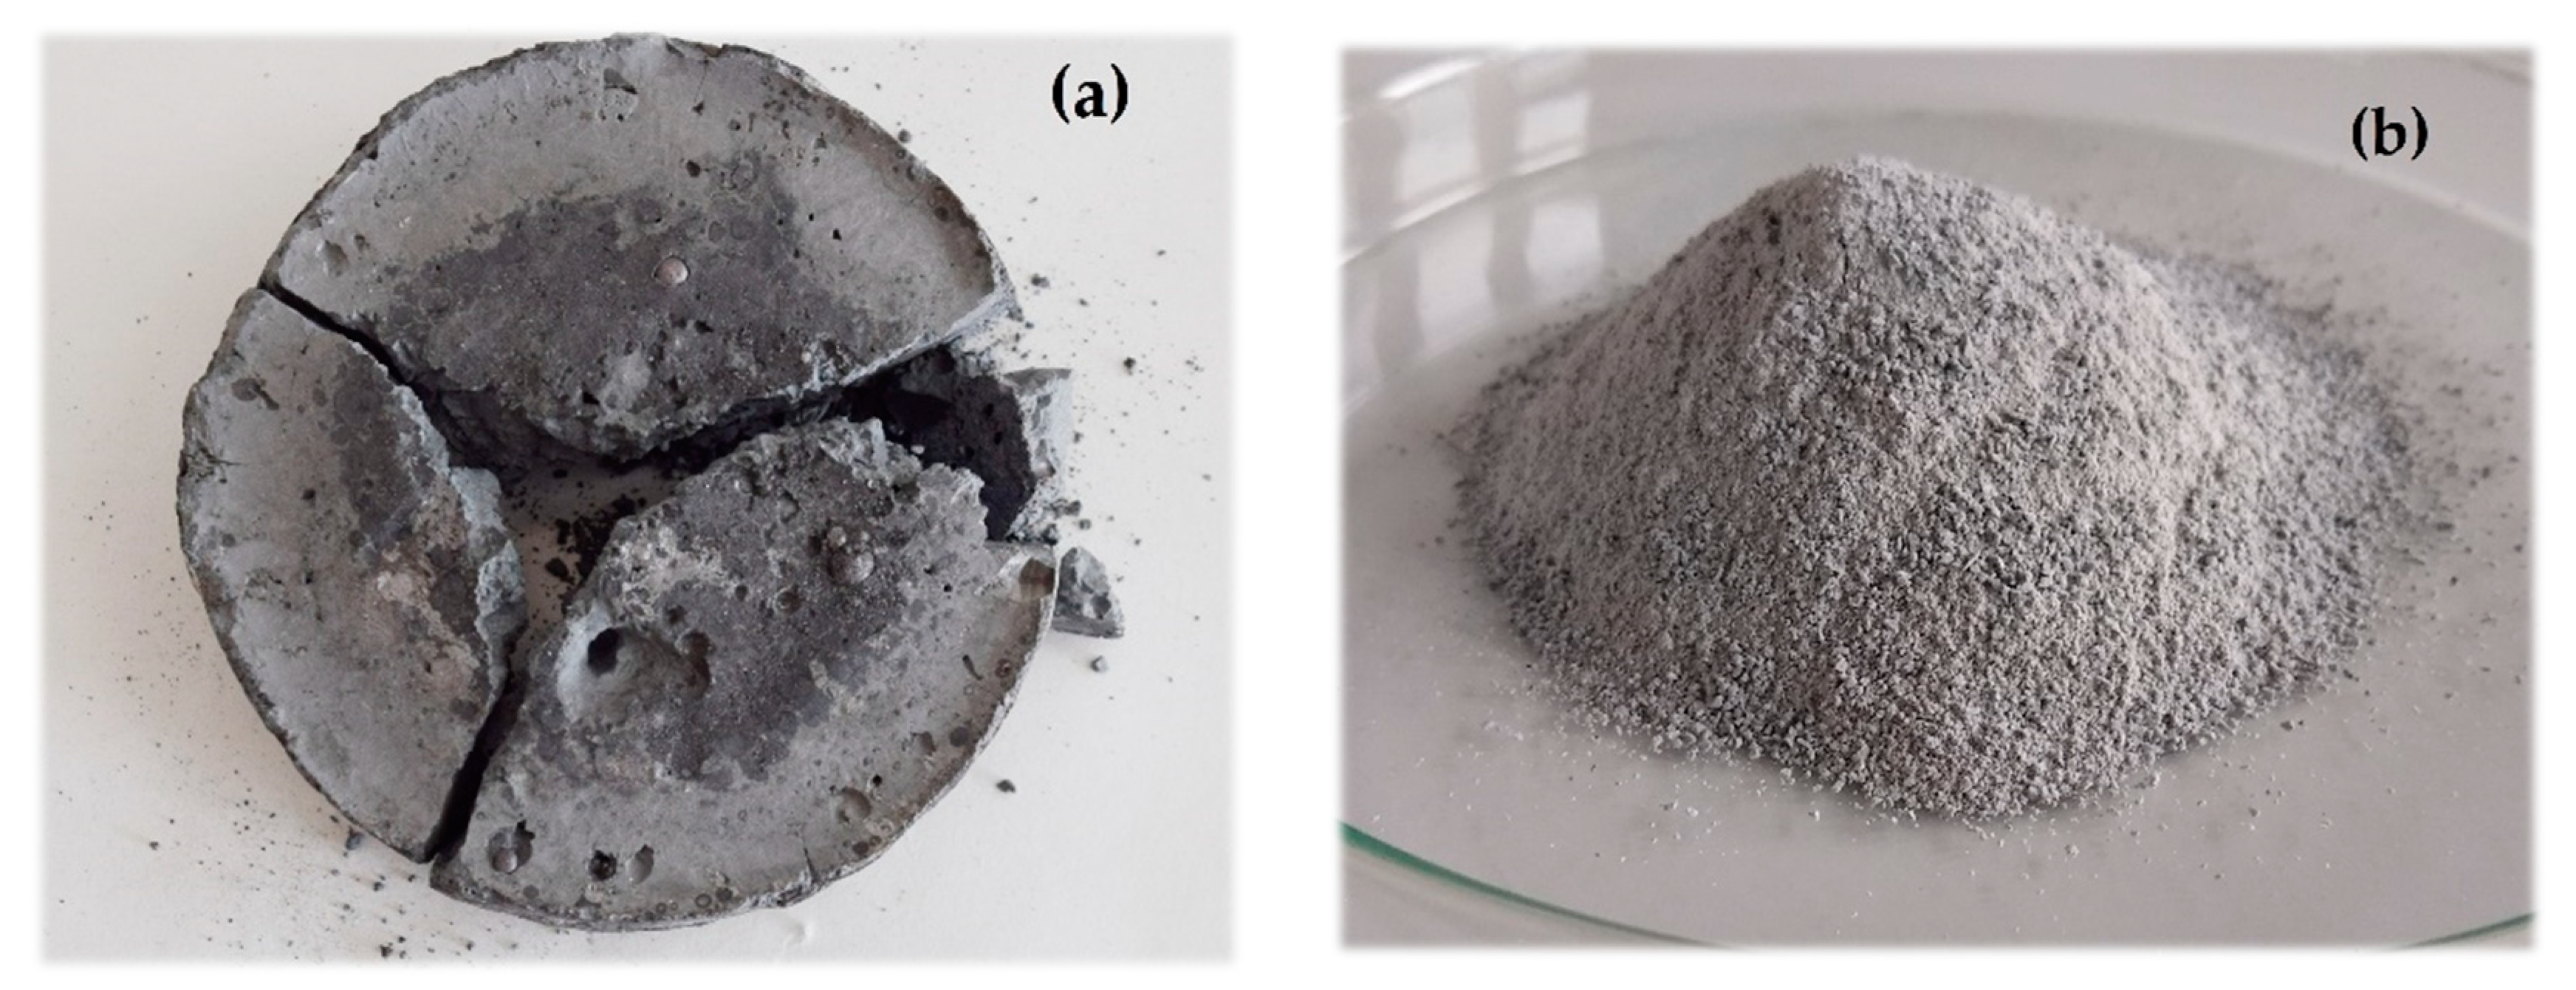
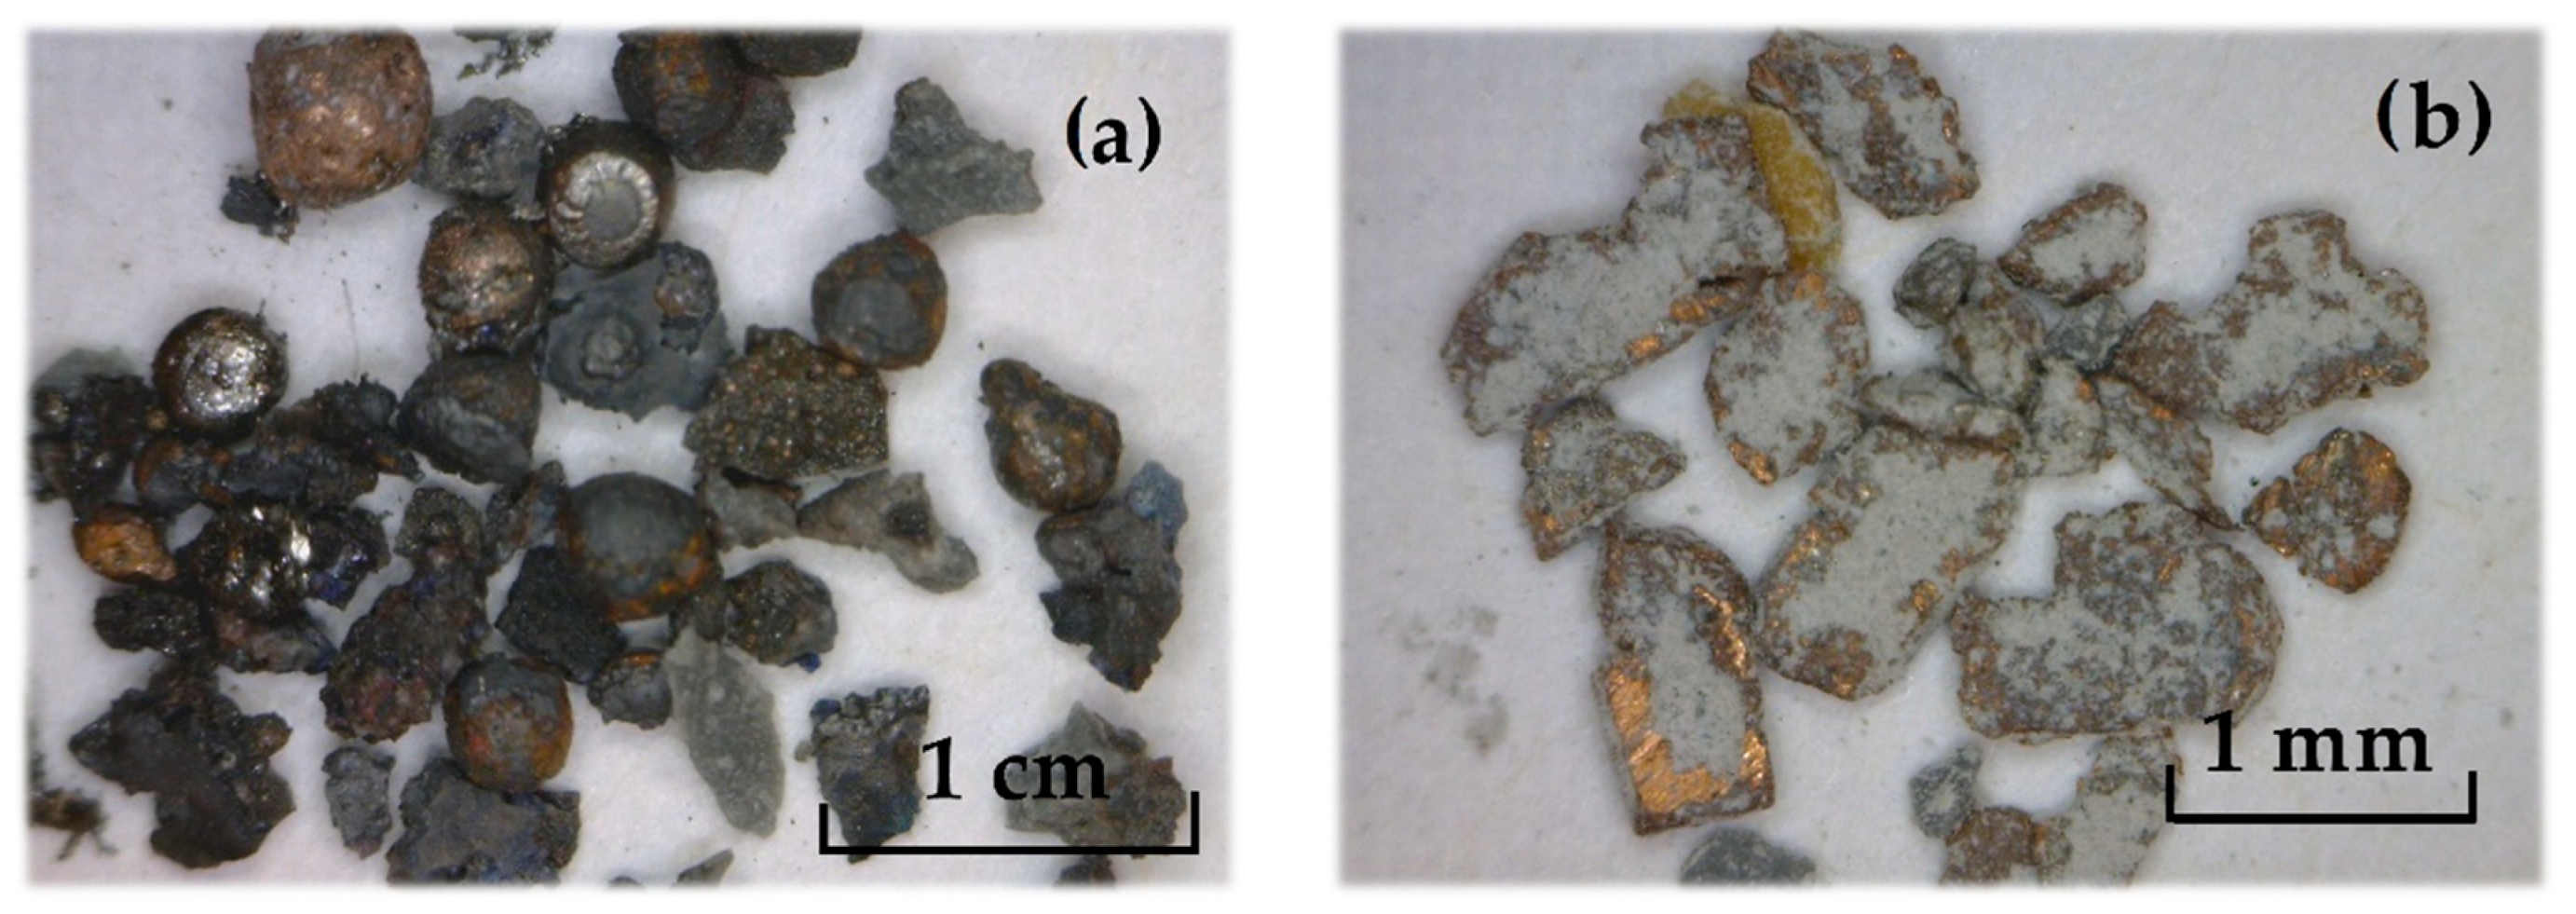
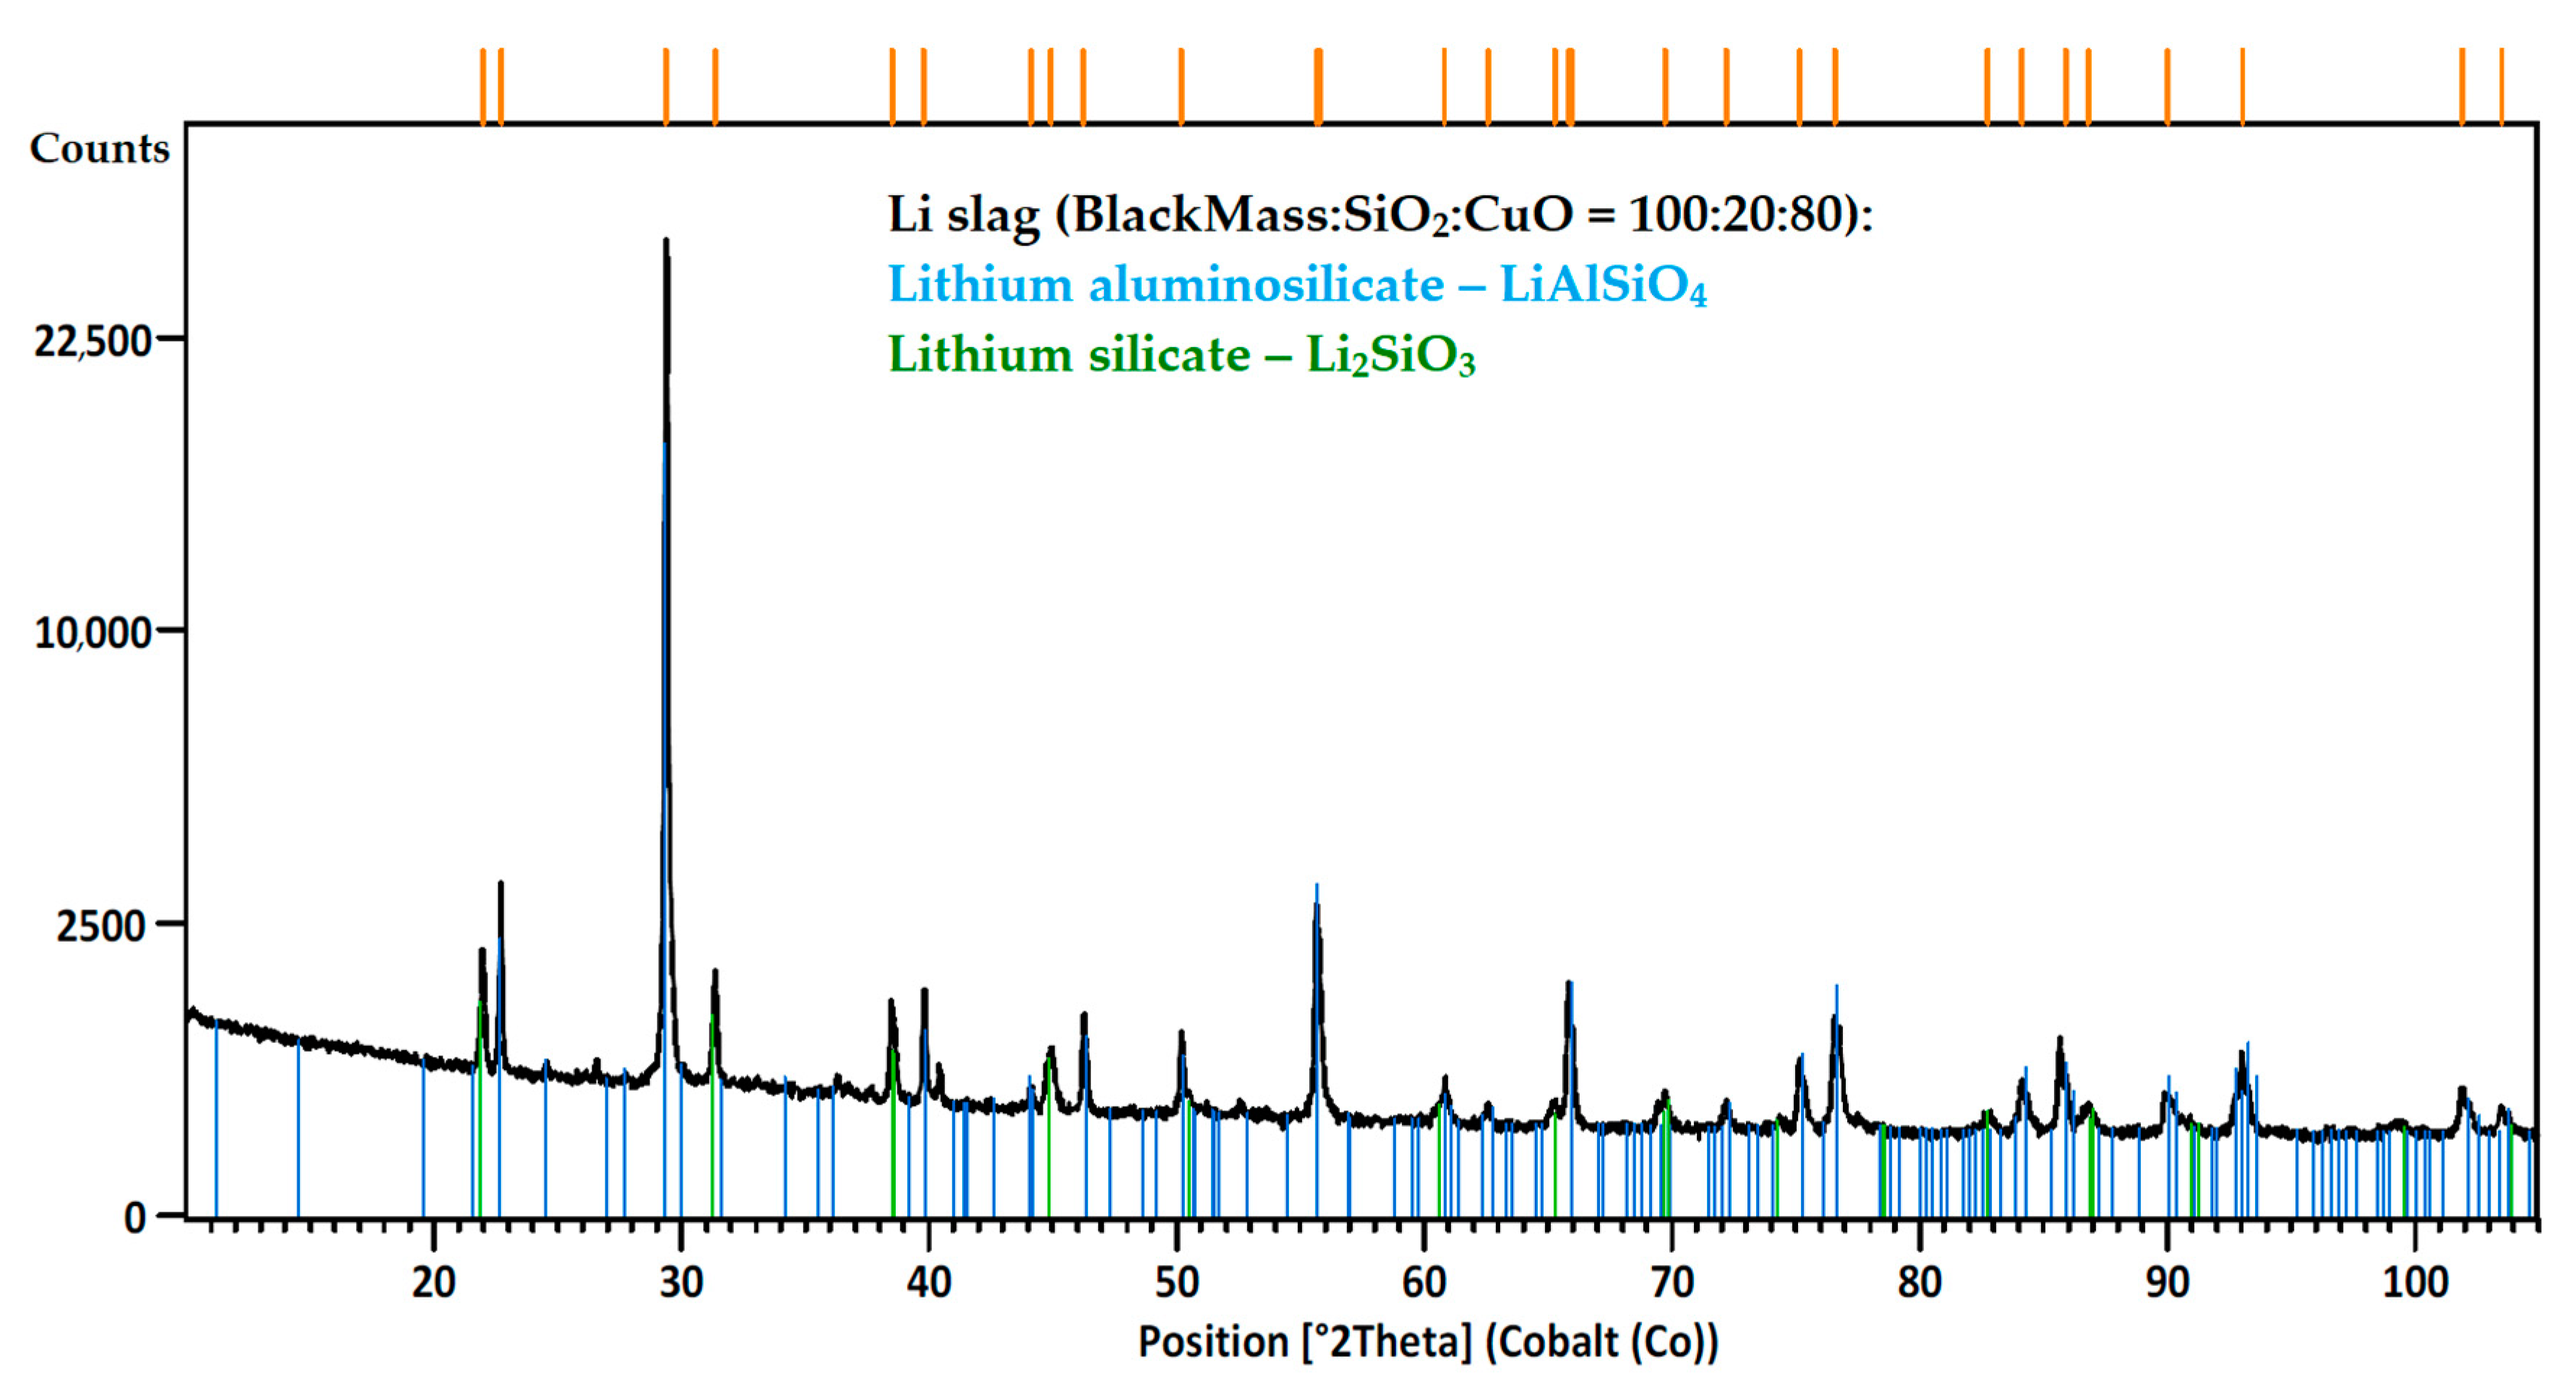
2.1. Sample Preparation and Characterization

Pyrolyzed lithium-ion (Li-ion) battery black mass used for this study was generated by Accurec Recycling GmbH and further processed in the Electric Arc furnace (EAF) at the IME Process Metallurgy and Metal Recycling, Institute of RWTH Aachen University, Germany with the SiO2 used as flux and CuO used to react with excess carbon from pyrolyzed battery black mass. A detailed description of the trials is presented in part 1 [30]. The chemical composition of the input materials, intermediates, and solutions obtained after hydrometallurgical treatment was analyzed by atomic absorption spectrometry (AAS) using spectrAA20+ spectrometer (Varian, Autralia). The phase composition of materials was analyzed by X-ray diffraction phase analysis (XRD) using Philips X’Pert Pro Co-Kα (PANanalytical, Almelo, Netherlands) and identified by PANanalytical HighScore Plus software version 3.0.
Generated Li slag showed in Figure 1 was crushed in a jaw crusher, ground in a mechanical mortar, subjected to a two-stage manual magnetic separation using a ferrite magnet, and subjected to sieving. Magnetic separation aimed to reduce the content of metallic impurities such as cobalt, copper, nickel, and iron in the Li slag. The first stage of magnetic separation was performed after crushing (Figure 2a) and the second after grinding (Figure 2b). Particle size of +0 −0.5 mm was used in this study. The chemical composition of Li slag and slag after mechanical pre-treatment is shown in Table 1.
The price and estimated value of Li slag elements in their marketable products are shown in Table 2. The theoretical values of the elements were calculated from the content of the element in Li slag and from the content of the element in the marketable product and their price. The most valuable element for its recovery from used Li slag is lithium marketed as Li2CO3. From one metric ton of Li slag, it is theoretically possible to obtain Li2CO3 with an estimated value of US $2500.27. The second most valuable element in the slag is aluminum with a theoretical value of US $367.99 per metric ton of Li slag. In addition to Li and Al, the study is focused on the leaching rates of silicon due to its high content in the Li slag and potential silica gel formations. Other elements are considered as impurities due to their low content.
XRD analysis of de-metalized Li slag is shown in Figure 3. The analysis shows that lithium is present in the slag as LiAlSiO4 and Li2SiO3. Other phases containing SiO2 were not identified in XRD diffraction pattern, which implies that excessive amount of SiO2 in the slag is present in amorphous form SiO2 (am).

2.2. Thermodynamic Study of Lithium Slag Leaching

A thermodynamic analysis was performed using HSC software (Outotec, Espoo, Finland) [38]. Table 3 shows potential reactions of identified lithium phases with sulfuric acid and their ΔG° values at 20 °C and 80 °C. A negative value of standard Gibbs energy indicates that these reactions are spontaneous and thermodynamically feasible.
Figure 4, Figure 5 and Figure 6 show E-pH diagram for Li-Al-S-Si-H2O, Al-Li-S-Si-H2O, and Si-Al-Li-S-H2O systems respectively. Thermodynamic study confirmed the presence of lithium as Li + ion in acidic leaching system at both selected temperatures. At pH above 13 and at 80 °C LiOH*H2O might precipitate. Aluminum and silicon are also thermodynamically stable in ionic form under pH five. At pH above five at 20 °C and pH above four at 80 °C Al2O3*SiO2 precipitates. Reactions (1), (2), and (3) from Table 3 indicated three possible silicon phases (SiO2, H2SiO3, and H4SiO4) present in the leaching system (formed by means of reaction of LiAlSiO4 with H2SO4). According to the Eh-pH diagram, the most thermodynamically stable is H4SiO4.

2.3. Methodology of Direct Li-Slag Leaching

The direct leaching experiments were carried out in an 800 mL glass reactor placed in a thermostatically controlled water bath. The experiments were performed at temperatures from 20 °C, 40 °C, 60 °C, and 80 °C using constant 400 rpm stirring speed. The aqueous solution of sulfuric acid at concentrations of 0.5 M and 1 M were used as leaching reagents. The pH of the solutions was measured with pH-meter (Inolab, WTW 3710, Germany). The volume of the leaching reagent was 500 mL. Ten grams of de-metalized Li slag samples were used for the experiments, which represents liquid to solid ratio L:S = 50. Solid Li slag samples for the experiments were obtained by manual quartering. The total duration of the experiment was 30 min with sampling time after 2, 5, 10, 15, 30 min.

2.4. Methodology of Dry Digestion Followed by Dissolution in Water

In addition to direct slag leaching, dry digestion (DD) experiments were performed to minimize gel formation. These experiments were carried out in 800 mL glass reactors. The experiments consisted of mixing a Li slag samples with concentrated (17.9 M) sulfuric acid and deionized water. The duration of the DD experiments was set to 60 min, after which the resulting dried mixture was dissolved in additional 500 mL of deionized water. The first series of experiments consisted of finding the optimal ratio of sample, acid, and water in DD step. The weight of Li slag samples was 10 g. The volumes of sulfuric acid used in this set of experiments was 5, 10, and 15 mL and volume of deionized water was 4, 12, and 24 mL. The experiments were also performed without the addition of water. In the second series of experiments, the constant ratio of Li slag sample, acid and water in DD step and volume of water in water dissolution step was maintained, while the total amount of the dried mixture was increased in the dissolution step. The prepared mixtures consisted of slag [g], acid [mL] and water [mL] in the ratios 10:10:24, 25:25:60, 50:50:120, and 100:100:240.

3. Results and Discussion

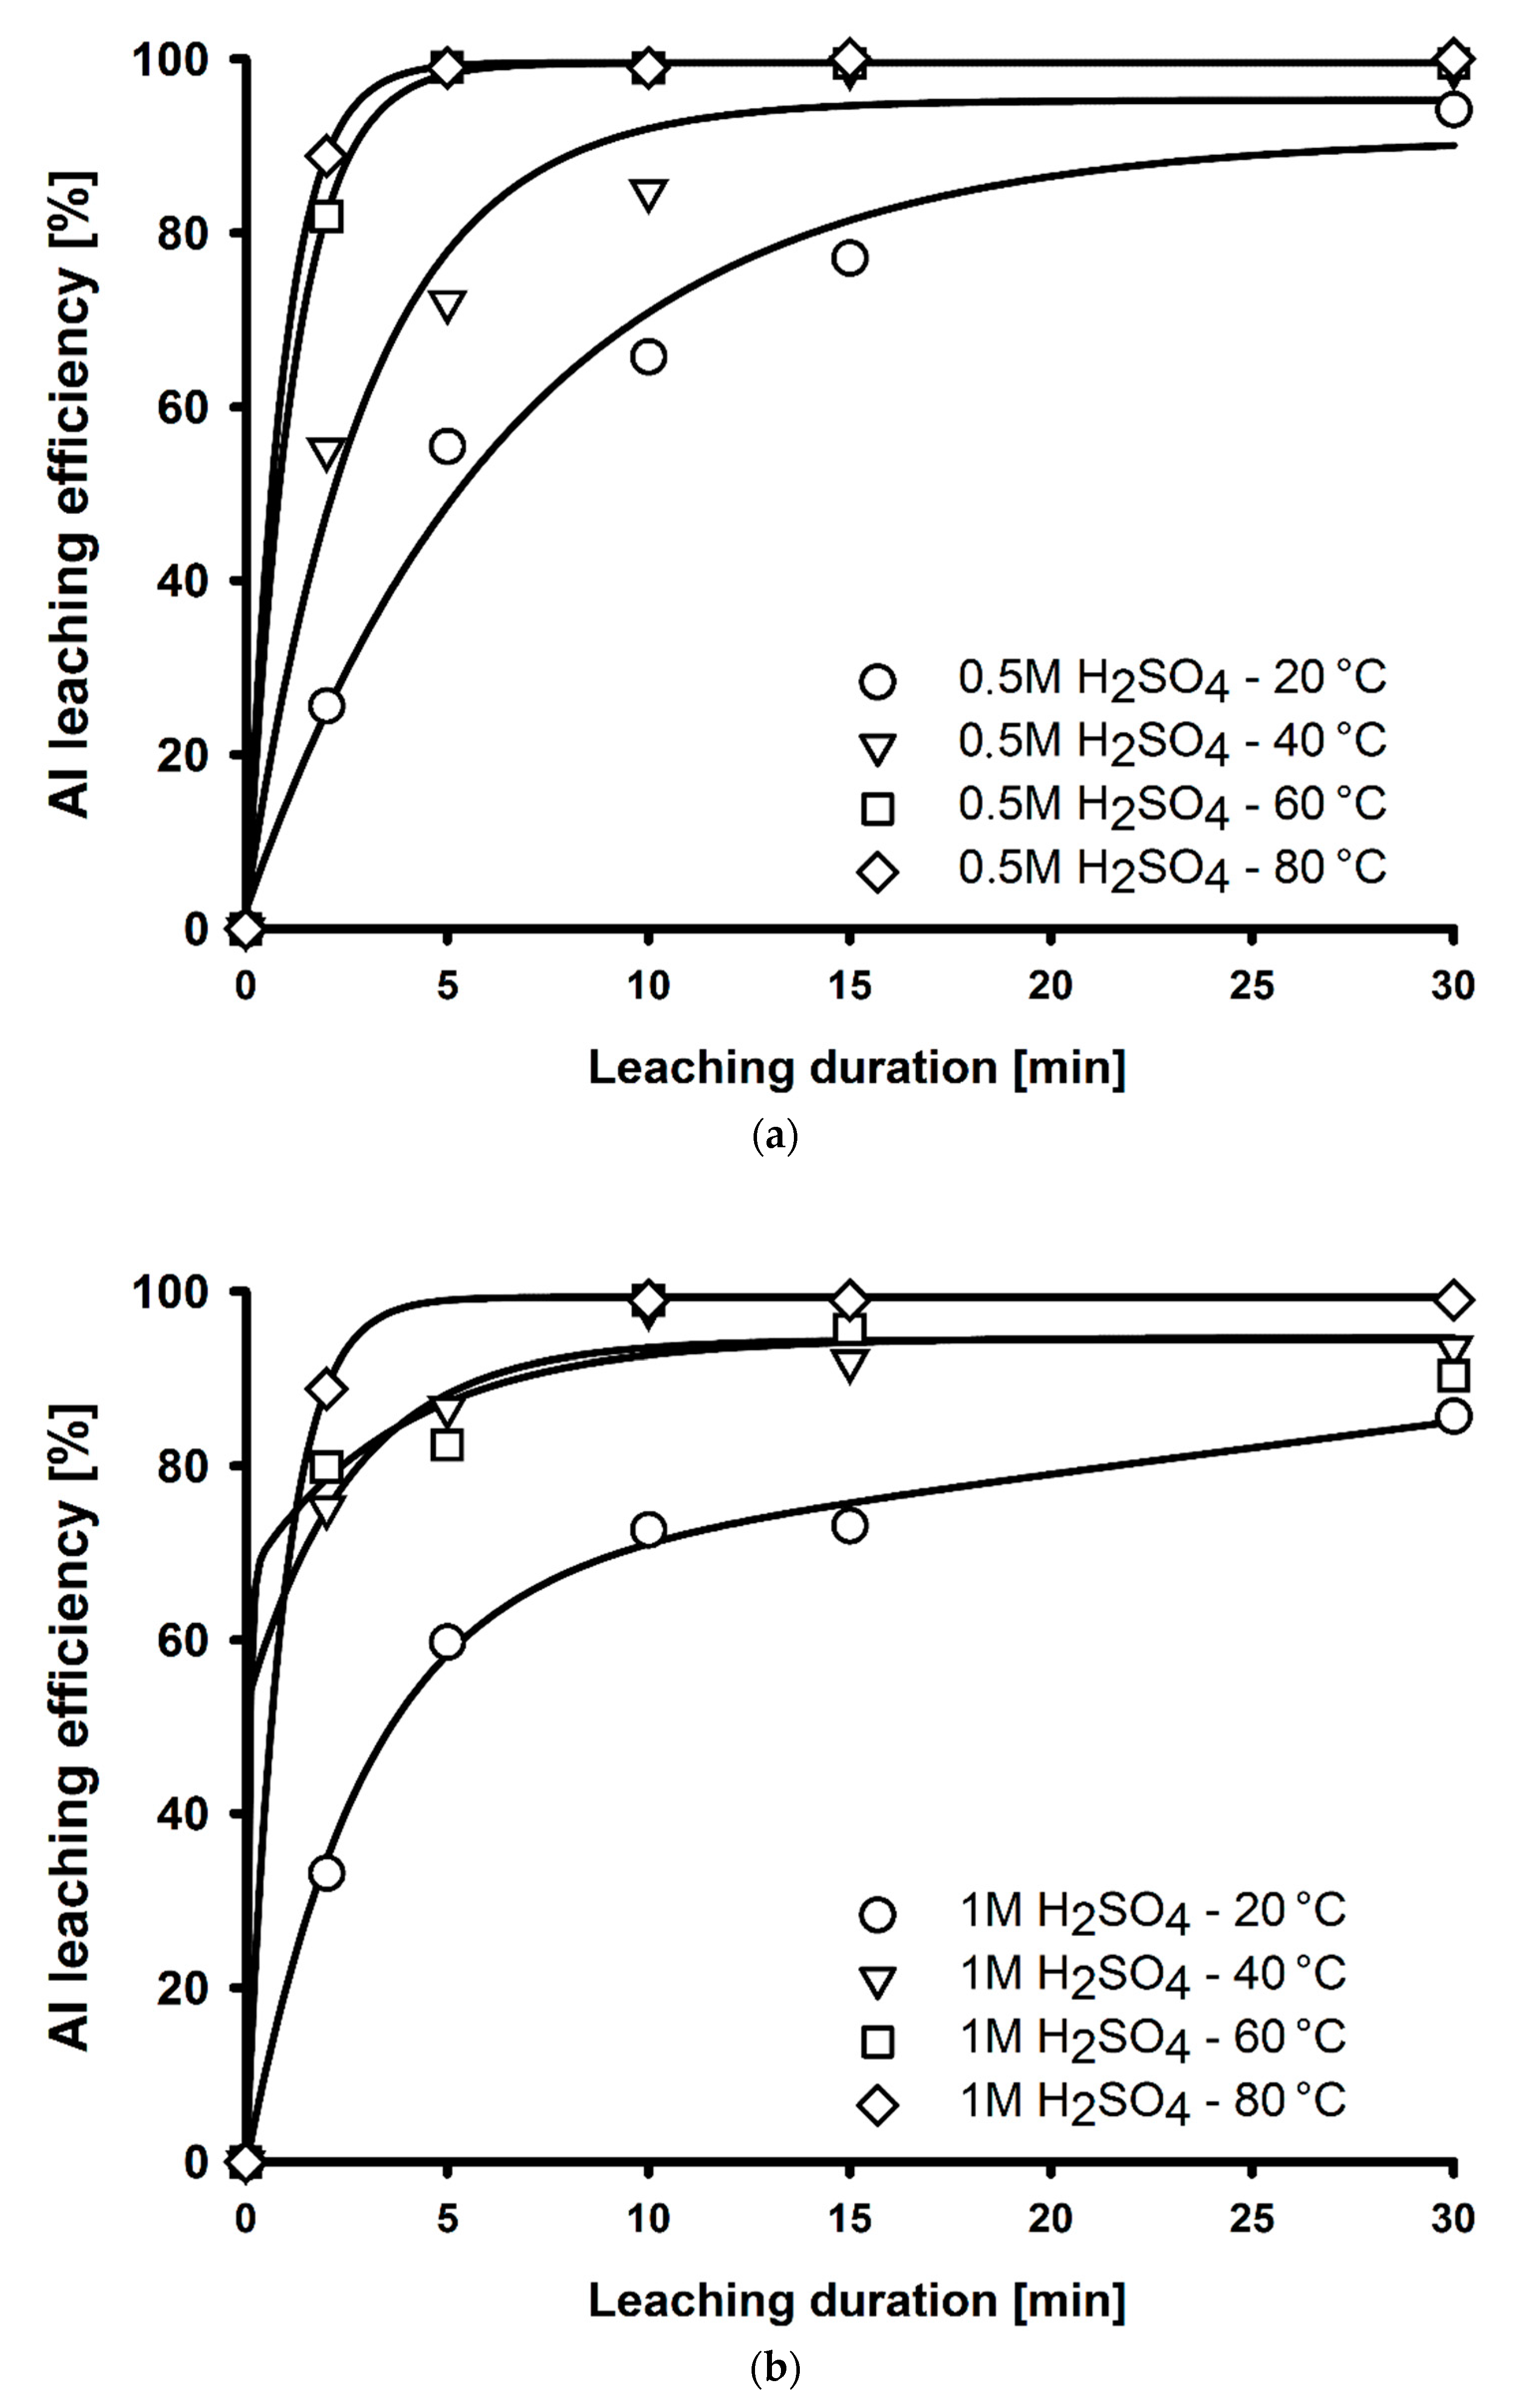
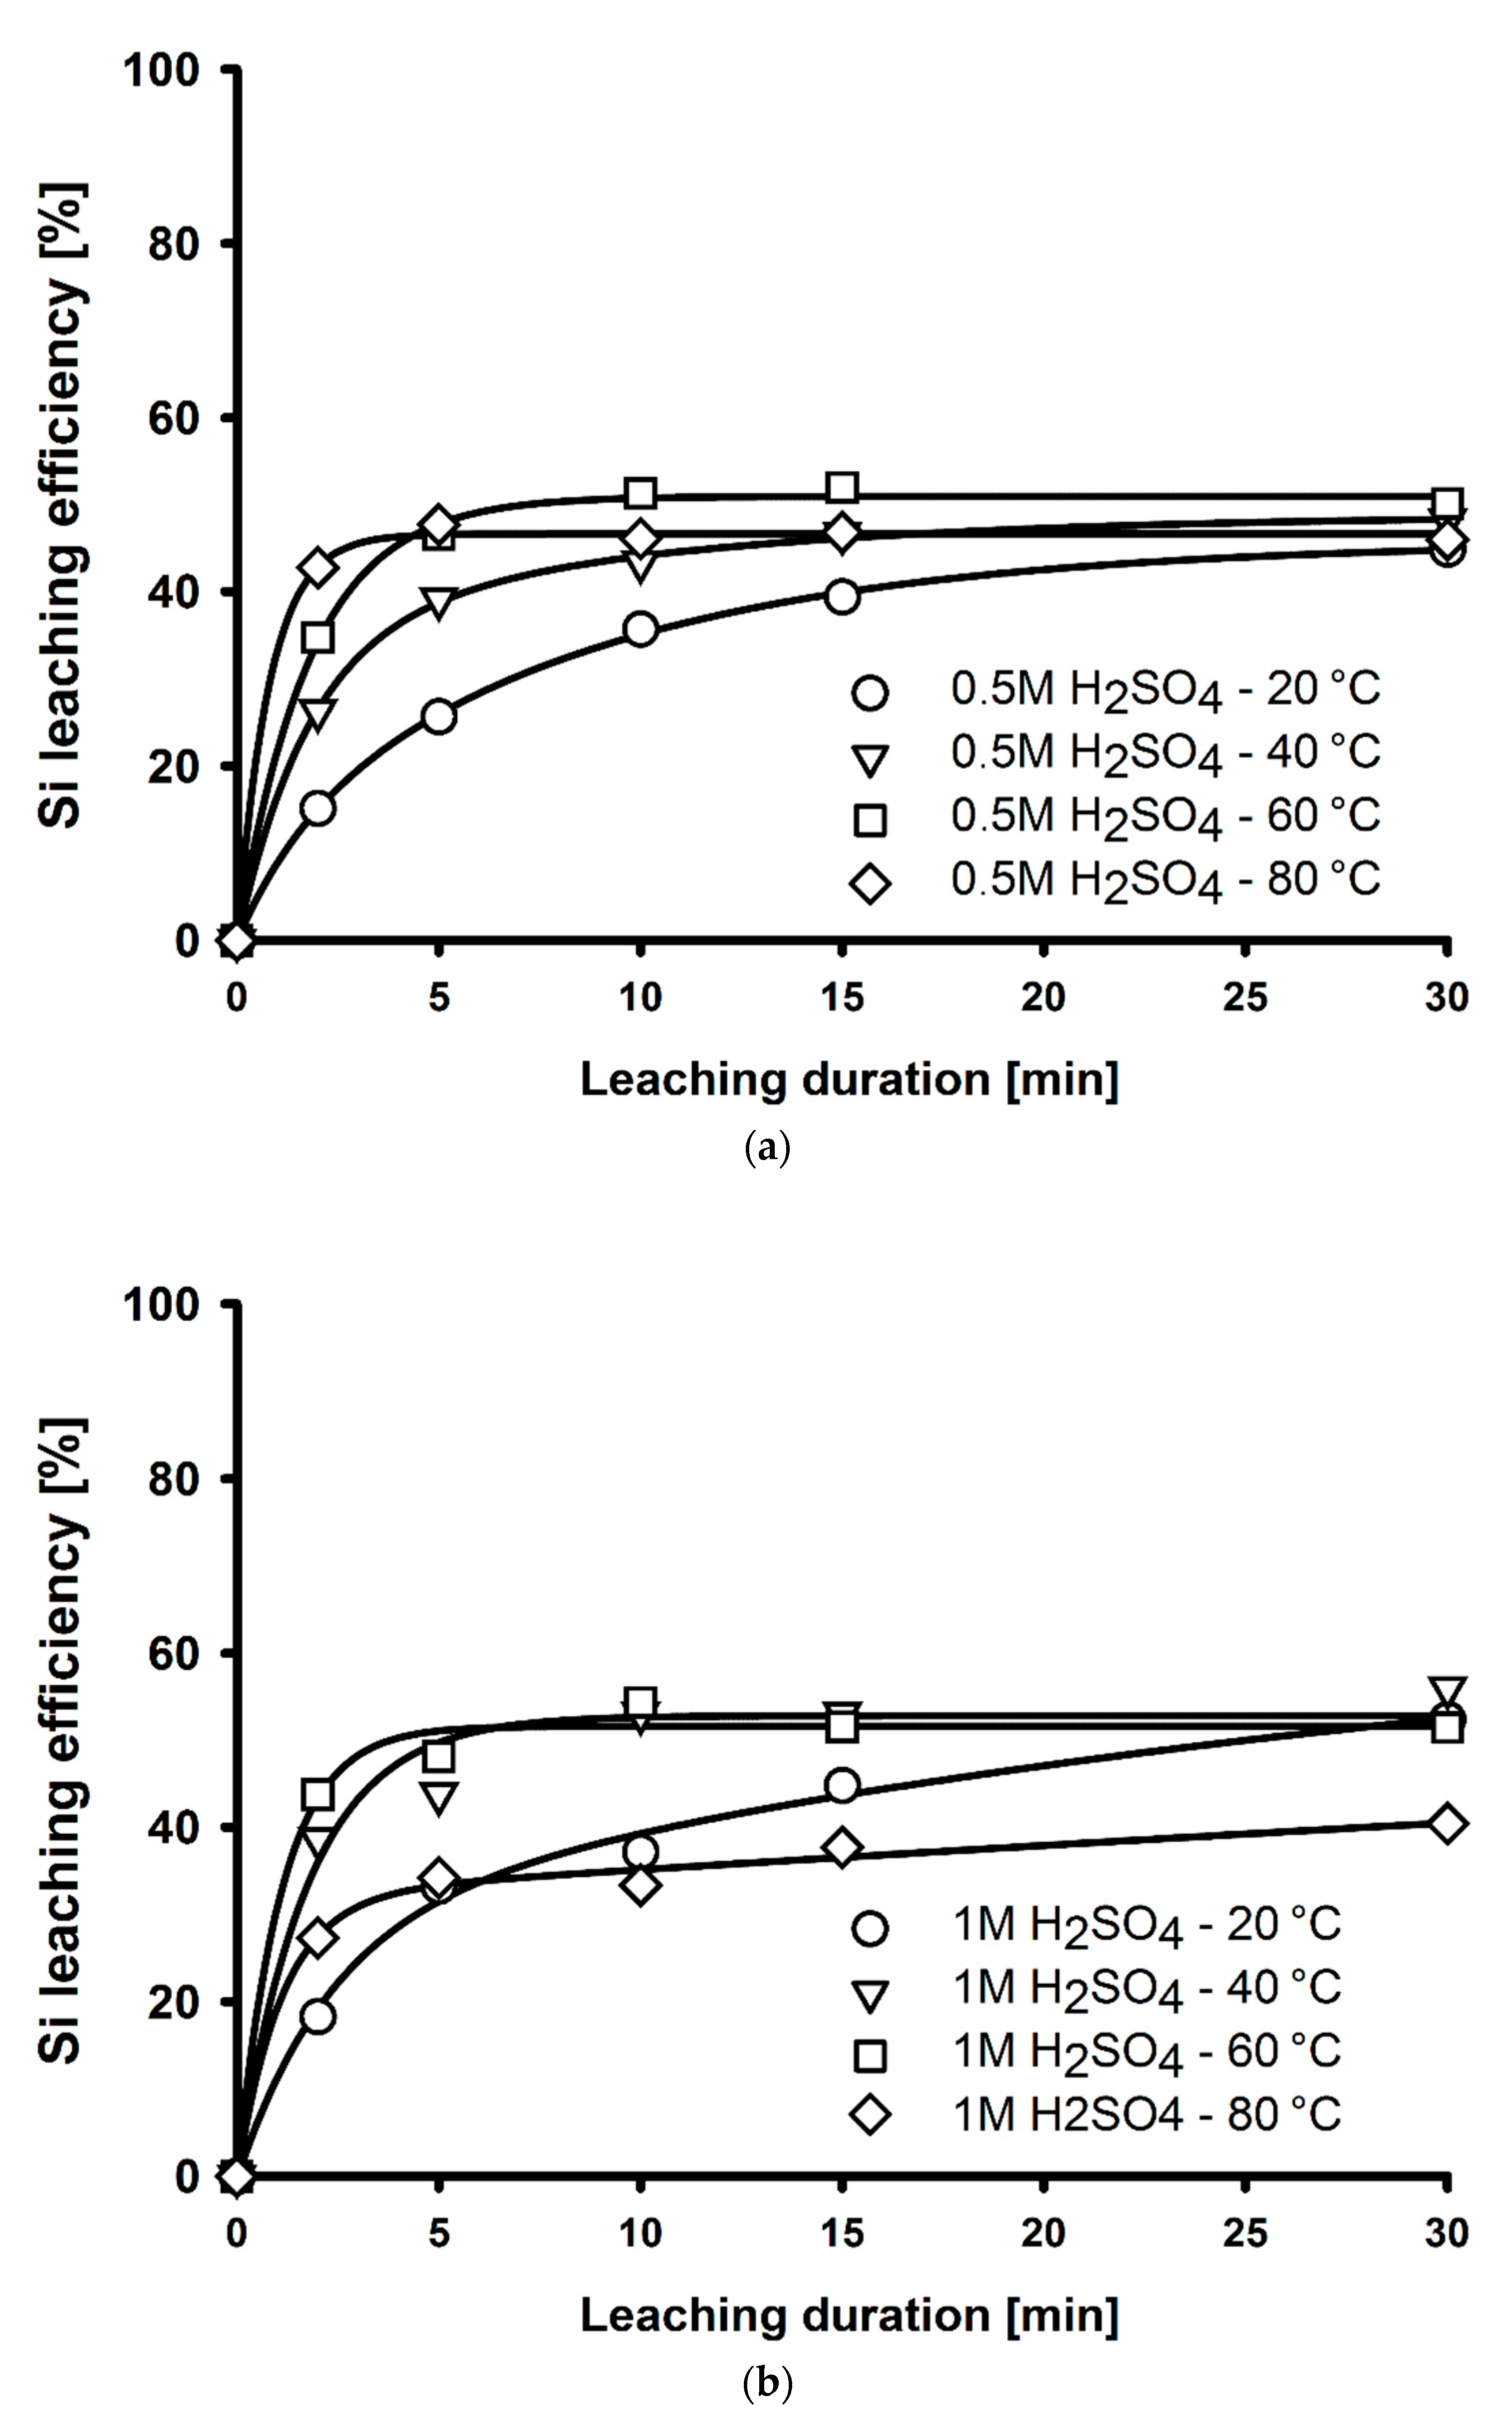
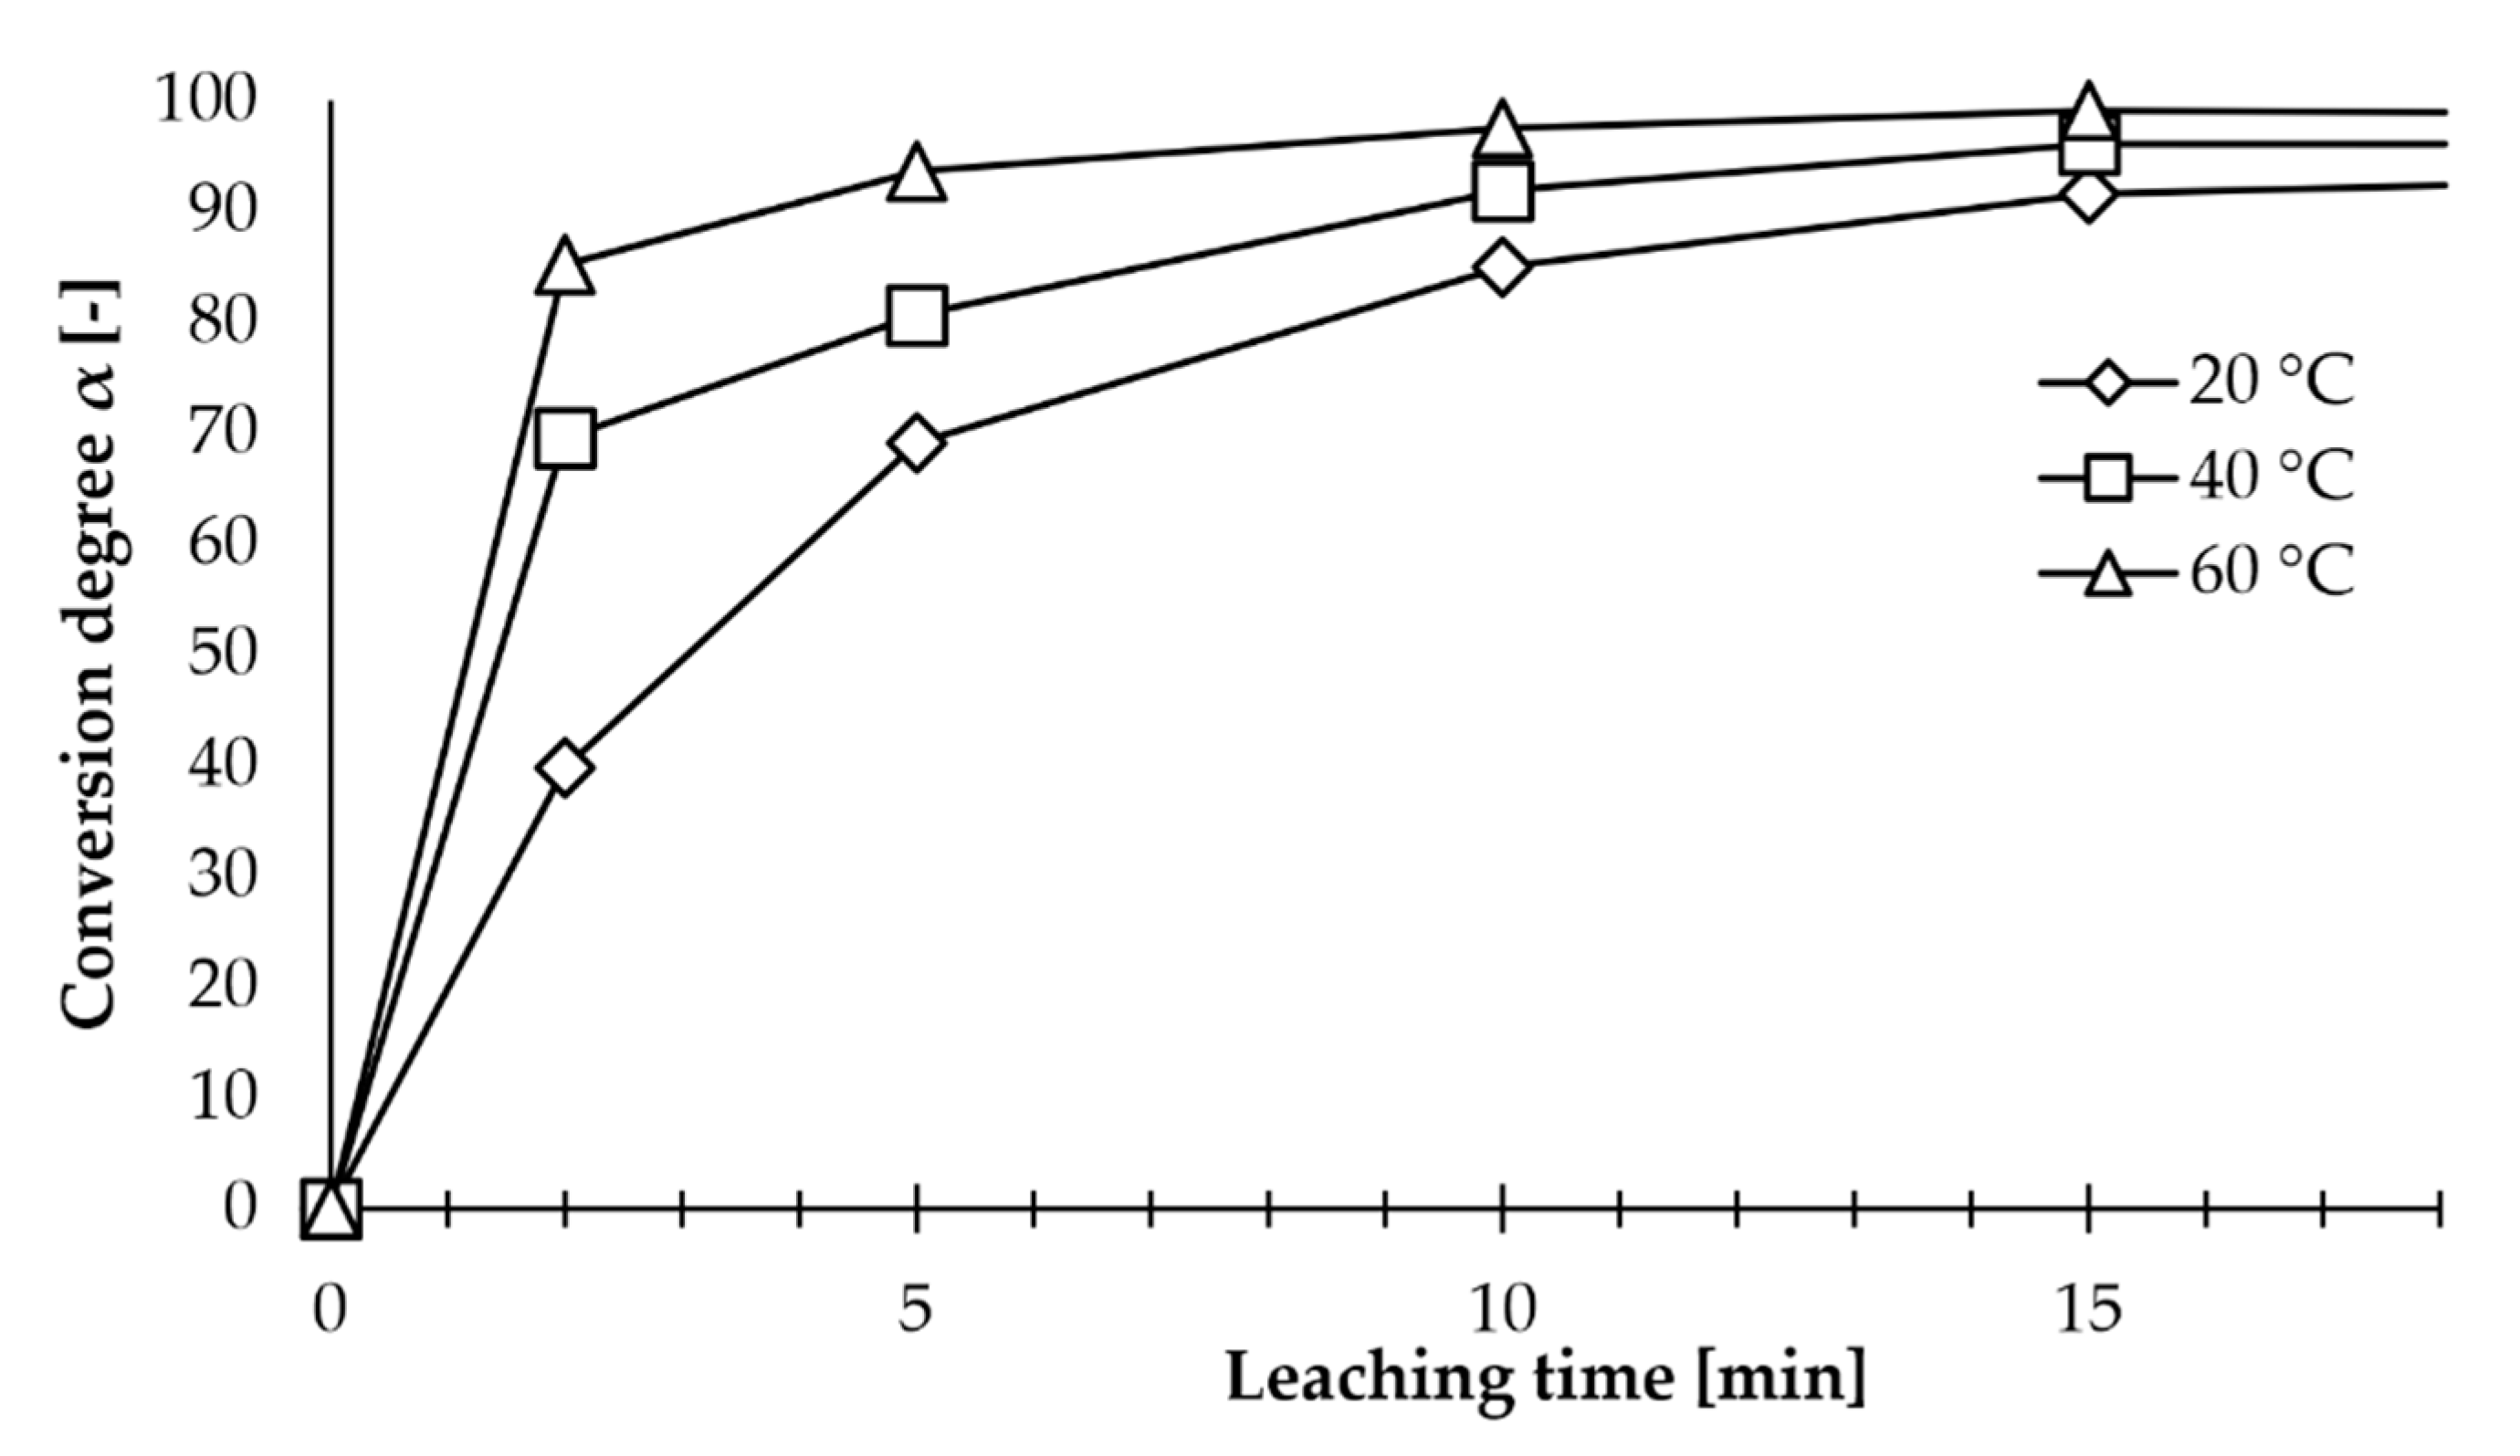
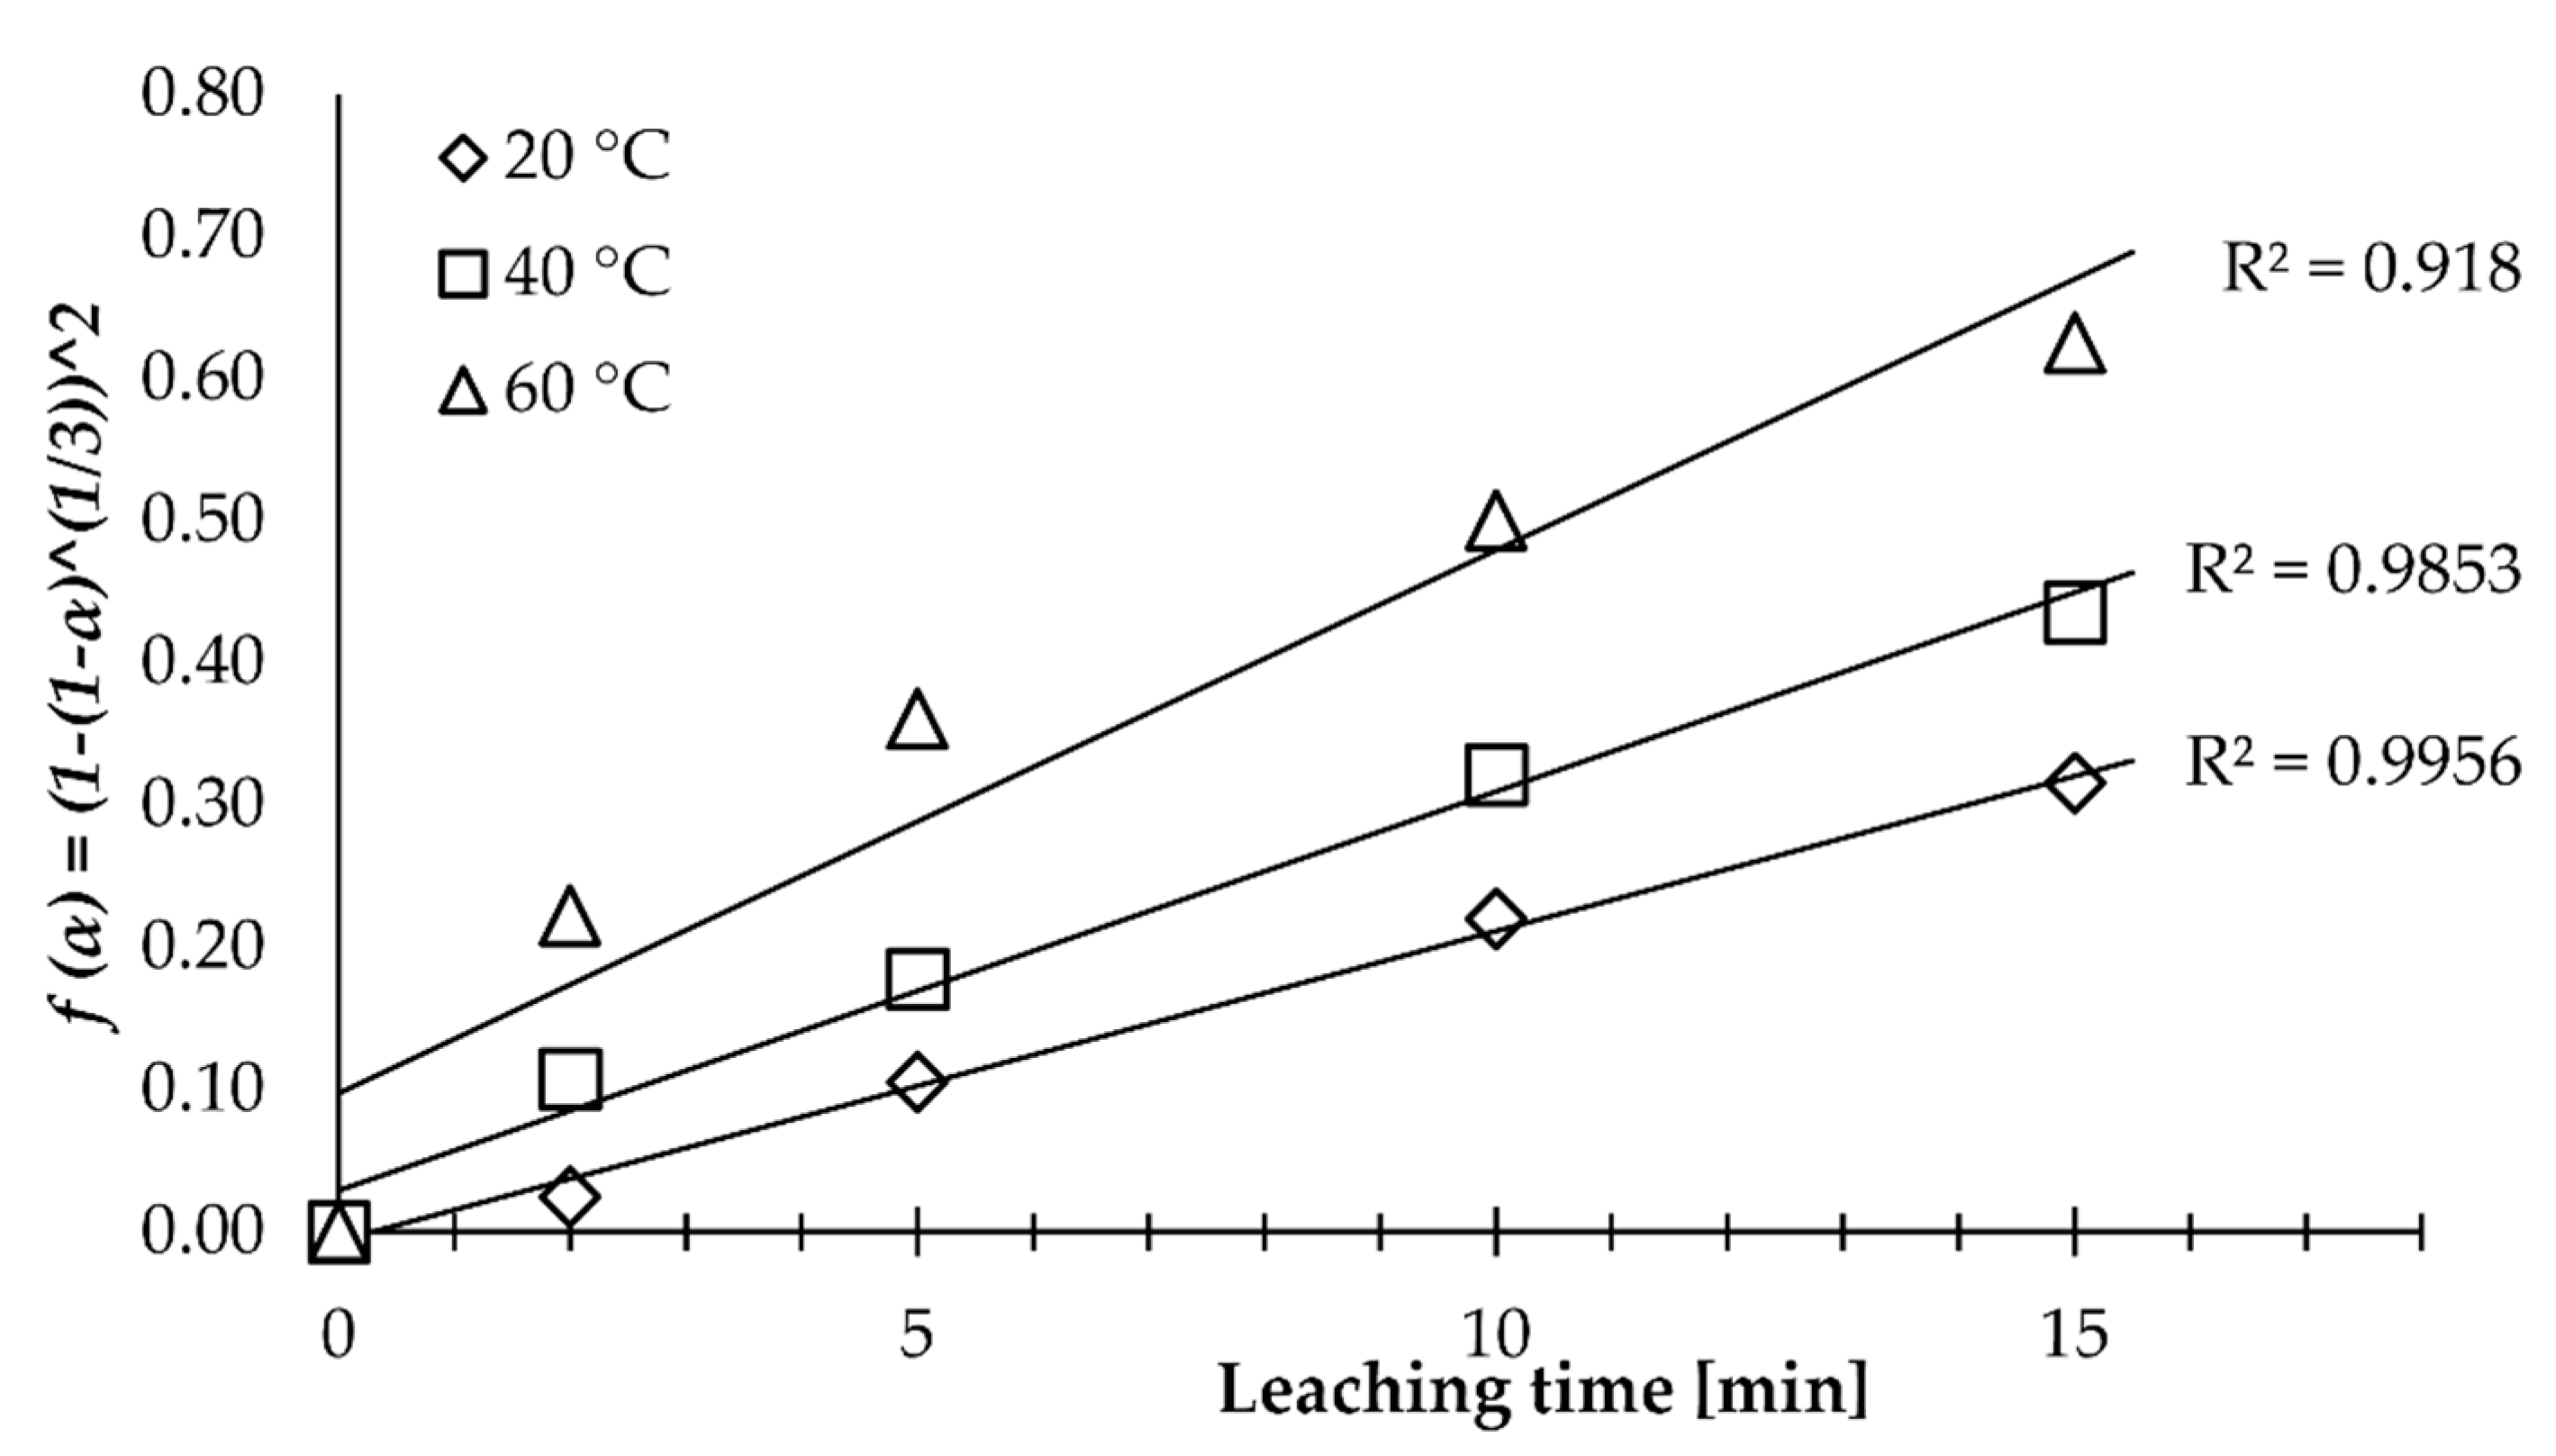
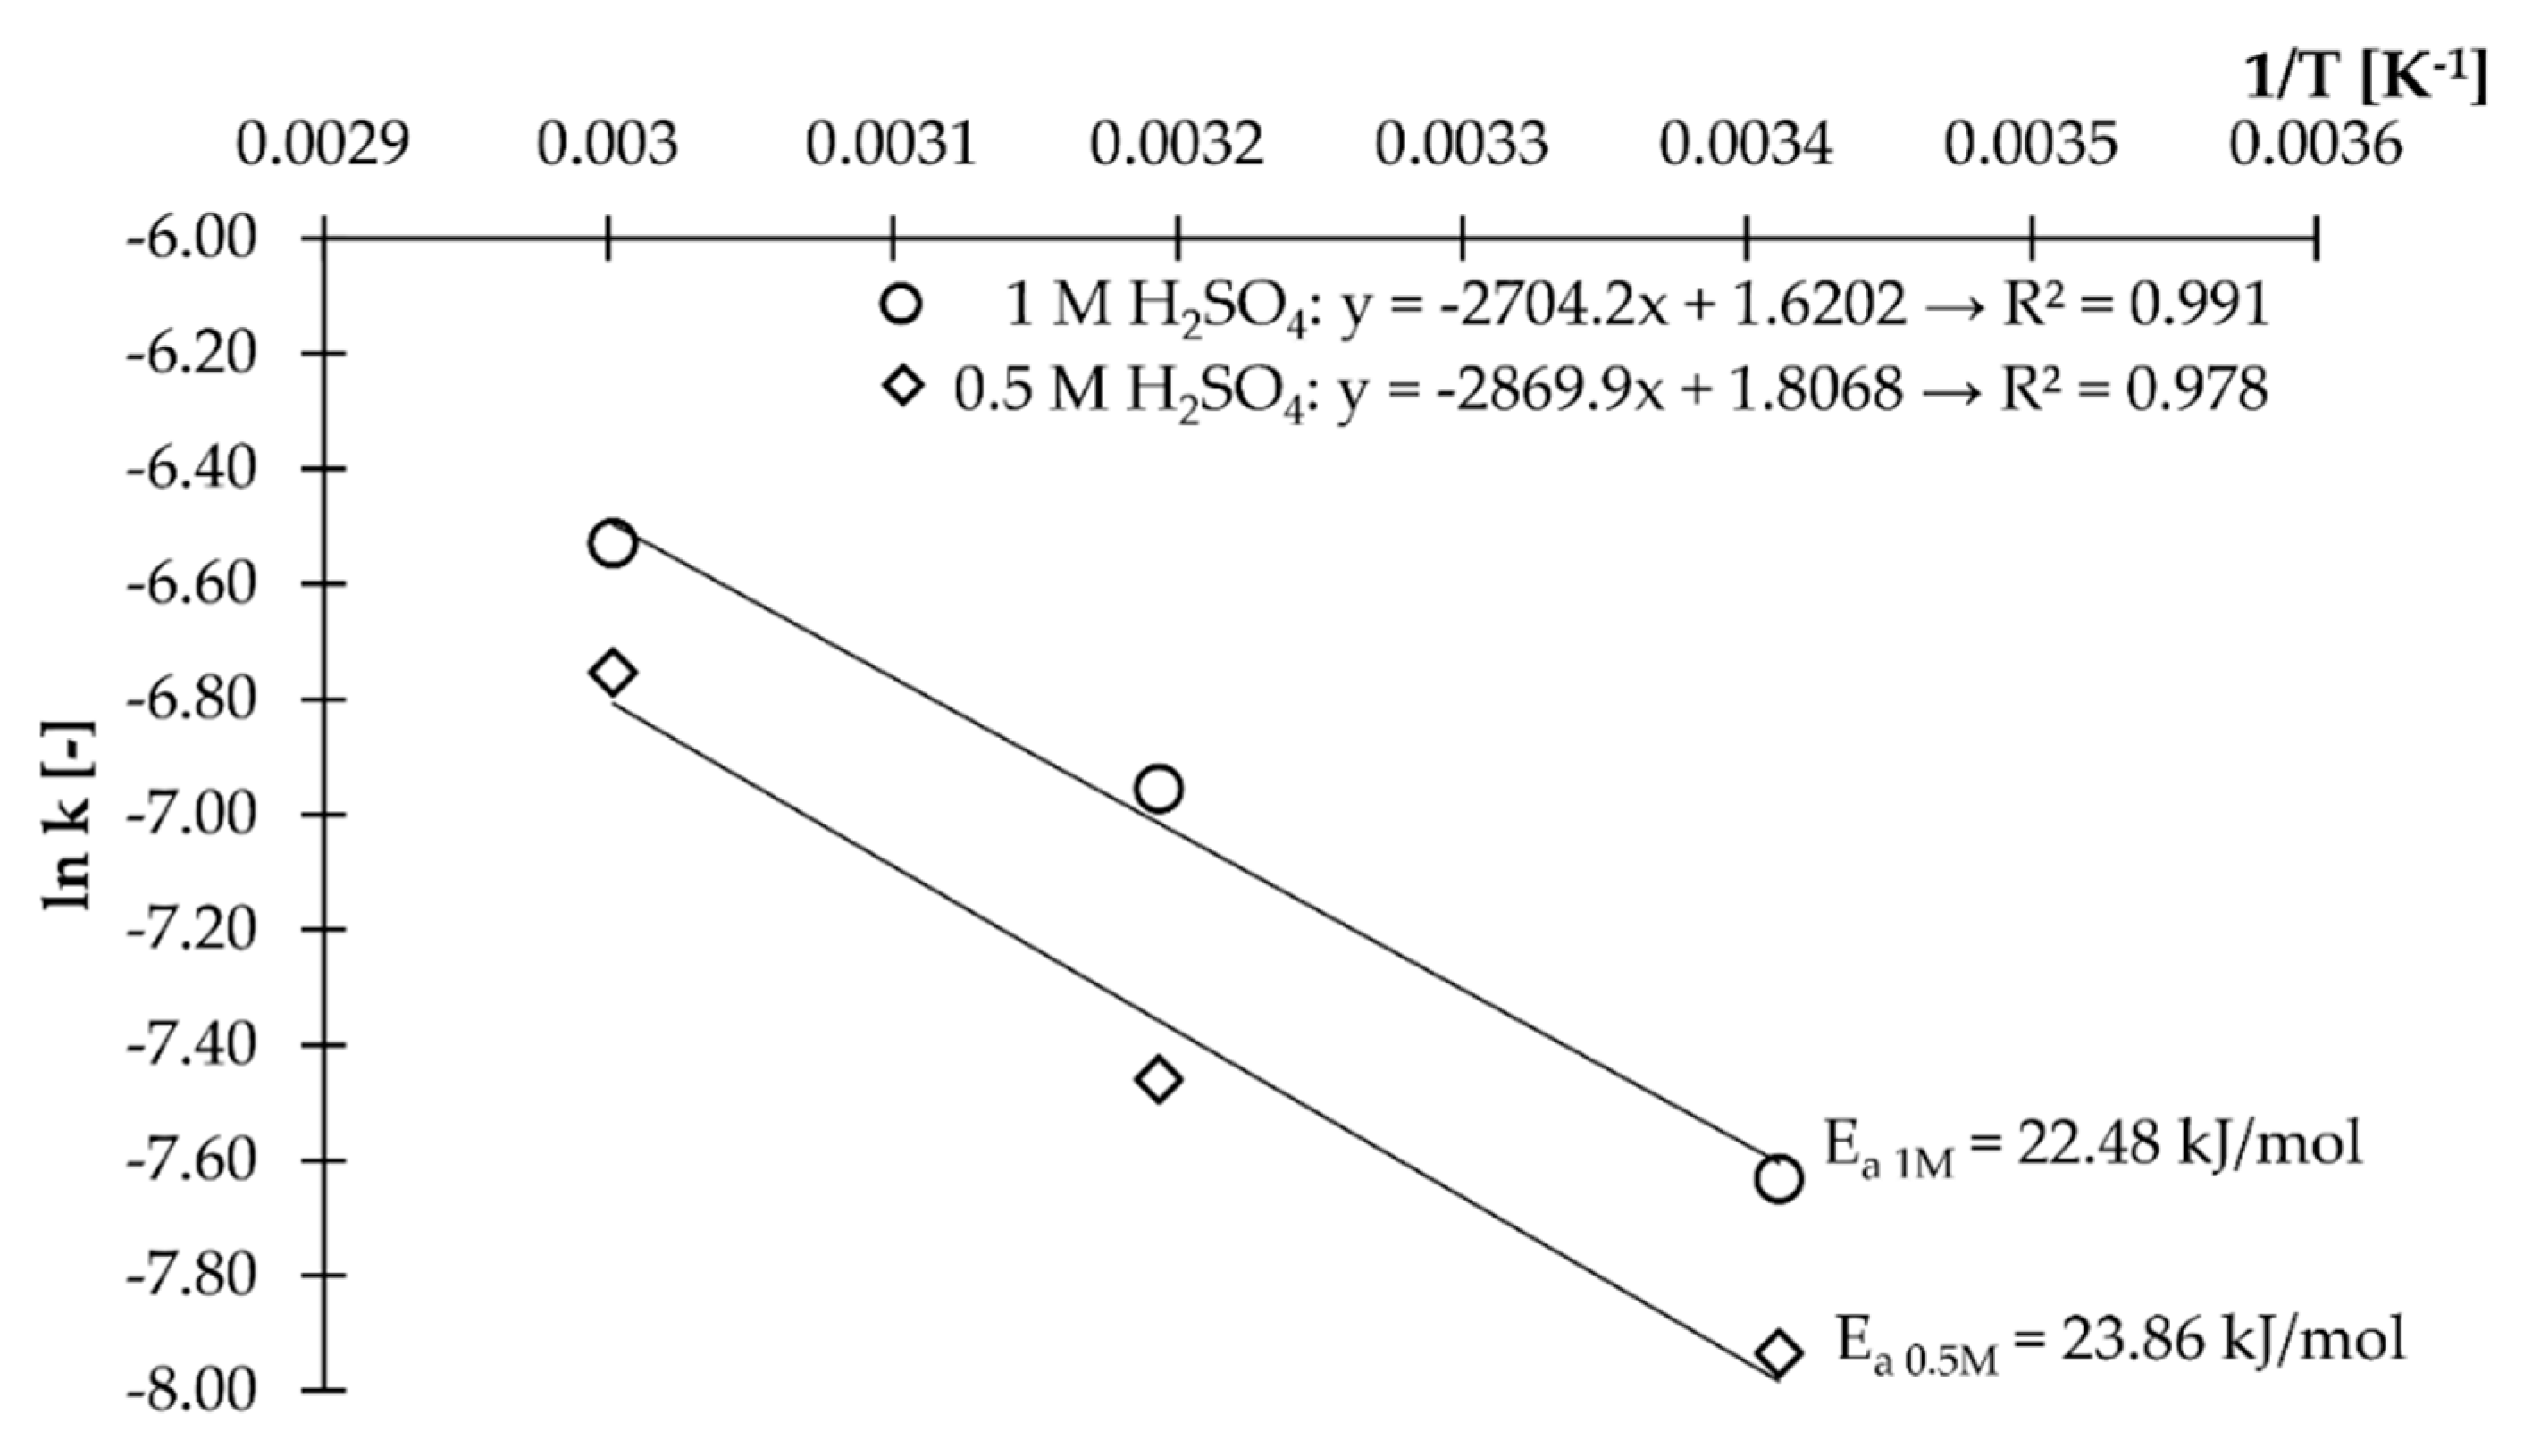
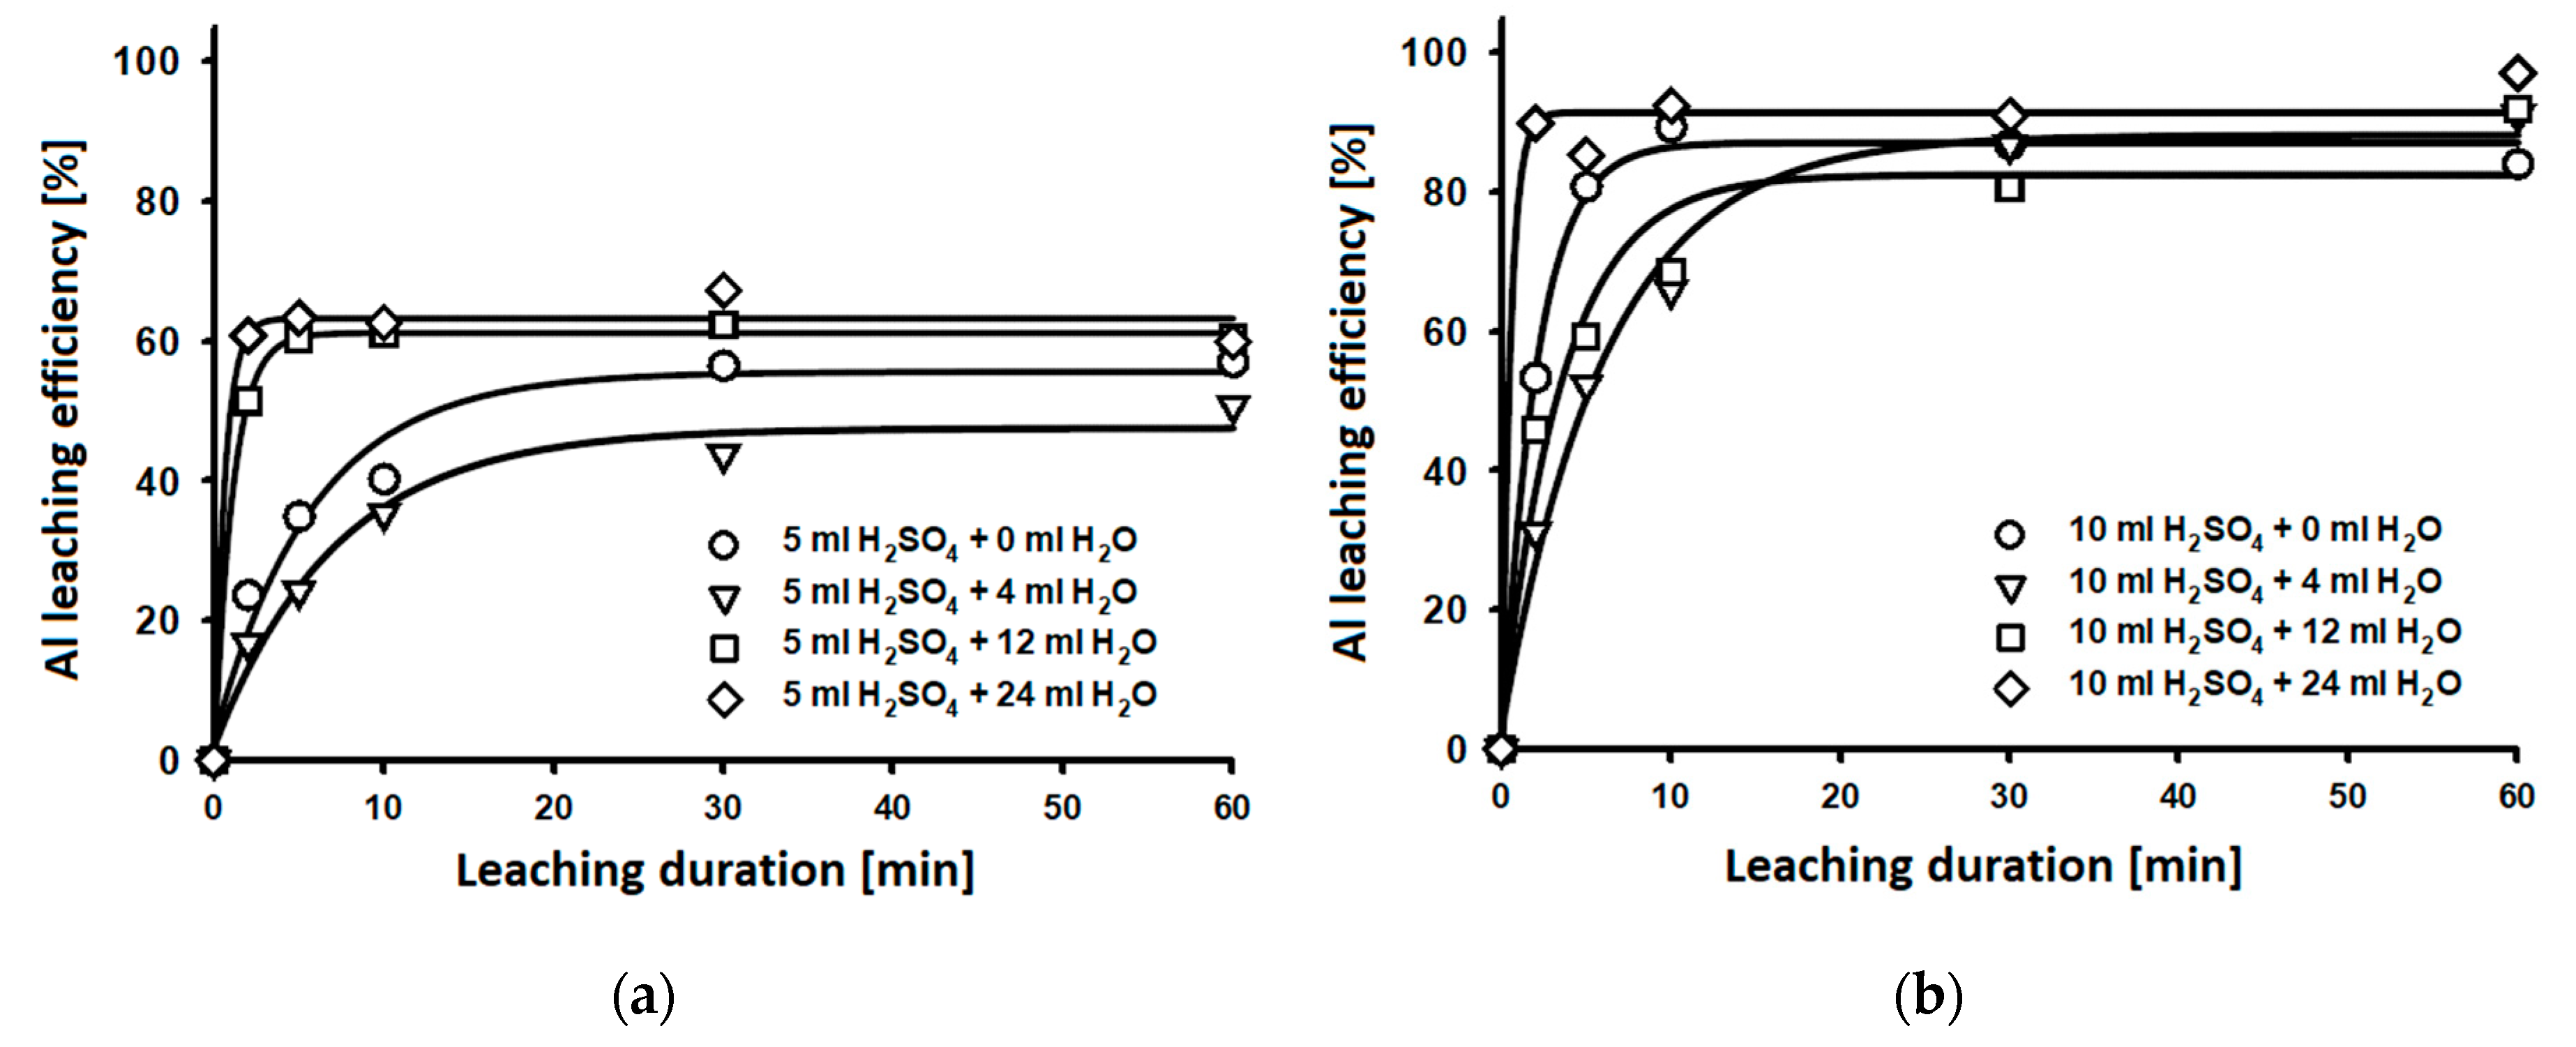
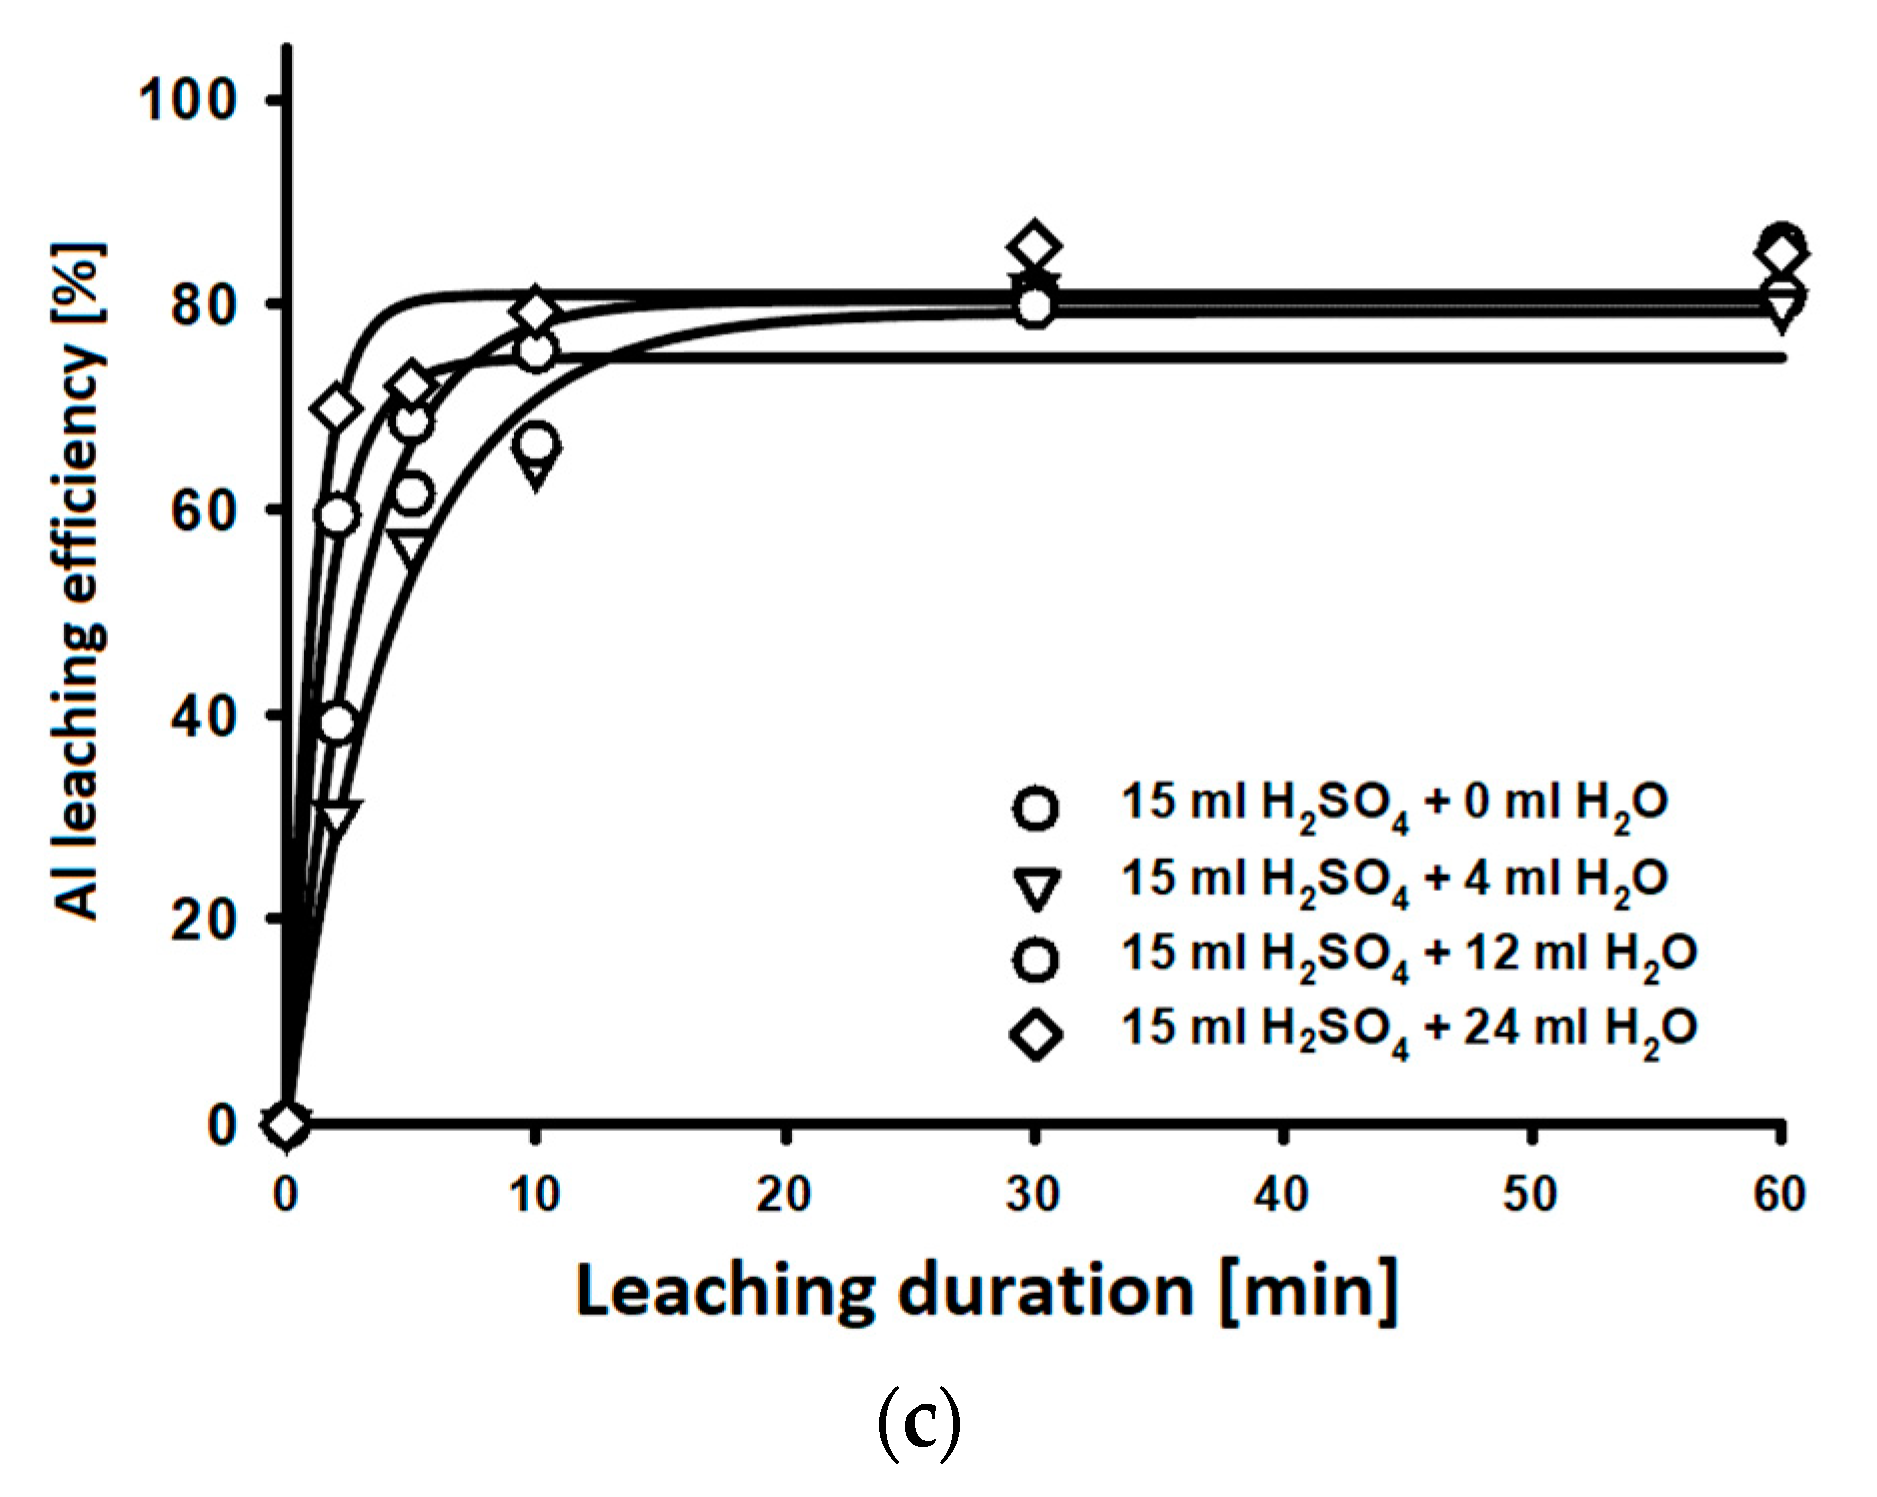
3.1. Direct Li Slag Leaching and Kinetic Study

The first hydrometallurgical experiment was direct leaching of Li slag in 500 mL of 0.5 M and 1 M H2SO4 solution at 20 °C, 40 °C, 60 °C, and 80 °C for 30 min. Figure 7, Figure 8 and Figure 9 show the dependence of leaching efficiency over time at different temperatures and acid concentrations for lithium, aluminum, and silicon, respectively.
Previous analysis of chemical composition shows that the most valuable element for the recovery from Li slag is lithium itself. High lithium leaching efficiencies close to 100% were achieved after 30 min of leaching at 20 °C using both H2SO4 concentrations. As the leaching temperature increases, the time required to leach lithium gradually decreases to 15 min at 40 °C and 60 °C and to five minutes at 80 °C. An increase in Li leaching efficiency can be observed in the first minutes of the experiments when leaching results of 0.5 M and 1 M H2SO4 are compared. In addition to lithium, the leaching efficiencies of aluminum and silicon were also studied, as these three elements are present in the LiAlSiO4 phase and their content in the slag is high. From the efficiency of aluminum leaching, it is possible to observe a slight effect of increasing the concentration of sulfuric acid, especially at lower temperatures, but more significant is the effect of temperature increase. Silicon is leached with an efficiency of up to 50%. This corresponds to stoichiometric calculations according to which approximately 50% of the silicon is present in the LiAlSiO4 phase, which is leachable in H2SO4, and approximately 50% in the SiO2 phase, which is not leachable in H2SO4. Thermodynamic study confirmed that leaching takes place according to Equations (1) and (6), in which orthosilicic acid (H4SiO4) is formed. A lower Si leaching efficiency was achieved at 20 °C. The highest Si leaching efficiencies were achieved at temperatures of 40 and 60 °C. As the leaching temperature is increased to 80 °C, a decrease in Si leaching efficiency was observed, which might be related to the fact that in addition to reaction (1), reaction (3) also takes place, in which solid SiO2 and H2O are formed instead of H4SiO4.
The apparent activation energy Ea of lithium was determined from measured experiments. The first step was the calculation of lithium conversion degree α for 0.5 and 1 M H2SO4, according to Equation (7):
α ( Li ) = m 0 m / m 0
where m0 is the amount of Li in the solid sample in time t = 0 and m is the calculated amount of lithium in the solution at the specific time of the leaching. Different kinetic models were applied to evaluate the linear relationship between model function f( α ) over time in the first 15 min of the leaching. The model is confirmed if a linear relationship between f(α) and t with a high coefficient of determination (R2) is found.
Table 4 shows the applied kinetic models [39] and their calculated values of R2 from the 0.5 M H2SO4 leaching in the time interval from 0 to 15 min. Low R2 values of the leaching at 80 °C indicated that none of these models could be applied to linearize the dissolution rate over time. This was caused by high dissolution rates in the first two minutes of the leaching. Therefore, only data obtained by leaching at 20 °C, 40 °C, and 60 °C, showed in Figure 10 were used for the Ea calculations. The R2 values given in Table 4 confirmed the three-dimensional diffusion model. The time dependence of the function of the selected diffusion model and the value of R2 are shown in Figure 11. Apparent rate constants were extracted from the slopes of the selected model function at different temperatures and their natural logarithm values were plotted against reciprocal temperature (Figure 12). Apparent activation energy was calculated from the slope according to the Arrhenius Equation (8) in the form:
l n k 2 k 1 = E a R ( 1 T 2 1 T 1 )
The same procedure for the apparent activation energy calculation was used for the data obtained from the Li slag leaching in 1 M H2SO4.
Activation energy values under 21 kJ/mol indicate that the rate-determining step of the reactions is diffusion, in the range of Ea values from 21 to 35 kJ/mol it is a mixed mechanism and activation energy values above 35 kJ/mol indicate that the rate-determining step is a chemical reaction [40]. Apparent activation energy of lithium leaching in 0.5 M H2SO4 is 23.86 kJ/mol (R2 = 0.978) and in 1 M H2SO4 is 22.48 kJ/mol (R2 = 0.991). Takáčová et al. [41] studied direct leaching of black mass fromLIBs, where lithium was present in LiCoO2. The apparent activation energy of lithium leaching from LCO black mass was in the interval from 16 to 19 kJ/mol. The comparison of apparent activation energies shows that, unlike black mass leaching, where the rate-determining step is diffusion only, in the case of Li slag leaching it is a mixed mechanism, where both diffusion and the rate of chemical reaction affect the overall course of the reaction. To maintain high leaching efficiencies of lithium from slag, it is necessary to leach at increased temperatures with sufficient stirring speed.

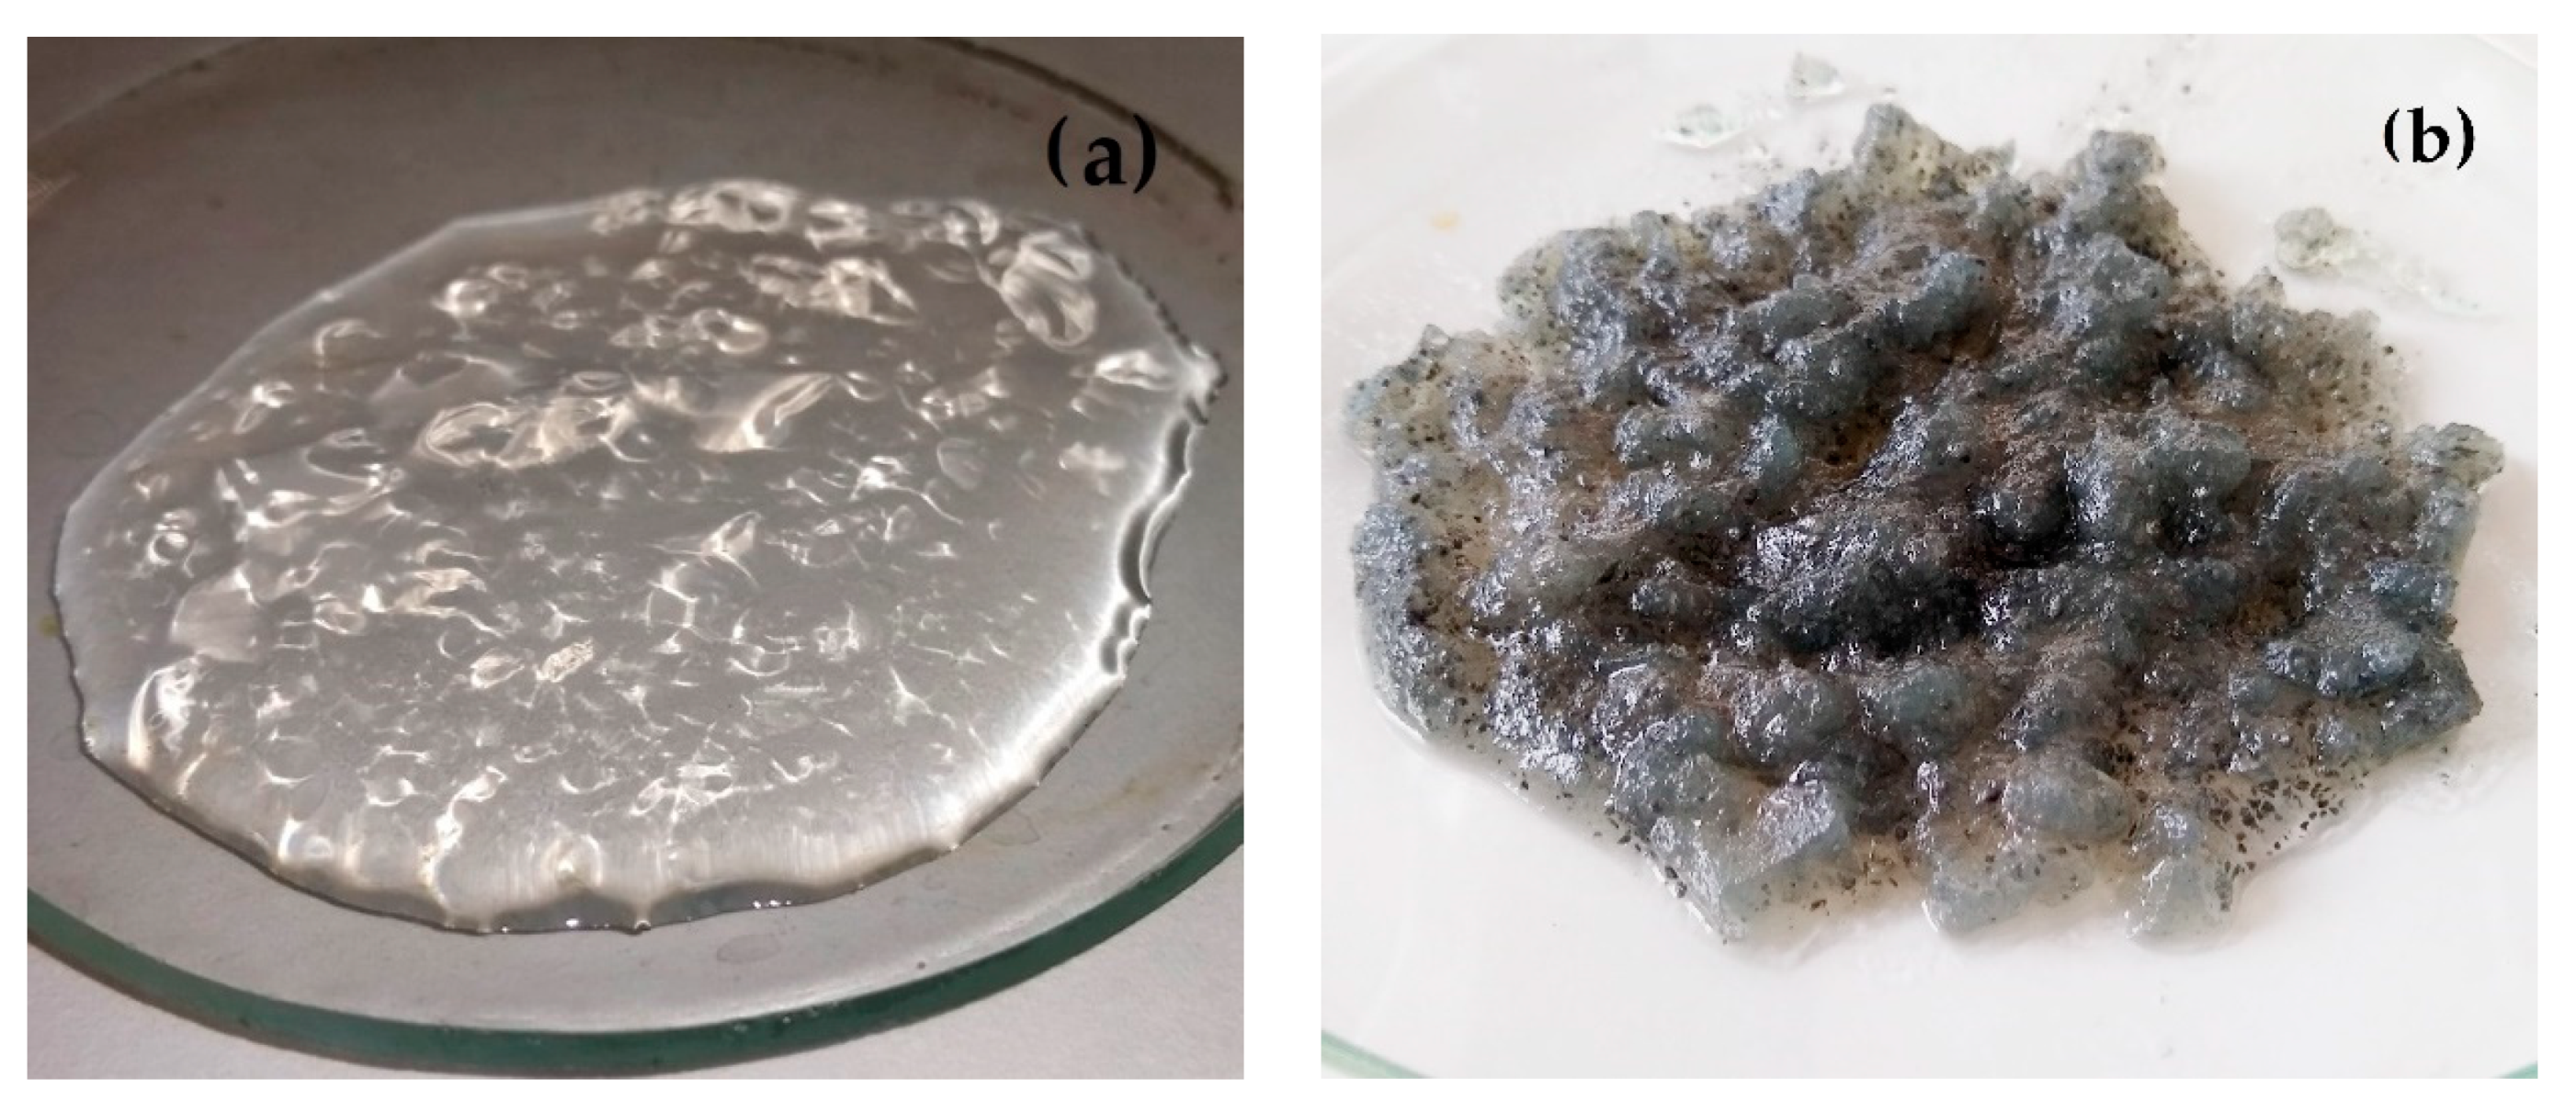
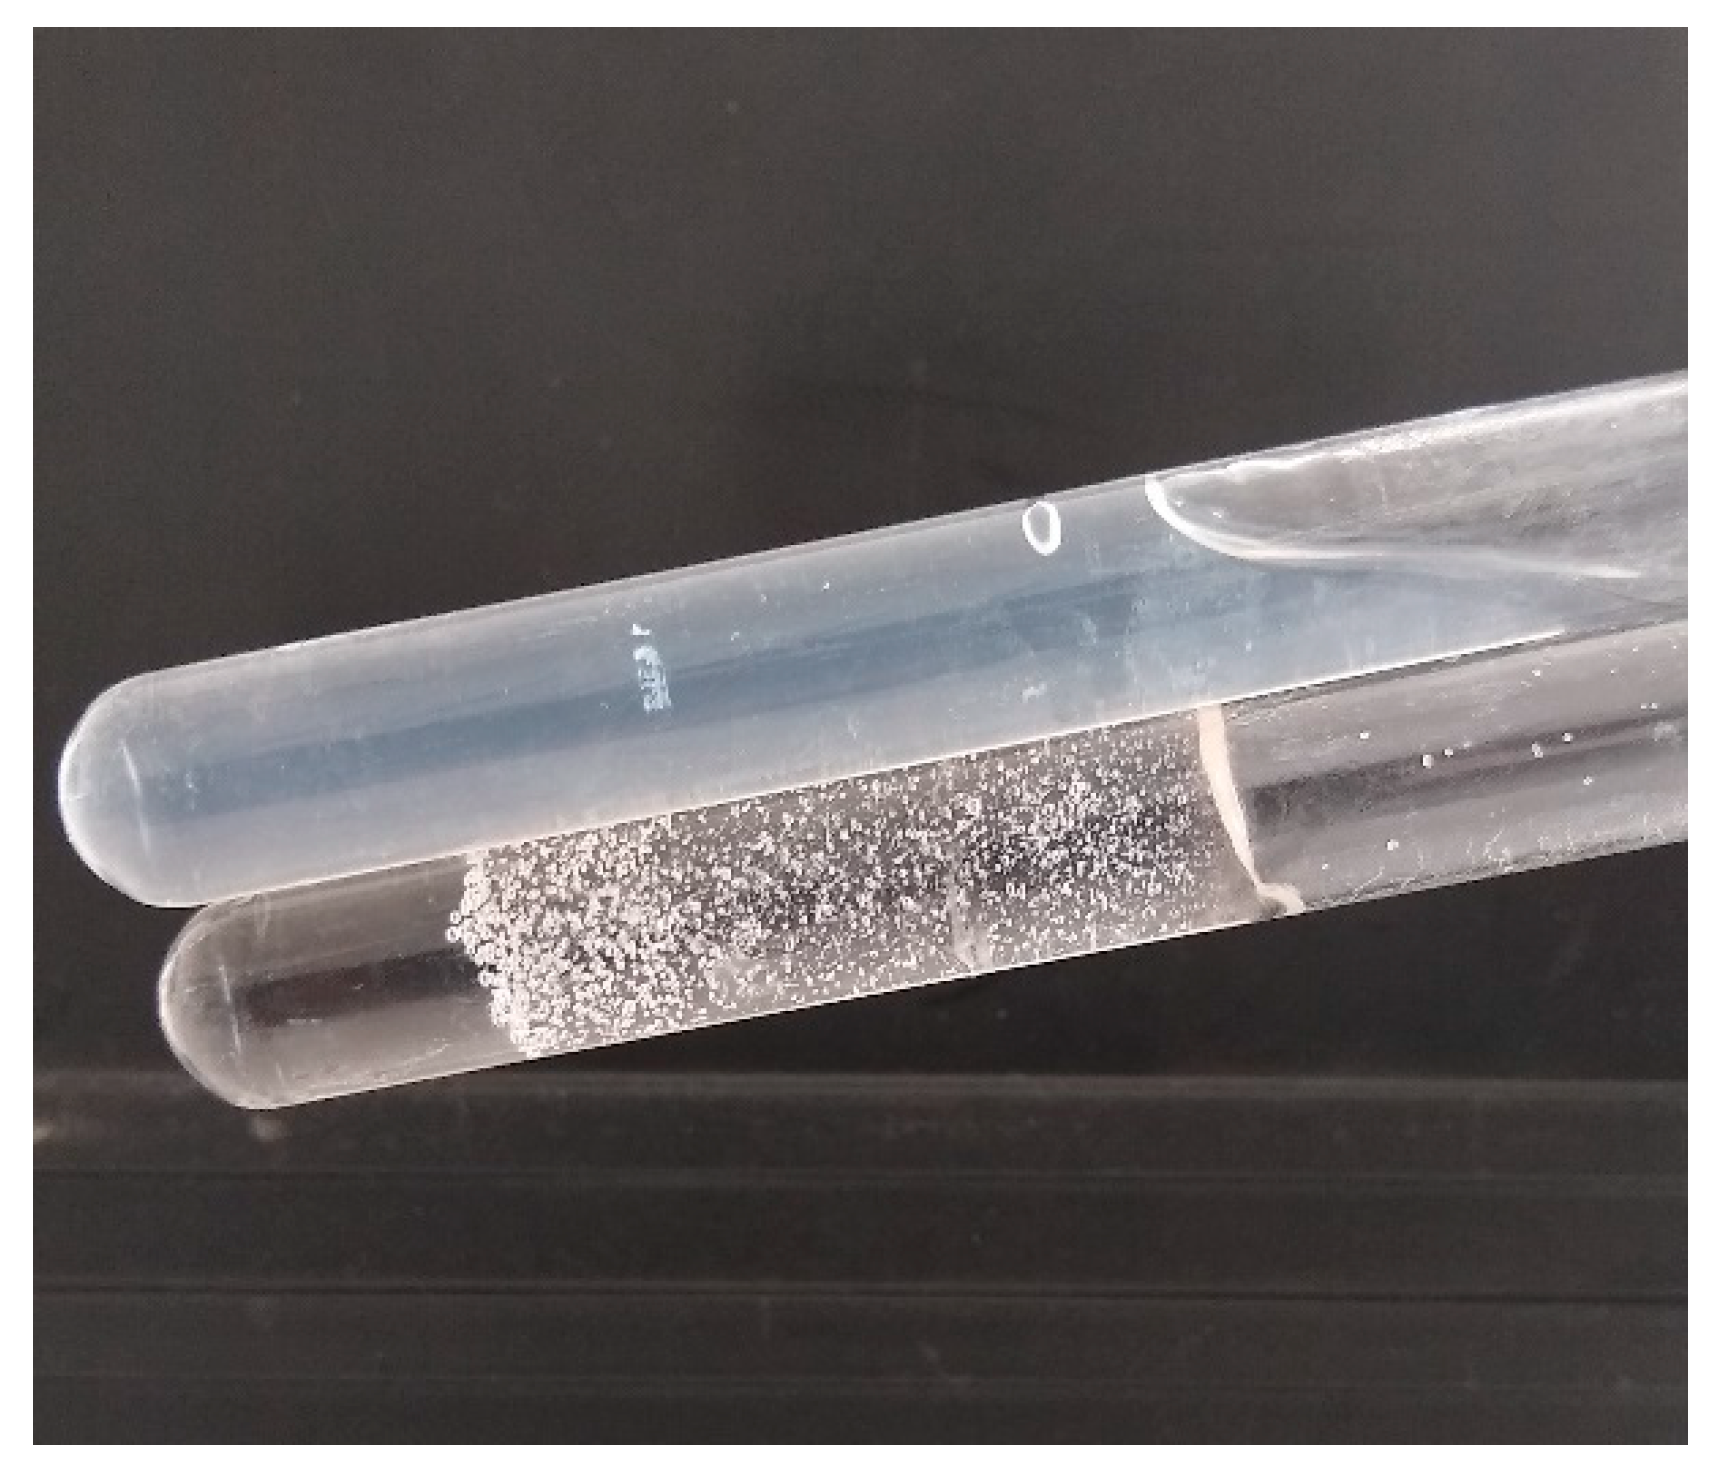
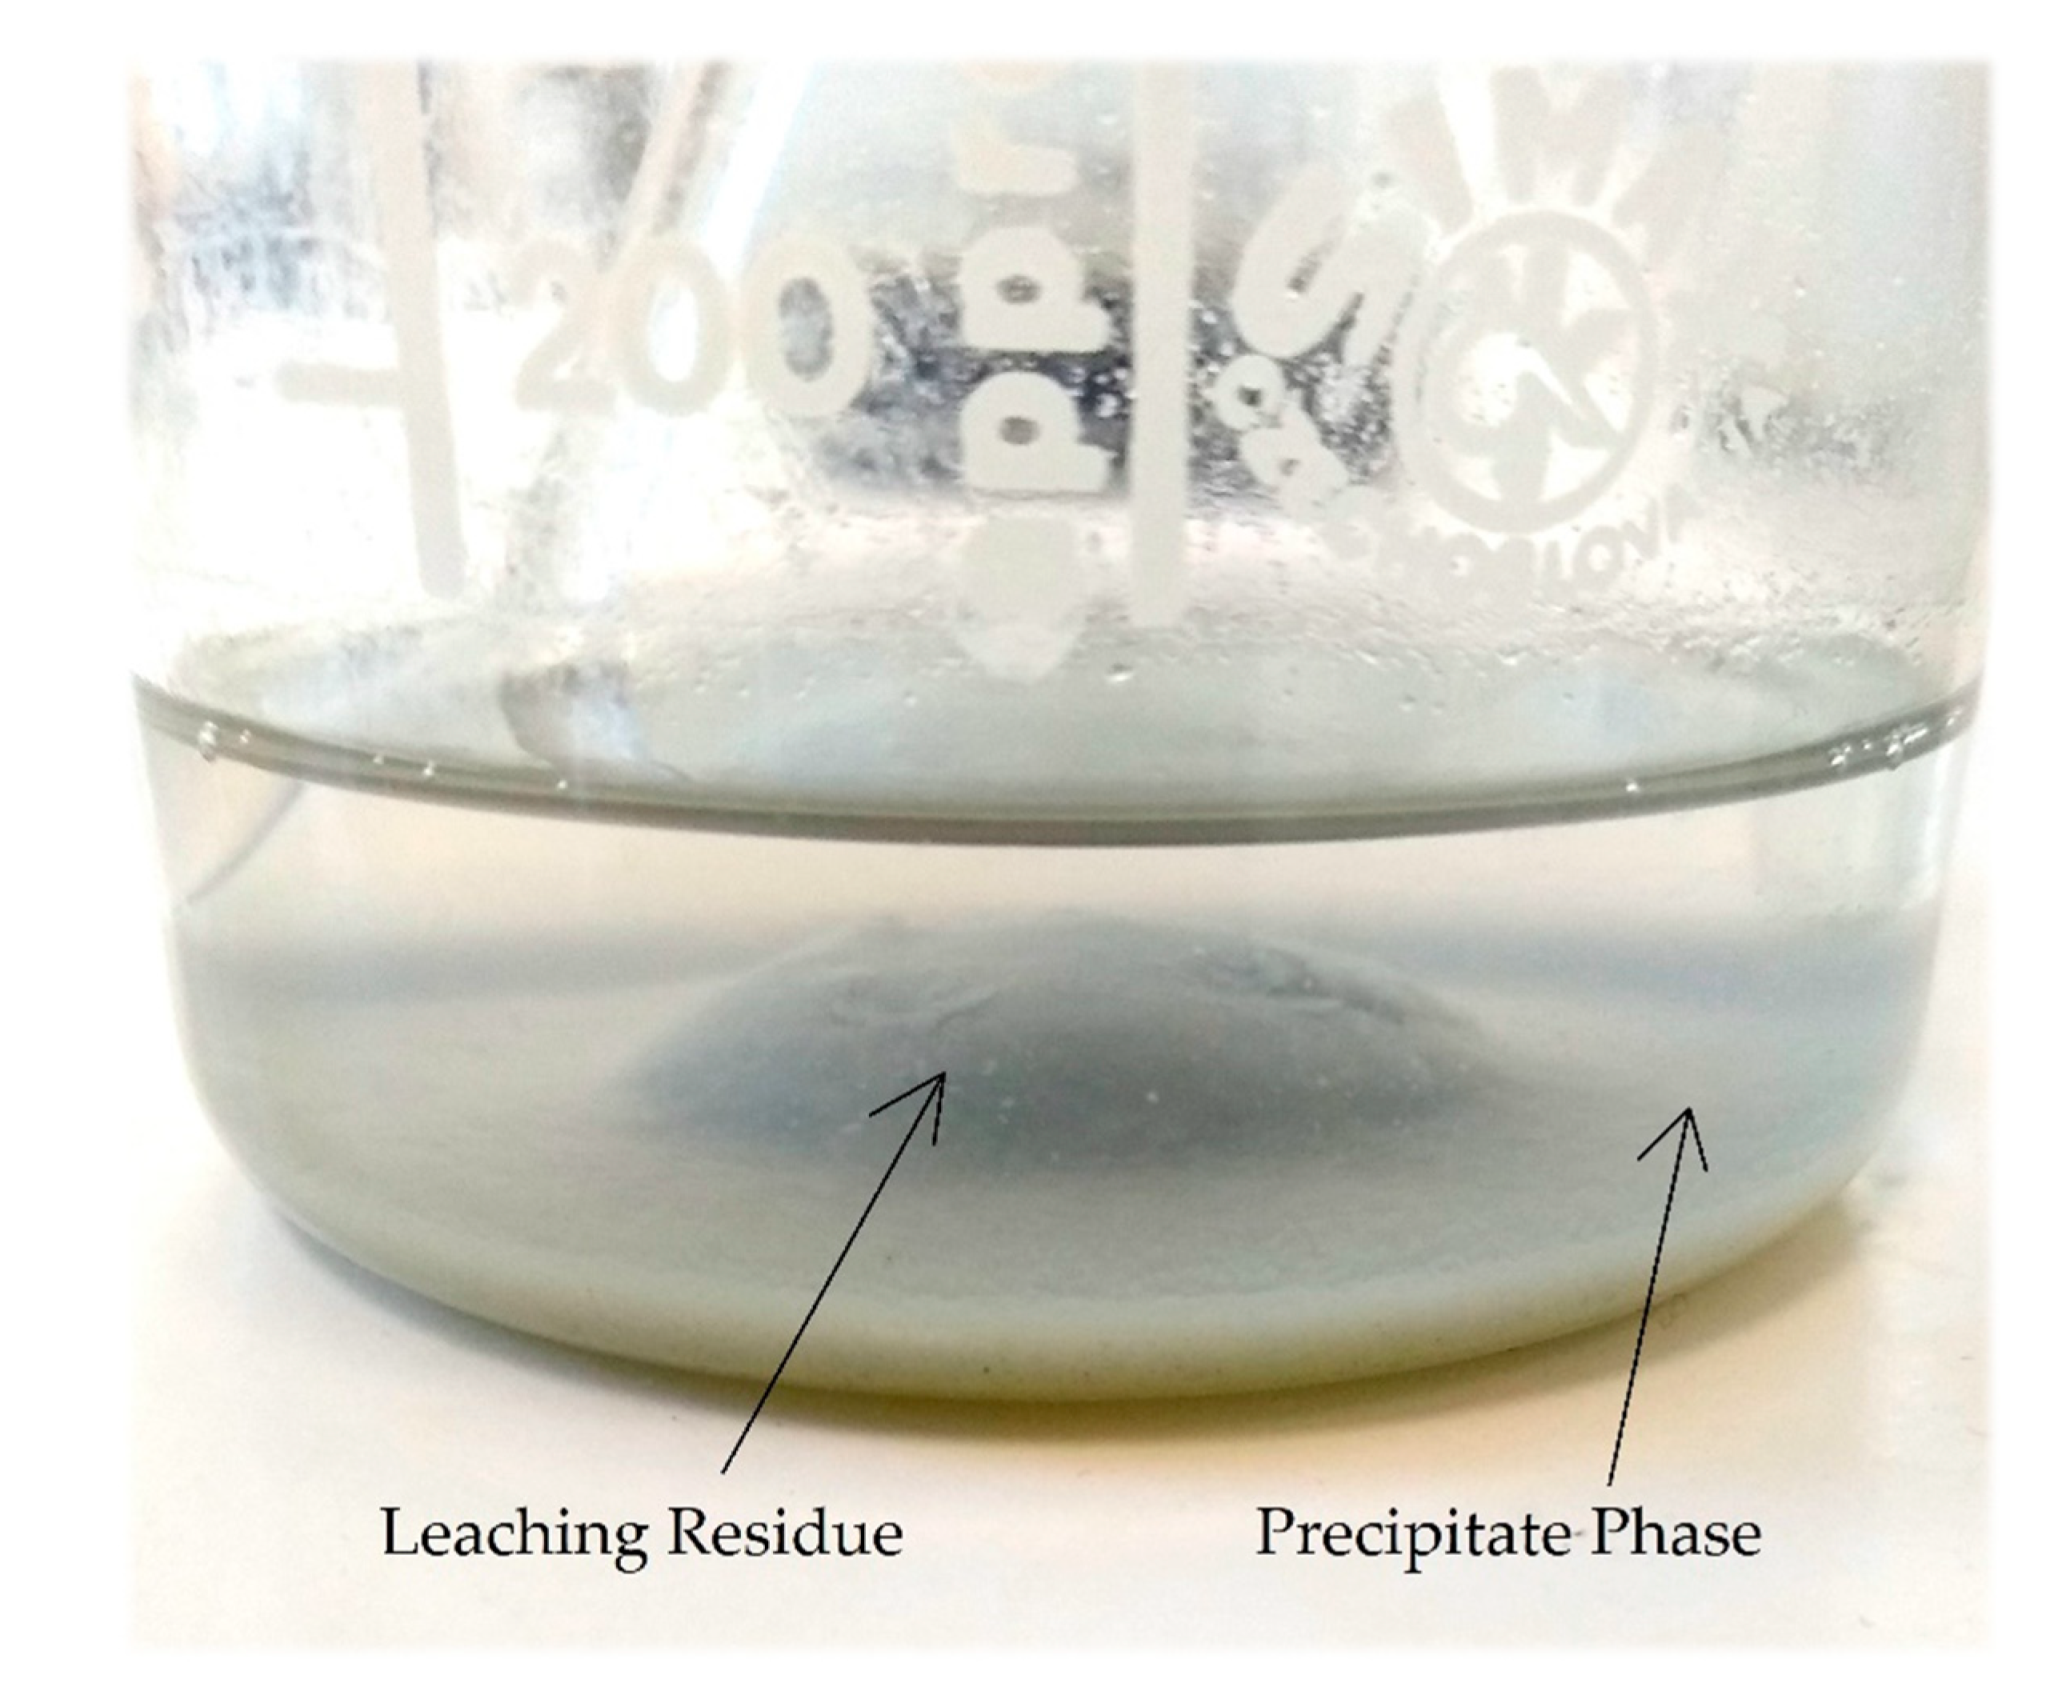
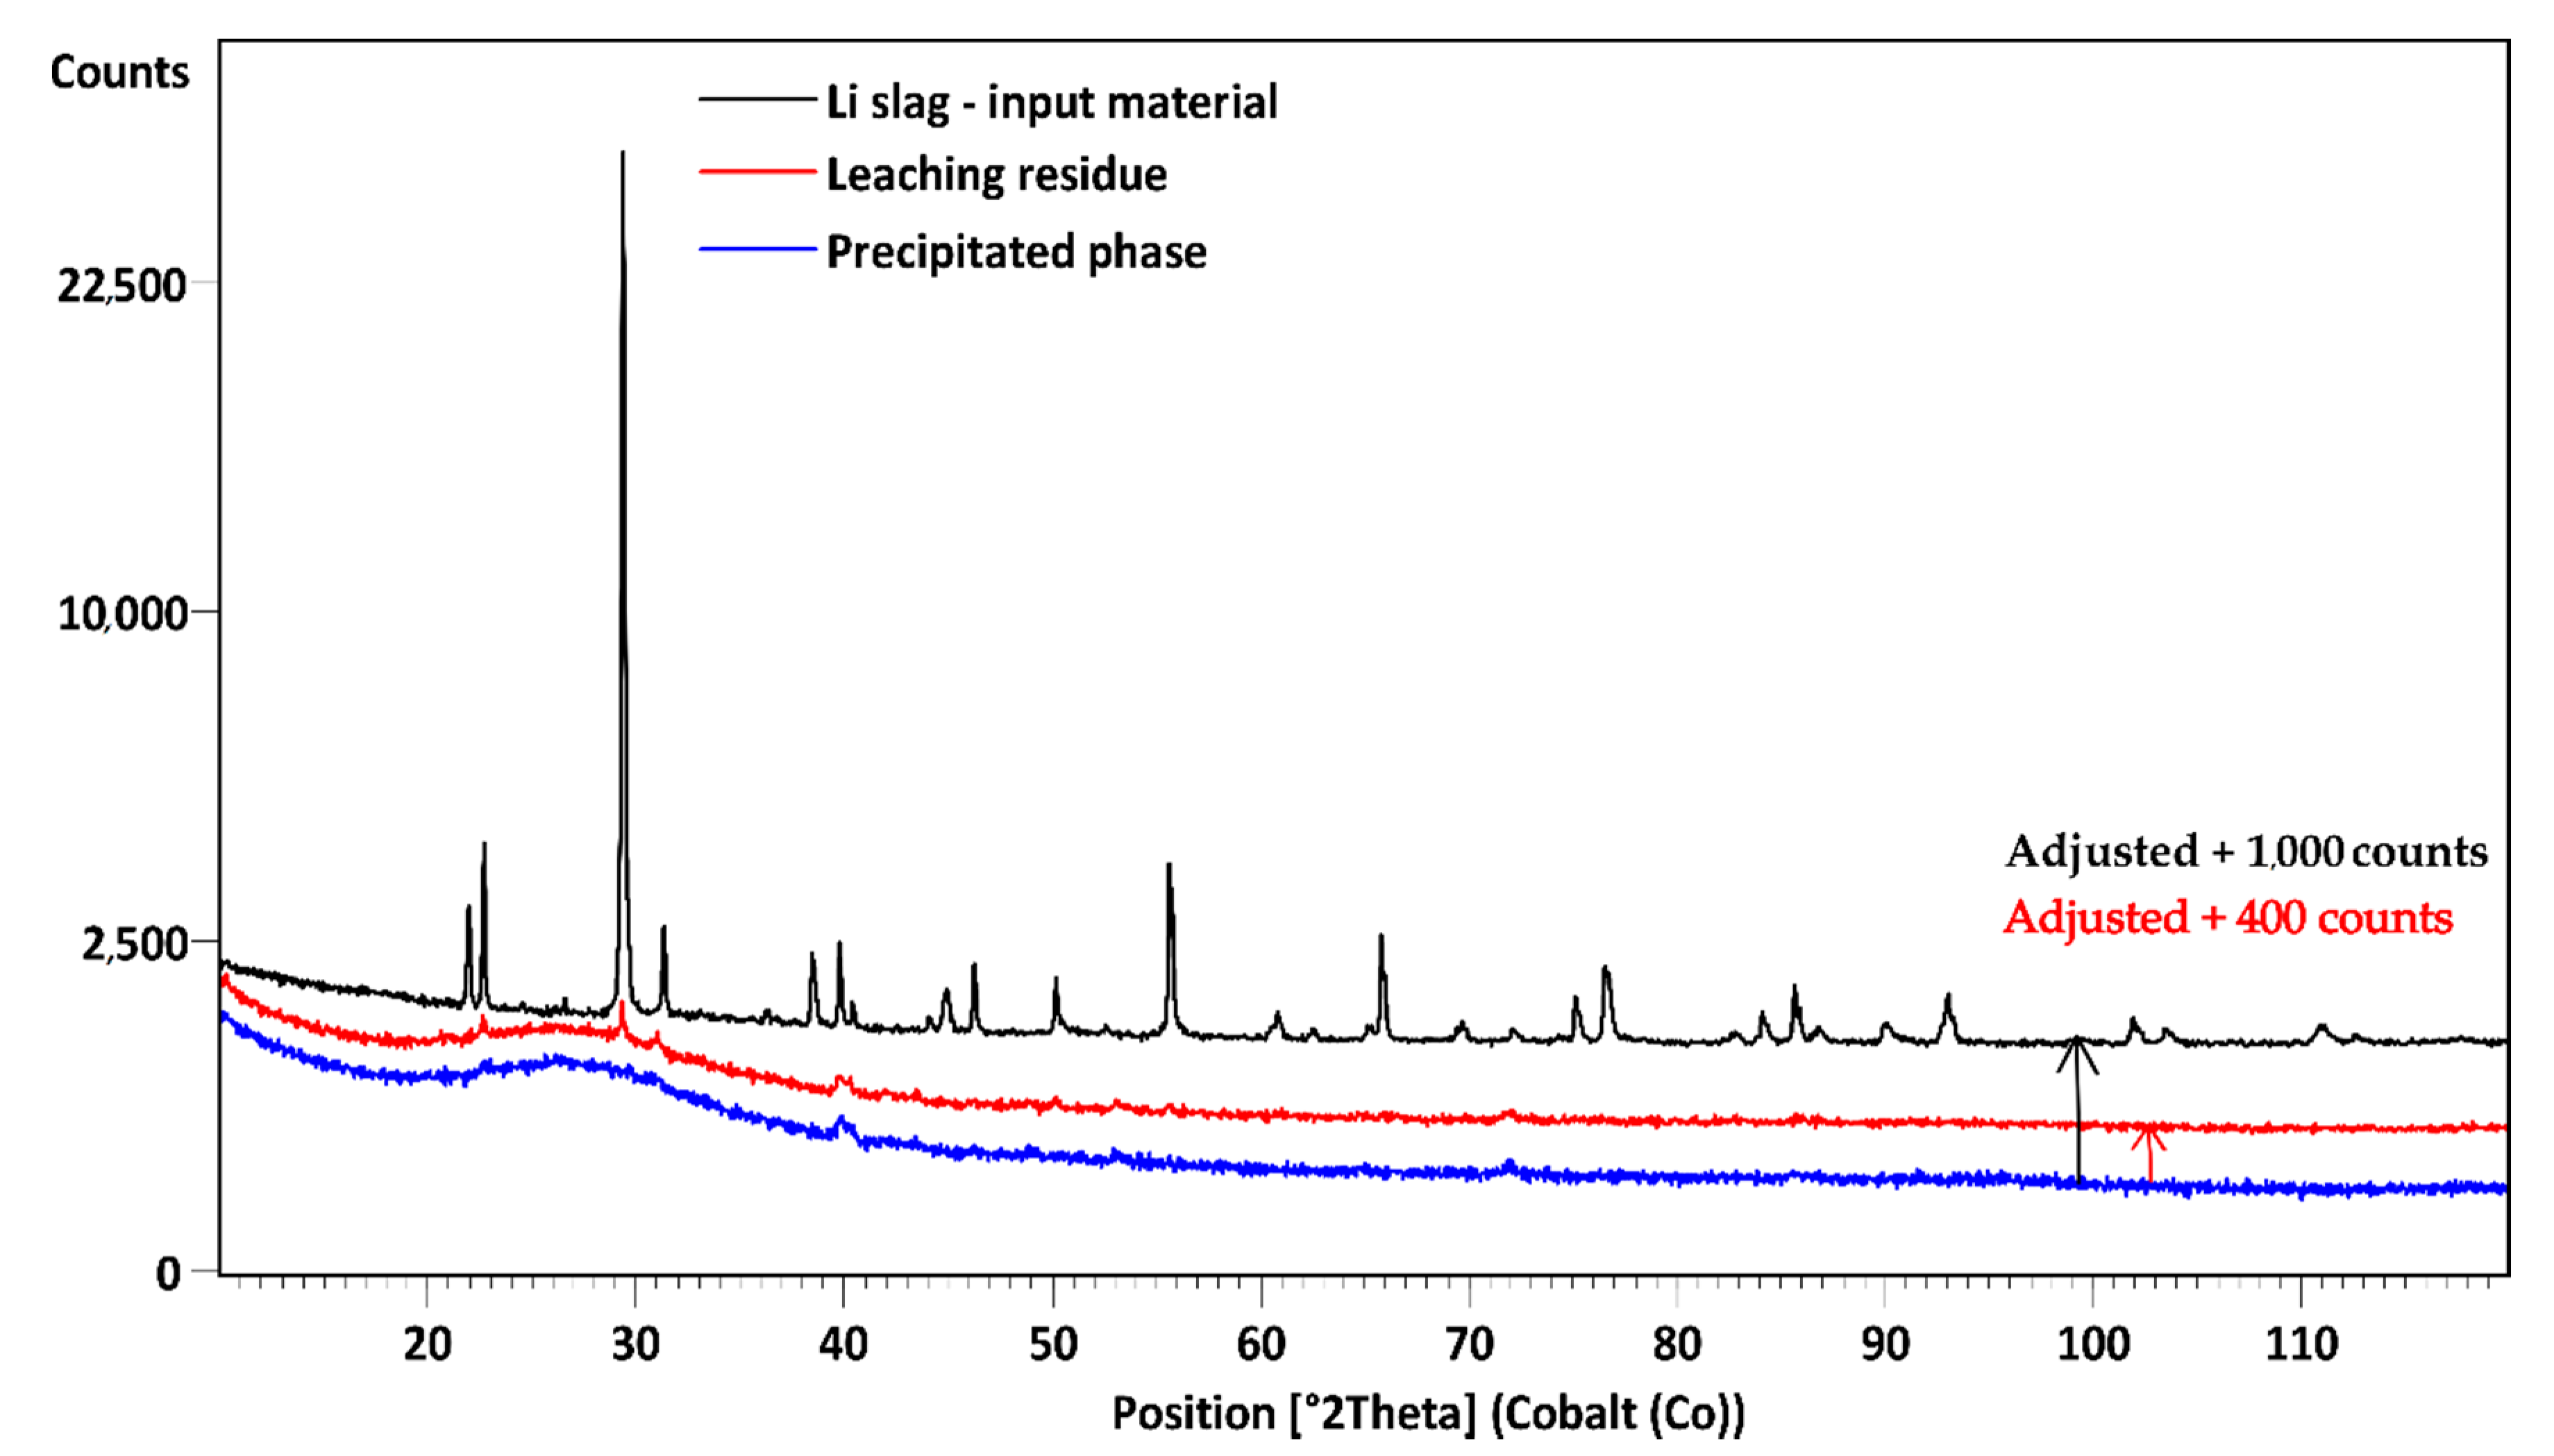
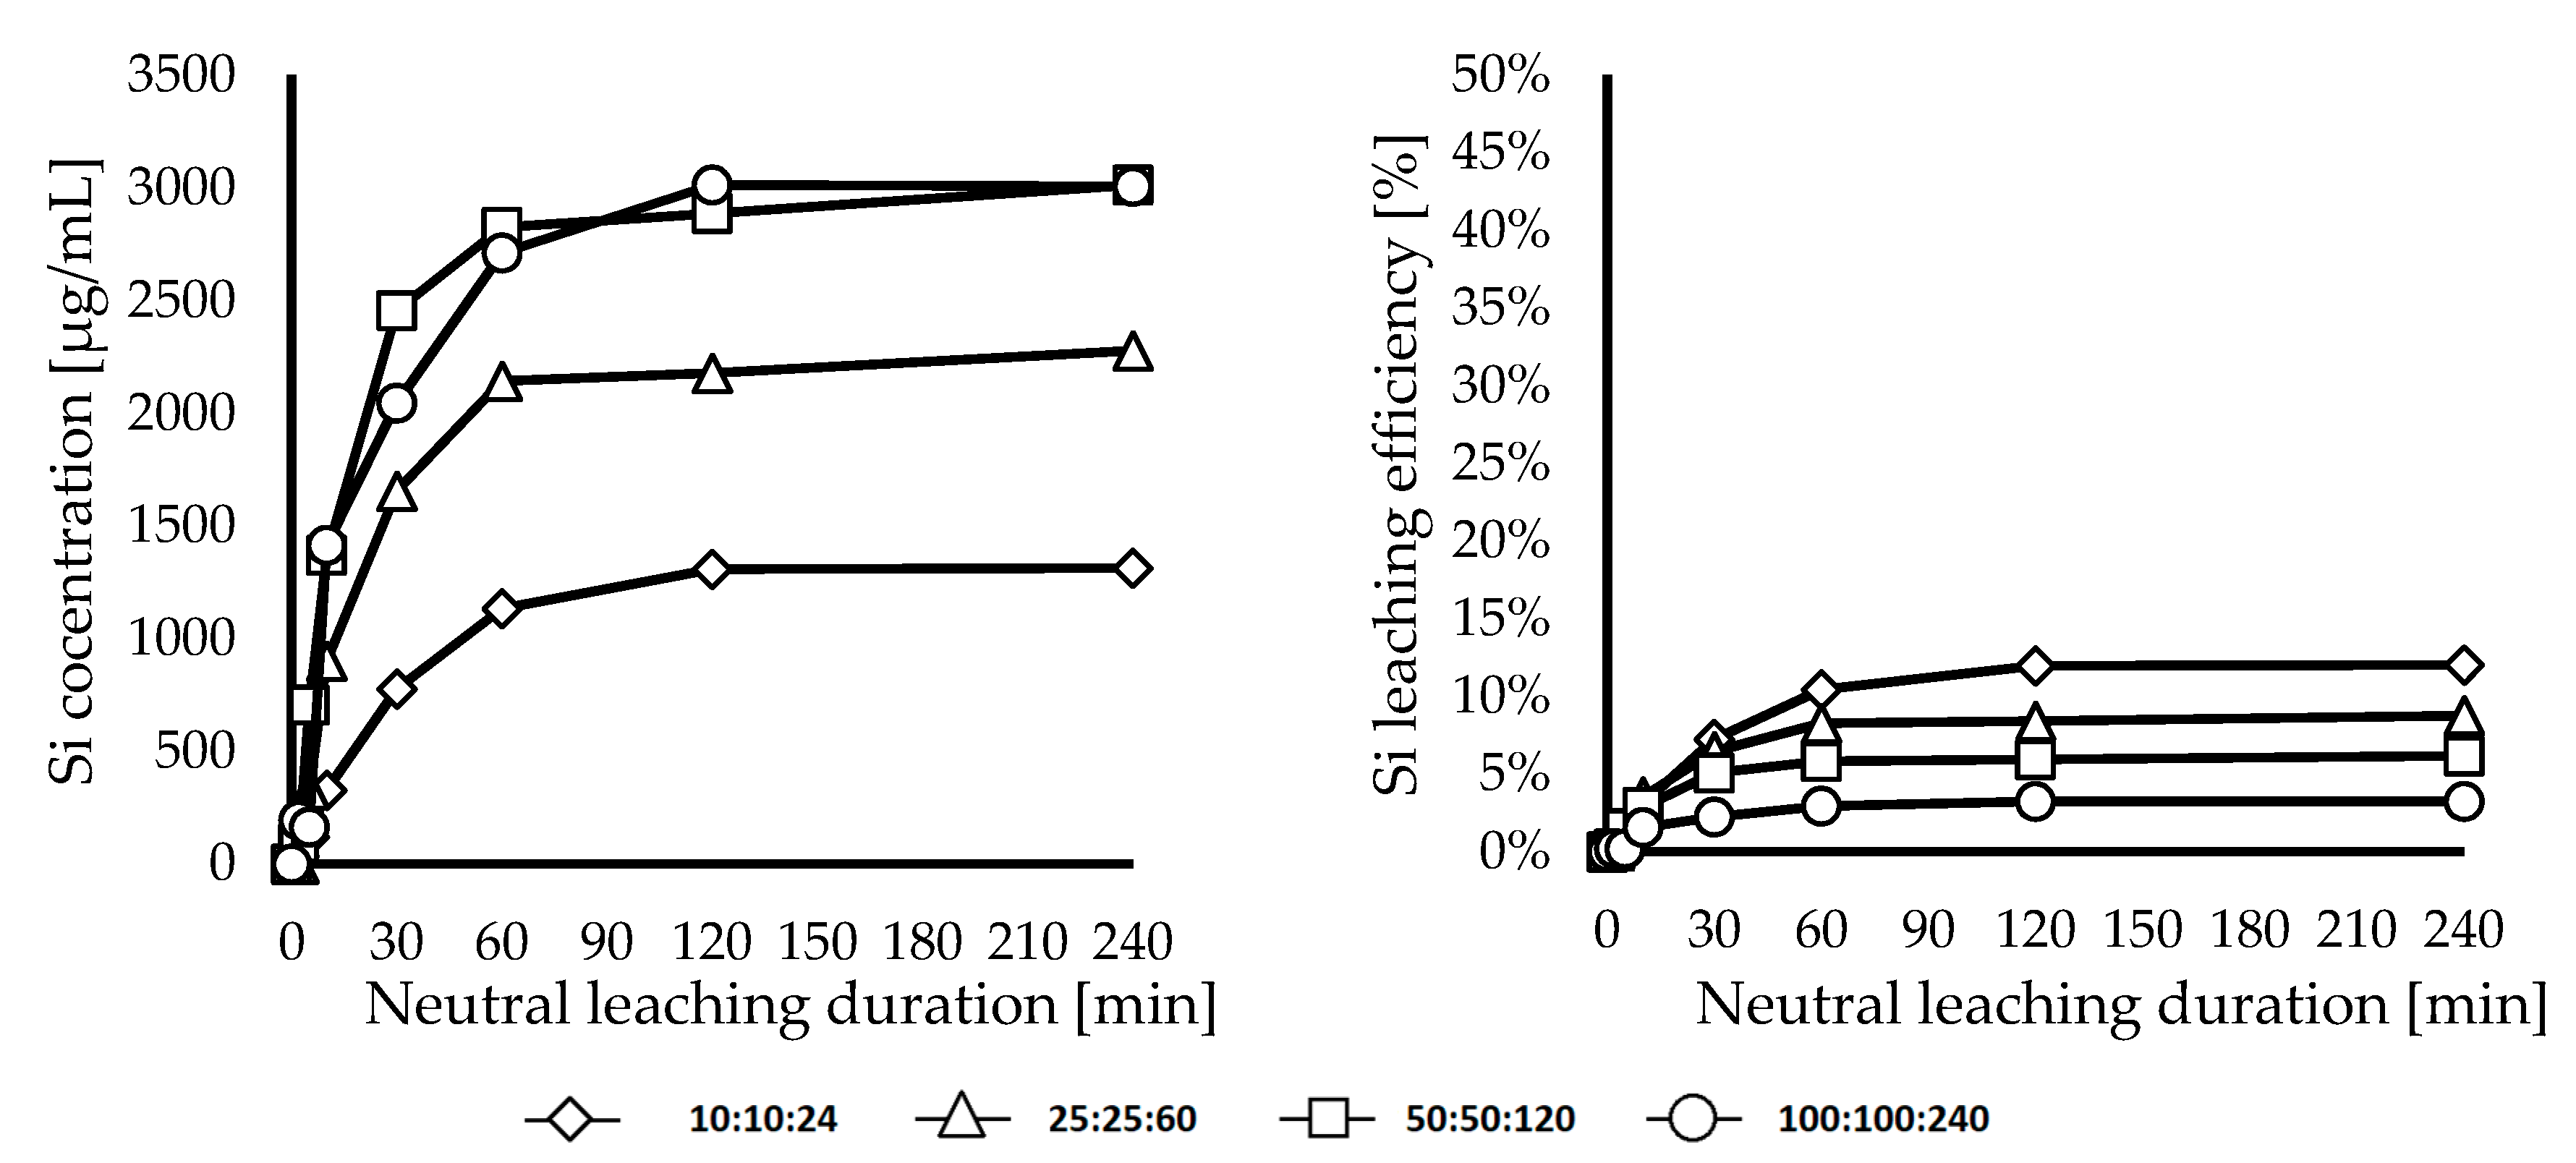
3.2. Investigation of the Silica Gel Formation

The results of Li slag leaching in H2SO4 confirmed that achieving high lithium leaching efficiency is possible, but the problem of conventional direct leaching is the high silicon leaching efficiency, which leads to the formation of gels. According to XRD phase analysis and stoichiometric calculations, 50% of the silicon in the Li slag is present in the Li2SiO3 and LiAlSiO4 phases and the remaining silicon, which was not detected by the XRD method, should be present in the amorphous SiO2 phase. The solubility of silicon oxide SiO2 (cr) is 10 µg/mL and the solubility of amorphous SiO2 (am) ranges from 100 µg/mL to 120 µg/mL [42]. However, the concentration of Si in the solutions after direct leaching of the Li slag reaches up to 6000 µg/mL. The low solubility of SiO2 and high silicon concentration in solutions close to 50% confirmed the theory that silicon is leached from LiAlSiO4 and Li2SiO3 phases only according to Equations (1) and (6) with high relative efficiency. Products of these reactions are lithium sulfates, aluminum sulfates, and orthosilicic acid (H4SiO4). A higher concentration of orthosilicic acid leads to oligomerization, according to Equations (9)–(11) [43].
H4SiO4(a) + H4SiO4(a) = H6Si2O7(a)+ H2O(l)
H4SiO4(a) + H6Si2O7(a) = H8Si3O10(a) + H2O(l)
H4SiO4(a) + H8Si3O10(a) = H10Si4O12(a) + H2O(l)
Chemically bound water is gradually separated from orthosilicic acid by oligomerization, causing formation of gels. Under some leaching conditions on a small laboratory scale, it is possible to filter the solution and leaching residue from each other before the gels are formed. The gel-like solution formed after filtration is shown in Figure 13a. Gel formation can significantly complicate the whole process of recycling Li slag on an industrial scale, especially if a continuous leaching process is used or if the gels are formed in a batch process before the solid residues are filtered off. The separation of solid residues entrapped in the gels (Figure 13b) is impossible without additional technological operations, which can affect economic and environmental aspects of the whole recycling process.
The presence of gel-like aggregates in solutions obtained by direct Li slag leaching with high silicon concentration (6000 µg/mL) and low pH (~0) was observed immediately after the leaching was completed. According to Icopini et al. [43], gel formation occurrence is dependent on pH and on the concentration of silicon in the solutions. Therefore, the gel formation was monitored for two months after the leaching experiments. With decreasing silicon concentration in the solution and increasing pH at the end of the experiments, gel formation slowed to a duration of four weeks. No gel presence was observed in the solutions with a Si concentration lower than 1000 µg/mL or solutions with a pH higher than 0.75. The addition of concentrated H2SO4 to a solution with a silicon concentration above the threshold limit of 1000 µg/mL resulted in the rapid gel formation (Figure 14). pH adjustment of gel-like solutions to values above the limit of 0.75 does not cause fast gels dissolution, which means that the mechanism of gel formation is not reversible and it is not possible to eliminate the problem of gelation by this method.

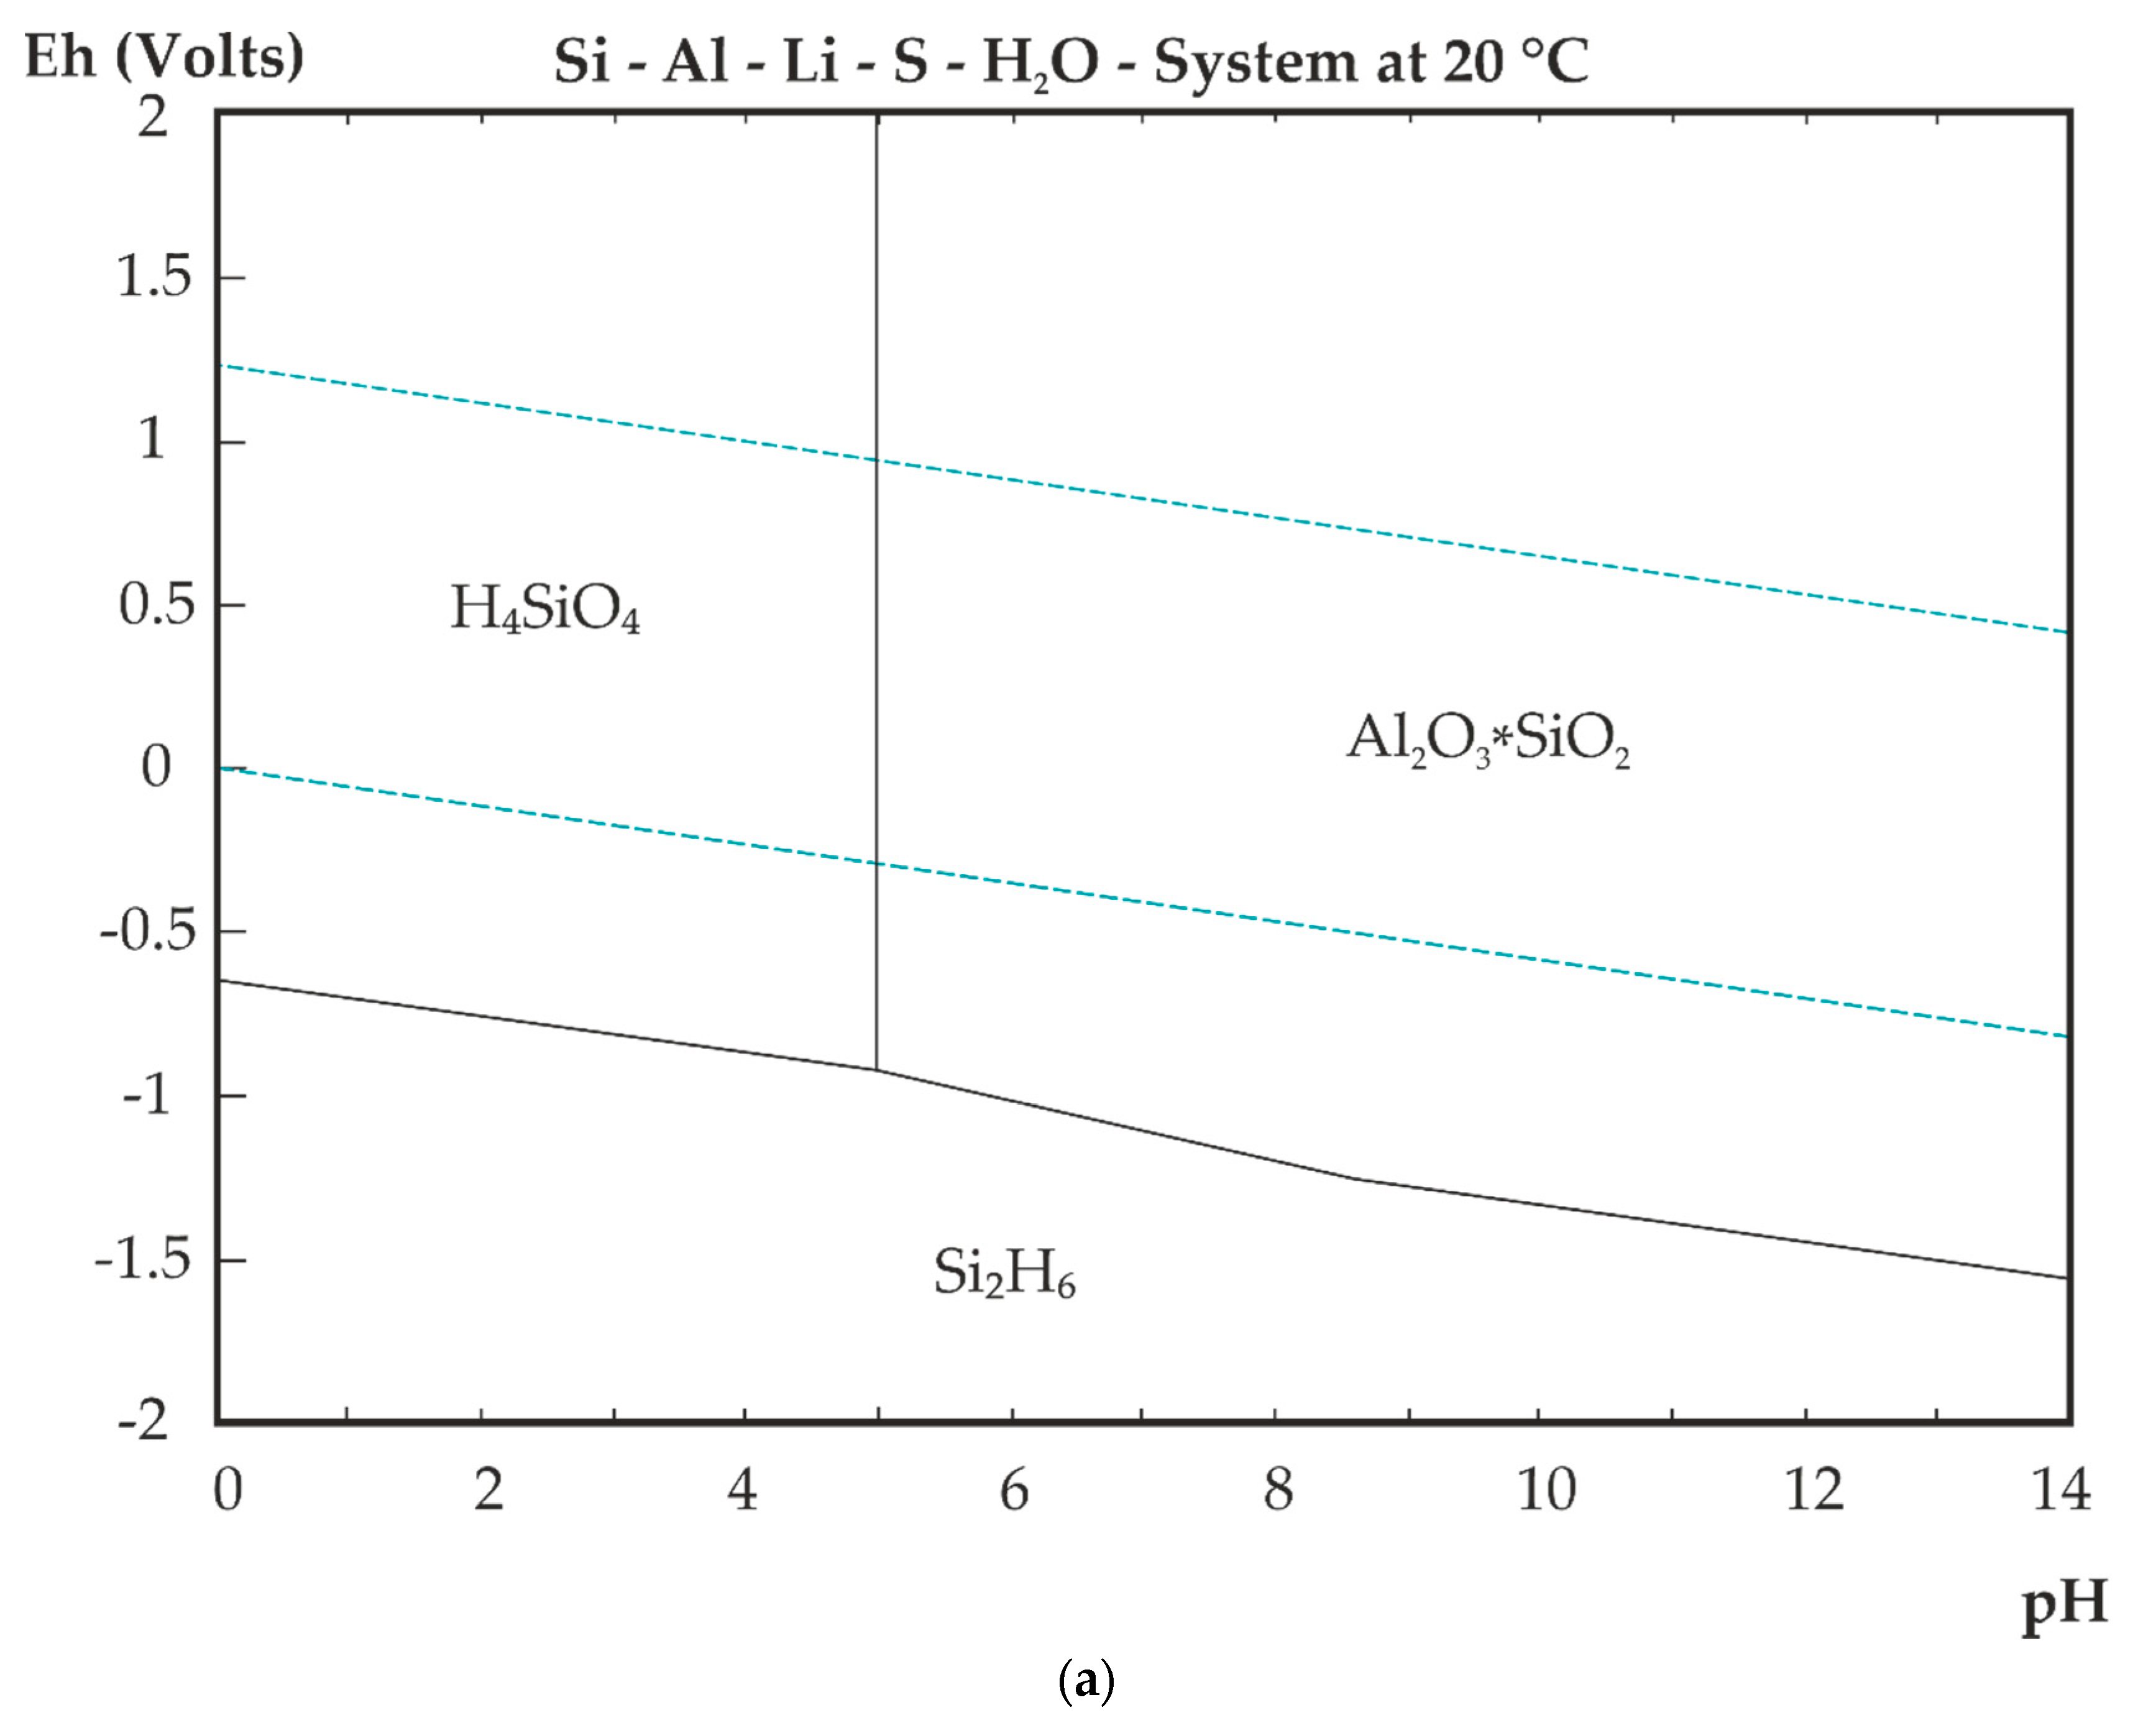
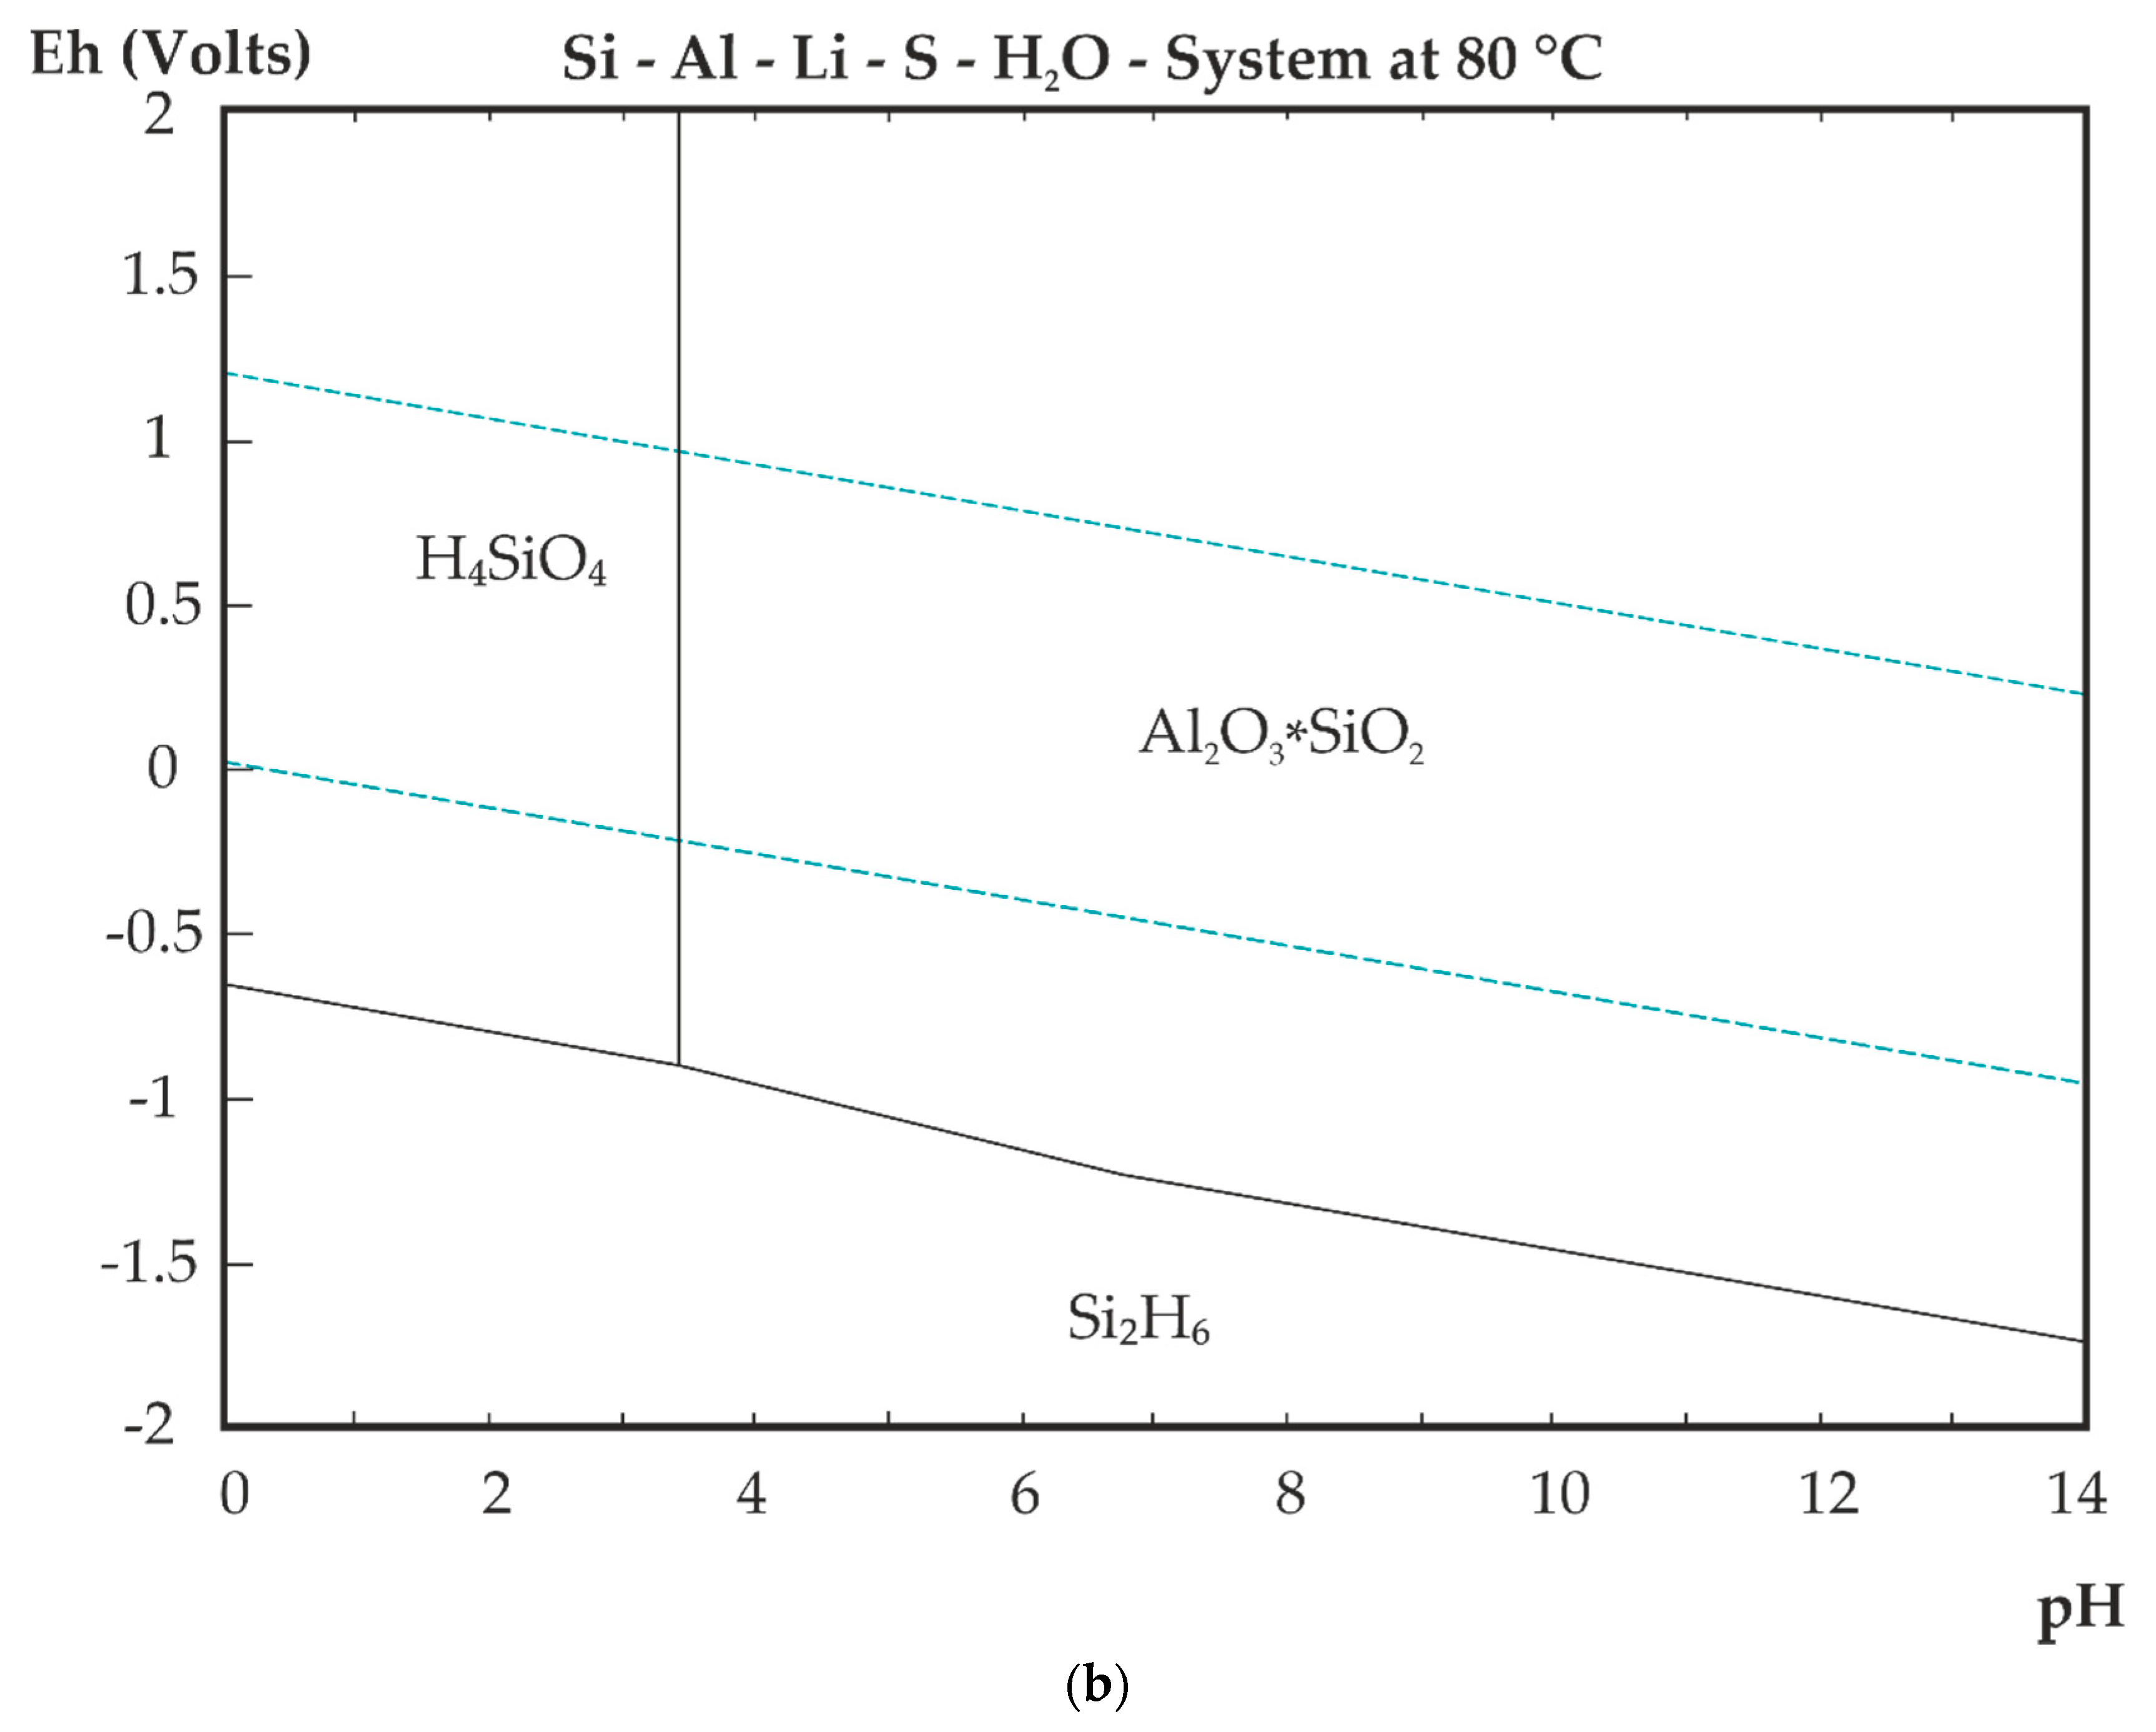
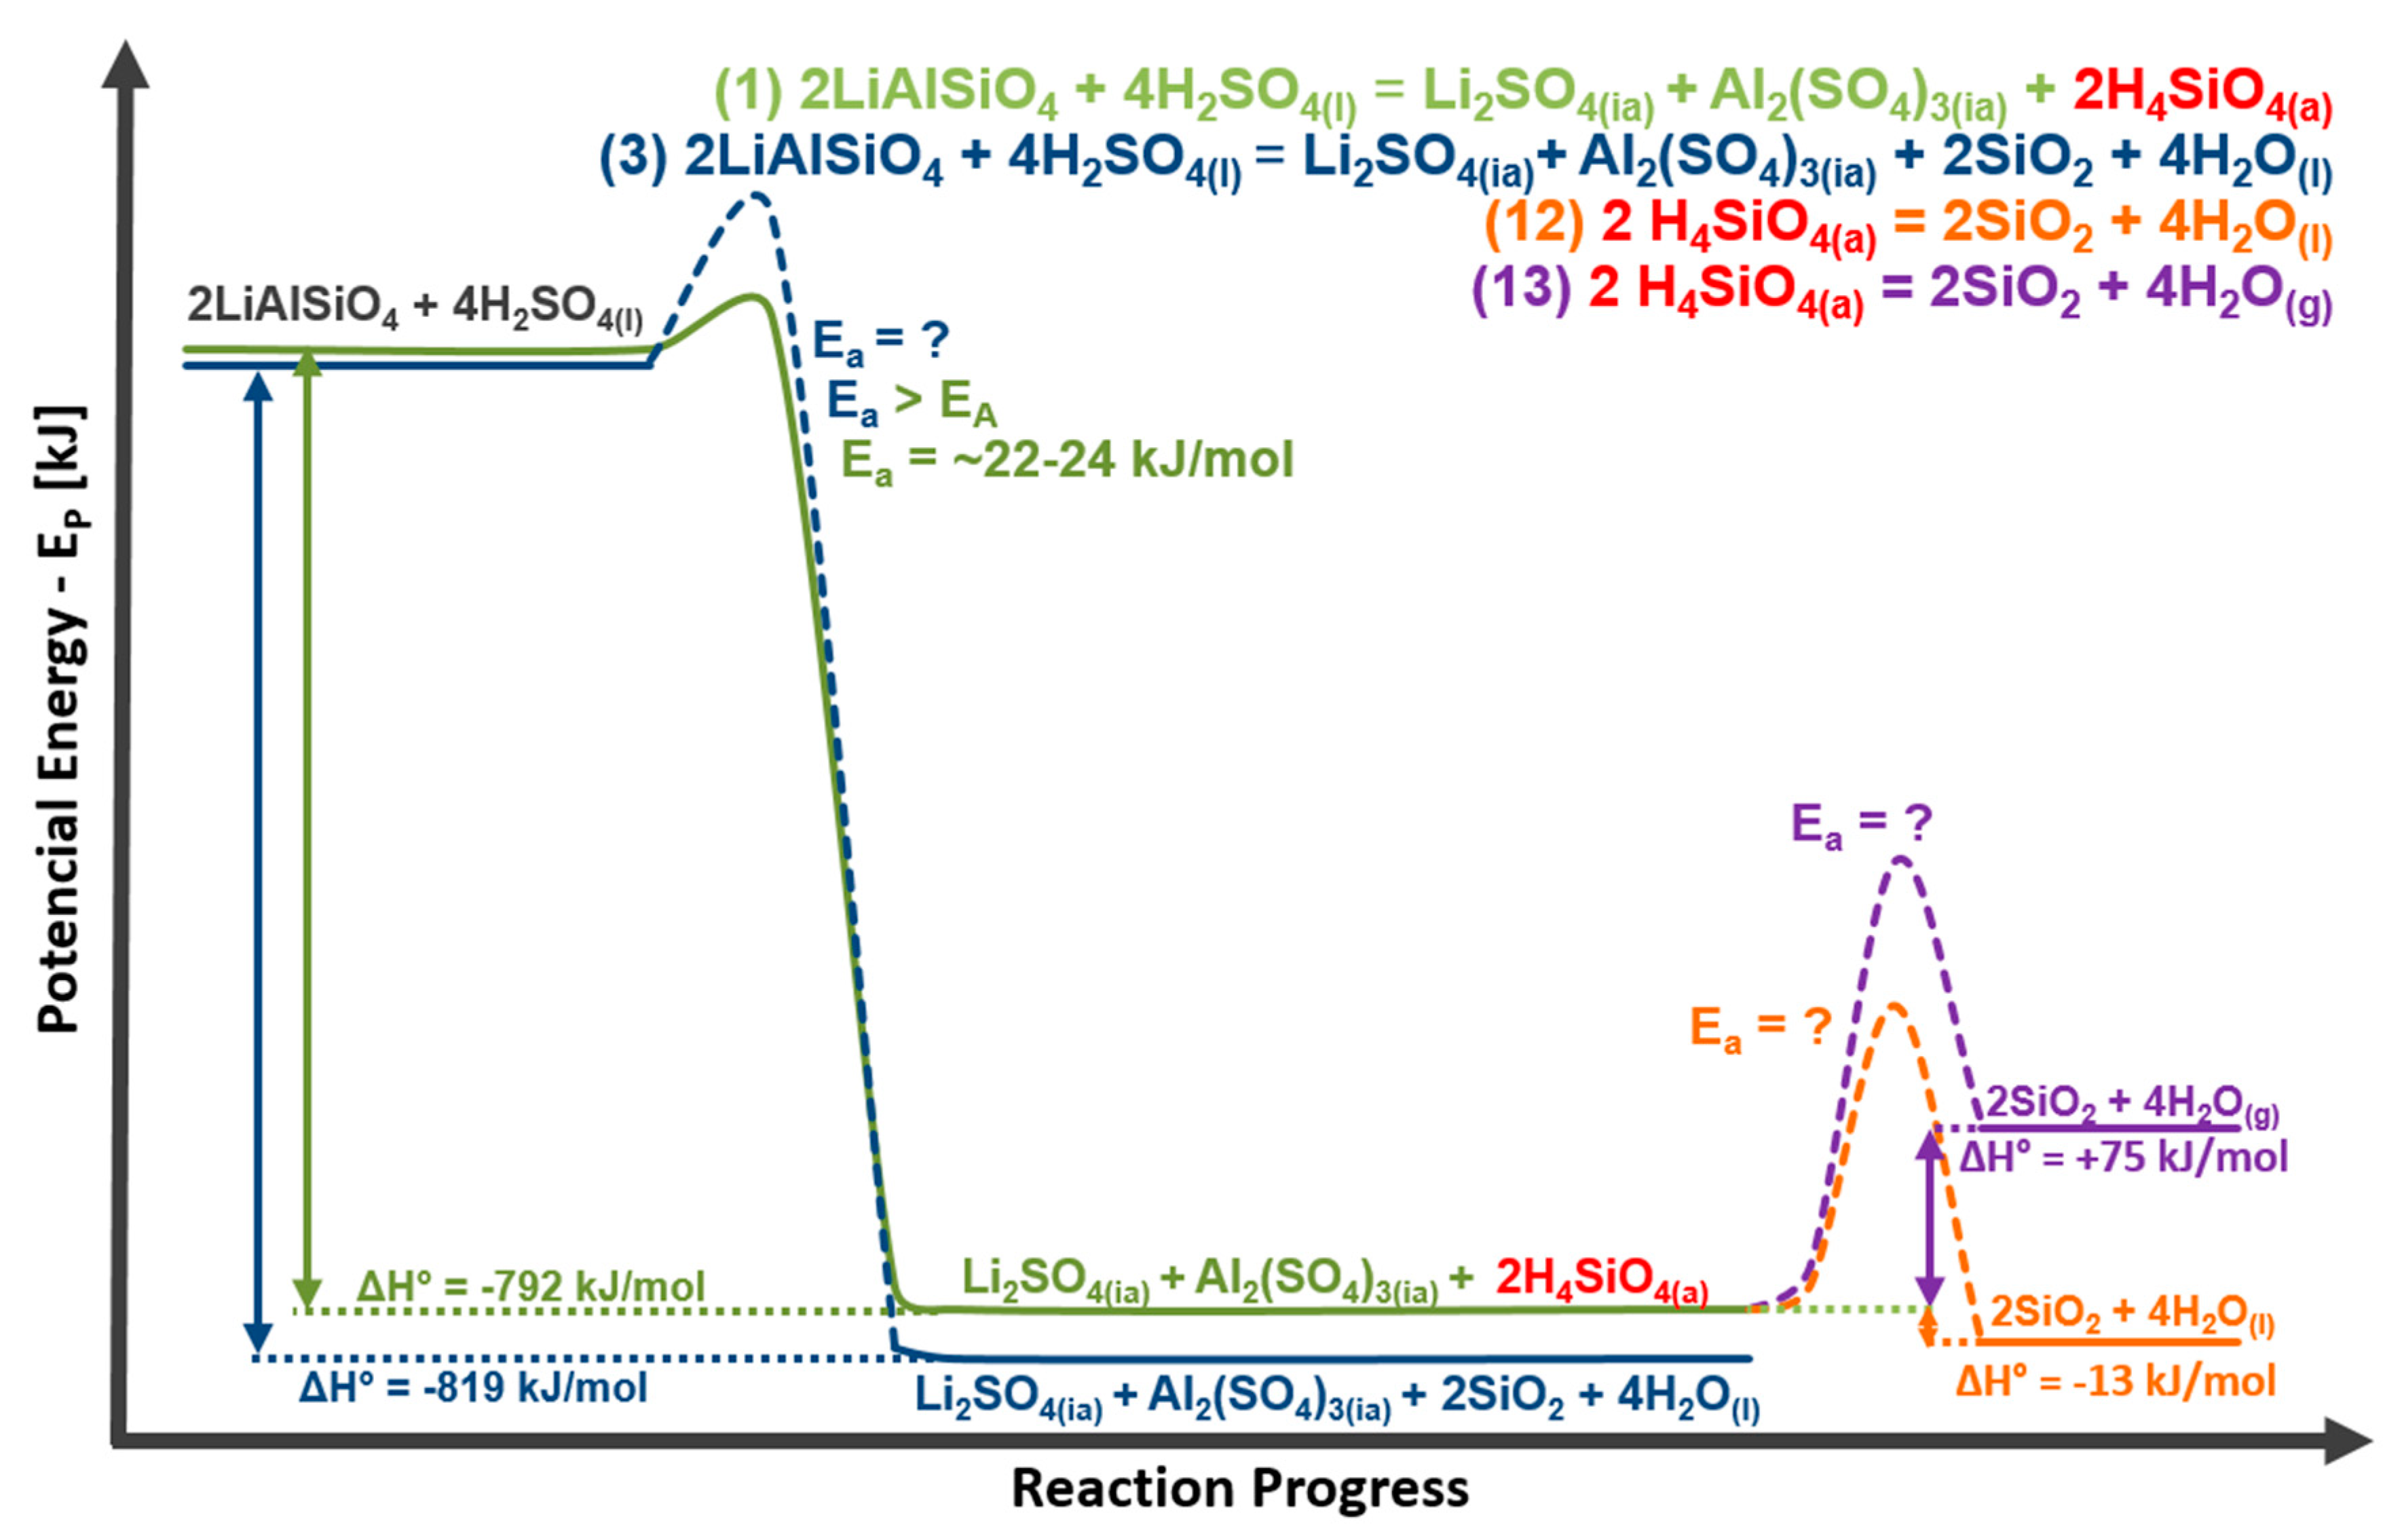
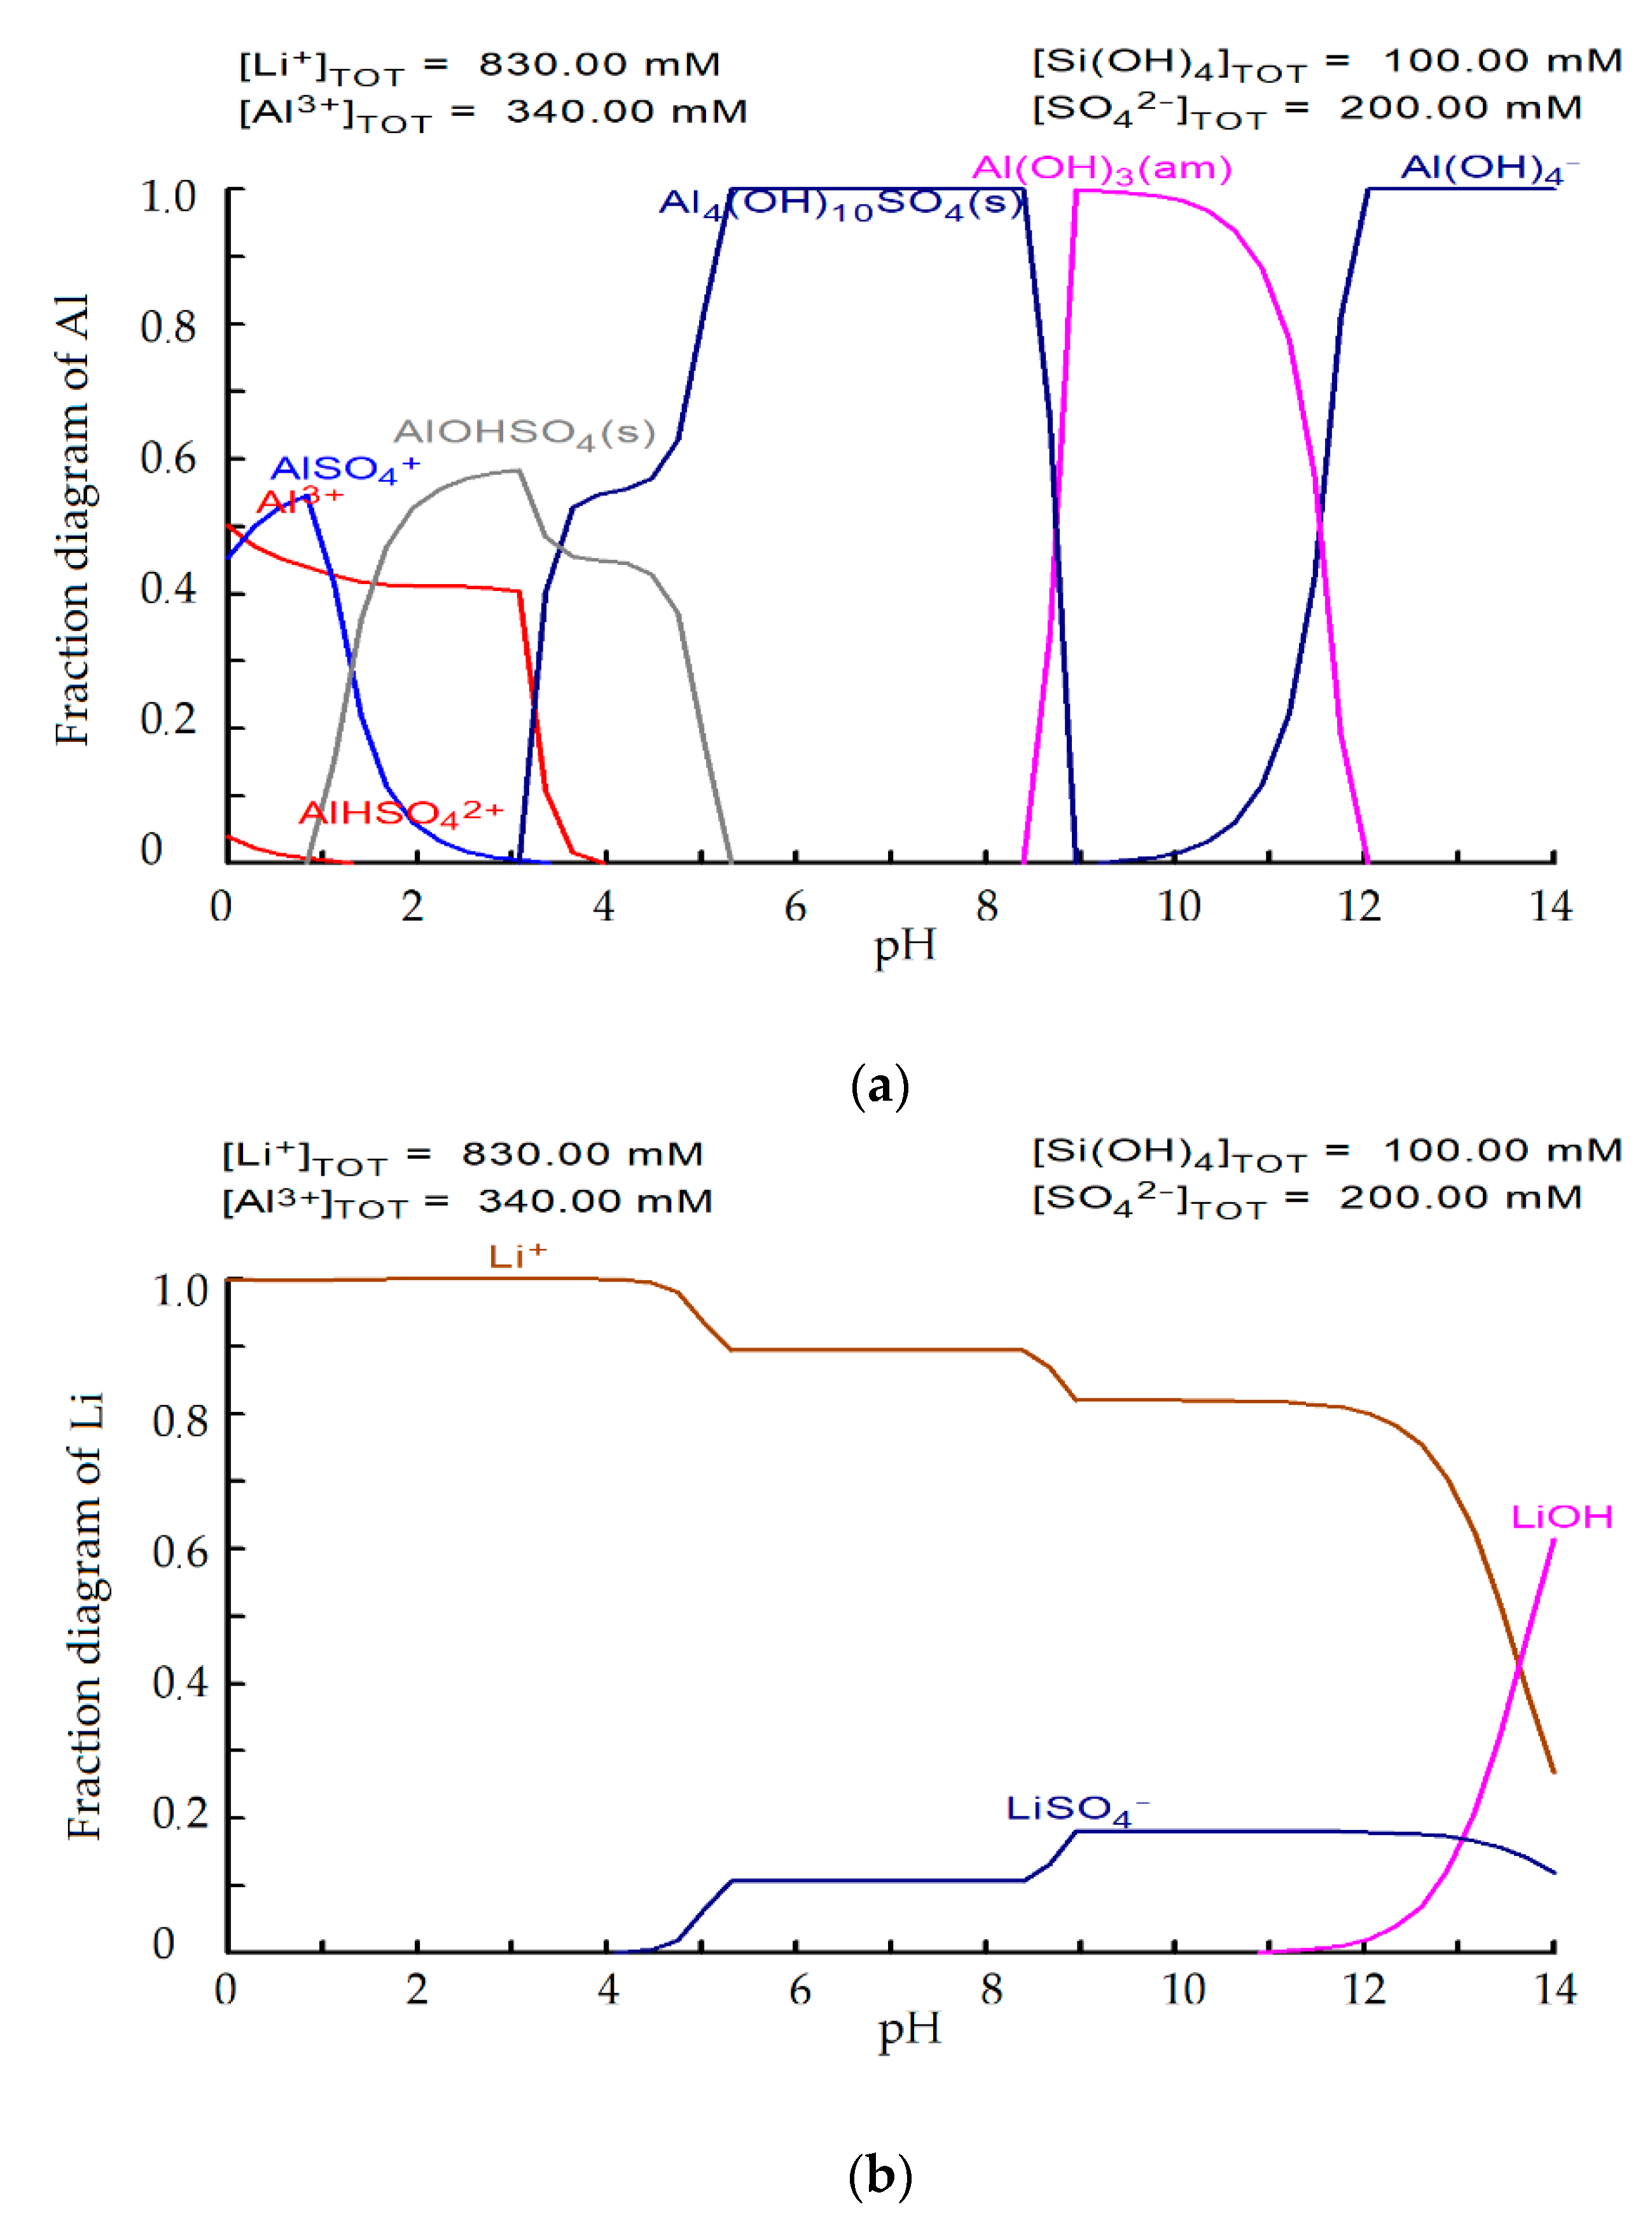
3.3. Suppression of Gel Formation—Thermodynamic Analysis

High concentration of silicon in the solutions confirmed, that leaching of the Li slag takes place according to Equations (1) and (6), where H4SiO4 is produced. The calculated apparent activation energy of this ongoing reaction is 22–24 kJ/mol. In addition to this reaction, it should be also possible to precipitate SiO2 out of solution directly, or precipitate SiO2 from already produced H4SiO4. Precipitation of SiO2 could be a solution to gel-free leaching. Thermodynamic values for direct precipitation of SiO2 are listed in Table 3. Reactions of SiO2 precipitation from H4SiO4 and their ΔH° and ΔG° values are shown in Table 5.
Figure 15 shows a potential energy diagram of LiAlSiO4 leaching according to the Equations (1), (3), (12) and (13). The diagram shows only the reaction path of the LiAlSiO4 with the focus on silicon phase, but a similar principle can be applied for leaching of the Li2SiO3 phase as well.
Thermodynamic analysis shows, that reaction (3) is thermodynamically favorable, but high Si concentration in the solution confirms that the leaching takes place according to reaction (1). After leaching, it was not possible to observe a decrease in the concentration of silicon in the solution, from which it can be concluded that reactions (12) and (13) do not proceed despite the fact that their ΔG° values are negative. One of the possible reasons why SiO2 does not precipitate out from solutions may be the fact, that Ea of reactions (3), (12) and (13) were not reached. Specific values of these activation energies cannot be determined experimentally due to the fact that these reactions do not take place during direct leaching. Therefore, these values are marked in Figure 15 as unknown with dashed lines. Part of the energy generated by the exothermic direct leaching, according to reaction (1), could be sufficient to overcome the activation energy of reaction (12) or even (13), but this direct leaching takes place at high S:L ratios equal 1:50 and the heat generated is thus consumed for heating of a large volume of leach solution. More energy must be supplied to the leaching system in next experiments to overcome Ea of the reactions in which SiO2 precipitates out of the solution.

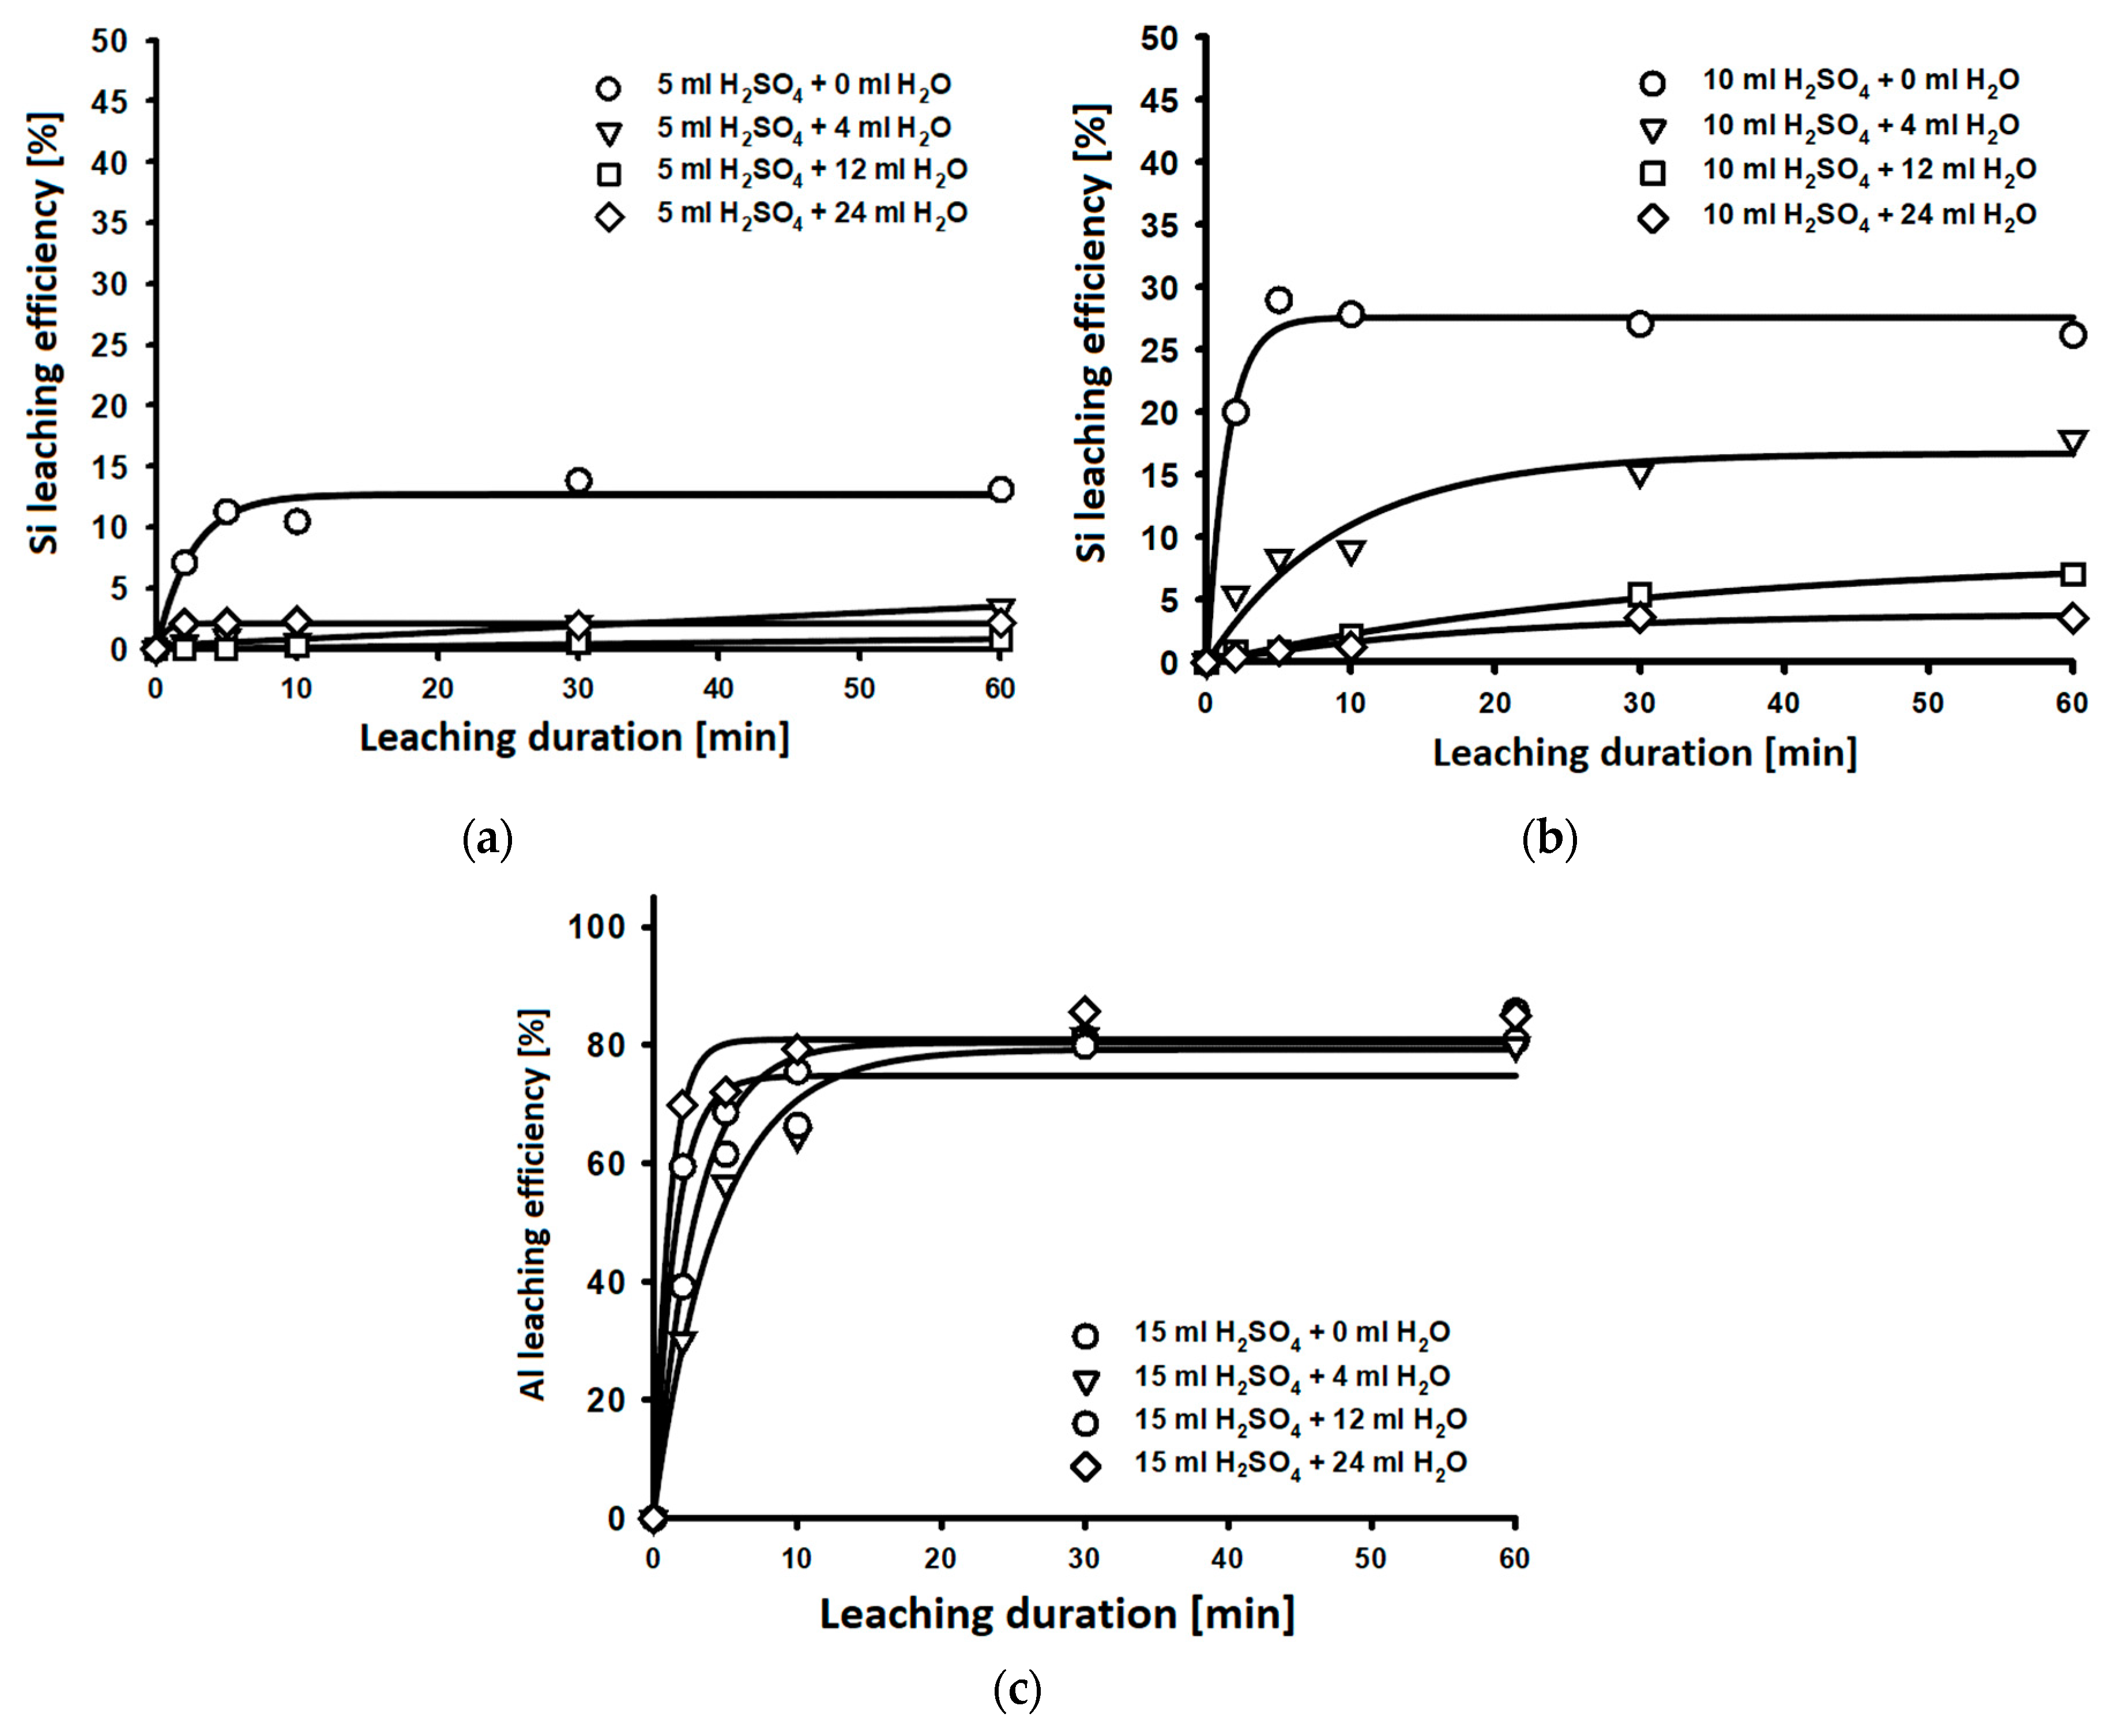
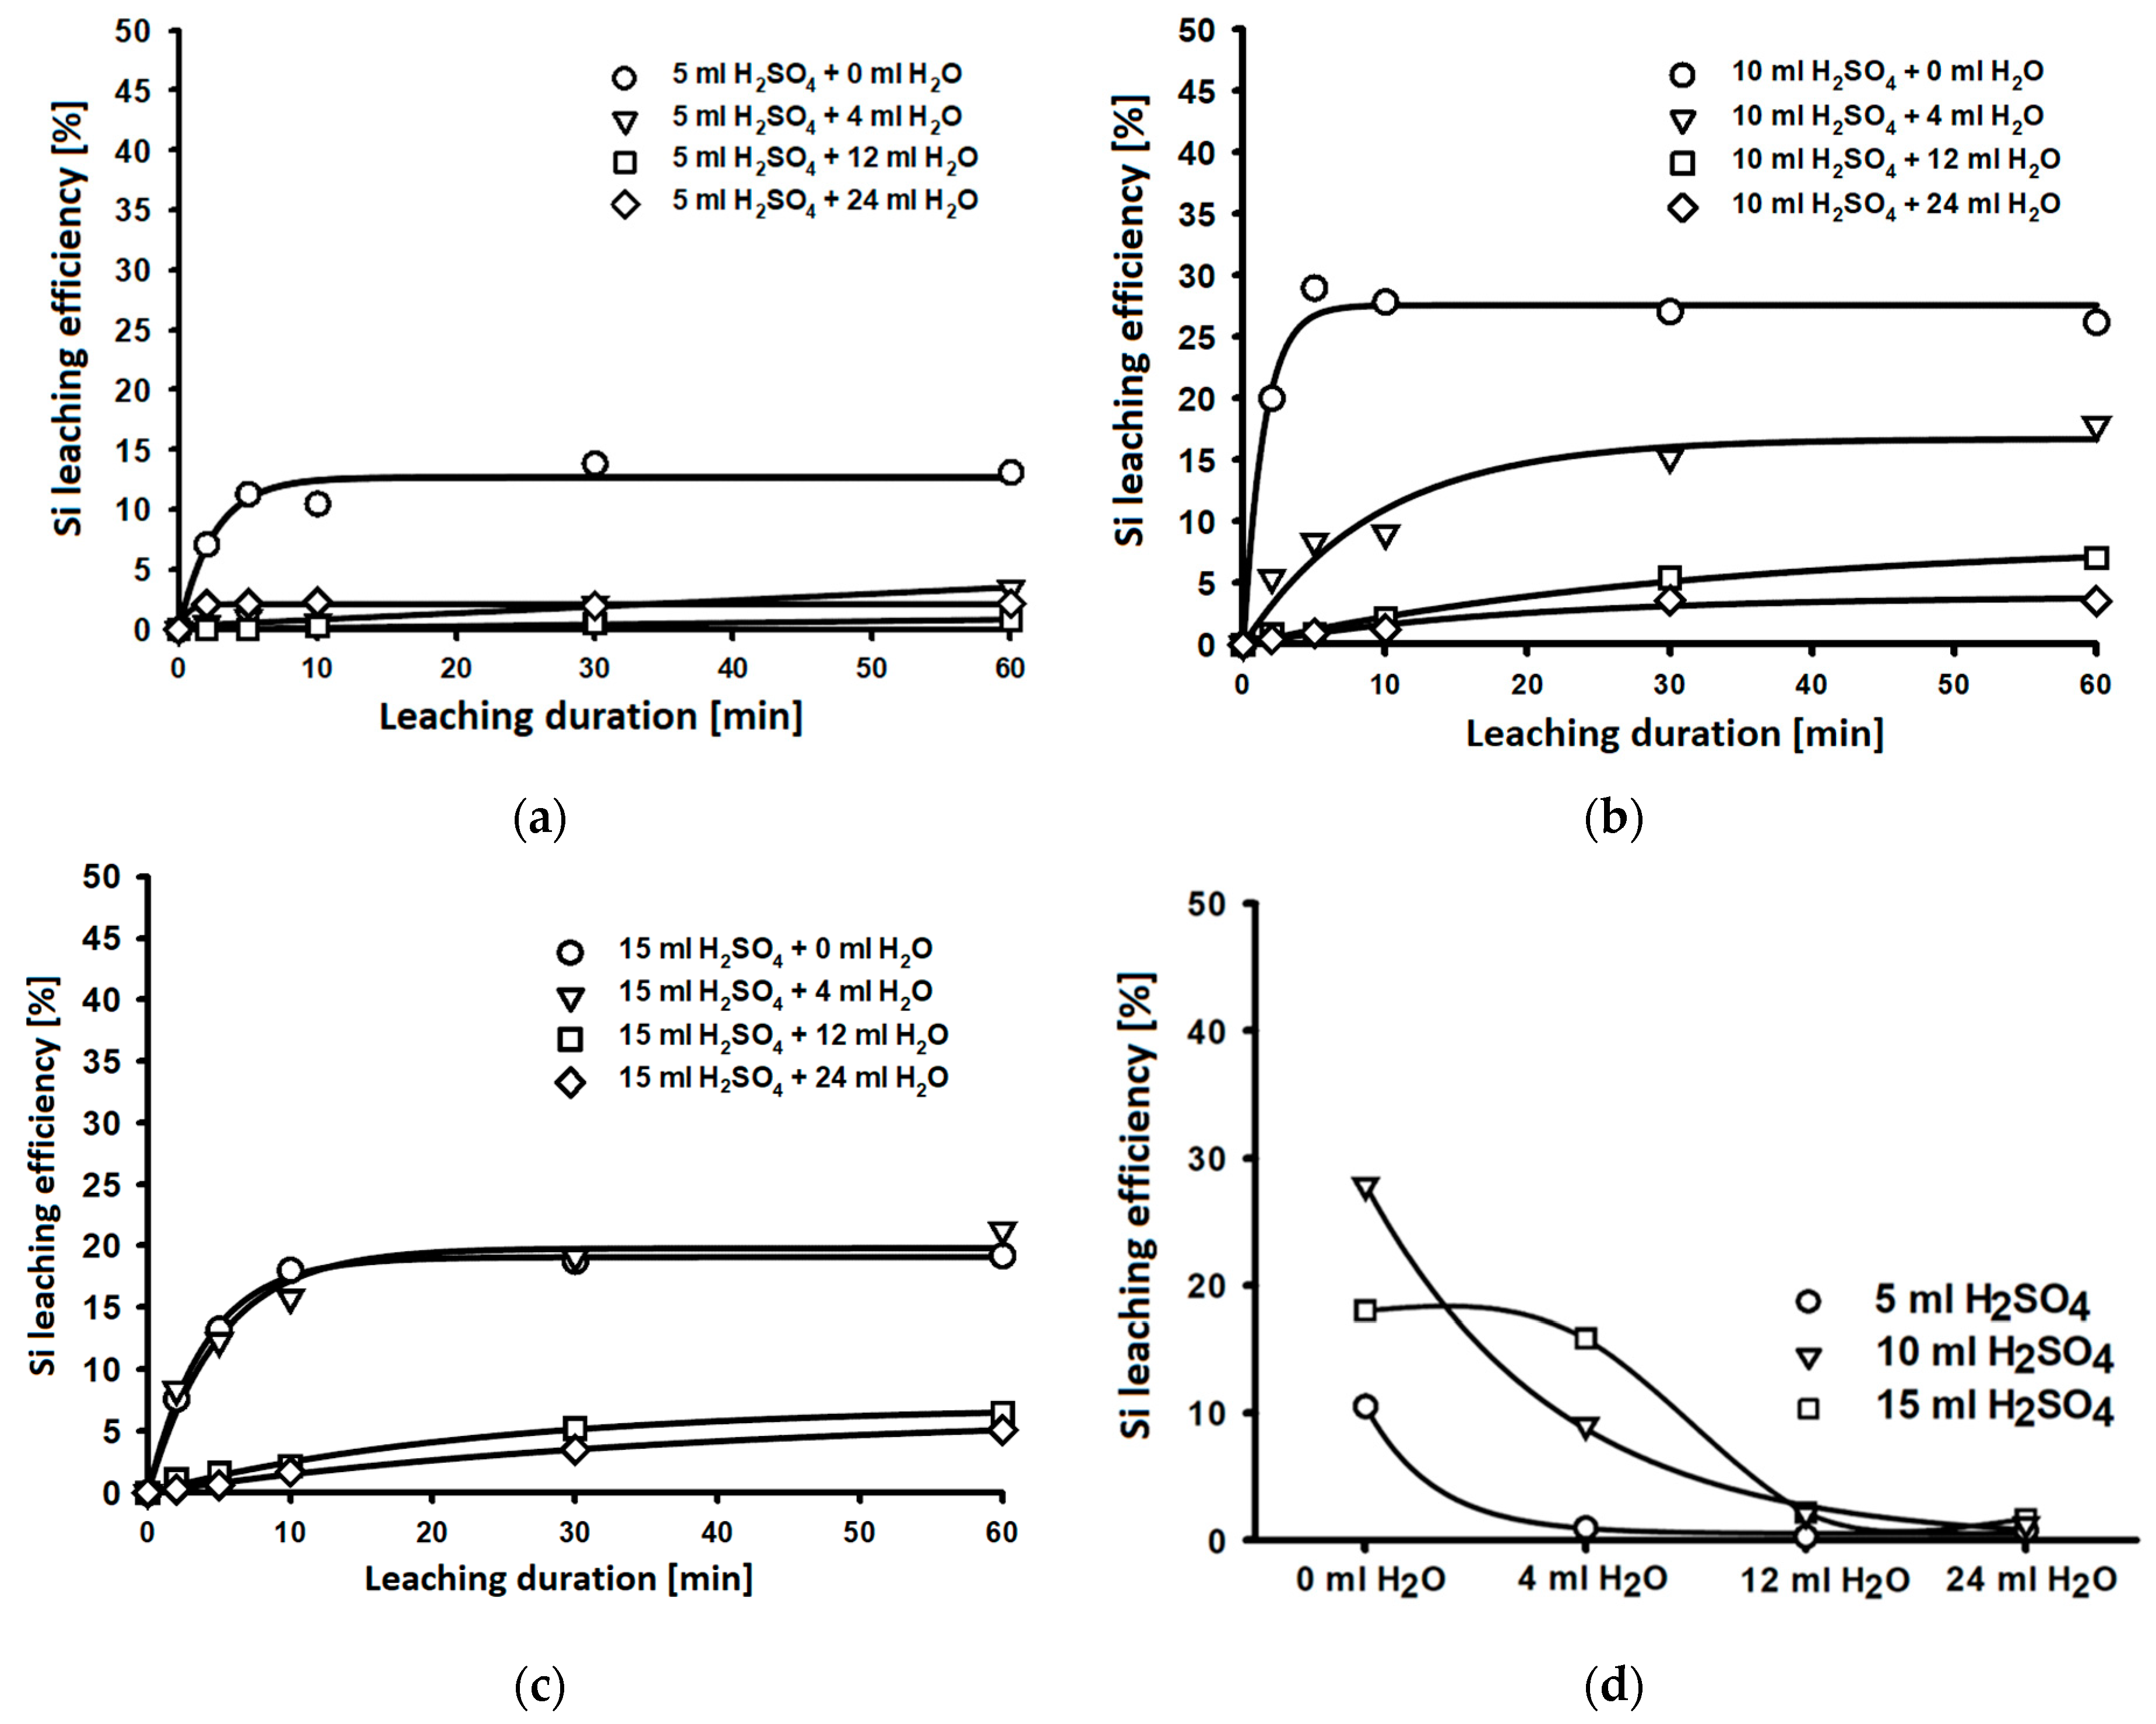
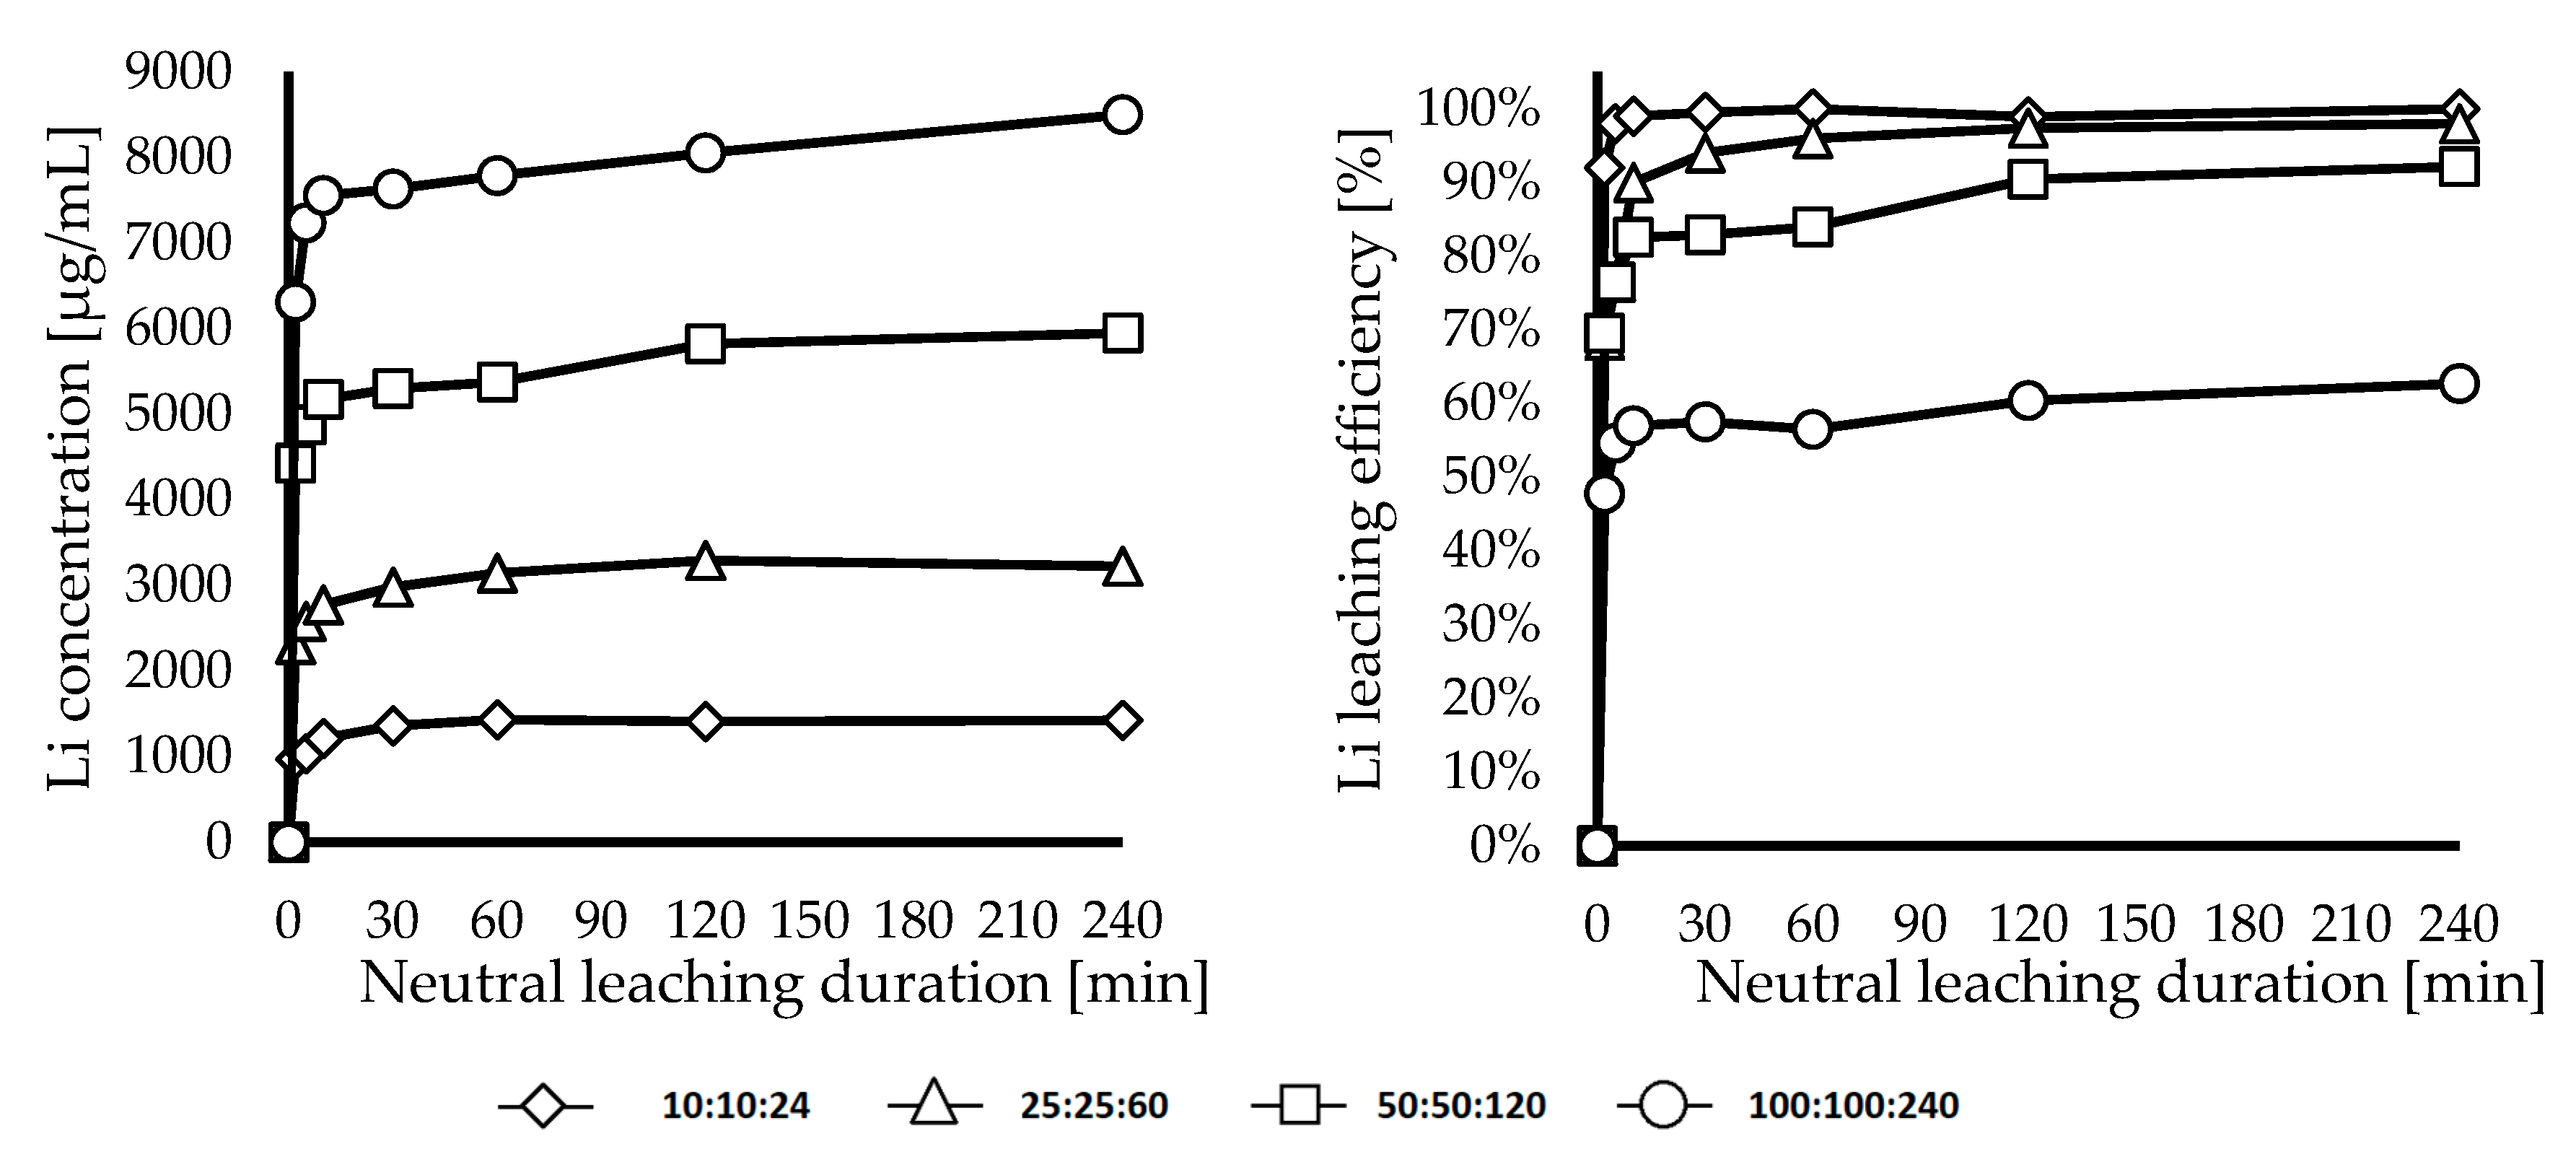
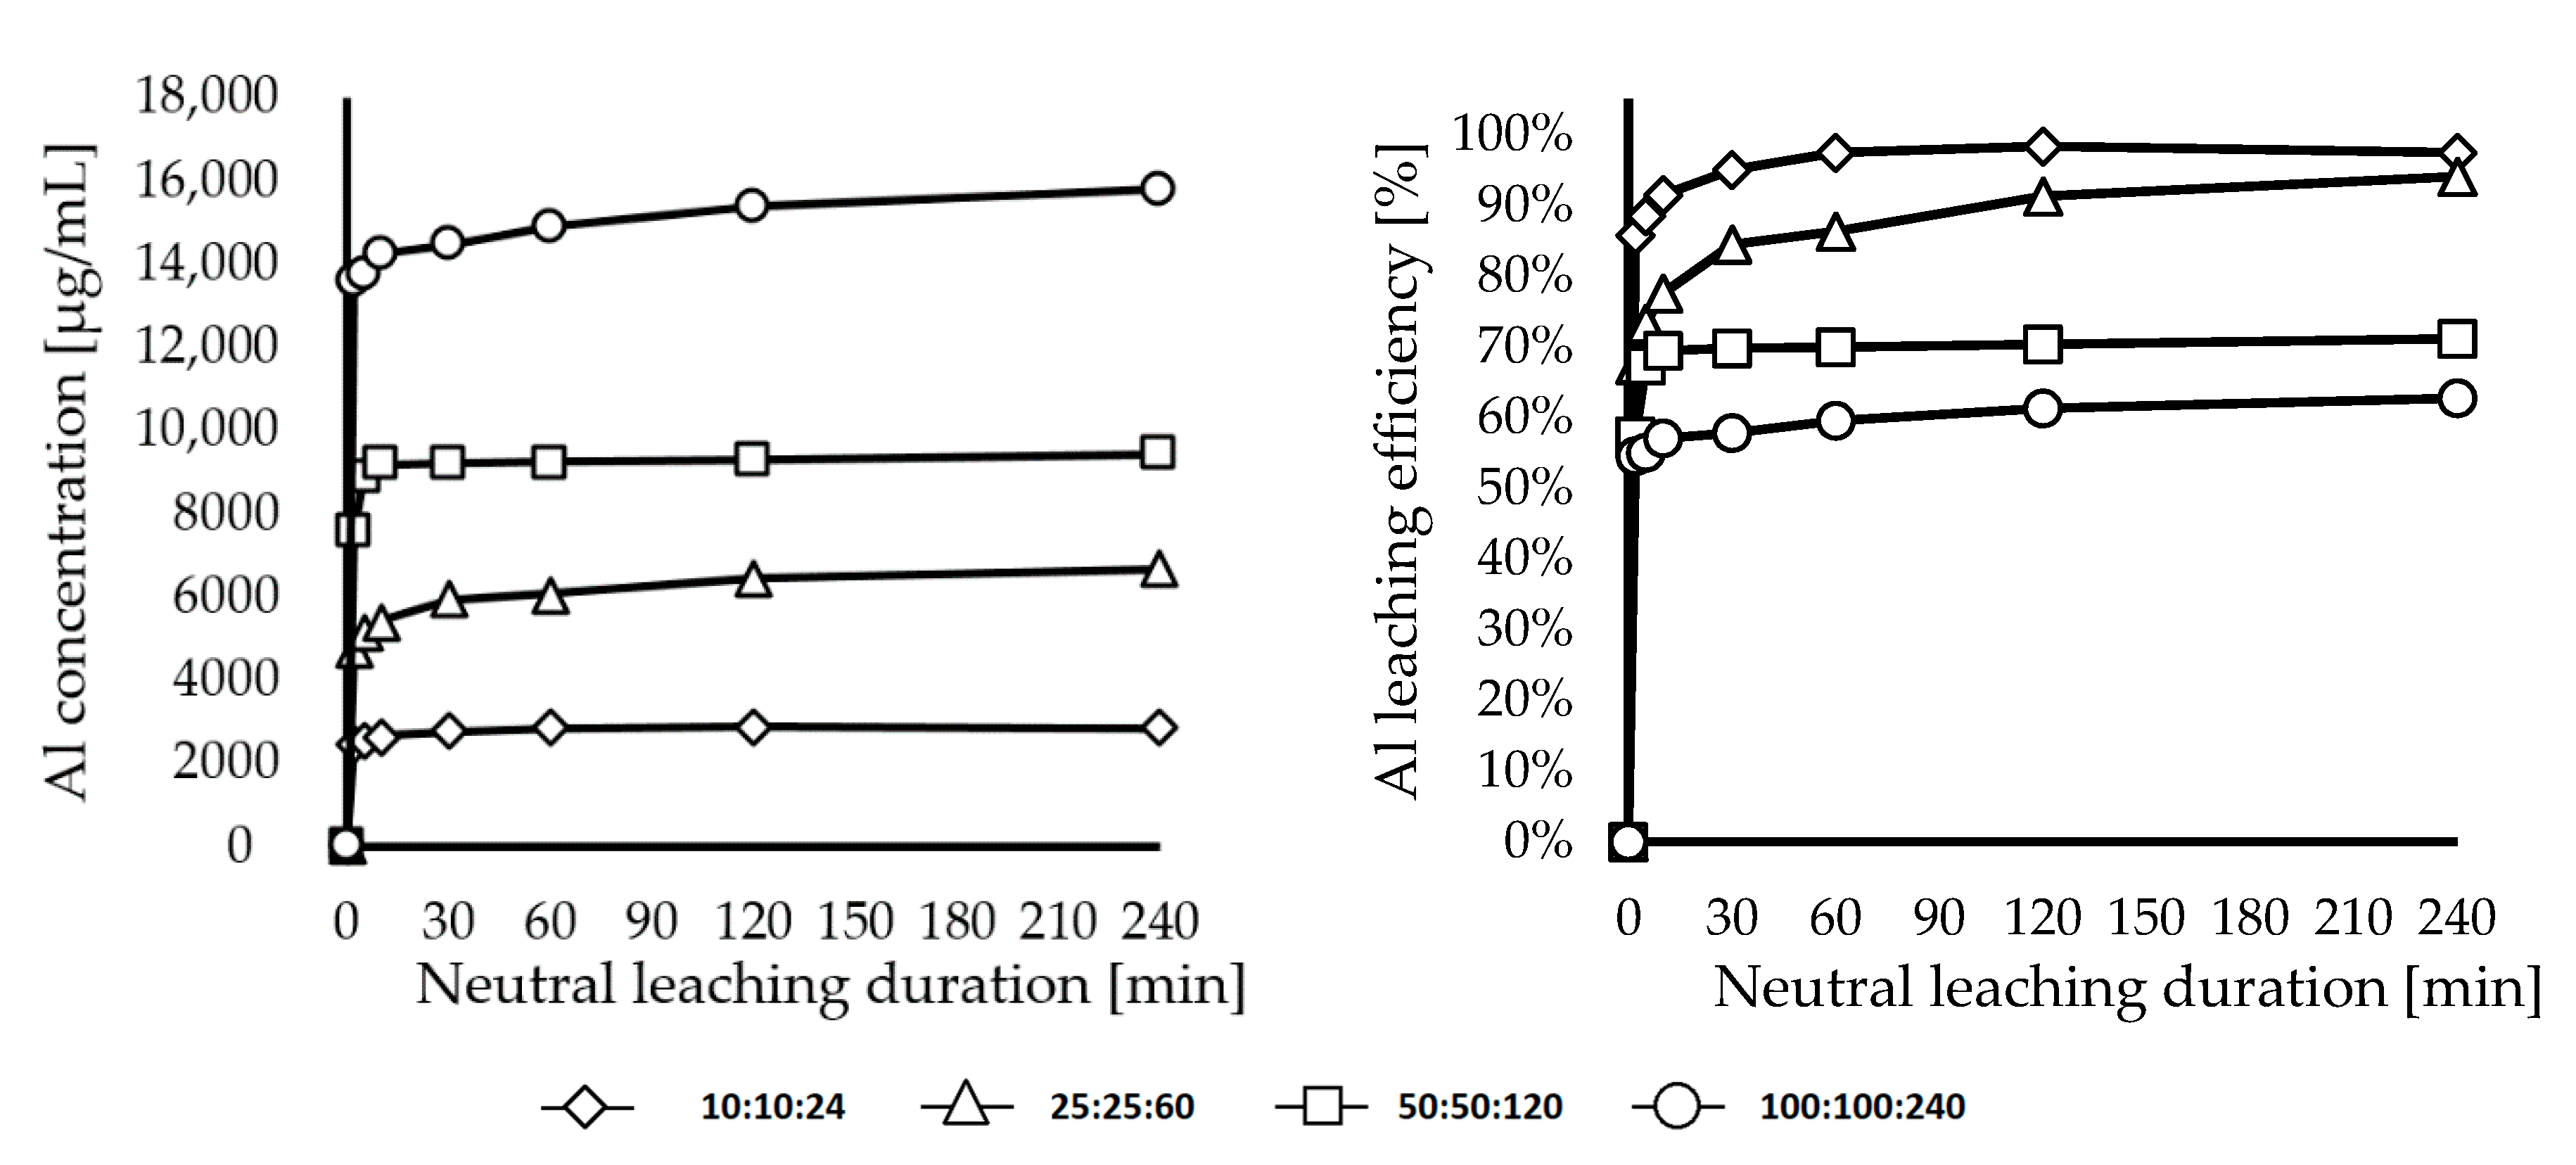
3.4. Dry Digestion—the Optimal Ratio of Li Slag Sample, Acid, and Water

Thermodynamic study from chapter 3.3 confirmed that one of the solutions to prevent the formation of gels is to precipitate SiO2. To achieve precipitation, it is necessary to overcome the unknown activation energies of reactions (3), (12), and (13), and therefore it is necessary to increase the energy to the system. It is also appropriate to reduce the volume of the leaching solution to prevent energy consumption for its heating. It was proposed to treat the slag by the dry digestion (DD) method in the experiments, which has been applied in the treatment of eudialyte concentrates [31,32,33,34,35] and iron-depleted red mud [35].
The DD principle consists in mixing a slag sample with concentrated acid and water and this method aimed to verify whether the heat generated from the exothermic acid dilution and the exothermic slag decomposition reaction may be sufficient to overcome the unknown Ea needed to precipitate SiO2 from solution according to theory showed in Figure 15. Small addition of water (4, 12, 24 mL) to slag and acid resulted in a strong exothermic reaction. Under these conditions, it is assumed that insoluble SiO2 and soluble lithium and aluminum sulfates were formed according to reaction (3).
One-hour DD experiment was thus followed by dissolution of obtained solid mixtures in 500 mL of deionized water. Figure 16 shows lithium-leaching efficiencies. The addition of 5 mL of H2SO4 was not sufficient to achieve high Li leaching efficiency, but 10 mL H2SO4 resulted in efficiency close to 100%. No further increase in H2SO4 addition was necessary. Further increase of H2SO4 to 15 mL was neither necessary nor appropriate, due to the fact that lowering the pH may promote gel formation. The use of 10 mL H2SO4 seems to be suitable also in the case of aluminum leaching showed in Figure 17.
The silicon leaching efficiencies up to 50% were achieved in previous direct Li slag leaching (Figure 9), which corresponds to complete dissolution of silicon from the LiAlSiO4 and Li2SiO3 phases. Figure 18 shows the silicon leaching efficiency in DD experiments followed by water dissolution. To maintain the high leaching efficiency of lithium, it is advisable to use 10 mL H2SO4. Reduction in the leaching efficiency of silicon from 50% to 30% was achieved, when 10 mL of H2SO4 without the addition of water was used. Heat was generated only from the decomposition of the LiAlSiO4 and Li2SiO3 phases in these experiments, which was not sufficient to precipitate SiO2 in significant amounts. When water was added during DD, which caused additional production of heat by exothermic dilution of sulfuric acid, a further reduction of silicon leaching efficiency to 15% using 4 mL of H2O, 6% using 12 mL of H2O and 4% using 24 mL of H2O was achieved. From the leaching curves, follows increasing of Si leaching efficiency over time and therefore further reduction in the Si leaching efficiency could be possible by shortening of dissolution time of DD mixture. Maximum lithium leaching efficiency was achieved using 10 mL of H2SO4 and 24 mL of H2O (ratio 10:10:24) after 10 min of dissolution. Figure 18d shows Si leaching efficiency in the 10th minute of dissolution. In a 10 min experiment at a ratio of 10:10:24, it was possible to achieve 99.12% (1492 µg/mL) and 92.36% (2792 µg/mL) dissolution of lithium and aluminum, respectively, and reduce the dissolution efficiency of silicon to 1.25% (134 µg/mL).
The new precipitated phase was observed at the bottom of the beaker after dissolution of the DD mixture (Figure 19). The precipitated phase was separated from the leaching residue and the samples were subjected to XRD analysis. Figure 20 shows an XRD analysis comparison of the input Li slag sample (black), the leaching residue obtained by dissolution of DD mixture at ratio 10:10:24 (red) and the precipitated phase (blue). The significant peak intensity decrease of the LiAlSiO4 and Li2SiO3 phases in the XRD patterns indicates that the leaching residue and precipitate consists of unknown amorphous phases. Taking into account the theoretical analysis, the XRD, and the AAS analysis, it is concluded that the precipitated phase is amorphous SiO2.
The results confirmed that energy generated in DD process was sufficient to overcome the activation energy of reactions (3), (6), (12), and (13). This resulted in the precipitation of insoluble SiO2 from the mixture in DD step. Precipitation reduced the concentration of silicon in the solution below 1000 µg/mL and pH of the obtained solution was 1.322, which confirmed that both gel prevention conditions were met. Another advantage of dry digestion over direct leaching is the increase in the weight of the solid residue from 20.01% to 51.05%. DD method followed by dissolution makes the separation of the leaching residue from the solution possible. Residues can be thus landfilled or used in the construction industry [28].

3.5. Dry Digestion—Increase of Dry Digested Mixture Used per Constant Volume of Water in Dissolution Step

The optimal mixture ratio of 10:10:24 for DD was determined in chapter 3.4 The solution obtained by dissolution of dry digested mixture in 500 mL of deionized water contained 1492 µg/mL of lithium (1.18 g of Li2SO4/100 mL). One suitable option for future lithium recovery from solutions is the precipitation of Li2CO3. Precipitation of lithium carbonate (Li2CO3) will occur only if the concentration of lithium in the solution exceeds 2498 µg/mL (Ksp Li2CO3 = 1.33 g/100 mL; molar ratio of Li in Li2CO3 is 18.79%), but current concentration is lower. Therefore, it is necessary to increase lithium concentration in solution significantly.
Lithium concentration increase was experimentally verified in followed chapter by increasing the amount of dry digested mixture used in the next dissolution step. Mixtures of 10:10:24, 25:25:60, 50:50:120 and 100:100:240 were dissolved in constant 500 mL of water in the following experiments. The length of the experiments was extended to 4 h because silicon concentration was continuously increasing throughout the first 60 min of leaching in the previous dissolution experiments (Figure 18). Figure 21 and Figure 22 shows the leaching efficiency of lithium and aluminum, respectively.
The results show that the concentration of lithium and aluminum increases with the increased amount of dry digested mixture, but the overall leaching efficiency of lithium and aluminum decreased from 99.98% and 97.46% in the trial 10:10:24 to 62.74% and 62.71% in the trial 100:100:240. However, such a significant reduction in efficiency should not occur due to the fact that the ratio Li slag: H2SO4: H2O in DD step was maintained.
A possible reason for the reduction in leaching efficiency of lithium and aluminum could be in reaching of their maximum solubility. The maximum theoretical concentration of lithium in sulfuric acid is 43940 µg/mL (Ksp Li2SO4 = 34.8 g/100 mL; molar ratio of Li in Li2SO4 is 12.63%) and the maximum theoretical concentration of aluminum is 57409 µg/mL (Ksp Al2(SO4)3 = 36.4 g/100 mL; molar ratio Al in Al2(SO4)3 is 15.77%). The maximum concentration of lithium in this solution will be affected by the presence of aluminum and vice versa, since both of these elements are bound to the same SO 4 2 anions. However, even taking into account the mutually limited solubility, it can be stated that the maximum concentrations of lithium and aluminum were not exceeded in these experiments. Leaching residues obtained in the dissolution step were washed and analyzed by AAS for that reason. The results are shown in Table 6.
The chemical analysis of leaching residues from experiments 10:10:24 and 25:25:60 confirmed the dissolution of lithium and aluminum above 99%. The leaching residue from the 50:50:120 experiment contained only 0.34% of Li and not 7.82%, as it was assumed according to Figure 21, where Li leaching efficiency was 92.17% only. The leaching residue from the 100:100:240 experiment also contained less lithium and aluminum than expected from the leaching results.
Due to the difference between the results of the solutions and the leaching residues, the experiments were repeated and the leaching residues were washed in a vacuum filtration funnel with a constant volume of 500 mL. Analysis of the washing solutions (Table 7) confirmed that the solution obtained by washing of solids from trial 50:50:120 contained 546 µg/mL of lithium, which represented remaining 7.8% of the lithium. The 100:100:240 wash solution contained only 25.39 of 37.5% remaining lithium, suggesting that washing such a large amount of the mixture should be performed with a larger volume of washing solution. The washing solution results indicate that lithium and aluminum sulfates are probably adsorbed on the surface of solid insoluble residues. In the DD experiments, 50:50:120 and 100:100:240, the surface area of the insoluble residues is so large that there is a significant reduction in the leaching efficiencies of these elements.
Figure 23 shows silicon concentration and leaching efficiency of experiments 10:10:24–100:100:240. The threshold value of the silicon concentration of 1000 µg/mL was exceeded at about 60 min of the leaching in the trial 10:10:24. In trials, where a larger volume of the mixture was dissolved, the threshold concentration was exceeded in the first minutes of leaching.
The analysis in Chapter 3.2 shows, that gels are formed in solutions with higher silicon concentrations only if the pH is lower than 0.75. Table 8 shows pH values of the solutions at the beginning and after the end of leaching. Gel presence could be observed only in the solution obtained in trial 100:100:240.
The results of this chapter confirm that 92.17% Li leaching efficiency (5825 µg/mL) can be achieved by leaching a 50:50:120 mixture in the dissolving step and a suitable dissolution time is 1 h. The remaining 7.8% of Li can be recovered by quick washing of solids in a vacuum filtration funnel. To prevent lithium loses by washing of leaching residue, the reuse of wash water in dissolution step should be considered. No gel formation should be present under these conditions. Remaining washed solids (45 wt. % of input Li slag used in DD step) can thus be landfilled or used in various industries.

3.6. Further Lithium Concentration Increase and Precipitation of Products (Theoretical Analysis)

The results show that by dry digestion in a ratio of 50:50:120 and by subsequent leaching in water, it is possible to obtain a solution with 5950 µg/mL of Li and 9410 µg/mL of Al. The pH of the solutions under these conditions should be above 0.75 and therefore no gelation should be present. Precipitation of lithium carbonate (Li2CO3) from obtained solution with the lithium concentration of 5950 µg/mL should be possible, but the amount obtainable Li2CO3 would be relatively small, since Li2CO3 solubility is 1.33 g/100mL, which represent Li concentration of 2498 µg/mL. As much as 41.98% of Li (2498 µg/mL) would remain dissolved in the solution and only 58% (3452 µg/mL) would precipitate out of the solution. From the practical point of view, it is therefore appropriate to consider the multiple reuse of the solution for leaching of new 50:50:120 batches/mixtures. It should be possible to double (±12,000 µg/mL) or triple (±18,000 µg/mL) the amount of lithium in the solution. By treatment of this solution with tripled concentration of lithium (±18,000 µg/mL) by carbonates, the amount of dissolved lithium remaining in the solution would be reduced from 41.98% to 13.88% and therefore 86.18% (15,502 µg/mL) of the lithium would be precipitated as Li2CO3. The maximum concentration of lithium based on Li2SO4 solubility is 43,939.73 µg/mL, but the Li2SO4 solubility will be affected by leaching of aluminum. Multiple reuse of the same solution would also lower the pH of the solution below the critical limit, causing gels to form.
For this reasons, it seems appropriate to adjust pH of the solution to pH 4–6, at which all the aluminum precipitates out of solution according to the fraction diagrams (Figure 24a), while lithium should stay in ionic form (Figure 24b).
After pH adjustment and filtration of aluminum precipitates, refined solution should be ready for next leaching of fresh DD 50:50:120 according to Figure 25.

4. Conclusions

Lithium slag recycling methods were investigated in this paper. Chemical analysis showed that the slag produced by smelting of lithium battery black mass in EAF with the addition of CuO and SiO2 is a valuable secondary source with a lithium content of 6.96%. The sample of Li slag suitable for leaching was prepared by crushing, grinding, and magnetic separation with the use of which the magnetic metals content was reduced to a minimum.
By direct leaching of the slag in 0.5 and 1 M H2SO4, it was possible to achieve a lithium recovery close to 100% after only five minutes of leaching at 80 °C and after 30 min of leaching at 20 °C. Kinetic study showed that the apparent activation energy for lithium leaching in 0.5 and 1 M H2SO4 is 22.48 and 23.86 kJ/mol, respectively, and the process of Li leaching is described well by Jander kinetic model, which corresponds to 3-dimensional cylindrical diffusions mechanism as the rate-controlling step. The disadvantage of direct leaching of Li slag is the high leaching efficiency of silicon, which causes the formation of gels. Gels complicate a chemical analysis of solutions, filtration, and further recovery of the products.
Therefore, the conditions for gel formation and the possibilities of gel formation preventions were investigated. The results of the observation show that gels are produced when the concentration of Si in the solution exceeds 1000 µg/mL and at the same time the pH of the solution is lower than 0.75. Thermodynamic study has shown that leaching of Li phases of the slag should be also possible with the precipitation of solid SiO2 instead of H4SiO4 production followed by gelation.
The dry digestion method was investigated to prevent the formation of H4SiO4. By this method, it was possible to overcome the activation energy of reactions in which SiO2 precipitates out of solution. Lithium and aluminum sulfates were also produced in this step. The optimal ratio of components in the dry digestion is 10 mL of concentrated H2SO4 and 24 mL H2O per 10 g of slag. Mixtures obtained by DD were leached in a water dissolution step, where Si was leached with a much lower rate compared to the dissolution of lithium and aluminum silicates. The leaching efficiency of silicon was reduced to 1.25% by dissolving a mixture of 10:10:24 in 500 mL of water, while maintaining high leaching yields of lithium and aluminum. The solution obtained under these conditions contains 1492 µg of lithium per ml. Further increase in the lithium concentration to 5950 µg/mL (92.12%) was achieved by dissolving a mixture of 50:50:120 in 500 mL of water. The study confirmed an important role of the washing of leaching residues after dry digestion and water leaching. Remaining 7.8% of lithium were recovered by washing in 500 mL of water. Wash water containing lithium can be then reused in the next batch of water dissolution of dry digested mixture.

Author Contributions

Conceptualization, J.K., D.O., and T.H.; methodology, J.K., D.O., and C.D.; software, J.K; validation, J.K., D.O., A.M., M.S., C.V., C.D., B.F., and T.H.; formal analysis, J.K.; investigation, J.K. and D.O.; resources, J.K.; data curation, J.K. and D.O.; writing—original draft preparation, J.K.; writing—review and editing, J.K., D.O., A.M., M.S., C.V., C.D., B.F., and T.H.; visualization, J.K.; supervision, T.H.; project administration, J.K. and C.V.; funding acquisition, B.F., A.M., T.H., J.K., and C.V. All authors have read and agreed to the published version of the manuscript.

Funding

The exchange cost was funded by Deutscher Akademischer Austauschdienst (DAAD), grant number 57453240. This work was funded by the Ministry of Education of the Slovak Republic under grant MŠ SR VEGA 1/0556/20. This work was also funded by association UNIVNET, project No. 0201/0082/19.

Acknowledgments

The authors are grateful to Accurec Recycling GmbH (Germany) for providing pelletized black mass. The authors would also like to express their gratitude to the DAAD and Ministry of Education of the Slovak Republic for enabling the joint research in battery recycling.

Conflicts of Interest

The authors declare no conflict of interest. The funders had no role in the design of the study; in the collection, analyses, or interpretation of data; in the writing of the manuscript, or in the decision to publish the results.

References

  1. Dańczak, A.; Klemettinen, L.; Kurhila, M.; Taskinen, P.; Lindberg, D.; Jokilaakso, A. Behavior of Battery Metals Lithium, Cobalt, Manganese and Lanthanum in Black Copper Smelting. Batteries 2020, 6, 16. [Google Scholar] [CrossRef] [Green Version]
  2. Helbig, C.; Bradshaw, A.M.; Wietschel, L.; Thorenz, A.; Tuma, A. Supply Risks Associated with Lithium-Ion Battery Materials. J. Clean. Prod. 2018, 172, 274–286. [Google Scholar] [CrossRef]
  3. Nitta, N.; Wu, F.; Lee, J.T.; Yushin, G. Li-Ion Battery Materials: Present and Future. Mater. Today 2015, 18, 252–264. [Google Scholar] [CrossRef]
  4. Gu, F.; Guo, J.; Yao, X.; Summers, P.A.; Widijatmoko, S.D.; Hall, P. An Investigation of the Current Status of Recycling Spent Lithium-Ion Batteries from Consumer Electronics in China. J. Clean. Prod. 2017, 161, 765–780. [Google Scholar] [CrossRef]
  5. Contestabile, M.; Panero, S.; Scrosati, B. A Laboratory-Scale Lithium-Ion Battery Recycling Process. J. Power Sources 2001, 92, 65–69. [Google Scholar] [CrossRef]
  6. Pinegar, H.; Smith, Y.R. Recycling of End-of-Life Lithium-Ion Batteries, Part II: Laboratory-Scale Research Developments in Mechanical, Thermal, and Leaching Treatments. J. Sustain. Metall. 2020, 6, 142–160. [Google Scholar] [CrossRef]
  7. Porvali, A.; Aaltonen, M.; Ojanen, S.; Velazquez-Martinez, O.; Eronen, E.; Liu, F.; Wilson, B.P.; Serna-Guerrero, R.; Lundström, M. Mechanical and Hydrometallurgical Processes in HCl Media for the Recycling of Valuable Metals from Li-Ion Battery Waste. Resour. Conserv. Recycl. 2019, 142, 257–266. [Google Scholar] [CrossRef]
  8. European Commission. Report from the Commission to the European Parliament, the Council, the European Economic and Social Committee, the Committee of the Regions and the European Investment Bank: On the Implementation of the Strategic Action Plan on Batteries: Building a Strategic Battery Value Chain in Europe. Available online: https://eur-lex.europa.eu/legal-content/EN/TXT/HTML/?uri=CELEX:52019DC0176&from=EN (accessed on 16 June 2020).
  9. Pinegar, H.; Smith, Y.R. Recycling of End-of-Life Lithium Ion Batteries, Part I: Commercial Processes. J. Sustain. Metall. 2019, 5, 402–416. [Google Scholar] [CrossRef]
  10. Tarascon, J.; Armand, M. Issues and Challenges Facing Rechargeable Lithium Batteries. Nature 2001, 414, 359–367. [Google Scholar] [CrossRef]
  11. Huang, B.; Pan, Z.; Su, X.; An, L. Recycling of Lithium-Ion Batteries: Recent Advances and Perspectives. J. Power Sources 2018, 399, 274–286. [Google Scholar] [CrossRef]
  12. The European Parliament and the Council of the European Union. Directive 2006/66/EC of the European Parliament and of the Council on Batteries and Accumulators and Waste Batteries and Accumulators and Repealing Directive 91/157/EEC. Available online: https://eur-lex.europa.eu/legal-content/EN/TXT/PDF/?uri=CELEX:02006L0066-20131230&rid=1 (accessed on 6 May 2020).
  13. European Commission. Report from the Commission to the European Parliament, the Council, the European Economic and Social Committee and the Committee of the Regions: Critical Raw Materials Resilience: Charting a Path towards greater Security and Sustainability. Available online: https://eur-lex.europa.eu/legal-content/EN/TXT/?uri=CELEX:52020DC0474 (accessed on 15 September 2020).
  14. Werner, D.; Peuker, U.A.; Mütze, T. Recycling Chain for Spent Lithium-Ion Batteries. Metals 2020, 10, 316. [Google Scholar] [CrossRef] [Green Version]
  15. Zhong, X.; Liu, W.; Han, J.; Jiao, F.; Qin, W.; Liu, T. Pretreatment for the Recovery of Spent Lithium Ion Batteries: Theoretical and Practical Aspects. J. Clean. Prod. 2020, 263, 121439. [Google Scholar] [CrossRef]
  16. Liu, J.; Wang, H.; Hu, T.; Bai, X.; Wang, S.; Xie, W.; Hao, J.; He, Y. Recovery of LiCoO2 and Graphite from Spent Lithium-Ion Batteries by Cryogenic Grinding and Froth Flotation. Miner. Eng. 2020, 148, 106223. [Google Scholar] [CrossRef]
  17. Zhang, G.; Du, Z.; He, Y.; Wang, H.; Xie, W.; Zhang, T. A Sustainable Process for the Recovery of Anode and Cathode Materials Derived from Spent Lithium-Ion Batteries. Sustainability 2019, 11, 2363. [Google Scholar] [CrossRef] [Green Version]
  18. Zhang, G.; He, Y.; Feng, Y.; Wang, H.; Zhang, T.; Xie, W.; Zhu, X. Enhancement in Liberation of Electrode Materials Derived from Spent Lithium-Ion Battery by Pyrolysis. J. Clean. Prod. 2018, 199, 62–68. [Google Scholar] [CrossRef]
  19. Li, J.; Lai, Y.; Zhu, X.; Liao, Q.; Xia, A.; Huang, Y.; Zhu, X. Pyrolysis Kinetics and Reaction Mechanism of the Electrode Materials During the Spent LiCoO2 Batteries Recovery Process. J. Hazard. Mater. 2020, 398, 122955. [Google Scholar] [CrossRef]
  20. Zhong, X.; Liu, W.; Han, J.; Jiao, F.; Qin, W.; Liu, T.; Zhao, C. Pyrolysis and Physical Separation for the Recovery of Spent LiFePO4 Batteries. Waste Manag. 2019, 89, 83–93. [Google Scholar] [CrossRef]
  21. Ruismäki, R.; Dańczak, A.; Klemettinen, L.; Taskinen, P.; Lindberg, D.; Jokilaakso, A. Integrated Battery Scrap Recycling and Nickel Slag Cleaning with Methane Reduction. Minerals 2020, 10, 435. [Google Scholar] [CrossRef]
  22. Shi, J.; Peng, C.; Chen, M.; Li, Y.; Eric, H.; Klemettinen, L.; Lundström, M.; Taskinen, P.; Jokilaakso, A. Sulfation Roasting Mechanism for Spent Lithium-Ion Battery Metal Oxides Under SO2-O2-Ar Atmosphere. JOM 2019, 71, 4473–4482. [Google Scholar] [CrossRef] [Green Version]
  23. Peng, C.; Hamuyuni, J.; Wilson, B.P.; Lundström, M. Selective Reductive Leaching of Cobalt and Lithium from Industrially Crushed Waste Li-Ion Batteries in Sulfuric Acid System. Waste Manag. 2018, 76, 582–590. [Google Scholar] [CrossRef]
  24. Porvali, A.; Chernyaev, A.; Shukla, S.; Lundström, M. Lithium Ion Battery Active Material Dissolution Kinetics in Fe (II)/Fe (III) Catalyzed Cu-H2SO4 Leaching System. Sep. Purif. Technol. 2020, 236, 116305. [Google Scholar] [CrossRef]
  25. Dewulf, J.; van der Vorst, G.; Denturck, K.; van Langenhove, H.; Ghyoot, W.; Tytgat, J.; Vandeputte, K. Recycling Rechargeable Lithium Ion Batteries: Critical Analysis of Natural Resource Savings. Resour. Conserv. Recyl. 2010, 54, 229–234. [Google Scholar] [CrossRef]
  26. BRGM. Le Lithium (Li)—Éléments de Criticité; BRGM, the French Geological Survey: Orleans, France, 2017; pp. 1–8. Available online: http://www.mineralinfo.fr/page/fiches-criticite (accessed on 19 October 2020).
  27. Mathieux, F.; Ardente, F.; Bobba, S.; Nuss, P.; Blengini, G.; Alves Dias, P.; Blagoeva, D.; Torres De Matos, C.; Wittmer, D.; Pavel, C.; et al. Critical Raw Materials and the Circular Economy—Background Report; JRC Science-for-policy report, EUR 28832 EN; Publications Office of the European Union: Luxembourg, 2017; ISBN 978-92-79-74282-8. [Google Scholar] [CrossRef]
  28. Harper, G.; Sommerville, R.; Kendrick, E.; Driscoll, L.; Slater, P.; Stolkin, R.; Walton, A.; Christensen, P.; Heidrich, O.; Lambert, S.; et al. Recycling Lithium-Ion Batteries from Electric Vehicles. Nature 2019, 575, 75–86. [Google Scholar] [CrossRef] [Green Version]
  29. Wang, H.; Friedrich, B. Development of a Highly Efficient Hydrometallurgical Recycling Process for Automotive Li–Ion Batteries. J. Sustain. Metall. 2015, 1, 168–178. [Google Scholar] [CrossRef] [Green Version]
  30. Sommerfeld, M.; Vonderstein, C.; Dertmann, C.; Klimko, J.; Oráč, D.; Miškufová, A.; Havlik, T.; Friedrich, B. A Combined Pyro- and Hydrometallurgical Approach to Recycle Pyrolyzed Lithium-Ion Battery Black Mass Part 1: Production of Lithium Concentrates in an Electric Arc Furnace. Metals 2020, 10, 1069. [Google Scholar] [CrossRef]
  31. Voßenkaul, D.; Birich, A.; Müller, N.; Stoltz, N.; Friedrich, B. Hydrometallurgical Processing of Eudialyte Bearing Concentrates to Recover Rare Earth Elements Via Low-Temperature Dry Digestion to Prevent the Silica Gel Formation. J. Sustain. Metall. 2017, 3, 79–89. [Google Scholar] [CrossRef]
  32. Ma, Y.; Stopic, S.; Gronen, L.; Friedrich, B. Recovery of Zr, Hf, Nb from eudialyte residue by sulfuric acid dry digestion and water leaching with H2O2 as a promoter. Hydrometallurgy 2018, 181, 206–214. [Google Scholar] [CrossRef]
  33. Ma, Y.; Stopic, S.; Gronen, L.; Milivojevic, M.; Obradovic, S.; Friedrich, B. Neural Network Modeling for the Extraction of Rare Earth Elements from Eudialyte Concentrate by Dry Digestion and Leaching. Metals 2018, 8, 267. [Google Scholar] [CrossRef] [Green Version]
  34. Davris, P.; Stopic, S.; Balomenos, E.; Panias, D.; Paspaliaris, I.; Friedrich, B. Leaching of rare earth elements from eudialyte concentrate by suppressing silica gel. Miner. Eng. 2017, 108, 115–122. [Google Scholar] [CrossRef]
  35. Alkan, G.; Yagmurlu, B.; Gronen, L.; Dittrich, C.; Ma, Y.; Stopic, S.; Friedrich, B. Selective silica gel free scandium extraction from Iron-depleted red mud slags by dry digestion. Hydrometallurgy 2019, 185, 266–272. [Google Scholar] [CrossRef]
  36. London Metal Exchange (LME). Available online: https://www.lme.com/Metals (accessed on 19 October 2020).
  37. Shanghai Metals Market (SMM). Available online: https://price.metal.com/ (accessed on 19 October 2020).
  38. Roine, A. HSC Chemistry Thermodynamic Software; Outotec: Pori, Finland, 2018. [Google Scholar]
  39. Hem Shanker Ray, H.; Saradindukumar, R. Analysis of Kinetic Data for Practical Applications. In Kinetics of Metallurgical Processes; Springer Nature: Singapore, 2018; Volume 1, pp. 315–340. [Google Scholar]
  40. Havlik, T. Hydrometallurgy—Principes and applications; Woodhead Publishing Limited: Cambridge, UK, 2008; p. 536. ISBN 978-1-84569-407-4. [Google Scholar]
  41. Takáčová, Z.; Havlik, T.; Kukurugya, F.; Orac, D. Cobalt and Lithium Recovery from Active Mass of Spent Li-ion Batteries: Theoretical and Experimental Approach. Hydrometallurgy 2016, 163, 9–17. [Google Scholar] [CrossRef]
  42. Iler, R.K. The Chemistry of Silica: Solubility, Polymerization, Colloid and Surface Properties, and Biochemistry; Wiley: New York, NY, USA, 1979. [Google Scholar]
  43. Icopini, G.A.; Brantley, S.L.; Heaney, P.J. Kinetics of silica oligomerization and nanocolloid formation as a function of pH and ionic strength at 25 °C. Geochimica Cosmochimica Acta 2005, 69, 293–303. [Google Scholar] [CrossRef]
Figure 1. Li slag from EAF: (a) before mechanical pretreatment, (b) after mechanical pre-treatment consisting of crushing, grounding, magnetic separation, and sieving.
Metals 10 01558 g001
Figure 2. Metal phases obtained by magnetic separation: (a) after crushing (b) after grounding.
Metals 10 01558 g002
Figure 3. XRD analysis of the Li slag.
Metals 10 01558 g003
Figure 4. Eh-pH diagram for Li-Al-S-Si-H2O system: (a) 20 °C, (b) 80 °C. Molarity: (Li) = 1 M, (Al) = 0.5 M, (S) = 0.5 M and (Si) = 0.05 M.
Metals 10 01558 g004aMetals 10 01558 g004b
Figure 5. Eh-pH diagram for Al-Li-S-Si-H2O system: (a) 20 °C; (b) 80 °C. Molarity: (Li) = 1 M, (Al) = 0.5 M, (S) = 0.5 M and (Si) = 0.05 M.
Metals 10 01558 g005aMetals 10 01558 g005b
Figure 6. Eh-pH diagram for Si-Al-Li-S-H2O system: (a) 20 °C, (b) 80 °C. Molarity: (Li) = 1 M, (Al) = 0.5 M, (S) = 0.5 M and (Si) = 0.05 M.
Metals 10 01558 g006aMetals 10 01558 g006b
Figure 7. Lithium leaching efficiency at 20–80 °C in 0.5 M (a) and 1 M (b) H2SO4.
Metals 10 01558 g007
Figure 8. Aluminum leaching efficiency at 20–80 °C in 0.5 M (a) and 1 M (b) H2SO4.
Metals 10 01558 g008
Figure 9. Silicon leaching efficiency at 20–80 °C in 0.5 M (a) and 1 M (b) H2SO4.
Metals 10 01558 g009
Figure 10. Input kinetic data of lithium leaching used for apparent activation energy calculations.
Metals 10 01558 g010
Figure 11. Kinetic data after linearization by cylindrical diffusion kinetic model.
Metals 10 01558 g011
Figure 12. Apparent activation energy determination from the slope of Arrhenius plot at two different molarities of H2SO4.
Metals 10 01558 g012
Figure 13. Gel aggregates present in the solutions after direct leaching of the Li slag: (a) formed after filtration of the leaching residue; (b) formed before filtration with entrapped leaching residues particles.
Metals 10 01558 g013
Figure 14. Solution before (top) and 30 min after addition of 17.9 M H2SO4 (bottom).
Metals 10 01558 g014
Figure 15. Potential energy diagram of LiAlSiO4 phase leaching with the focus on the silicon phases.
Metals 10 01558 g015
Figure 16. Lithium leaching efficiency in H2O using (a) 5 mL of H2SO4, (b) 10 mL of H2SO4, (c) 15 mL of H2SO4.
Metals 10 01558 g016aMetals 10 01558 g016b
Figure 17. Aluminum leaching efficiency in H2O using (a) 5 mL of H2SO4, (b) 10 mL of H2SO4, (c) 15 mL of H2SO4.
Metals 10 01558 g017
Figure 18. Silicon leaching efficiency in H2O using (a) 5 mL of H2SO4, (b) 10 mL of H2SO4, (c) 15 mL of H2SO4, (d) silicon dissolution in 10th min of neutral leaching.
Metals 10 01558 g018
Figure 19. Leaching residue and precipitated phase after dry digestion followed by neutral leaching.
Metals 10 01558 g019
Figure 20. XRD analysis of input slag sample (black) leaching residue after leaching (red) and precipitated phase (blue).
Metals 10 01558 g020
Figure 21. Lithium concentration and leaching efficiency.
Metals 10 01558 g021
Figure 22. Aluminum concentration and leaching efficiency.
Metals 10 01558 g022
Figure 23. Silicon concentration and leaching efficiency.
Metals 10 01558 g023
Figure 24. Fraction diagrams of precipitation: (a) aluminum; (b) lithium.
Metals 10 01558 g024
Figure 25. Proposed approach for lithium slag recycling by dry digestion method.
Metals 10 01558 g025
Table 1. Chemical composition of the slag before and after magnetic separation.
SampleLiCoCuAlFeSiCaNiMn
Li slag6.801.171.5316.520.5148.621.160.150.65
De-metalized Li slag6.960.000.1116.400.2051.101.260.010.88
Table 2. Estimated value of the elements in the Li slag, data from [36,37].
ElementsContentMarketable ProductsPrice of Marketable Products (US $/t)Estimated Value of Marketable Products in 1 t of Li Slag (US $)
Li6.96%Li2CO3 (Li = 18.79%)67502500.27
Al16.40%Al2243.86367.99
Si51.10%SiO2 (Si= 46.74%)100–120109–131
Mn0.88%Mn1525.8313.43
Cu0.11%Cu7703.938.47
Ca1.26%CaO (Ca= 71.47%)801.41–1.76
Ni0.01%Ni17,935.941.79
Fe0.20%Fe2850.57
Co0.00%Co32,985-
Table 3. Potential reactions of slag phases and ΔG° values in the H2SO4 leaching system, data from [38].
EquationReactionΔG°293.15 [kJ]ΔG°353.15 [kJ]
(1)2LiAlSiO4 + 4H2SO4(l) = Li2SO4(ia) + Al2(SO4)3(ia) + 2H4SiO4(a)−274.727−274.783
(2)2LiAlSiO4 + 4H2SO4(l) = Li2SO4(ia) + Al2(SO4)3(ia) + 2H2SiO3(a) + 2H2O−300.098−272.695
(3)2LiAlSiO4 + 4H2SO4(l) = Li2SO4(ia) + Al2(SO4)3(ia) + 2SiO2 + 4H2O−302.950−303.060
(4)2LiAlSi2O6 + 4H2SO4(l) + 4H2O = Li2SO4(ia) + Al2(SO4)3(ia) + 4H4SiO4(a)−216.581−218.504
(5)Li2SiO3 + H2SO4(l) = Li2SO4(ia) + H2SiO3(a)−151.744−141.622
(6)Li2SiO3 + H2SO4(l) + H2O(l) = Li2SO4(ia) + H4SiO4(a)−152.092−142.666
Table 4. Kinetics models and linear relationship of model functions over time represented by coefficient of determination (R2) value, kinetic models from [39].
Kinetic ModelsLinear Relationship (R2)
1. Linear α-t dependency20 °C40 °C60 °C80 °C
No   kinetic   model   applied :   f ( α ) = α = % M e 100 0.800.590.450.37
2. Deceleratory α–t curves
2.1. Based on geometrical models
Contracting   area   ( cylindrical   symmetry ) :   f ( α ) = 1 ( 1 α ) 1 2 0.900.770.630.47
Contracting   volume   ( spherical   symmetry ) :   f ( α ) = 1 ( 1 R ) 1 3 0.930.830.720.53
2.2. Based on diffusion mechanism
1 D   diffusion : f ( α ) = α 2 0.930.780.560.40
2 D   diffusion :   f ( α ) = ( 1 α ) · ln ( 1 α ) + α 0.970.890.690.46
3 D   diffusion   ( cylindrical ) :   f ( α ) = [ 1 ( 1 α ) 1 3 ] 2 1.000.990.920.64
3 D   Ginstling Brounstein   diffusion   ( spherical ) :   f ( α ) = ( 1 2 α 3 ) ( 1 α ) 2 3 0.980.940.780.53
2.3. Based on order of reaction
First   order : f ( α ) = ln ( 1 α ) 0.980.930.890.59
Sec ond - order   chemical   reaction : f ( α ) = ( 1 α ) 1 0.990.950.900.17
Third - order   chemical   reaction : f ( α ) = ( 1 α ) 2 0.860.800.730.11
3. Acceleratory α –t curves
Power   law : f ( α ) = α 1 n (n = 0.25)0.980.950.730.45
Power   law : f ( α ) = α 1 n (n = 0.5)0.930.780.560.40
Power   law : f ( α ) = α 1 n (n = 1)0.800.590.450.37
Power   law : f ( α ) = α 1 n (n = 2) 0.620.470.400.36
Exponential   law : f ( α ) = ln α 0.130.120.150.14
4. Sigmoidal α–t curves
Avrami Erofeev   nucleation   and   growth   ( n = 2 ) :   f ( α ) = [ ln ( 1 α ) ] 1 2 0.830.730.680.54
Avrami Erofeev   nucleation   and   growth   ( n = 3 ) :   f ( α ) = [ ln ( 1 α ) ] 1 3 0.710.610.580.49
Avrami Erofeev   nucleation   and   growth   ( n = 4 ) :   f ( α ) = [ ln ( 1 α ) ] 1 4 0.630.550.520.46
Prout Tompkins : f ( α ) = ln [ R 1 α ] 0.970.950.900.17
Table 5. Thermodynamic data of reactions in which SiO2 precipitates from H4SiO4.
EquationReactionΔH°293.15 (kJ)ΔH°353.15 (kJ)ΔG°293.15 (kJ)ΔG°353.15 (kJ)
(12)H4SiO4(a) = SiO2 + 2H2O(l)−13.642−14.203−14.112−14.139
(13)H4SiO4(a) = SiO2 + 2H2O(g)74.78269.2174.199−9.698
Table 6. Solid sample atomic absorption spectrometry (AAS) analysis and calculated dissolution rate of lithium and aluminum.
Sample (Slag:H2SO4:H2O)Leaching Residue WeightLiAl
Solid (AAS)Solution (Calculated)Solid (AAS)Solution (Calculated)
Input sample100.00%100.00%-100.00%-
10:10:2454.16% (5.41 g)0.07%99.93%0.36%99.64%
25:25:6055.32% (13.83 g)0.07%99.93%0.57%99.43%
50:50:12045.03% (22.51 g)0.34%99.66%1.59%98.41%
100:100:24049.96% (49.96 g)2.76%97.24%3.81%96.19%
Table 7. AAS analysis of the solutions obtained by washing of the leaching residues by 500 mL of H2O.
Trial (Slag:H2SO4:H2O)LiAlSi
(µg/mL)(%)(µg/mL)(%)(µg/mL)(%)
10:10:2416.071.15%1364.70%830.81%
25:25:6034.30.98%5537.65%2490.97%
50:50:1205467.80%154810.71%2890.57%
100:100:240355525.39%646022.34%3110.30%
Table 8. pH values of solutions at the beginning and after the end of DD mixture water leaching.
Slag:H2SO4:H2O10:10:2425:25:6050:50:120100:100:240
pH00.4660.097−0.159−0.383
pH11.3221.0330.7520.494
Publisher’s Note: MDPI stays neutral with regard to jurisdictional claims in published maps and institutional affiliations.

