Review

Effect of Laser Peening on the Mechanical Properties of Aluminum Alloys Probed by Synchrotron Radiation and X-Ray Free Electron Laser

1
Energy Systems Research and Development Center, Toshiba Energy Systems & Solutions Corporation, 8 Shinsugita-cho, Isogo-ku, Yokohama, Kanagawa 235-8523, Japan
2
Division of Research Innovation and Collaboration, Institute for Molecular Science, National Institutes of Natural Sciences, 38 Nishigo-Naka, Myodaiji, Okazaki, Aichi 444-8585, Japan
3
Department of Quantum Beam Physics, Institute of Scientific and Industrial Research, Osaka University, 8-1 Mihogaoka, Ibaraki, Osaka 567-0047, Japan
4
Department of Mechanical Systems Engineering, National Institute of Technology, Okinawa College, 905 Henoko, Nago, Okinawa 905-2192, Japan
5
Department of Mechanical Systems Engineering, Faculty of Science and Engineering, Tokyo City University, 1-28-1 Tmamazutsumi, Setagaya-ku, Tokyo 158-8557, Japan
6
Japan Synchrotron Radiation Research Institute, 1-1-1, Kouto, Sayo-cho, Sayo-gun, Hyogo 679-5198, Japan
7
Division of Materials and Manufacturing Science, Graduate School of Engineering, Osaka University, 2-1 Yamada-oka, Suita, Osaka 565-0871, Japan
*
Author to whom correspondence should be addressed.
Metals 2020, 10(11), 1490; https://doi.org/10.3390/met10111490
Submission received: 13 October 2020 / Revised: 2 November 2020 / Accepted: 6 November 2020 / Published: 9 November 2020
(This article belongs to the Special Issue Laser Peening for Improving Fatigue Properties of Aluminium Alloys)

Abstract

:
Synchrotron radiation (SR) and X-ray free electron laser (XFEL) are indispensable tools not only for the exploration of science but also for the evolution of industry. We used SR and XFEL to elucidate the mechanism and the effects of laser peening without coating (LPwC) which enhances the durability of metallic materials. X-ray diffraction (XRD) employing SR revealed that the residual stress (RS) in the top surface became compressive as the laser pulse irradiation density increased with appropriate overlapping of adjacent laser pulses. SR-based computed tomography (CT) was used to nondestructively reconstruct three-dimensional (3D) images of fatigue cracks in aluminum alloy, revealing that LPwC retarded crack propagation on the surface and inside of the sample. SR-based computed laminography (CL) was applied to friction stir welded (FSWed) aluminum alloy plates to visualize fatigue cracks propagating along the welds. The fatigue crack had complicated shape; however, it became a semi-ellipsoid once projected onto a plane perpendicular to the fatigue loading direction. Ultra-fast XRD using an XFEL was conducted to investigate the dynamic response of aluminum alloy to an impulsive pressure wave simulating the LPwC condition. The diffraction pattern changed from spotty to smooth, implying grain refinement or subgrain formation. Shifts in diffraction angles were also observed, coinciding with the pressure history of laser irradiation. The durations of the dynamic phenomena were less than 1 µs; it may be possible to use high-repetition lasers at frequencies greater than kHz to reduce LPwC processing times.

Graphical Abstract

1. Introduction

Structural materials in actual service are subjected to external loads in corrosive environments. Defects or cracks almost always commence at the surface because of stress concentration attributable to bending, torsion, roughness, or pitting. Therefore, surface enhancement is beneficial to extend the service life [1]. Laser shock peening (LSP) is a well-established method that induces compressive RSs on the surface, thus preventing crack initiation and propagation [2,3,4,5,6,7,8,9]. Since the mid-1990s, LSP has been used as a countermeasure against so-called foreign object damage (FOD) to prolong the high-cycle fatigue (HCF) life of jet-engine fan blades [10,11,12]. Recently, a sophisticated LSP system with a pulse energy of 10 J and a repetition rate of 20 Hz was commercialized [3]. Some researchers are applying LSP to new areas such as engineering ceramics [13] and medical implant [14]. Meanwhile, the authors previously described a laser peening process using low-energy laser pulses (0.1 J or less) [15,16,17,18,19]; no surface preparation (pasting of a “sacrificial overlay”) was required. We initially termed this process laser peening (LP) [19] and later laser peening without coating (LPwC) [20,21] to emphasize that no sacrificial overlay or coating was necessary. In this context, a novel technology of LPwC without using any confining medium named “Dry-LP” was developed using a femtosecond laser and the effects to prolong fatigue life [22] and reduce corrosion rate [23] were confirmed for A2024 aluminum alloy.
In LPwC, laser pulses directly impinge on the surface, heat it, and evaporate the surface to create a laser-induced high-pressure plasma, which induces impulsive pressure waves that propagate internally to generate permanent strain and a beneficial compressive RS in the near-surface layer. However, this may also induce a negative heat effect on the surface, creating an undesirable tensile RS that competes with the favorable effect of the compressive RS [24,25]. Recently, we summarized the results of a series of XRD experiments using SR and concluded that LPwC induced compressive RSs on top surfaces with the exception of the final laser spot when the irradiating laser pulse density was high and the adjacent laser pulses overlapped appropriately [26]. We took full advantage of valuable SR characteristics (high brilliance and spatial coherence) when precisely mapping RS distributions on top surfaces after single, line, and areal irradiations. The tensile component of RSs created by a laser pulse can be wiped out by succeeding laser pulses that appropriately overlap the prior pulse.
To explore fatigue crack propagation, we employed SR-based computed tomography (CT) and computed laminography (CL) to obtain 3D images of fatigue cracks; we utilized phase-contrast to enhance the edge of crack images. We succeeded in imaging a casting defect and a fatigue crack commencing from that defect in a rod-type fatigued sample of AC4CH cast aluminum alloy [27,28,29]. Intermittent CT imaging during fatigue loading showed that LPwC reduced crack propagation.
CL was employed to reconstruct images of fatigue cracks propagating in friction stir welded (FSWed) joints of A6061 aluminum alloy [30]. Friction stir welding (FSW) imparts a unique structure, reflecting material flow during welding [31,32,33,34,35,36]. In general, fusion welding creates a fused zone and an adjoining heat-affected zone (HAZ), the mechanical properties of which are inferior to those of the base material. Therefore, fatigue cracks usually commence in this region and propagate along the weld line or the HAZ [35,37]. In FSWed materials, a thermomechanically affected zone (TMAZ) exists between the stir zone (SZ; corresponding to the fused zone of fusion welding) and the HAZ, rendering crack propagation complicated and unpredictable. However, SR-based CL successfully reconstructed 3D images of fatigue cracks in FSWed joints and showed that the projected images of cracks on the plane perpendicular to the fatigue-loading direction were semi-ellipsoidal, as expected given the base material. Although the fatigue cracks propagated in an unpredictable manner, the projected images grew smoothly as the number of fatigue loading cycles increased, reducing the unpredictability of crack propagation in FSWed joints.
XFEL affords much higher brightness than SR [38,39,40,41,42]. A single XFEL pulse contains sufficient photons to study the dynamic response of materials to laser pulses using time-resolved XRD [43,44,45]. Immediately after completion of the SPring-8 angstrom compact free electron laser (SACLA; the XFEL facility constructed by RIKEN; Harima, Japan [38,39]) in 2011, we commenced “pump-probe” experiments to explore the microscopic phenomena and fundamental mechanism of material plastic deformation under LPwC conditions. Prior to the availability of XFEL, the effects of LPwC had been studied statically thus via evaluation of RSs and fatigue. A finite element method (FEM) based on continuum mechanics well-reproduced the RS state after LPwC, except that of the top surface subjected to a thermomechanical effect [5,25,46,47]. These approaches do not deal directly with microscopic phenomena, such as dislocation, grain refinement, phase transformation, or precipitation; such data are essential when seeking to understand plasticity, material hardening, and RS stability.
Here, we present the results of SR-based CT and CL on aluminum alloys in Section 2 and Section 3, respectively; we nondestructively visualized fatigue cracks in a 3D manner and evaluated the propagation. The results of ultra-fast XRD using an XFEL are described in Section 4; these revealed the dynamic responses of an aluminum alloy under an impulsive pressure wave that simulated the LPwC condition.

2. Imaging of Fatigue Cracks and Propagation Using SR-Based CT

Fatigue is a major cause of component failure. It is essential to understand how fatigue cracks propagate with reference to the critical safety points. Fatigue cracks are initially small; it is difficult to obtain 3D images of them using conventional X-ray CT, fluoroscopy, or other nondestructive methods. We sought to use an SR-based CT technique with a phase-contrast effect to image tiny fatigue cracks in macroscopic engineering objects [27,28,29,30,48,49].

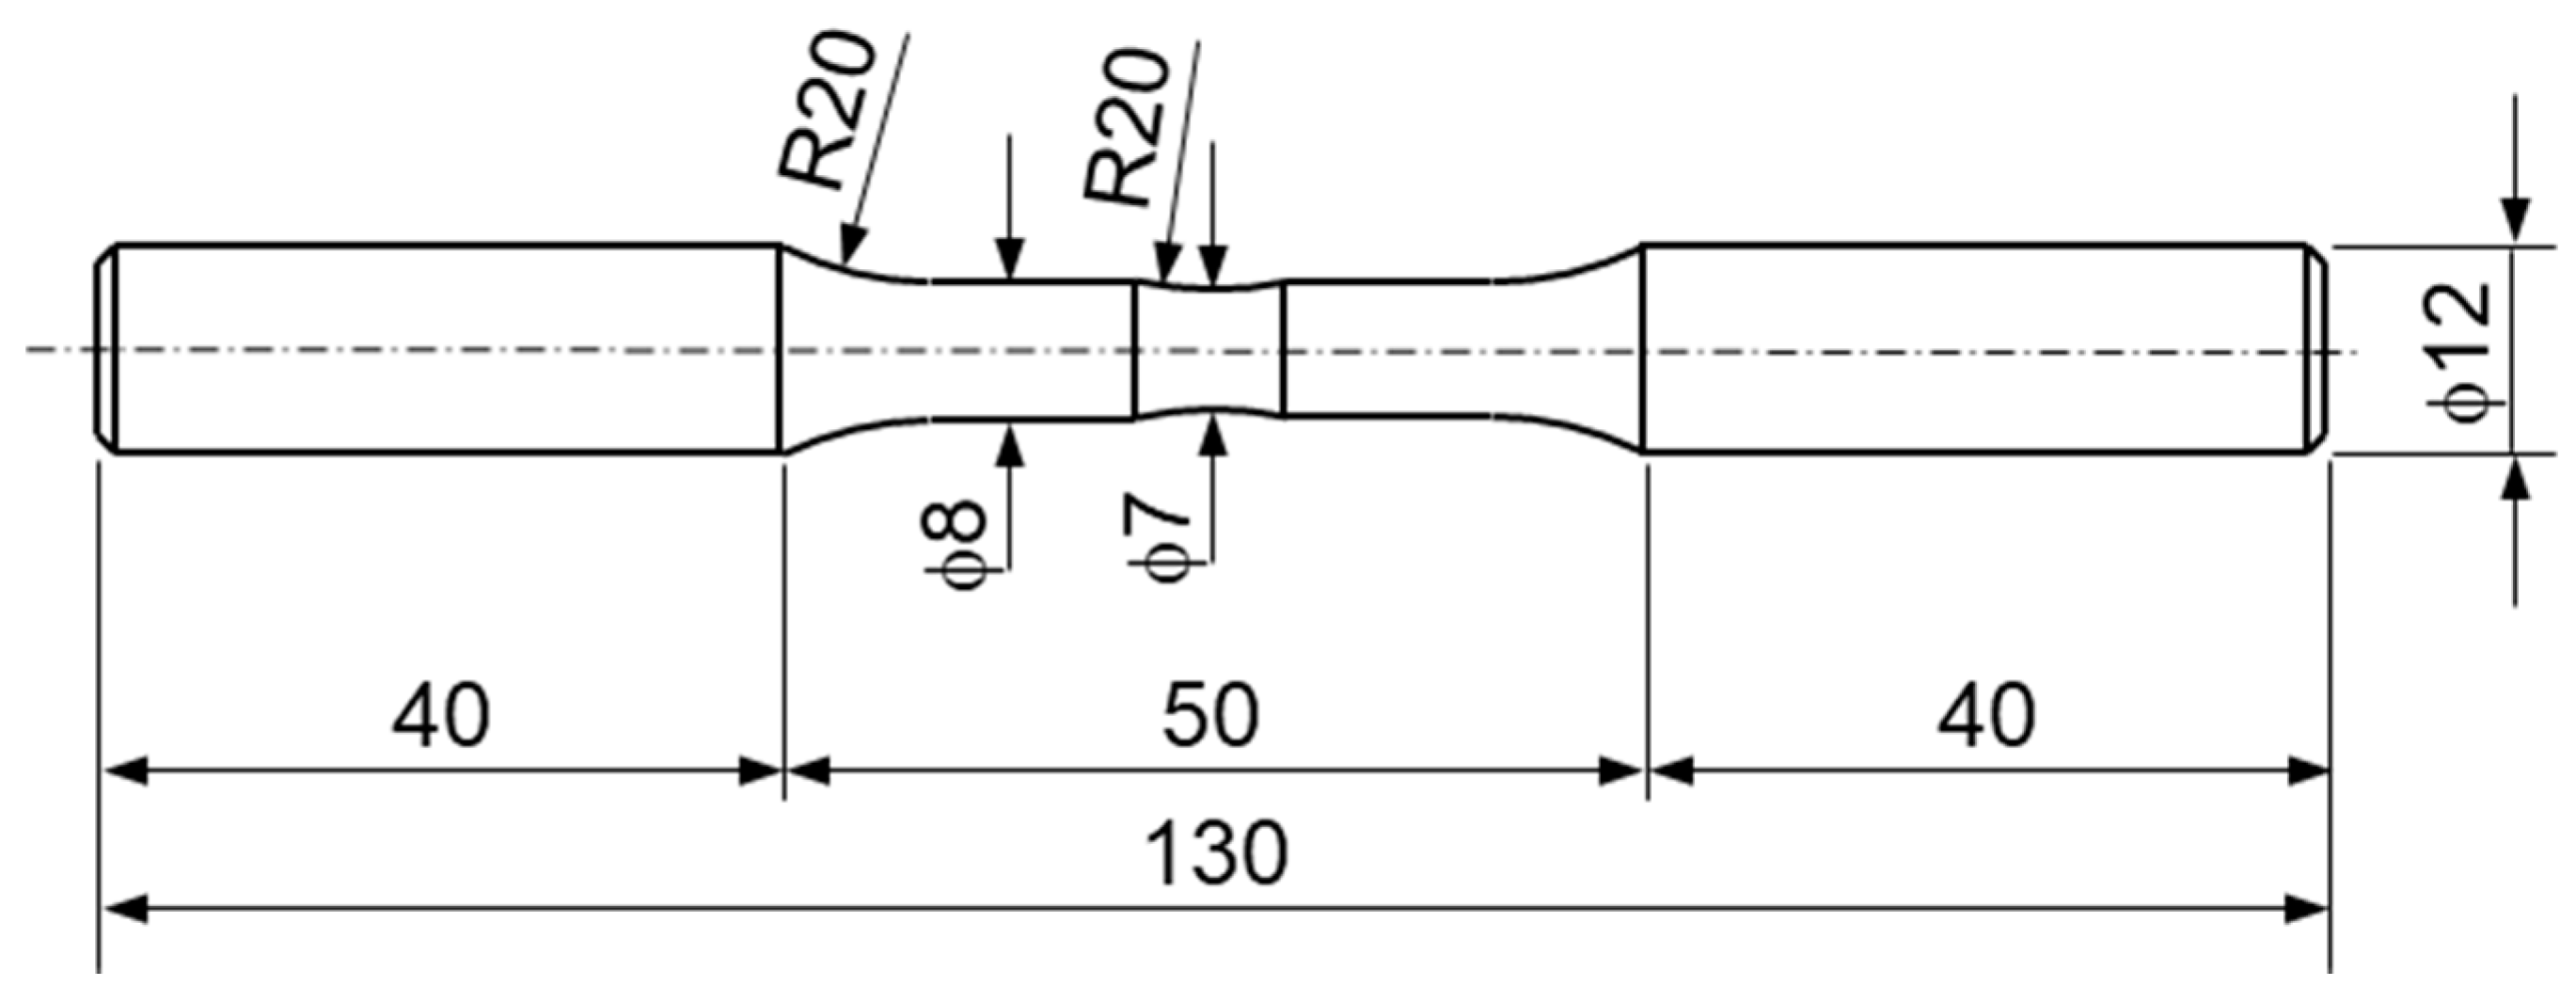
2.1. Sample Preparation

Fatigue test samples were prepared from a cast Al-Si-Mg alloy (JIS AC4CH). The shape and dimensions are shown in Figure 1 [50]. The chemical composition of AC4CH is given in Table 1. A minute hole (diameter 0.3 mm) was drilled in the center of each sample. Rotating-bending fatigue was used to trigger a crack commencing at the drill hole and extending to a length of 2.5 mm on the surface. Next, three samples out of eight were subjected to LPwC to induce compressive surface RSs that covered the crack. Then, an additional 1 × 10⁵ loading cycles were applied to all eight samples to confirm the effect of LPwC on crack propagation.
The crack length was measured by the replication method. A thin film of acetyl cellulose was attached to the crack surface using methyl acetate, the texture of the surface was transferred to the film, and the film was observed using a microscope to determine the crack length. Regarding LPwC, laser pulses with a wavelength of 532 nm and an energy of 100 mJ were irradiated to the sample immersed in water with a spot diameter 0.6 mm and a pulse density of 27 pulse/mm2, affording a peak power density of about 4 GW/cm2 [48]. RSs of about −100 to −200 MPa appeared on the surface after LPwC [50]. Typical depth profiles of RS are reported elsewhere [48].
The crack propagation curves are plotted in Figure 2 for samples that did and did not undergo LPwC. Each curve is shifted so that the fatigue loading cycle at a crack length of 2.5 mm on the surface is the origin of the horizontal axis. This compensates for crack initiation and propagation variations in the fatigue loading cycles until the crack length of 2.5 mm was attained. In the additional loading cycles, the cracks continuously grew in samples not subjected to LPwC, but not in samples subjected to LPwC which thus prohibited crack propagation.

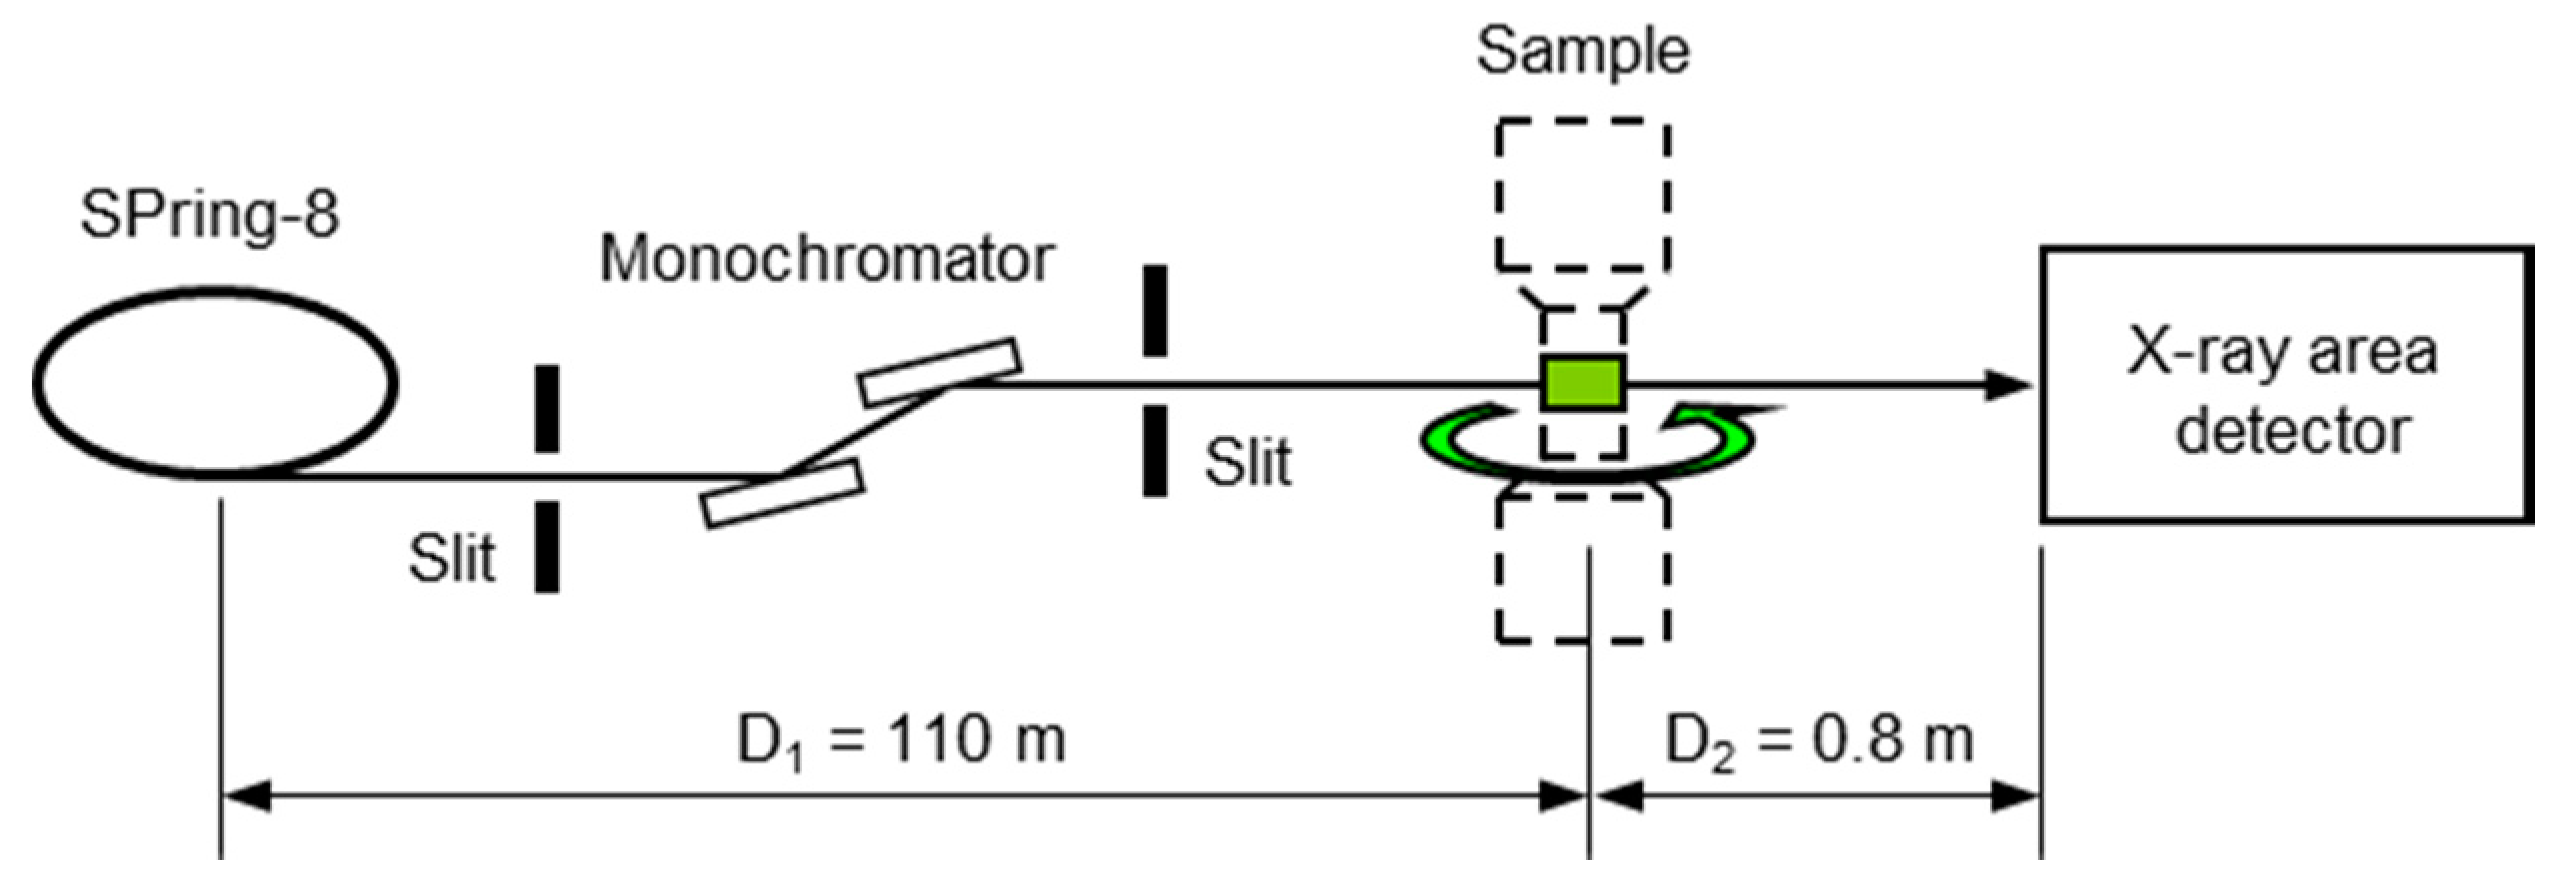
2.2. Experimental Setup for SR-Based CT

CT imaging of fatigue cracks used beamline BL19B2 of SPring-8 as shown in Figure 3. The X-ray energy was adjusted to 28 keV using a double-crystal monochromator. The sample was placed about 110 m distant from the X-ray source (a bending magnet). The X-ray area detector (a cooled CCD camera) was positioned 0.8 m behind the sample to allow a phase-contrast effect. During sample rotation, projected data of 1024 × 1024 pixels were recorded every 0.5° from 0 to 180°. The detector pixel size corresponded to about 6 μm, given its optical magnification of a relay lens after an X-ray-to-visible converter. Each slice was reconstructed using a filtered-back projection algorithm.
The distance between the X-ray source and the sample was determined by considering the blur of the image and the resolution of the detector [48]. The X-ray source size was 0.3 mm wide and 0.1 mm high. Since the magnification of the experimental system (D2/D1) was 7.3 × 10⁻³, the horizontal blur was 2.2 µm and the vertical was 0.7 µm, which are sufficiently small compared to the resolution of the X-ray area detector of about 6 µm.

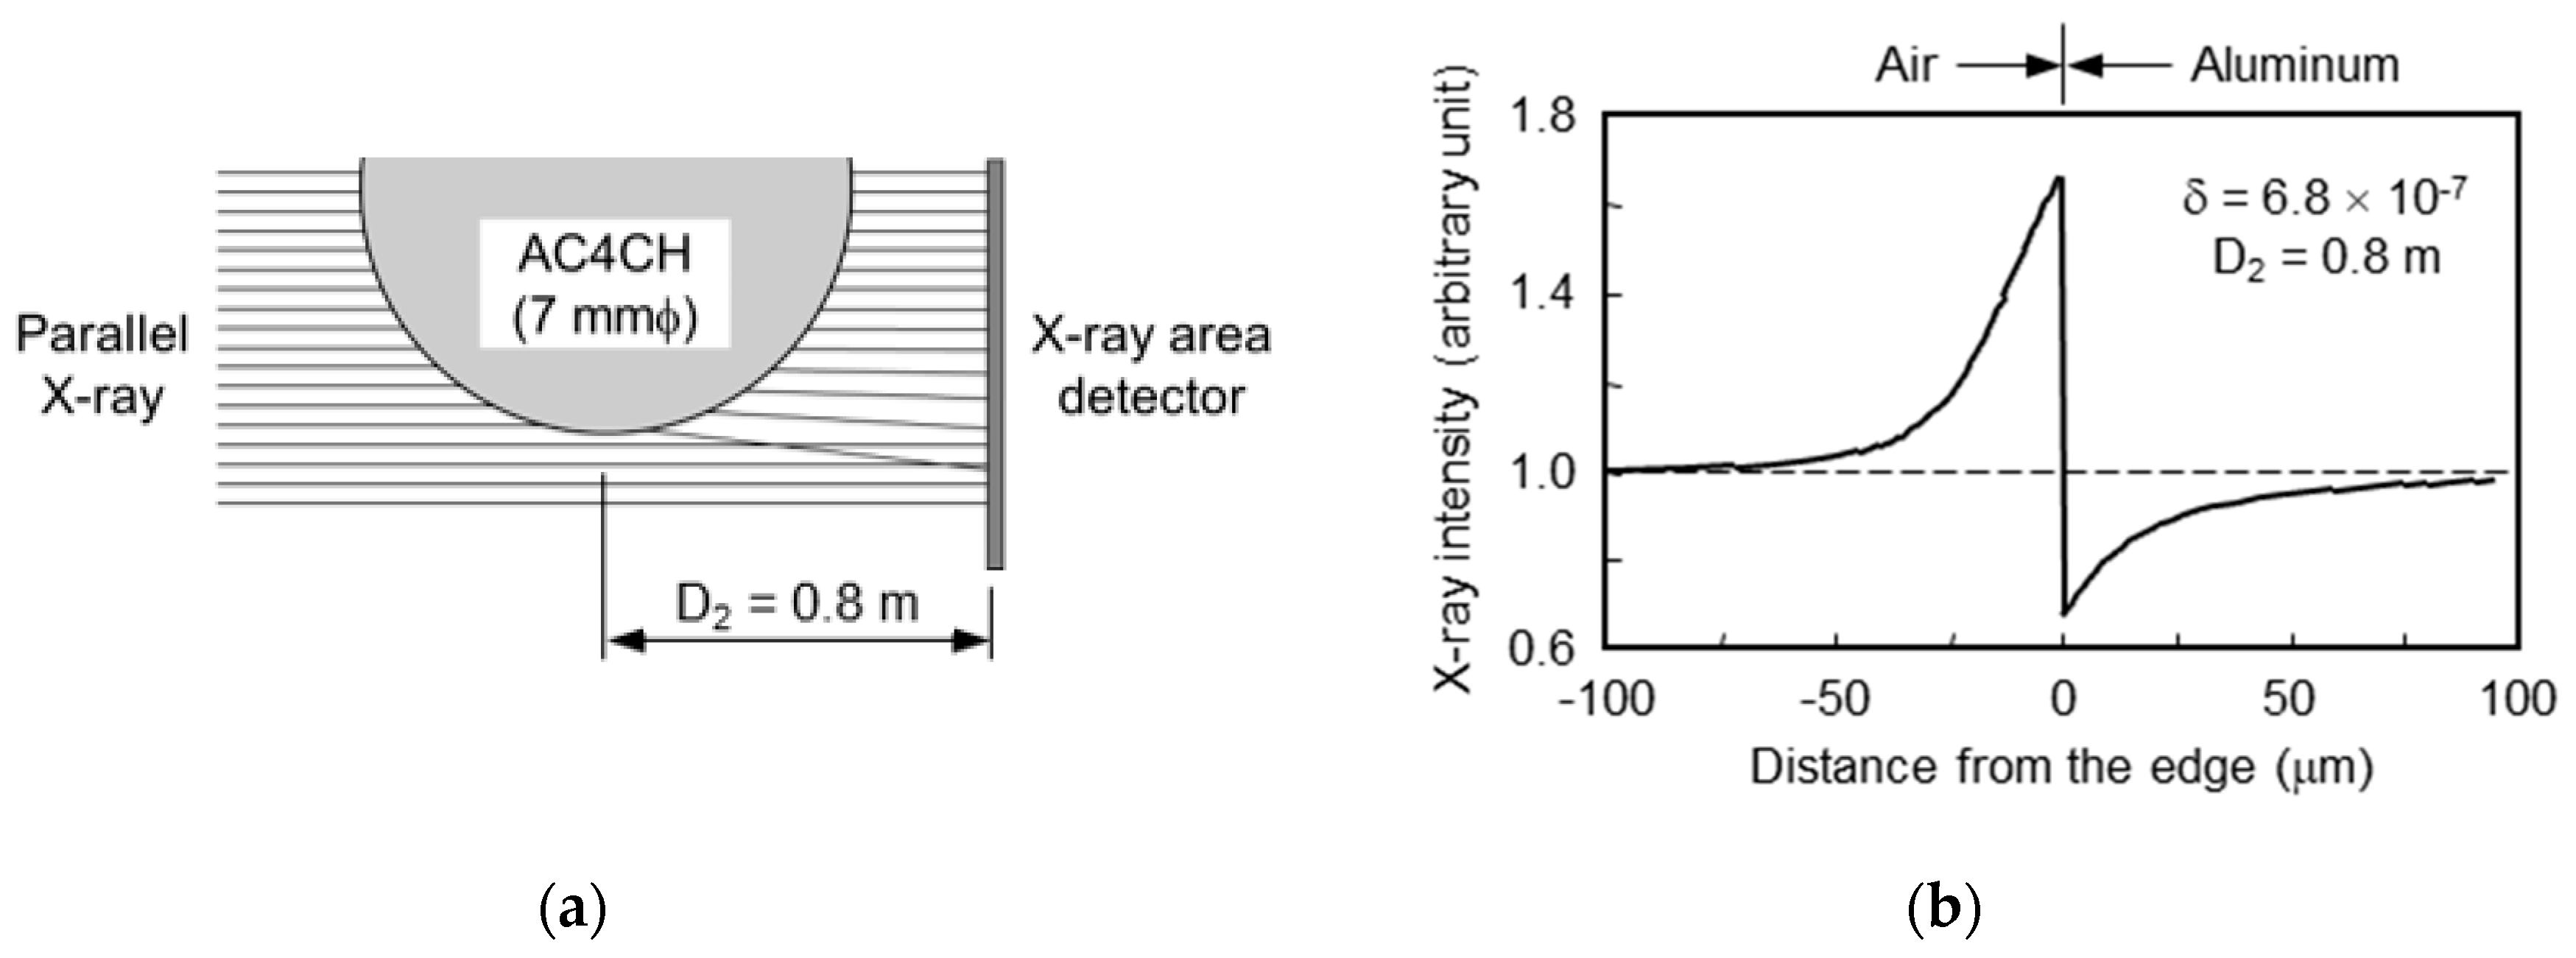
2.3. The Phase-Contrast Effect

Before experiment, the phase-contrast effect was evaluated via ray-trace calculation [51,52,53,54]. The sample serves as a concave lens because the refractive index of a hard X-ray within a material is slightly smaller than unity (in this case, by 6.8 × 10⁻⁷) [48,53]. The calculated edge enhancement attributable to phase-contrast is shown in Figure 4. A pair of bright and dark lines (a fringe) must be evident in the projected image. The extent of edge enhancement is several tens of micrometers, thus much greater than the resolution of the X-ray area detector (about 6 μm).

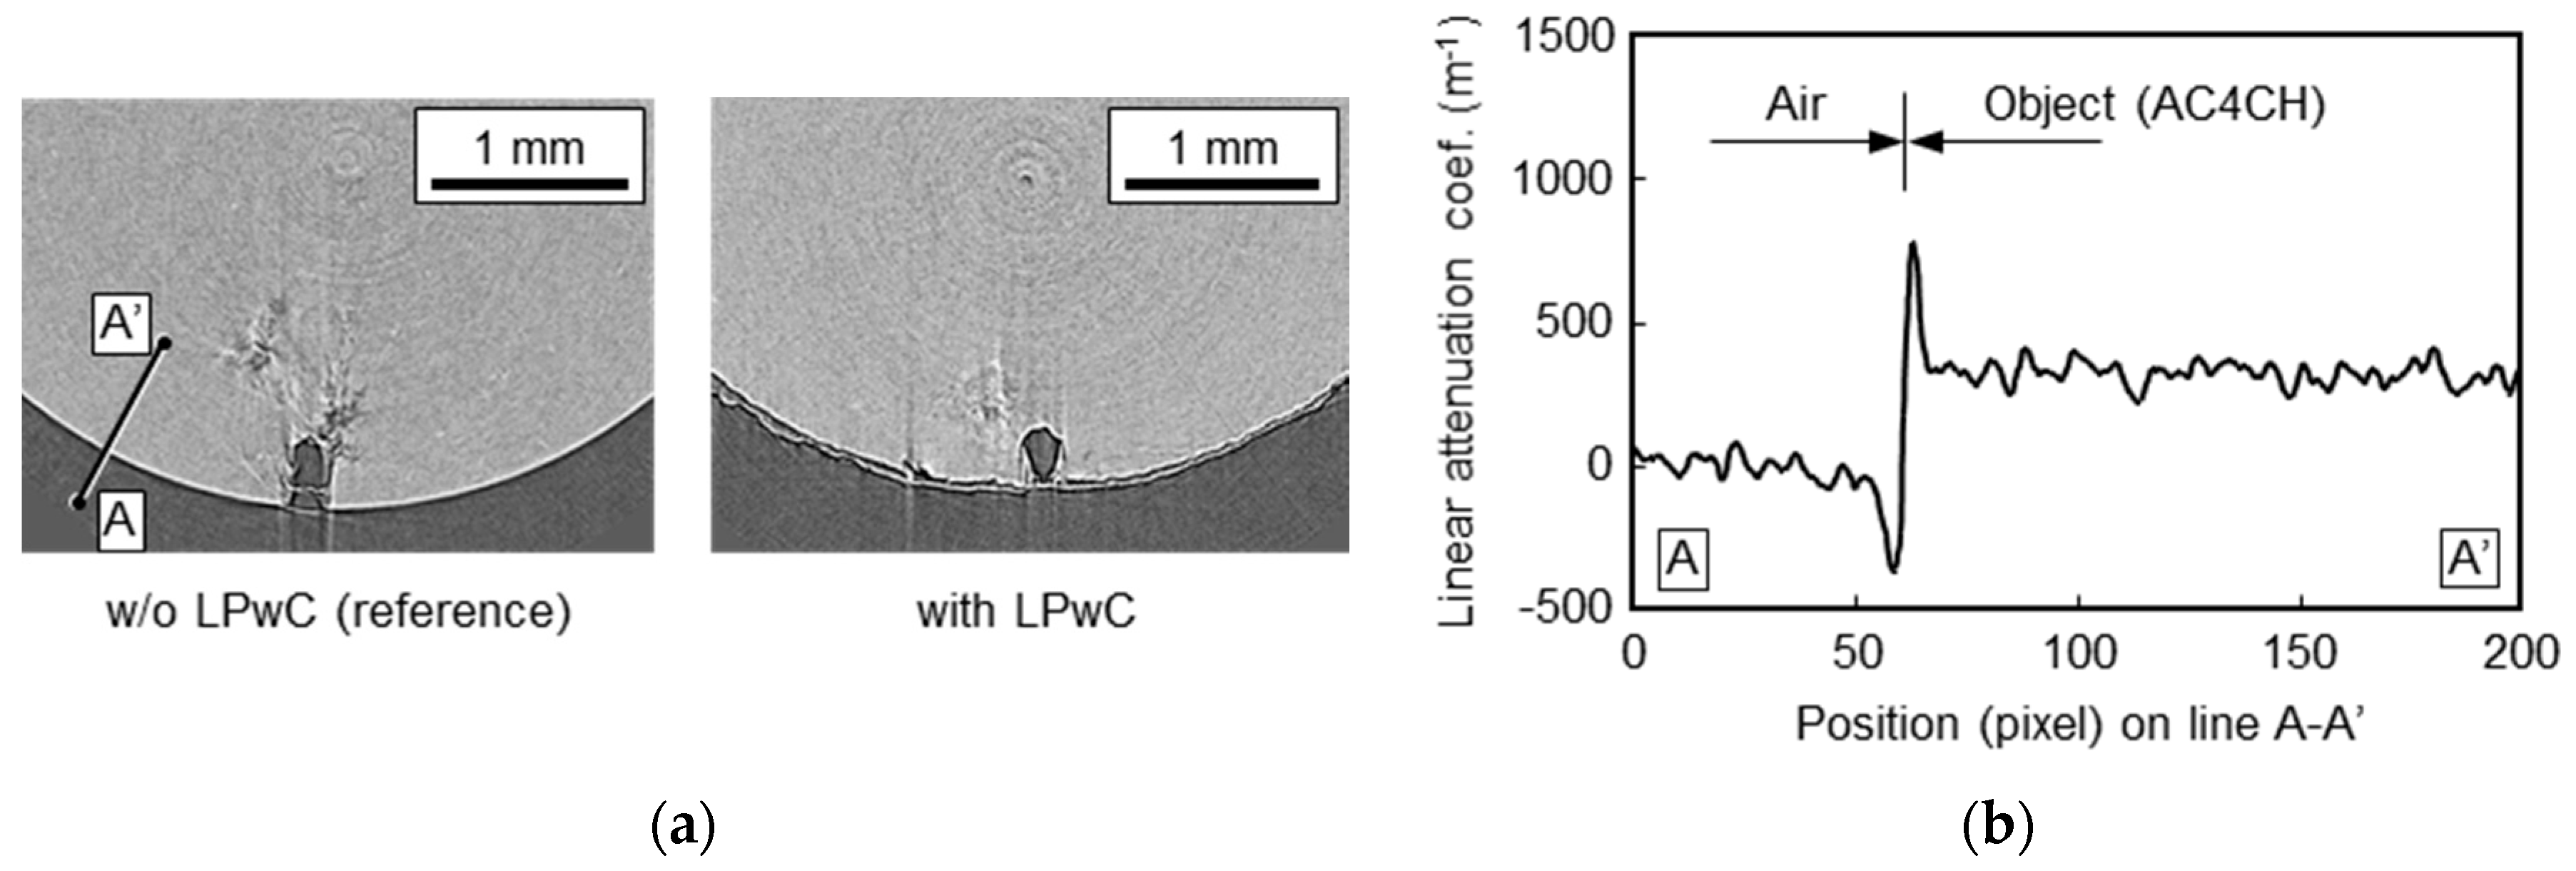
2.4. Reconstruction of Crack Images

CT was used to image fatigue cracks after the additional 105 loading cycles in samples subjected or not to LPwC. Figure 5a shows images at the levels of the drilled holes of such samples. The hole is notably distorted after LPwC, implying that LPwC induced significant plastic surface flow [28]. The contrasting area near the hole is the crack opening. As predicted by Figure 4, the boundaries between the objects and air are enhanced by the pair of bright and dark lines. The linear attenuation coefficients along the line A-A’ in the sample not subjected to LPwC are plotted in Figure 5b. The edge enhancement attributable to phase-contrast is clear.
The crack image of each slice was extracted and sequentially stacked to build 3D images of fatigue samples that did and did not undergo LPwC (Figure 6) [28]. The white shadows are the crack openings. The upper images are views parallel to the sample axis; the lower images are views perpendicular to that axis. The drilled holes are in the centers of the shadows; the cracks propagated from the holes. A comparison shows that fatigue crack propagation was retarded by LPwC not only on the surface but also internally.

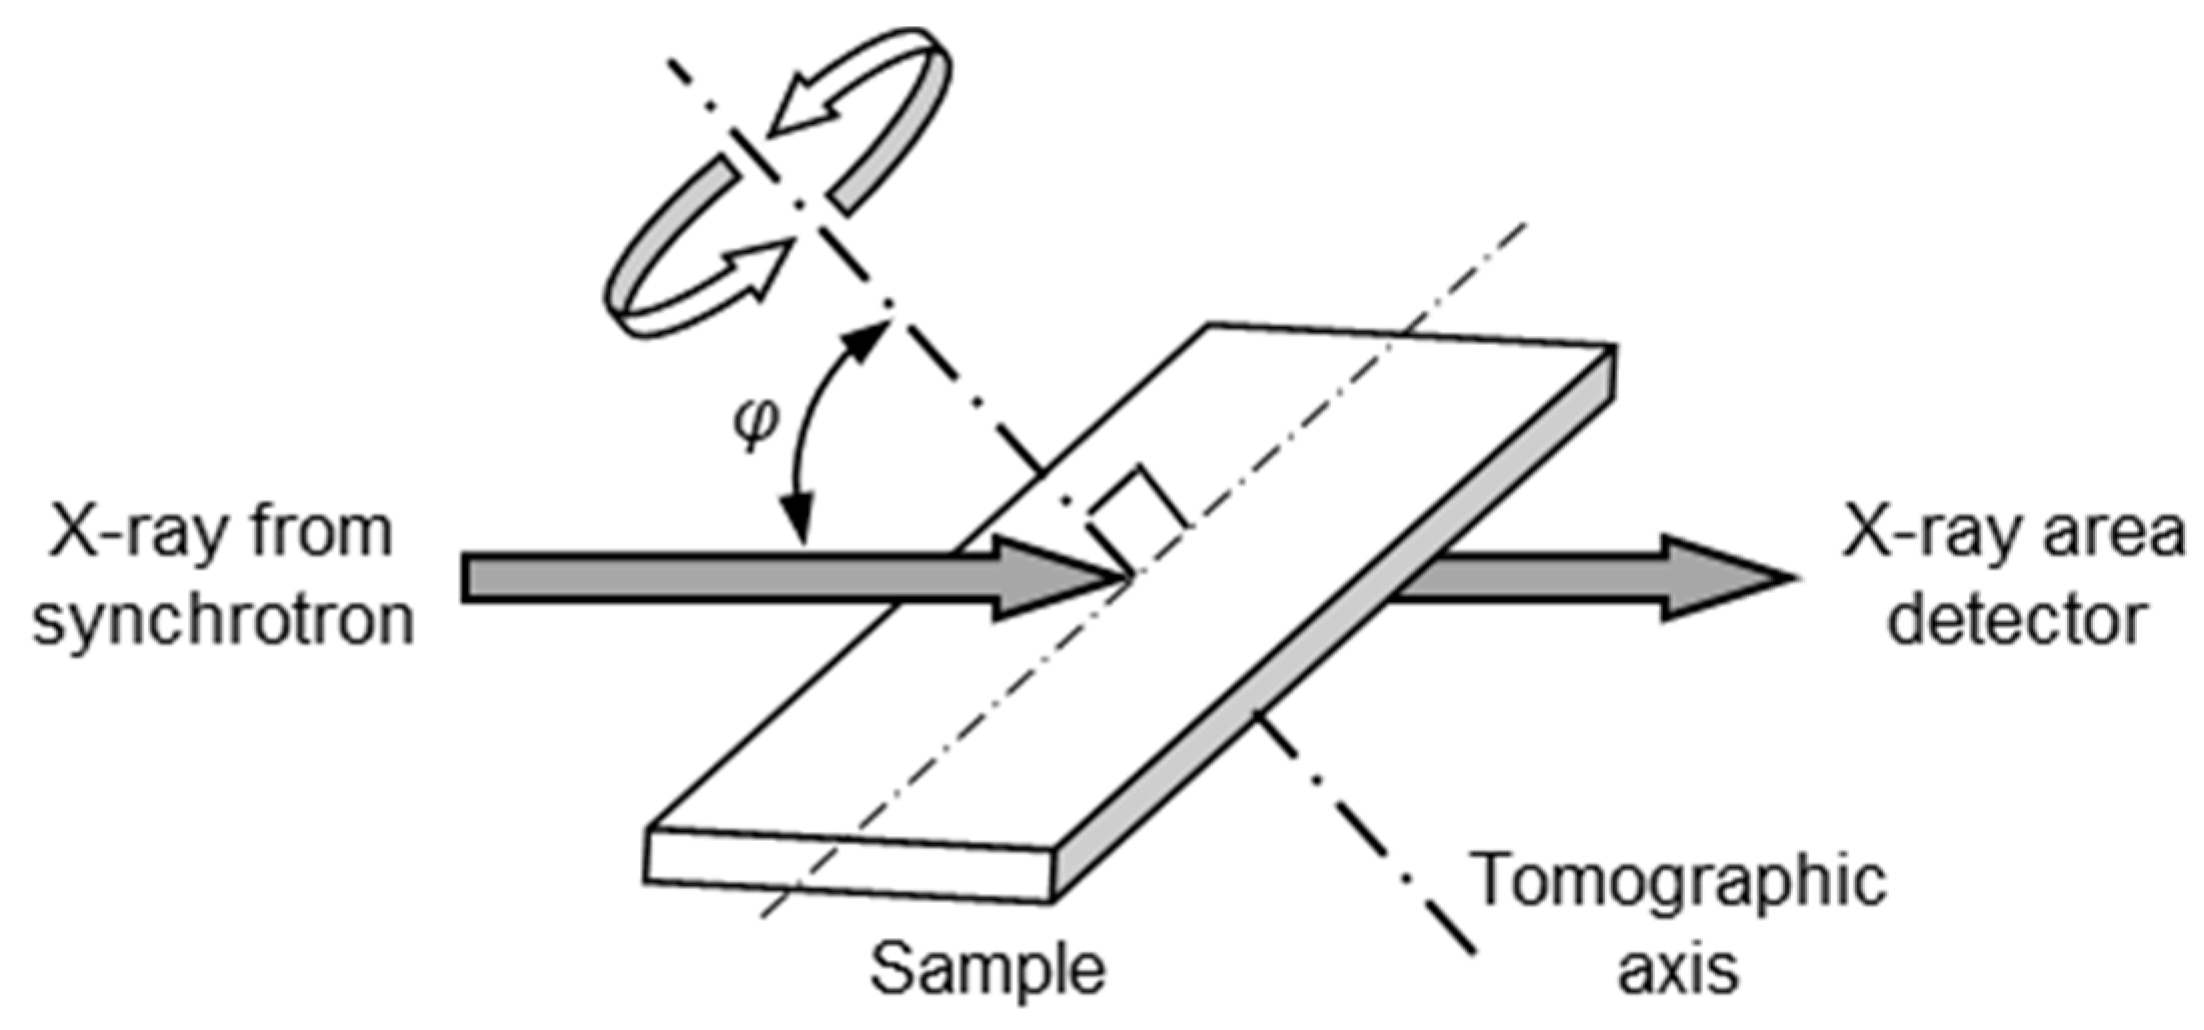
3. Imaging of Fatigue Cracks in FSWed Joints Using SR-Based CL

FSW is an emerging solid-state joining process and serves as an alternative to fusion welding of aluminum alloys [55,56,57]. Heat input is less than that associated with fusion welding; FSW thus creates less distortion, reducing time and labor for post-processing. However, the stirring creates inhomogeneous anisotropic microstructures reflecting material flow. These influence the mechanical properties, especially fatigue, which must be assessed prior to any application. We earlier showed that LPwC enhanced the HCF properties of FSWed A6061-T6 aluminum alloy plates under plane-bending fatigue, as shown in Figure 7 [58,59]. LPwC was applied at first to the top surface (crown side) with a 60 mJ pulse energy, a 0.7 mm spot diameter and an 18 pulse/mm2 pulse density, then applied to the bottom surface (root side) with a 27 pulse/mm2 pulse density. LPwC increased the fatigue strength of the FSWed material beyond that of the base material under an HCF regime. However, the propagation behaviors of fatigue cracks in FSWed joints differed greatly from those in the base material [60,61,62,63,64,65].
As described in Section 2, CT was used to reconstruct 3D images of fatigue cracks in rod-shaped AC4CH samples. However, it is difficult to apply CT to laterally extended objects such as FSWed joints because X-ray attenuation drastically varies during the rotational scan. CL can be used to visualize the internal structures of objects such as printed circuit boards [66,67,68,69,70,71]. The CL setup is similar to that of CT; the tomographic axis is inclined as shown in Figure 8. In this configuration, the X-ray attenuation does not change significantly during the rotation. We performed SR-based CL to nondestructively reconstruct 3D images of fatigue cracks inside the FSWed joints at BL19B2 in SPring-8. The reconstructed 3D images were compared to macroscopic photographs of the fracture surface, demonstrating the effectiveness of SR-based CL.

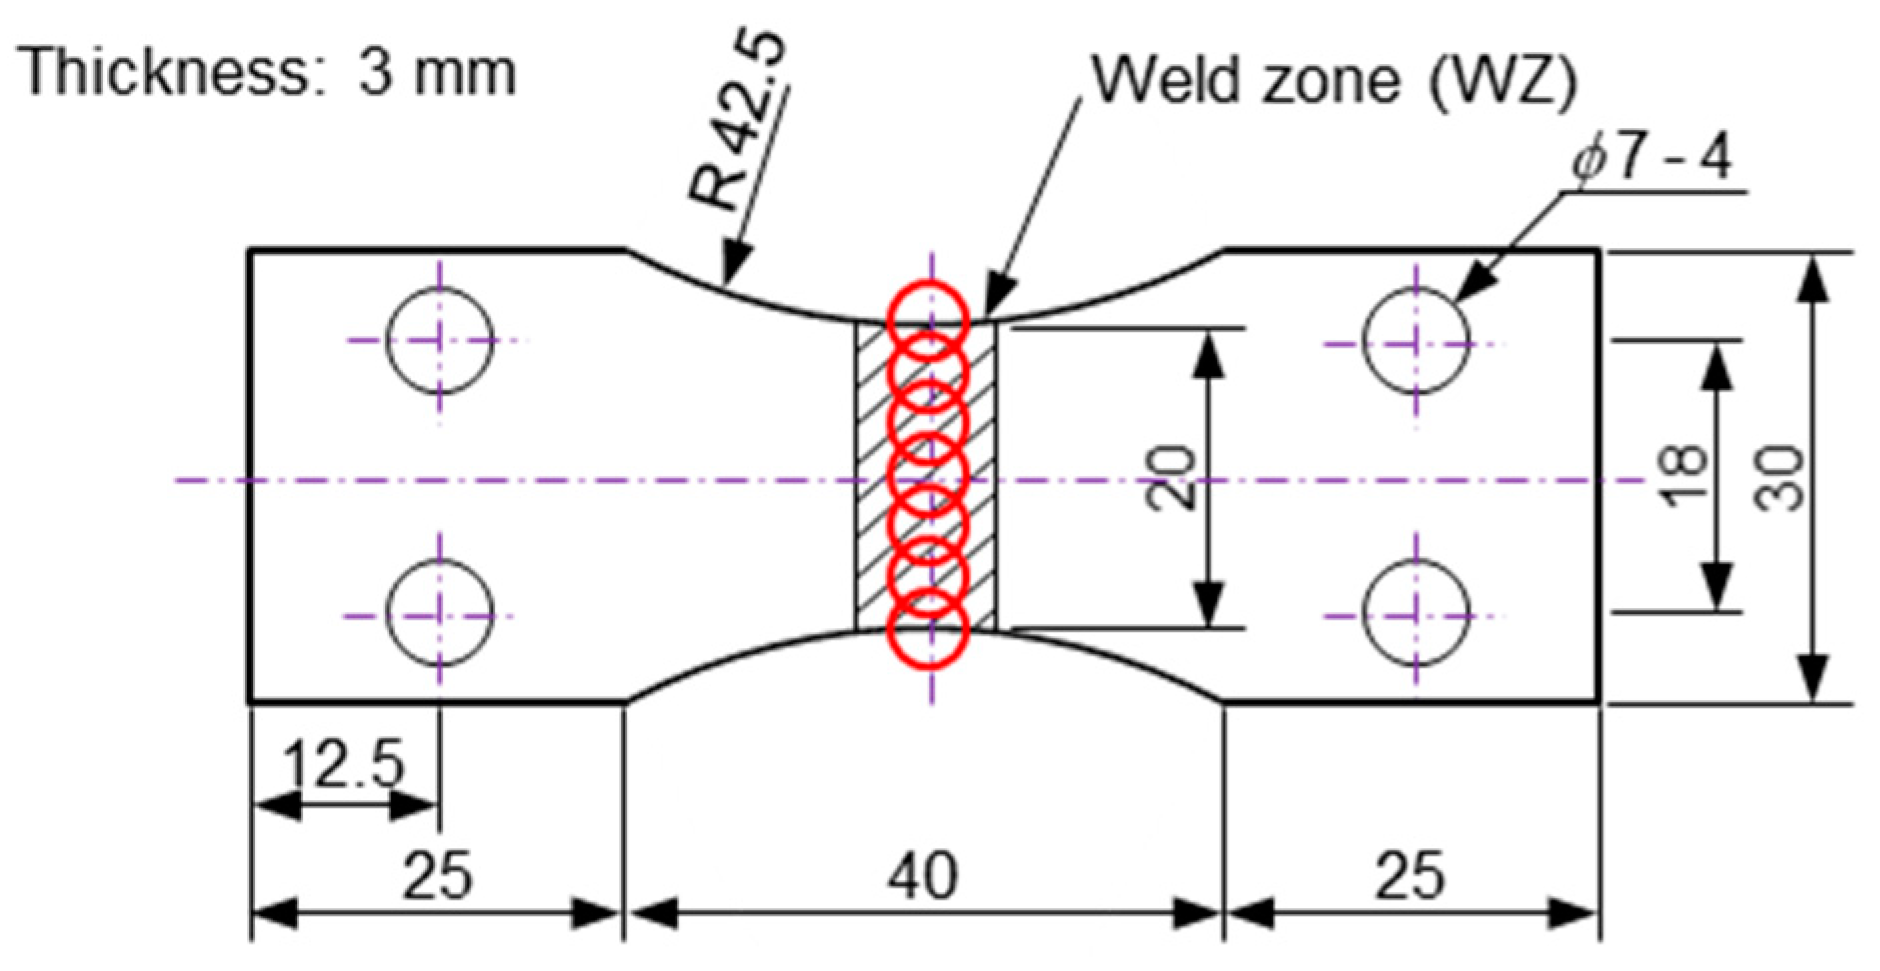
3.1. Preparation of FSWed Joints

The base material (BM) was a 3 mm thick A6061-T6 aluminum alloy plate with the chemical composition described in Table 2. The FSW procedure has been described elsewhere [59]. The mechanical properties of BM and the joint are listed in Table 3.
Fatigue samples were cut from FSWed plates via wire electric discharge machining. A sample is shown in Figure 9. The hatched area is the weld zone (WZ) and the red circles are the fields of view in the CL setup. The top (crown) and bottom (root) surfaces were skimmed with an end mill to remove burrs or irregularities formed during FSW. The top, bottom, and side surfaces of each sample were polished. A hole 0.3 mm in diameter and depth was drilled in the center of the WZ to initiate a fatigue crack. Cyclic bending-loading was applied in a direction perpendicular to the weld line, at a constant strain amplitude, a stress ratio R = −1, and a frequency of 22 Hz under ambient conditions.

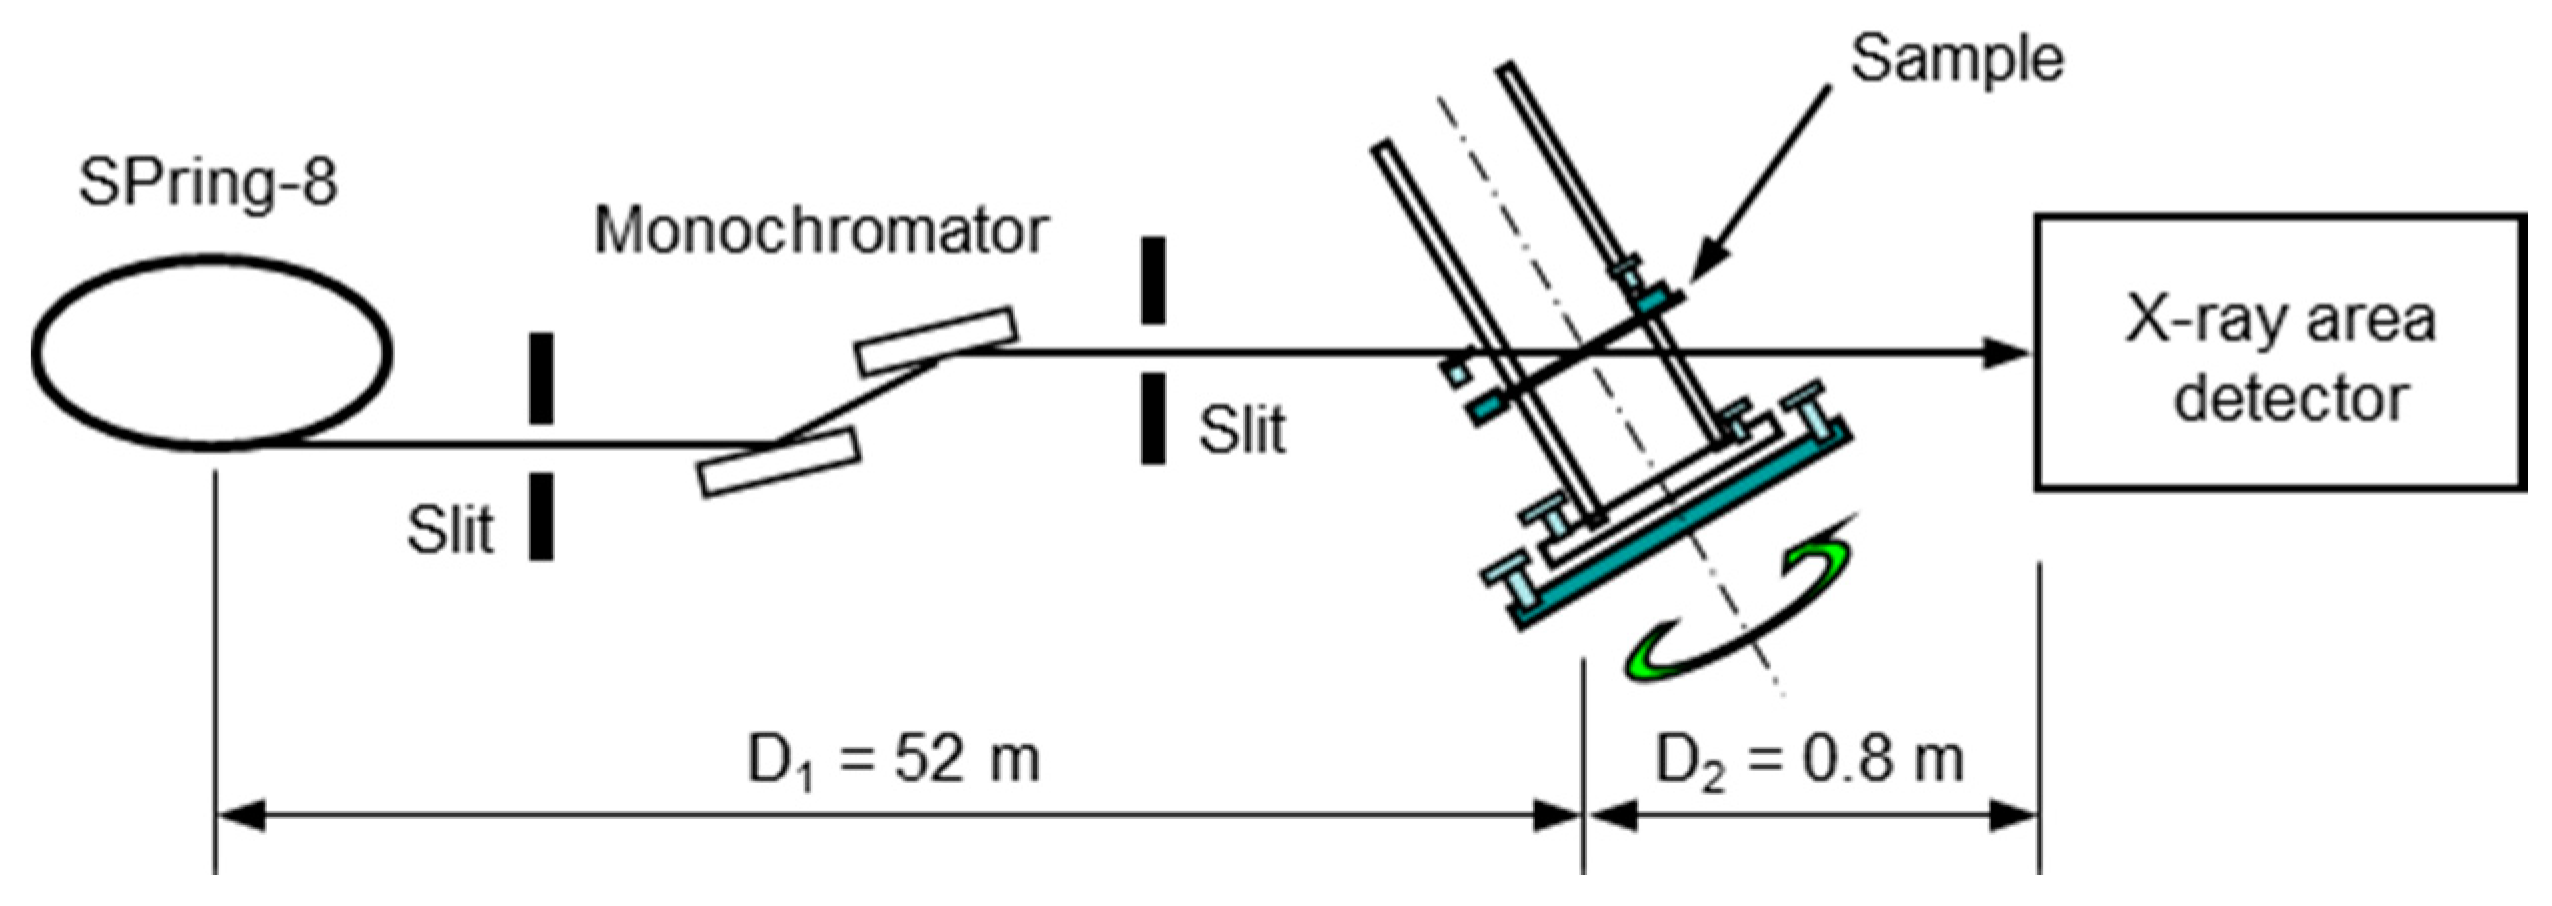
3.2. Experimental Setup of SR-Based CL

A schematic of the setup is shown in Figure 10. The tomographic axis was inclined by 30° (φ = 60° in Figure 8). The X-ray energy was adjusted to 28 keV using a monochromator. The X-ray area detector (a cooled CCD camera) captured projection data every 0.5° over 360° with an exposure time of 400 ms per flame. Every 20 exposures, the sample was shifted downward and the projection data of the acrylic pipe (without the sample) were collected to allow compensation for X-ray attenuation by the pipe. The window size of the projection was set to 1984 × 7680 pixels after 2 × 2 binning, representing a tradeoff between image resolution and easy data-handling. The effective detector pixel size was 5.7 μm after the binning, including the optical magnification. The size of the field of view was 11.3 mm (horizontal) × 4.4 mm (vertical). The distance between the bending magnet and the sample was 52 m, rendering the X-ray beam parallel. The detector was positioned 0.8 m behind the sample to incorporate the phase-contrast effect [29,30,48]. Slice images were reconstructed from a set of 720 angularly equidistant 2D projection data using a filtered-back projection algorithm and 3D images of the fatigue cracks obtained by stacking the 2D sliced images.
To obtain clear images of fatigue cracks, a specially designed sample holder was placed on the rotational stage of beamline BL19B2 at SPring-8. As shown in Figure 11, the holder retains the sample using screwed bolts and controls the bending strain by adjusting the bolts so that the fatigue crack opens slightly. This enhances the contrast of crack images. The effective size of the field of view was several millimeters; it was thus necessary to combine the reconstructed 3D images for each field of view to obtain an entire fatigue crack image that ran through several fields of view.

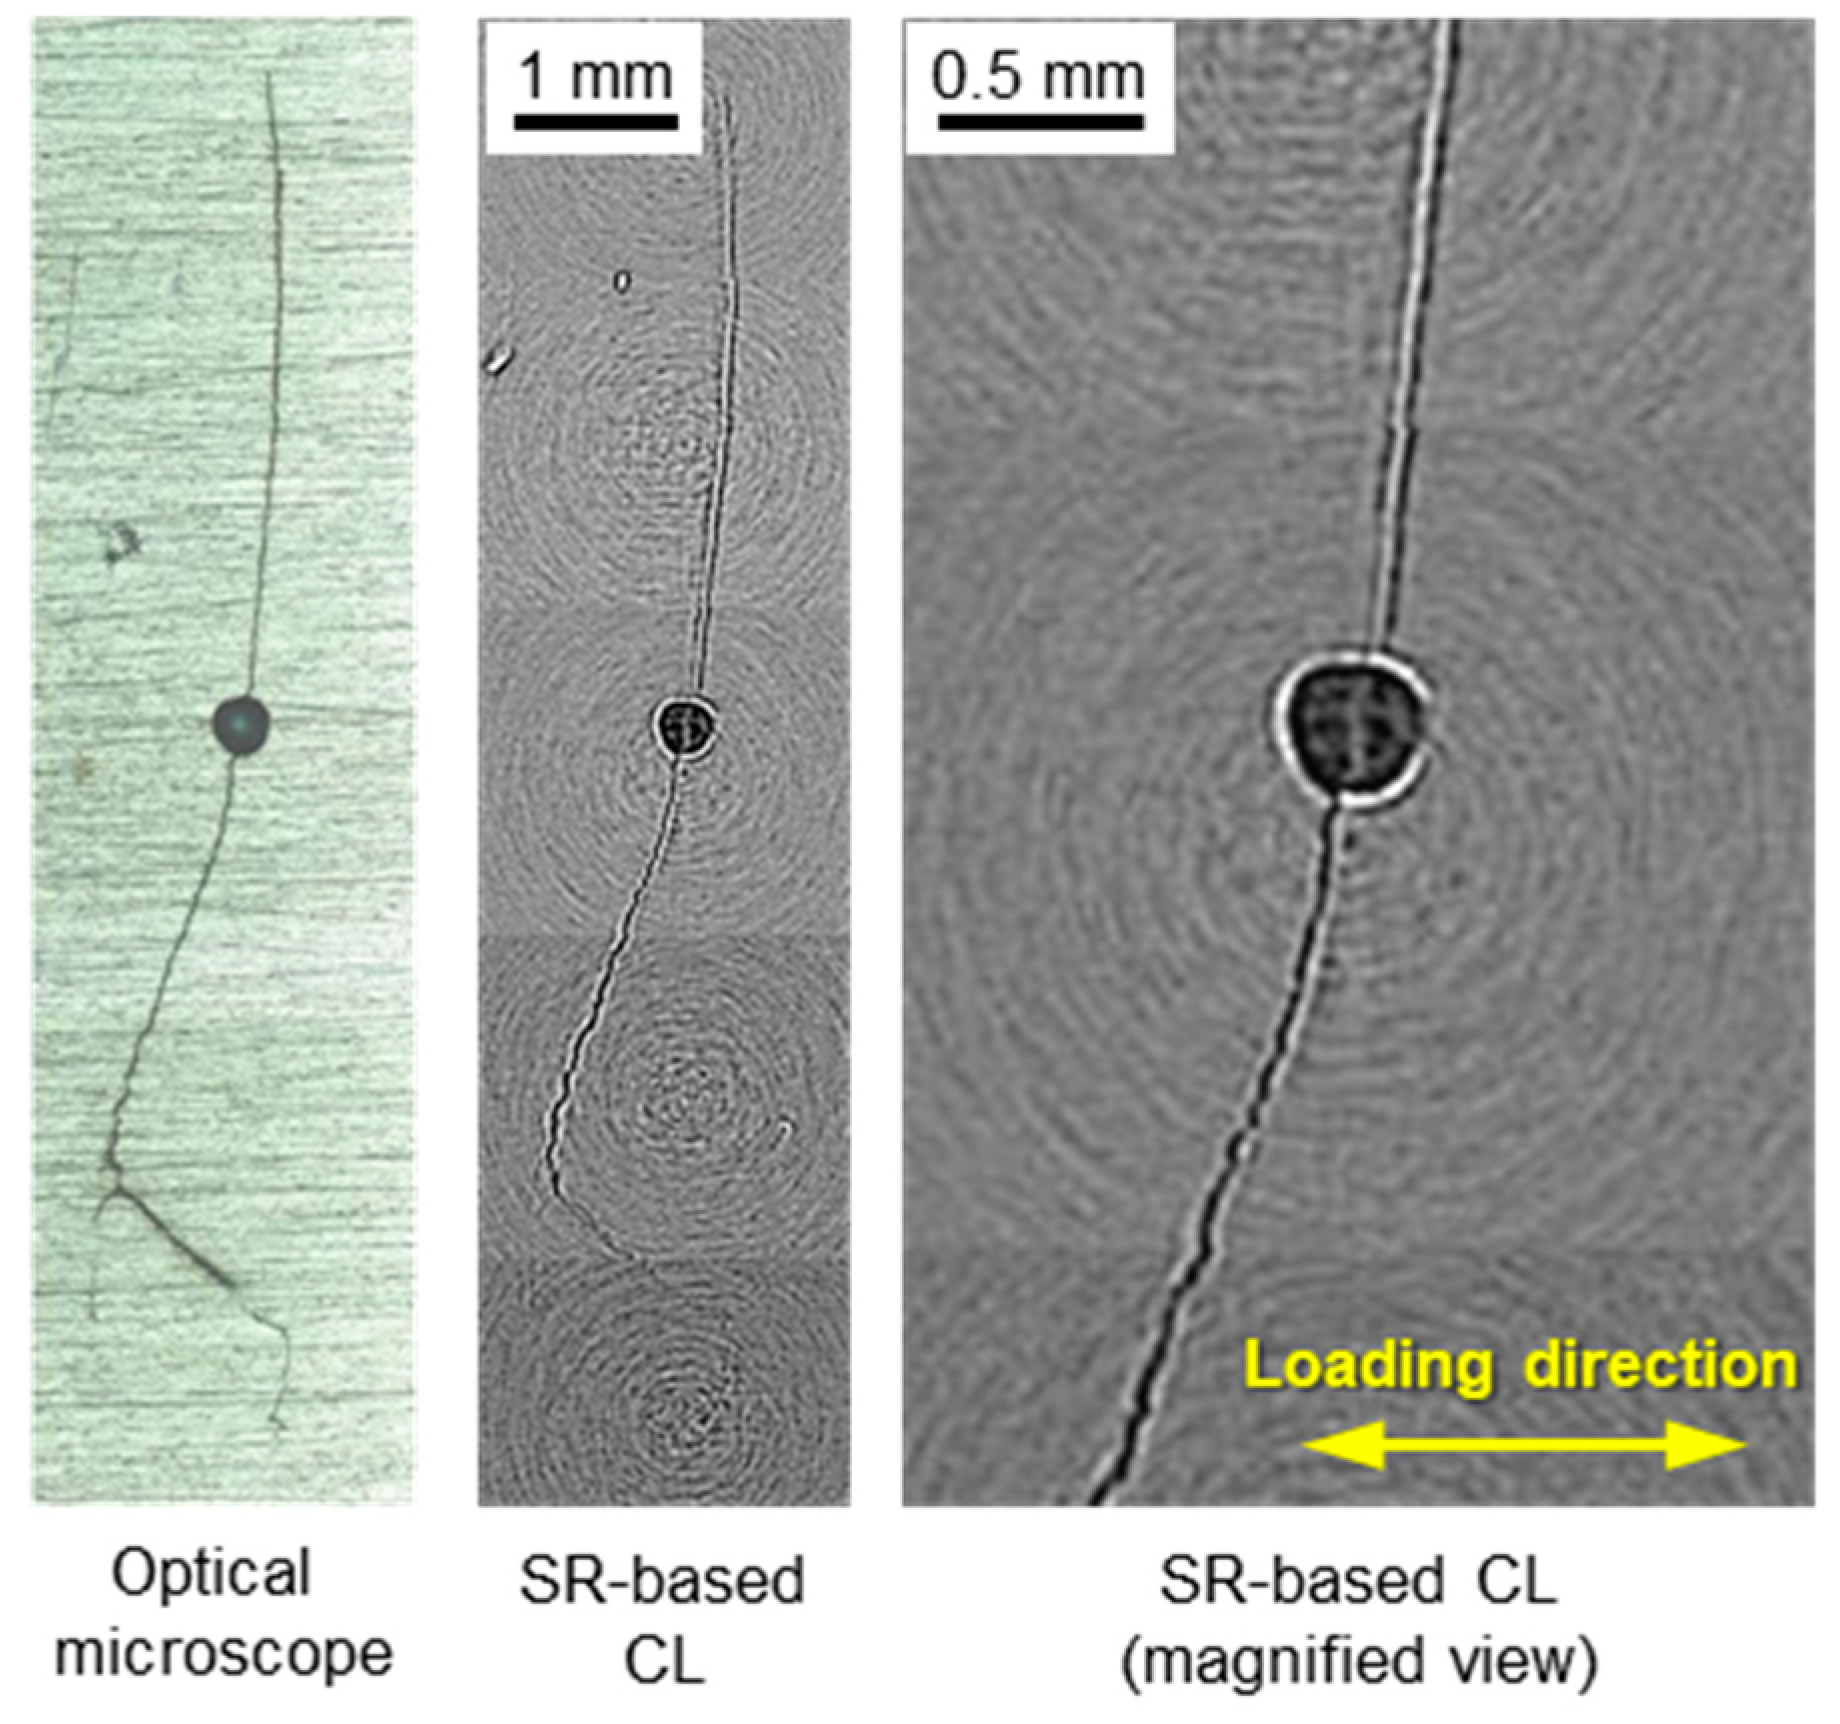
3.3. Surface Observations on Samples with Fatigue Cracks

A crack was created and propagated in an FSWed sample via fatigue loading over 5.80 × 10⁴ cycles with an initial stress amplitude of 160 MPa. CL was performed for several fields of view at intervals of 2 mm to cover the whole crack. The entire image was built by connecting the five fields of view at the same elevation. Figure 12 compares the reconstructed image of the fatigue crack at the sample surface and the corresponding photograph. Ring artifacts remain in the reconstructed image; however, the crack shape is well-reproduced by CL.
In general, a fatigue crack in a homogeneous material propagates along a near-straight line perpendicular to the loading direction. However, in the FSWed sample of Figure 12, the crack propagates with a large deviation from the straight line. This may be attributable to the distinctive microstructure formed during FSW [62,63,64,65].

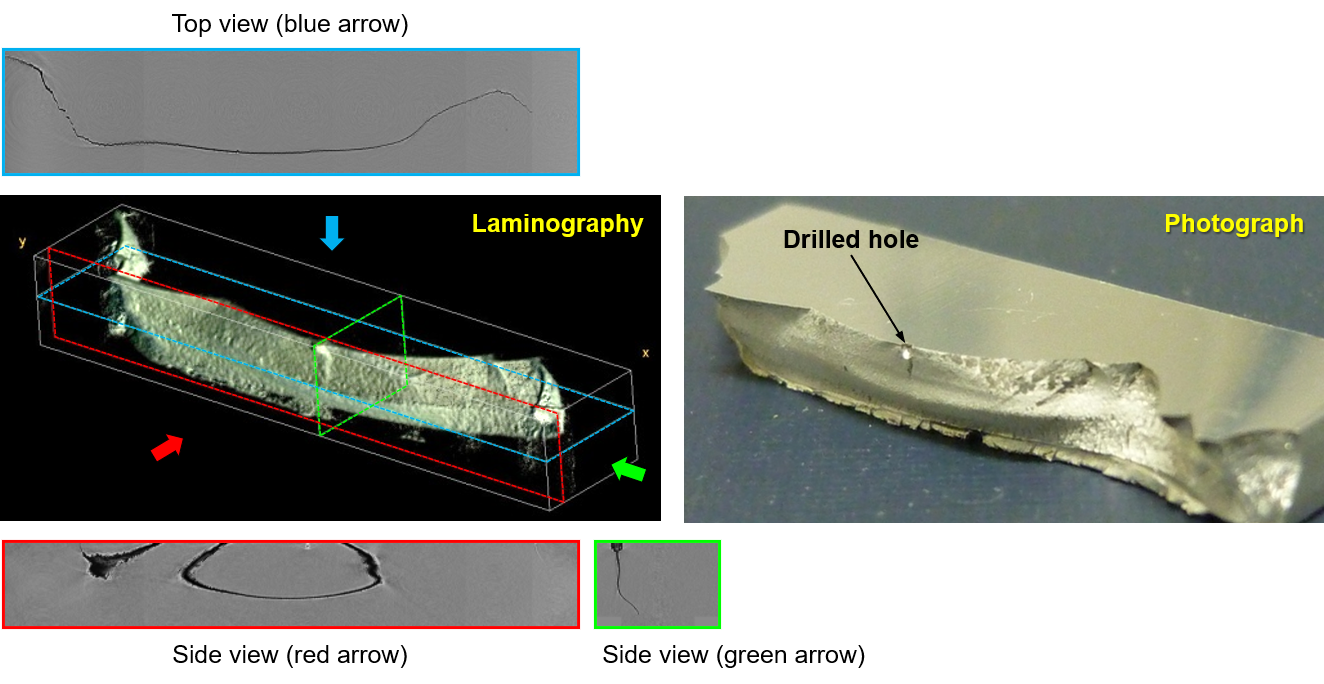
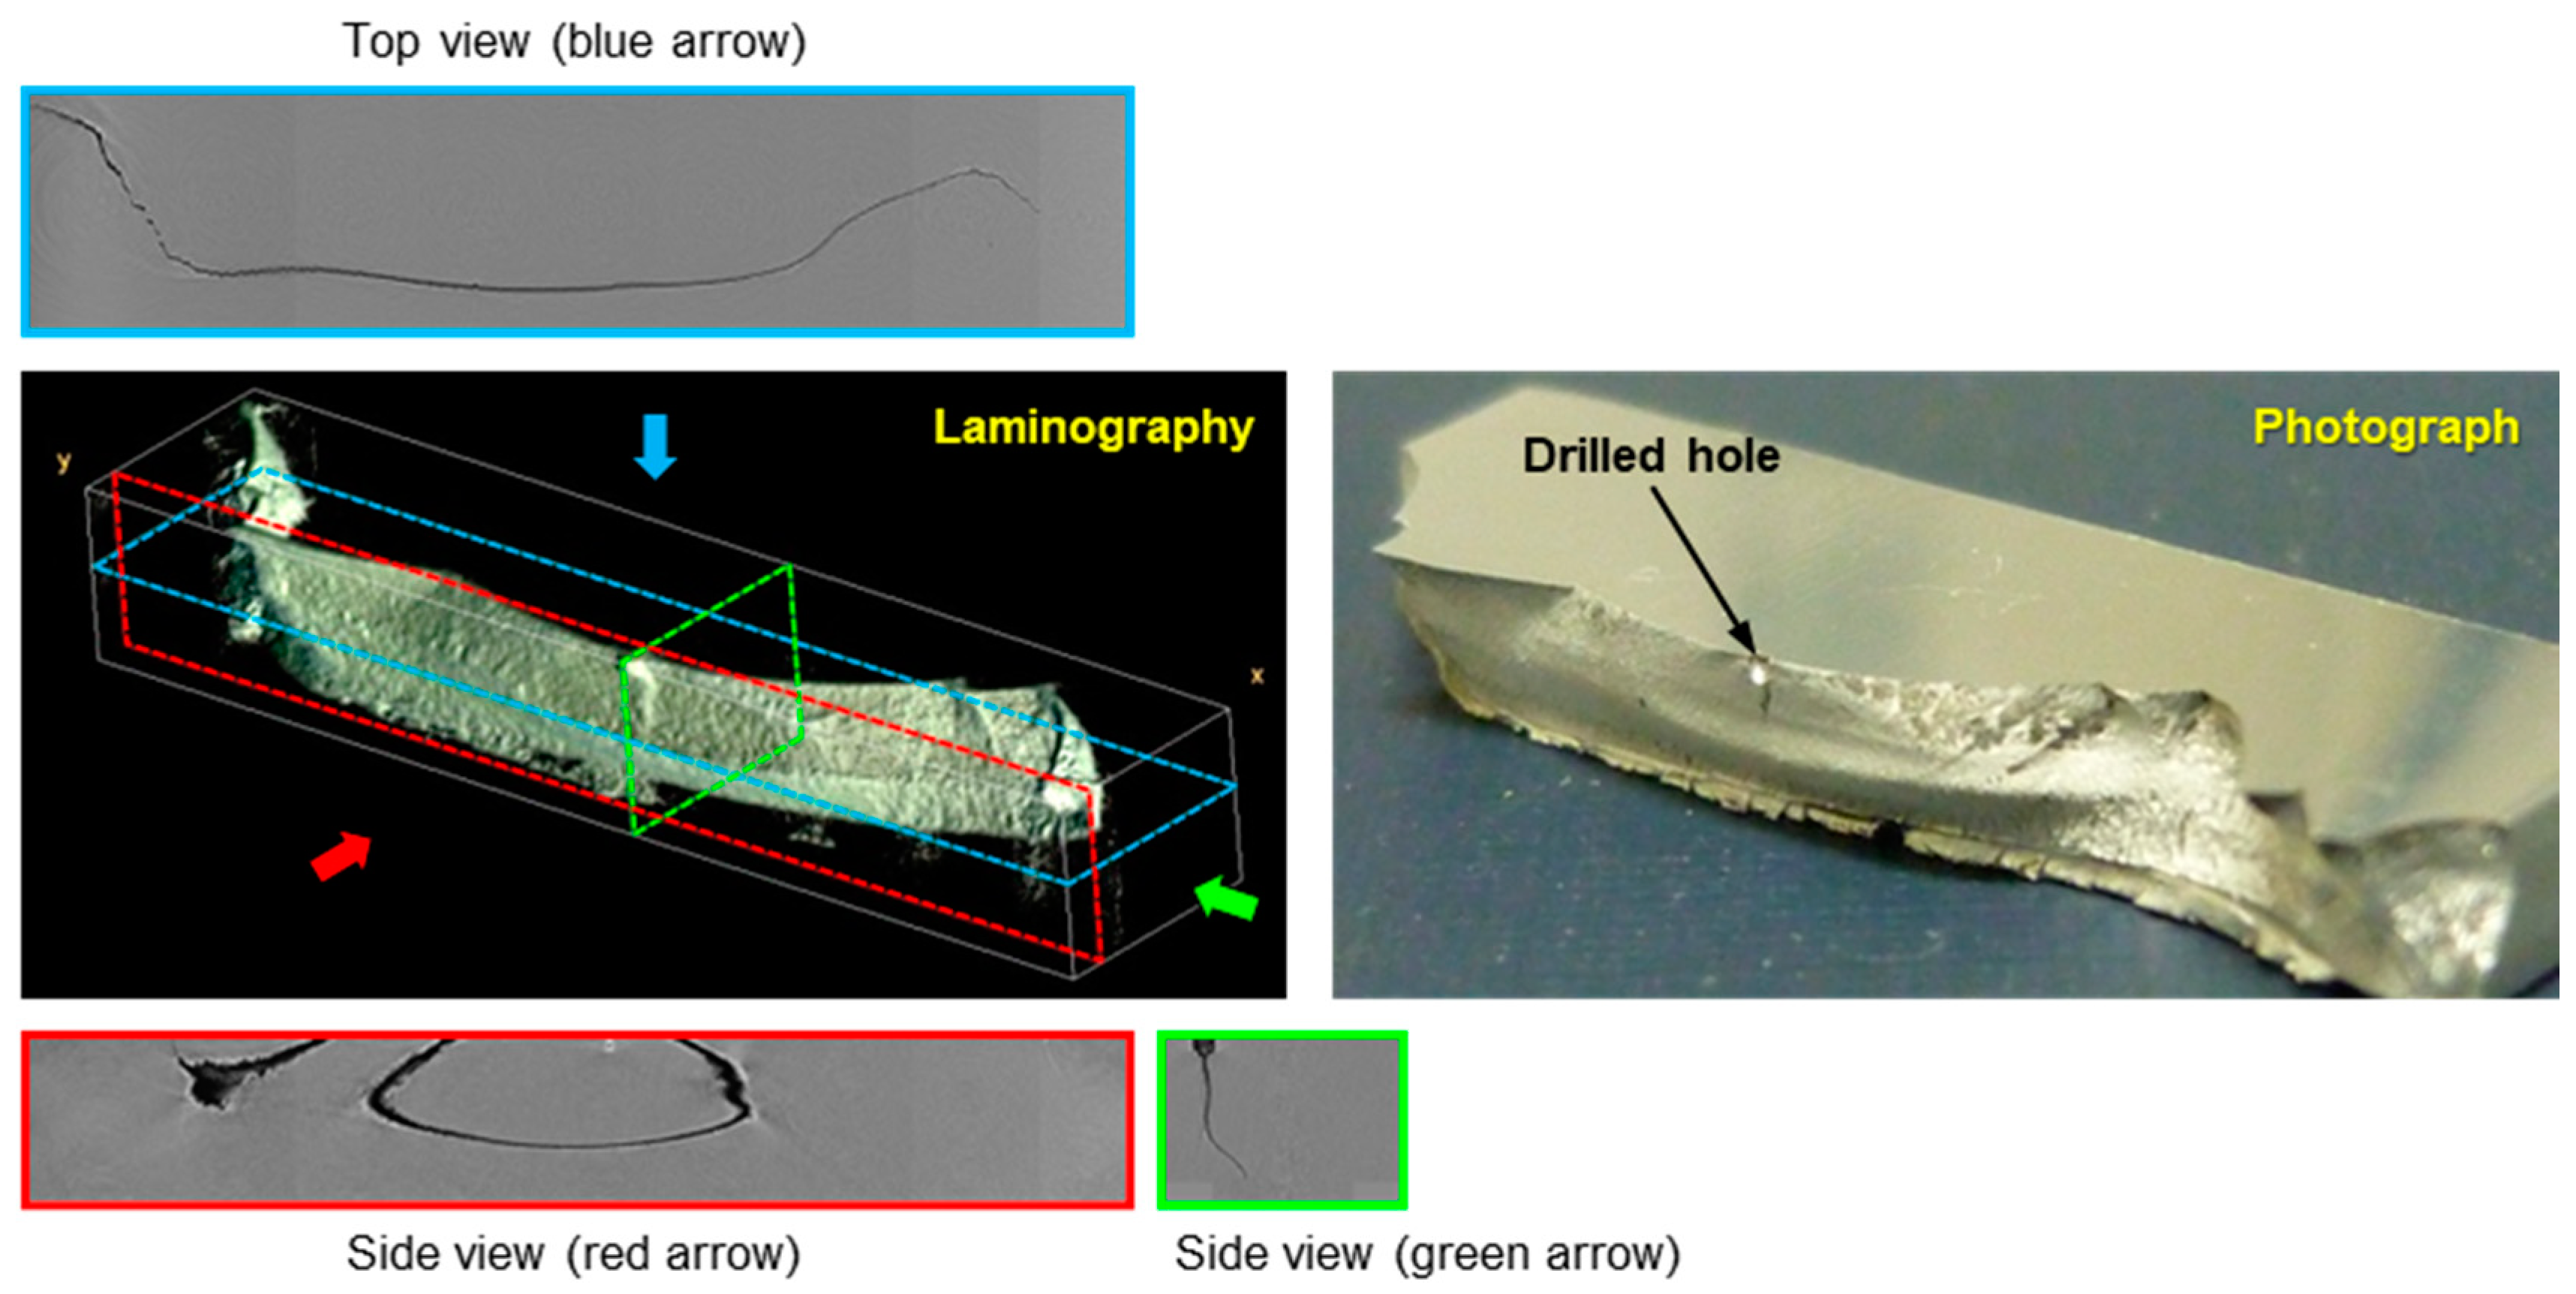
3.4. Three-Dimensional Imaging of a Fatigue Crack in an FSWed Joint

A fatigue crack was created in another sample over 3.37 × 10⁵ loading cycles using an initial stress amplitude of 120 MPa. The reconstructed 3D image is shown in Figure 13, reproducing the shape, morphology, and texture of the fracture surface very well. The initially drilled hole is at the center of the image. Three cracks can be identified in Figure 13; the main crack initially propagated from the drilled hole as expected; further two cracks then commenced at the corners between the top and both side surfaces. Finally, the sample separated into two pieces when the three cracks combined. The 2D representations shown in red, green, and blue are cutaways of the 3D image at the planes shown by the rectangular dotted lines. The arrows indicate the directions of the visual angles of the 2D cracks.
Figure 14 shows the 2D projection images of the main crack and the crack length, depth, and aspect ratio. The images are viewed from the direction of the red arrow of Figure 13 at 2.00, 3.00, and 3.37 × 10⁵ fatigue cycles. Surprisingly, once the crack image projected onto a plane perpendicular to the fatigue loading direction, the crack shape became a clear semi-ellipsoid (Figure 14a); also, the crack propagation curve was smooth (Figure 14b) even though the crack exhibited a complicated 3D structure. The crack length on the surface estimated by CL agreed well with that derived using the replication method. The crack depth tended to plateau as the crack propagated, as would be expected during plane bending fatigue, decreasing the aspect ratio. The results thus imply that crack propagation in FSWed joints is well-characterized by SR-based CL. The aspect ratio yielded by CL is very useful; this is necessary when calculating the stress intensity factor, but is difficult to determine nondestructively.

4. Ultra-Fast XRD of an Aluminum Alloy under Impulsive Stress Wave

The macroscopic phenomena in LPwC, except those of the top surface, are well-understood by precision experiments and time-dependent elastoplastic FEM simulations [5,46,47]. However, the microscopic aspects (dislocation, grain refinement, dynamic precipitation, and phase transformation) are not well-characterized because observational tools affording adequate space-time resolution were unavailable prior to XFEL. We thus studied the microscopic dynamics of an A6061 aluminum alloy by ultra-fast XRD during plastic deformation after intense laser pulse irradiation simulating LPwC at the Japanese XFEL facility, SACLA [72,73].

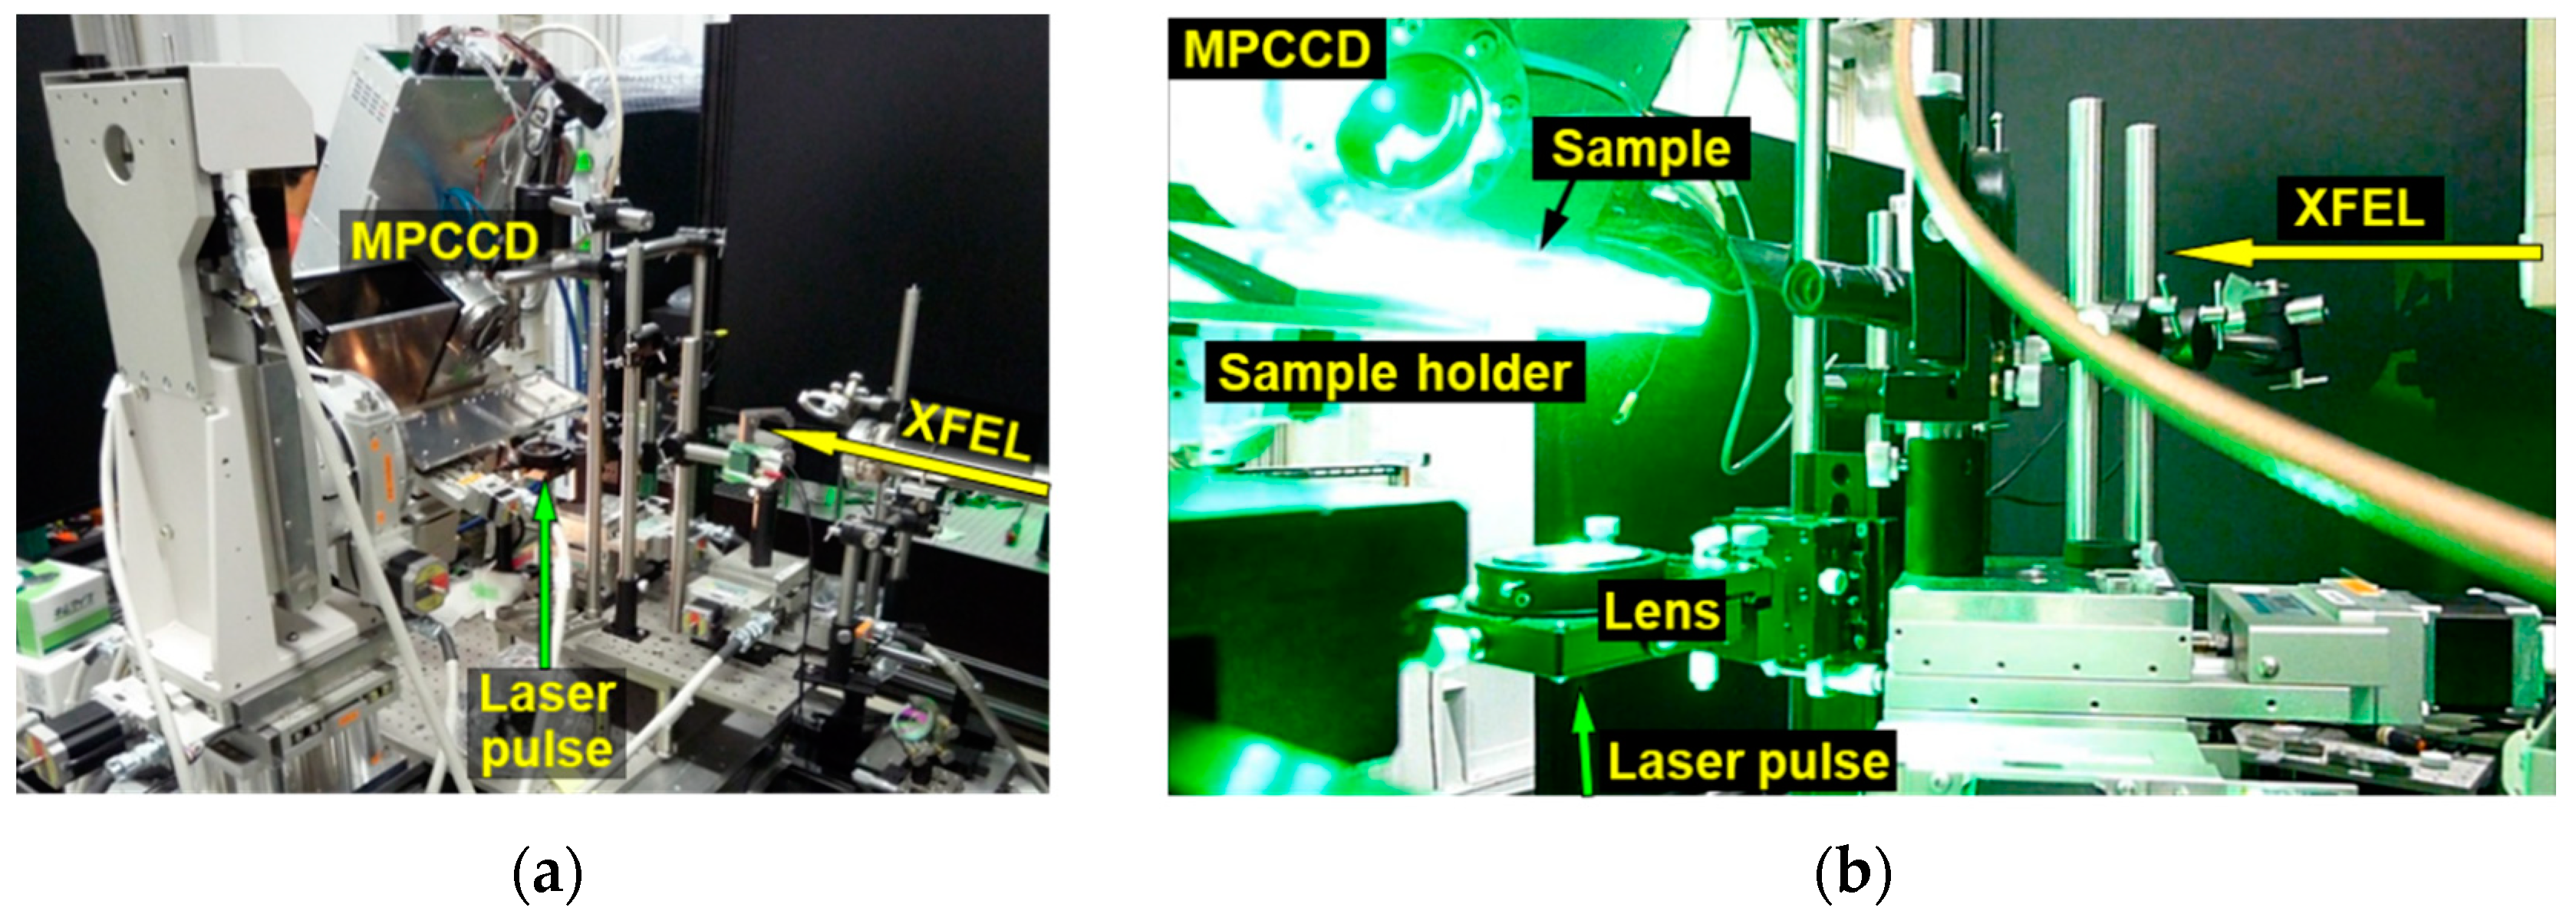
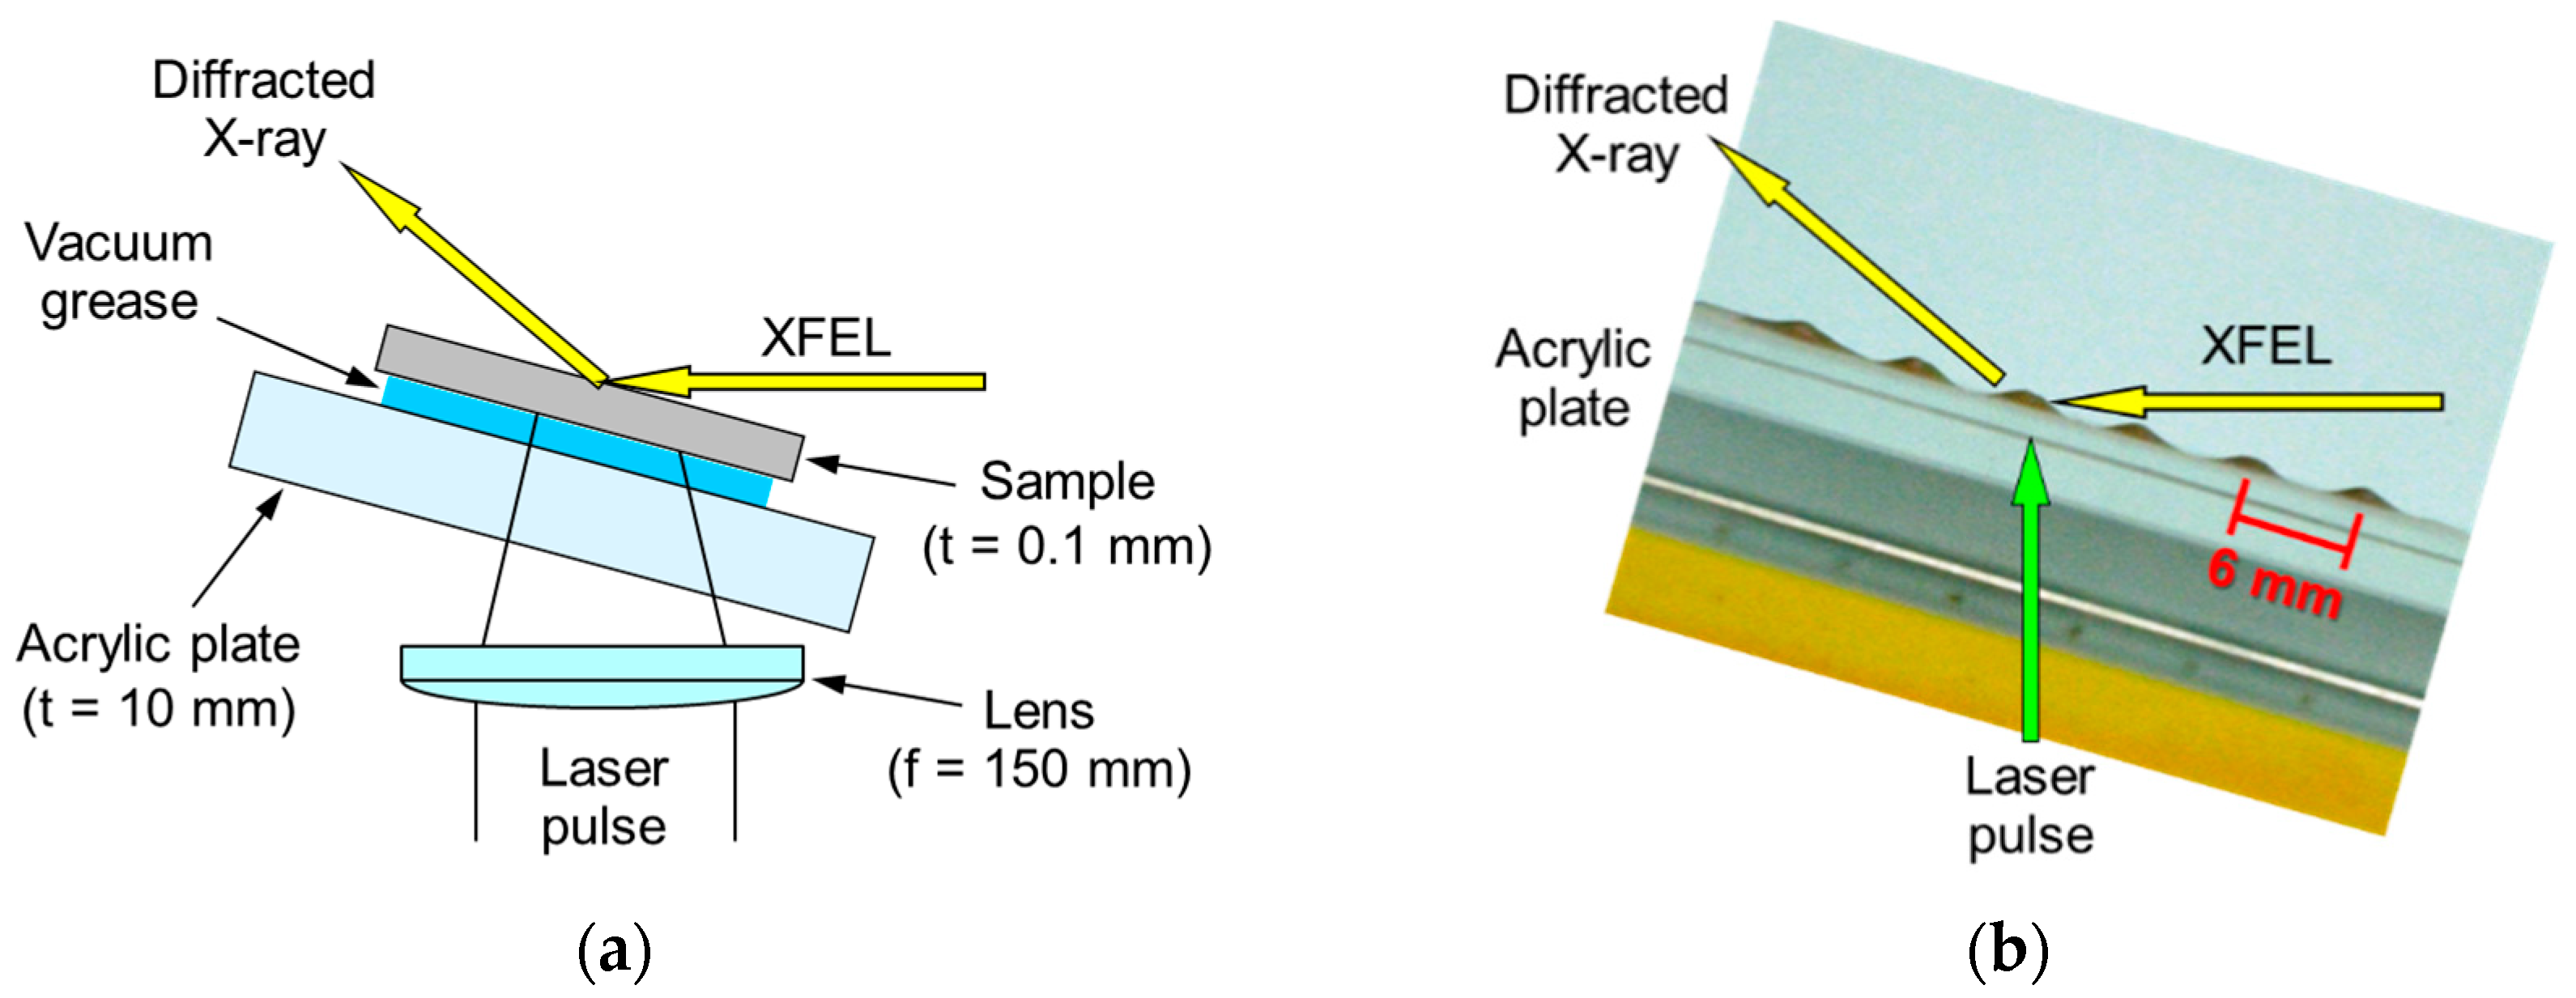
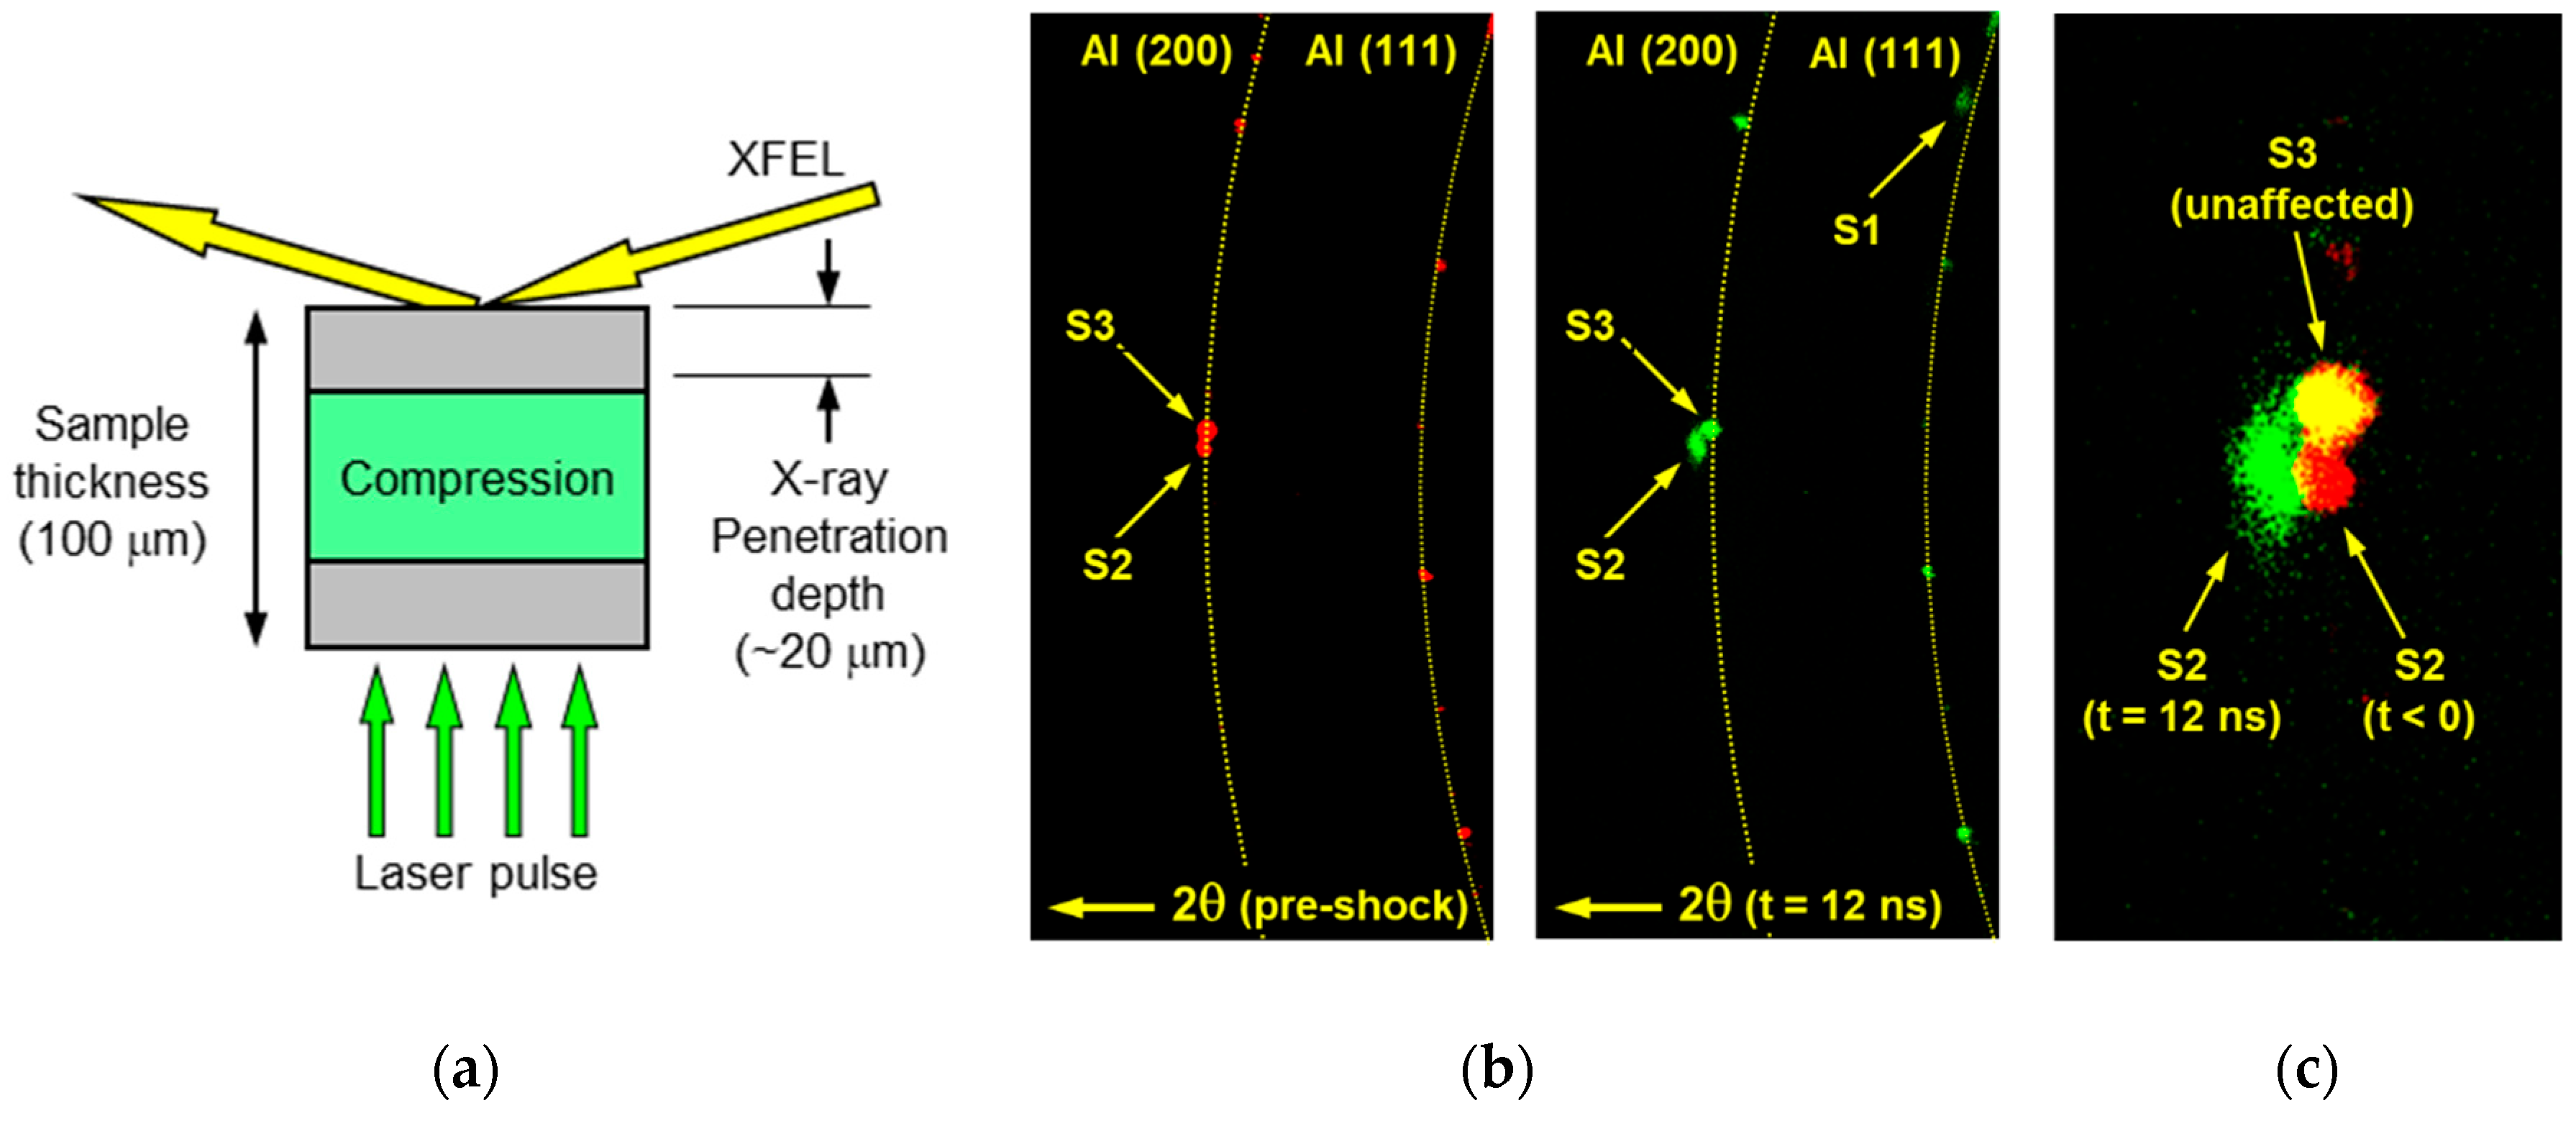
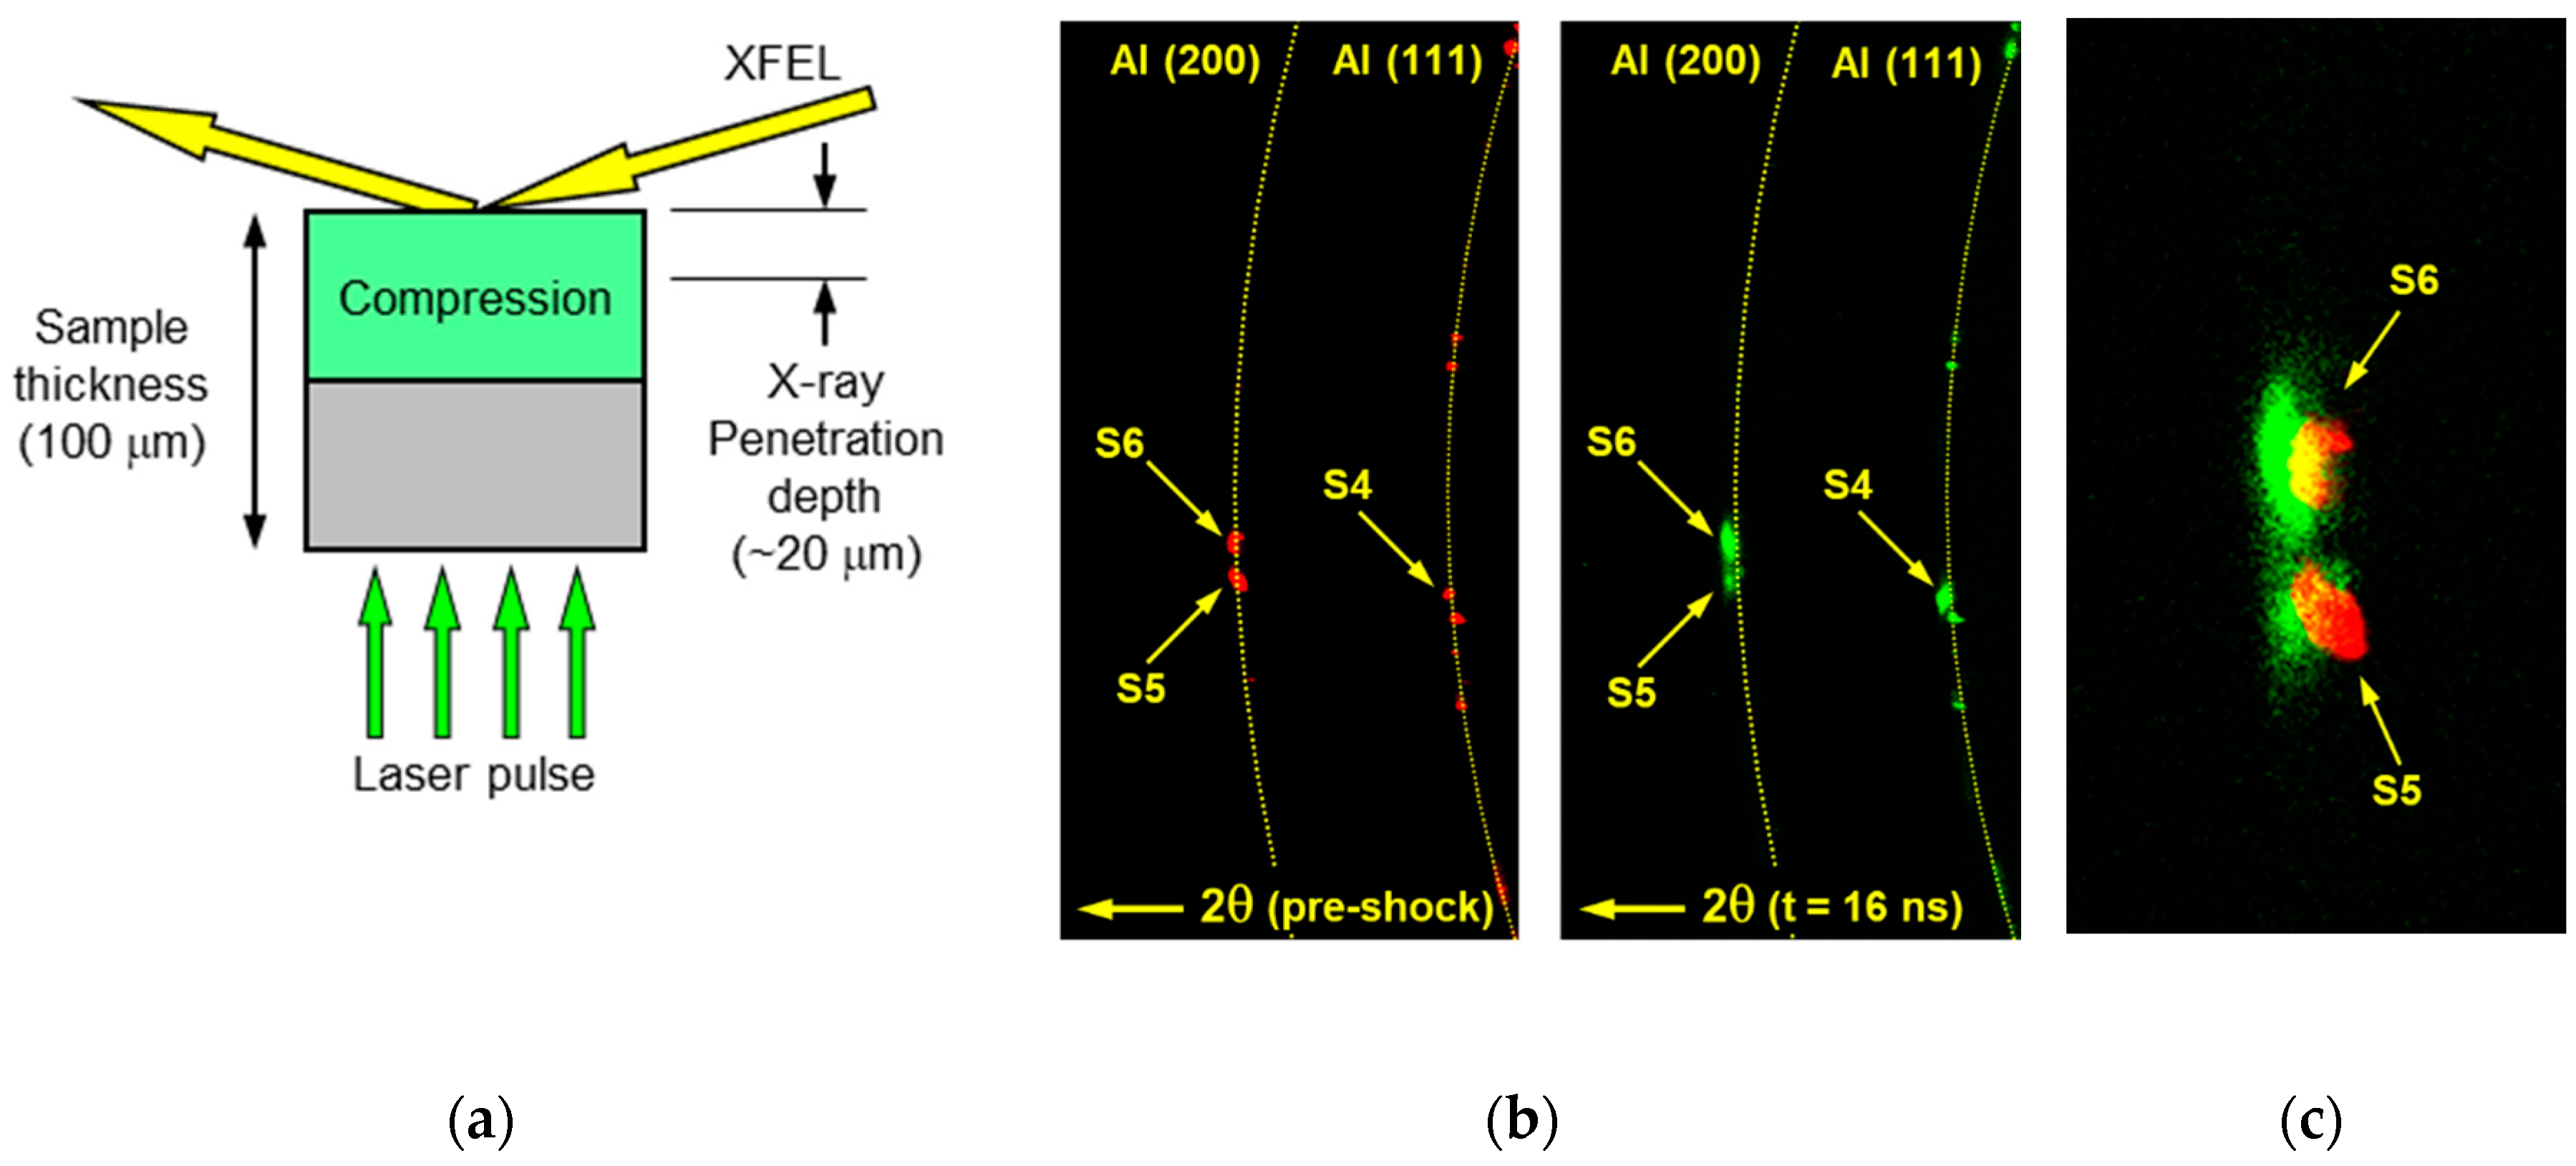
4.1. Experimental Procedure

The sample material was that used in Section 3, thus the A6061 aluminum alloy. Foils 0.1 mm in thickness were solution heat-treated and stuck to acrylic plates using vacuum grease. The plate confines the plasma generated by ablative interaction of the laser pulse with the sample surface, magnifying the plasma pressure up to several gigapascals when simulating LPwC conditions [18,74]. The setup of a diffractometer is shown in Figure 15, and the sample arrangement in Figure 16 together with a sample photograph taken after a series of pump-probe experiments.
Laser pulses from a frequency-doubled Nd:YAG laser (λ = 532 nm) were irradiated onto the sample through the 10 mm thick acrylic plate via a planoconvex lens (f = 150 mm). The pulse energy, pulse duration and focusing spot diameter were about 400 mJ, 6–8 ns (the FWHM), and 1.5 mm respectively, affording a peak power density of 3–4 GW/cm2 and a plasma pressure of 3–4 GPa. The impulsive stress wave generated by the high-pressure plasma propagated into the sample as a quasi-plane wave because of the one-dimensional (1D) sample geometry. When the stress wave arrived at the opposite free sample surface, the sample began to macroscopically deform (Figure 16b). Therefore, diffraction data must be collected before the deformation.
In general, the material exposed to LPwC (or LSP) should be thick enough to hold the inducing compressive RS; a thickness of 10 times or more the compression depth is desirable to avoid the macroscopic deformation which results in relieving the RS. Nonetheless, in this experiment, a thin foil (0.1 mm thick) was used to observe dynamic phenomena on the opposite free surface of the foil without significantly attenuating the impulsive pressure wave and the thermal effect of the laser pulse irradiation. Therefore, the interpretation of the experiment is complicated compared to that in the actual LPwC because of the sample deformation, the reflection of the pressure wave at the free surface and the subsequent propagation of a tensile stress wave in the sample.
The XFEL photon energy was adjusted to 10 keV (λ = 0.124 nm) with an energy spread of 50 eV. The X-ray penetration depth into the sample aluminum alloy was about 20 µm, considering the XFEL incident angle of 74°. The XFEL footprint on the sample was an ellipse with major and minor axes of 0.7 and 0.2 mm, respectively, thus small compared to the laser spot diameter of 1.5 mm. This allowed collection of diffracted X-ray from the laser-irradiated area only; the data were not contaminated by X-ray from uncompressed area. The diffracted X-ray was recorded using a 2D detector; the MPCCD covered diffraction angles (2θ) from 25 to 40°. After recording, the foil and acrylic plate were shifted by 6 mm; the next laser pulse was to a fresh foil region with different delay time.

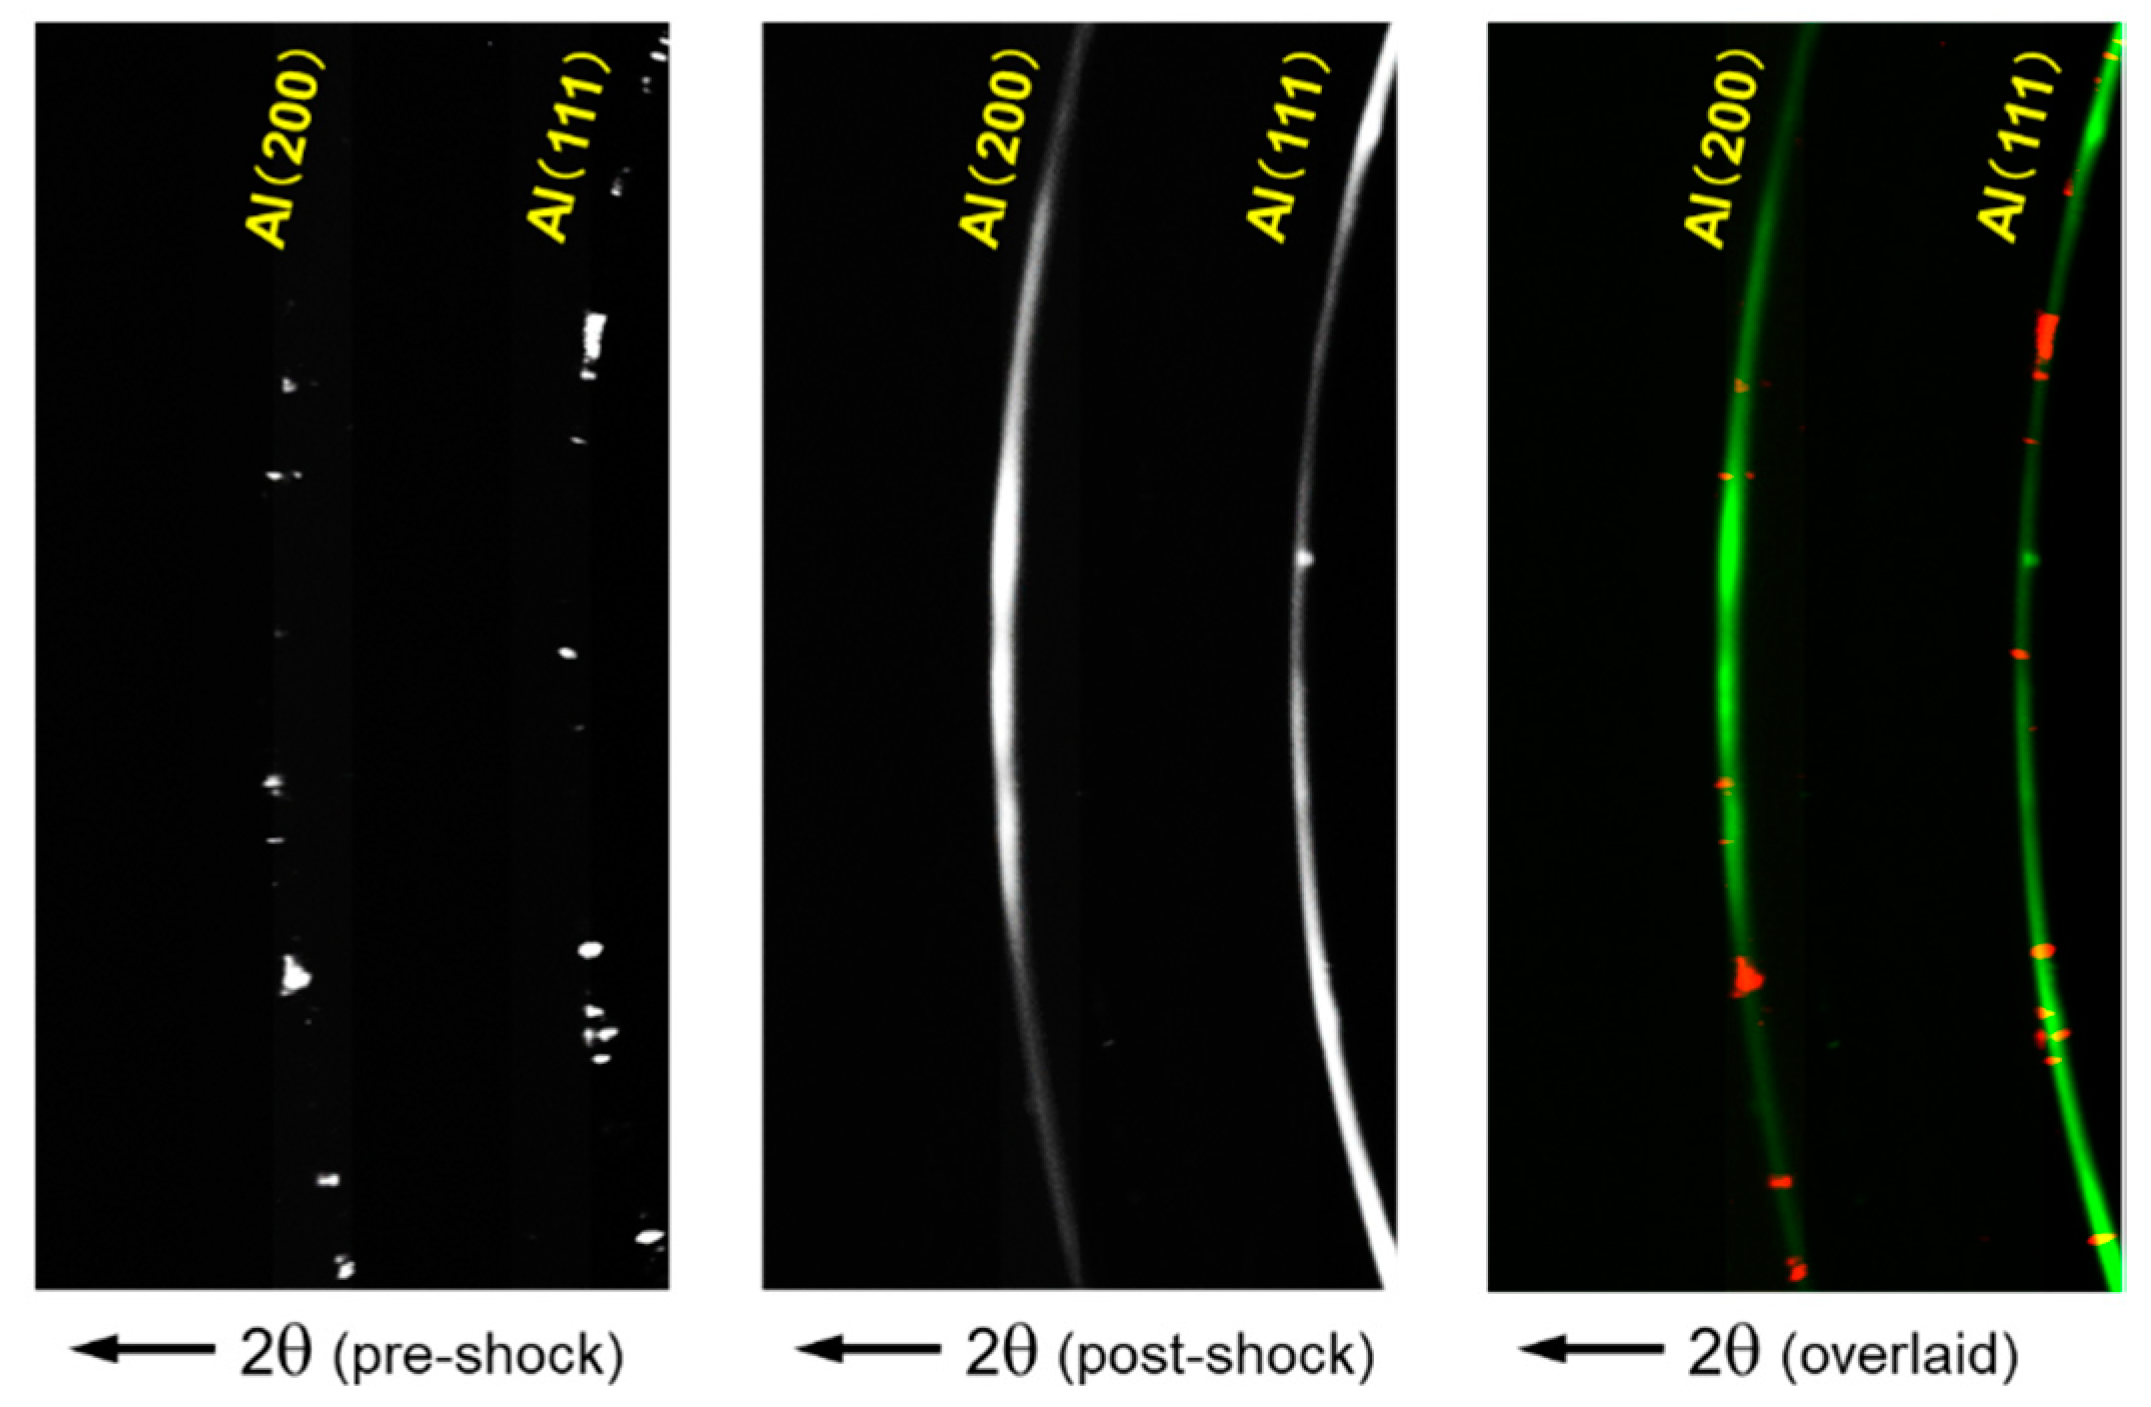
4.2. Comparison of Diffraction Patterns before and after Laser Irradiation

Figure 17 compares the diffraction patterns of solution heat-treated A6061 aluminum alloy before (pre-shock) and after (post-shock) laser pulse irradiation. Pre-shock diffraction data were acquired for the pristine sample setup shown in Figure 16a. Then, a backing plate was set on the sample to avoid the deformation and the Nd:YAG laser was fired, which allowed the pressure wave passed through the foil without reflection at the opposite surface of the foil. Post-shock diffraction data were collected for the same sample after removal of the backing plate. We acquired 100 sets of diffraction data to reduce statistical noise and create a clear image of the post-shock. The diffraction patterns of Al (111) and Al (200) changed from spotty to near-continuous rings, reflecting refinement of the crystal grains or subgrain formation by the impulsive stress wave imparted by the laser pulse [72,73]. The diffraction angles (2θ) did not change significantly, thus matching the angles of the stress-free thin foil. We superimposed the pre-shock (red) and post-shock (green) images so that changes in the diffraction pattern can be easily recognized.

4.3. Time-Resolved Ultra-Fast XRD at Elapsed Time of 12 and 16 ns

The transient diffraction pattern at 12 ns after laser irradiation is shown in Figure 18. The stress distribution in the sample at this time is schematically depicted in Figure 18a. It was assumed that the sample surface was exposed to a compressive stress from 0 to 8 ns (the laser pulse duration); the stress wave was generated instantaneously and propagated into the sample at the longitudinal sound velocity in aluminum alloy (6.3 km/s). The diffraction pattern begins to change at 12 ns because the compressive stress wave has just attained a depth of about 20 µm (the X-ray penetration depth) from the opposite free sample surface.
Figure 18b compares the initial diffraction pattern and the pattern 12 ns after laser irradiation. The dotted lines indicate the normal diffraction lines for the stress-free sample. The laser irradiation induced a diffuse spot indicated by arrow “S1” at a high angle compared to the normal Al (111) diffraction line. It seems that the impulsive stress wave compressed grains, inducing grain refinement or subgrain formation, and as a result, the diffraction condition of “S1” was satisfied.
A superimposition of spots “S2” and “S3” before (red) and after (green) laser irradiation is shown in Figure 18c. If a spot is unaffected by laser irradiation, the superimposition of red and green renders the spot yellow. Spot “S2” shifted from an original stress-free position to a higher diffraction angle and became diffuse; the adjacent spot “S3” seemed to be unaffected. This means that the stress wave attained the grain causing spot “S2”and compressed that grain, possibly triggering grain refinement or subgrain formation. The grain corresponding to spot “S3” may have been close to the surface; the compressive stress wave had not arrived there by 12 ns.
Assuming that plastic deformation commences at a strain of 0.2%, the corresponding shift in the diffraction angle would be about 0.1°. The observed shift of spot “S2” was about 0.4°, thus much larger than the 0.1° response to the yield stress. This implies that the grain was over-compressed by the impulsive stress wave at 12 ns and relaxed via grain refinement or subgrain formation, creating diffraction spot diffusion. The shift of “S1” was also about 0.4°, reflecting a similar situation.
The diffraction pattern at 16 ns after laser irradiation is shown in Figure 19. The compressive stress wave arrives at the free sample surface at around 16 ns (Figure 19a). A typical diffraction pattern is shown in Figure 19b. A superimposition of spots “S5” and “S6” before and after laser irradiation is shown in Figure 19c. The spots indicated by arrows shift to higher diffraction angles and become diffuse at 16 ns, similar to the changes noted in Figure 18. Note that the diffraction intensity of spot “S5” decreases, and the intensity of “S6” increases, implying possible changes in misorientations between adjacent grains. The shifts of “S4”, “S5”, and “S6” are about 0.3°, thus much larger than the 0.1° response to the 0.2% strain.

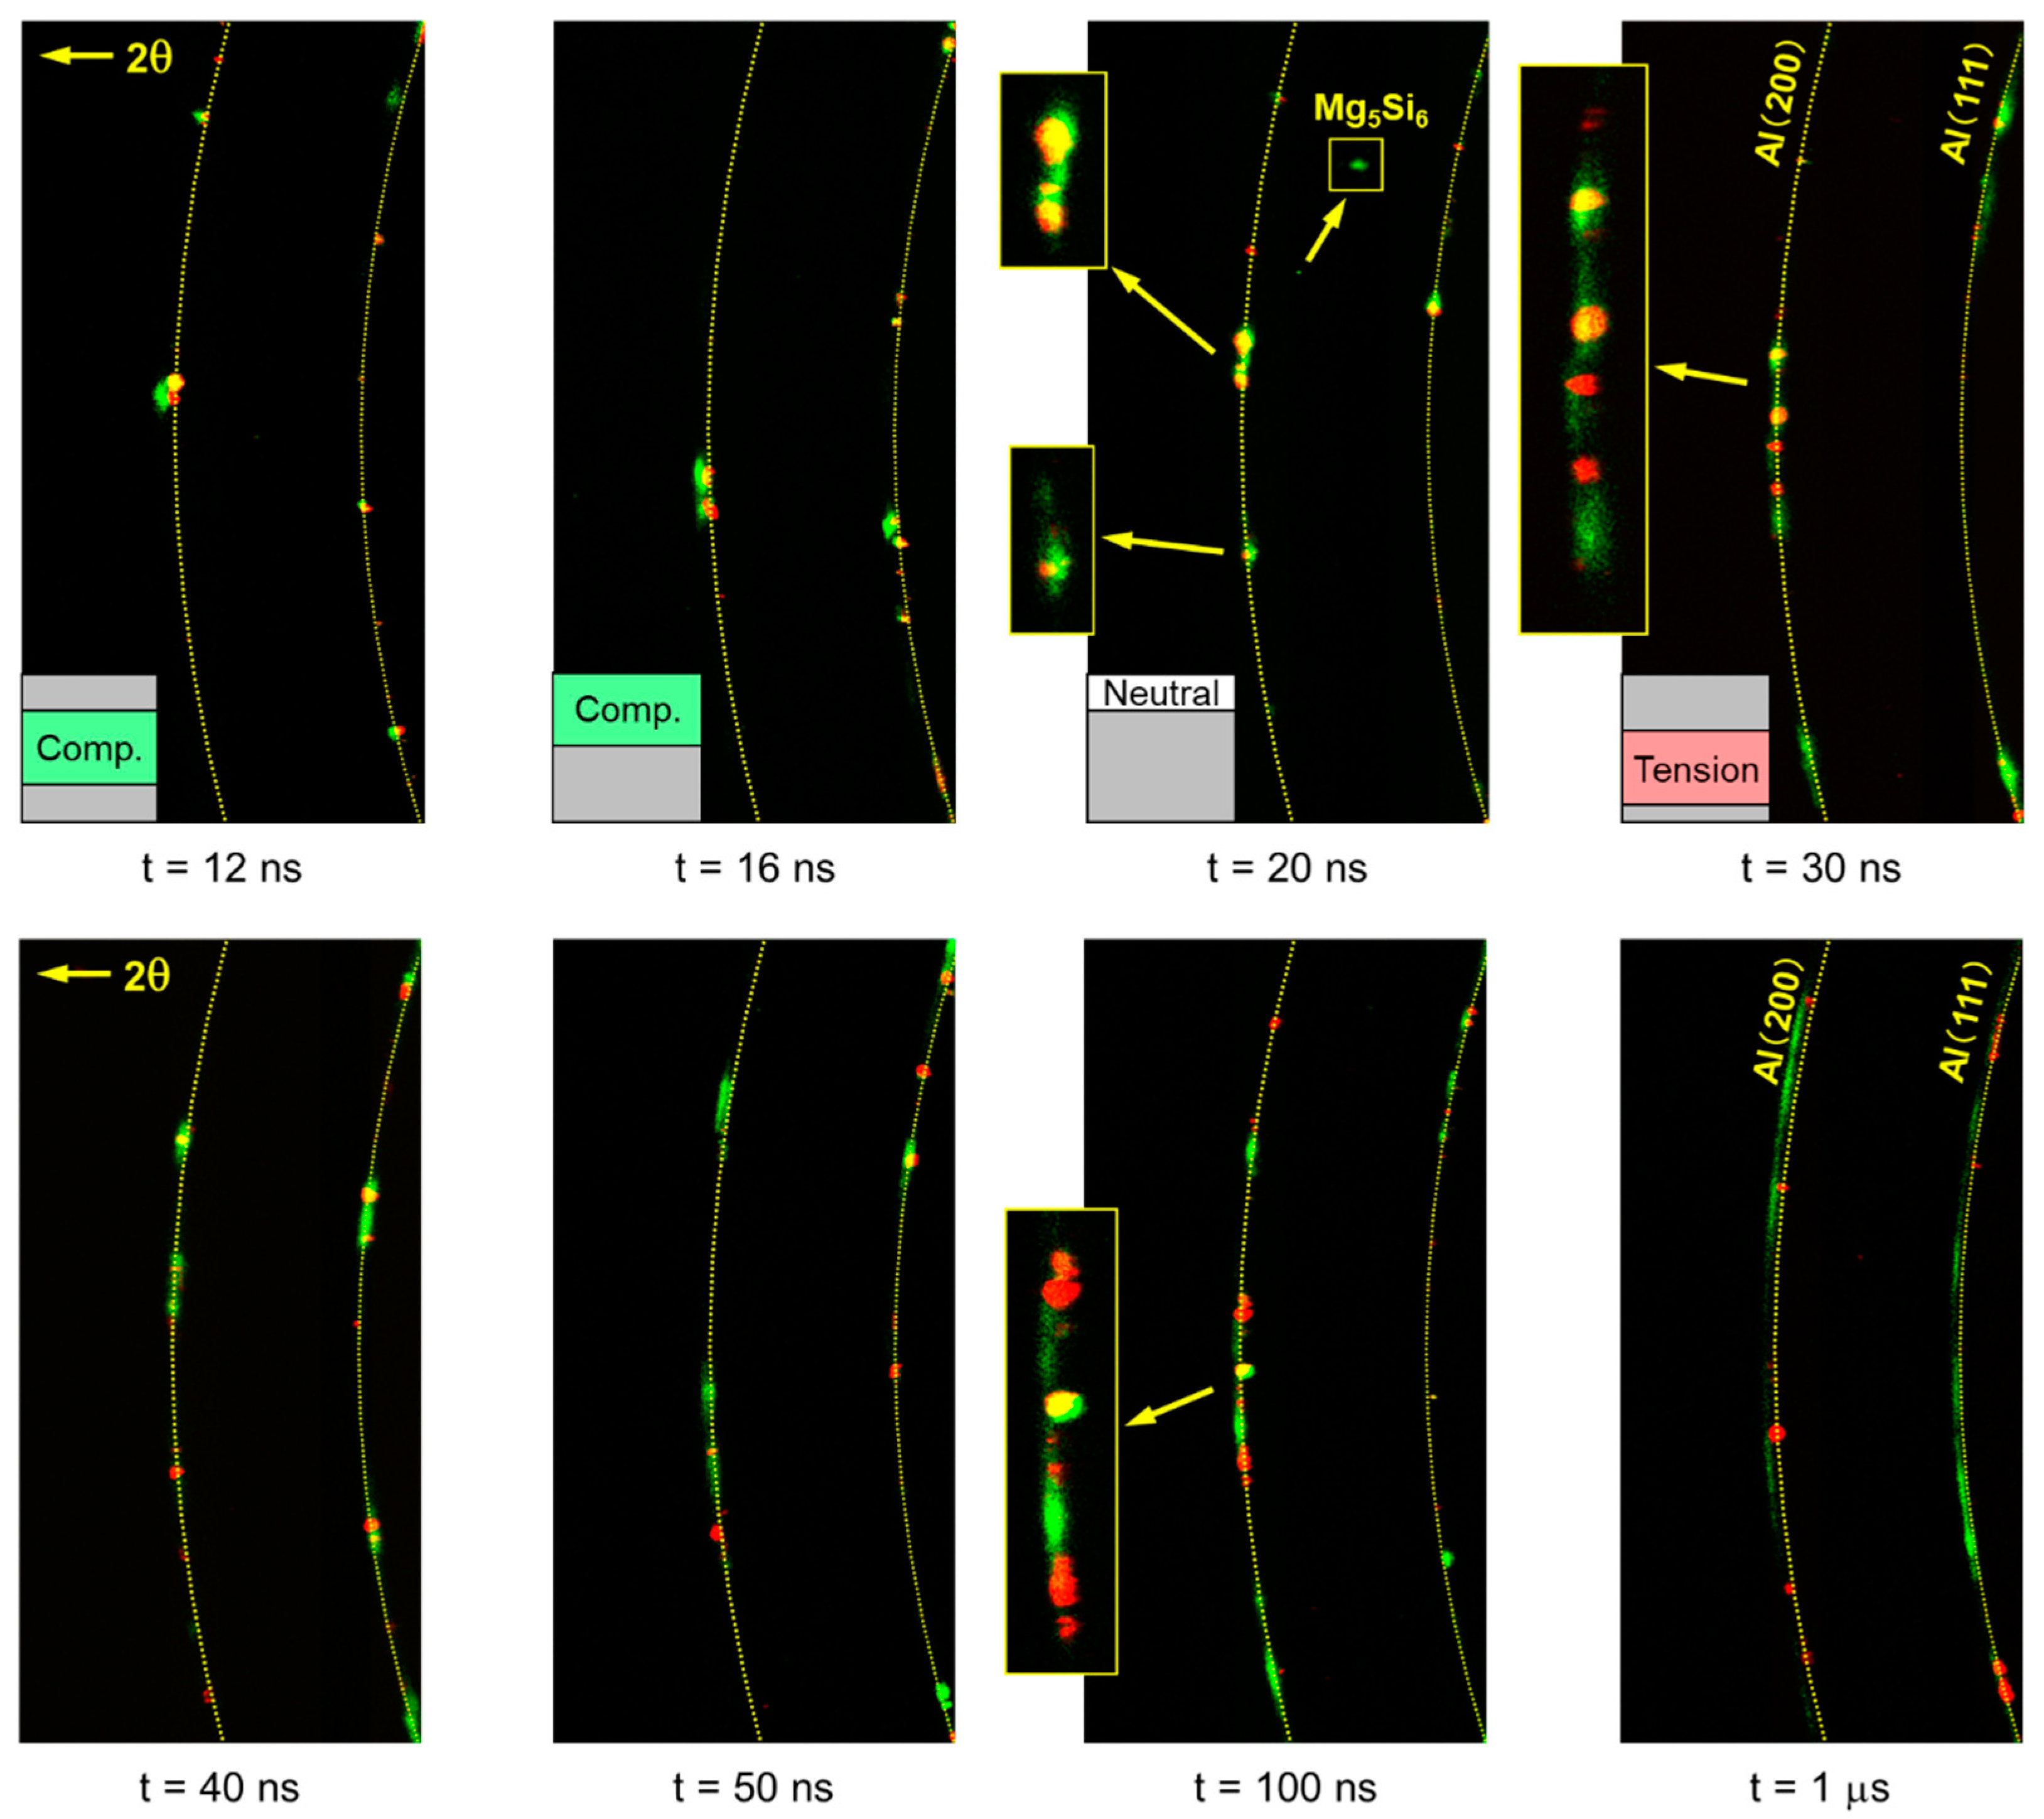
4.4. Effect of Laser Irradiation on Diffraction Patterns to 1 µs

The typical diffraction patterns to 1 µs are summarized in Figure 20, which shows the changes after laser irradiation. The insets for 12, 16, 20, and 30 ns show the positions of the laser-induced stress wave. The enlarged images show certain diffraction spots that clearly reveal the changes. The stress wave arrives at the sample surface at around 16 ns, reflects, and then travels as a tensile stress wave toward the laser-irradiated surface. The tensile component traveling downward is partially canceled by the initial compressive stress wave traveling upward to about 20 ns. Then, the stress wave propagates downward as a tensile wave. Therefore, the diffraction angle shifts become small or negligible at about 20 ns and later.
The overall change in the diffraction pattern seems to commence at about 30 ns and to be complete within 1 µs, probably at about 100 ns, implying that the durations of dynamic phenomena are typically less than 1 µs. Therefore, the plastic deformation induced by the succeeding laser pulse seems to be independent to that of the previous laser pulse even at the pulse repetition rate of 1 MHz, which is much higher than the maximum pulse repetition rate of 300 Hz [75] ever used in actual LPwC applications; this suggests the potential to significantly increase the pulse repetition rate and throughput of LPwC.
The Al (200) and Al (111) diffraction angles at 1 µs seem to be much greater than those of the stress-free sample. This is probably attributable to the macroscopic deformation shown in Figure 16b. Such sample deformation can shift the diffraction center upstream of the XFEL by a maximum of about 1 mm, resulting in a false shift of about 0.2 to 0.3° in the diffraction angle, corresponding well with the observed shifts at 1 µs.
A spot corresponding to Mg5Si6 is evident at 20 ns. This precipitate is to be expected in A6061 aluminum alloy. It is possible that the impulsive stress waves induced the dynamic precipitation of Mg5Si6, but other possibilities include rotation of a crystal grain to satisfy the diffraction conditions. Detailed experiments are required for further discussion.

5. Conclusions

LPwC is a surface enhancement technology; SR and XFEL are essential for microscopic analysis, and were indispensable over the course of LPwC development because they explain the relevant phenomena precisely. In particular, XFEL renders it possible to observe the dynamic behaviors of materials under LPwC conditions, revealing the mechanism thereof and facilitating the development of novel processes. We have used SR and XFEL to explore the mechanism and effects of LPwC for nearly 20 years [76]. XRD experiments employing SR spatially resolved the strain and allowed RS mapping showing that, after LPwC, the top surface was compressive [28]. Using these results and an empirical model, we explained how LPwC induced compressive RSs on the top surface [26]. Here, we describe how we visualized fatigue cracks with the aid of SR-based CT and CL, and how we performed time-resolved XRD using an XFEL. The results can be summarized as follows.
The effect of LPwC on fatigue crack growth in AC4CH cast aluminum alloy was studied using SR-based CT at SPring-8. Edge enhancement created by phase-contrast was apparent and 3D images of the fatigue cracks were reconstructed. The fatigue cracks were visualized non-destructively [27]. Crack growth retardation after LPwC was evident not only on the sample surface, but also in the interior. The results agreed well with surface observations employing optical microscopy [28].
SR-based CL at SPring-8 was used to visualize fatigue cracks in FSWed A6061-T6 aluminum alloy joints. We thus confirmed that CL can be used to evaluate laterally extended objects. Crack images were successfully reconstructed and agreed well with the actual fracture surfaces. CL can reproduce the 3D shapes of fatigue cracks in FSWed joints in a nondestructive manner. The propagation of such cracks can be evaluated via intermittent CL during fatigue testing. This provides crucial information for optimizing materials and processing of FSW, yielding higher-quality FSWed joints that are durable.
We performed time-resolved XRD to observe the time evolution of strain and microstructural changes in the A6061 aluminum alloy. We delivered laser pulse irradiation during pump-probe experiments in the Japanese XFEL facility, SACLA, and observed phenomena suggesting grain refinement, subgrain formation, and precipitation [73]; these are closely related to the mechanism of LPwC. We used thin foil samples and collected diffracted X-rays of XFEL single pulses at the free surface opposite the laser irradiation. Physical interpretation of the results was not easy because of stress wave reflection at the free surface and sample deformation. However, we observed over-compression and the diffusion of diffraction spots caused by the impulsive stress wave. We estimate that the duration of the dynamic phenomenon is less than 1 µs, which may render it possible to use high-repetition lasers beyond kHz to reduce LPwC processing time. This would reinvigorate LPwC by removing the main obstacle to extension of LPwC applications.

Author Contributions

Conceptualization, Y.S.; Methodology, Y.S., K.M., K.A., K.K. and T.S.; Investigation, Y.S., K.M., K.A., K.K. and T.S.; Resources, Y.S., K.M., K.A., K.K. and T.S.; Writing—Original Draft Preparation, Y.S.; Writing—Review and Editing, Y.S., K.M., K.A., K.K. and T.S.; Supervision, Y.S. and T.S. All authors have read and agreed to the published version of the manuscript.

Funding

This research received no external funding.

Acknowledgments

The authors thank the members of the SACLA engineering team especially Y. Inubushi (JASRI) and T. Sato (RIKEN, currently at SLAC) for their vital support of our XFEL experiments. The synchrotron radiation experiments were performed at the BL19B2 of SPring-8 with the approval of the Japan Synchrotron Radiation Research Institute (JASRI) (Proposal Nos. 2011A1685, 2011B1861, 2012A1274, 2012B1740, 2013B1863, 2014A1700, and 2014B1927). The XFEL experiments were performed at the BL3 [EH2] and [EH3] of SACLA with the approval of JASRI (Proposal Nos. 2012A8012, 2012B8011, 2013A8025, 2013B8029, 2014A8015, and 2014B8016).

Conflicts of Interest

The authors declare no conflict of interest.

References

  1. M’Saoubi, R.; Outeiro, J.C.; Chandrasekaran, H.; Dillon, O.W., Jr.; Jawahir, I.S. A review of surface integrity in machining and its impact on functional performance and life of machined products. Int. J. Sustain. Manuf. 2008, 1, 203–236. [Google Scholar] [CrossRef]
  2. Curtiss-Wright Surface Technologies. Available online: https://cwst.com (accessed on 6 October 2020).
  3. LSP Technologies. Available online: https://www.lsptechnologies.com (accessed on 6 October 2020).
  4. Clauer, A.H. Laser shock peening, the path to production. Metals 2019, 9, 626. [Google Scholar] [CrossRef] [Green Version]
  5. Ding, K.; Ye, L. Laser Shock Peening; Woodhead Publishing in Materials; Woodhead: Cambridge, UK, 2006. [Google Scholar]
  6. Kruusing, A. Underwater and water-assisted laser processing: Part 1-General features, steam cleaning and shock processing. Opt. Lasers Eng. 2004, 41, 307–327. [Google Scholar] [CrossRef]
  7. Montross, C.S.; Wei, T.; Ye, L.; Clark, G.; Mai, Y.W. Laser shock processing and its effects on microstructure and properties of metal alloys: A review. Int. J. Fatigue 2002, 24, 1021–1036. [Google Scholar] [CrossRef]
  8. Clauer, A.; Lahrman, D. Laser shock processing as a surface enhancement process. Key Eng. Mater. 2001, 197, 121–144. [Google Scholar] [CrossRef]
  9. Fabbro, R.; Peyre, P.; Berthe, L.; Scherpereel, X. Physics and applications of laser-shock processing. J. Laser Appl. 1998, 10, 265–279. [Google Scholar] [CrossRef]
  10. Altenberger, I.; Nalla, R.K.; Sano, Y.; Wagner, L.; Ritchie, R.O. On the effect of deep-rolling and laser-peening on the stress-controlled low-and high-cycle fatigue behavior of Ti–6Al–4V at elevated temperatures up to 550 °C. Int. J. Fatigue 2012, 44, 292–302. [Google Scholar] [CrossRef]
  11. Spanrad, S.; Tong, J. Characterisation of foreign object damage (FOD) and early fatigue crack growth in laser shock peened Ti–6Al–4V aerofoil specimens. Mater. Sci. Eng. A 2011, 528, 2128–2136. [Google Scholar] [CrossRef]
  12. See, D.W.; Dulaney, J.L.; Clauer, A.H.; Tenaglia, R.D. The air force manufacturing technology laser peening initiative. Surf. Eng. 2002, 18, 32–36. [Google Scholar] [CrossRef]
  13. Shukla, P.; Crookes, R.; Wu, H. Shock-wave induced compressive stress on alumina ceramics by laser peening. Mater. Des. 2019, 167, 107626. [Google Scholar] [CrossRef]
  14. Mannava, S.R.; Bhamare, S.; Chaswal, V.; Felon, L.; Kirschman, D.; Lahrman, D.; Tenaglia, R.; Qian, D.; Vasudevan, V. Application of laser shock peening for spinal implant rods. Int. J. Struct. Integr. 2011, 2, 101–113. [Google Scholar] [CrossRef]
  15. Changing Future of Manufacturing with Laser Peening, Toshiba Energy Systems & Solutions Corporation. Available online: https://www.toshiba-energy.com/en/nuclearenergy/topics/laserpeening.htm (accessed on 6 October 2020).
  16. Sano, Y. Quarter century development of laser peening without coating. Metals 2020, 10, 152. [Google Scholar] [CrossRef] [Green Version]
  17. Tokita, S.; Kokawa, H.; Kodama, S.; Sato, Y.S.; Sano, Y.; Li, Z.; Feng, K.; Wu, Y. Suppression of intergranular corrosion by surface grain boundary engineering of 304 austenitic stainless steel using laser peening plus annealing. Mater. Today Commun. 2020, 25, 101572. [Google Scholar] [CrossRef]
  18. Sano, Y.; Mukai, N.; Okazaki, K.; Obata, M. Residual stress improvement in metal surface by underwater laser irradiation. Nucl. Instrum. Methods Phys. Res. B 1997, 121, 432–436. [Google Scholar] [CrossRef]
  19. Mukai, N.; Aoki, N.; Obata, M.; Ito, A.; Sano, Y.; Konagai, C. Laser processing for underwater maintenance in nuclear plants. In Proceedings of the 3rd JSME/ASME International Conference on Nuclear Engineering (ICONE-3), Kyoto, Japan, 23–27 April 1995. [Google Scholar]
  20. Sano, Y.; Akita, K.; Masaki, K.; Ochi, Y.; Altenberger, I.; Scholtes, B. Laser peening without coating as a surface enhancement technology. J. Laser Micro/Nanoeng. 2006, 1, 161–166. [Google Scholar] [CrossRef] [Green Version]
  21. Sano, Y.; Mukai, N.; Yoda, M.; Uehara, T.; Chida, I.; Obata, M. Development and applications of laser peening without coating as a surface enhancement technology. In Proceedings of the SPIE 6343, Photonics North 2006, 634324, Quebec City, QC, Canada, 8 September 2006; SPIE: Bellingham, WA, USA, 2006. [Google Scholar]
  22. Sano, T.; Eimura, T.; Hirose, A.; Kawahito, Y.; Katayama, S.; Arakawa, K.; Masaki, K.; Shiro, A.; Shobu, T.; Sano, Y. Improving fatigue performance of laser-welded 2024-T3 aluminum alloy using dry laser peening. Metals 2019, 9, 1192. [Google Scholar] [CrossRef] [Green Version]
  23. Trdan, U.; Sano, T.; Klobčar, D.; Sano, Y.; Grum, J.; Šturm, R. Improvement of corrosion resistance of AA2024-T3 using femtosecond laser peening without protective and confining medium. Corros. Sci. 2018, 143, 46–55. [Google Scholar] [CrossRef]
  24. Peyre, P.; Berthe, L.; Scherpereel, X.; Fabbro, R. Laser-shock processing of aluminium-coated 55C1 steel in water-confinement regime, characterization and application to high-cycle fatigue behavior. J. Mater. Sci. 1998, 33, 1421–1429. [Google Scholar] [CrossRef]
  25. Peyre, P.; Chaieb, I.; Braham, C. FEM calculation of residual stresses induced by laser shock processing in stainless steels. Model. Simul. Mater. Sci. Eng. 2007, 15, 205–221. [Google Scholar] [CrossRef]
  26. Sano, Y.; Akita, K.; Sano, T. A mechanism for inducing compressive residual stresses on a surface by laser peening without coating. Metals 2020, 10, 816. [Google Scholar] [CrossRef]
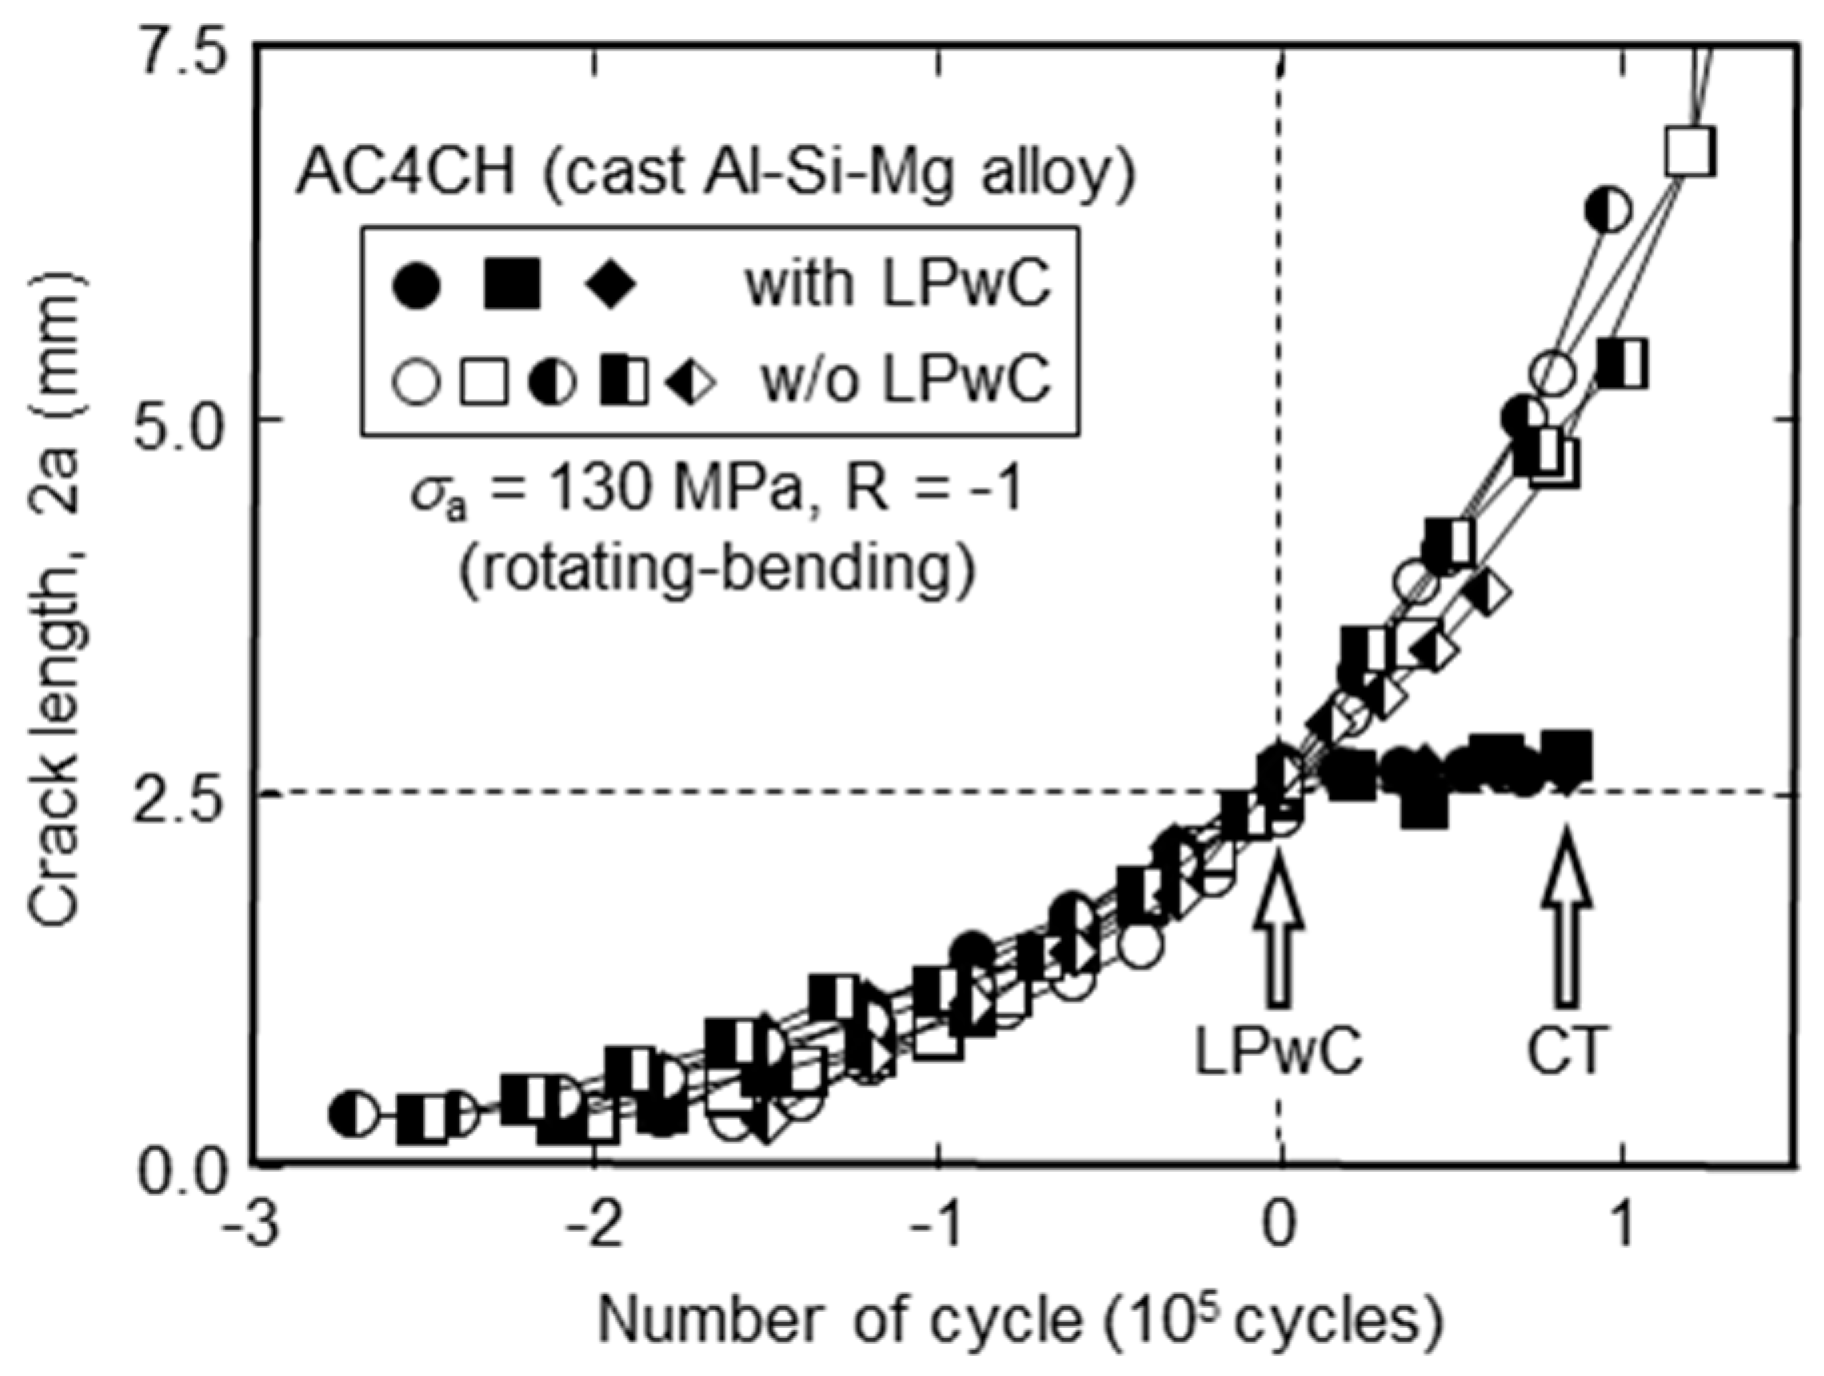
  27. Masaki, K.; Sano, Y.; Ochi, Y.; Akita, K.; Kajiwara, K. Investigation of fatigue crack behavior with synchrotron radiation on AC4CH casting aluminum alloy. J. Solid Mech. Mater. Eng. 2008, 2, 1104–1113. [Google Scholar] [CrossRef] [Green Version]
  28. Sano, Y.; Akita, K.; Masaki, K.; Ochi, Y.; Sato, M.; Kajiwara, K. Non-destructive characterization of laser-peened materials with synchrotron radiation of SPring-8. In Proceedings of the International Conference on Advanced Technology in Experimental Mechanics (ATEM’07), Fukuoka, Japan, 12–14 September 2007. [Google Scholar]
  29. Sano, Y.; Masaki, K. Three-Dimensional Imaging of Fatigue Cracks by Microtomography with Refractive Contrast Effect. SPring-8 Res. Front. 2006, pp. 151–152. Available online: http://www.spring8.or.jp/pdf/en/res_fro/06/151-152.pdf (accessed on 6 October 2020).
  30. Sano, Y.; Masaki, K.; Kajiwara, K. Evaluation of fatigue cracks in FSW joints of industrial structural materials by laminography. Hoshako 2016, 29, 32–37. [Google Scholar]
  31. Jacquin, D.; Guillemot, G. A review of microstructural changes occurring during FSW in aluminium alloys and their modelling. J. Mater. Process. Technol. 2020, 288, 116706. [Google Scholar] [CrossRef]
  32. Lorrain, O.; Favier, V.; Zahrouni, H.; Lawrjaniec, D. Understanding the material flow path of friction stir welding process using unthreaded tools. J. Mater. Process. Technol. 2010, 210, 603–609. [Google Scholar] [CrossRef]
  33. Lombard, H.; Hattingh, D.G.; Steuwer, A.; James, M.N. Optimising FSW process parameters to minimise defects and maximise fatigue life in 5083-H321 aluminium alloy. Eng. Fract. Mech. 2008, 75, 341–354. [Google Scholar] [CrossRef]
  34. Leal, R.M.; Leitao, C.; Loureiro, A.; Rodrigues, D.M.; Vilaça, P. Material flow in heterogeneous friction stir welding of thin aluminium sheets: Effect of shoulder geometry. Mater. Sci. Eng. A 2008, 498, 384–391. [Google Scholar] [CrossRef] [Green Version]
  35. Bussu, G.; Irving, P.E. The role of residual stress and heat affected zone properties on fatigue crack propagation in friction stir welded 2024-T351 aluminium joints. Int. J. Fatigue 2003, 25, 77–88. [Google Scholar] [CrossRef]
  36. Colligan, K. Material flow behavior during friction stir welding of aluminum. Weld. J. 1999, 78, 229–237. [Google Scholar]
  37. Tra, T.H.; Okazaki, M.; Suzuki, K. Fatigue crack propagation behavior in friction stir welding of AA6063-T5: Roles of residual stress and microstructure. Int. J. Fatigue 2012, 43, 23–29. [Google Scholar] [CrossRef]
  38. Yabashi, M.; Tanaka, H.; Ishikawa, T. Overview of the SACLA facility. J. Synchrotron Radiat. 2015, 22, 477–484. [Google Scholar] [CrossRef] [PubMed] [Green Version]
  39. Ishikawa, T.; Aoyagi, H.; Asaka, T.; Asano, Y.; Azumi, N.; Bizen, T.; Ego, H.; Fukami, K.; Fukui, T.; Furukawa, Y.; et al. A compact X-ray free-electron laser emitting in the sub-ångström region. Nat. Photonics 2012, 6, 540–544. [Google Scholar] [CrossRef]
  40. Amann, J.; Berg, W.; Blank, V.; Decker, F.J.; Ding, Y.; Emma, P.; Feng, Y.; Frisch, J.; Fritz, D.; Hastings, J.; et al. Demonstration of self-seeding in a hard-X-ray free-electron laser. Nat. Photonics 2012, 6, 693–698. [Google Scholar] [CrossRef]
  41. Emma, P.; Akre, R.; Arthur, J.; Bionta, R.; Bostedt, C.; Bozek, J.; Brachmann, A.; Bucksbaum, P.; Coffee, R.; Decker, F.-J.; et al. First lasing and operation of an ångstrom-wavelength free-electron laser. Nat. Photonics 2010, 4, 641–647. [Google Scholar] [CrossRef]
  42. Vartanyants, I.A.; Robinson, I.K.; McNulty, I.; David, C.; Wochner, P.; Tschentscher, T. Coherent X-ray scattering and lensless imaging at the European XFEL Facility. J. Synchrotron Radiat. 2007, 14, 453–470. [Google Scholar] [CrossRef] [Green Version]
  43. Sandberg, R.L.; Bolme, C.; Ramos, K.; Mcculloch, Q.; Martinez, R.; Hamilton, V.; Pierce, T.; Greenfield, M.; McGrane, S.; Barber, J.L.; et al. Studying shocked material dynamics with ultrafast x-rays. Microsc. Microanal. 2015, 21, 1851–1852. [Google Scholar] [CrossRef] [Green Version]
  44. Sano, T. In-situ X-ray Free Electron Laser diffraction under femtosecond laser-driven shock compression of solids. Radiat. Chem. 2013, 96, 23–28. [Google Scholar]
  45. Tanaka, Y.; Ito, K.; Nakatani, T.; Onitsuka, R.; Newton, M.; Sato, T.; Togashi, T.; Yabashi, M.; Kawaguchi, T.; Shimada, K.; et al. Time-resolved Bragg coherent X-ray diffraction revealing ultrafast lattice dynamics in nano-thickness crystal layer using X-ray free electron laser. J. Ceram. Soc. Jpn. 2013, 121, 283–286. [Google Scholar] [CrossRef] [Green Version]
  46. Ocaña, J.L.; Morales, M.; Molpeceres, C.; Torres, J. Numerical simulation of surface deformation and residual stresses fields in laser shock processing experiments. Appl. Surf. Sci. 2004, 238, 242–248. [Google Scholar] [CrossRef]
  47. Morales, M.; Porro, J.A.; Molpeceres, C.; Holgado, M.; Ocaña, J.L. Analysis of plasma thermal surface effects on the residual stress field induced by LSP in Al2024-t351. J. Optoelectron. Adv. Mater. 2010, 12, 718–722. [Google Scholar]
  48. Sano, Y.; Masaki, K.; Ochi, Y.; Akita, K.; Kajiwara, K. Imaging of fatigue cracks in aluminum alloy by micro computed tomography with synchrotron radiation. J. Soc. Mater. Sci. Jpn. 2008, 57, 395–400. [Google Scholar] [CrossRef] [Green Version]
  49. Masaki, K.; Sano, Y.; Ochi, Y.; Akita, K.; Kajiwara, K.; Adachi, T. Investigation of propagation and interference behavior of surface fatigue cracks under rotating bending fatigue by μCT technique with synchrotron radiation. J. Soc. Mater. Sci. Jpn. 2009, 58, 975–981. [Google Scholar] [CrossRef]
  50. Masaki, K.; Ochi, Y.; Matsumura, T.; Sano, Y. Effects of laser peening treatment on high cycle fatigue properties of degassing-processed cast aluminum alloy. Mater. Sci. Eng. A 2007, 468, 171–175. [Google Scholar] [CrossRef]
  51. Ishisaka, A.; Ohara, H.; Honda, C. A new method of analyzing edge effect in phase contrast imaging with incoherent x-rays. Opt. Rev. 2000, 7, 566–572. [Google Scholar] [CrossRef]
  52. Uesugi, K.; Suzuki, Y.; Yagi, N.; Tsuchiyama, A.; Nakano, T. Development of high spatial resolution X-ray CT system at BL47XU in SPring-8. Nucl. Instrum. Methods in Phys. Res. A 2001, 467, 853–856. [Google Scholar] [CrossRef]
  53. Momose, A.; Takeda, T.; Itai, Y.; Yoneyama, A.; Hirano, K. Phase-contrast tomographic imaging using an X-ray interferometer. J. Synchrotron Radiat. 1998, 5, 309–314. [Google Scholar] [CrossRef]
  54. Agliozzo, S.; Cloetens, P. Quantification of micrometre-sized porosity in quasicrystals using coherent synchrotron radiation imaging. J. Microsc. 2004, 216, 62–69. [Google Scholar] [CrossRef]
  55. Mishra, R.S.; Ma, Z.Y. Friction stir welding and processing. Mater. Sci. Eng. R 2005, 50, 1–78. [Google Scholar] [CrossRef]
  56. Olea, C.A.W.; Roldo, L.; Strohaecker, T.R.; dos Santos, J.F. Friction stir welding of precipitate hardenable aluminium alloys: A review. Weld. World 2006, 50, 78–87. [Google Scholar] [CrossRef]
  57. Tutum, C.C.; Hattel, J.H. Numerical optimisation of friction stir welding: Review of future challenges. Sci. Technol. Weld. Join. 2011, 16, 318–324. [Google Scholar] [CrossRef]
  58. Sano, Y.; Masaki, K.; Hirota, K. Improvement in fatigue strength of friction stir welded aluminum alloy plates by laser peening. Adv. Mater. Res. 2014, 891, 969–973. [Google Scholar] [CrossRef]
  59. Sano, Y.; Masaki, K.; Gushi, T.; Sano, T. Improvement in fatigue performance of friction stir welded A6061-T6 aluminum alloy by laser peening without coating. Mater. Des. 2012, 36, 809–814. [Google Scholar] [CrossRef]
  60. Hong, S.J.; Kim, S.S.; Lee, C.G.; Kim, S.J. Fatigue crack propagation behavior of friction stir welded Al–Mg–Si alloy. Scr. Mater. 2006, 55, 1007–1010. [Google Scholar] [CrossRef]
  61. Moreira, P.M.G.P.; de Figueiredo, M.A.V.; de Castro, P.M.S.T. Fatigue behaviour of FSW and MIG weldments for two aluminium alloys. Theor. Appl. Fract. Mech. 2007, 48, 169–177. [Google Scholar] [CrossRef]
  62. Milan, M.T.; Bose Filho, W.W.; Ruckert, C.O.F.T.; Tarpani, J.R. Fatigue behaviour of friction stir welded AA2024-T3 alloy: Longitudinal and transverse crack growth. Fatigue Fract. Eng. Mater. Struct. 2008, 31, 526–538. [Google Scholar] [CrossRef]
  63. Moreira, P.M.G.P.; de Jesus, A.M.P.; Ribeiro, A.S.; de Castro, P.M.S.T. Fatigue crack growth in friction stir welds of 6082-T6 and 6061-T6 aluminium alloys: A comparison. Theor. Appl. Fract. Mech. 2008, 50, 81–91. [Google Scholar] [CrossRef]
  64. Hatamleh, O.; Hill, M.; Forth, S.; Garcia, D. Fatigue crack growth performance of peened friction stir welded 2195 aluminum alloy joints at elevated and cryogenic temperatures. Mater. Sci. Eng. A 2009, 519, 61–69. [Google Scholar] [CrossRef]
  65. Moreira, P.M.G.P.; de Jesus, A.M.P.; de Figueiredo, M.A.V.; Windisch, M.; Sinnema, G.; de Castro, P.M.S.T. Fatigue and fracture behaviour of friction stir welded aluminium-lithium 2195. Theor. Appl. Fract. Mech. 2012, 60, 1–9. [Google Scholar] [CrossRef]
  66. Helfen, L.; Baumbach, T.; Mikulík, P.; Kiel, D.; Pernot, P.; Cloetens, P.; Baruchel, J. High-resolution three-dimensional imaging of flat objects by synchrotron-radiation computed laminography. Appl. Phys. Lett. 2005, 86, 071915. [Google Scholar] [CrossRef]
  67. Helfen, L.; Myagotin, A.; Rack, A.; Pernot, P.; Mikulík, P.; Di Michiel, M.; Baumbach, T. Synchrotron-radiation computed laminography for high-resolution three-dimensional imaging of flat devices. Phys. Stat. Sol. (a) 2007, 204, 2760–2765. [Google Scholar] [CrossRef]
  68. Shen, Y.; Morgeneyer, T.F.; Garnier, J.; Allais, L.; Helfen, L.; Crépin, J. Three-dimensional quantitative in situ study of crack initiation and propagation in AA6061 aluminum alloy sheets via synchrotron laminography and finite-element simulations. Acta. Mater. 2013, 61, 2571–2582. [Google Scholar] [CrossRef]
  69. Bull, D.J.; Helfen, L.; Sinclair, I.; Spearing, S.M.; Baumbach, T. A comparison of multi-scale 3D X-ray tomographic inspection techniques for assessing carbon fibre composite impact damage. Compos. Sci. Technol. 2013, 75, 55–61. [Google Scholar] [CrossRef] [Green Version]
  70. Cloetens, P.; Pateyron-Salomé, M.; Buffière, J.Y.; Peix, G.; Baruchel, J.; Peyrin, F.; Schlenker, M. Observation of microstructure and damage in materials by phase sensitive radiography and tomography. J. Appl. Phys. 1997, 81, 5878–5886. [Google Scholar] [CrossRef]
  71. Helfen, L.; Baumbach, T.; Cloetens, P.; Baruchel, J. Phase-contrast and holographic computed laminography. Appl. Phys. Lett. 2009, 94, 104103. [Google Scholar] [CrossRef]
  72. Sano, Y. Observation of Dynamic Phenomena of Laser Peening with XFEL at SACLA; SLAC Photon Science Seminar Series; SLAC National Accelerator Laboratory: Menlo Park, CA, USA, 2013. [Google Scholar]
  73. Sano, Y.; Fujita, T. Enhancement of surface properties on metallic materials by pulse laser irradiation and the real-time observation at SACLA. Nippon Kessho Gakkai-Shi 2014, 56, 22–26. [Google Scholar] [CrossRef]
  74. Fabbro, R.; Fournier, J.; Ballard, P.; Devaux, D.; Virmont, J. Physical study of laser-produced plasma in confined geometry. J. Appl. Phys. 1990, 68, 775–784. [Google Scholar] [CrossRef]
  75. Mukai, N.; Sano, Y.; Yoda, M.; Chida, I.; Uehara, T.; Yamamoto, T. Preventive maintenance against stress corrosion cracking in nuclear power reactors by laser peening: Remote delivery of high-power pulsed laser. Rev. Laser Eng. 2005, 33, 444–451. [Google Scholar] [CrossRef] [Green Version]
  76. Yoshioka, Y.; Akita, K.; Suzuki, H.; Sano, Y.; Ogawa, K. Residual stress measurements of laser peened steels by using synchrotron radiation. Mater. Sci. Forum 2002, 404–407, 83–88. [Google Scholar] [CrossRef]
Figure 1. The shape and dimensions of AC4CH samples used for rotating-bending fatigue testing. The dimensions are expressed in millimeters.
Metals 10 01490 g001
Figure 2. Crack growth behavior of AC4CH fatigue samples. Each curve is shifted so that the fatigue cycle at the crack length of 2.5 mm is the origin of the horizontal axis. Laser peening without coating (LPwC) was applied, and fatigue loading continued. Computed tomography (CT) was performed after an additional 105 loading cycles at SPring-8.
Metals 10 01490 g002
Figure 3. The CT setup with a phase-contrast effect at BL19B2 of SPring-8.
Metals 10 01490 g003
Figure 4. Edge enhancement calculation of the projected X-ray image afforded by phase-contrast: (a) The calculative geometry. The sample serves as a concave lens; (b) edge enhancement with bright and dark areas at the boundary.
Metals 10 01490 g004
Figure 5. The effect of phase-contrast: (a) Reconstructed slice images at the level of the drilled hole; (b) a plot of the linear attenuation coefficients along the line A-A’ of Figure 5a. The border between the object (AC4CH) and air is enhanced.
Metals 10 01490 g005
Figure 6. Three-dimensional (3D) crack images of AC4CH fatigue samples: (a) The crack in the reference sample (no LPwC); (b) The crack in the sample that underwent LPwC. A comparison shows that LPwC retarded crack propagation.
Metals 10 01490 g006
Figure 7. S-N curves of the A6061-T6 base material (BM), the friction stir welded material (FSW), and both materials after LPwC. The fatigue strength of the FSWed material was enhanced by LPwC to beyond that of the BM.
Metals 10 01490 g007
Figure 8. The sample arrangement for synchrotron radiation (SR)-based computed laminography (CL).
Metals 10 01490 g008
Figure 9. The shape and dimensions of FSWed samples. The dimensions are expressed in millimeters. The red circles are the fields of view of CL.
Metals 10 01490 g009
Figure 10. The SR-based CL setup at BL19B2 of SPring-8.
Metals 10 01490 g010
Figure 11. The scanning equipment of SR-based CL and the sample holder.
Metals 10 01490 g011
Figure 12. The fatigue crack on the sample surface.
Metals 10 01490 g012
Figure 13. The reconstructed SR-based CL 3D image and a photograph of the fatigue crack.
Metals 10 01490 g013
Figure 14. Crack propagation behavior: (a) Images of the main crack viewed from the fatigue loading direction; (b) crack propagation curves. The arrows point to the reference axes.
Metals 10 01490 g014
Figure 15. Configuration of the laser pump and the XFEL probe experiment performed at SACLA: (a) The setup around the sample and the diffractometer in preparation for ultra-fast X-ray diffraction (XRD); (b) at the moment of laser pulse irradiation.
Metals 10 01490 g015
Figure 16. The sample configuration: (a) The acrylic plate was placed on the diffractometer with a tilt angle of 16°.; (b) a magnified view of the sample foil after pump-probe experiments. Each laser pulse locally deforms the sample, creating a cone with a rounded head.
Metals 10 01490 g016
Figure 17. Diffraction pattern of the solution heat-treated A6061 aluminum alloy. The spotty pattern prior to laser irradiation (pre-shock) changed to a quasi-ring pattern (post-shock).
Metals 10 01490 g017
Figure 18. Diffracted XFEL patterns of the solution heat-treated A6061 aluminum alloy at 12 ns after laser pulse irradiation: (a) The position of the stress wave; (b) diffraction patterns before and after laser irradiation; (c) superimposition of diffraction spots “S2” and “S3”.
Metals 10 01490 g018
Figure 19. Diffracted XFEL patterns of the solution heat-treated A6061 aluminum alloy at 16 ns after laser pulse irradiation: (a) The position of the stress wave; (b) diffraction patterns before and after laser irradiation; (c) superimposition of diffraction spots “S5” and “S6”.
Metals 10 01490 g019
Figure 20. The diffraction patterns of solution heat-treated A6061 aluminum alloy to 1 µs. The insets for 12, 16, 20, and 30 ns schematically show the position of the laser-induced stress wave in the 0.1 mm thick sample. The enlarged images show the changes in the diffraction spots.
Metals 10 01490 g020
Table 1. The chemical composition of the AC4CH cast aluminum alloy.
ElementCuSiMgZnFeMnAl
Composition (wt.%)0.0326.920.3070.0090.1580.007Bal.
Table 2. The chemical composition of the A6061-T6 base material (BM).
ElementSiFeCuMnMgCrZnTiAl
Composition (wt.%)0.650.20.300.061.040.130.040.02Bal.
Table 3. The mechanical properties of the A6061-T6 BM and FSWed material.
MaterialTensile Strength (MPa)0.2% Proof Strength (MPa)Elongation (%)
Base material33631815.7
FSWed material195-4.8
Publisher’s Note: MDPI stays neutral with regard to jurisdictional claims in published maps and institutional affiliations.

