Analysis and Optimization of Tooth Surface Contact Stress of Gears with Tooth Profile Deviations, Meshing Errors and Lead Crowning Modifications Based on Finite Element Method and Taguchi Method

Abstract
:1. Introduction
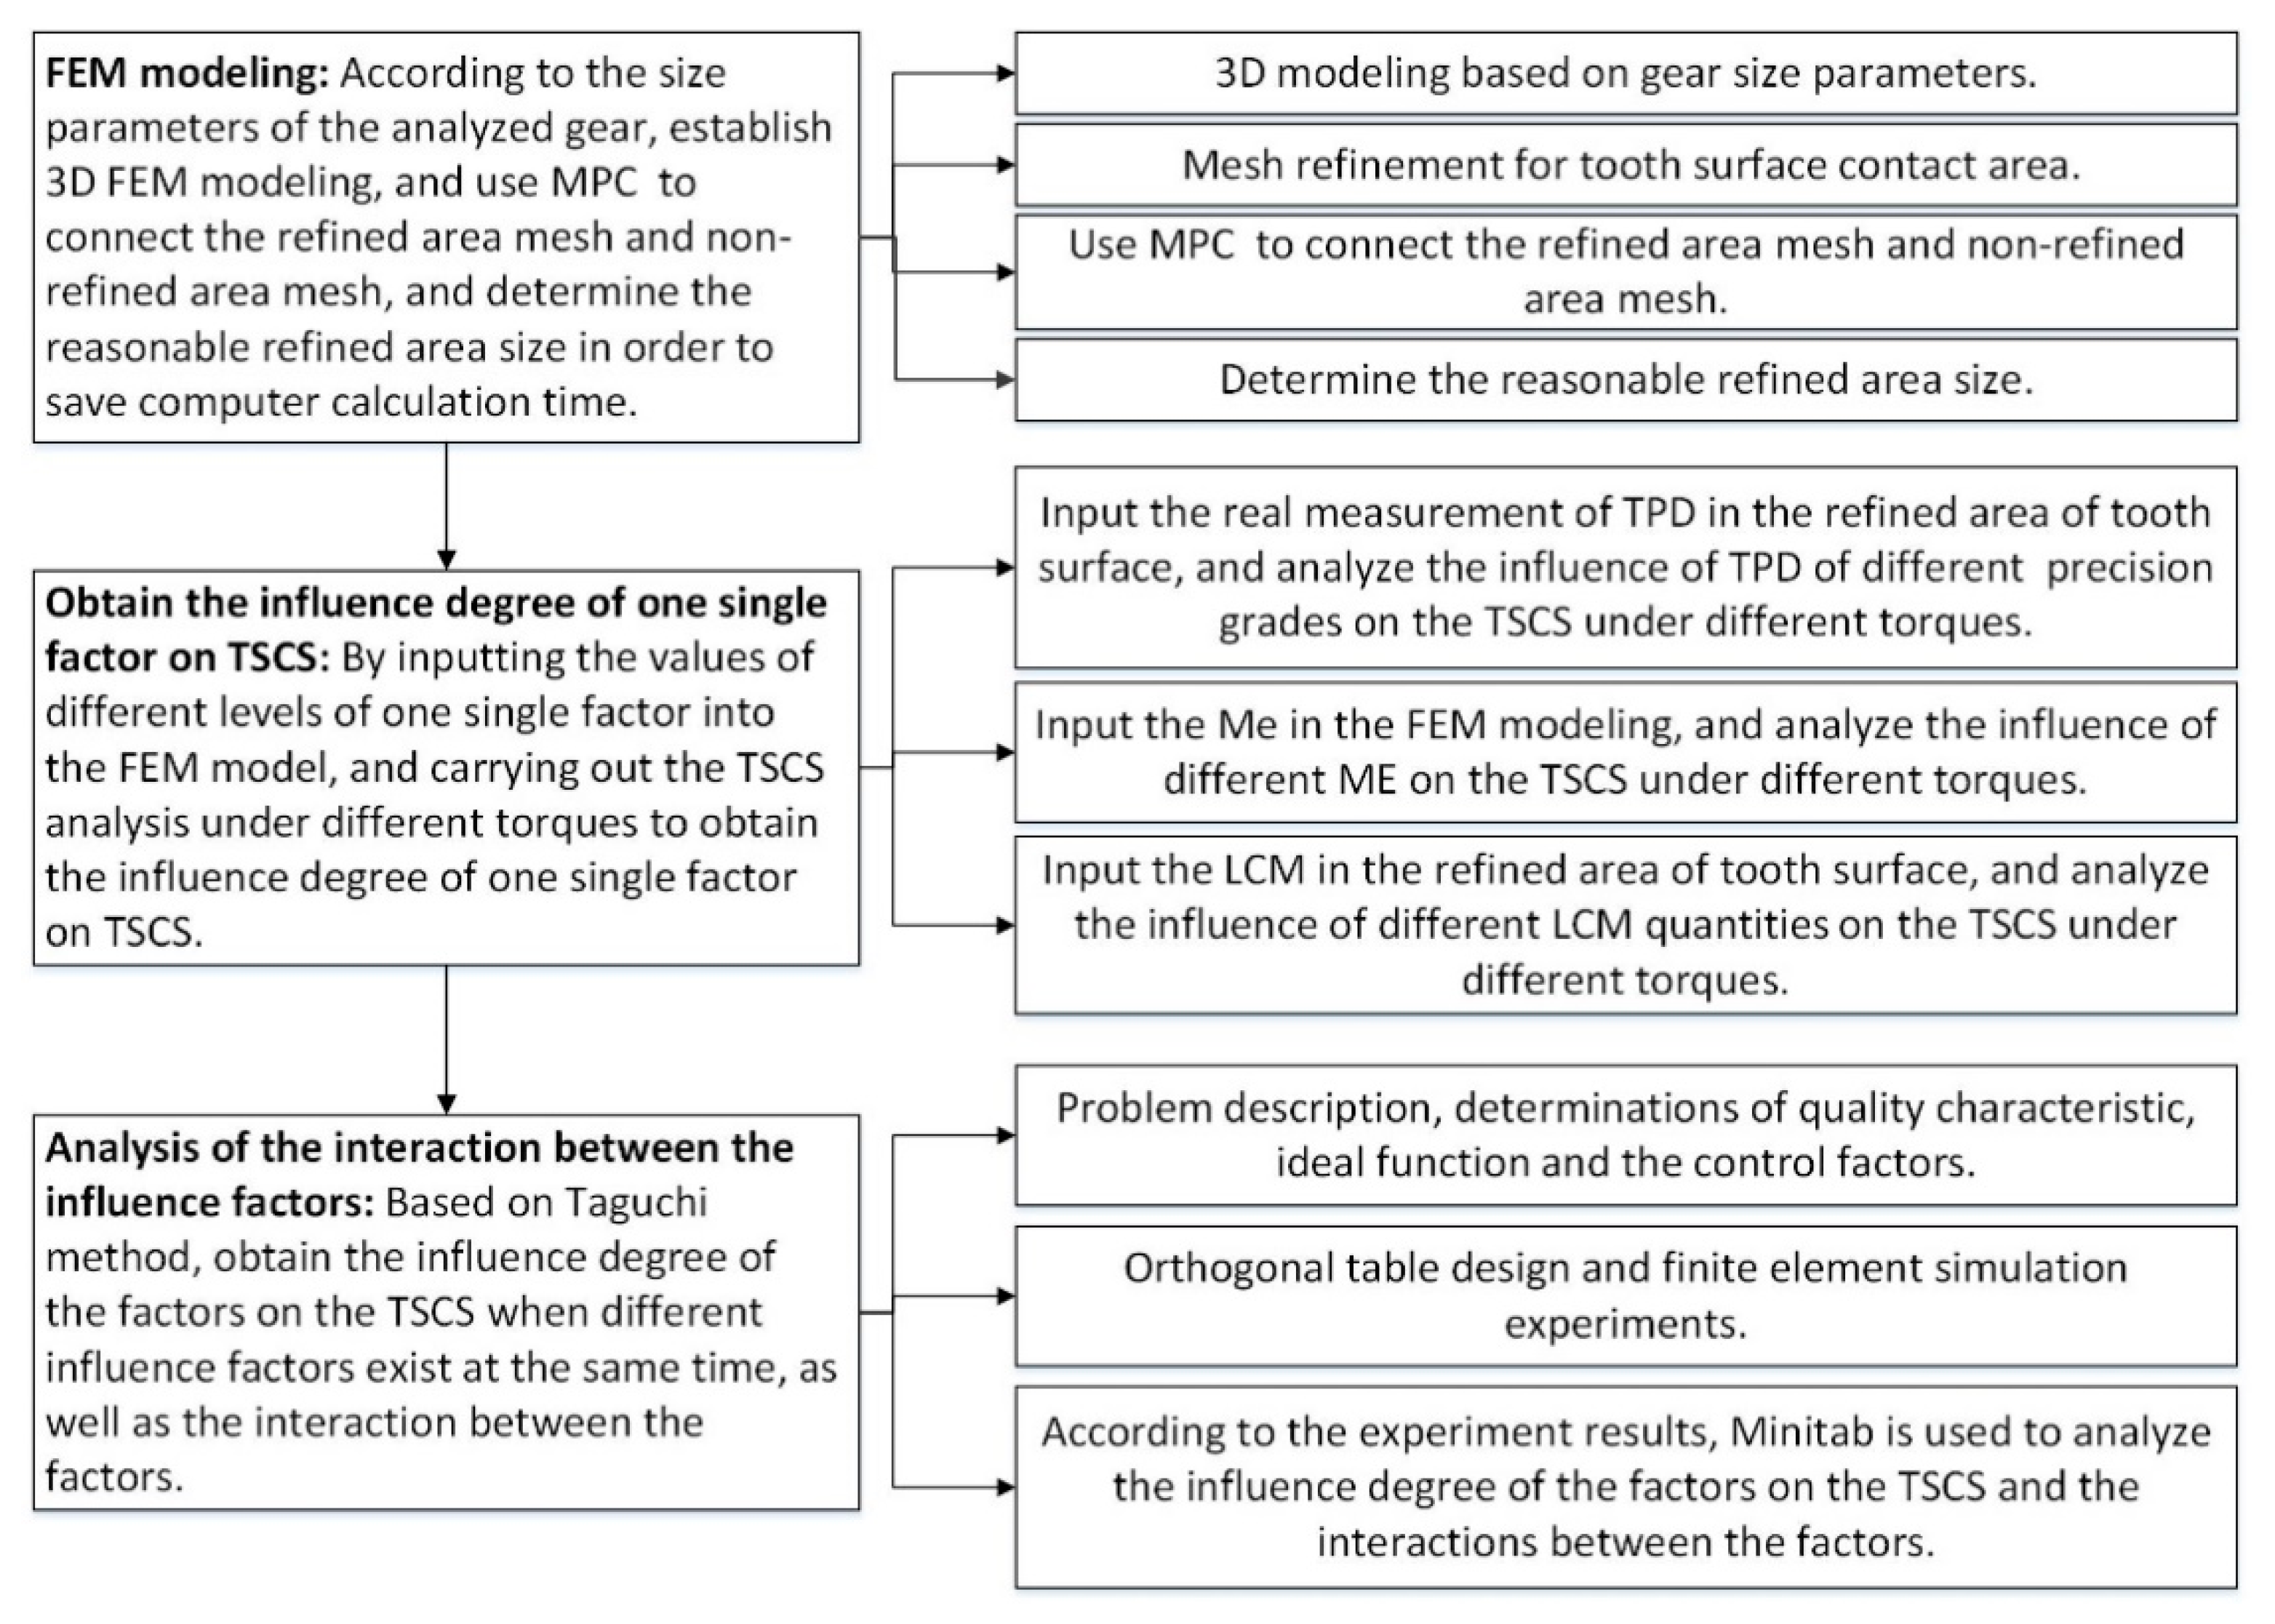
2. FEM Modeling
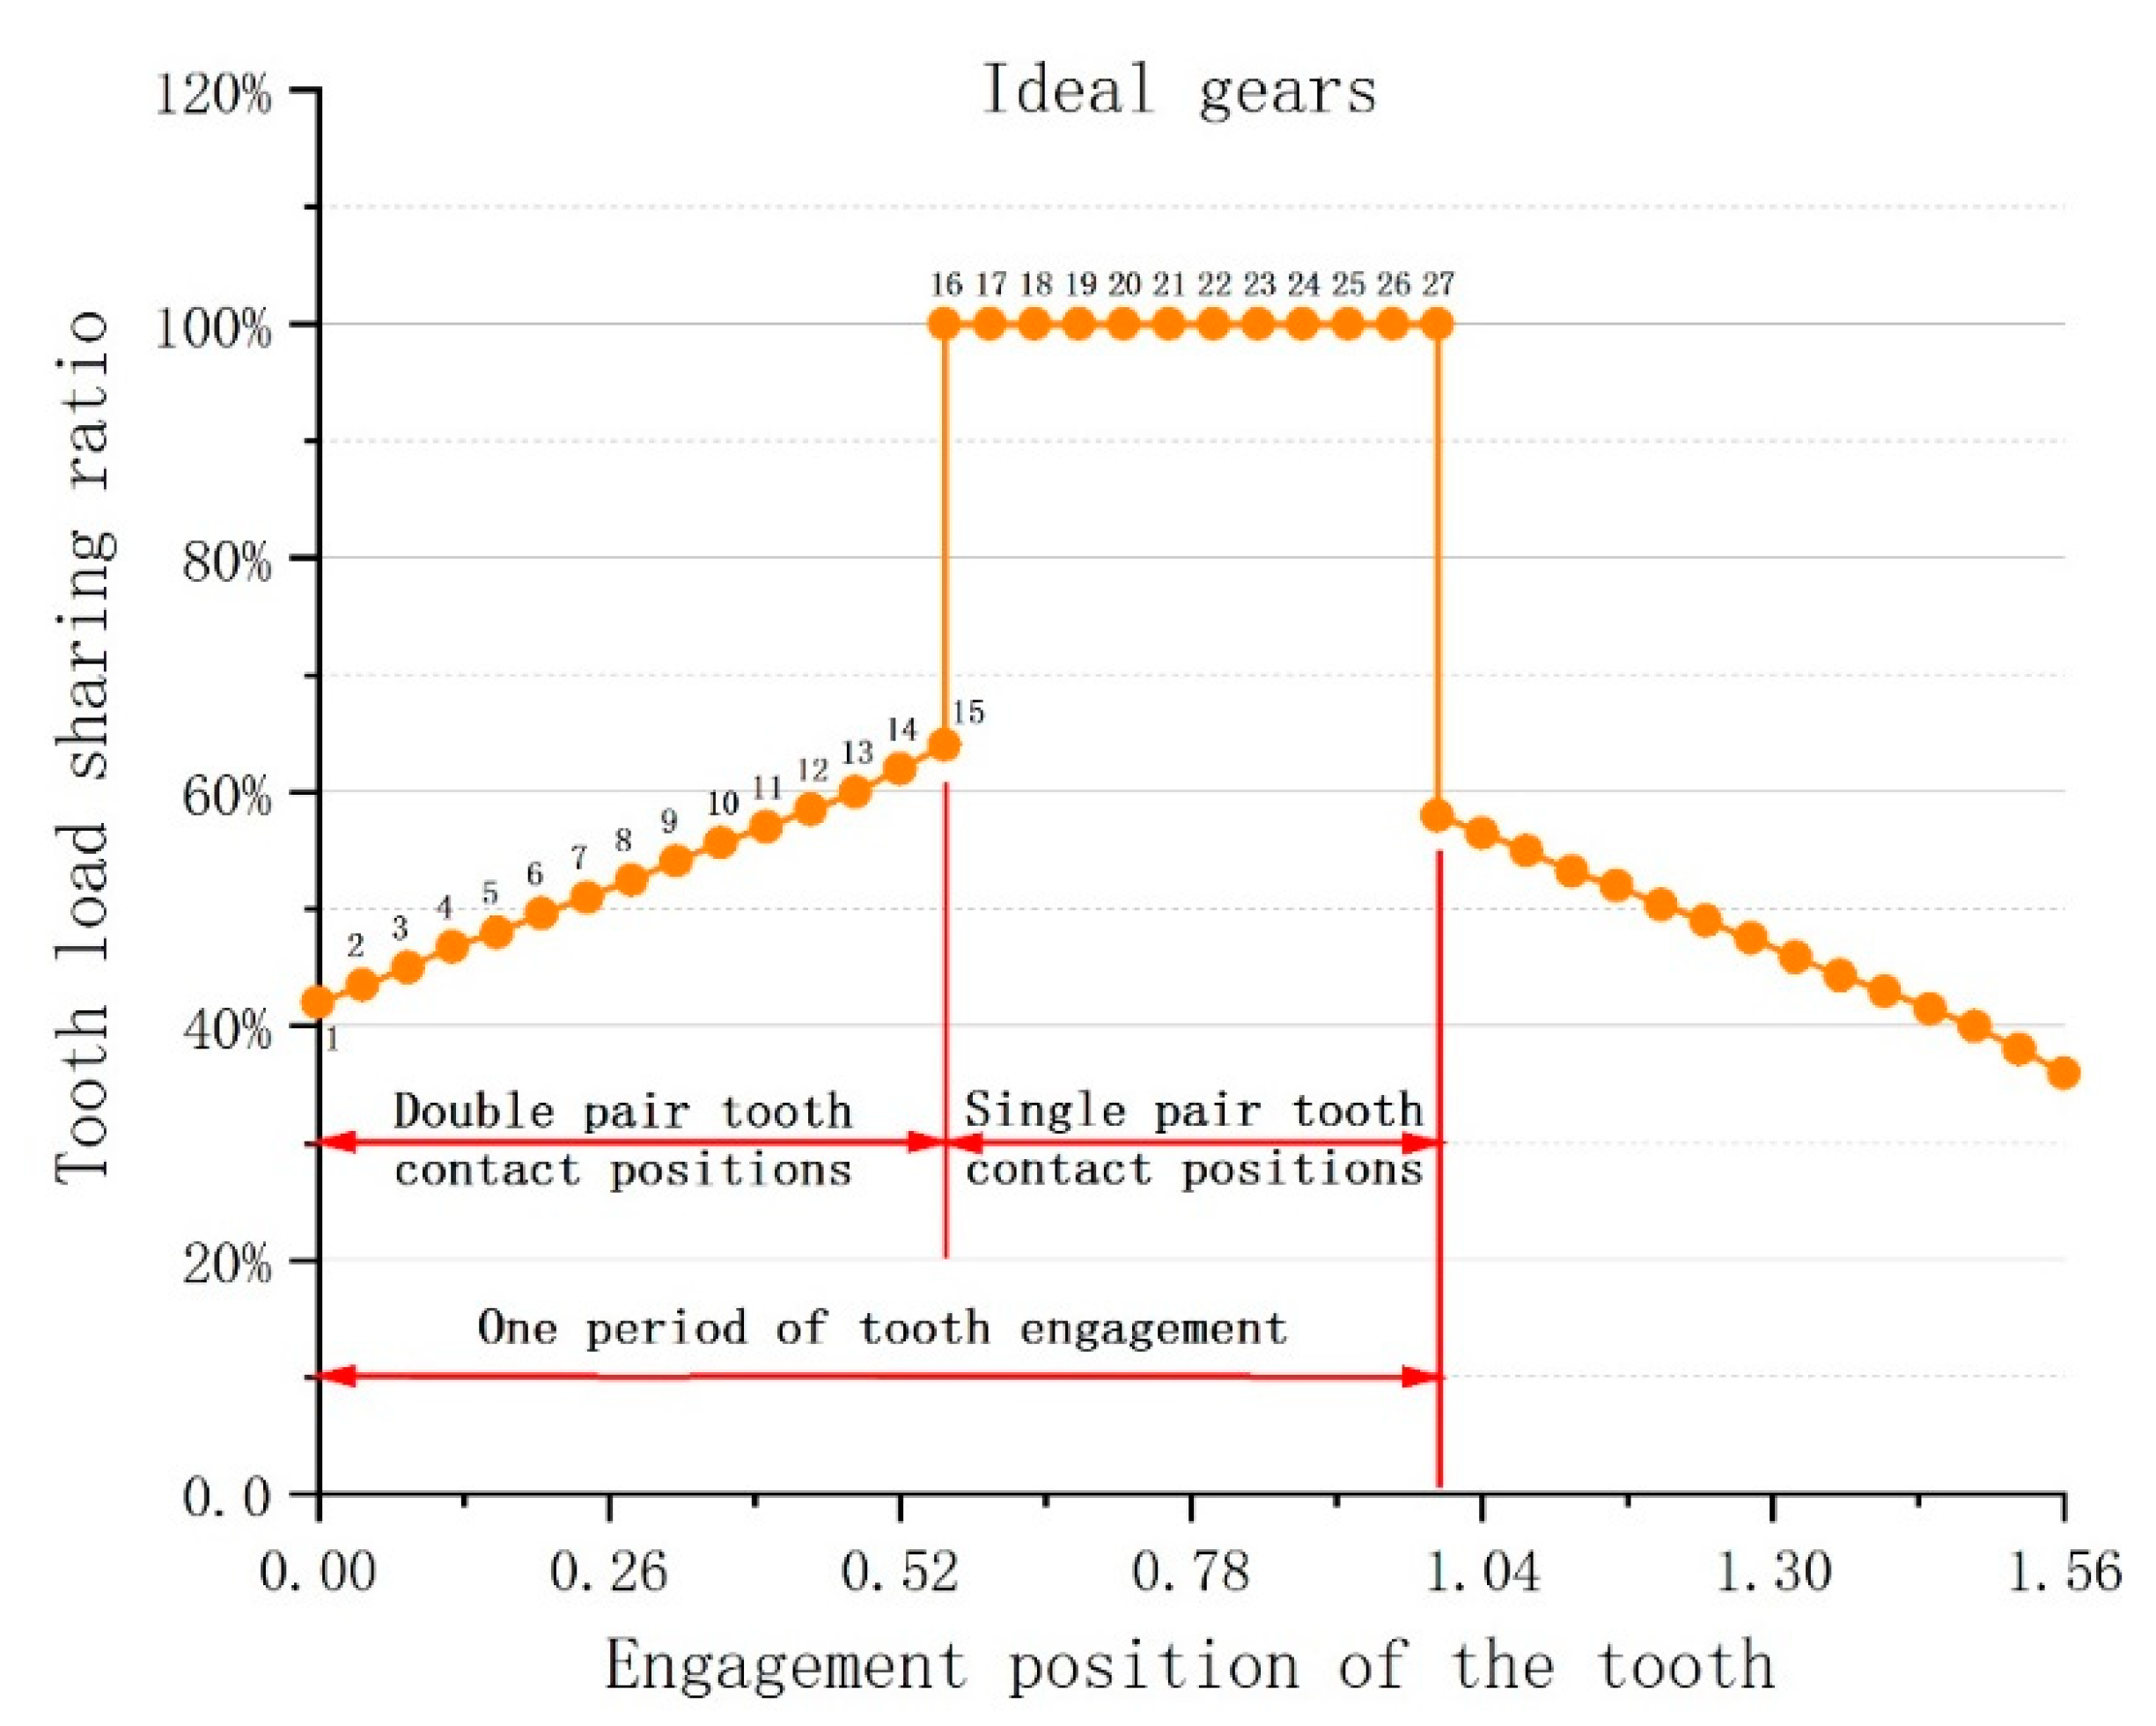
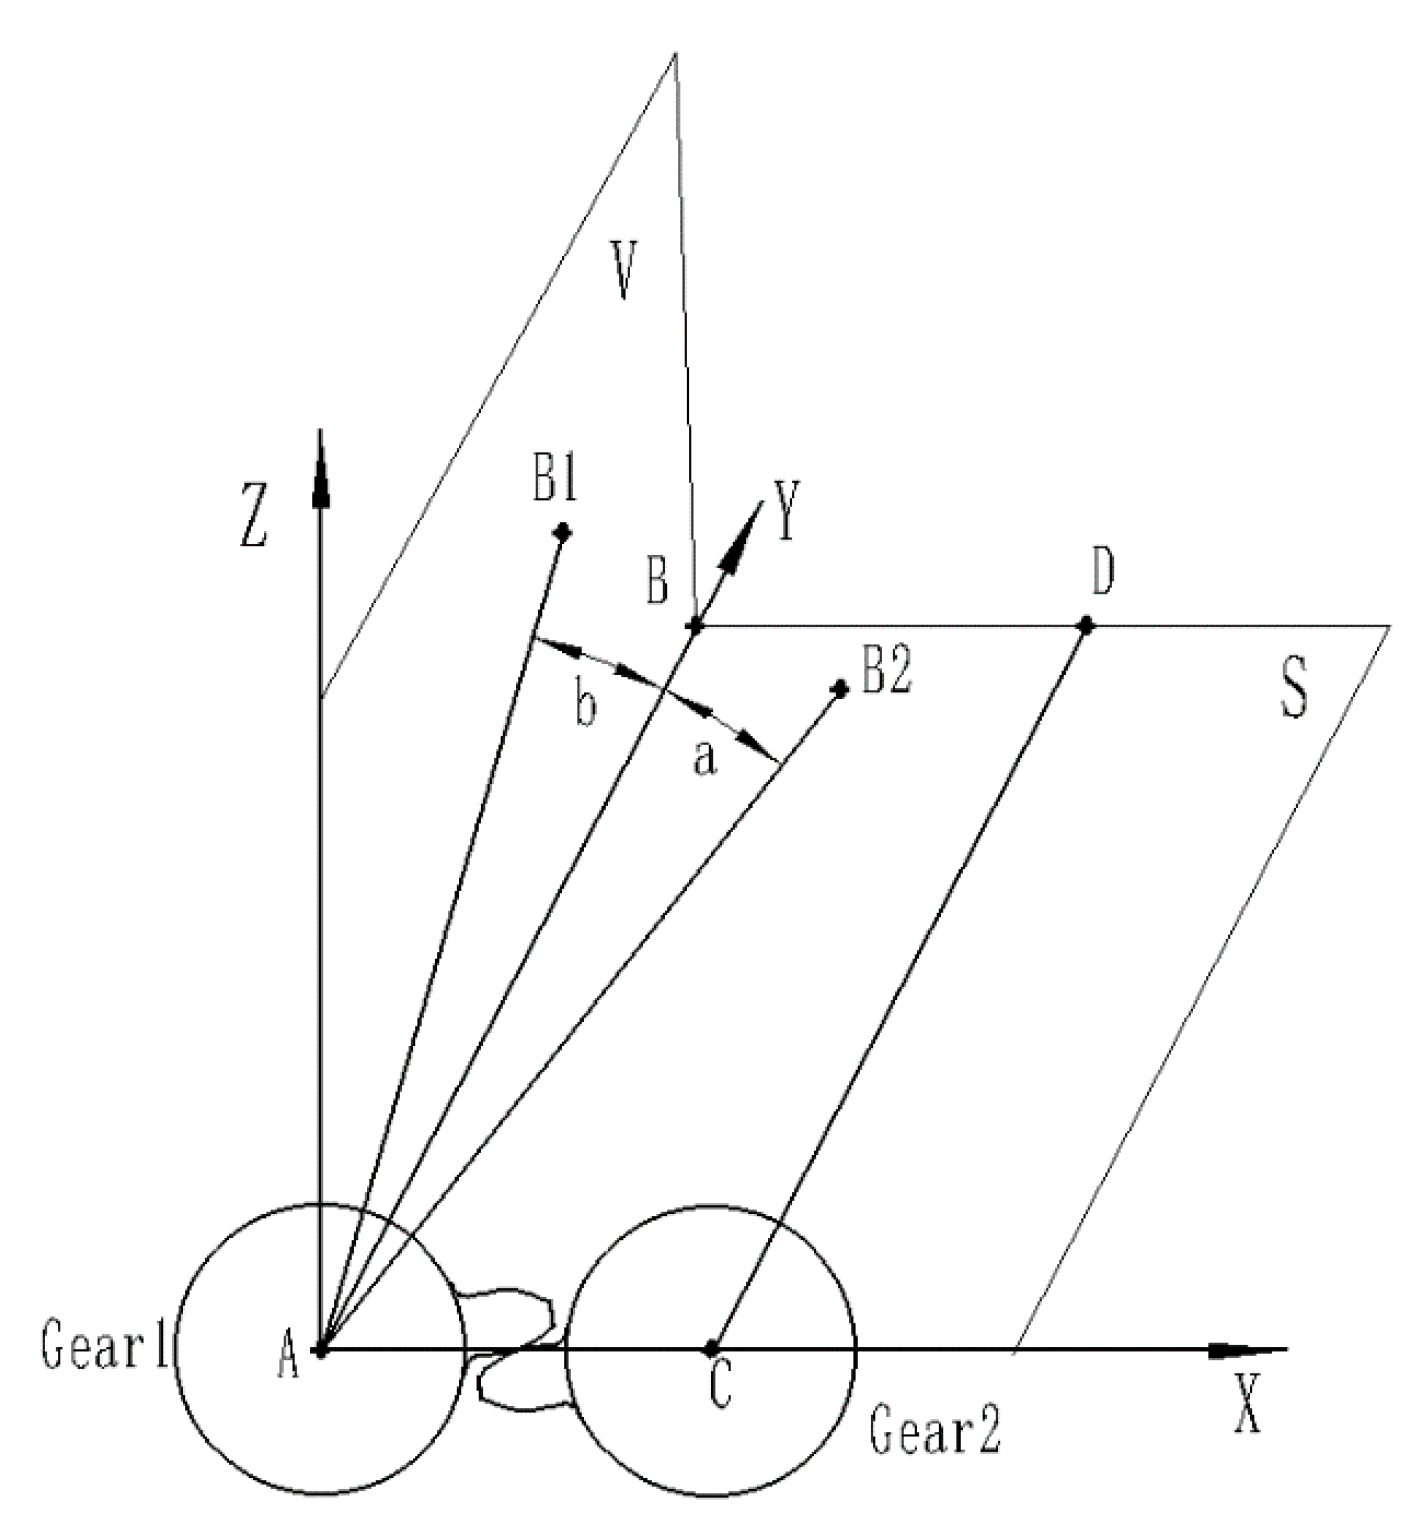
2.1. Determination of Gear Engagement Position
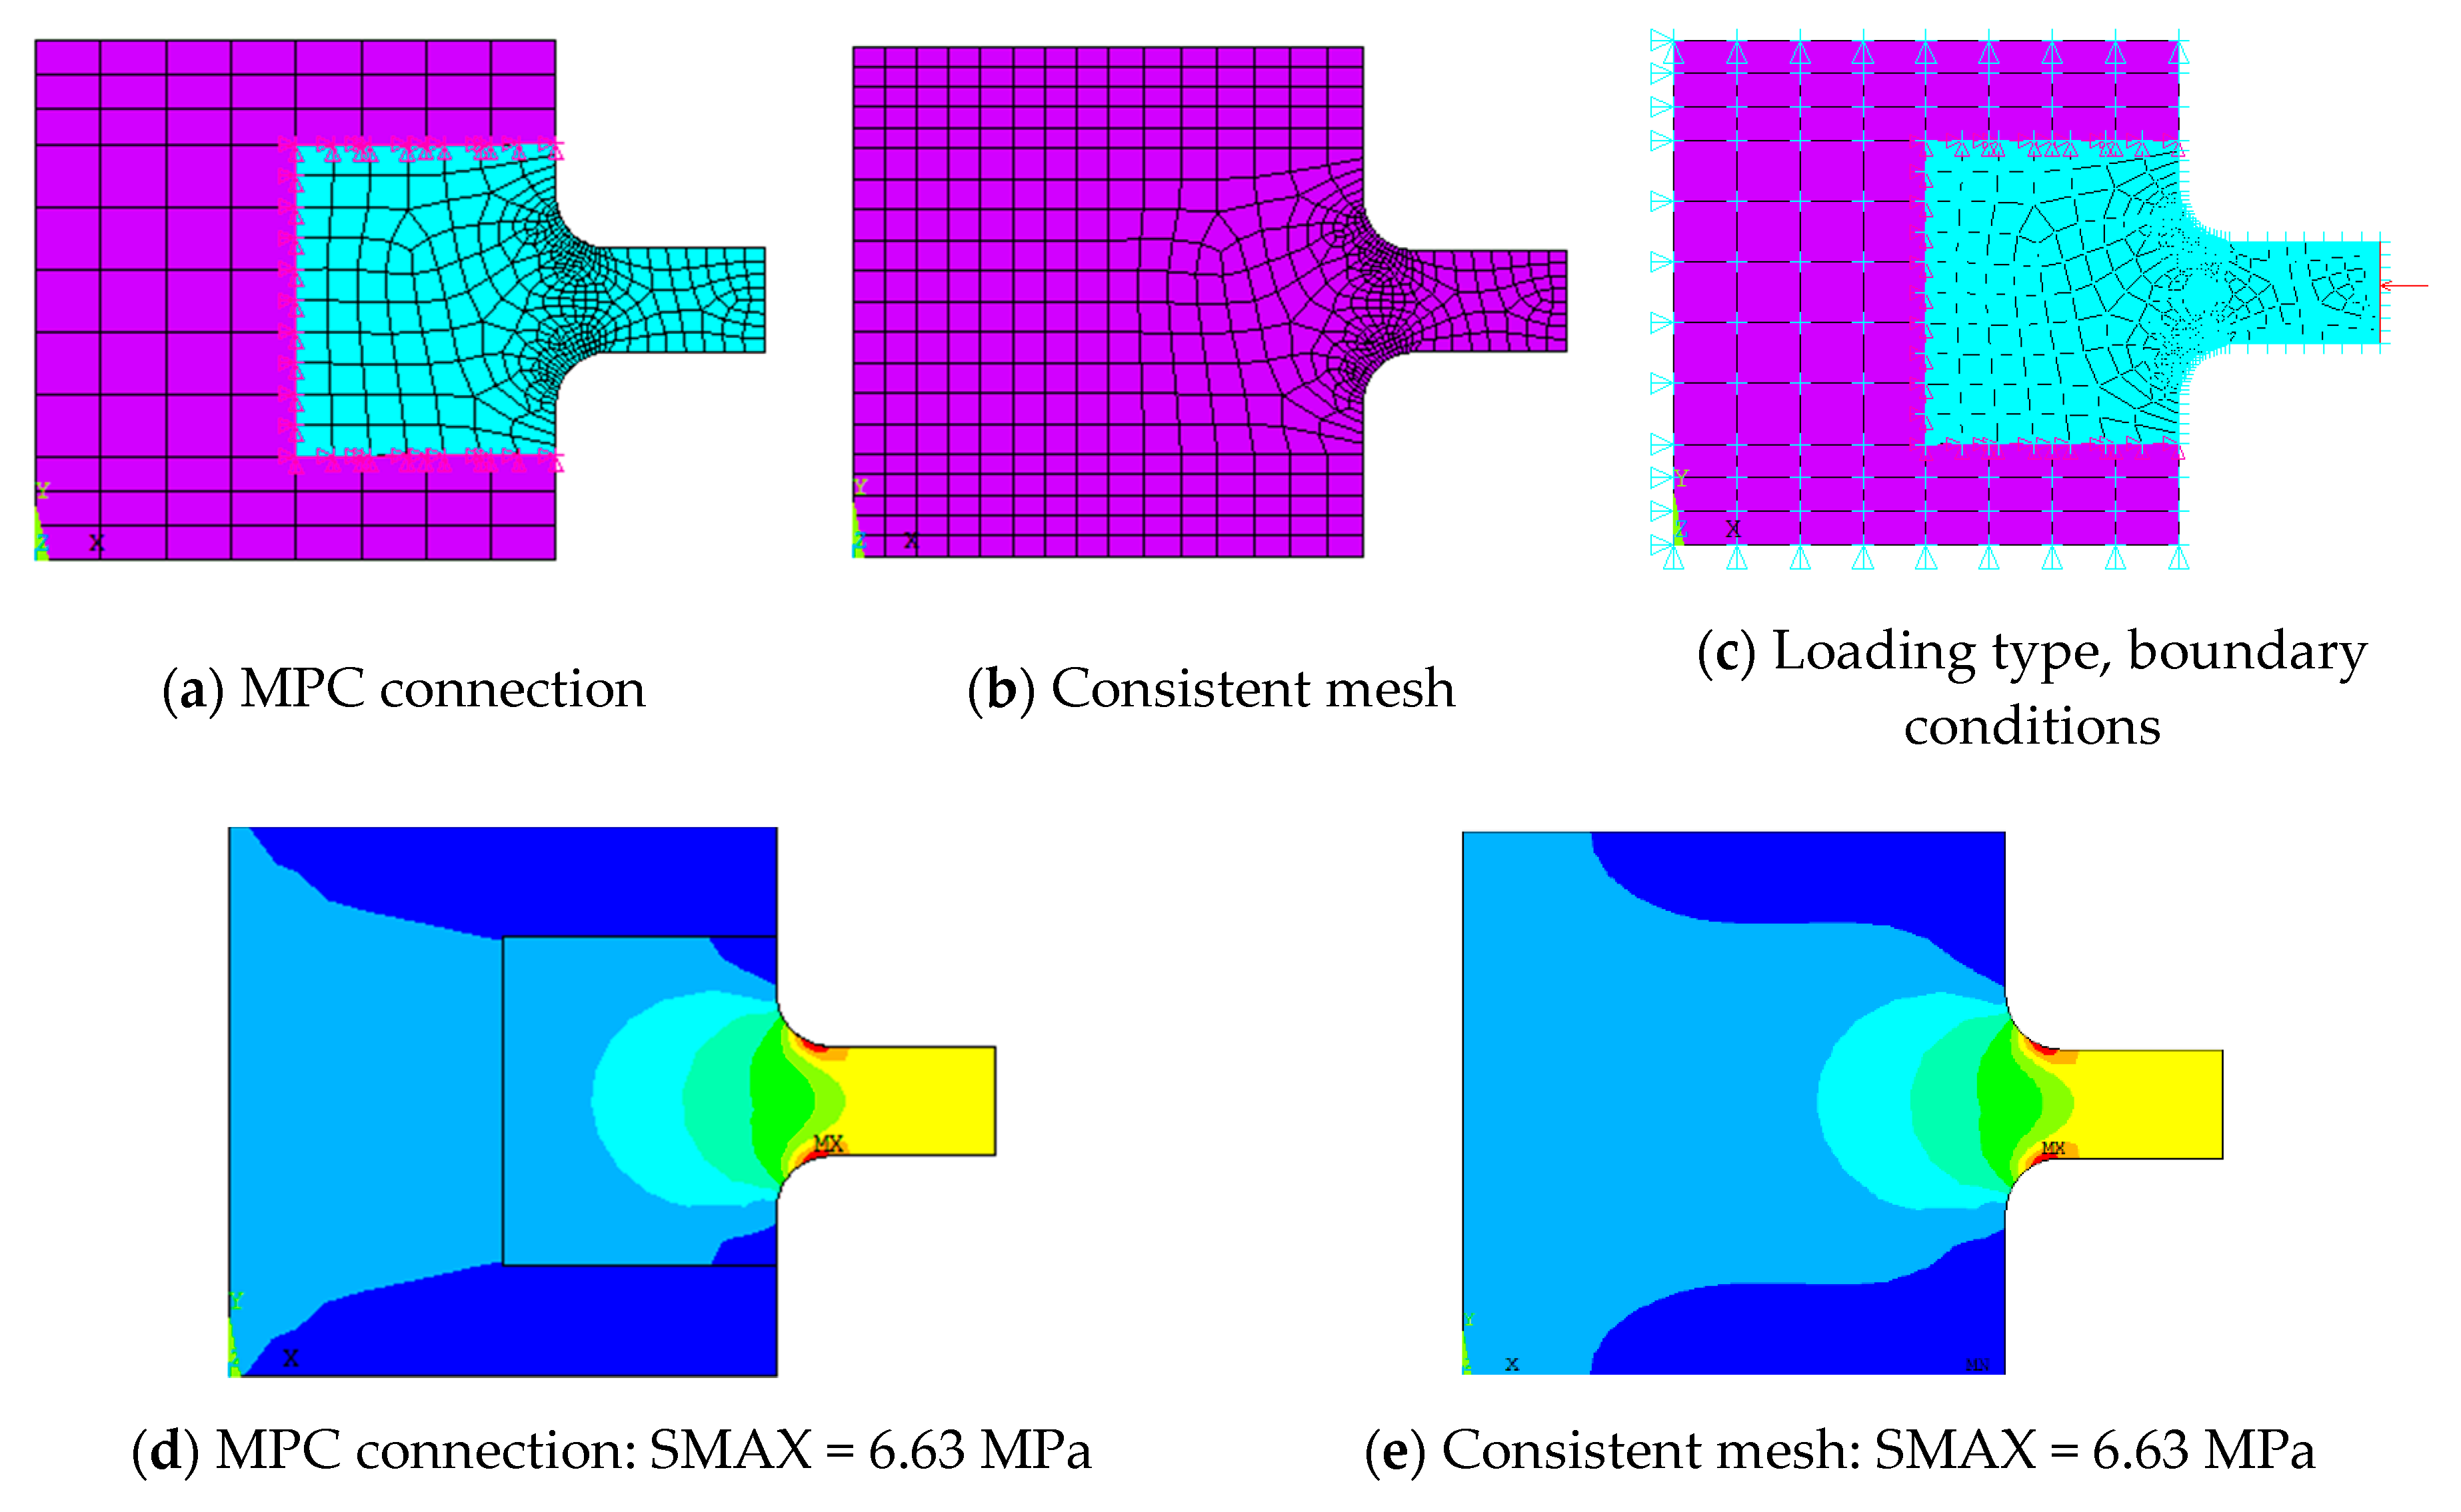
2.2. Multi-Point Constraint (MPC)
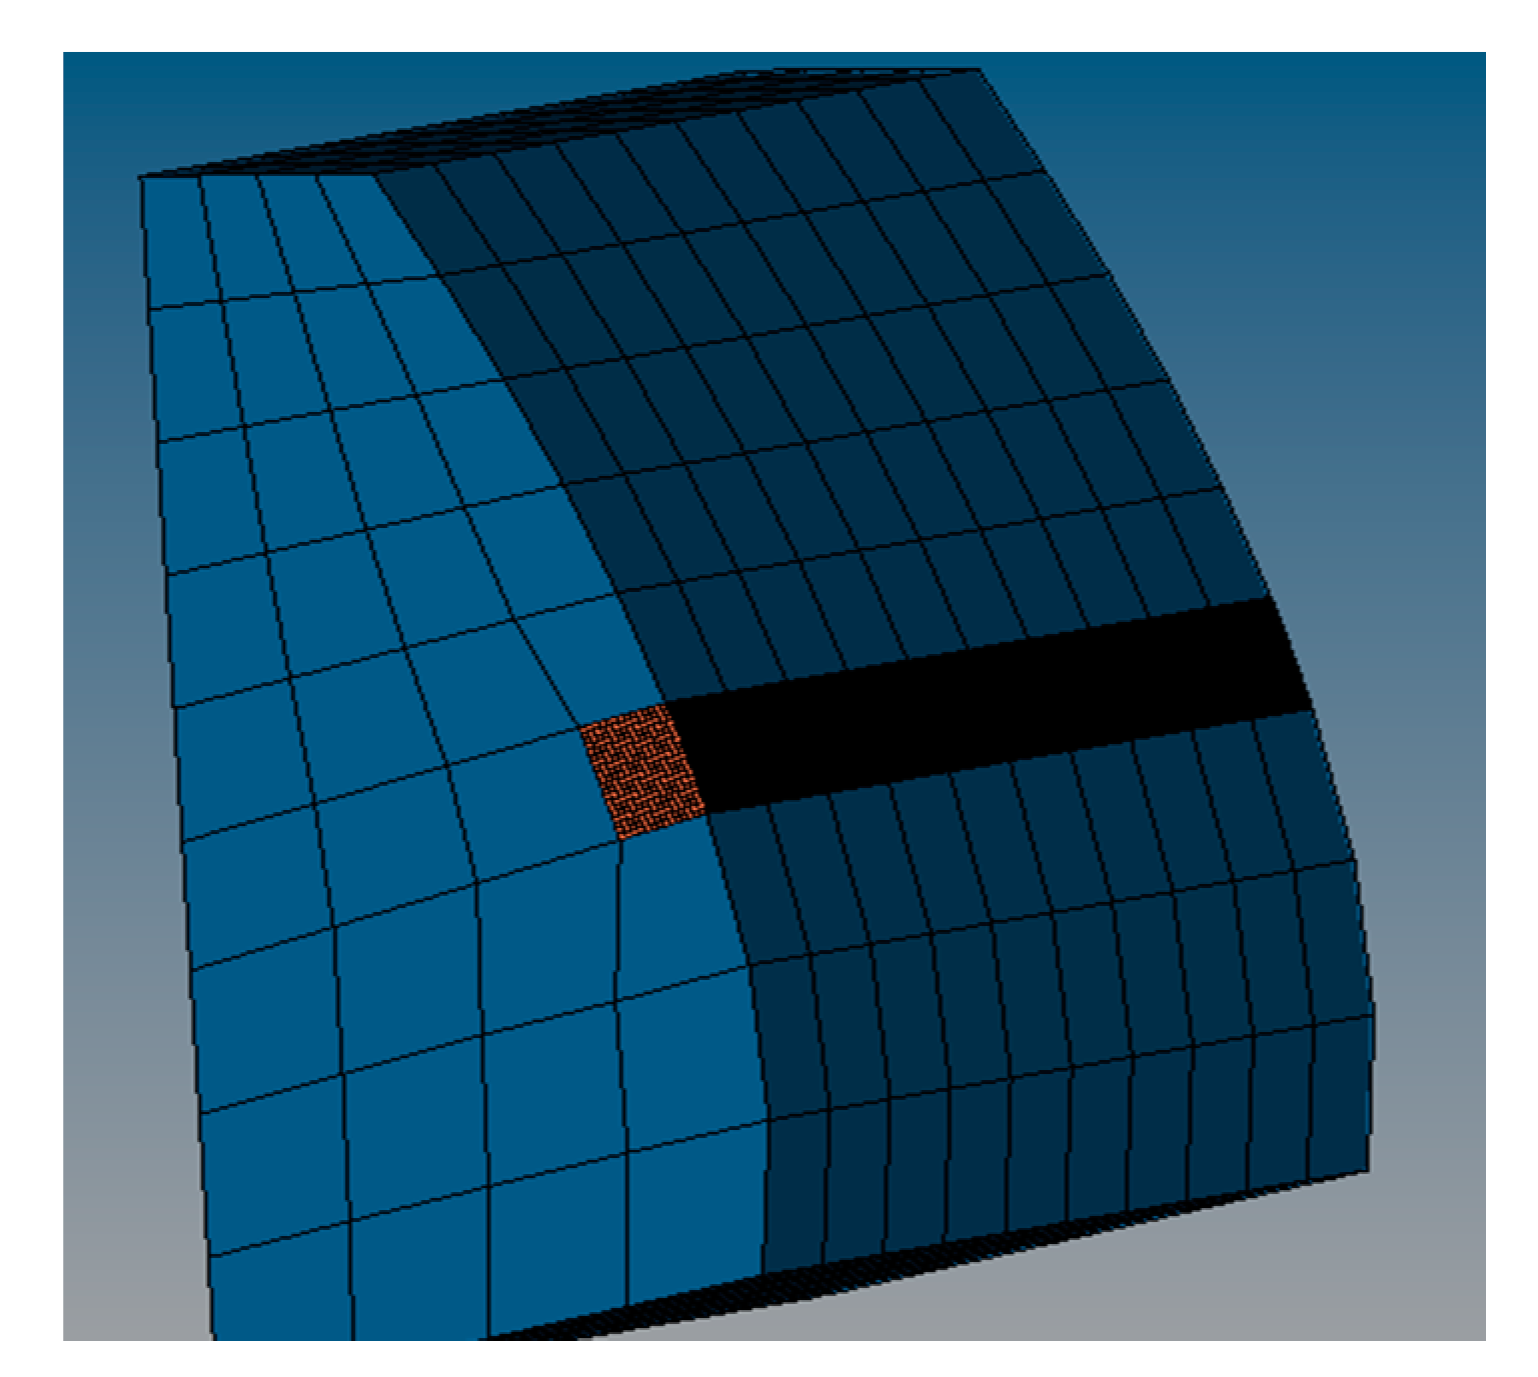
2.3. Determination of Mesh Transition Boundary Position
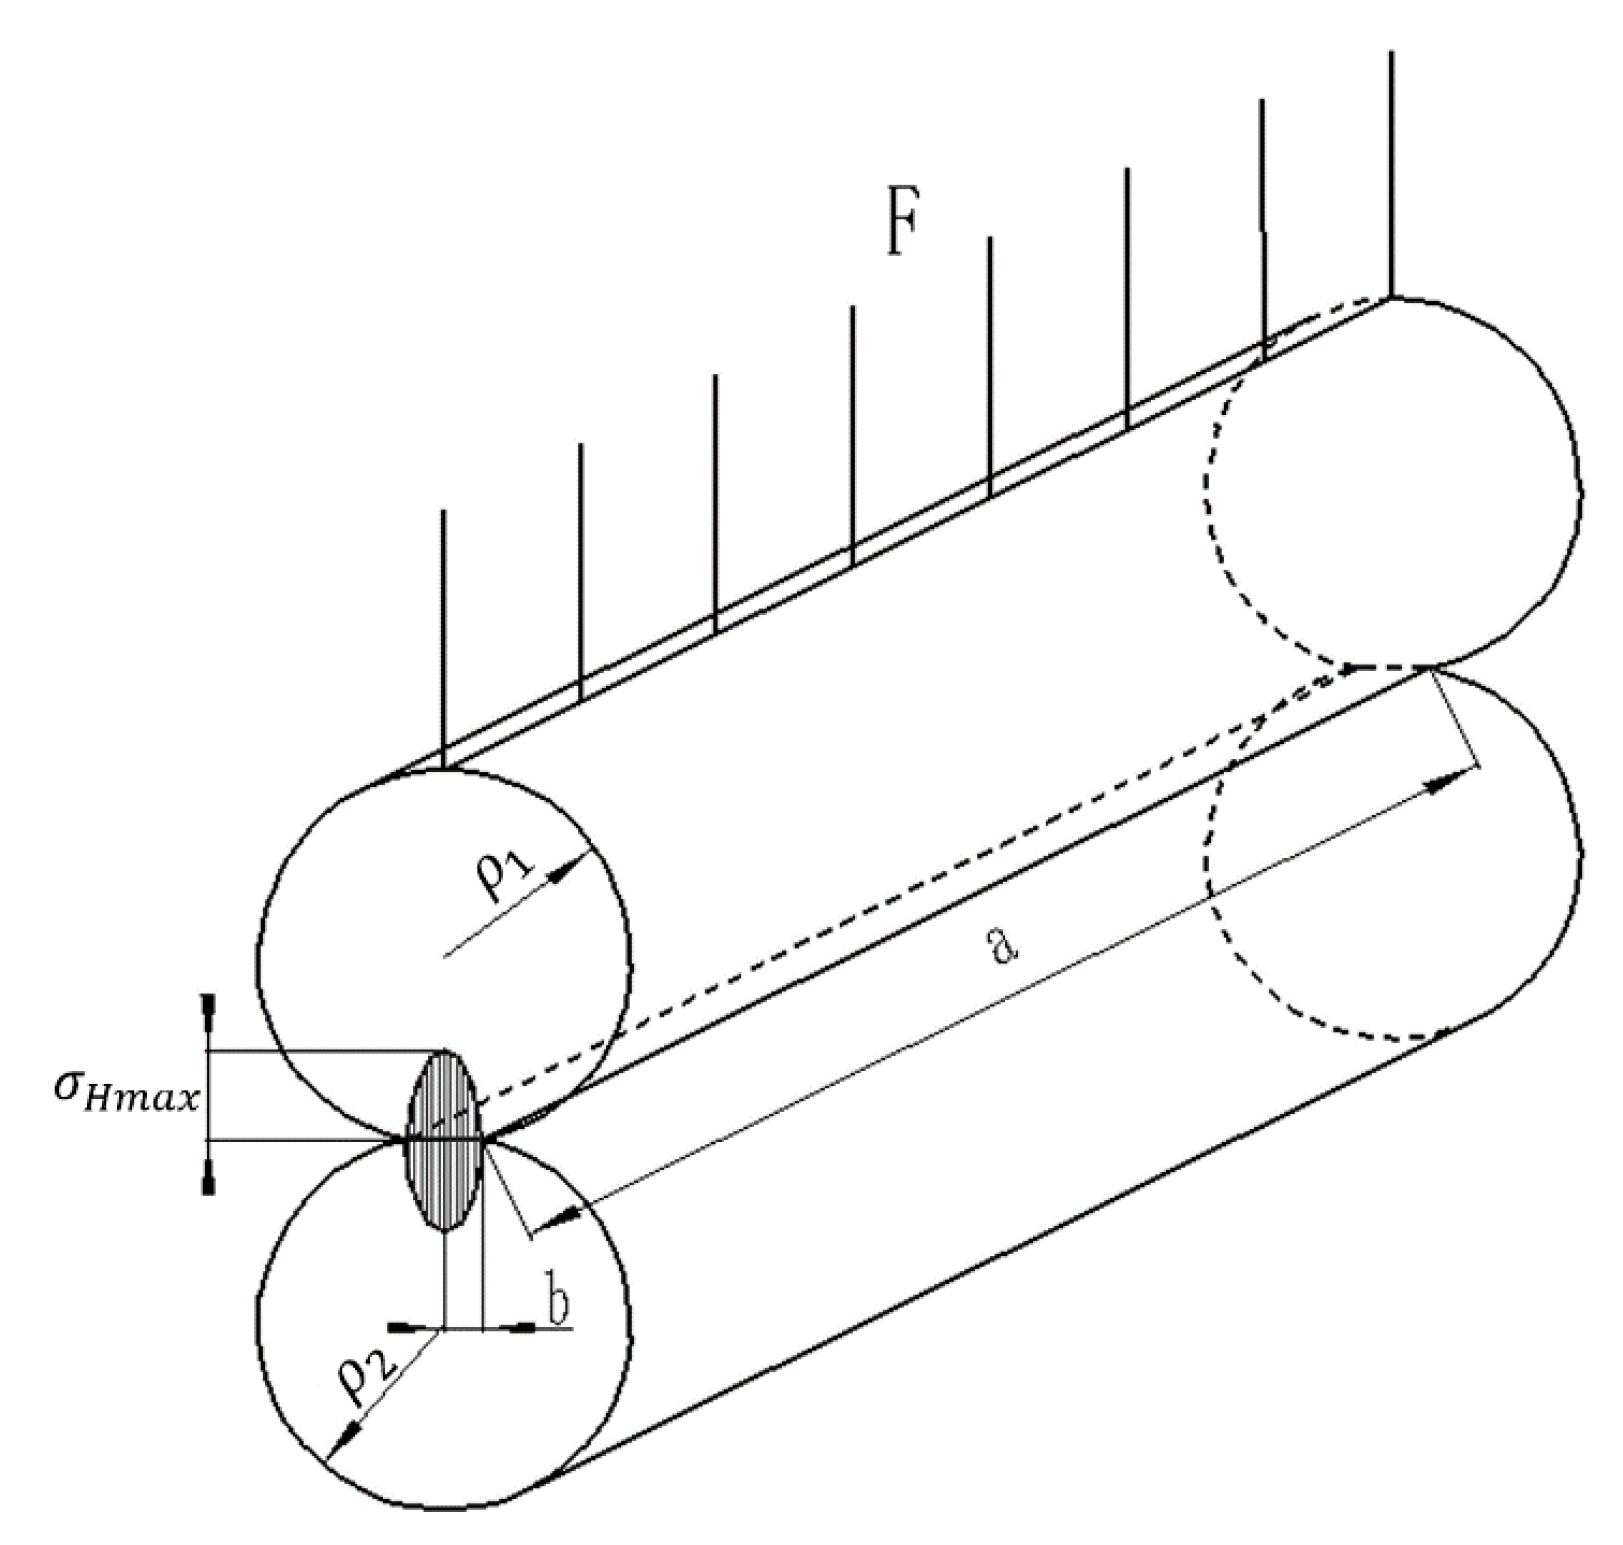
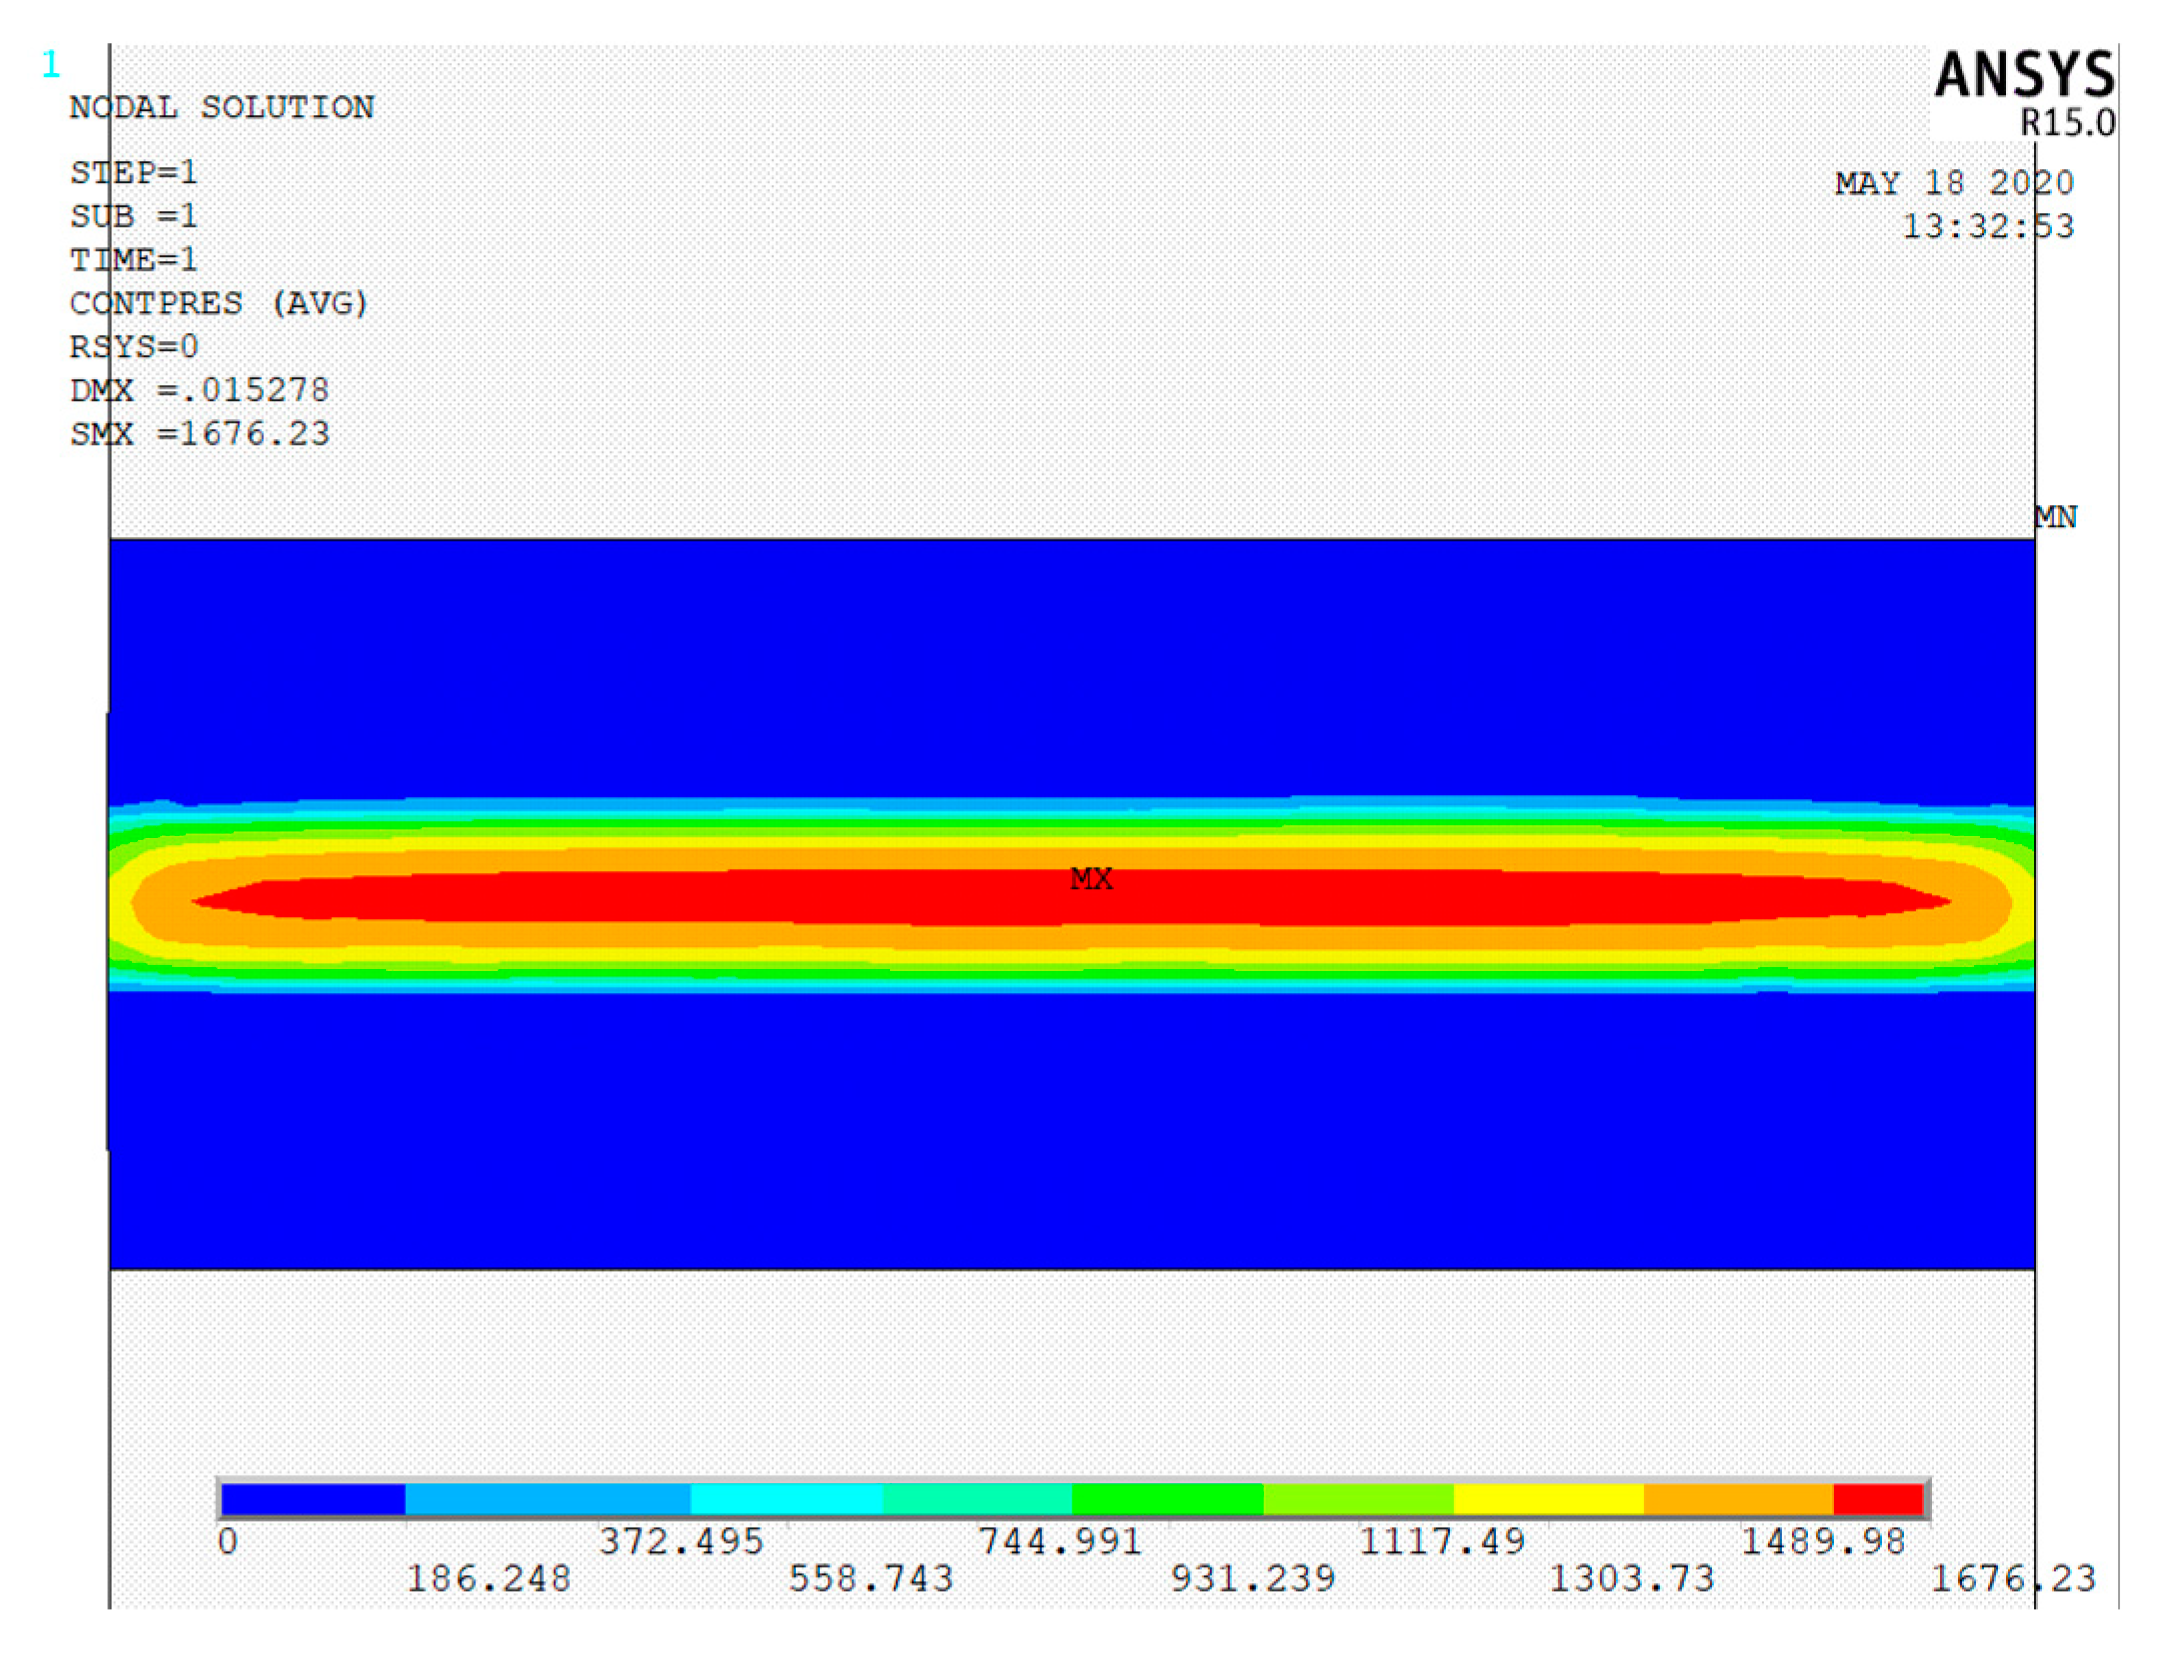
2.3.1. Hertz Contact Theory
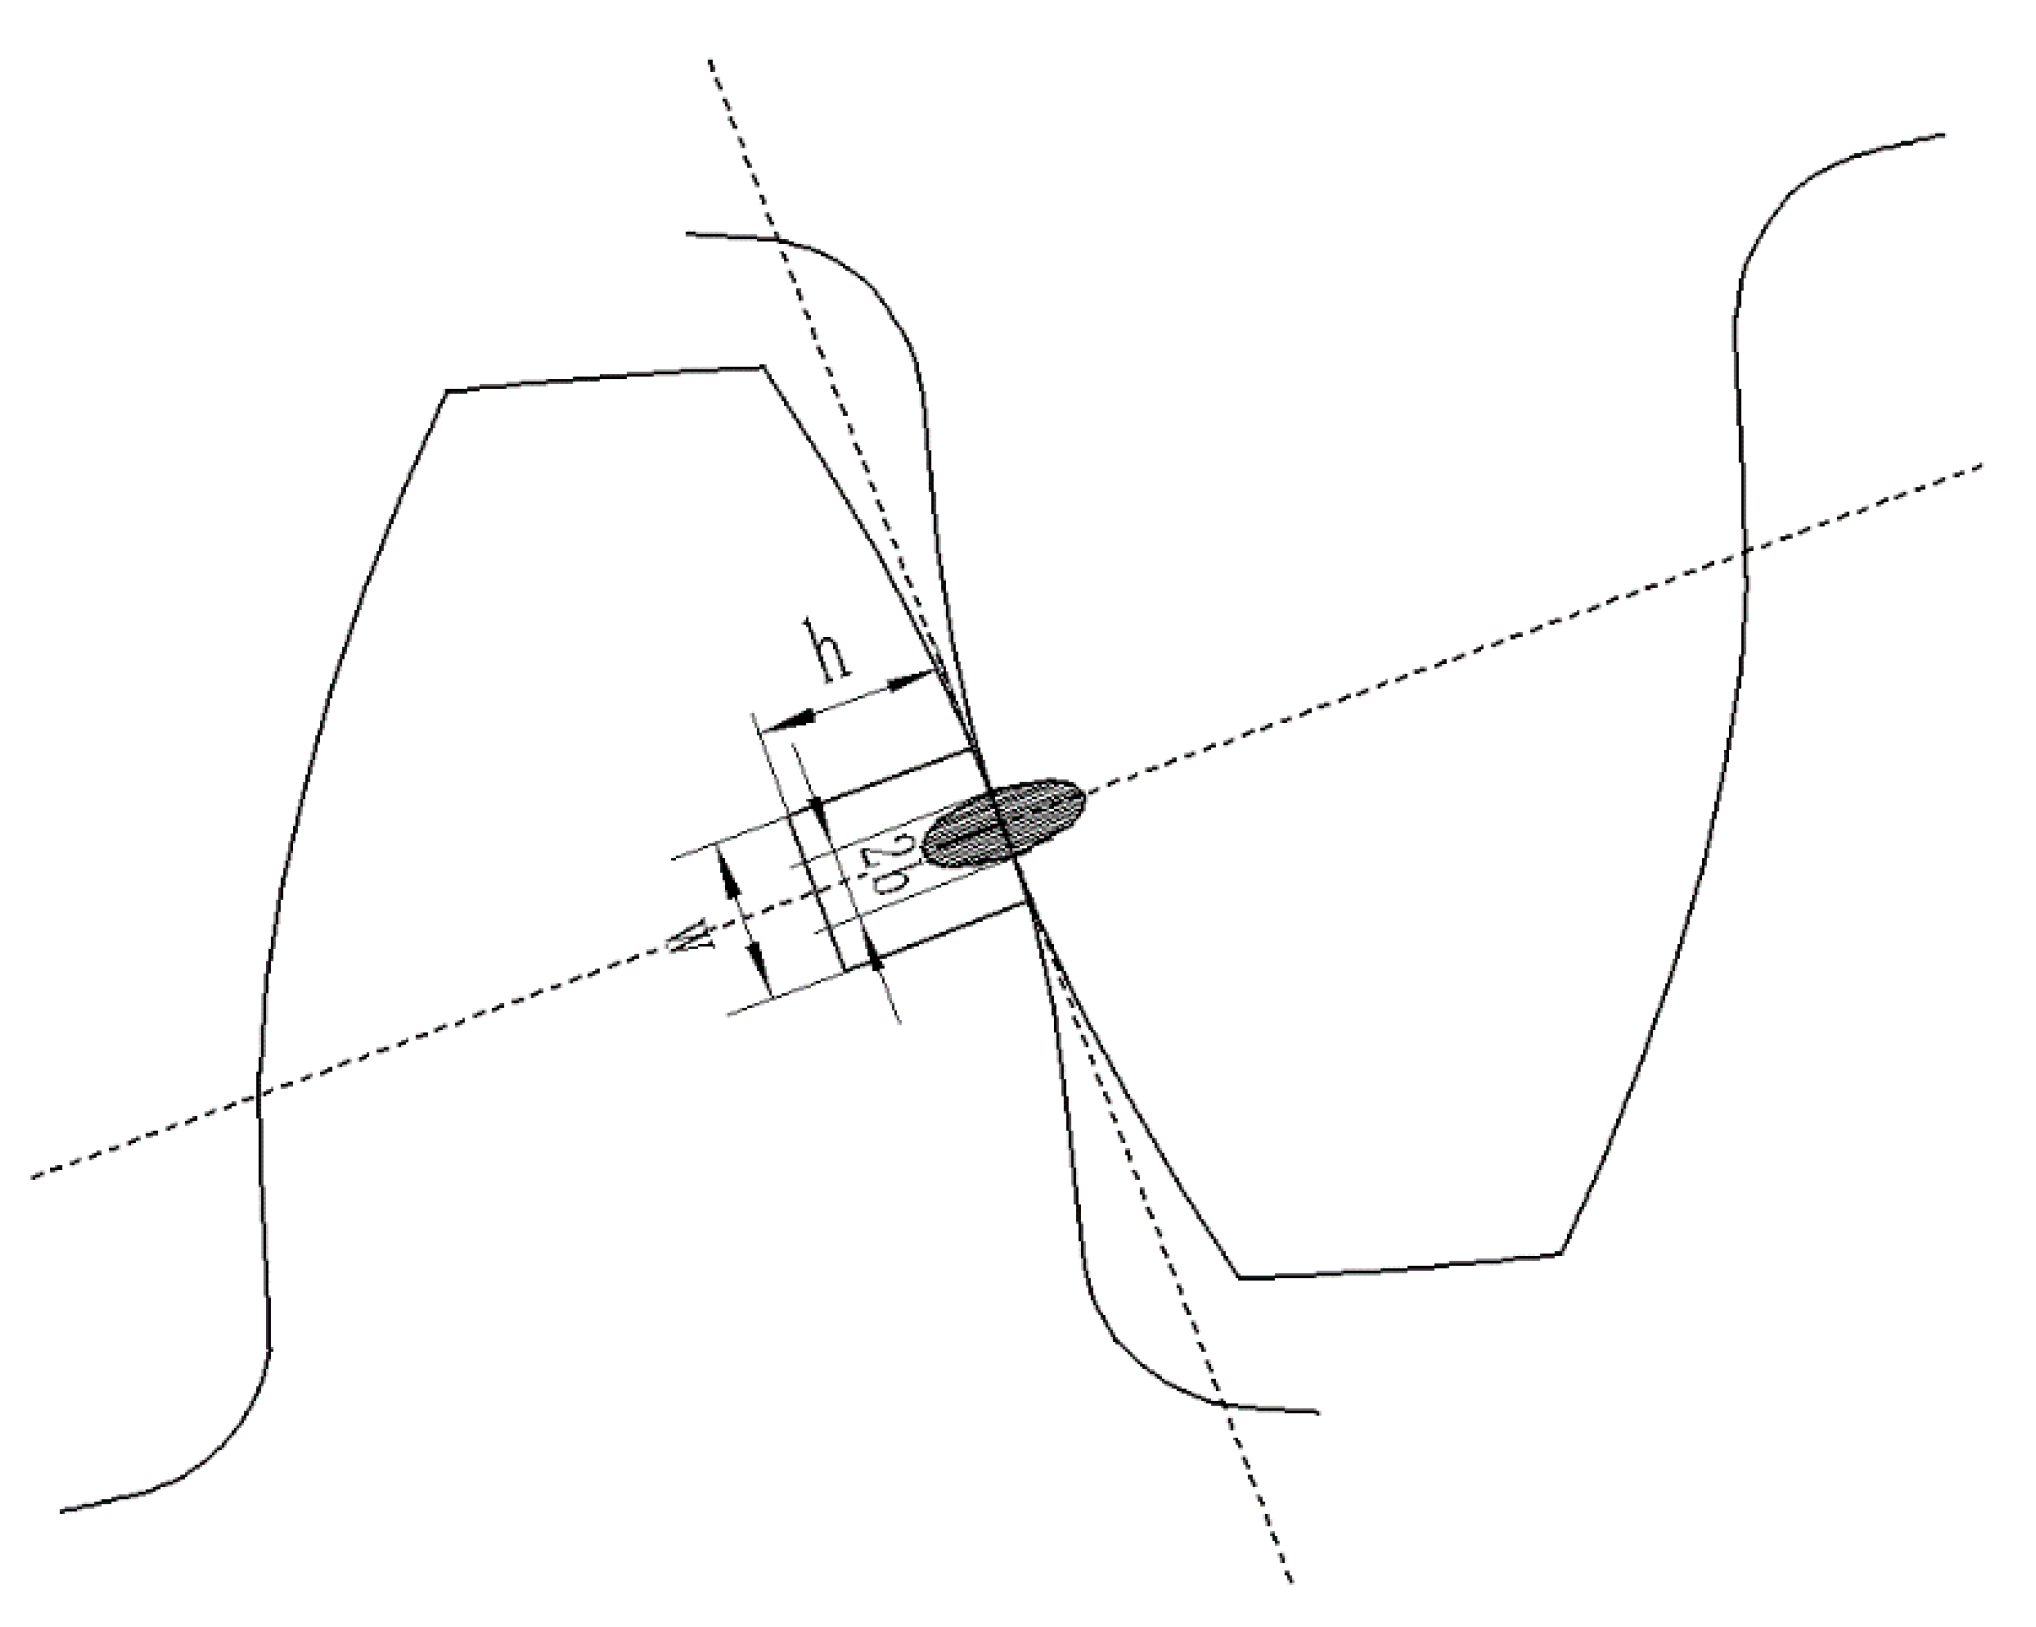
2.3.2. Determination of Mesh Transition Boundary Position
3. TSCS Analysis of Gear with TPD, ME or LCM
3.1. TSCS Analysis of Gear with TPD
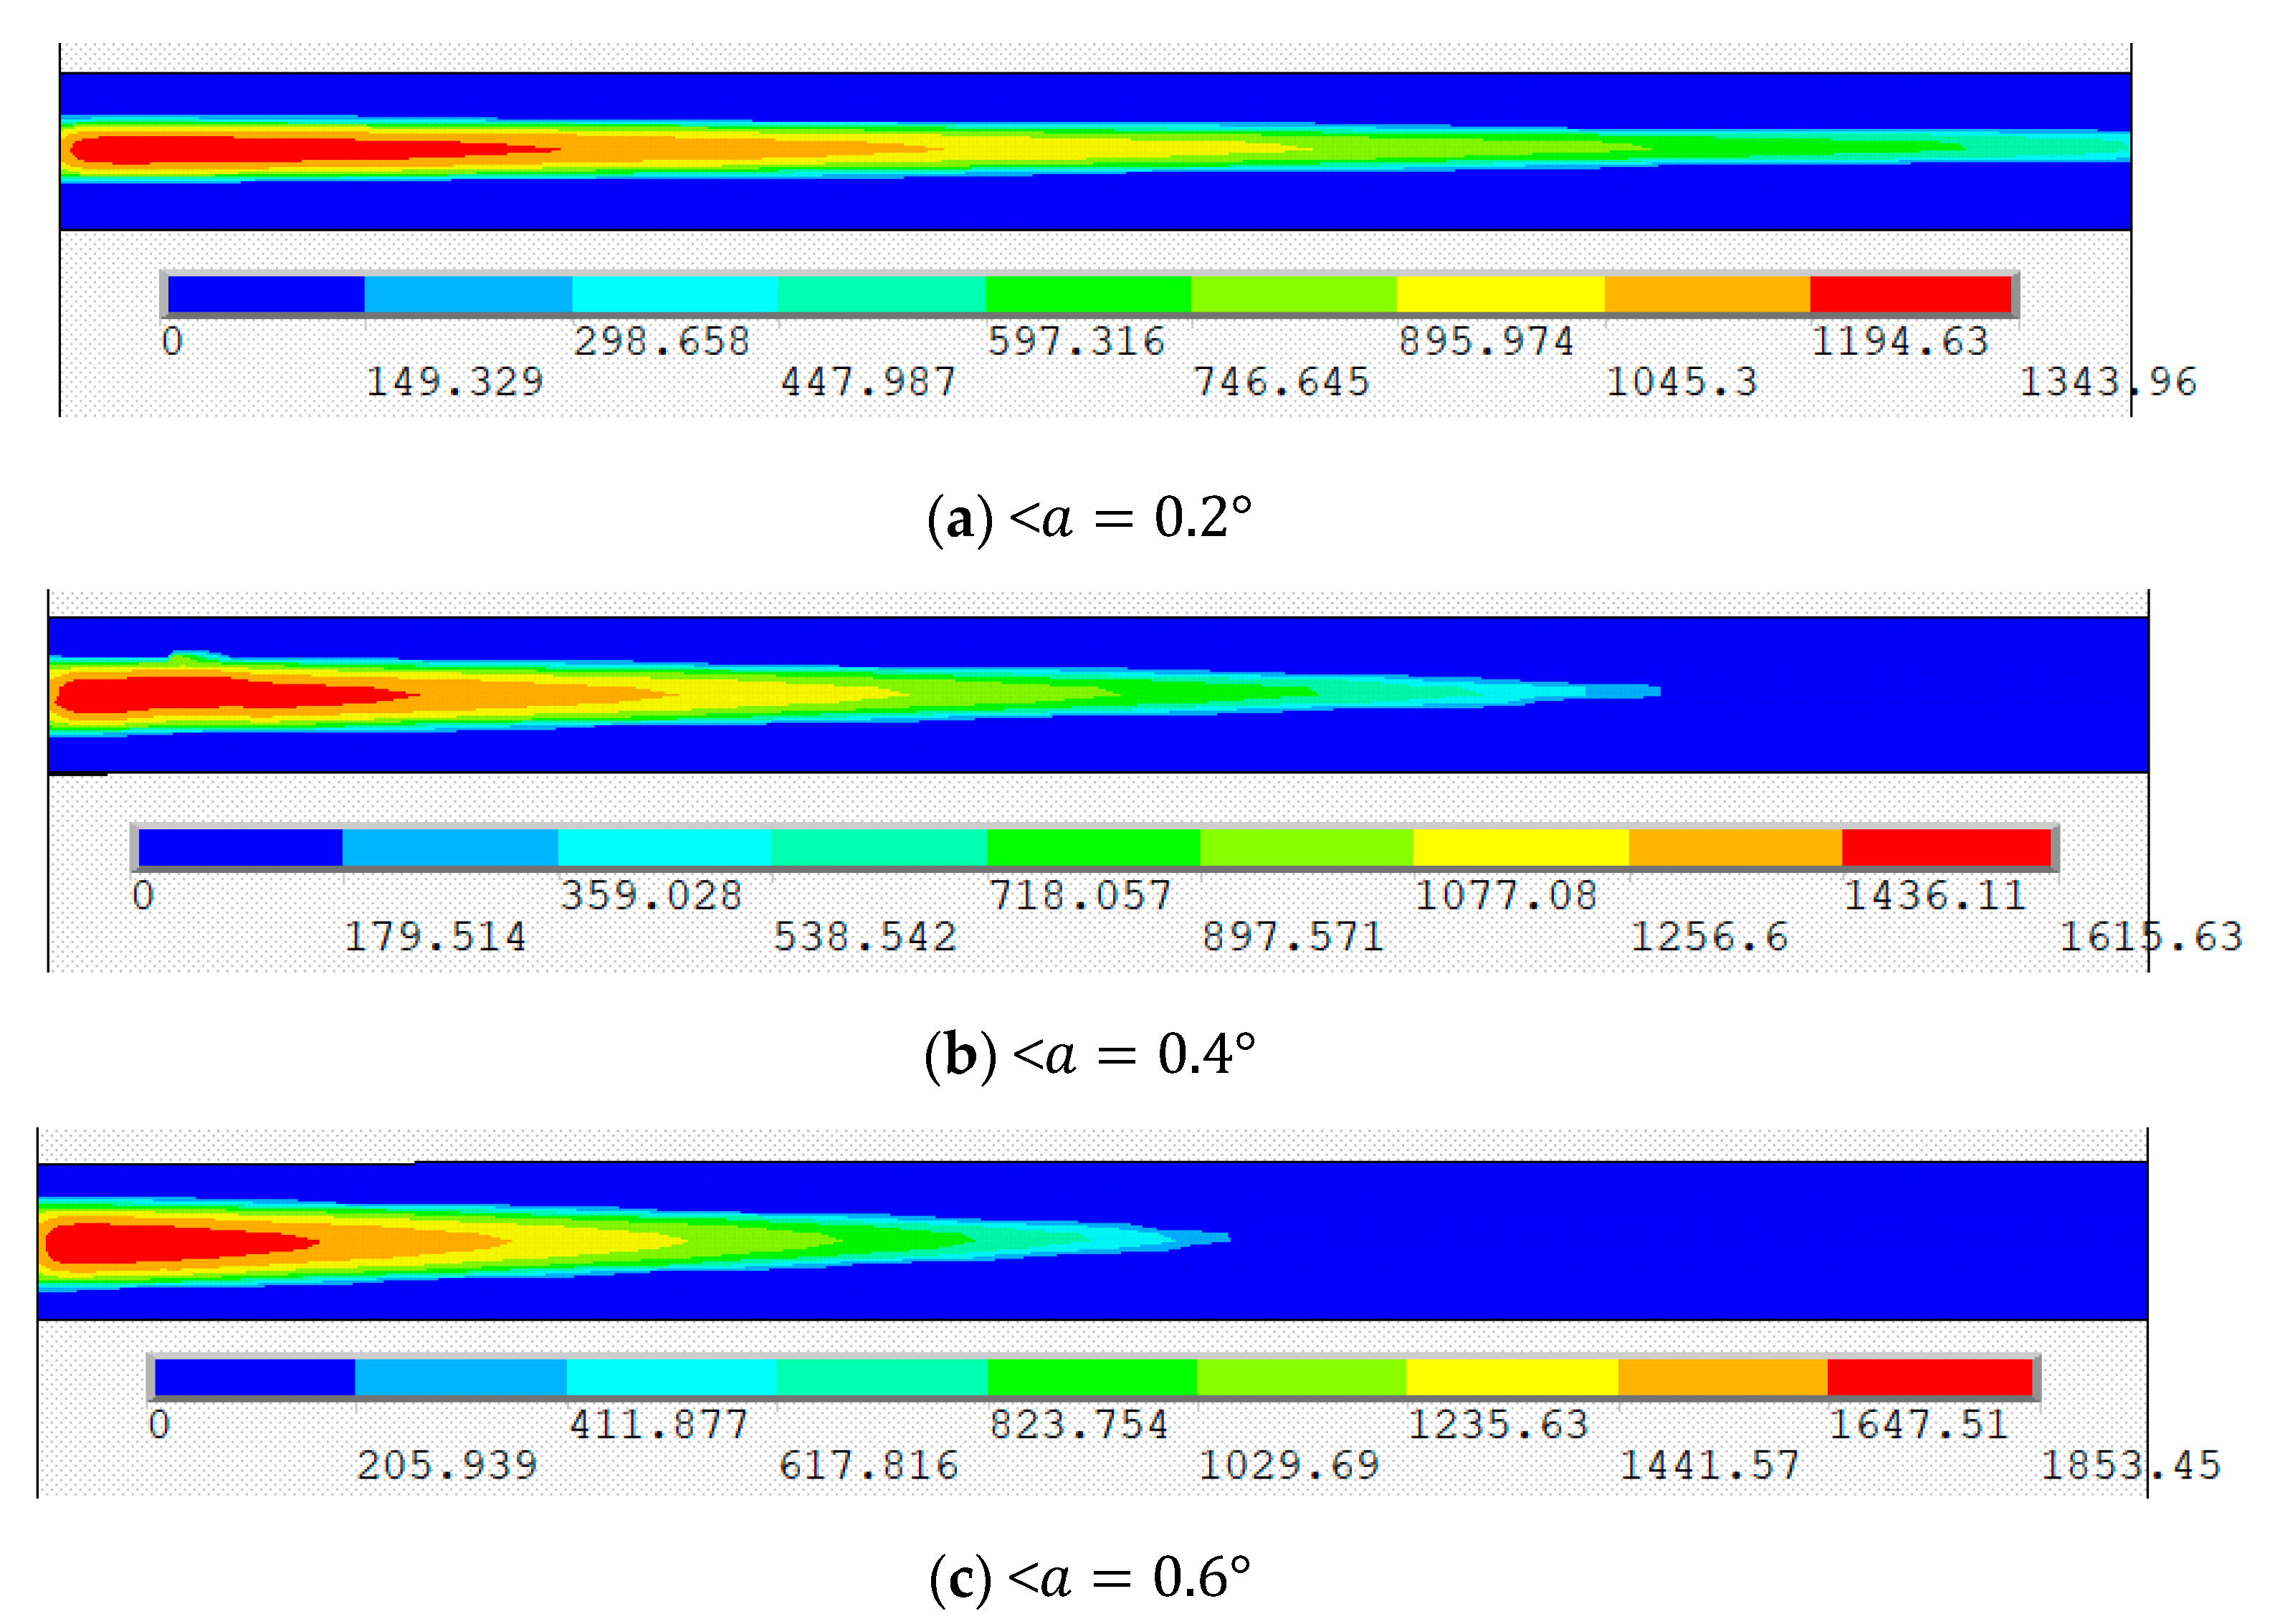
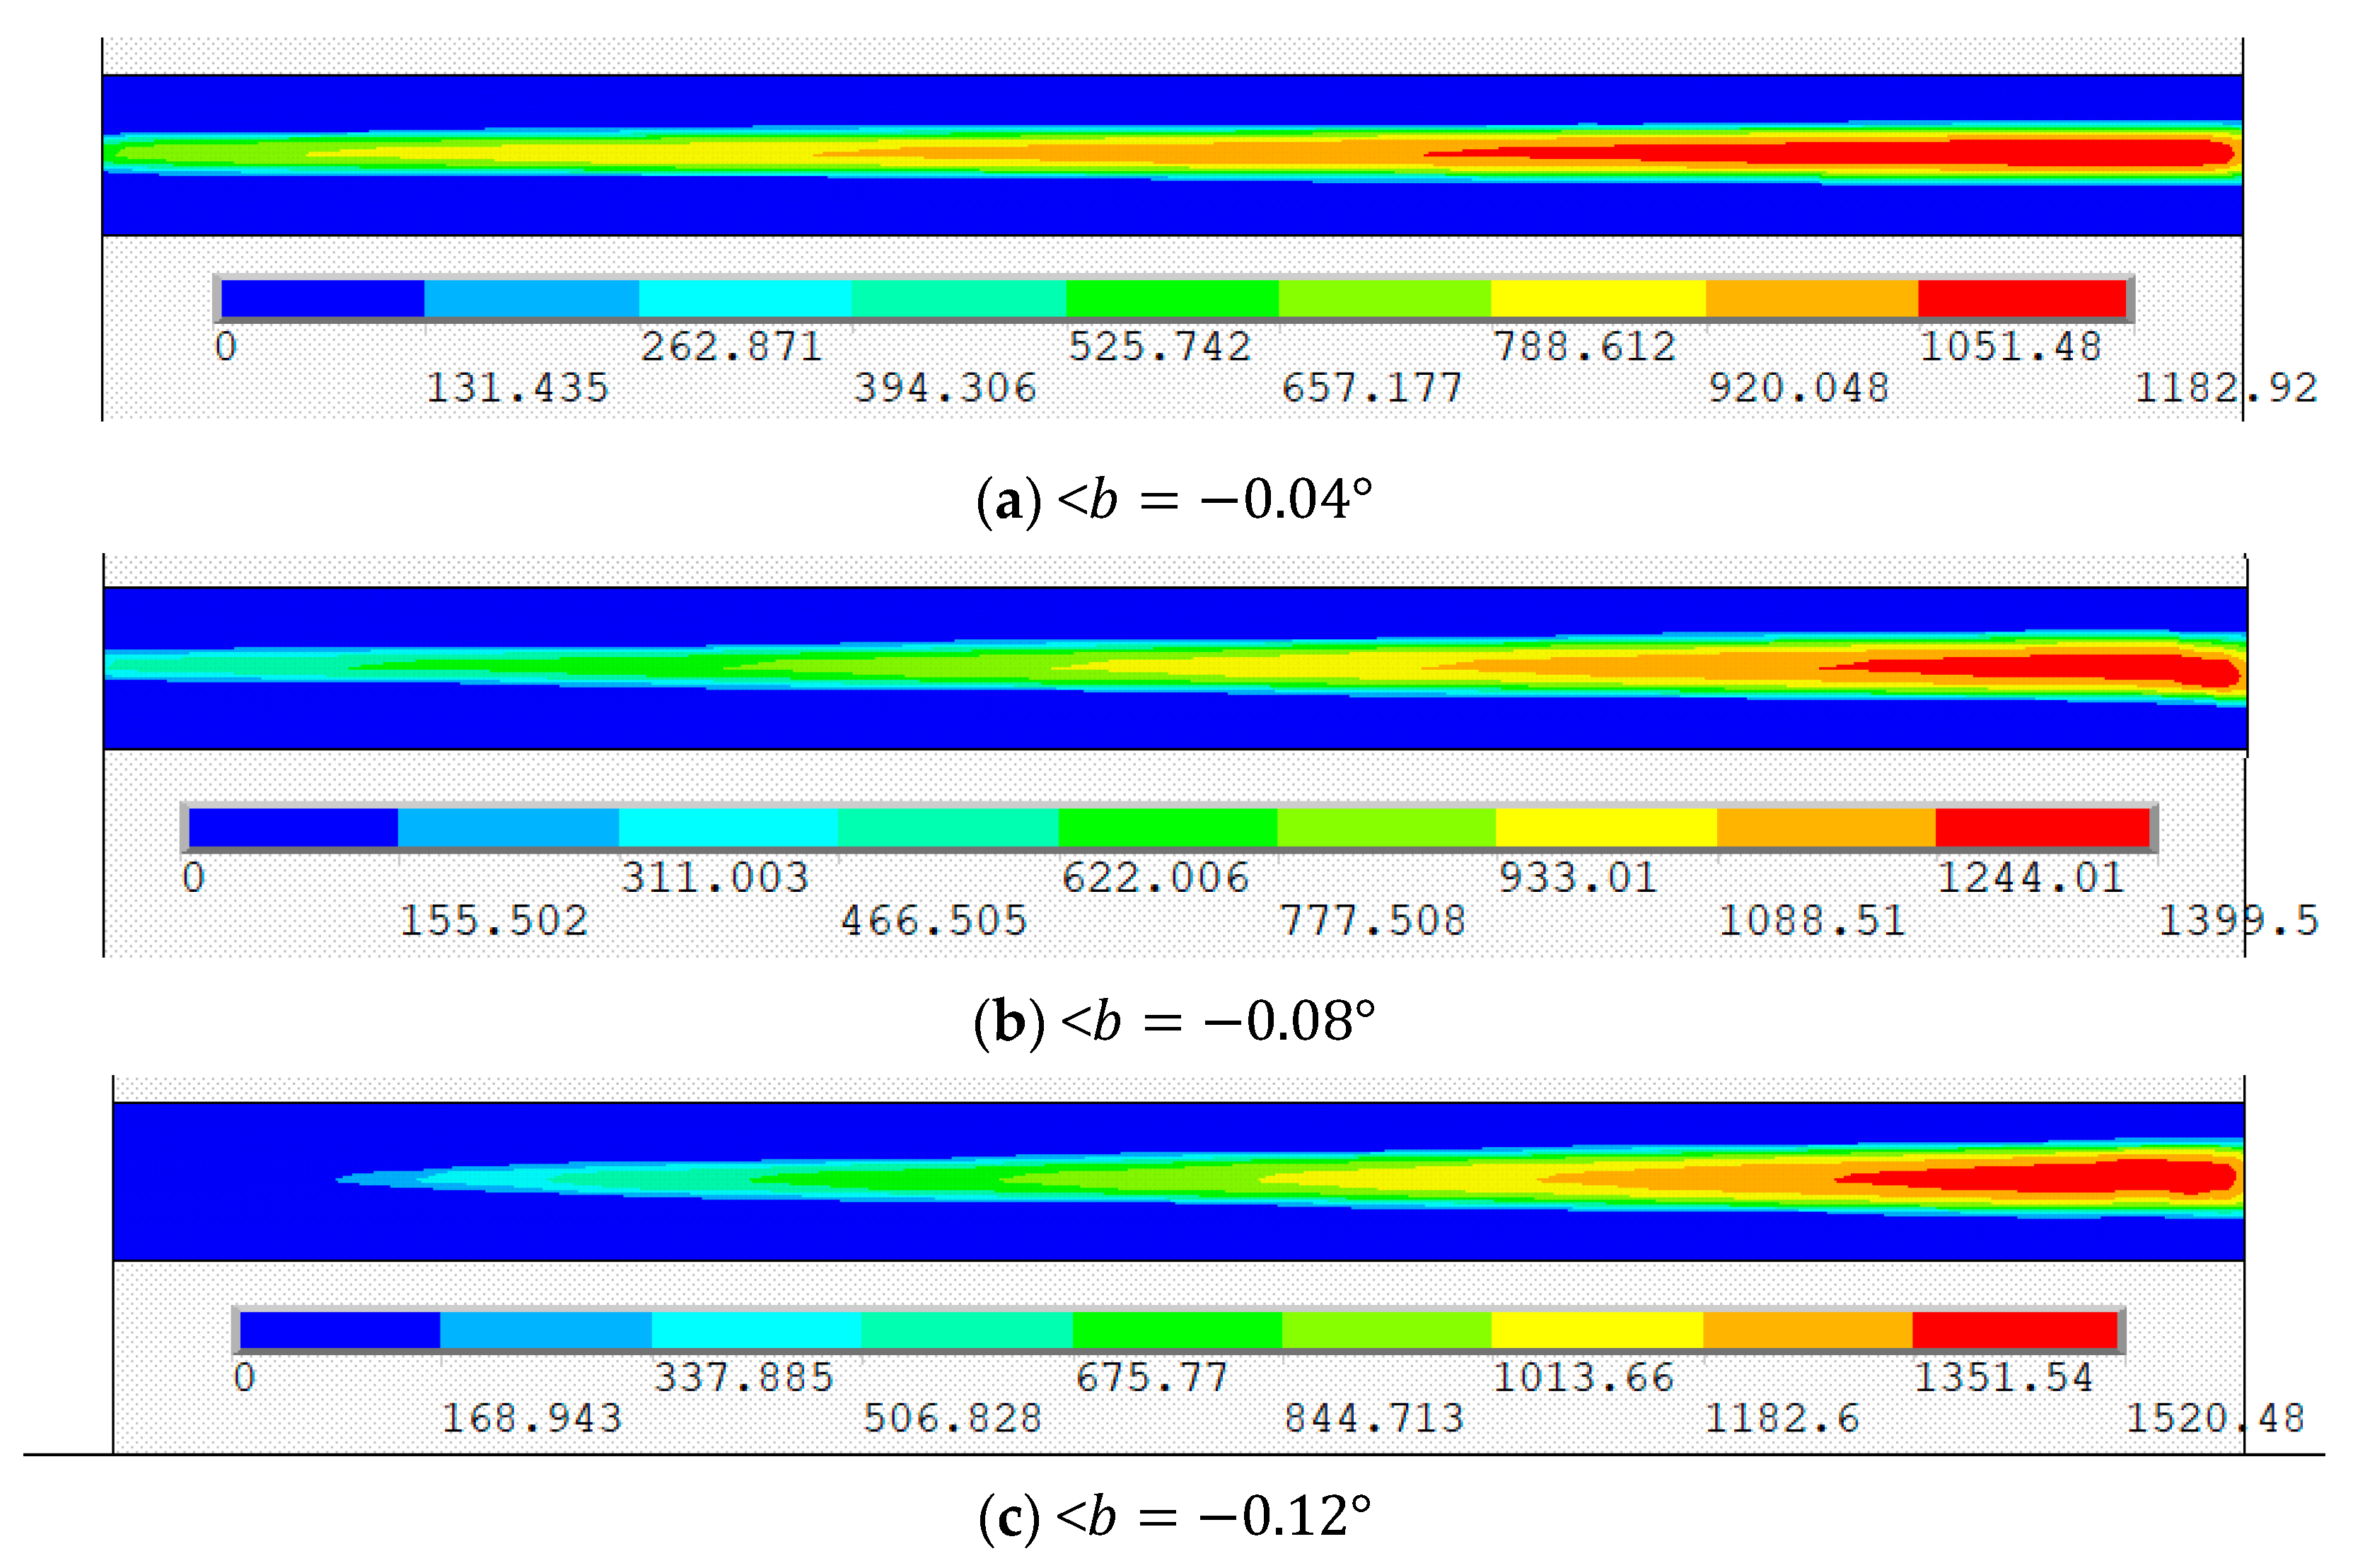
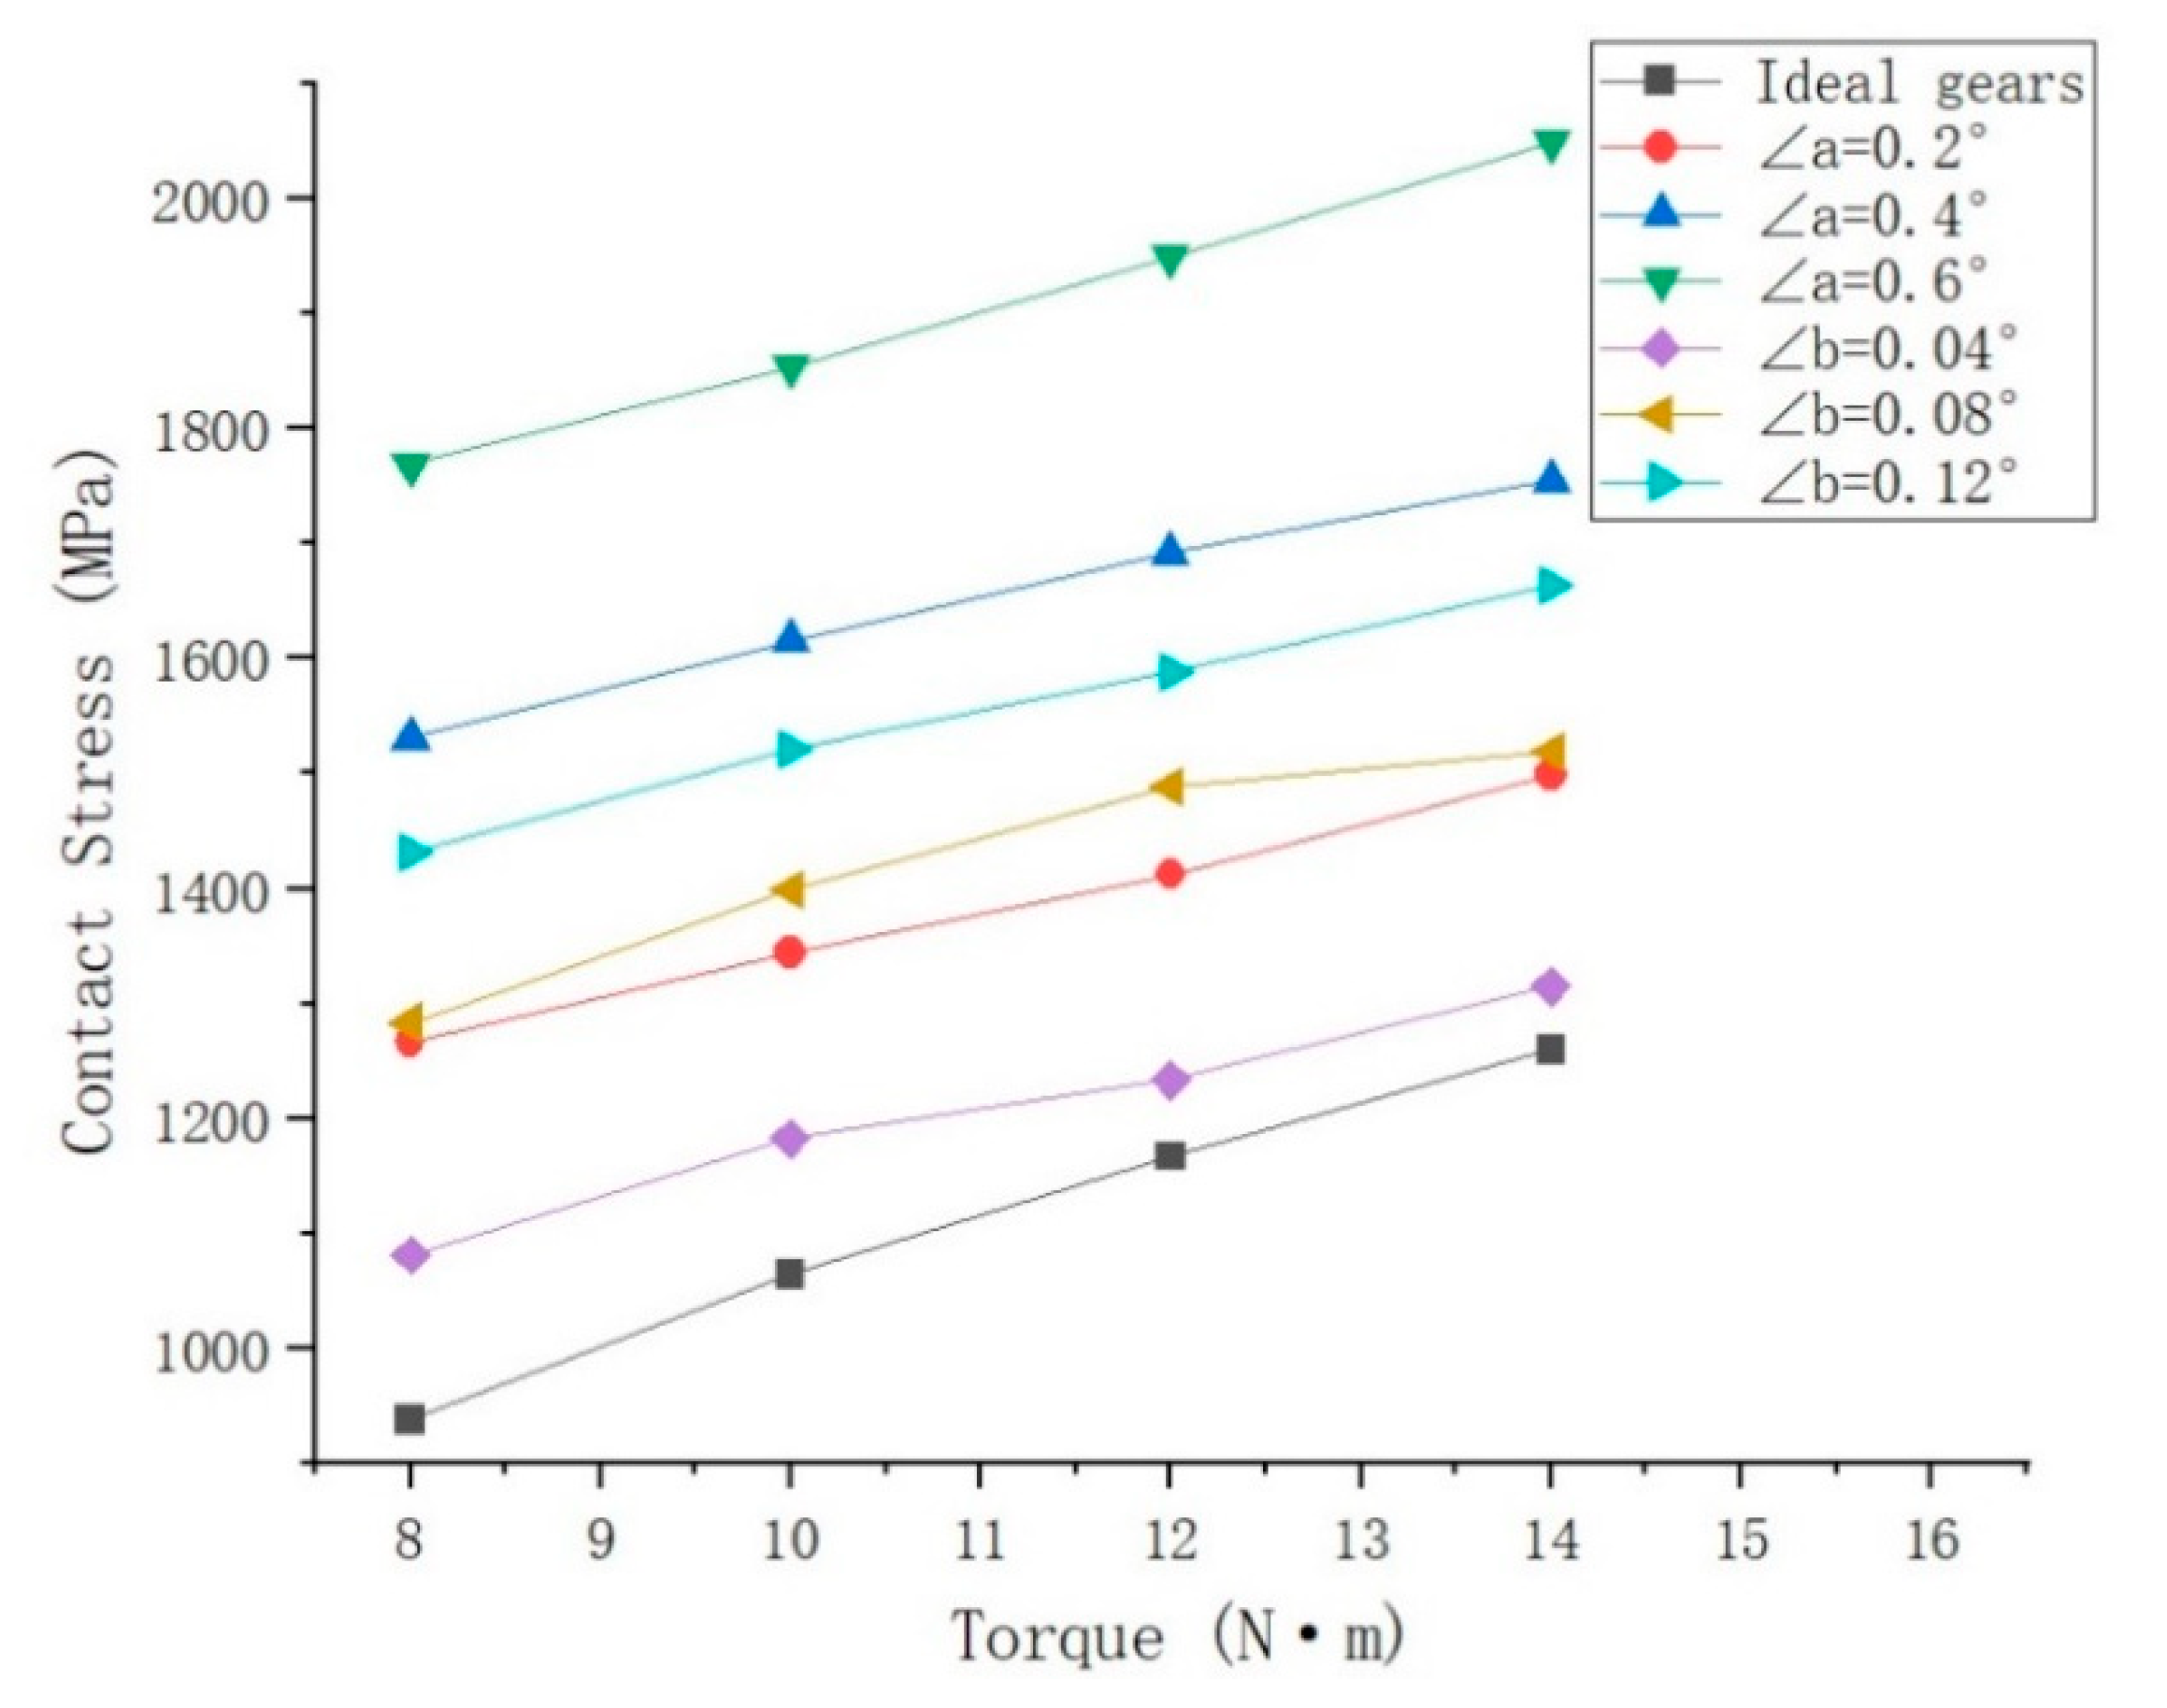
3.2. TSCS Analysis of Gear with ME
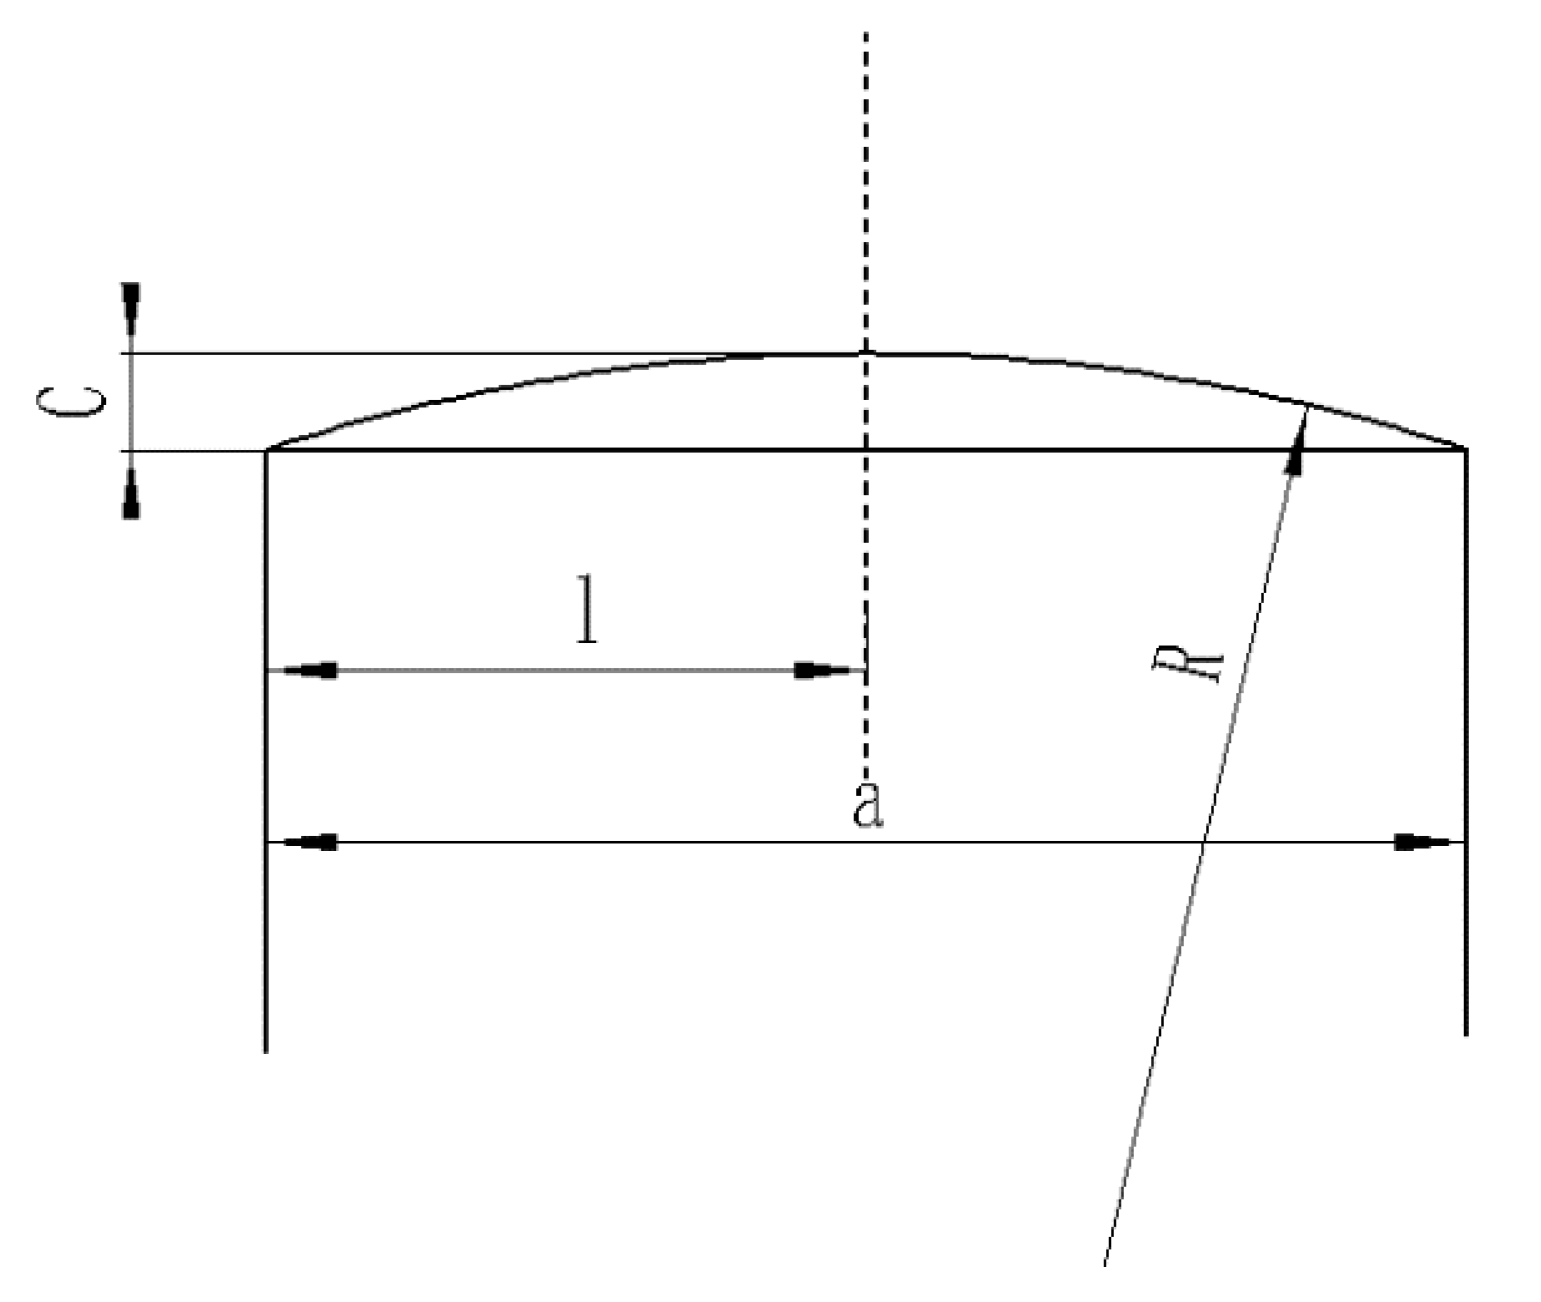
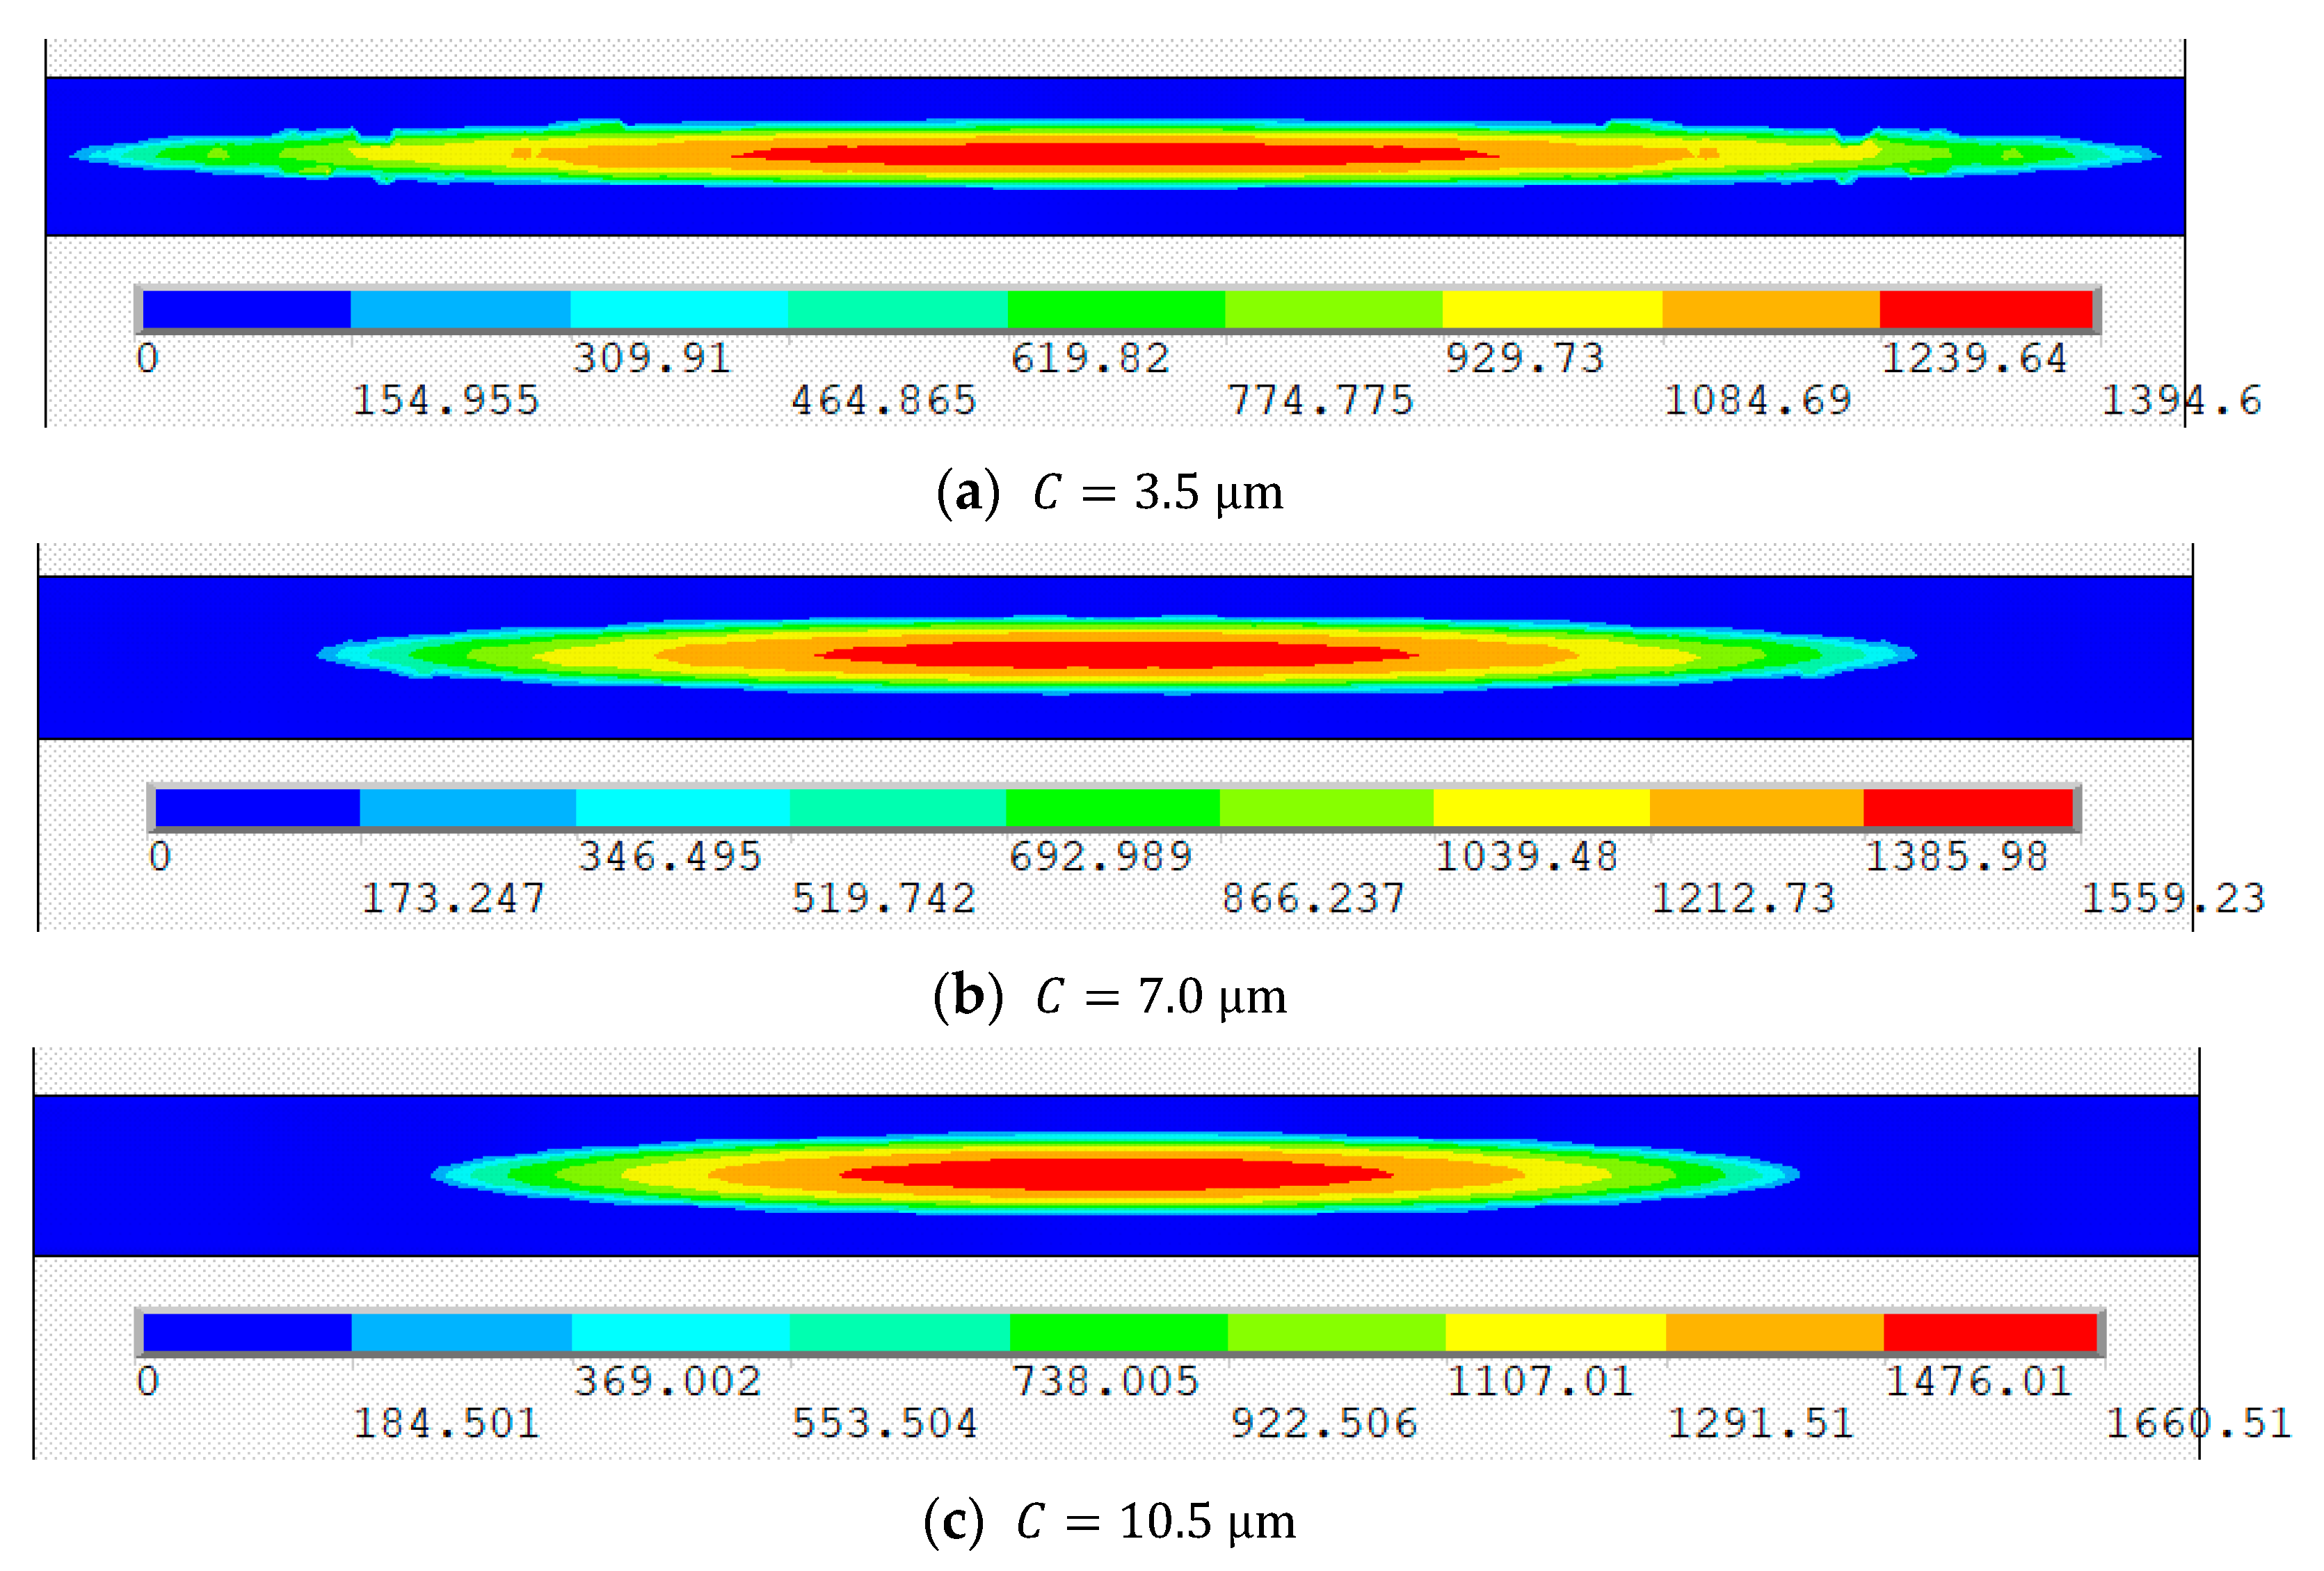
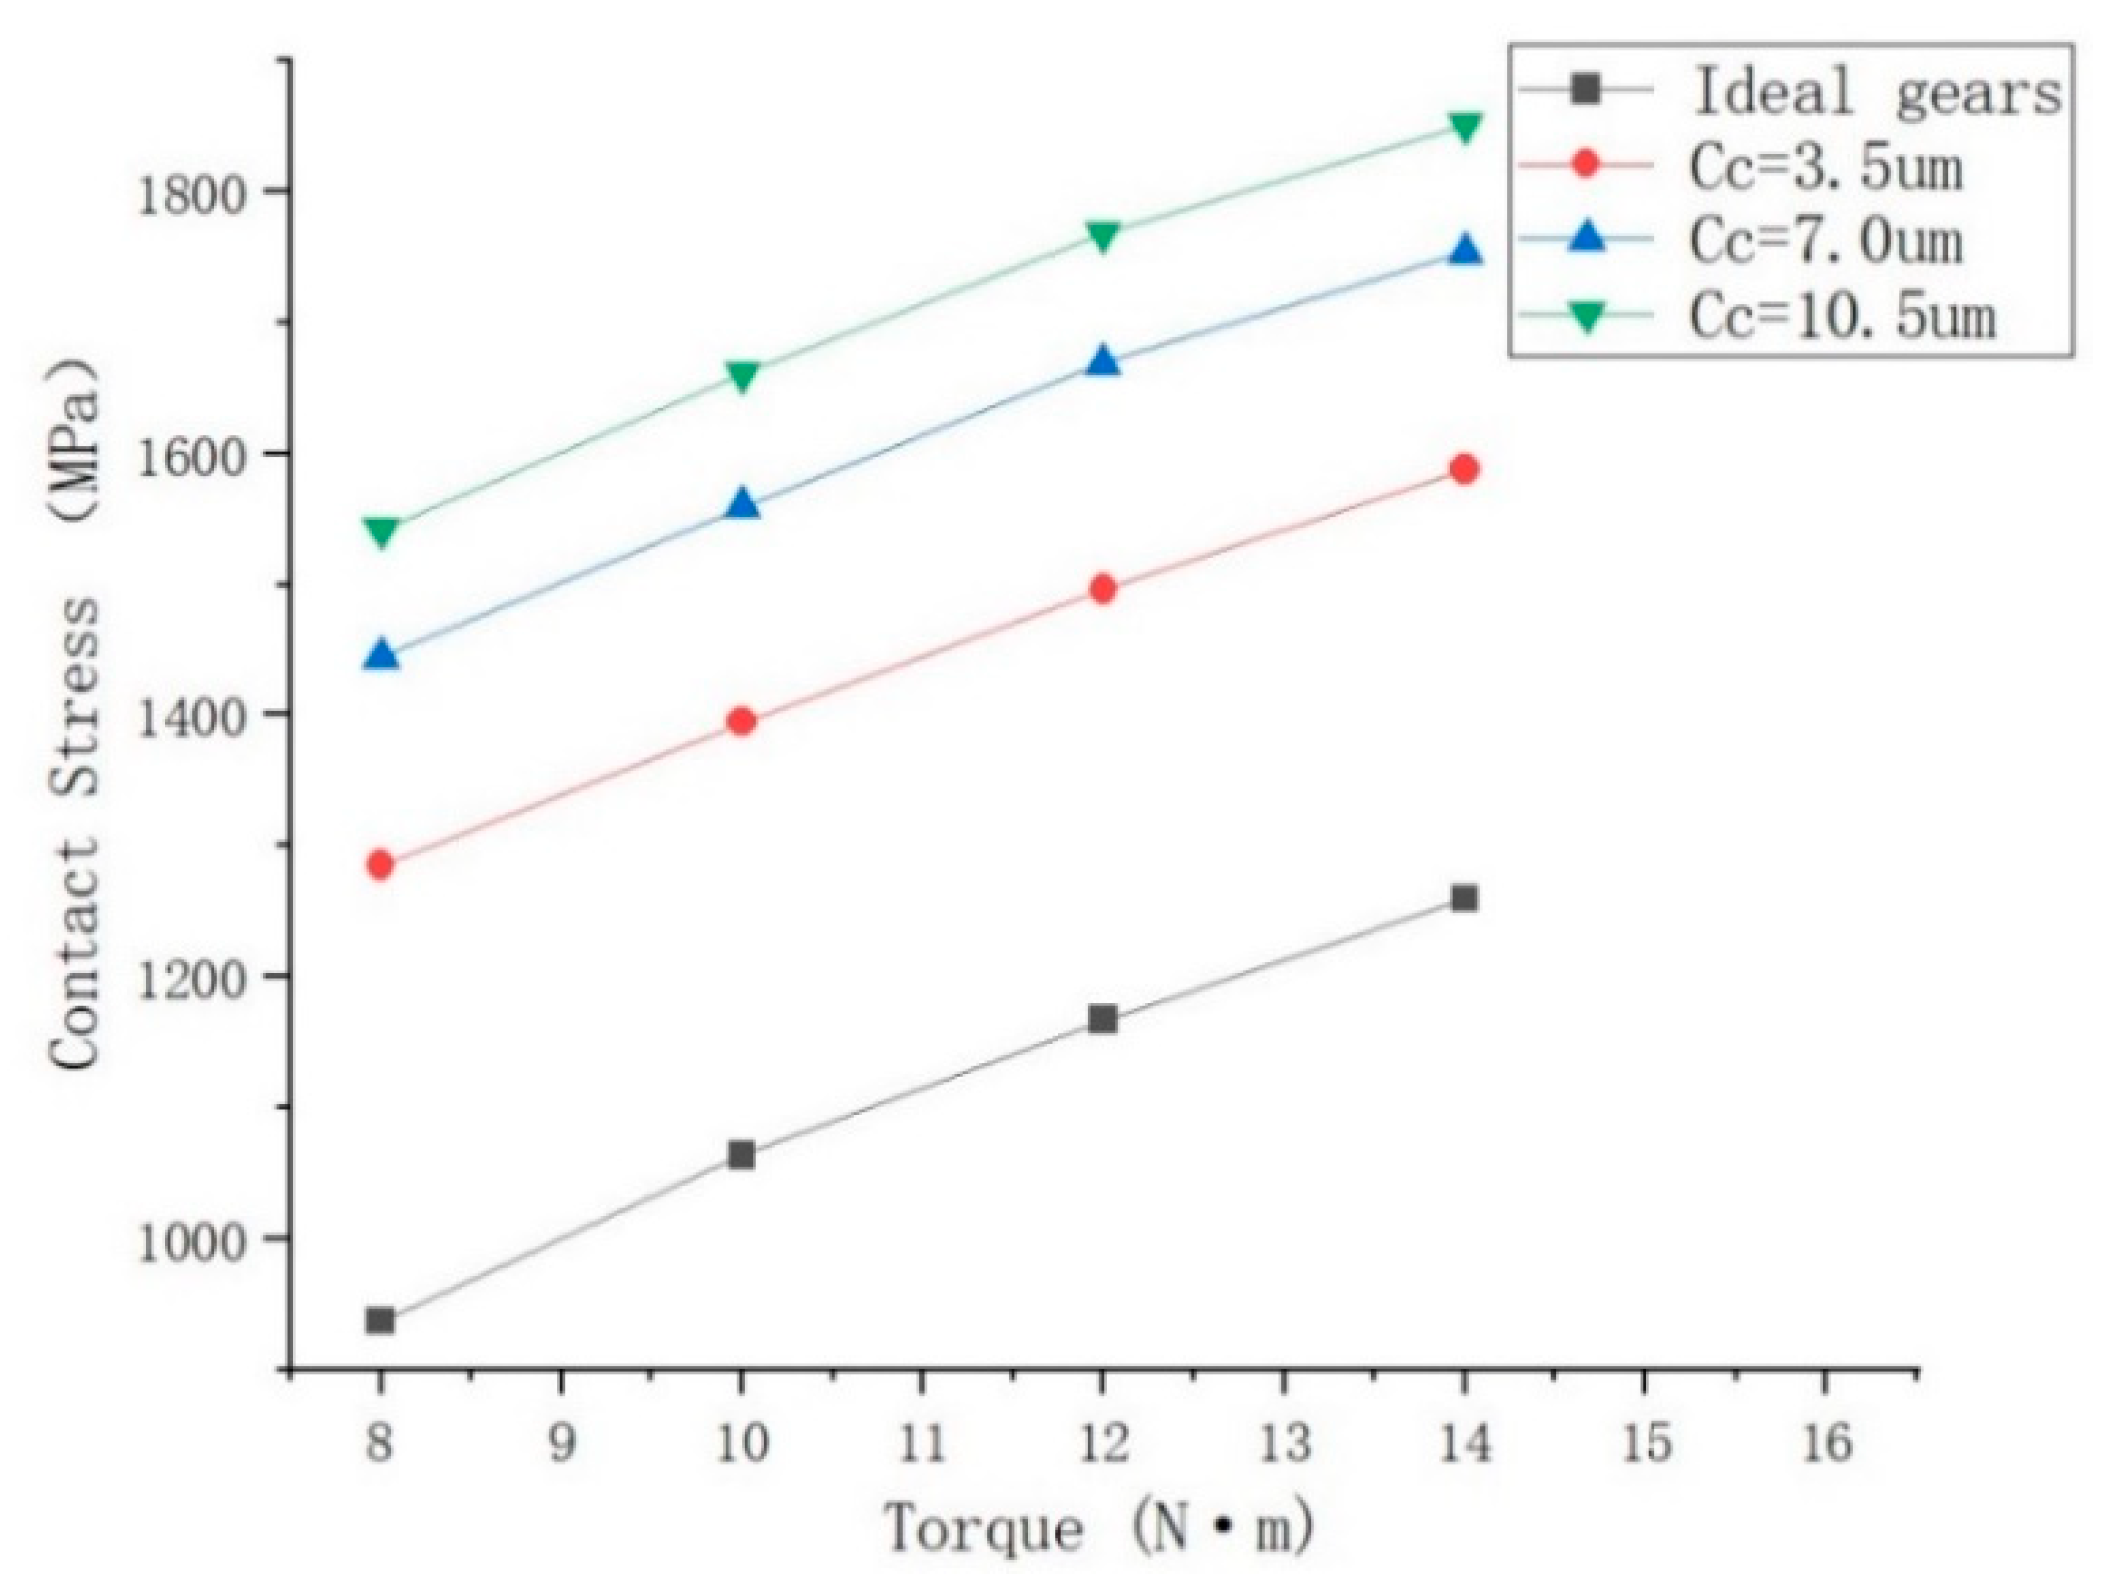
3.3. TSCS Analysis of Gear with LCM
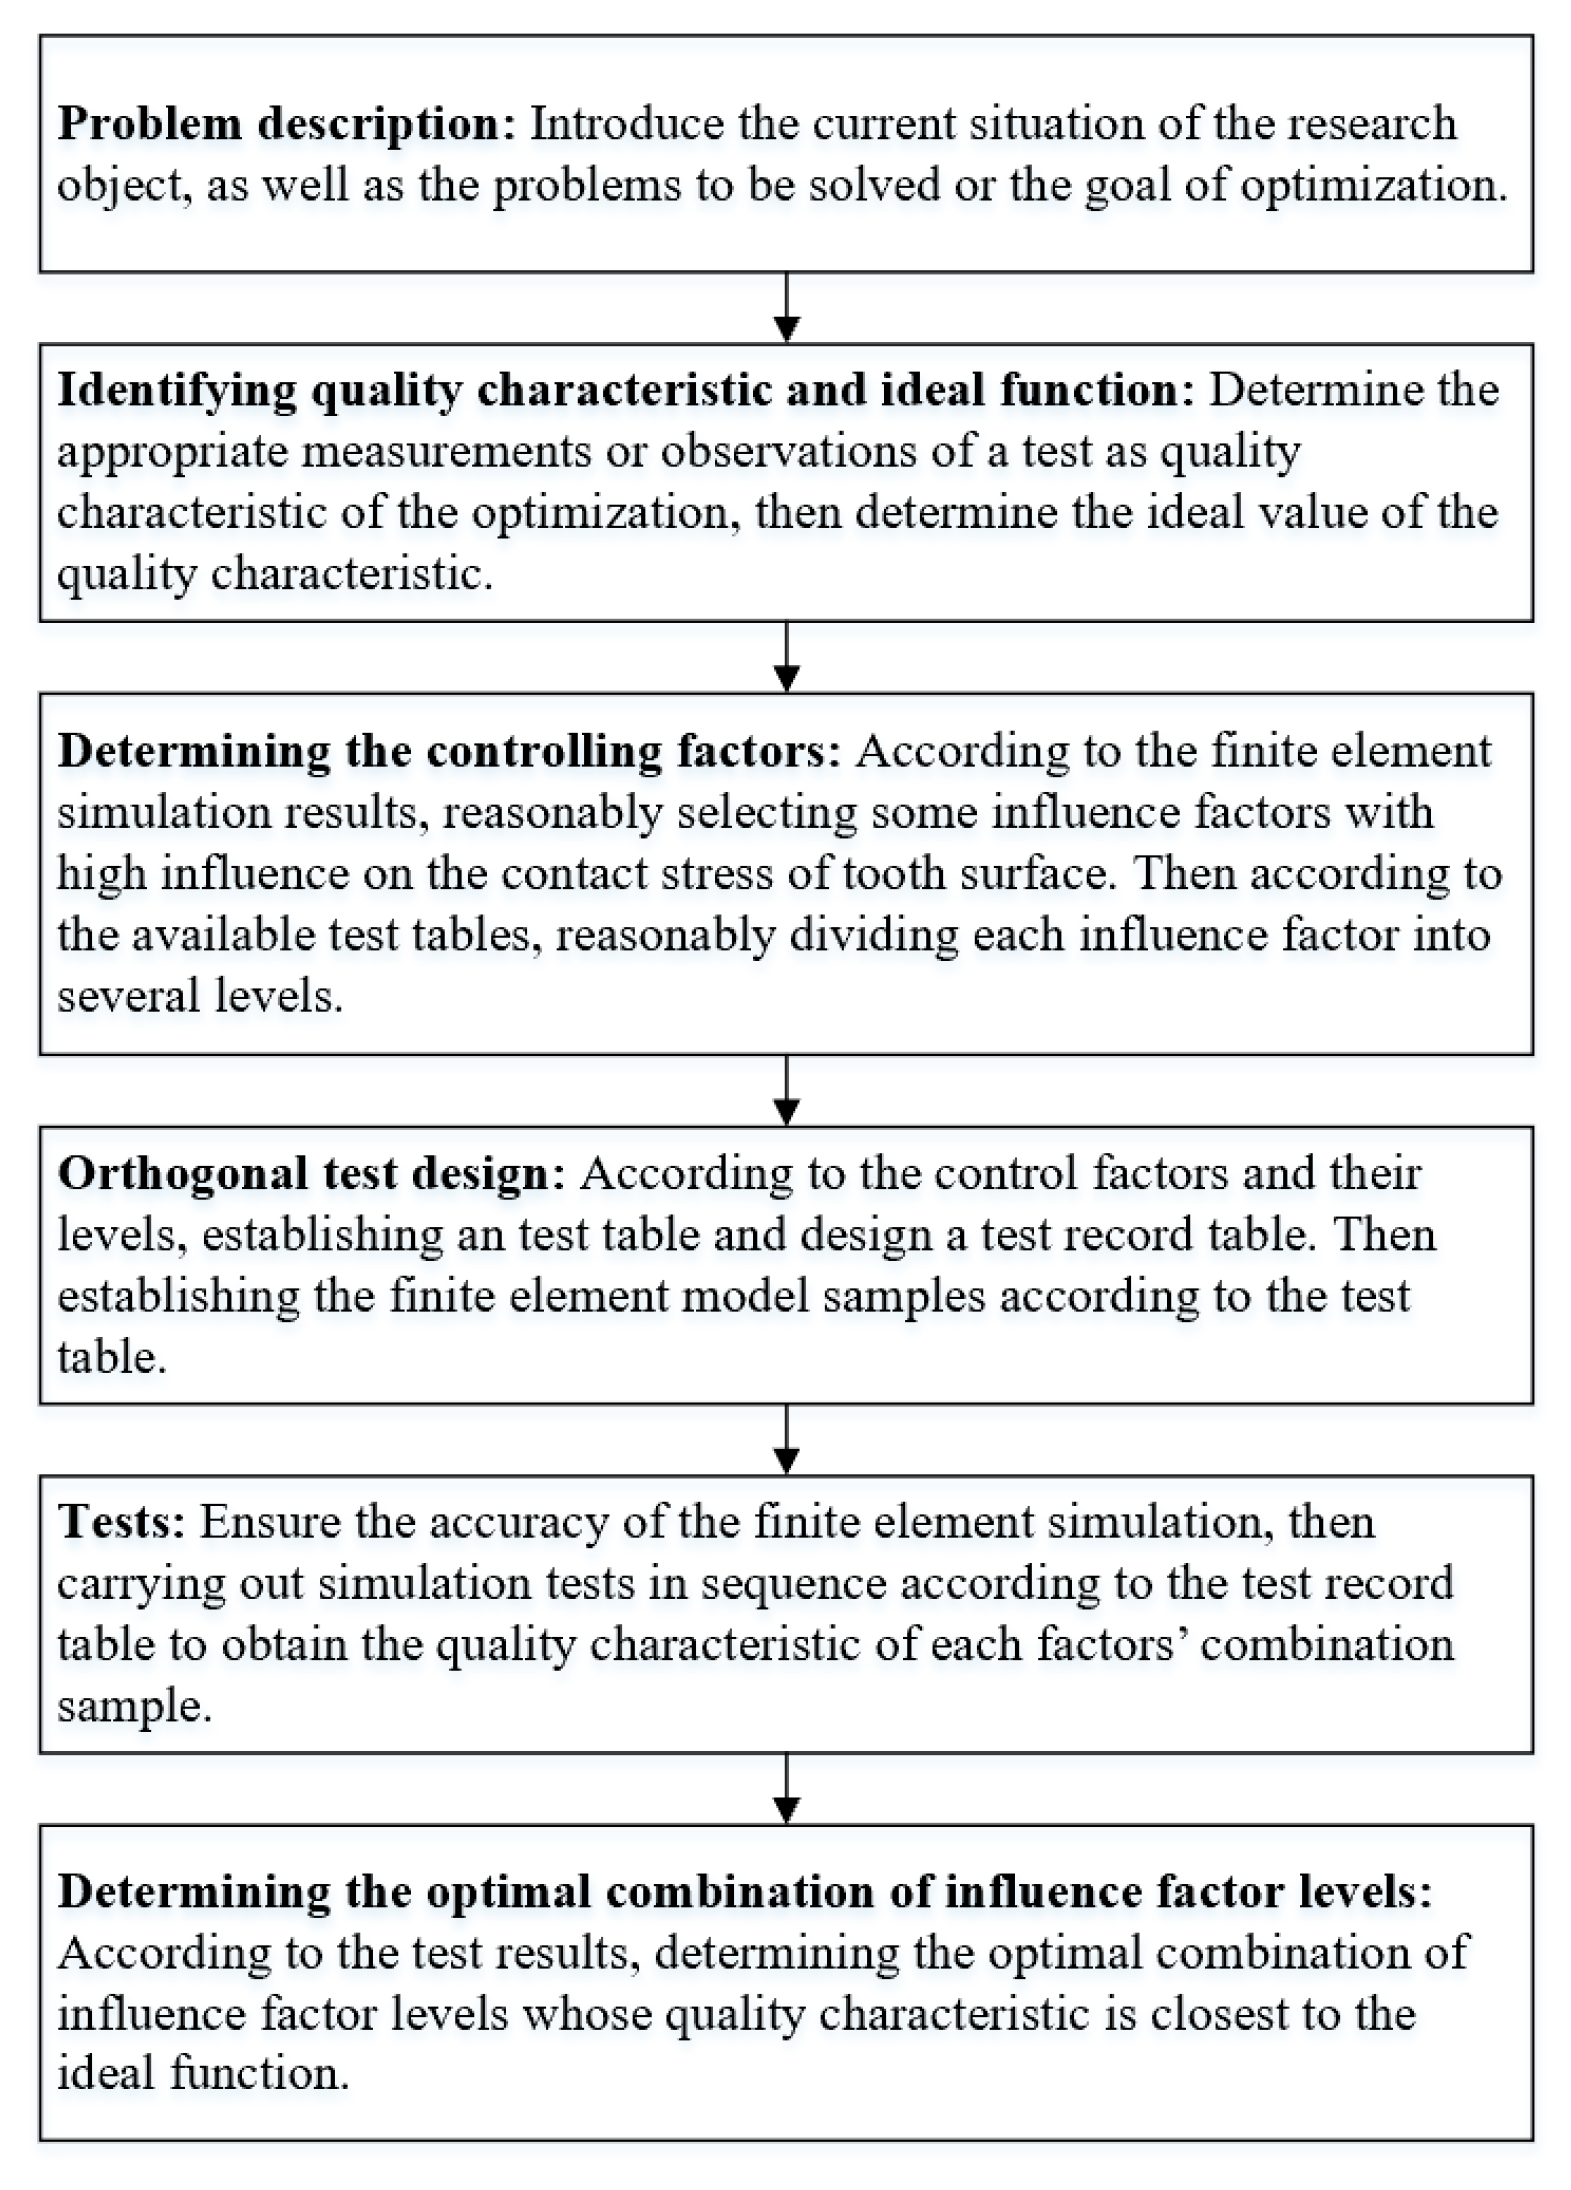
4. Analysis of the Influence of TPD, ME and LCM on TSCS by TM
4.1. Preparations before the Tests
4.2. Analysis of FEM Simulation Results
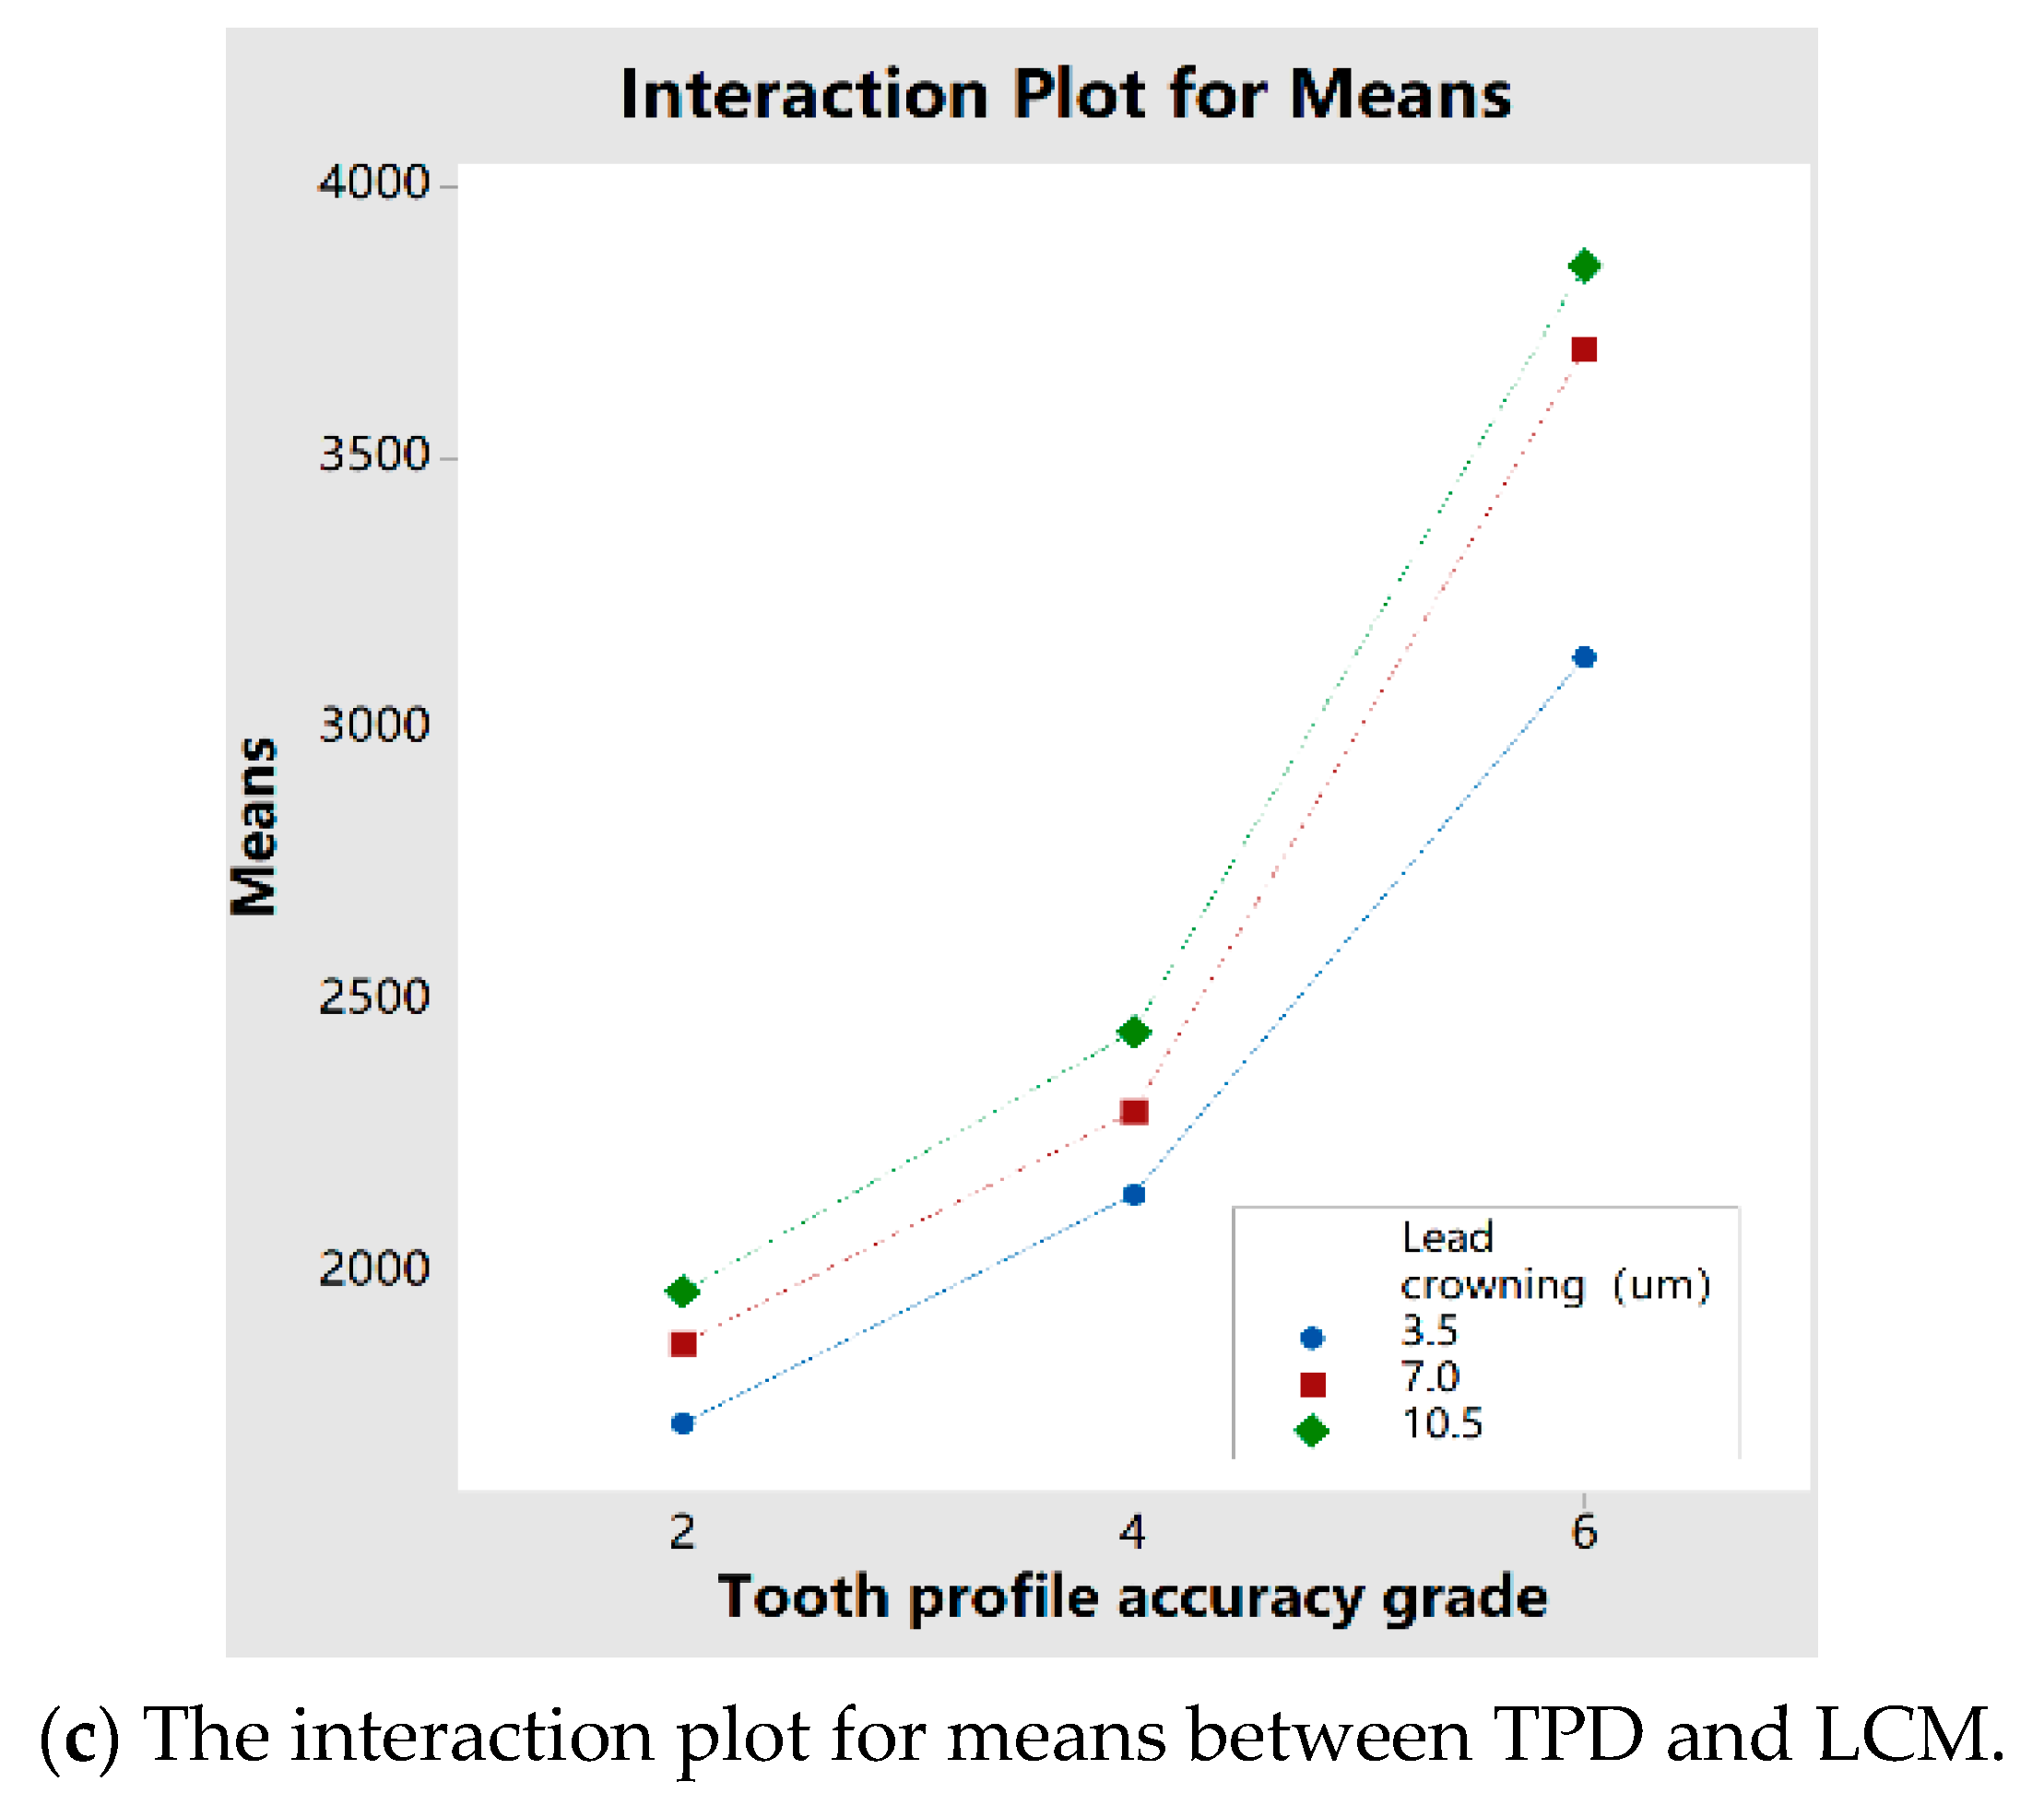
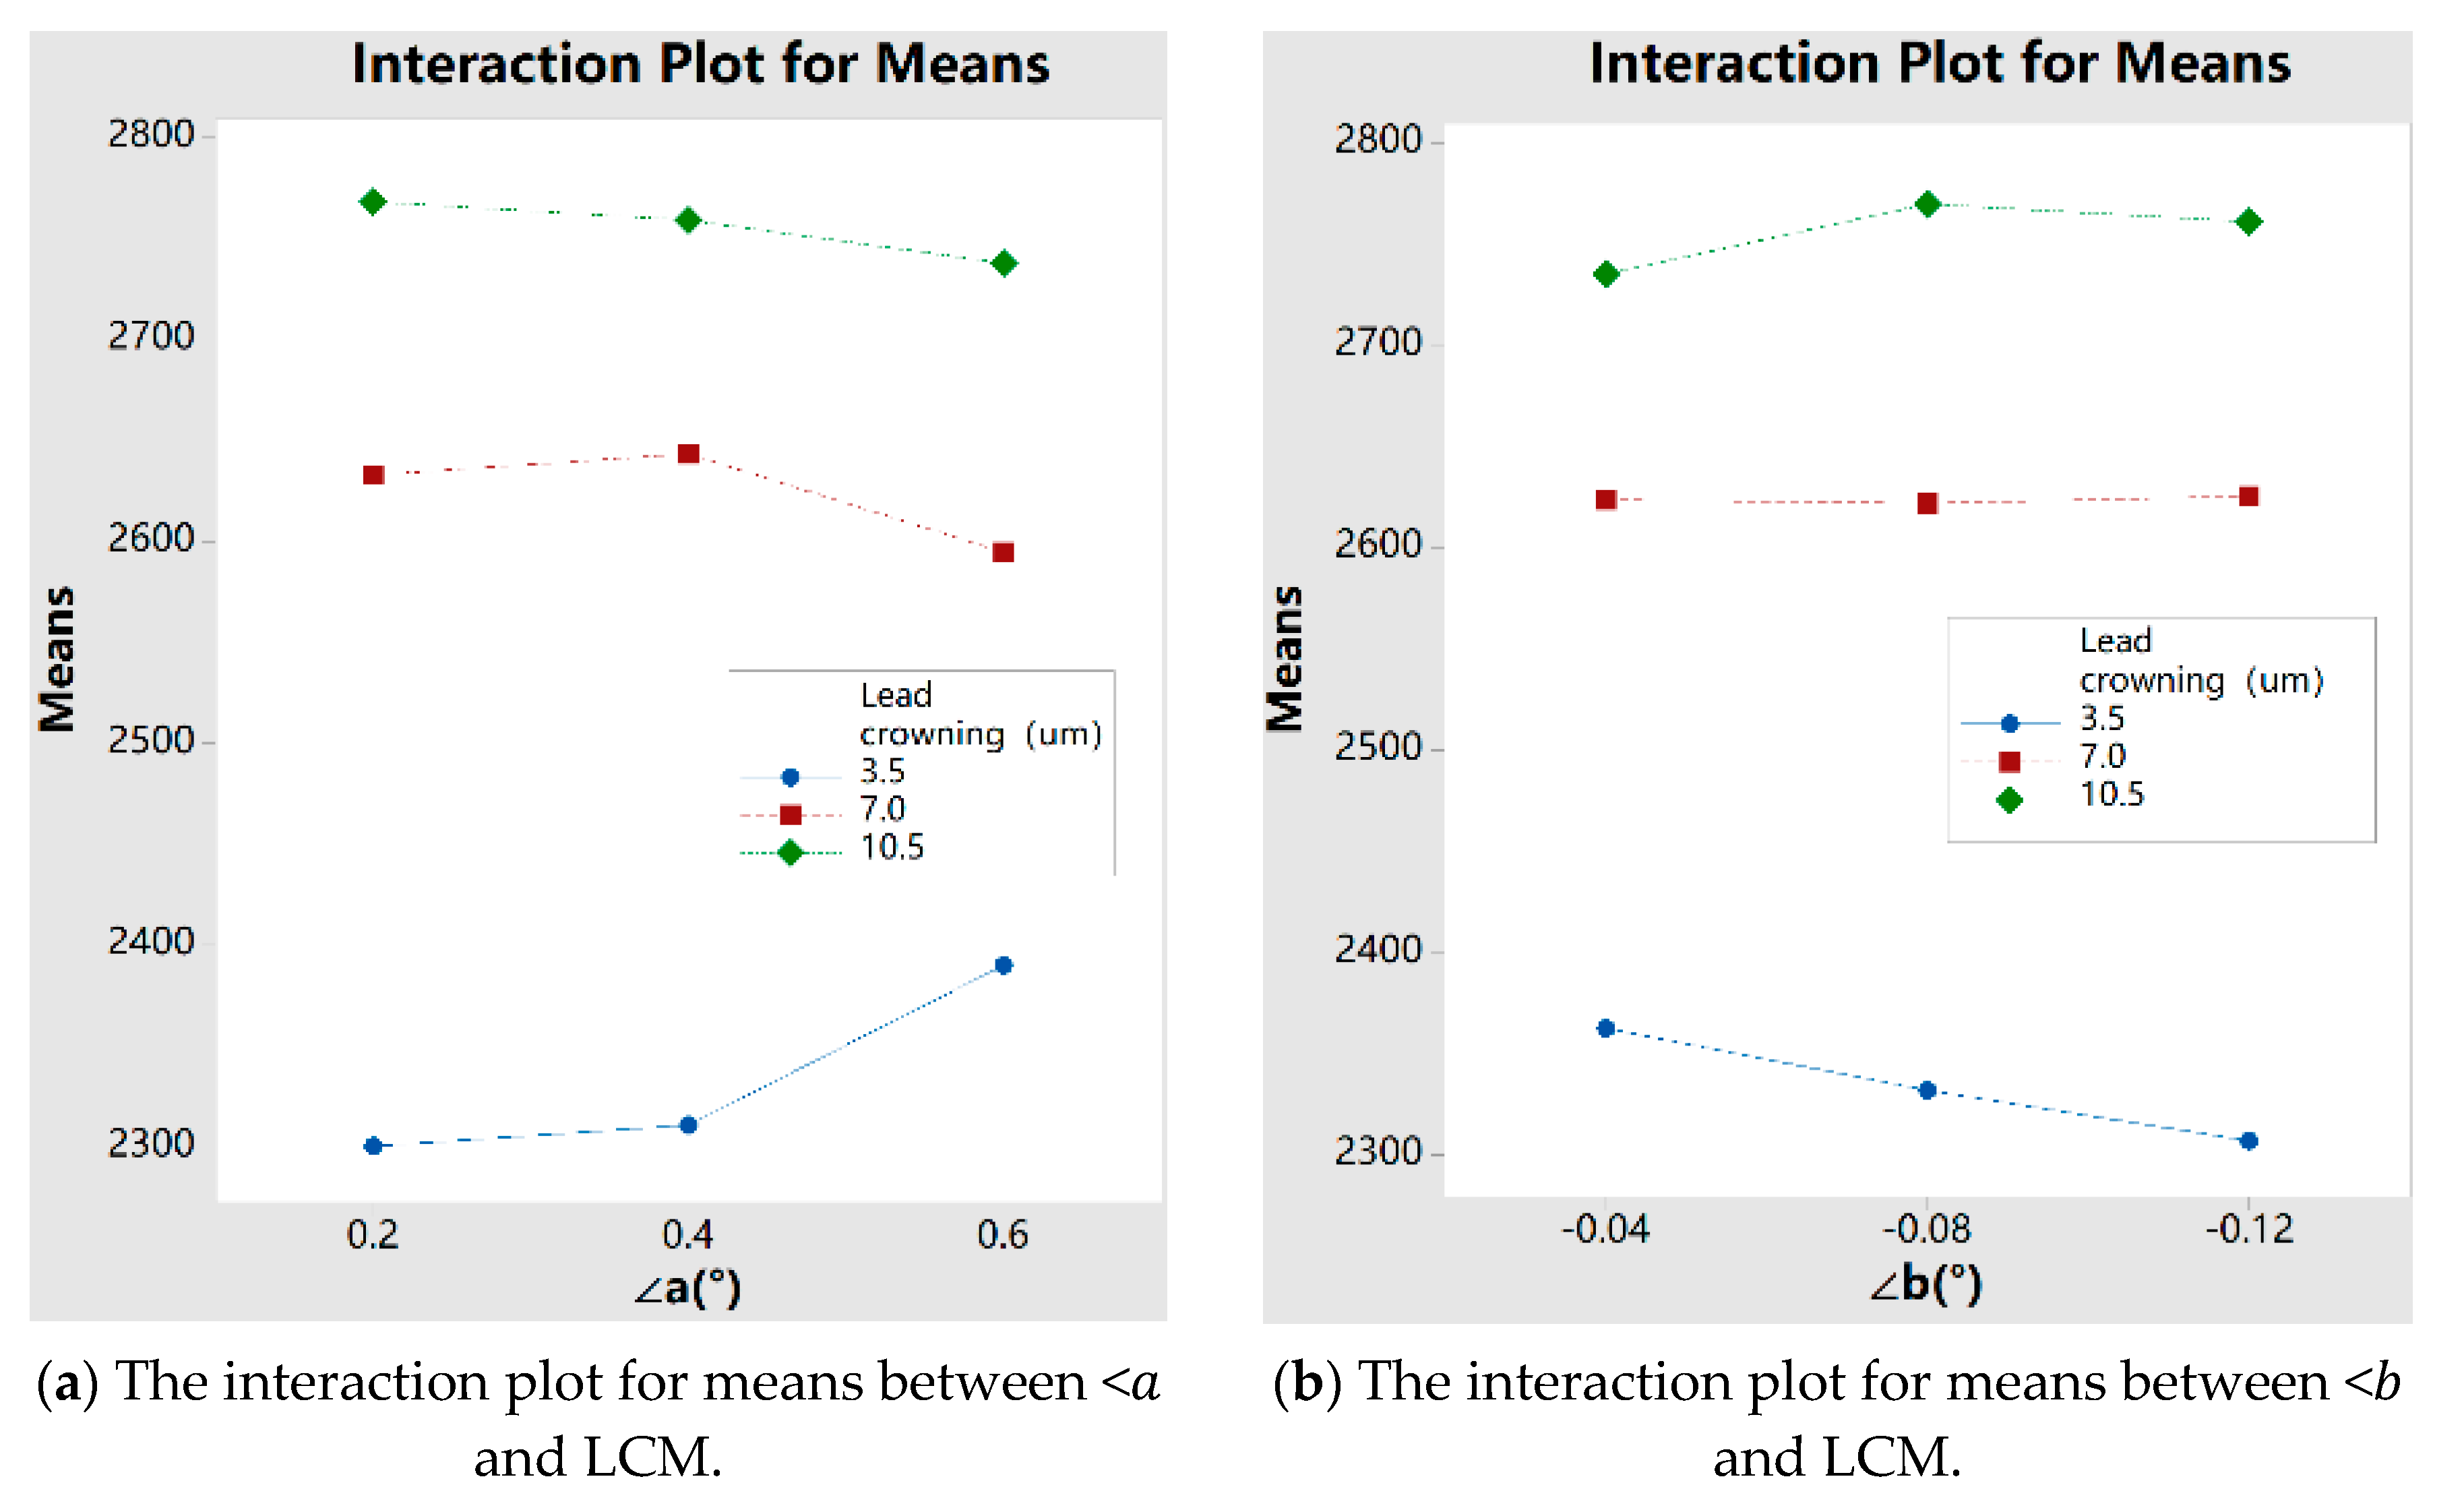
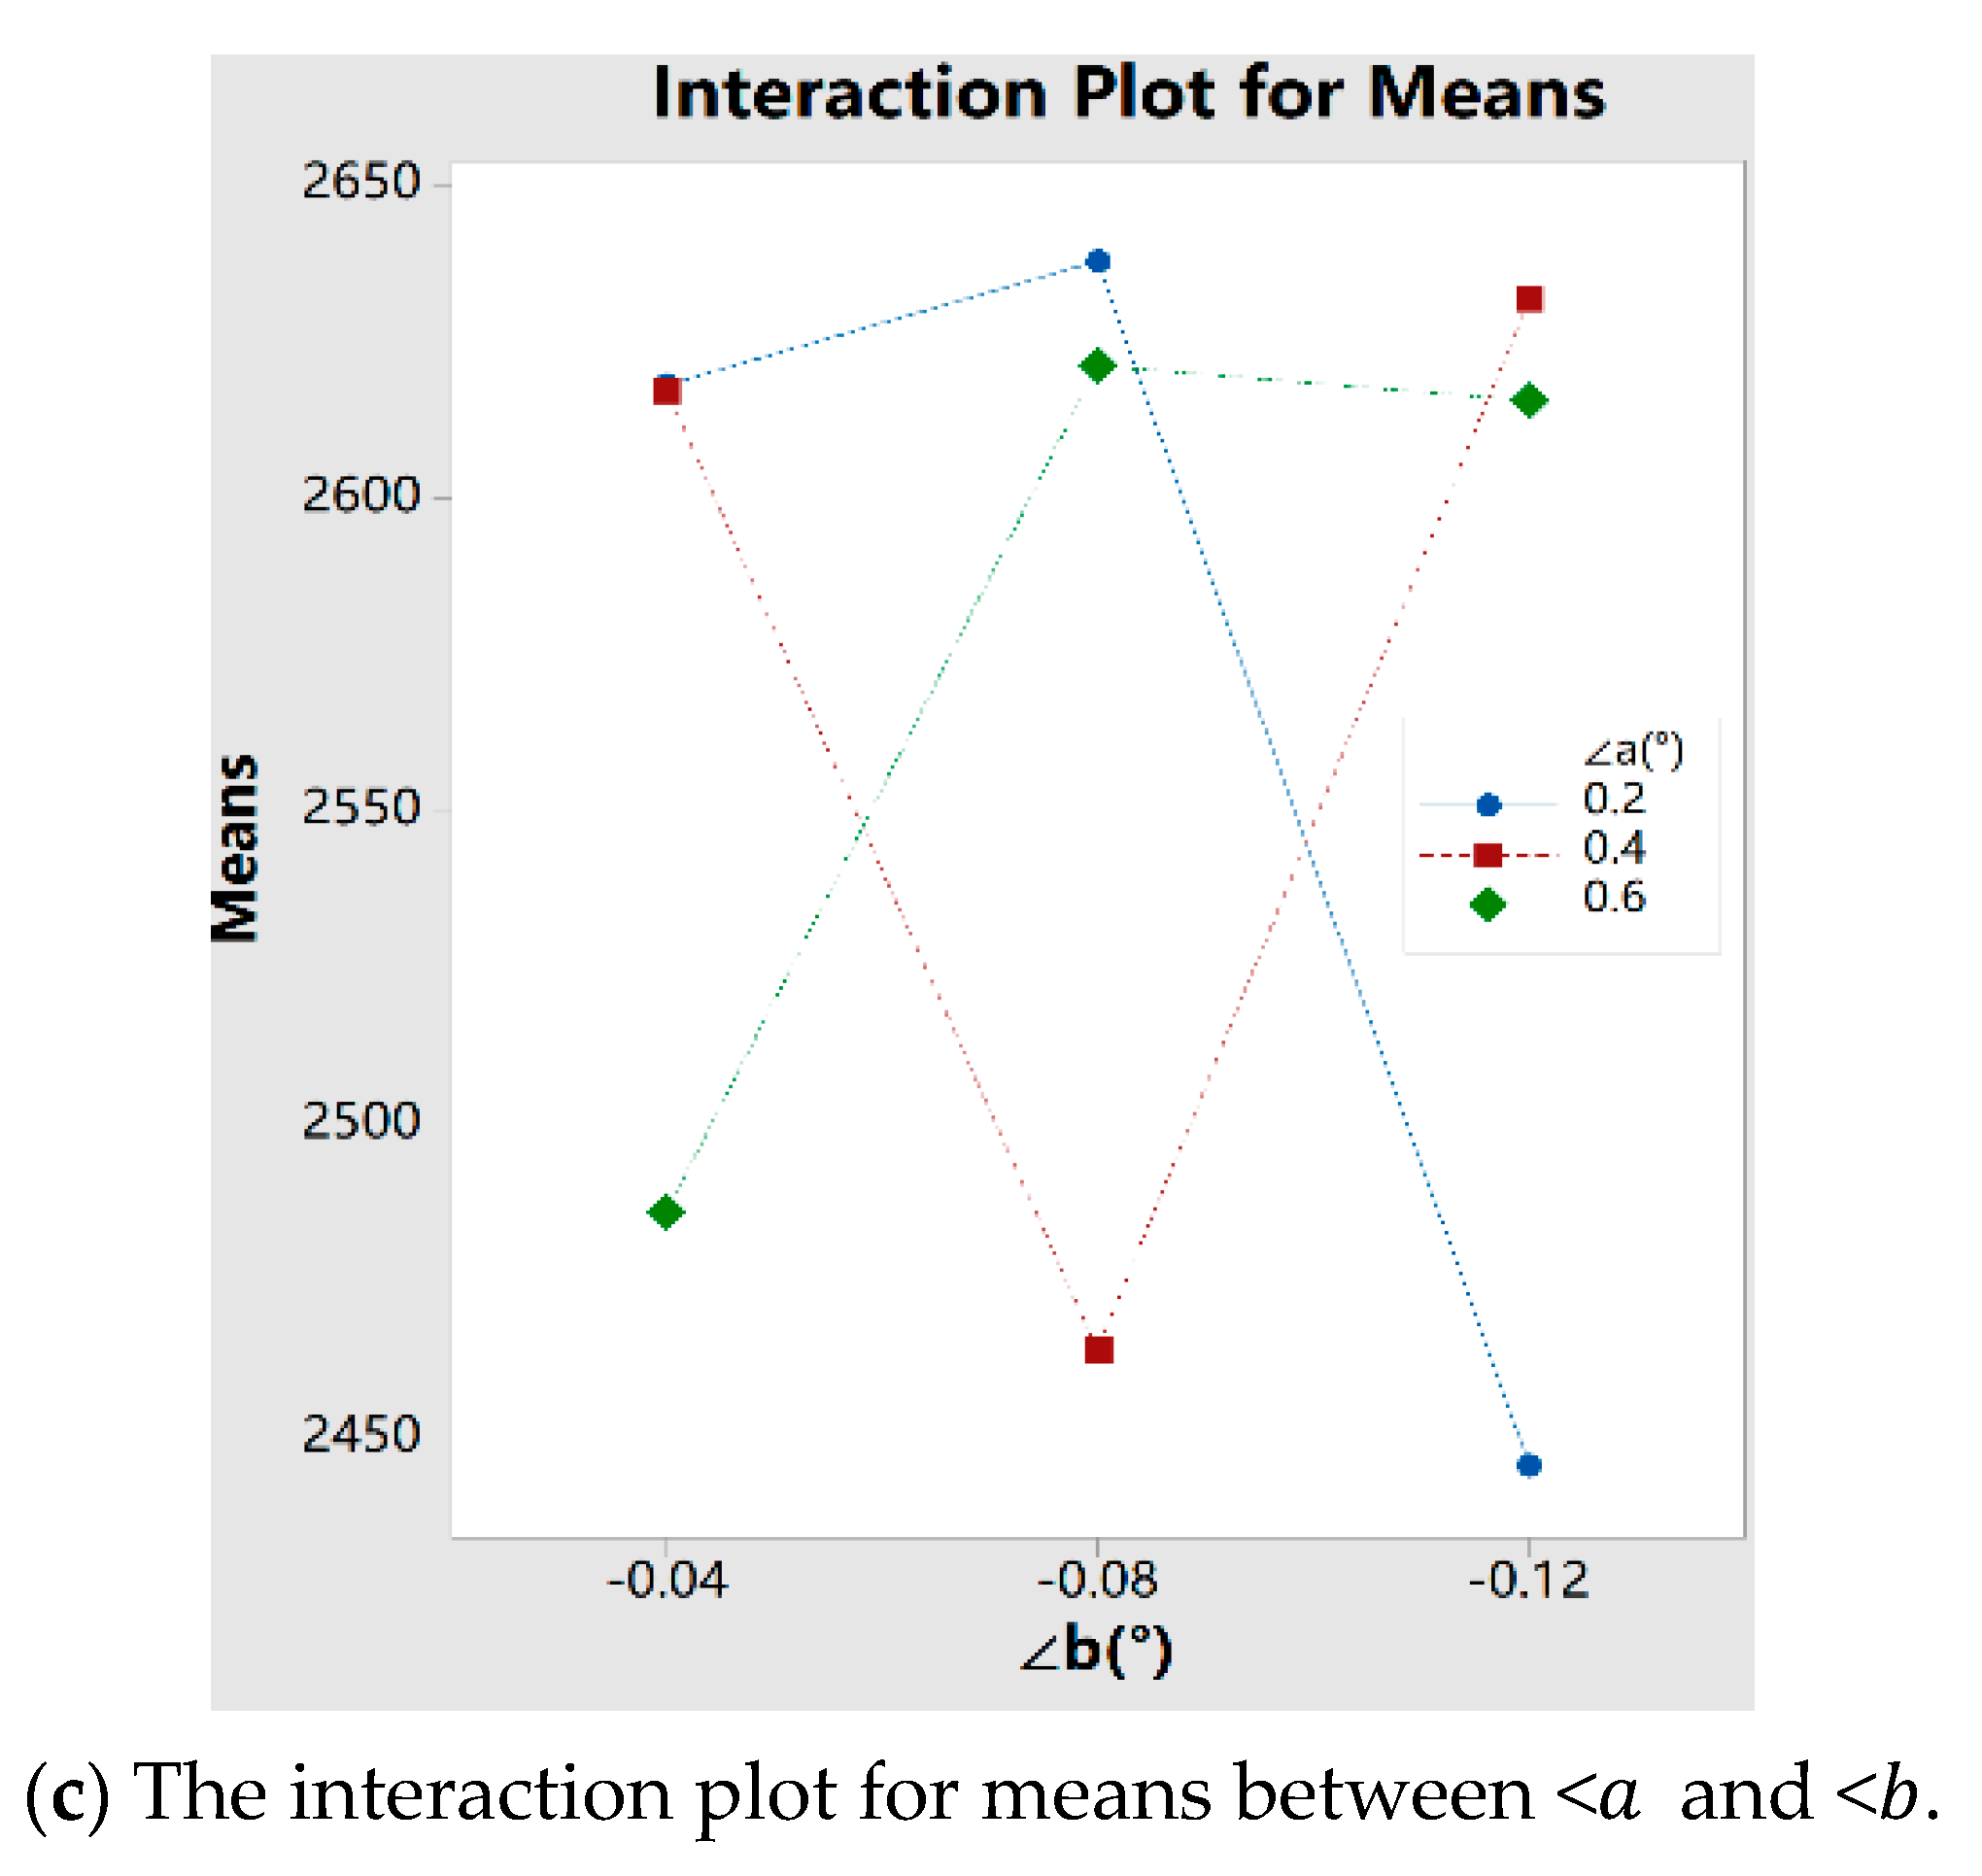
4.3. The Interaction between TPD, ME and LCM
4.4. Determining the Optimal Combination of Influence Factor Levels
4.5. Comparative Analysis of Different Combinations of Factor Levels
5. Conclusions
- (1)
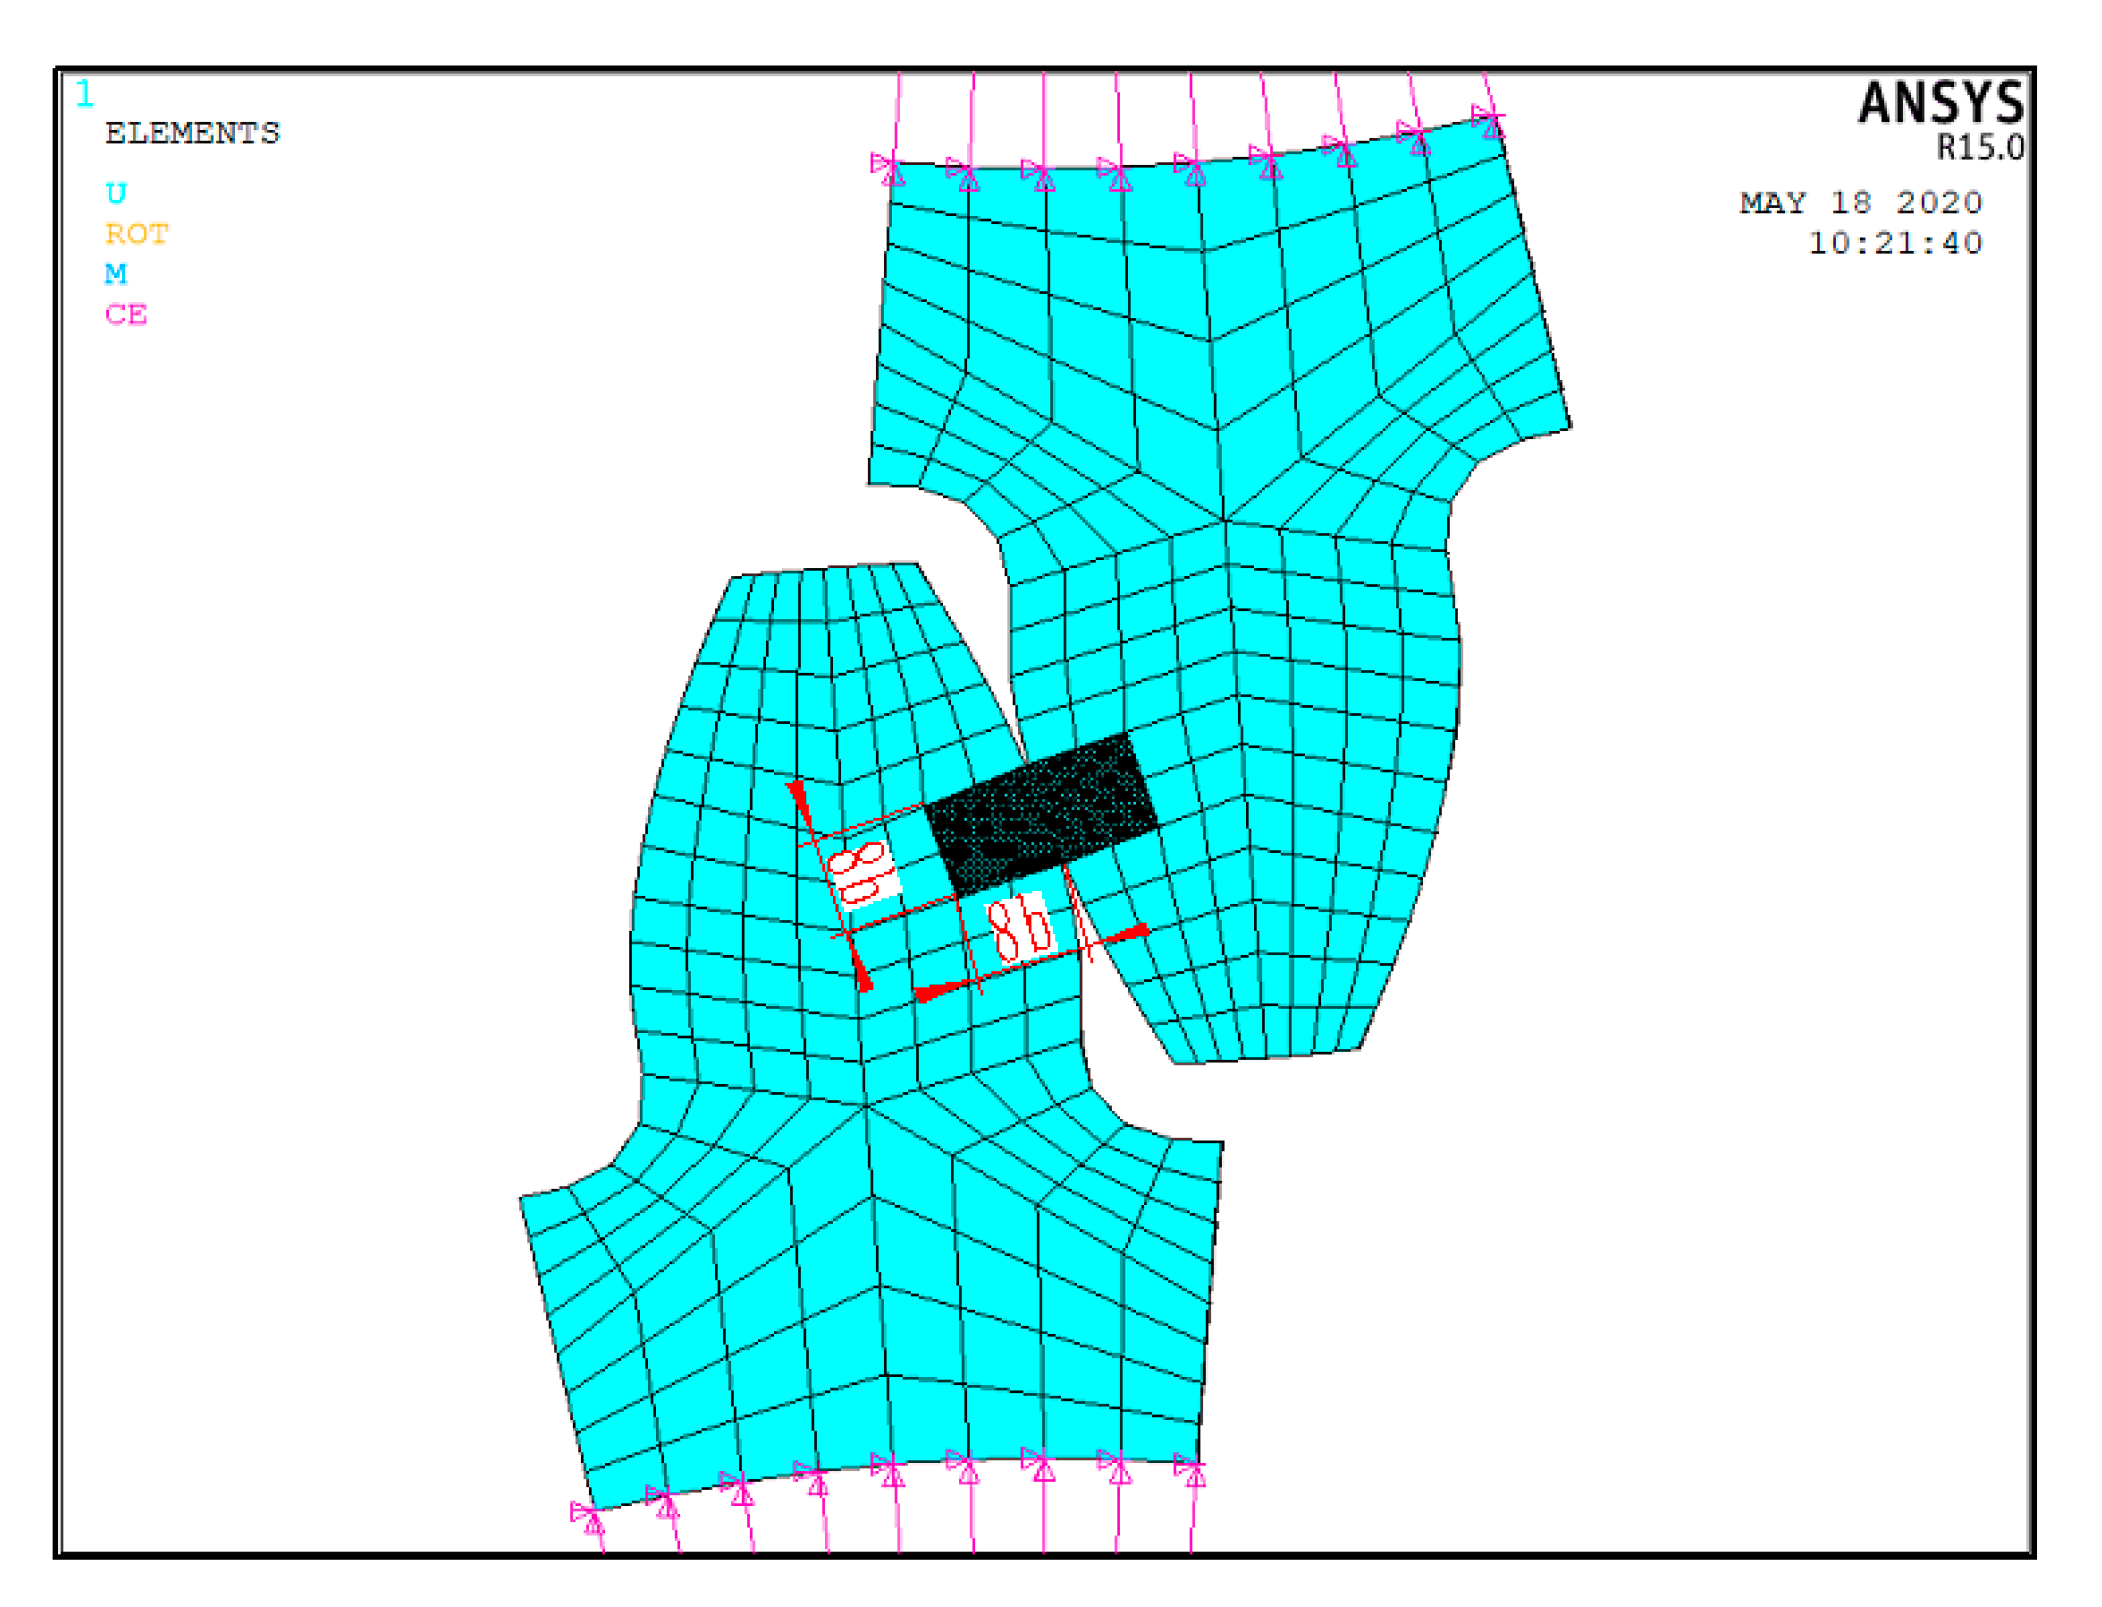
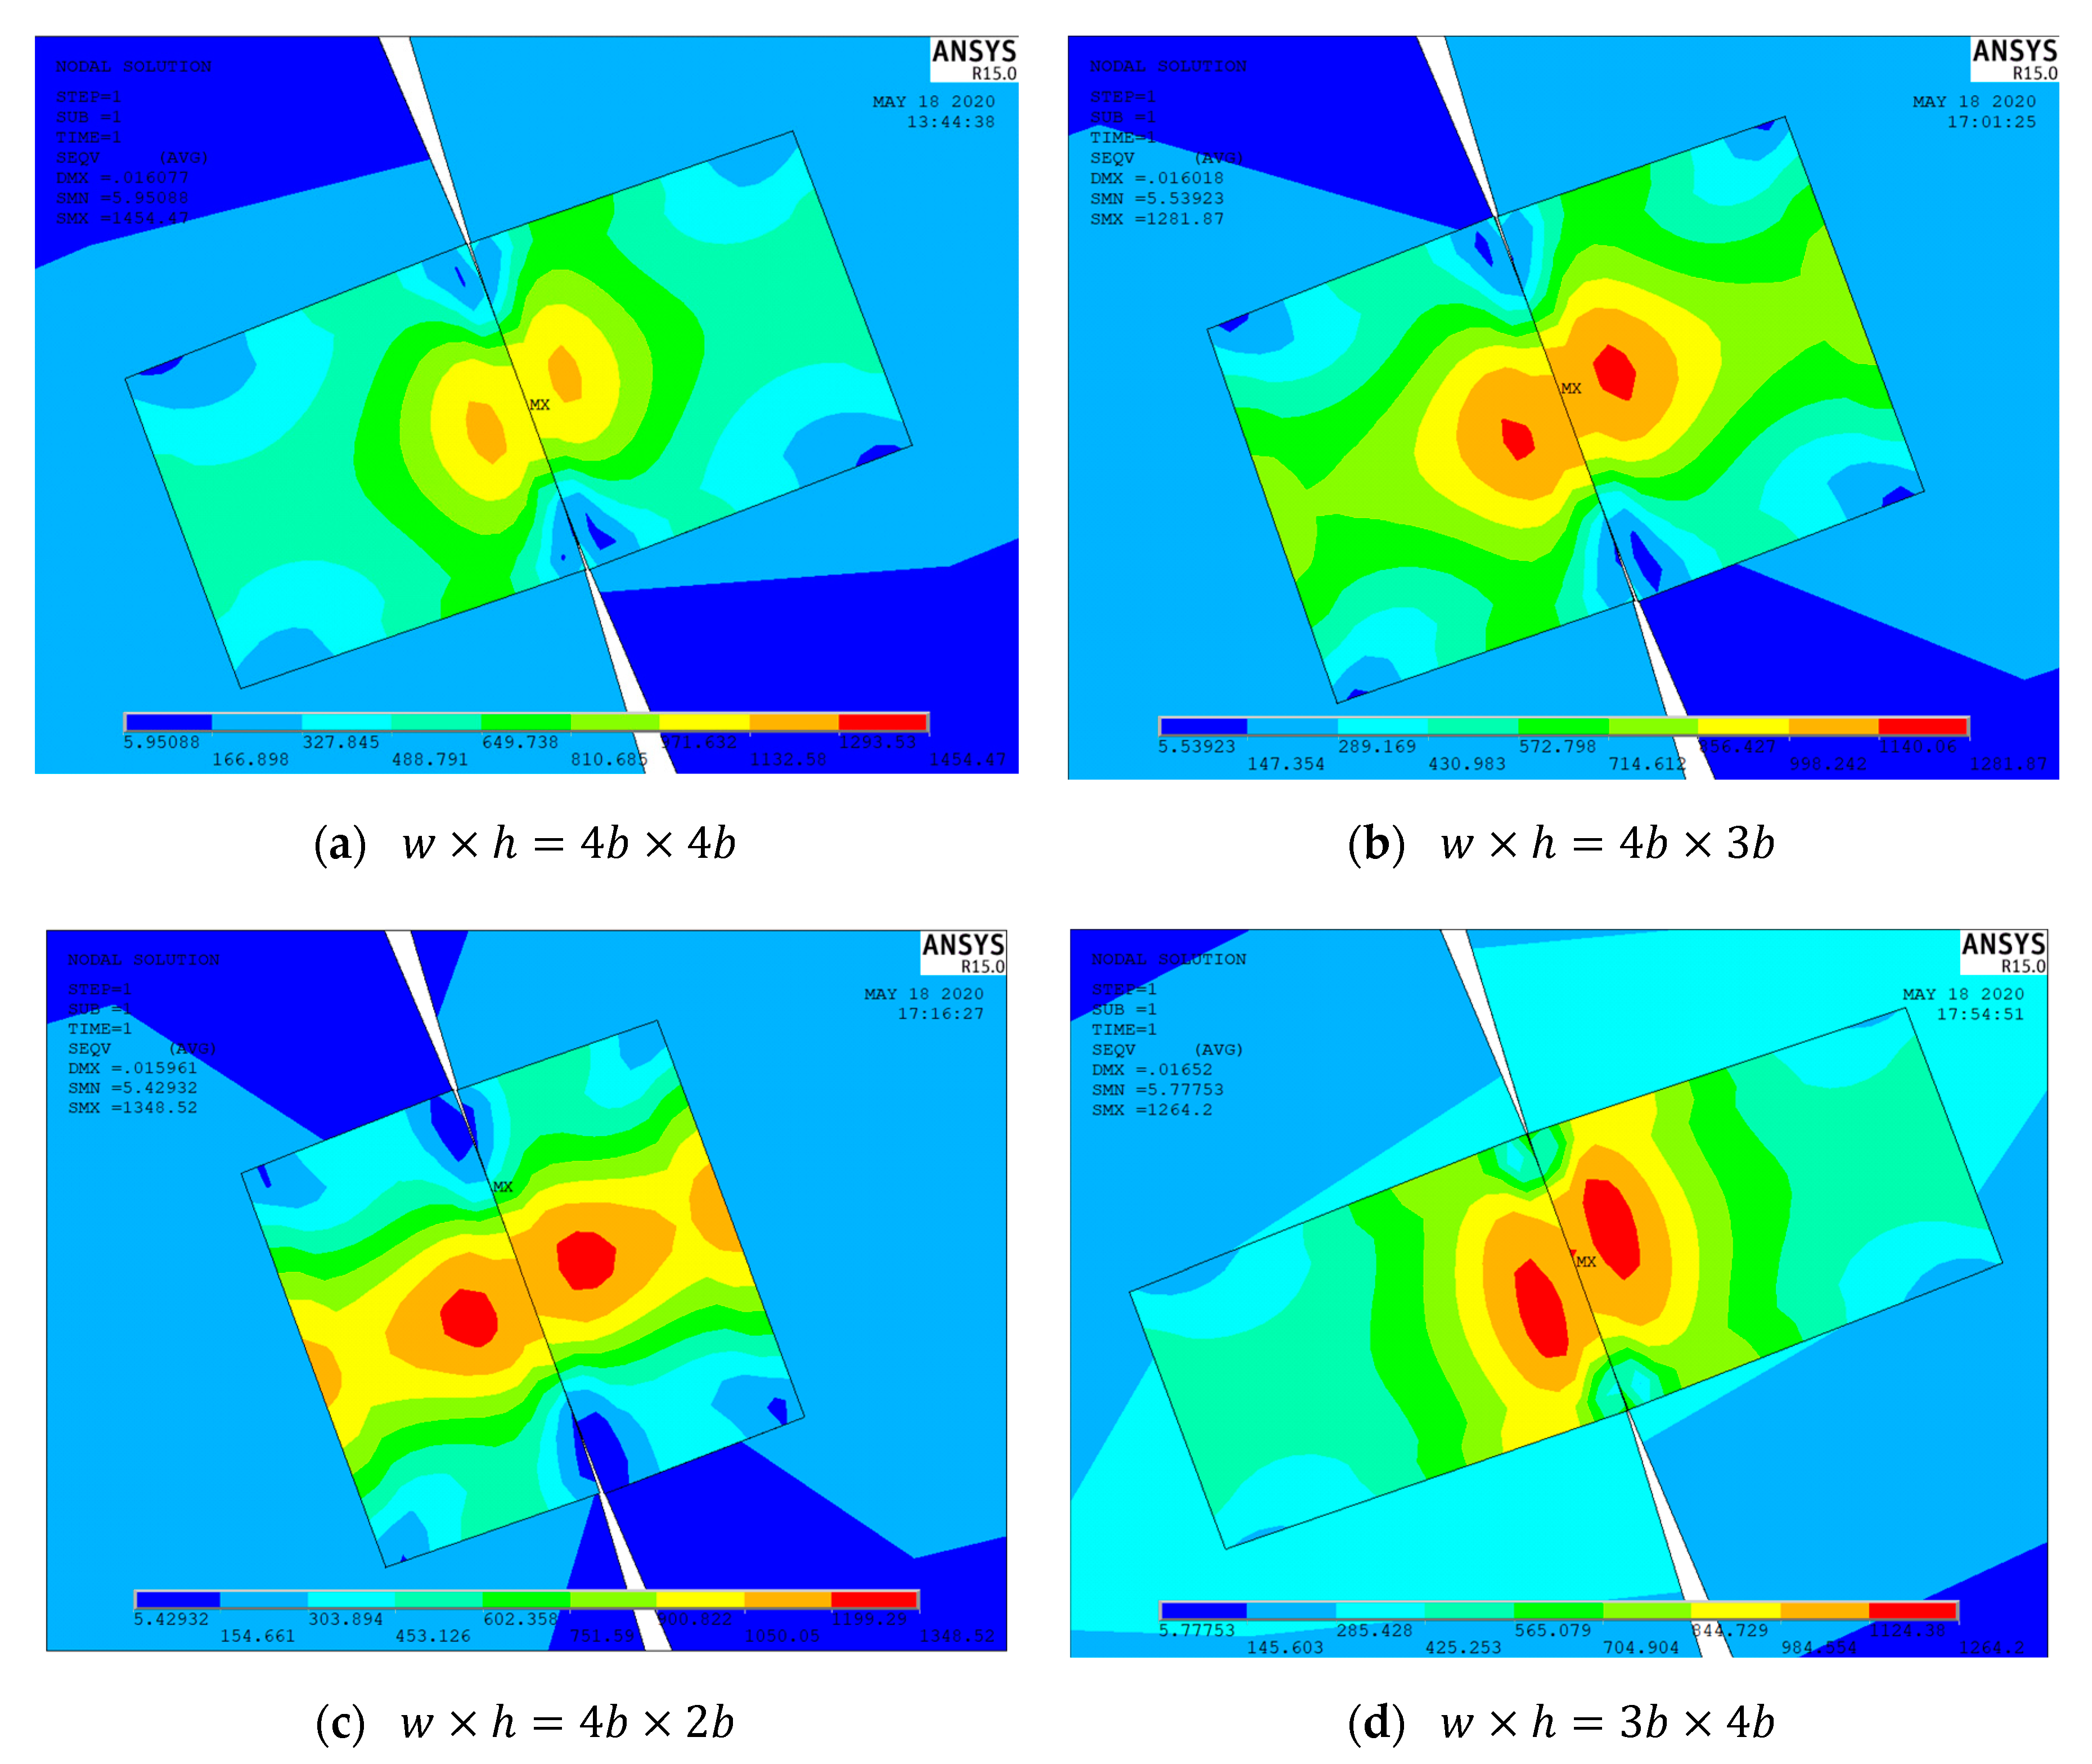
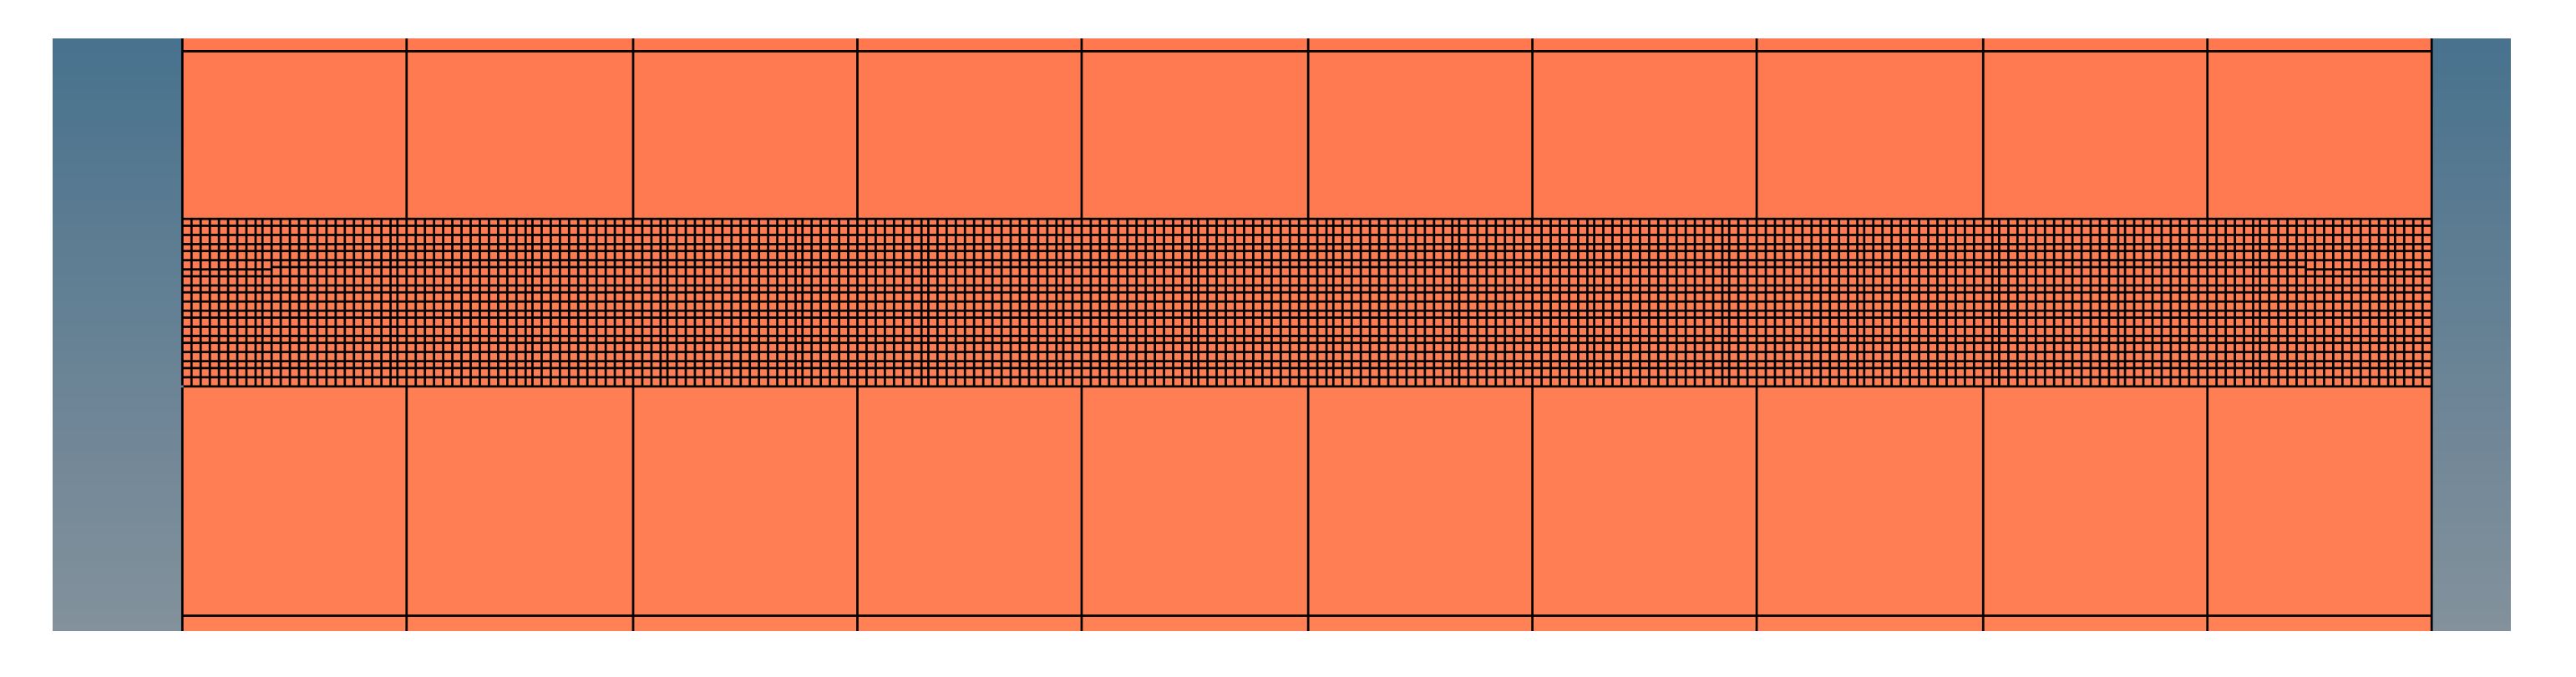
- In this paper, a 3D-FEM model of one pair of engaged teeth has been modeled and the mesh of the contact area has been refined by FEM software. In the model, the refined area mesh and the non-refined area mesh were connected by Multi-point constraint (MPC). At the same time, in order to save the time of the FEM solution on the premise of ensuring the accuracy of model analysis, the reasonable size of the refined area has been researched and confirmed;
- (2)
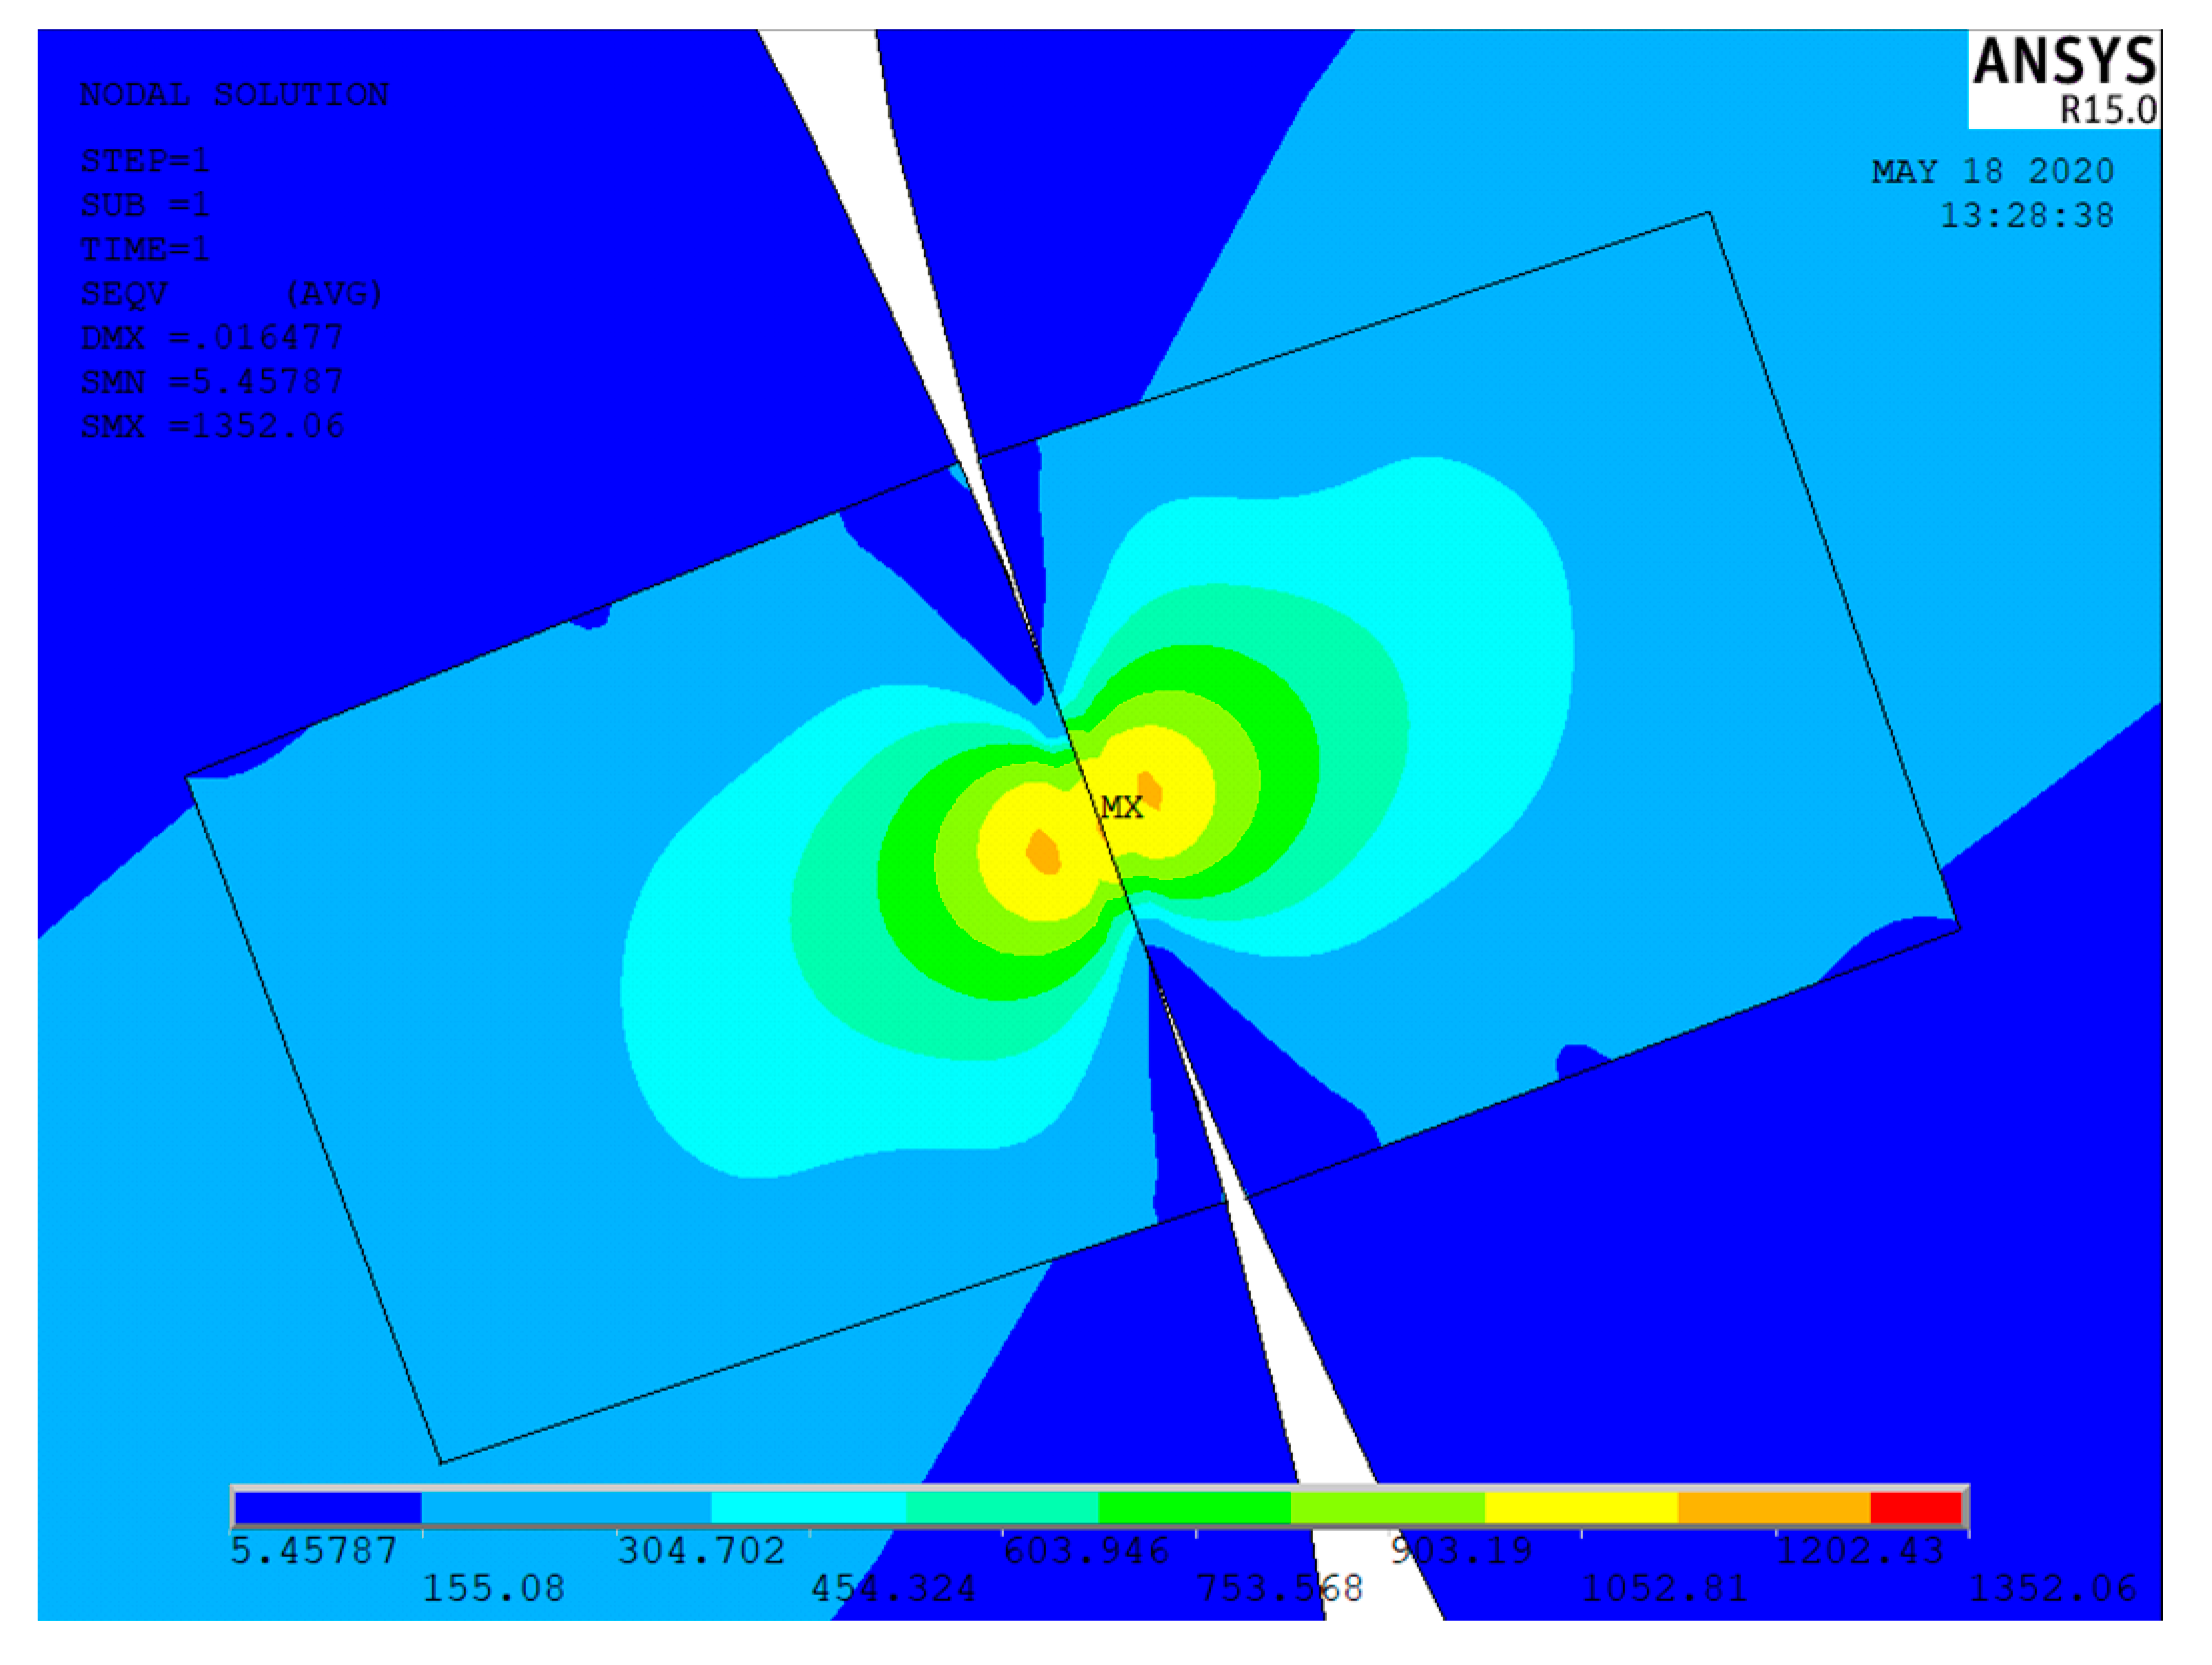
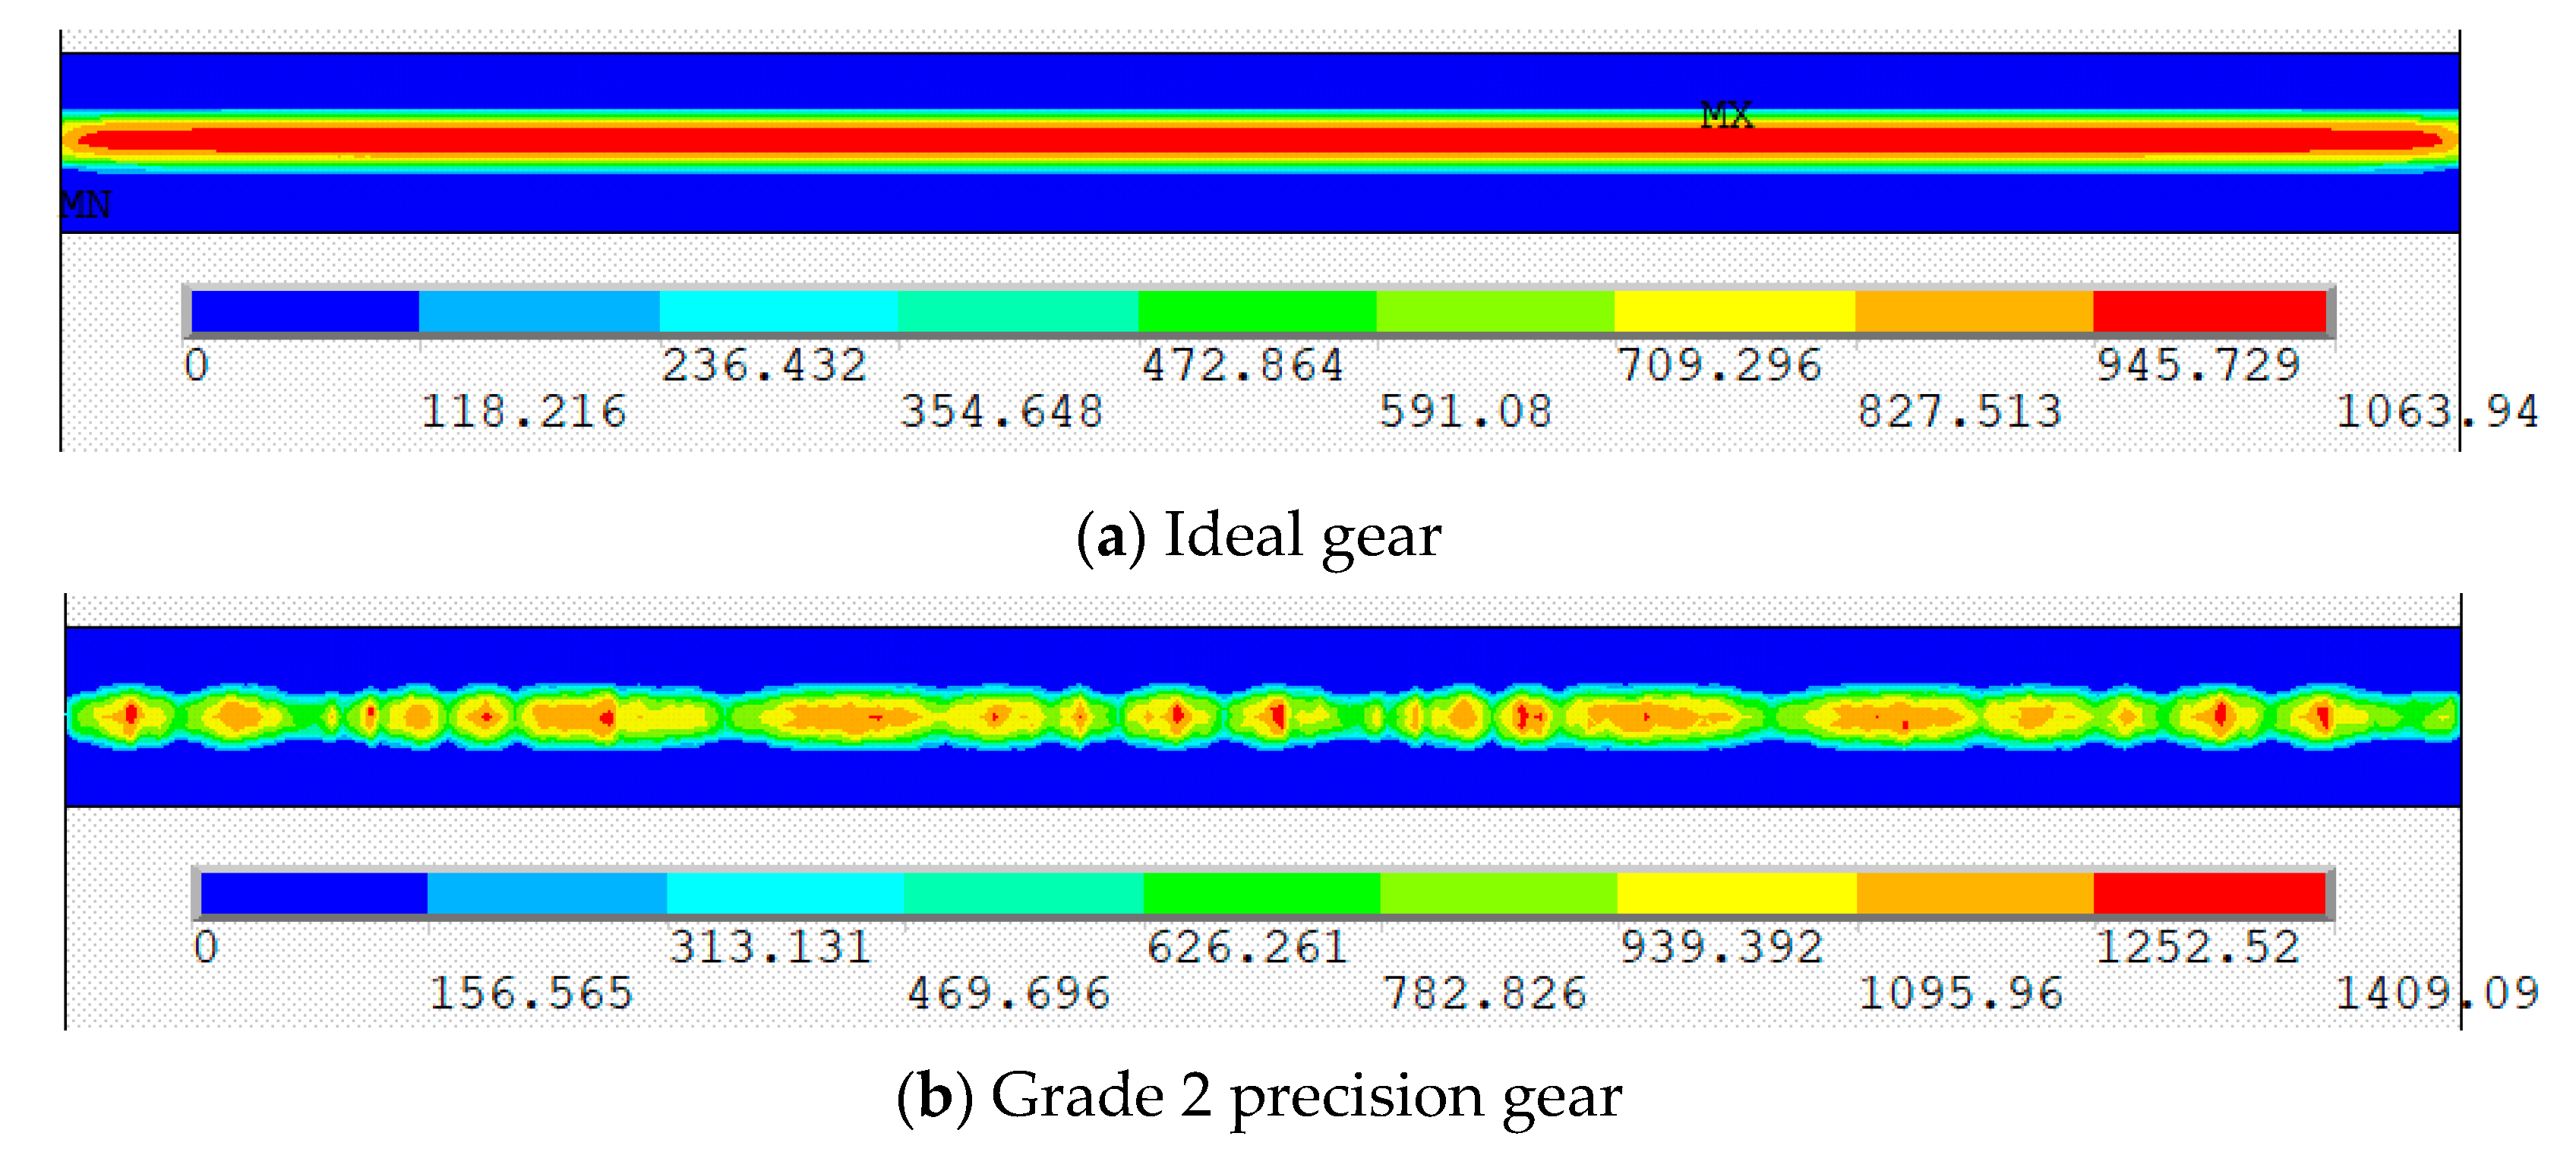
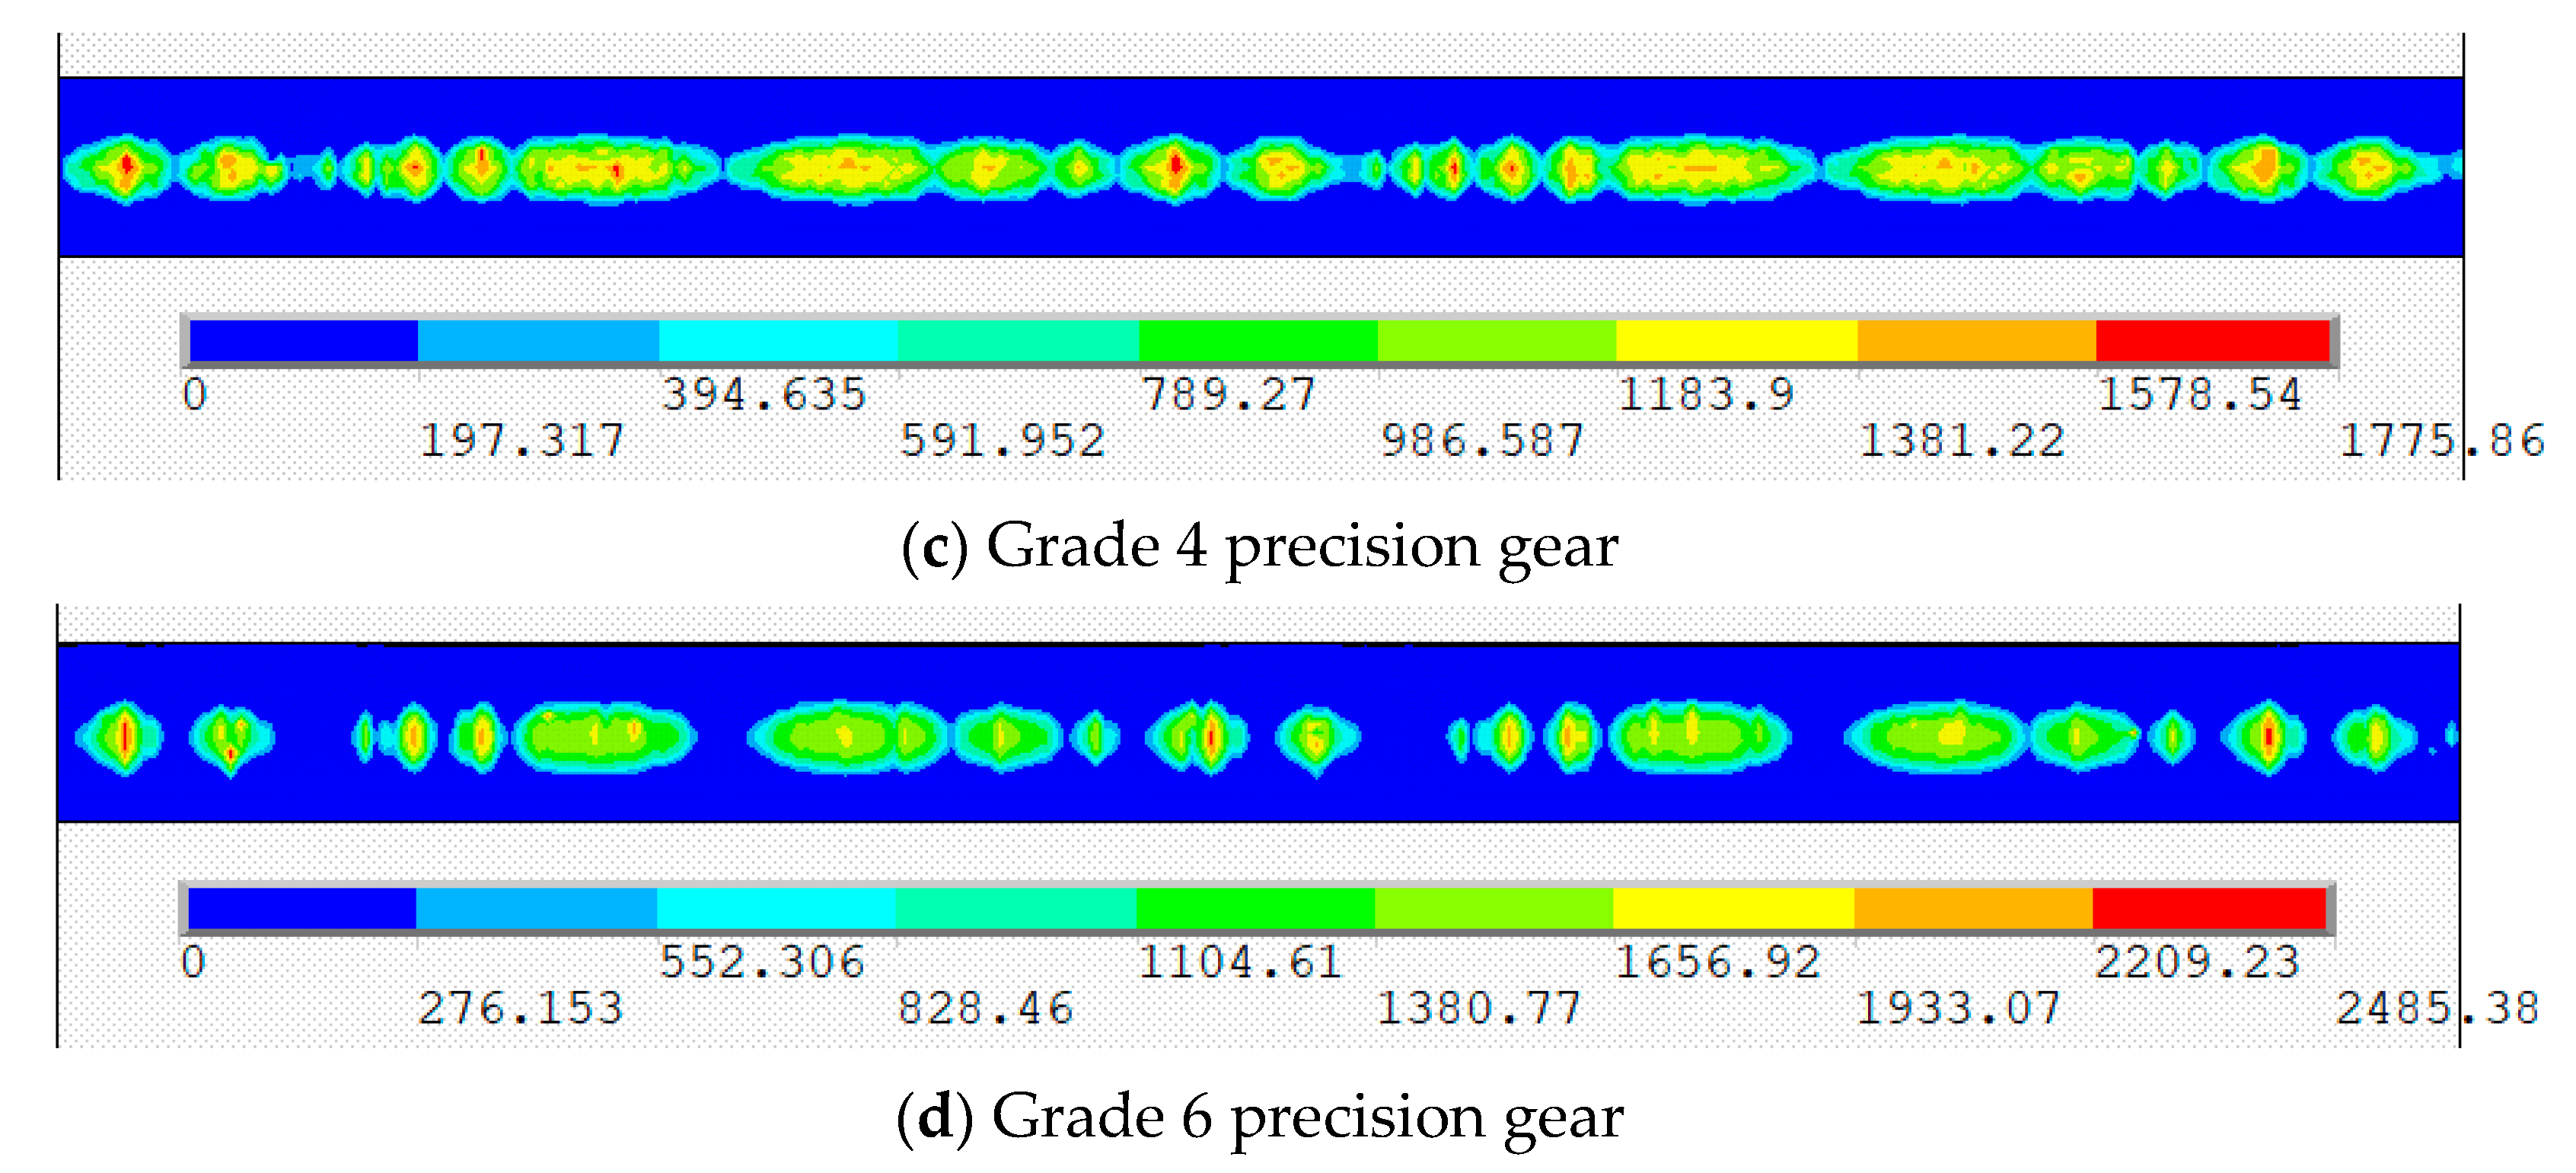
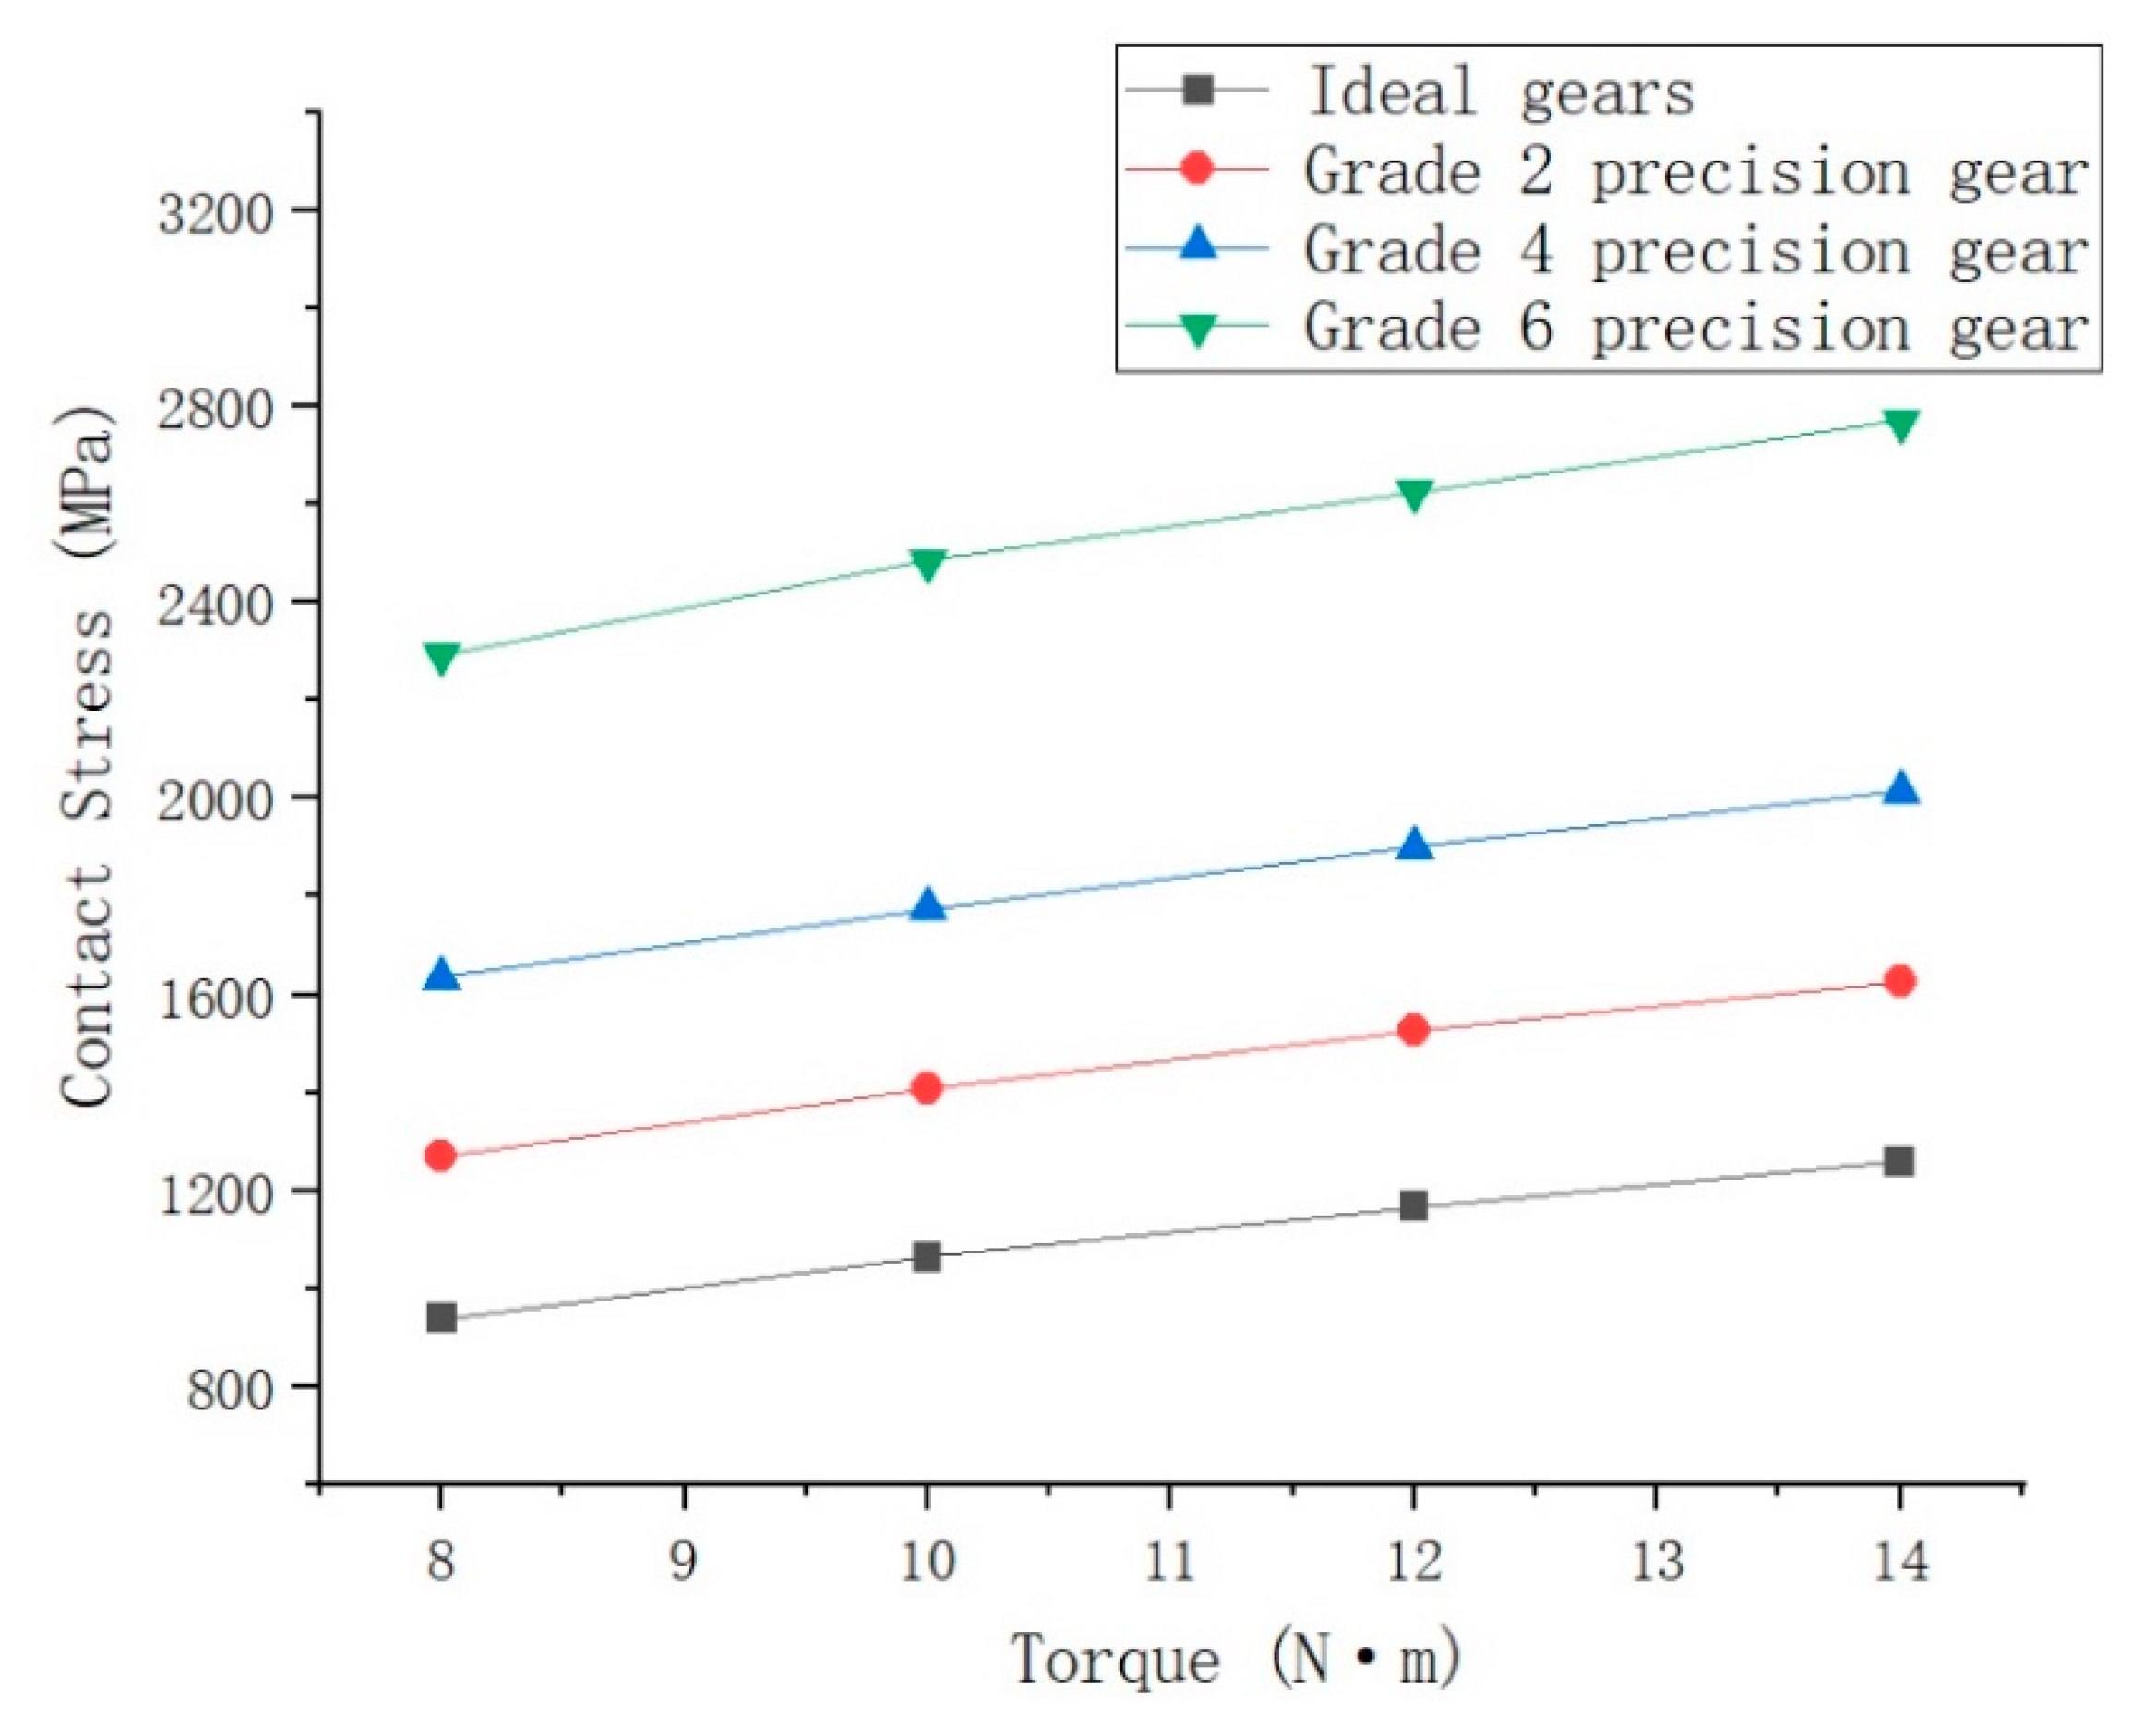
- In this paper, the FEM contact models of gears have been established and solved according to the three influence factors of TPD, ME and LCM, respectively. It is found that when there is only one single influence factor, the influence factor has a great influence on the TSCS. Compared with the ideal gear, the maximum TSCS of the gear with TPD can reach 2.45 times of that of the ideal gear, the maximum TSCS of the gear with ME can reach 1.88 times of that of the ideal gear, and the maximum TSCS of the gear with LCM can reach 1.65 times of that of the ideal gear;
- (3)
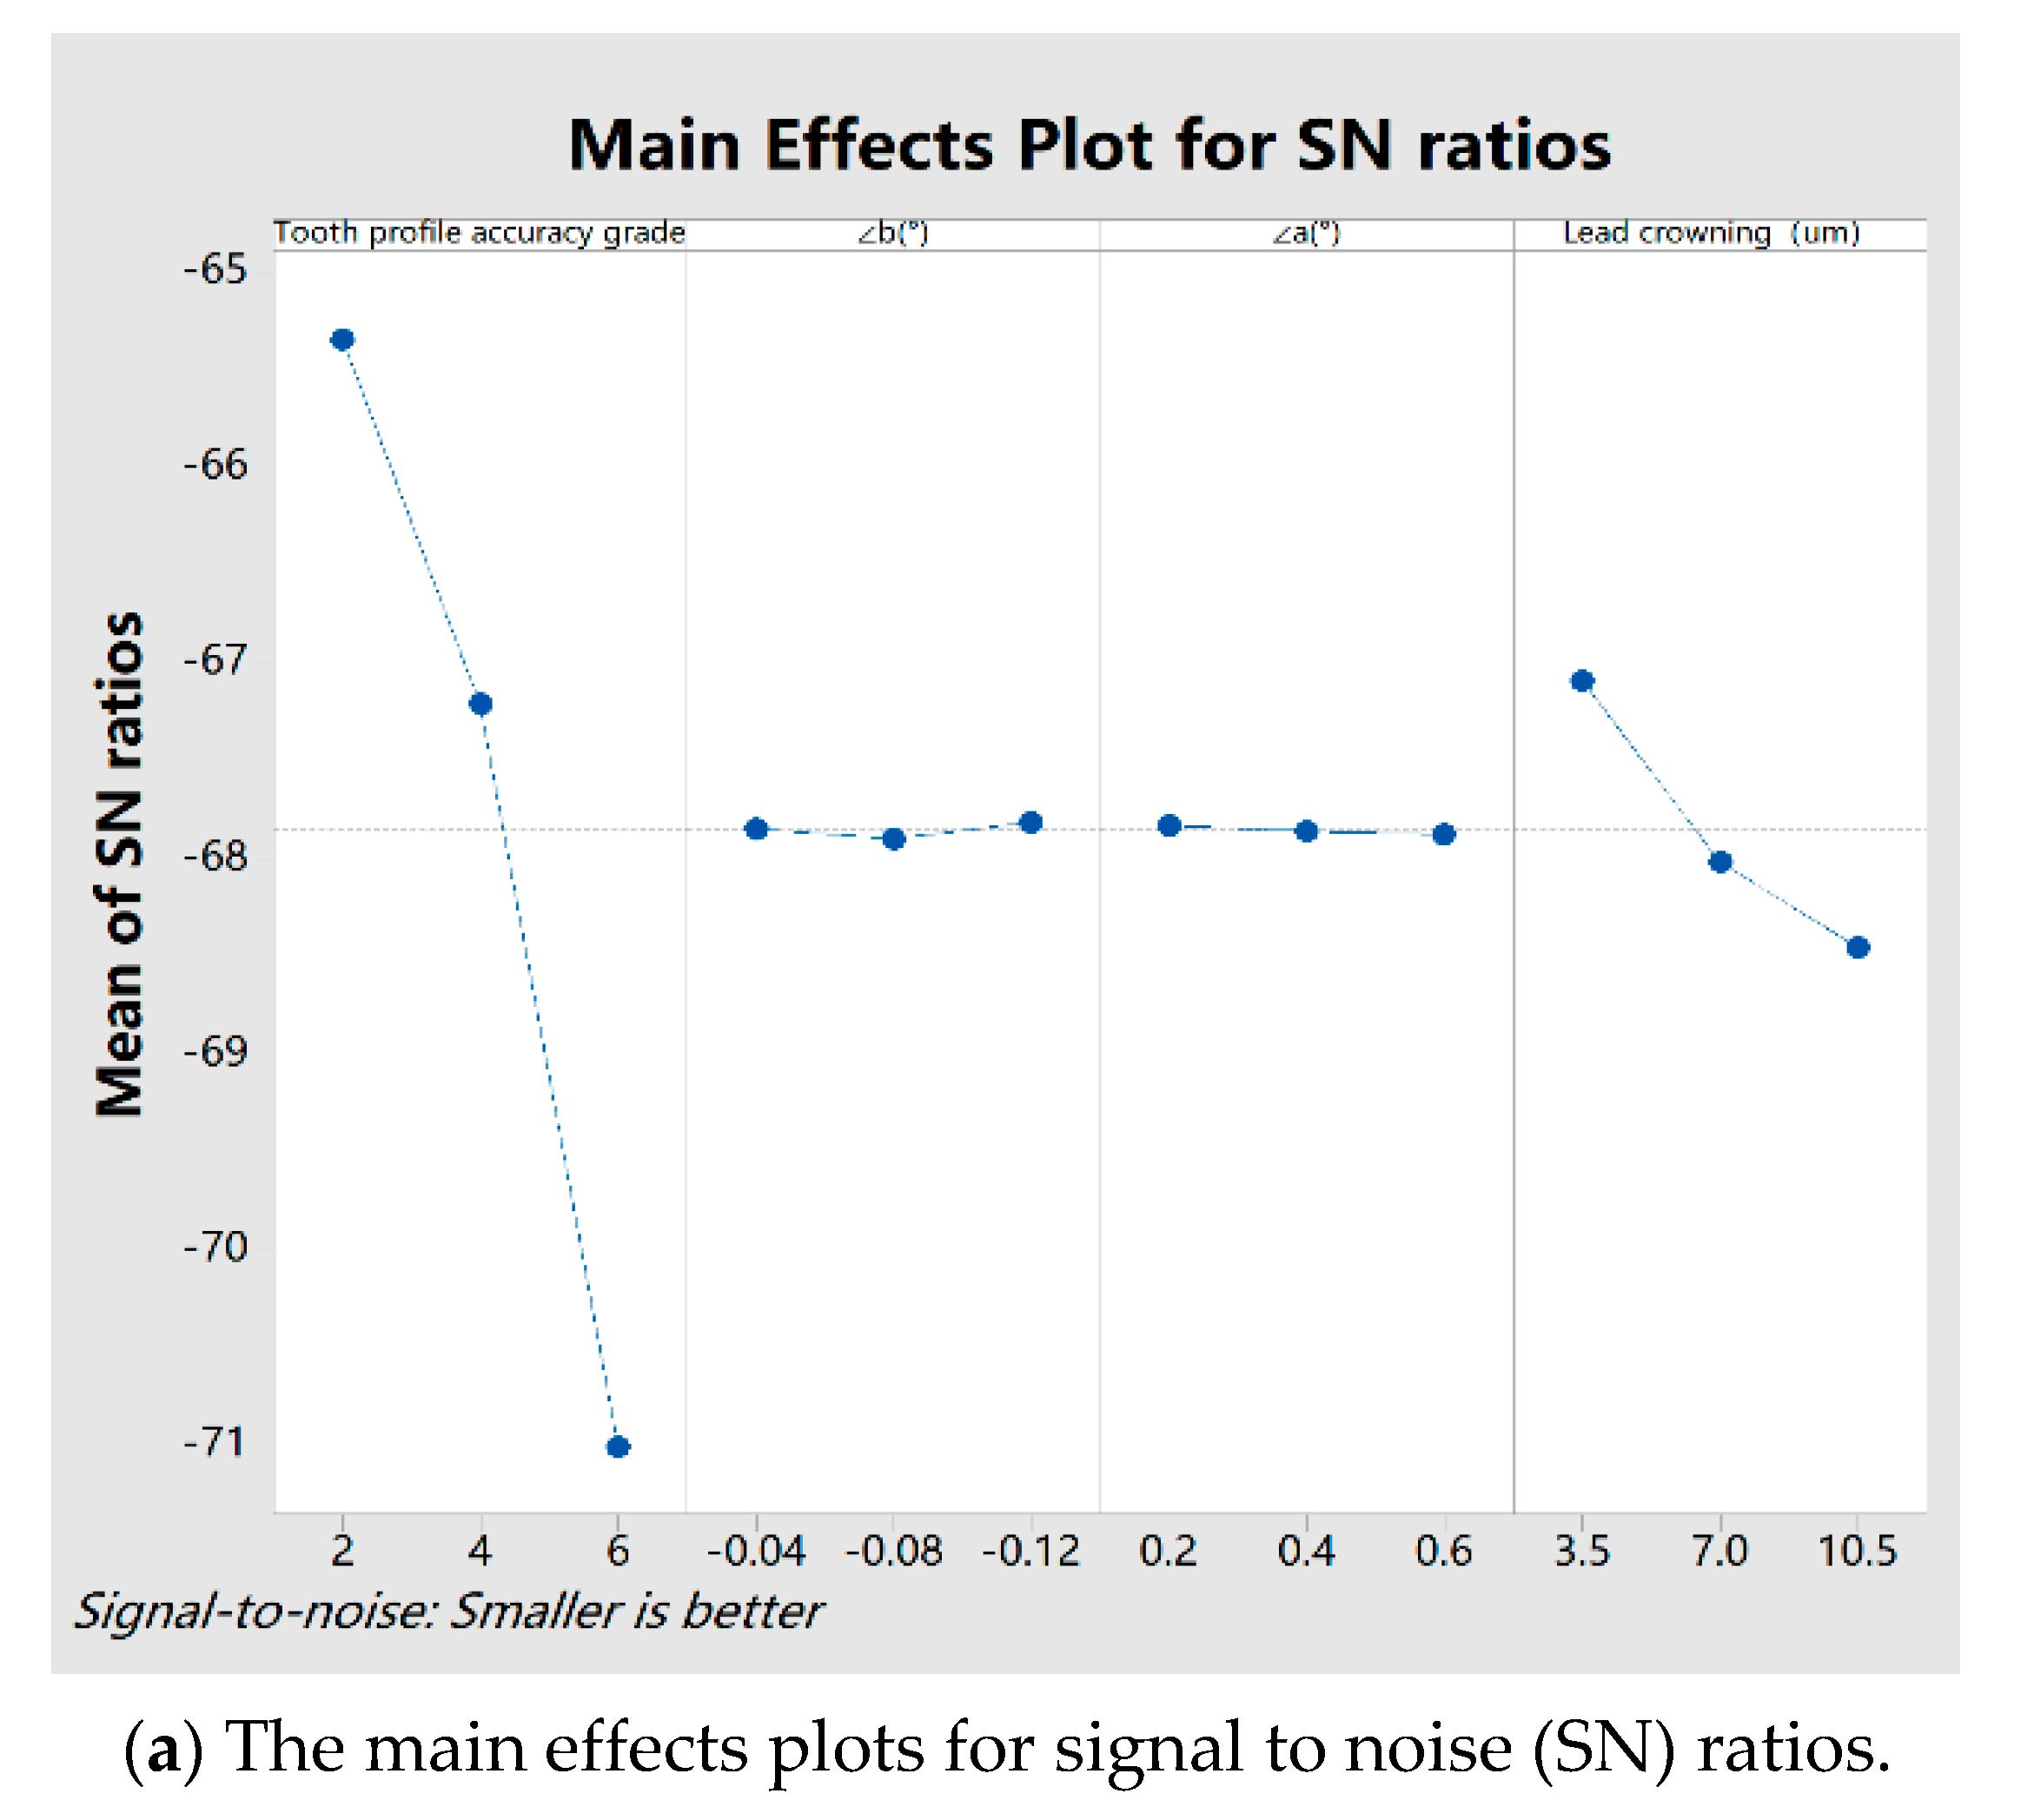
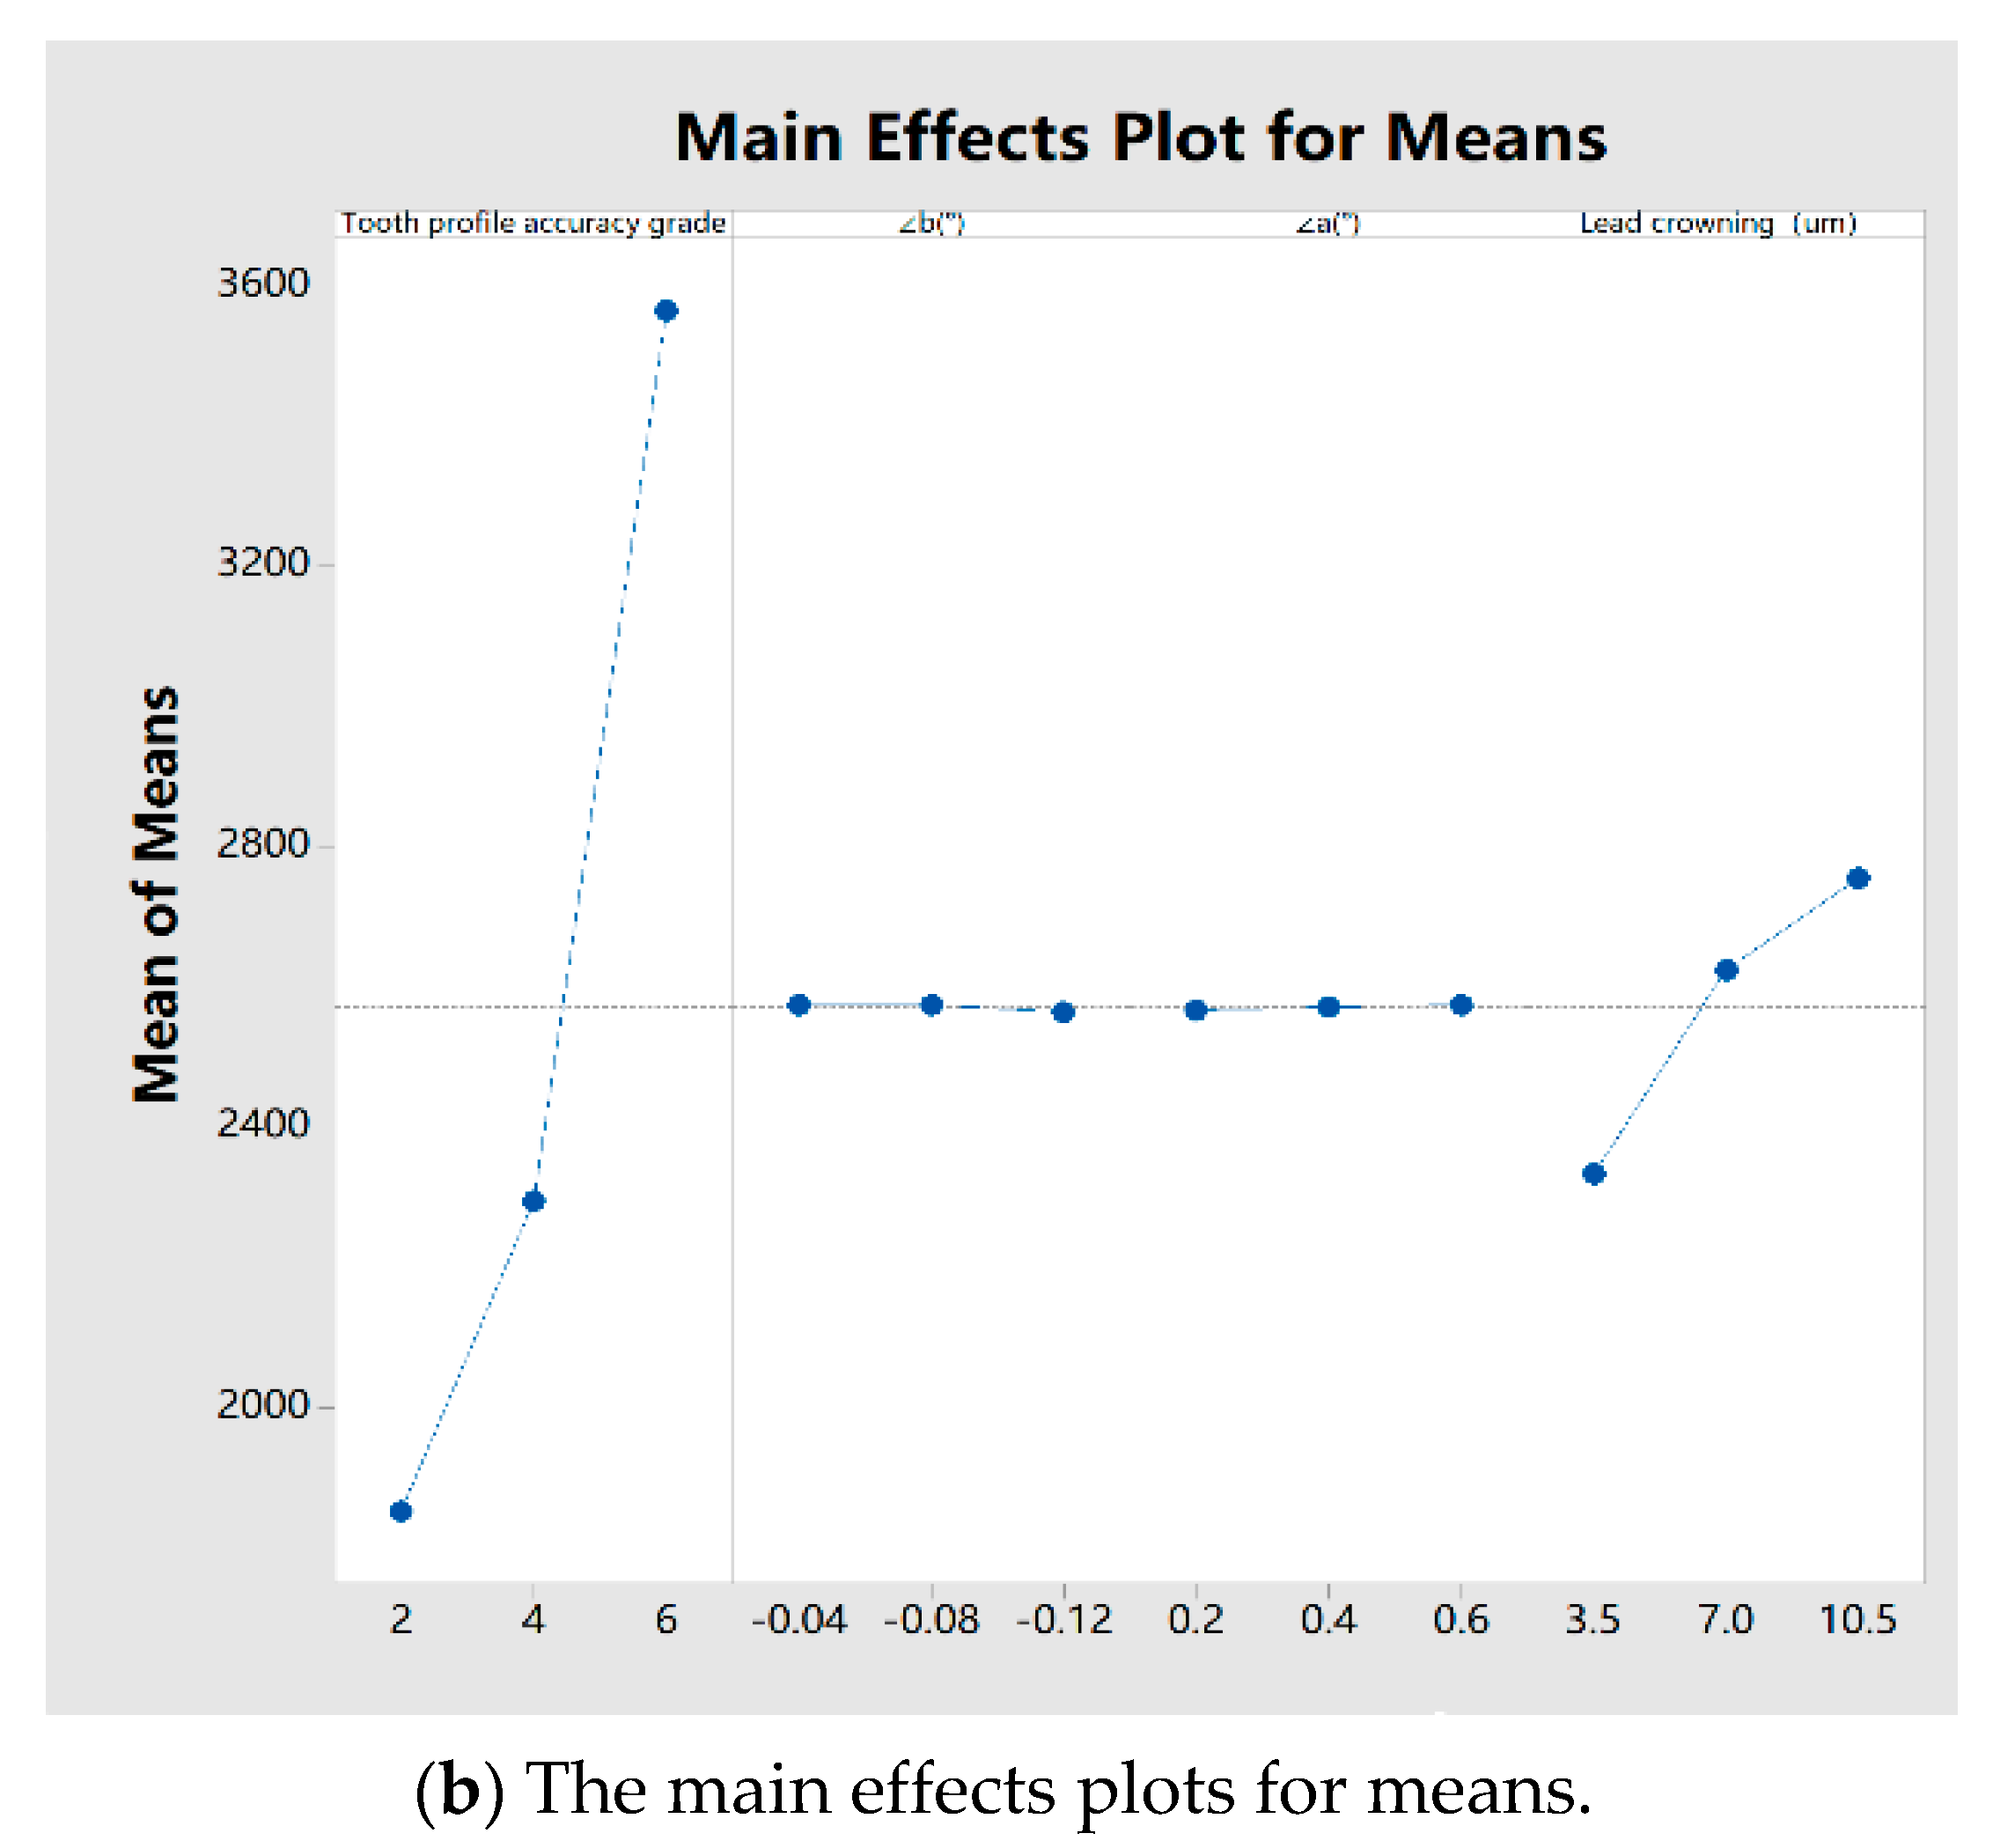
- In this paper, the Taguchi method has been used to research the influence degree of each factor on the TSCS when three factors exist at the same time. It is found that the TPD has the greatest influence on the TSCS, as the mean difference in TSCS between different grades of TPD can reach 1712 MPa. This is followed by the LCM, as the mean difference in TSCS between different LCM values can reach 421 MPa. The influence degree of ME is very limited, as the mean differences in TSCS value between different < and < are only 7 MPa and 10 MPa, respectively;
- (4)
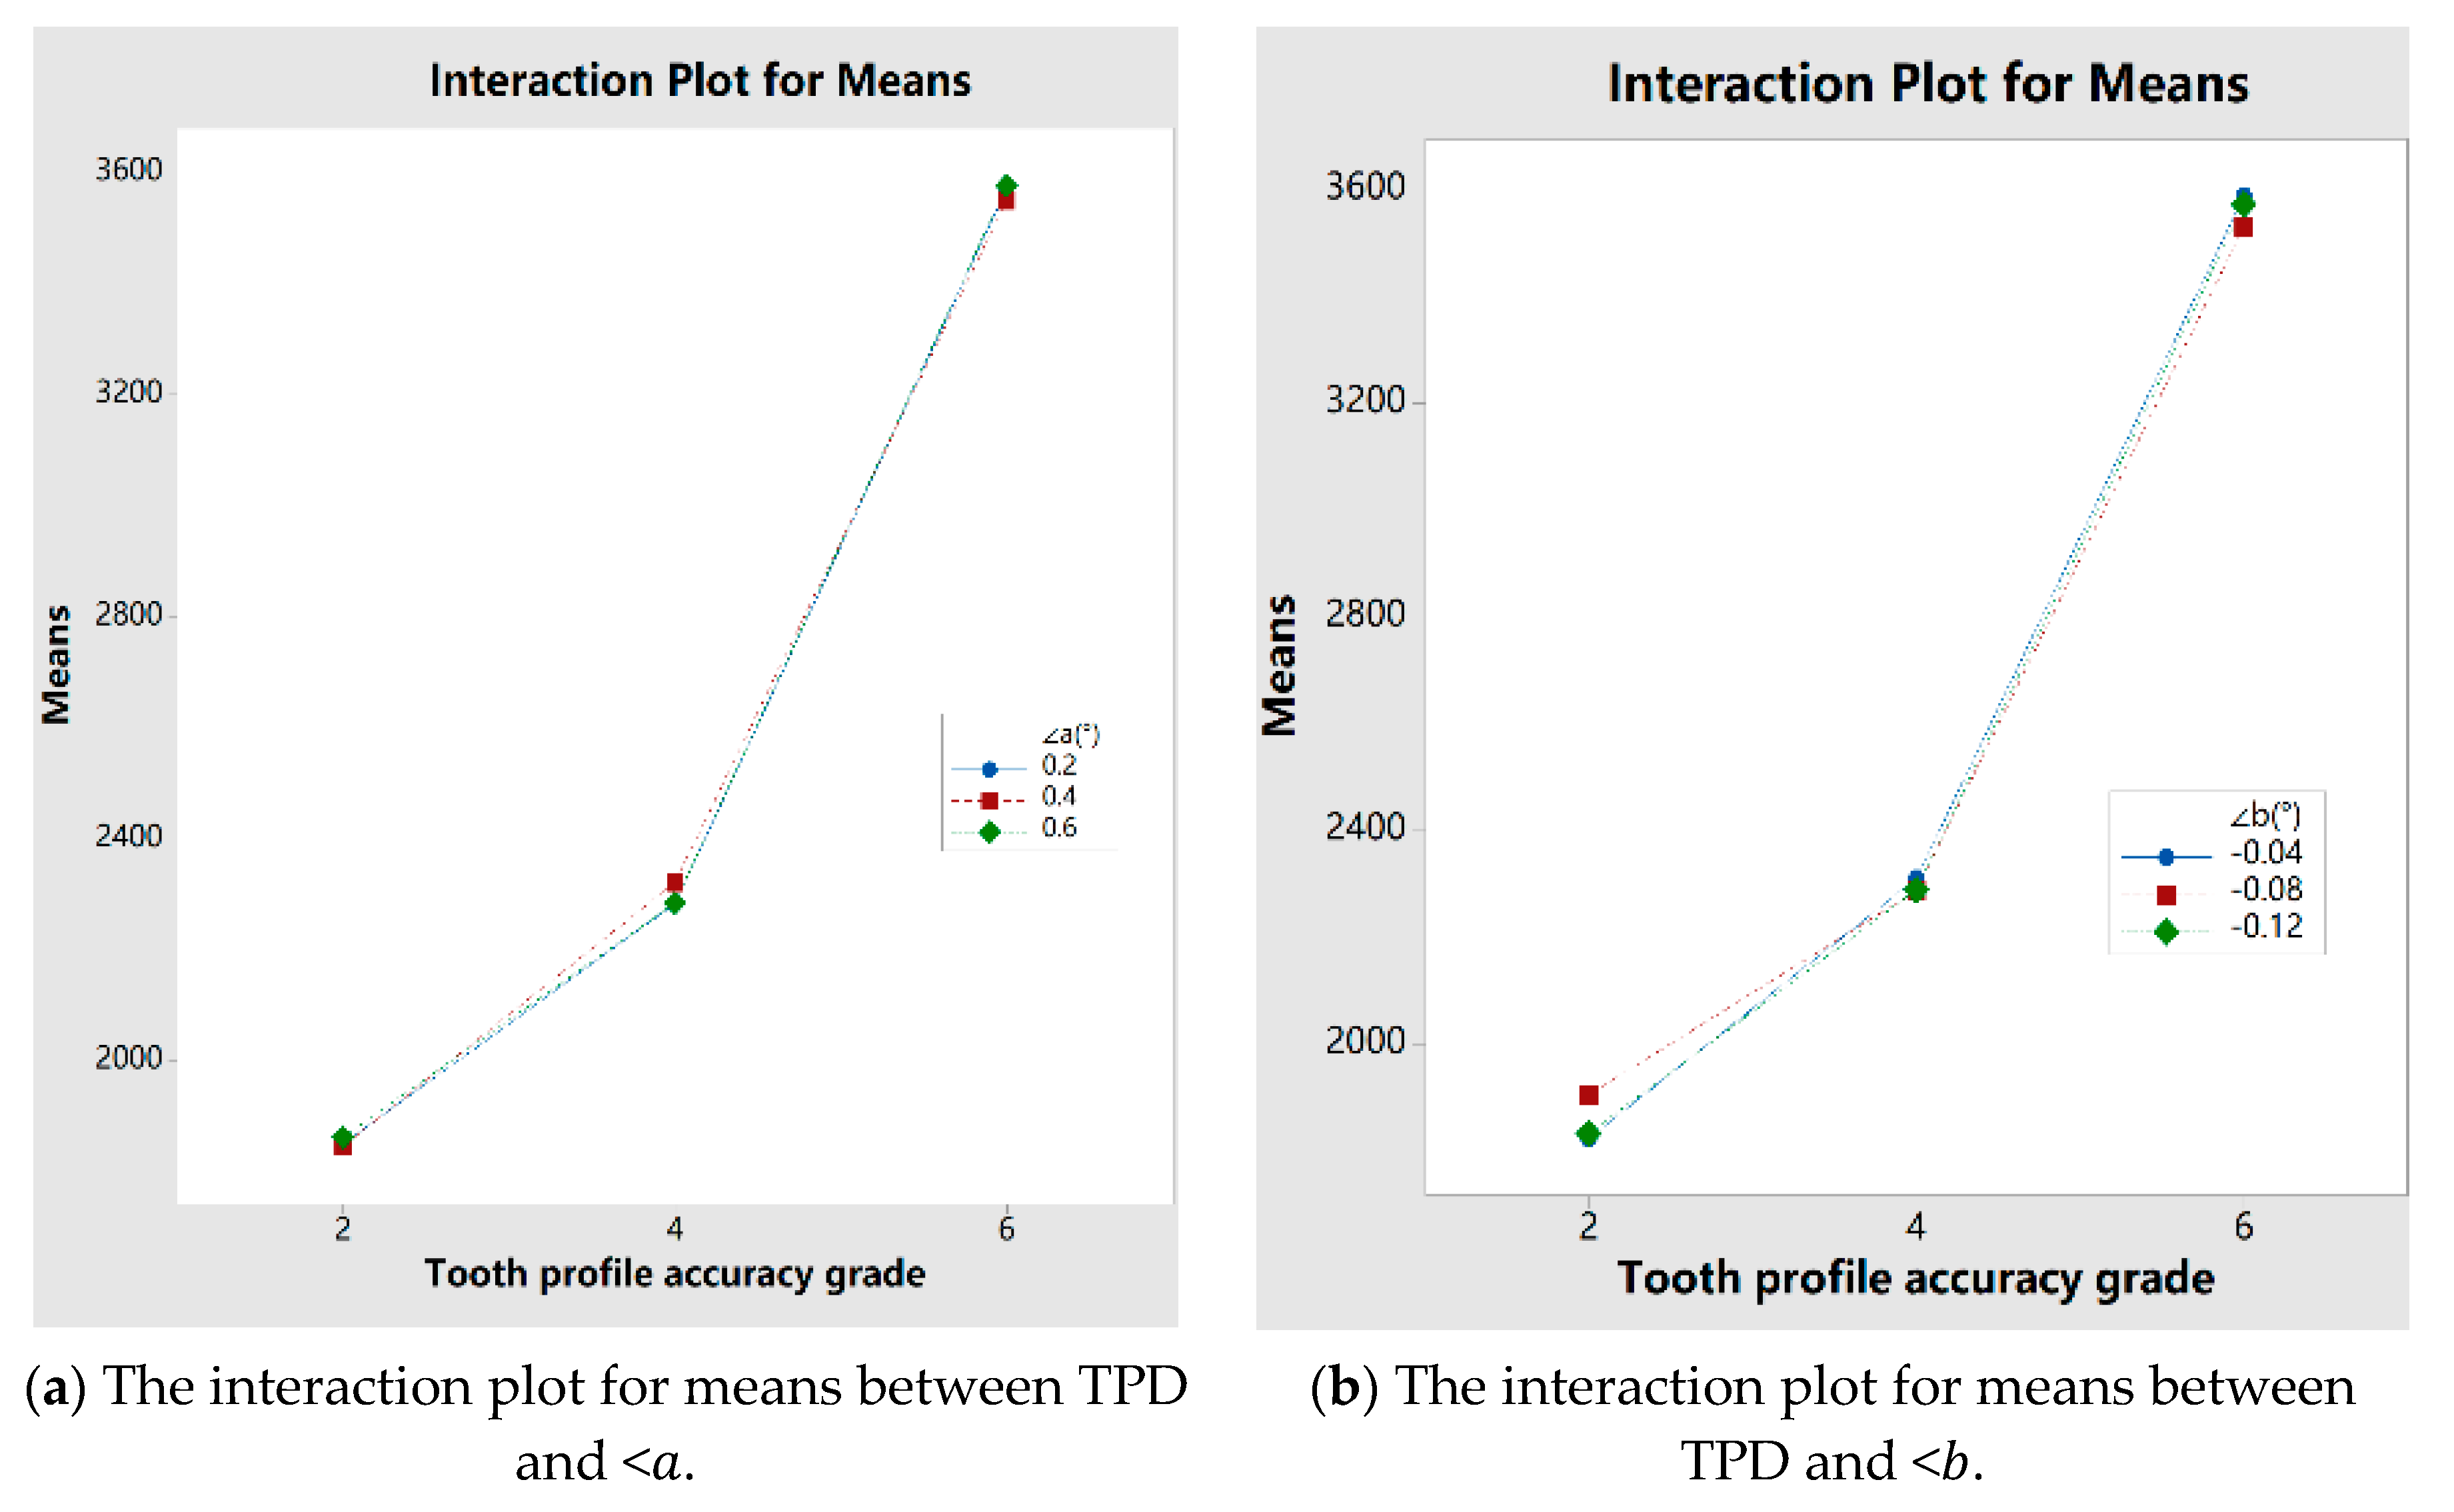
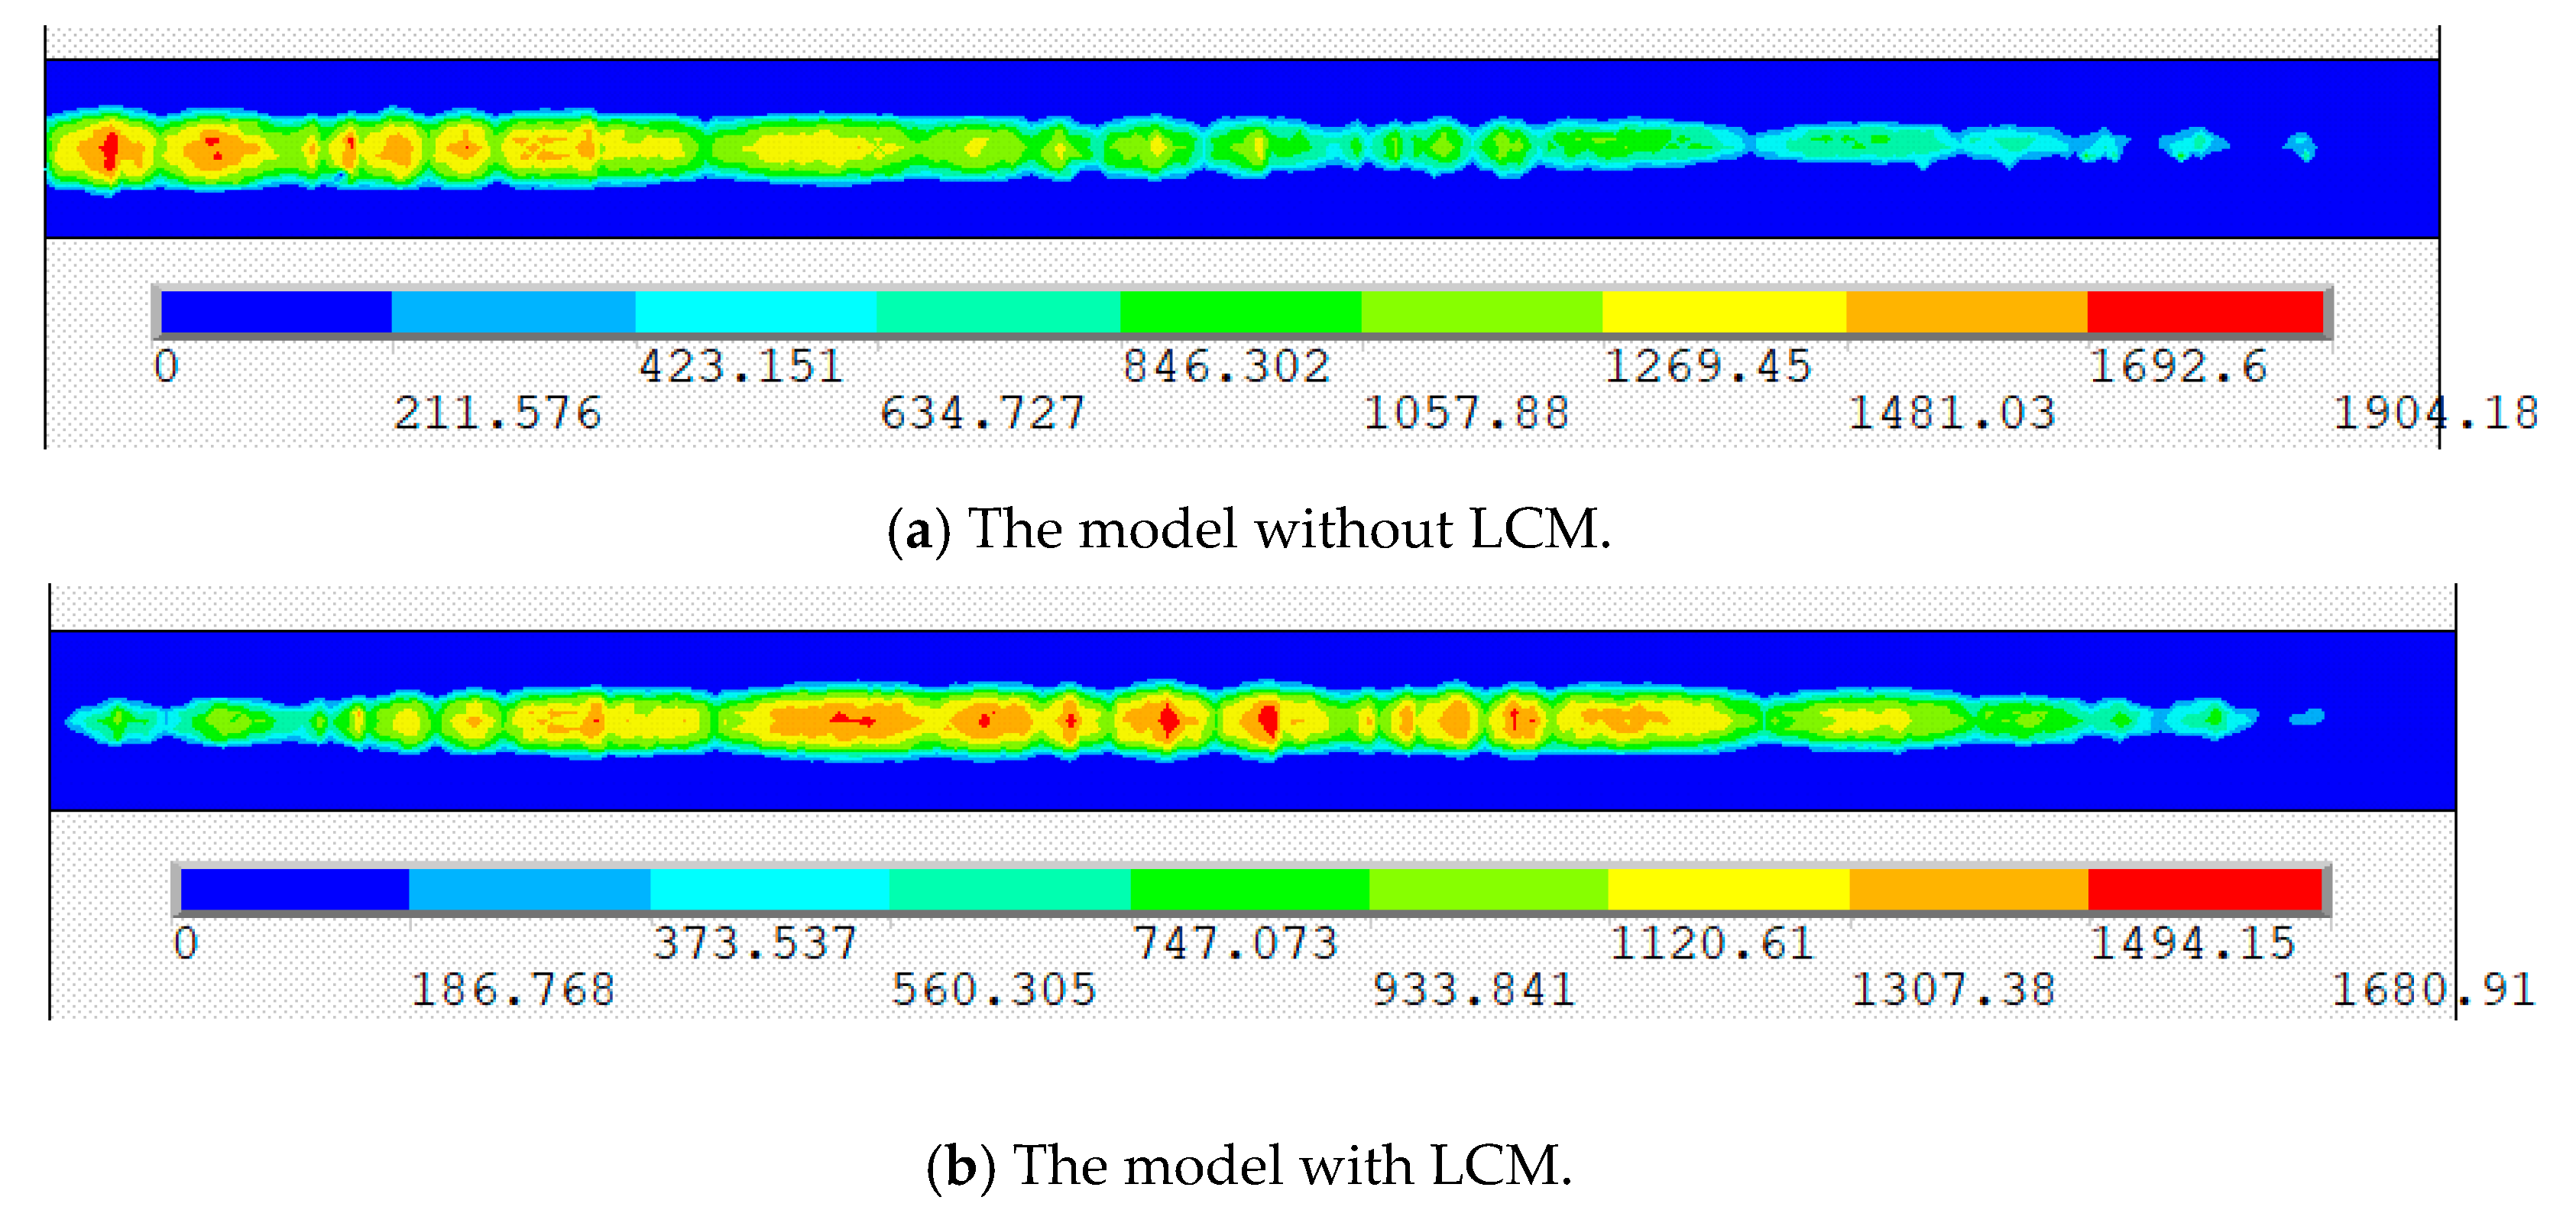
- In this paper, the interactions between the influence factors have been researched, and it is found that the interactions between the TPD and other factors are not obvious, while the interactions between the LCM, < and < are very obvious, especially the interaction between the two kinds of ME. In addition, it has been verified that the LCM can effectively alleviate the phenomenon of the edge stress concentration of TSCS caused by ME. From Figure 28, it can be found that the maximum TSCS value of the gear with LCM is 11.73% less than that of the gear without LCM;
- (5)
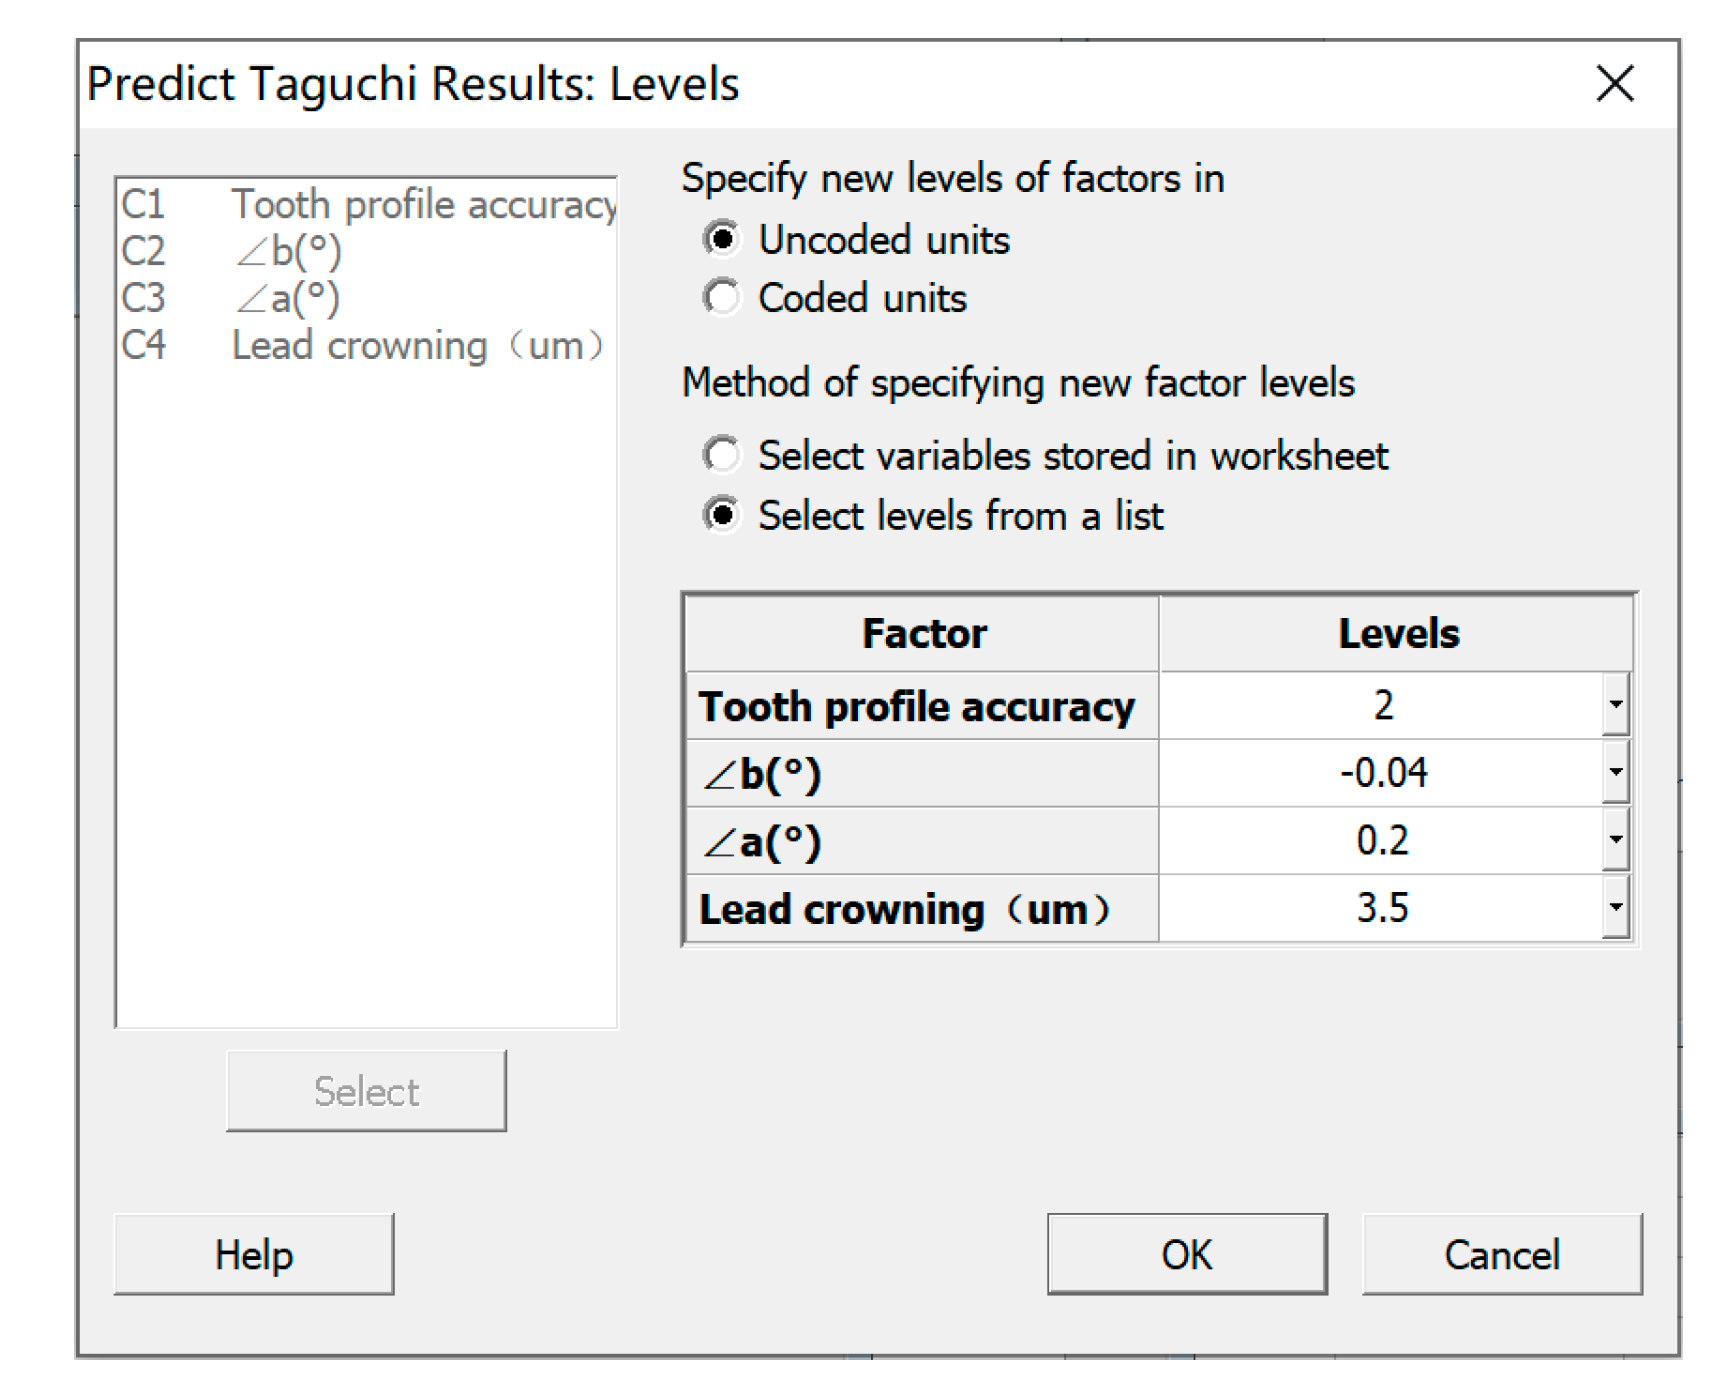
- According to the type of gear researched in this paper, through the TM, the optimal combination of control factor levels has been determined, as follows: grade 2 for the TPD, −0.12° for the <, 0.2° for the <, and 3.5 μm for the LCM quantity. The gear contact fatigue life of the optimal combination of factor levels is much longer than that of the original combination;
- (6)
- For other types of gears and different influence factors, the research method and analysis process of this paper have certain reference value.
Author Contributions
Funding
Conflicts of Interest
Abbreviations
| 3D | Three-dimensional |
| FEM | Finite element method |
| LCM | Lead crowning modifications |
| ME | Meshing errors |
| MPC | Multi-point constraint |
| TM | Taguchi method |
| TPD | Tooth profile deviations |
| TSCS | Tooth surface contact stress |
References
- Wei, J.; Lv, C.; Sun, W.; Li, X.; Wang, Y. A study on optimum design method of gear transmission system for wind turbine. Int. J. Precis. Eng. Manufact. 2013, 14, 767–778. [Google Scholar] [CrossRef]
- Li, M.; Xie, L.; Ding, L. Load sharing analysis and reliability prediction for planetary gear train of helicopter. Mechan. Mach. Theor. 2017, 115, 97–113. [Google Scholar] [CrossRef]
- ISO 6336-2: 2019. Calculation of Load Capacity of Spur and Helical Gears–Part. 2: Calculation of Surface Durability (Pitting). Available online: https://www.iso.org/standard/63821.html (accessed on 6 September 2020).
- ISO 6336-1. Calculation of Load Capacity of Spur and Helical Gears–Part. 1: Basic Principles, Introduction and General Influence Factors. Available online: https://www.iso.org/standard/63819.html (accessed on 6 September 2020).
- Li, S. Finite element analyses for contact strength and bending strength of a pair of spur gears with machining errors, assembly errors and tooth modifications. Mech. Mach. Theory 2007, 42, 88–114. [Google Scholar] [CrossRef]
- Sennba, M. Gear Errors and Strength; The Nikkan Kogyo Shimbun Press: Tokyo, Japan, 1974; pp. 70–148. (In Japanese) [Google Scholar]
- Ottewill, J.; Neild, S.A.; Wilson, R. An investigation into the effect of tooth profile errors on gear rattle. J. Sound Vib. 2010, 329, 3495–3506. [Google Scholar] [CrossRef]
- Ma, P.; Botman, M. Load Sharing in a Planetary Gear Stage in the Presence of Gear Errors and Misalignment. J. Mechan. Design 1985, 107, 4–10. [Google Scholar] [CrossRef]
- Bodas, A.; Kahraman, A. Influence of carrier and gear manufacturing errors on the static planet load sharing behavior of planetary gear sets (gear unit design and applications). Japan Soc. Mechan. Engr. 2017. [Google Scholar] [CrossRef]
- Miyoshi, Y.; Tobisawa, K.; Saiki, K. Composite analysis method of tooth contact load distribution of helical gear. In Proceedings of the ASME International Design Engrring Technical Conferences/Computers and Information in Engrring Conference, New York, NY, USA, 4–7 September 2007; pp. 173–180. [Google Scholar]
- Wang, Q.B.; Hu, P.; Zhang, Y.; Wang, Y.; Pang, X.; Tong, C. A model to determine mesh characteristics in a gear pair with tooth profile error. Adv. Mechan. Engr. 2014, 6, 1–10. [Google Scholar] [CrossRef]
- Lin, T.; He, Z. Analytical method for coupled transmission error of helical gear system with machining errors, assembly errors and tooth modifications. Mech. Syst. Signal. Process. 2017, 91, 167–182. [Google Scholar] [CrossRef]
- Li, Q.; Xie, L.; Song, J.; Li, H.; Xu, G. Research Methods and Applications of Gear Manufacturing Process Optimization. Mathem. Probl. Eng. 2019, 2019, 1–17. [Google Scholar] [CrossRef]
- Yu, B.S.; Liu, Y.Y. Improvement in phase purity and yield of hydrothermally synthesized smectite using Taguchi method. Appl. Clay Sci. 2018, 161, 103–109. [Google Scholar] [CrossRef]
- Sun, B.; Xiao, J.; Li, Z.; Ma, B.; Zhang, L.; Huang, Y.; Bai, L. An analysis of soil detachment capacity under freeze-thaw conditions using the Taguchi method. Catena 2018, 162, 100–107. [Google Scholar] [CrossRef]
- Mojtaba, F.; Abbas, N.; Sima, Z.; Mohammad, R.H. Optimization of H-shaped thin-walled energy absorber by Taguchi method and a new theoretical estimation for its energy absorption. Thin Wall. Struct. 2018, 131, 33–44. [Google Scholar]
- Ji, D.; Wei, Z.; Mazzoni, S.; Mengarelli, M.; Rajoo, S.; Zhao, J.; Pou, J.; Romagnoli, A. Thermoelectric generation for waste heat recovery: Application of a system level design optimization approach via Taguchi method. Energy Convers. Manag. 2018, 172, 507–516. [Google Scholar] [CrossRef]
- Shuting, L. Effects of misalignment error, tooth modifications and transmitted torque on tooth engagements of a pair of spur gears. Mechan. Machine Theory 2015, 83, 125–136. [Google Scholar]
- Hertz, H. On the contact of elastic solids. J. Reine Angew Math. 1882, 92, 156–171. [Google Scholar]
- ISO 1328-1. Cylindrical Gears–ISO System of Flank Tolerance Classification–Part. 1: Definitions and Allowable Values of Deviations Relevant to Flanks of Gear Teeth. Available online: https://www.iso.org/obp/ui/#iso:std:iso:1328:-1:ed-2:v1:en (accessed on 6 September 2020).


| Normal Modulus | Tooth Number | Pressure Angle | Addendum Coefficient | Clearance Coefficient | Helix Angle | Tooth Width | Modification Coefficient | Poisson Ratio | Elastic Modulus |
|---|---|---|---|---|---|---|---|---|---|
| 2 mm | 20 | 20° | 1 | 0.25 | 0° | 5 mm | 0 | 0.25 | 2.07 × 10⁵ MPa |
| Type of Main Elements | Contact Surface Element | Target Surface Element | Friction Coefficient | Material Density |
|---|---|---|---|---|
| Solid185 | Conta173 | Targe170 | 0.1 | 7.8 × 10⁻⁹ t/mm3 |
| The Maximum TSCS (MPa) | The Errors of TSCS | Time (min) | |
|---|---|---|---|
| Hertz contact theory | 1653.75 | ||
| 1676.23 | 1.36% | 75 | |
| 1682.93 | 1.76% | 9 | |
| 1693.59 | 2.41% | 6 | |
| 1754.98 | 6.12% | 4 | |
| 1712.73 | 3.57% | 6 |
| Symbol | Description | Value |
|---|---|---|
| Contact stress (MPa) | 1657.28 | |
| Single pair tooth contact factors for the wheel | 1.0 | |
| Zone factor | 2.5 | |
| Elasticity factor | 187.5 | |
| Contact ratio factor | 1.0 | |
| Helix angle factor | 1.0 | |
| Tangential force at the working pitch circle (N) | 1250 | |
| Diameter (mm) | 40 | |
| b | Face width (mm) | 5 |
| u | Gear ratio | 1.0 |
| Application factor | 1.0 | |
| Mesh load factor | 1.0 | |
| Dynamic factor | 1.0 | |
| Face load factor | 1.0 | |
| Transverse load factor | 1.0 |
| Pitch Circle Diameter (mm) | Module (mm) | Precision Grade | |||||||
|---|---|---|---|---|---|---|---|---|---|
| 0 | 1 | 2 | 3 | 4 | 5 | 6 | 7 | ||
| 20 d 50 | 0.5 m 2 | 0.9 μm | 1.2 μm | 1.8 μm | 2.5 μm | 3.5 μm | 5.0 μm | 7.0 μm | 10.0 μm |
| Precision Grades | Torques (N·m) | |||||||
|---|---|---|---|---|---|---|---|---|
| 8 | Comparison with Ideal Gears | 10 | Comparison with Ideal Gears | 12 | Comparison with Ideal Gears | 14 | Comparison with Ideal Gears | |
| Ideal | 937.19 | - | 1063.94 | - | 1166.77 | - | 1260.01 | - |
| 2 | 1270.99 | 35.62% | 1409.09 | 32.44% | 1527.70 | 30.93% | 1627.02 | 29.13% |
| 4 | 1635.07 | 74.47% | 1775.86 | 66.91% | 1902.75 | 63.08% | 2015.56 | 59.96% |
| 6 | 2294.29 | 144.81% | 2485.38 | 133.60% | 2627.90 | 125.23% | 2770.99 | 119.91% |
| Torques (N·m) | ||||||||
|---|---|---|---|---|---|---|---|---|
| 8 | Comparison with Ideal Gears | 10 | Comparison with Ideal Gears | 12 | Comparison with Ideal Gears | 14 | Comparison with Ideal Gears | |
| Ideal | 937.19 | - | 1063.94 | - | 1166.77 | - | 1260.01 | - |
| a = 0.2 | 1266.82 | 35.17% | 1343.96 | 26.32% | 1412.22 | 21.04% | 1499.08 | 18.97% |
| a = 0.4 | 1530.68 | 63.33% | 1615.63 | 51.85% | 1692.28 | 45.04% | 1755.10 | 39.29% |
| a = 0.6 | 1769.67 | 88.83% | 1853.45 | 74.21% | 1949.32 | 67.07% | 2049.15 | 62.63% |
| b = −0.04 | 1081.01 | 15.35% | 1182.92 | 11.18% | 1233.93 | 5.76% | 1314.95 | 4.36% |
| b = −0.08 | 1283.69 | 36.97% | 1399.51 | 31.54% | 1489.06 | 27.62% | 1518.91 | 24.54% |
| b = −0.12 | 1431.54 | 52.75% | 1520.48 | 42.91% | 1588.72 | 36.16% | 1664.76 | 32.12% |
| LCM Quantity (μm) | Torques (N·m) | |||||||
|---|---|---|---|---|---|---|---|---|
| 8 | Comparison with Ideal Gears | 10 | Comparison with Ideal Gears | 12 | Comparison with Ideal Gears | 14 | Comparison with Ideal Gears | |
| Ideal | 937.19 | - | 1063.94 | - | 1166.77 | - | 1260.01 | - |
| 2 | 1285.64 | 37.18% | 1394.60 | 31.08% | 1495.83 | 28.20% | 1587.48 | 25.99% |
| 4 | 1444.08 | 54.09% | 1559.23 | 46.55% | 1668.85 | 43.03% | 1754.07 | 39.21% |
| 6 | 1541.64 | 64.50% | 1660.51 | 56.07% | 1768.54 | 51.58% | 1851.27 | 46.93% |
| Control Factors | TPD | LCM | ||
|---|---|---|---|---|
| Level 1 | Grade 2 | 0.2° | −0.04° | 3.5 μm |
| Level 2 | Grade 4 | 0.4° | −0.08° | 7 μm |
| Level 3 | Grade 6 | 0.6° | −0.12° | 10.5 μm |
| Serial Number | Tooth Profile Precision Grade | (°) | (°) | Lead Crowning (μm) |
|---|---|---|---|---|
| 1 | Grade 2 | −0.04 | 0.2 | 3.5 |
| 2 | Grade 2 | −0.04 | 0.4 | 7.0 |
| 3 | Grade 2 | −0.04 | 0.6 | 10.5 |
| 4 | Grade 4 | −0.08 | 0.2 | 3.5 |
| 5 | Grade 4 | −0.08 | 0.4 | 7.0 |
| 6 | Grade 4 | −0.08 | 0.6 | 10.5 |
| 7 | Grade 6 | −0.12 | 0.2 | 3.5 |
| 8 | Grade 6 | −0.12 | 0.4 | 7.0 |
| 9 | Grade 6 | −0.12 | 0.6 | 10.5 |
| 10 | Grade 4 | −0.12 | 0.2 | 7.0 |
| 11 | Grade 4 | −0.12 | 0.4 | 10.5 |
| 12 | Grade 4 | −0.12 | 0.6 | 3.5 |
| 13 | Grade 6 | −0.04 | 0.2 | 7.0 |
| 14 | Grade 6 | −0.04 | 0.4 | 10.5 |
| 15 | Grade 6 | −0.04 | 0.6 | 3.5 |
| 16 | Grade 2 | −0.08 | 0.2 | 7.0 |
| 17 | Grade 2 | −0.08 | 0.4 | 10.5 |
| 18 | Grade 2 | −0.08 | 0.6 | 3.5 |
| 19 | Grade 6 | −0.08 | 0.2 | 10.5 |
| 20 | Grade 6 | −0.08 | 0.4 | 3.5 |
| 21 | Grade 6 | −0.08 | 0.6 | 7.0 |
| 22 | Grade 2 | −0.12 | 0.2 | 10.5 |
| 23 | Grade 2 | −0.12 | 0.4 | 3.5 |
| 24 | Grade 2 | −0.12 | 0.6 | 7.0 |
| 25 | Grade 4 | −0.04 | 0.2 | 10.5 |
| 26 | Grade 4 | −0.04 | 0.4 | 3.5 |
| 27 | Grade 4 | −0.04 | 0.6 | 7.0 |
| Serial Number | Maximum TSCS (MPa) | Serial Number | Maximum TSCS (MPa) | Serial Number | Maximum TSCS (MPa) |
|---|---|---|---|---|---|
| 1 | 1680.91 | 10 | 2272.12 | 19 | 3888.53 |
| 2 | 1854.25 | 11 | 2459.15 | 20 | 3070.89 |
| 3 | 1931.67 | 12 | 2135.32 | 21 | 3636.82 |
| 4 | 2118.22 | 13 | 3719.14 | 22 | 1962.06 |
| 5 | 2322.13 | 14 | 3819.85 | 23 | 1683.50 |
| 6 | 2420.97 | 15 | 3229.20 | 24 | 1850.24 |
| 7 | 3102.55 | 16 | 1907.33 | 25 | 2454.60 |
| 8 | 3753.72 | 17 | 1999.51 | 26 | 2177.90 |
| 9 | 3861.61 | 18 | 1806.02 | 27 | 2297.35 |
| Level | Tooth Profile Accuracy | Lead Crowning (μm) | ||||||
|---|---|---|---|---|---|---|---|---|
| SN Ratios | Means | SN Ratios | Means | SN Ratios | Means | SN Ratios | Means | |
| 1 | −65.34 | 1853 | −67.85 | 2574 | −67.83 | 2567 | −67.09 | 2334 |
| 2 | −67.20 | 2295 | −67.89 | 2574 | −67.85 | 2571 | −68.01 | 2624 |
| 3 | −71.01 | 3565 | −67.81 | 2564 | −67.87 | 2574 | −68.45 | 2755 |
| Delta | 5.66 | 1712 | 0.08 | 10 | 0.04 | 7 | 1.36 | 421 |
| Rank | 1 | 3 | 4 | 2 | ||||
| Table | LCM (μm) | TSCS (MPa) | ||
|---|---|---|---|---|
| 2 | −0.04 | 0.2 | 3.5 | 1614.97 |
| 0.4 | 1618.91 | |||
| 0.6 | 1622.06 | |||
| −0.08 | 0.2 | 1615.59 | ||
| 0.4 | 1619.53 | |||
| 0.6 | 1622.67 | |||
| −0.12 | 0.2 | 1605.57 | ||
| 0.4 | 1609.51 | |||
| 0.6 | 1612.66 |
Publisher’s Note: MDPI stays neutral with regard to jurisdictional claims in published maps and institutional affiliations. |
© 2020 by the authors. Licensee MDPI, Basel, Switzerland. This article is an open access article distributed under the terms and conditions of the Creative Commons Attribution (CC BY) license (http://creativecommons.org/licenses/by/4.0/).
Share and Cite
Li, Q.; Xie, L. Analysis and Optimization of Tooth Surface Contact Stress of Gears with Tooth Profile Deviations, Meshing Errors and Lead Crowning Modifications Based on Finite Element Method and Taguchi Method. Metals 2020, 10, 1370. https://doi.org/10.3390/met10101370
Li Q, Xie L. Analysis and Optimization of Tooth Surface Contact Stress of Gears with Tooth Profile Deviations, Meshing Errors and Lead Crowning Modifications Based on Finite Element Method and Taguchi Method. Metals. 2020; 10(10):1370. https://doi.org/10.3390/met10101370
Chicago/Turabian StyleLi, Qiang, and Liyang Xie. 2020. "Analysis and Optimization of Tooth Surface Contact Stress of Gears with Tooth Profile Deviations, Meshing Errors and Lead Crowning Modifications Based on Finite Element Method and Taguchi Method" Metals 10, no. 10: 1370. https://doi.org/10.3390/met10101370