On the Impact of Microsegregation Model on the Thermophysical and Solidification Behaviors of a Large Size Steel Ingot

Abstract
:1. Introduction
2. Microsegregation Models
- Straight liquidus and solidus lines of the concerned phase diagram (i.e., a constant partition coefficient k connecting the slope of solidus and liquidus together);
- A constant diffusion coefficient;
- A plate-like or cylindrical dendrite geometry;
- A single phase in the solid (an abrupt occurrence of δ-ferrite/γ-austenite transformation);
- A parabolic () or linear local solid/liquid interface advance velocity ().
3. Material and Methods
3.1. Experimental and Modeling Processes
3.2. Determination of Fourier Number α
3.3. Determination of Thermodynamic Properties
4. Results and Discussions
4.1. SDAS and Back-Diffusion Parameter
4.2. Impact of Microsegregation Model on Thermophysical Properties
4.3. Impact of Microsegregation Model on Solidification Behavior
5. Conclusions
Author Contributions
Funding
Acknowledgments
Conflicts of Interest
References
- Pickering, E.J. Macrosegregation in steel ingots: The applicability of modelling and characterisation techniques. ISIJ Int. 2013, 53, 935–949. [Google Scholar] [CrossRef] [Green Version]
- Wolczyski, W.; Ivanwa, A.A.; Kwapisinski, P. Mathematical prediction of brass/steel ingot structure. Sci. J. Marit. Univ. Szczec. 2018, 56, 47–54. [Google Scholar]
- Wolczyski, W.; Ivanwa, A.A.; Kwapisinski, P. On consonance between a mathematical method for the CET prediction and constrained/unconstrained solidification. Procedia Manuf. 2019, 30, 459–466. [Google Scholar] [CrossRef]
- Guan, R.; Ji, C.; Zhu, M.; Deng, S. Numerical simulation of V-shaped segregation in continuous casting blooms based on a microsegregation model. Metall. Mater. Trans. B 2018, 49, 2571–2583. [Google Scholar] [CrossRef]
- Fridberg, J.; Torndahl, L.E.; Hillert, M. Diffusion in iron. Jernkont. Ann. 1969, 153, 263–276. [Google Scholar]
- Smith, W.F.; Hashemi, J. Foundations of Materials Science and Engineering, 4th ed.; McGraw-Hill: New York, NY, USA, 2006. [Google Scholar]
- Scheil, E.; Metallk, Z. Bemerkungen zur Schichtkristallbildung. Z. Met. 1942, 34, 70–72. [Google Scholar]
- Xiong, M.; Kuznetsov, A.V. Comparison between Lever and Scheil Rules for modeling of microporosity formation during solidification. Flow Turbul. Combust. 2001, 67, 305–323. [Google Scholar] [CrossRef]
- Schaffnit, P.; Stallybrass, C.; Konrad, J.; Stein, F.; Weinberg, M. A Scheil-Gulliver model dedicated to the solidification of steel. Calphad 2015, 48, 184–188. [Google Scholar] [CrossRef]
- Kozeschnik, E.; Rindler, W.; Buchmayr, B. Scheil–Gulliver simulation with partial redistribution of fast diffusers and simultaneous solid–solid phase transformations. Int. J. Mater. Res. 2007, 98, 826–831. [Google Scholar] [CrossRef]
- Won, Y.M.; Thomas, B.G. Simple model of microsegregation during solidification of steels. Metall. Mater. Trans. A 2001, 32, 1755–1767. [Google Scholar] [CrossRef]
- Vandersluis, E.; Ravindran, C. Comparison of measurement methods for secondary dendrite arm spacing. Metallogr. Microstruct. Anal. 2017, 6, 89–94. [Google Scholar] [CrossRef]
- Kurz, W.; Fischer, D.J. Fundamentals of Solidification; Trans Tech Publications: Aedermannsdorf, Switzerland, 1989. [Google Scholar]
- Flemings, M.C. Solidification Processing. Metall. Trans. 1974, 5, 2121–2134. [Google Scholar] [CrossRef]
- Clyne, T.W.; Kurz, W. Solute redistribution during solidification with rapid solid state diffusion. Metall. Trans. A 1985, 12, 965–971. [Google Scholar] [CrossRef]
- Kobayashi, S. A mathermatical model for solute redistribution during dendritic solidification. Trans. ISIJ 1988, 28, 535–542. [Google Scholar] [CrossRef]
- Thercast 8.2®; Transvalor S.A.: Sophia Antipolis CEDEX, France, 2012.
- Rutskii, D.V.; Gamanyuk, S.B.; Zyuban, N.A.; Petrova, V.F.; Palatkina, L.V. Effect of liquid-solid pouring on the as-cast structure and the distribution of non-metallic inclusions in a 24.2-t steel 38KhN3MFA ingot. Russ. Metall. (Met.) 2017, 2017, 376–383. [Google Scholar] [CrossRef]
- Abramoff, M.D.; Magalhaes, P.J.; Ram, S.J. Image processing with ImageJ. Biophotonics Int. 2004, 11, 36–42. [Google Scholar]
- Zhang, C.; Shahriari, D.; Loucif, A.; Melkonyan, H.; Jahazi, M. Influence of thermomechanical shrinkage on macrosegregation during solidification of a large-sized high-strength steel ingot. Int. J. Adv. Manuf. Technol. 2018, 99, 3035–3048. [Google Scholar] [CrossRef]
- Zhang, C.; Loucif, A.; Jahazi, M.; Tremblay, R.; Lapierre, L.P. On the Effect of Filling Rate on Positive Macrosegregation Patterns in Large Size Cast Steel Ingots. Appl. Sci. 2018, 8, 1878. [Google Scholar] [CrossRef] [Green Version]
- Meng, Y.; Thomas, B.G. Heat Transfer and solidification model of continuous slab casting: CON1D. Metall. Mater. Trans. B 2003, 34, 685–705. [Google Scholar] [CrossRef]
- Andersson, J.O.; Helander, T.; Höglund, L.; Shi, P.F.; Sundman, B. Thermo-Calc & DICTRA, computational tools for materials science. Calphad 2002, 26, 273–321. [Google Scholar]
- Mietinen, J.; Louhenkilpi, S. Calculation of Thermophysical properties of carbon and low alloyed steels for modeling of solidification processes. Metall. Mater. Trans. B 1994, 25, 909–916. [Google Scholar] [CrossRef]
- Campbell, J. Complete Casting Handbook—Metal Casting Processes, Metallurgy, Techniques and Design, 1st ed.; Butterworth-Heinemann: Waltham, MA, USA, 2011; pp. 119–269. [Google Scholar]
- Schneider, M.C.; Beckermann, C. Formation of macrosegregation by multicomponent thermosolutal convection during the solidification of steel. Metall. Mater. Trans. A 1995, 26, 2373–2388. [Google Scholar] [CrossRef]
- Wolcznski, W. Nature of segregation in the steel static and brass continuously cast ingots. Arch. Metall. Mater. 2018, 63, 1915–1922. [Google Scholar]
- Wolcznski, W. Back-diffusion in crystal growth. Peritectics. Arch. Metall. Mater. 2015, 60, 2409–2414. [Google Scholar] [CrossRef]
- Wolcznski, W. Back-diffusion in crystal growth. Eutectics. Arch. Metall. Mater. 2015, 60, 2403–2407. [Google Scholar] [CrossRef]
- Himemiya, T.; Wolcznski, W. Solidification path and solute redistributiuon of an iron-based multi-component alloy with solute diffusion in the solid. Mater. Trans. 2002, 43, 2890–2896. [Google Scholar] [CrossRef]


| Microsegregation Model | Solute Concentration at the Solid/Liquid Interface ωS | Solid Fraction fS |
|---|---|---|
| Lever Rule | ||
| Scheil-Gulliver Model | ||
| Brody-Flemings Model | ||
| Clyne-Kurz Model | ||
| Kobayashi-Ohnaka Model |
| Steel/Regions | C | Si | Mn | S | Cr | Mo | P | Ni | Fe |
|---|---|---|---|---|---|---|---|---|---|
| Nominal | 0.36 | 0.4 | 0.85 | 0.0023 | 1.82 | 0.45 | 0.01 | 0.16 | Balance |
| Region 1 | 0.37 | 0.4 | 0.86 | 0.001 | 1.92 | 0.44 | 0.013 | 0.17 | Balance |
| Region 2 | 0.38 | 0.4 | 0.86 | 0.001 | 1.93 | 0.45 | 0.014 | 0.17 | Balance |
| Region 3 | 0.44 | 0.42 | 0.86 | 0.001 | 1.89 | 0.44 | 0.015 | 0.17 | Balance |
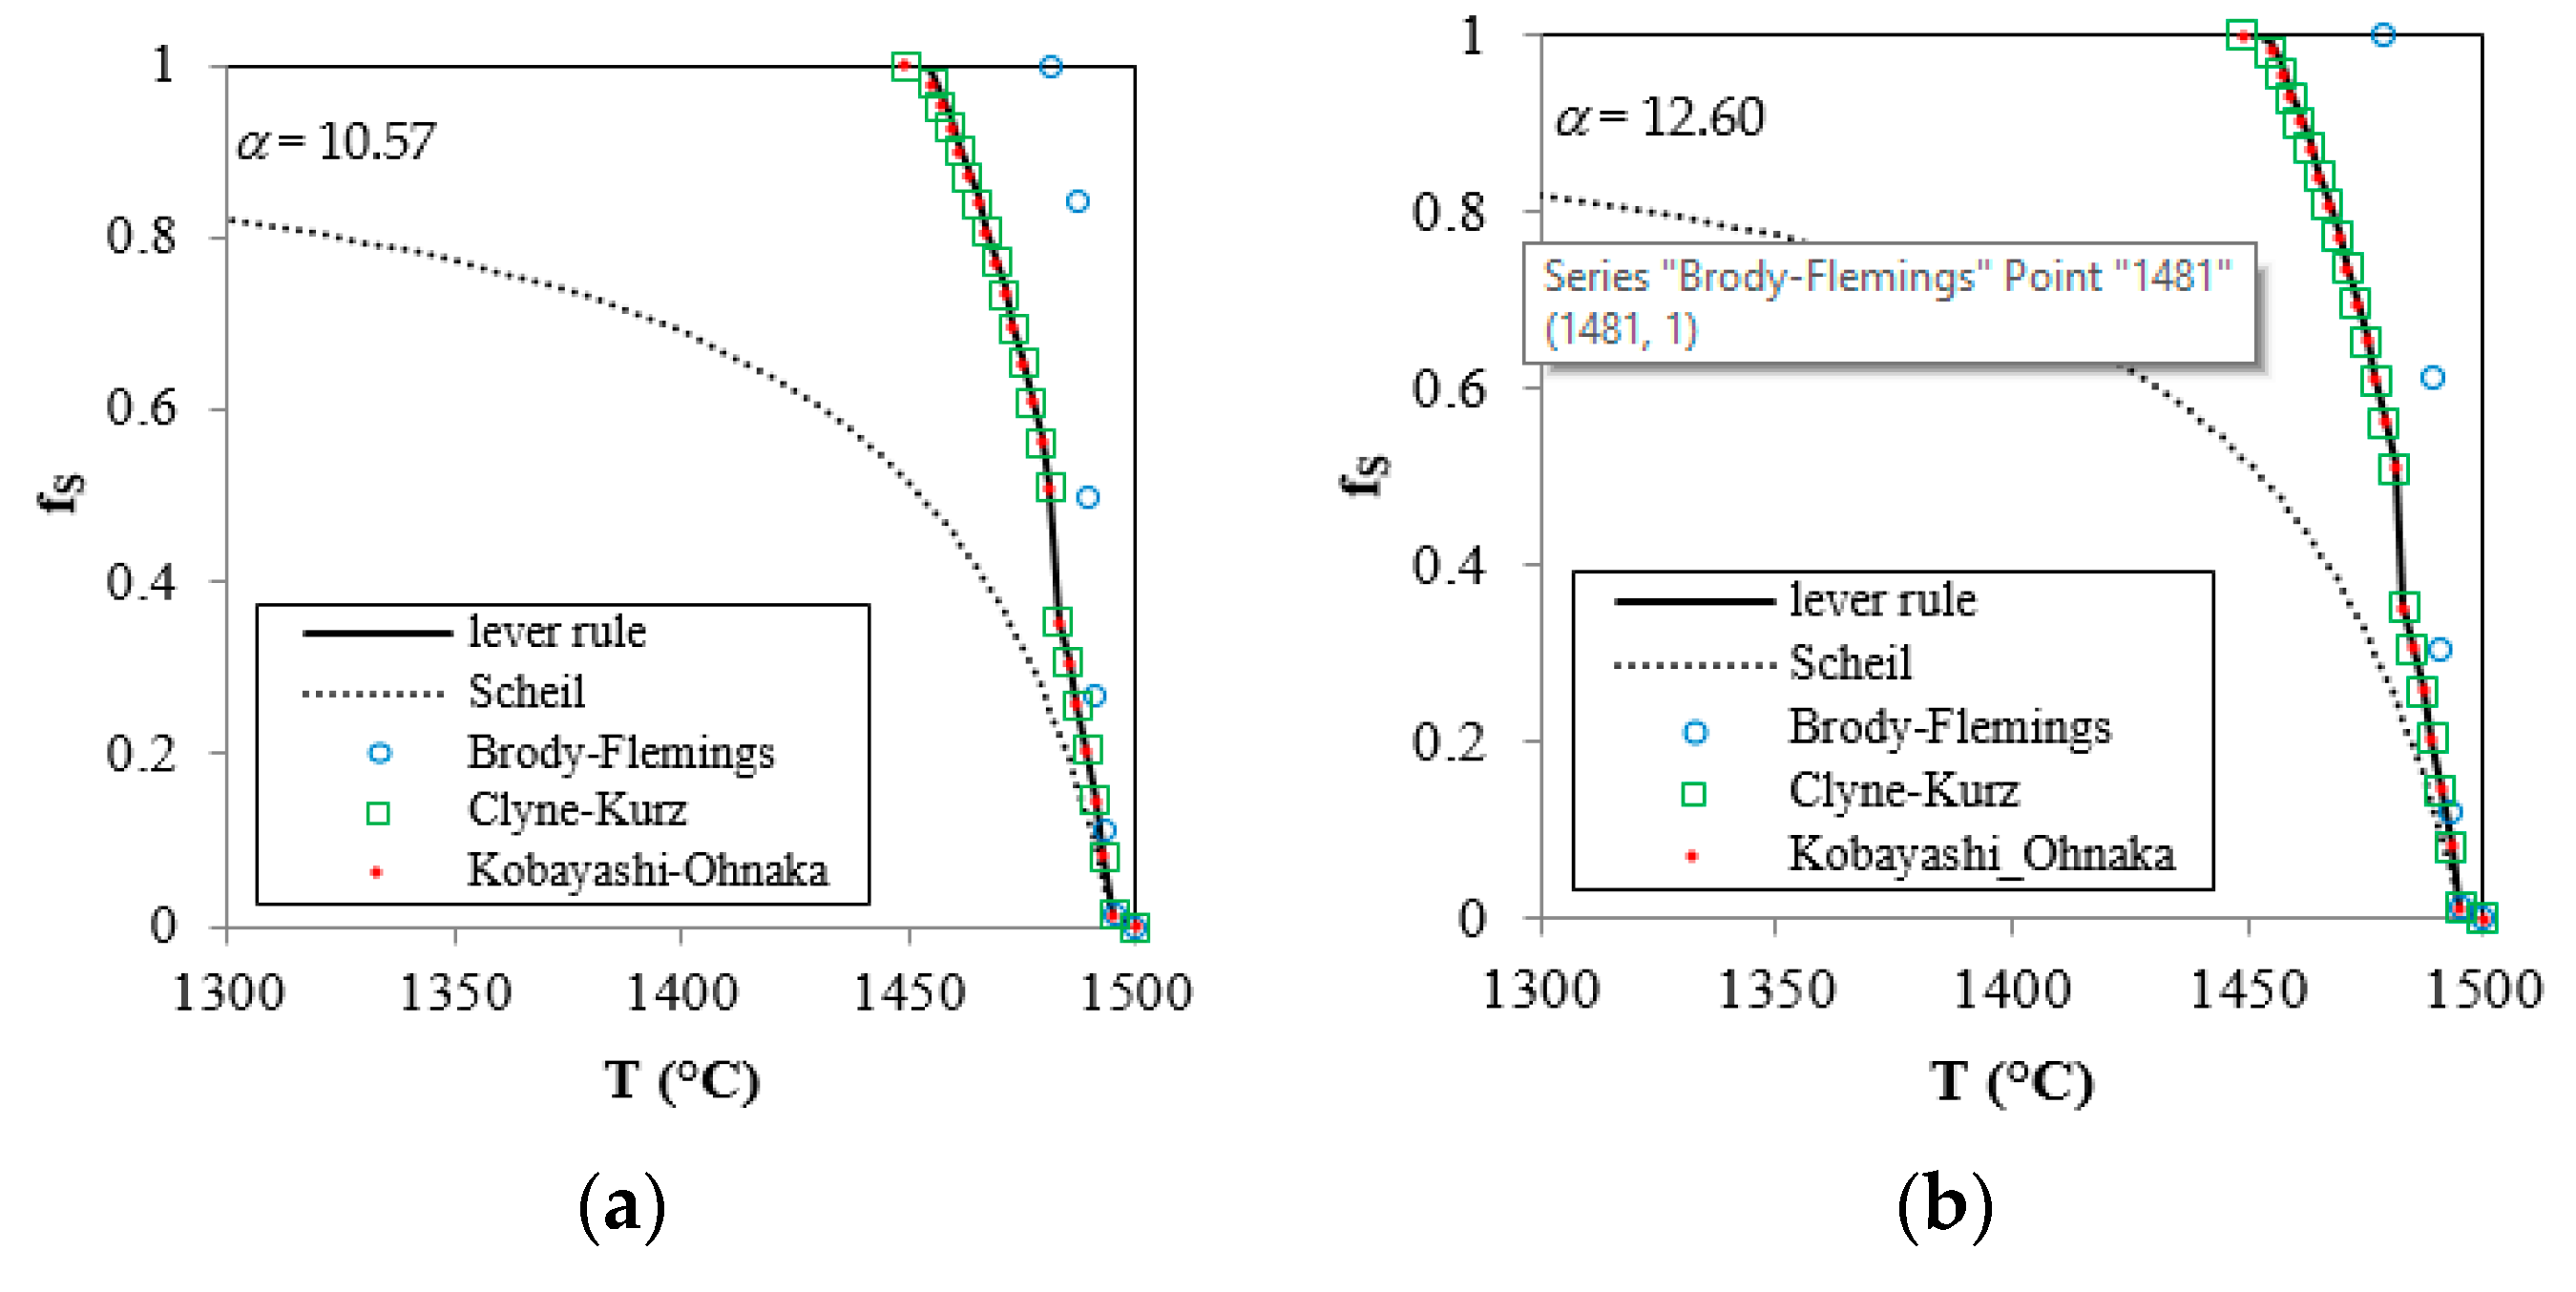
| Region | TS (°C) | TL (°C) | d2 (μm) | tf (s) | α |
|---|---|---|---|---|---|
| 1 | 1428.5 | 1493.1 | 366 | 509 | 10.57 |
| 2 | 1426.5 | 1492.8 | 474 | 1017 | 12.60 |
| 3 | 1414.2 | 1486.7 | 536 | 1307 | 12.66 |
© 2020 by the authors. Licensee MDPI, Basel, Switzerland. This article is an open access article distributed under the terms and conditions of the Creative Commons Attribution (CC BY) license (http://creativecommons.org/licenses/by/4.0/).
Share and Cite
Zhang, C.; Jahazi, M.; Isabel Gallego, P. On the Impact of Microsegregation Model on the Thermophysical and Solidification Behaviors of a Large Size Steel Ingot. Metals 2020, 10, 74. https://doi.org/10.3390/met10010074
Zhang C, Jahazi M, Isabel Gallego P. On the Impact of Microsegregation Model on the Thermophysical and Solidification Behaviors of a Large Size Steel Ingot. Metals. 2020; 10(1):74. https://doi.org/10.3390/met10010074
Chicago/Turabian StyleZhang, Chunping, Mohammad Jahazi, and Paloma Isabel Gallego. 2020. "On the Impact of Microsegregation Model on the Thermophysical and Solidification Behaviors of a Large Size Steel Ingot" Metals 10, no. 1: 74. https://doi.org/10.3390/met10010074