

Online Commerce Pattern in European Union Countries between 2019 and 2020


ASEBUSS—The Institute for Business Administration in Bucharest, 012101 Bucharest, Romania
Societies 2023, 13(1), 4; https://doi.org/10.3390/soc13010004
Submission received: 22 October 2022
/
Revised: 5 December 2022
/
Accepted: 7 December 2022
/
Published: 22 December 2022
(This article belongs to the Special Issue Social Interactions and the Technology Development: Perspectives on E-Societies)
Abstract
:The development of information technology, along with the high growth and diversification of consumer needs, has revolutionized the way in which business-to-consumer transactions occur. All this progress was boosted by the COVID-19 pandemic period in a different manner in each EU country, depending on different local aspects. The main goal of this paper is to determine the key characteristics of e-commerce in European Union countries in a pandemic context, based on Eurostat Digital Economy data for 2019–2020. Therefore, for an easier visualization, based on PCA, using 27 analyzed variables, new unique dimensions were revealed: 1. heavy online purchasers, 2. triggers for embracing digital purchasing, 3. perceived barriers against buying online (privacy concerns, security, or not having a card), 4. dynamics of online interaction with public authorities, and 5. enterprise online sharing. Moreover, clustering techniques set four groups of countries with different online commerce patterns that might require attention, according to their specificities, both from a government level and from a business perspective. Special attention is paid to Romania, which has one of the biggest e-commerce industries in Southeastern Europe, but with the share of e-commerce in total retail still quite low, despite this great increase. The models of other countries could be important in helping Romania to catch up with the most successful economies in terms of e-commerce.
1. Introduction
In recent years, as a result of technology innovations, e-commerce has experienced an impressive development, leading to changes in the company’s market strategies. E-commerce takes into account the sales, trade, distribution, and services of marketing for products and services that take place via the Internet between an organization or a person and a company’s stakeholders. E-commerce has emerged as a consequence of technology development, which has produced a total change in company market strategies. In the context of such important changes in technology, consumers are becoming more and more informed and, therefore, more selective about the goods and services they acquire. They have the opportunity to buy from the comfort of their own homes, or any other place they choose, at any time of day, and the goods are delivered without any need to go to the store and transport the goods home.
The phenomenon is exploited by an extensive amount of research, which actually concludes on the equivoque evolution of the digital world as well as on the context, implications, and perspectives of this ecommerce development [1,2,3]. Particular interest exists in finding certain aspects that might influence e-commerce, such as blockchains [4], marketing capabilities [5], and special zoom-area electronics [6]. This paradigm was boosted in the context of the COVID-19 pandemic period [7,8,9,10,11].
Several countries show a strongly increasing trend and some of them exhibit constant light increases with regard to e-commerce. However, with this research, we try to better describe the online pattern for EU countries in order to categorize and further exploit their model for future developments and research.
This paper aims to analyze the evolution of online commerce, both in the European Union and, in particular, in Romania and to determine the factors that influence the e-commerce status, describing the main patterns of electronic commerce in European Union countries during 2019–2020, based on 27 variables. Based on the analysis, e-commerce in Romania and the main barriers to its development will be analyzed. Finally, conclusions of the analysis and some proposals are presented in order to increase the share of e-commerce in total trade in EU countries, with a focus on Romania as a country with an important lag regarding e-commerce, but with strong potential in terms of future e-commerce growth.
Our study differs from other studies in the literature because it establishes some new factors determining e-commerce patterns in the 27 EU countries and, based on these, a better analysis can be conducted in order to determine new policies or investment decisions.
This paper makes some important contributions to our knowledge in this area: to achieve a better understanding of the positioning of the countries, examples of countries that are on top, considering certain e-commerce dimensions and models, can be used as examples for the other countries to follow, especially in regards to what the governments of specific countries could do to improve their own e-commerce status. Moreover, the research focuses on Romania, a country that, even though it exhibits great Internet infrastructure and consistent online usage growth, remains very low in some areas of e-commerce, and important steps are required in order to help it keep pace with other EU countries.
The first purpose of this paper is to generate an output from which the links between the variables to be analyzed can be seen. This visual representation will be performed using principal component analysis.
The second aim of the paper is to obtain a grouping of states within the European Union according to various unique components. Therefore, the position of Romania in regard to e-commerce can be compared with that of other states that have similar characteristics. In this respect, a hierarchical classification method, namely the Ward method, is needed.
In order to do that, the paper is structured as follows: The following section is a brief overview of the existing and latest research on e-commerce in European countries. The third section presents the conceptual research model and the methods used. The fourth section deals with the presentation of the results, constructed in three parts: 1. a principal component analysis aiming to underline the five most important sources of influence regarding the e-commerce status of European Union countries, 2. a grouping of the countries based on clustering methods, and 3. the presentation of the characteristics of European Union countries, with a focus on Romania particularities. Finally, the fifth section concludes the current paper.
2. Literature Review
There are many studies focusing on the e-commerce field, most of them focusing on business strategies, as well as on consumer behavior. There are also attempts to determine the benefits associated with adopting technology in the business field [12,13,14,15], offering models based on data obtained from statistical institutions or on the basis of statistical surveys. Tutsch [16] attempted to demonstrate, in the article “Think Locally, Fight Globally”, that each market has different patterns and is subject to different risks in terms of fraud. This is also due to the fact that there are different payment modalities in different territories and that there are areas associated with low security.
Similar risks have been analyzed more recently, concluding that perceived after-sales risk, financial risk, psychological risk, and social risk had a significant effect on online purchase behavior. Ref. [17] states that knowledge regarding online privacy risks and concerns explain the e-commerce adoption of buying via social media advertisements, through an analysis [18] of a micro-level dataset with multilevel logit models for EU countries. It is demonstrated that e-commerce participation probability of consumers increases with knowledge of privacy risks and decreases with concerns over online recordings [18].
Lin [19] aimed to construct a model for the factors that affect online consumer behavior intentions and post-purchasing behavior by integrating the decomposed theory of planned behavior, technology acceptance model, and relationship quality. Later, Paris et al. [20], studying the factors that influence online commerce, reached new perspectives related to business organization: compatibility; complexity; vendor capability; routine configurations; top management support; organizational structure; information system professionals; communication; resistance to change and customer requirements. Customer behavior is also analyzed from the perspective of perceptions and how social demographics (age, education, gender) might influence perception of online content trustworthiness. Ref. [21] and Goyal [22] present an integrated view of e-commerce definitions across five dimensions—information, technology, buy–sell transactions, monetary transactions, and competition. Xifei and Jin [23] studied five dimensions when considering how to enforce e-commerce service reliability: product conformance, distribution reliability, information reliability, customer service reliability, and web technology reliability.
Gu et al. [8] considered the spread of the COVID-19 pandemic and the increasing importance of e-commerce into the study of online consumers. They built a methodological approach to assess the relationships and the level of influence of the factors activating the purchasing behavior of online consumers against the background of the COVID-19 pandemic. They showed that the impact of consumer awareness and experience has increased.
Additional analysis of mobile commerce as an essential electronic commerce component established the main drivers of mobile commerce and the intensity of their influences [24] covering the period 2010–2020, the last year of this period capturing the context of the COVID-19 pandemic and its impact on electronic commerce (e-commerce) and mobile commerce (m-commerce). In the macroeconomic analysis of competitiveness using US data, the following main drivers of m-commerce, using artificial neural networks and the mediation effects, were found: increasing internet speed, expanding 5G and Wi-Fi networks, and increasing accessibility and trust in mobile devices and applications. For those 27 European countries, Campisi [25] analyzed the correlation between online shopping habits and socio-demographic characteristics. The results were obtained from a descriptive statistical evaluation and the correlation between the variables was defined by the chi-square calculation. The results lay the foundations for the definition of the change in transport demand by home-purchase motivation and allow one to define some considerations on the emission patterns that characterize transport demand.
Other recent approaches consist of examining, in depth, the drivers of online pur-chase behavior during the pandemic, analyzing the relations between normative, utilitarian and hedonic motives, and purchase intentions, employing structural equation modeling [26], offering recommendations for e-commerce companies on ways to address consumers’ purchase motives and strategically harness normative influence.
Findings from Guthrie et al. [27] support the usefulness of the multi-perspective re-act–cope–adapt framework of constrained consumer behavior in an online environment
Mazorenko [28] paid particular attention to the study of the impact of the COVID-19 pandemic on the development of e-commerce, which allowed them to identify new trends in e-commerce, to investigate changes caused by the pandemic and quarantine in the behavior of consumers and entrepreneurs. However, each country responded differently to this evolution, as the adoption of digitalization has not happened at the same pace across industries because many different factors are involved in the process of digitalization [29], so that a further overview and specific analysis are required to identify patterns for each case.
Therefore, a special focus is on several countries, for example, Romania, where Florea et al. [30] worked on forecasting e-commerce in Romania, offering positive trends and good perspectives. Comanescu [31] briefly described some of the aspects of e-commerce in Romania in comparison with strong performance of other countries. Hategan et al. [32] checked the e-commerce in Romania from the perspective of important companies, revealing the importance of brand equity for gaining a better positioning into online commerce. Tita [33] went deeper into the motivation of e-commerce use and also investigated technology usage into a specific domain: tourism, demonstrating how important the development of easy-to-use applications could be in strong correlation with customer satisfaction and continued usage of online purchasing. Lup et al. [34] investigated the influence of trust dimensions upon using online platforms in Romania on the area of buying electronic appliances, verifying this impact through a series of regressions.
Moreover, a holistic approach from Purcarea [35] on the above e-commerce aspects provided some important advice: performance enrichment of businesses websites, continuous monitoring of customer feedback, increased focus on m-commerce, and consideration of new digital transformation trends. Digital transformation is in the scope of Verhoef et al. [36] and it requires specific organizational structures and bears consequences for the metrics used to calibrate performance. They also provided a research agenda to stimulate and guide future research on digital transformation. Important advice for businesses to move online was offered by Costa [37], sustaining that the future is digital, and the transition to this framework will grant survivability to enterprises, allowing them to face global competition in a fairer arena.
A similar methodology was used by Paraschiv et al. [38]: both qualitative research of the literature regarding e-commerce and a quantitative analysis that captures two aspects. On the one hand, it highlights the change determined by the pandemic in online commerce and, on the other hand, it shows an X-ray of EU state positioning in terms of e-commerce evolution. The latter also consists of a comparative Hierarchical Cluster Analysis that aims to provide an image on the situation of EU states, before and after the pandemic. However, there are significant limitations based on the small number of indicators—only six—taken into consideration in this paper.
3. Materials and Methods
- This study aims to respond to several questions:
- What are the patterns of EU countries?
- Is there any factor describing online commerce considering information available on Eurostat regarding online behavior of people/country governments and business?
- What are the principal characteristics?
- In which groups could we cluster the countries for better describing their similarities and particularities?
These will help to further investigate the differences and similarities for a better understanding of the current status and the needed or next-best actions for increasing results.
The first step in the analysis was to carry out a statistical characterization of several variables. Based on these results, we could see that there are a lot of disparities between countries, depending on the variable chosen.
In Europe, e-commerce business grew exponentially during the last ten years. Denmark, Germany, and the Netherlands are the countries with the highest level of online trade, whereas Southern European countries have the highest increasing rate of online retail. This exponential growth is mainly due to the opportunities offered to consumers to control their shopping experience, access to a very diverse range of goods, but also to the continued development of technology and improvements in the online payment system.
In Figure 1, it can be seen that there are big differences between European countries in the levels of last online purchases in the last 12 months. Thus, the minimum level is recorded in Bulgaria (31%) and Romania (38%) and the maximum level in the Netherlands (87%) and Denmark (89%). Moreover, a high and inverse correlation between the dynamics of last online purchases and 2020 level of online purchases across European countries could be observed.
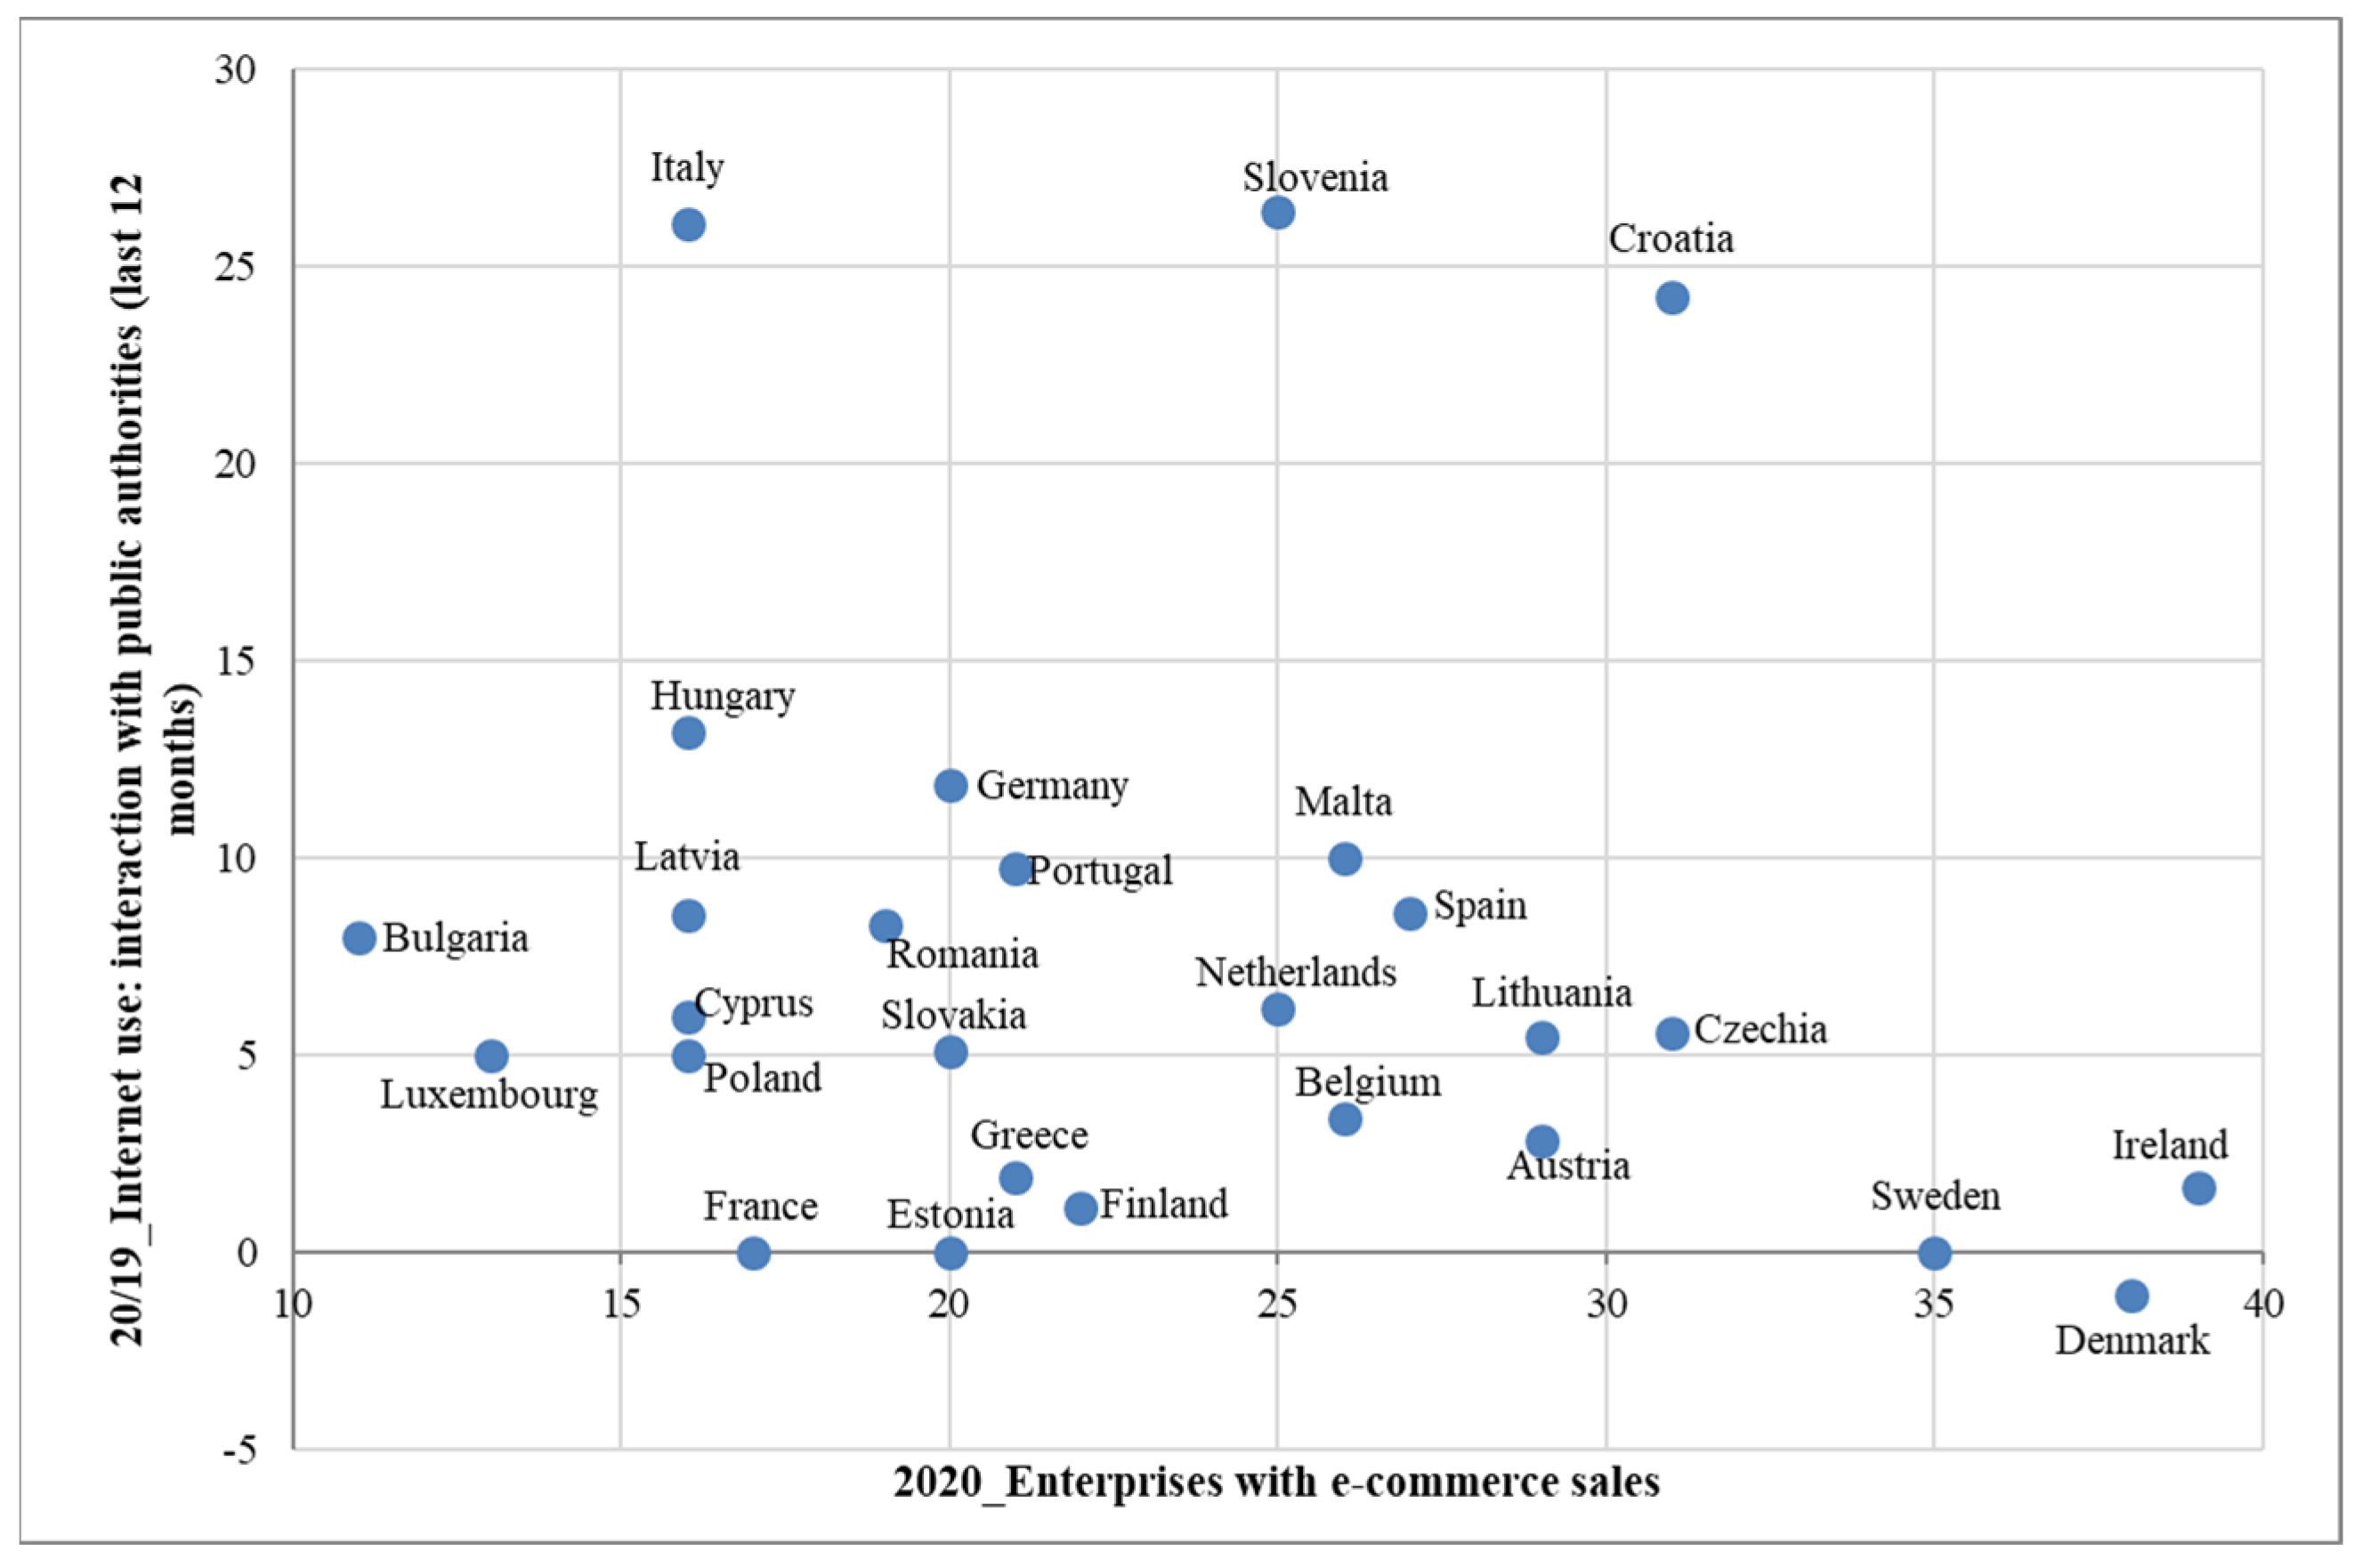
Taking into consideration the other two variables, 2020 enterprises with e-commerce sales and dynamics in internet usage based on interaction with public authorities, as per Figure 2, it can also be noticed that there is a large spread in the data. Italy, Slovenia, and Croatia are the countries with the most important increase in online interactions with public authorities, while Ireland, Denmark, and Sweden are the ones that have the highest percentage of enterprises with e-commerce sales.
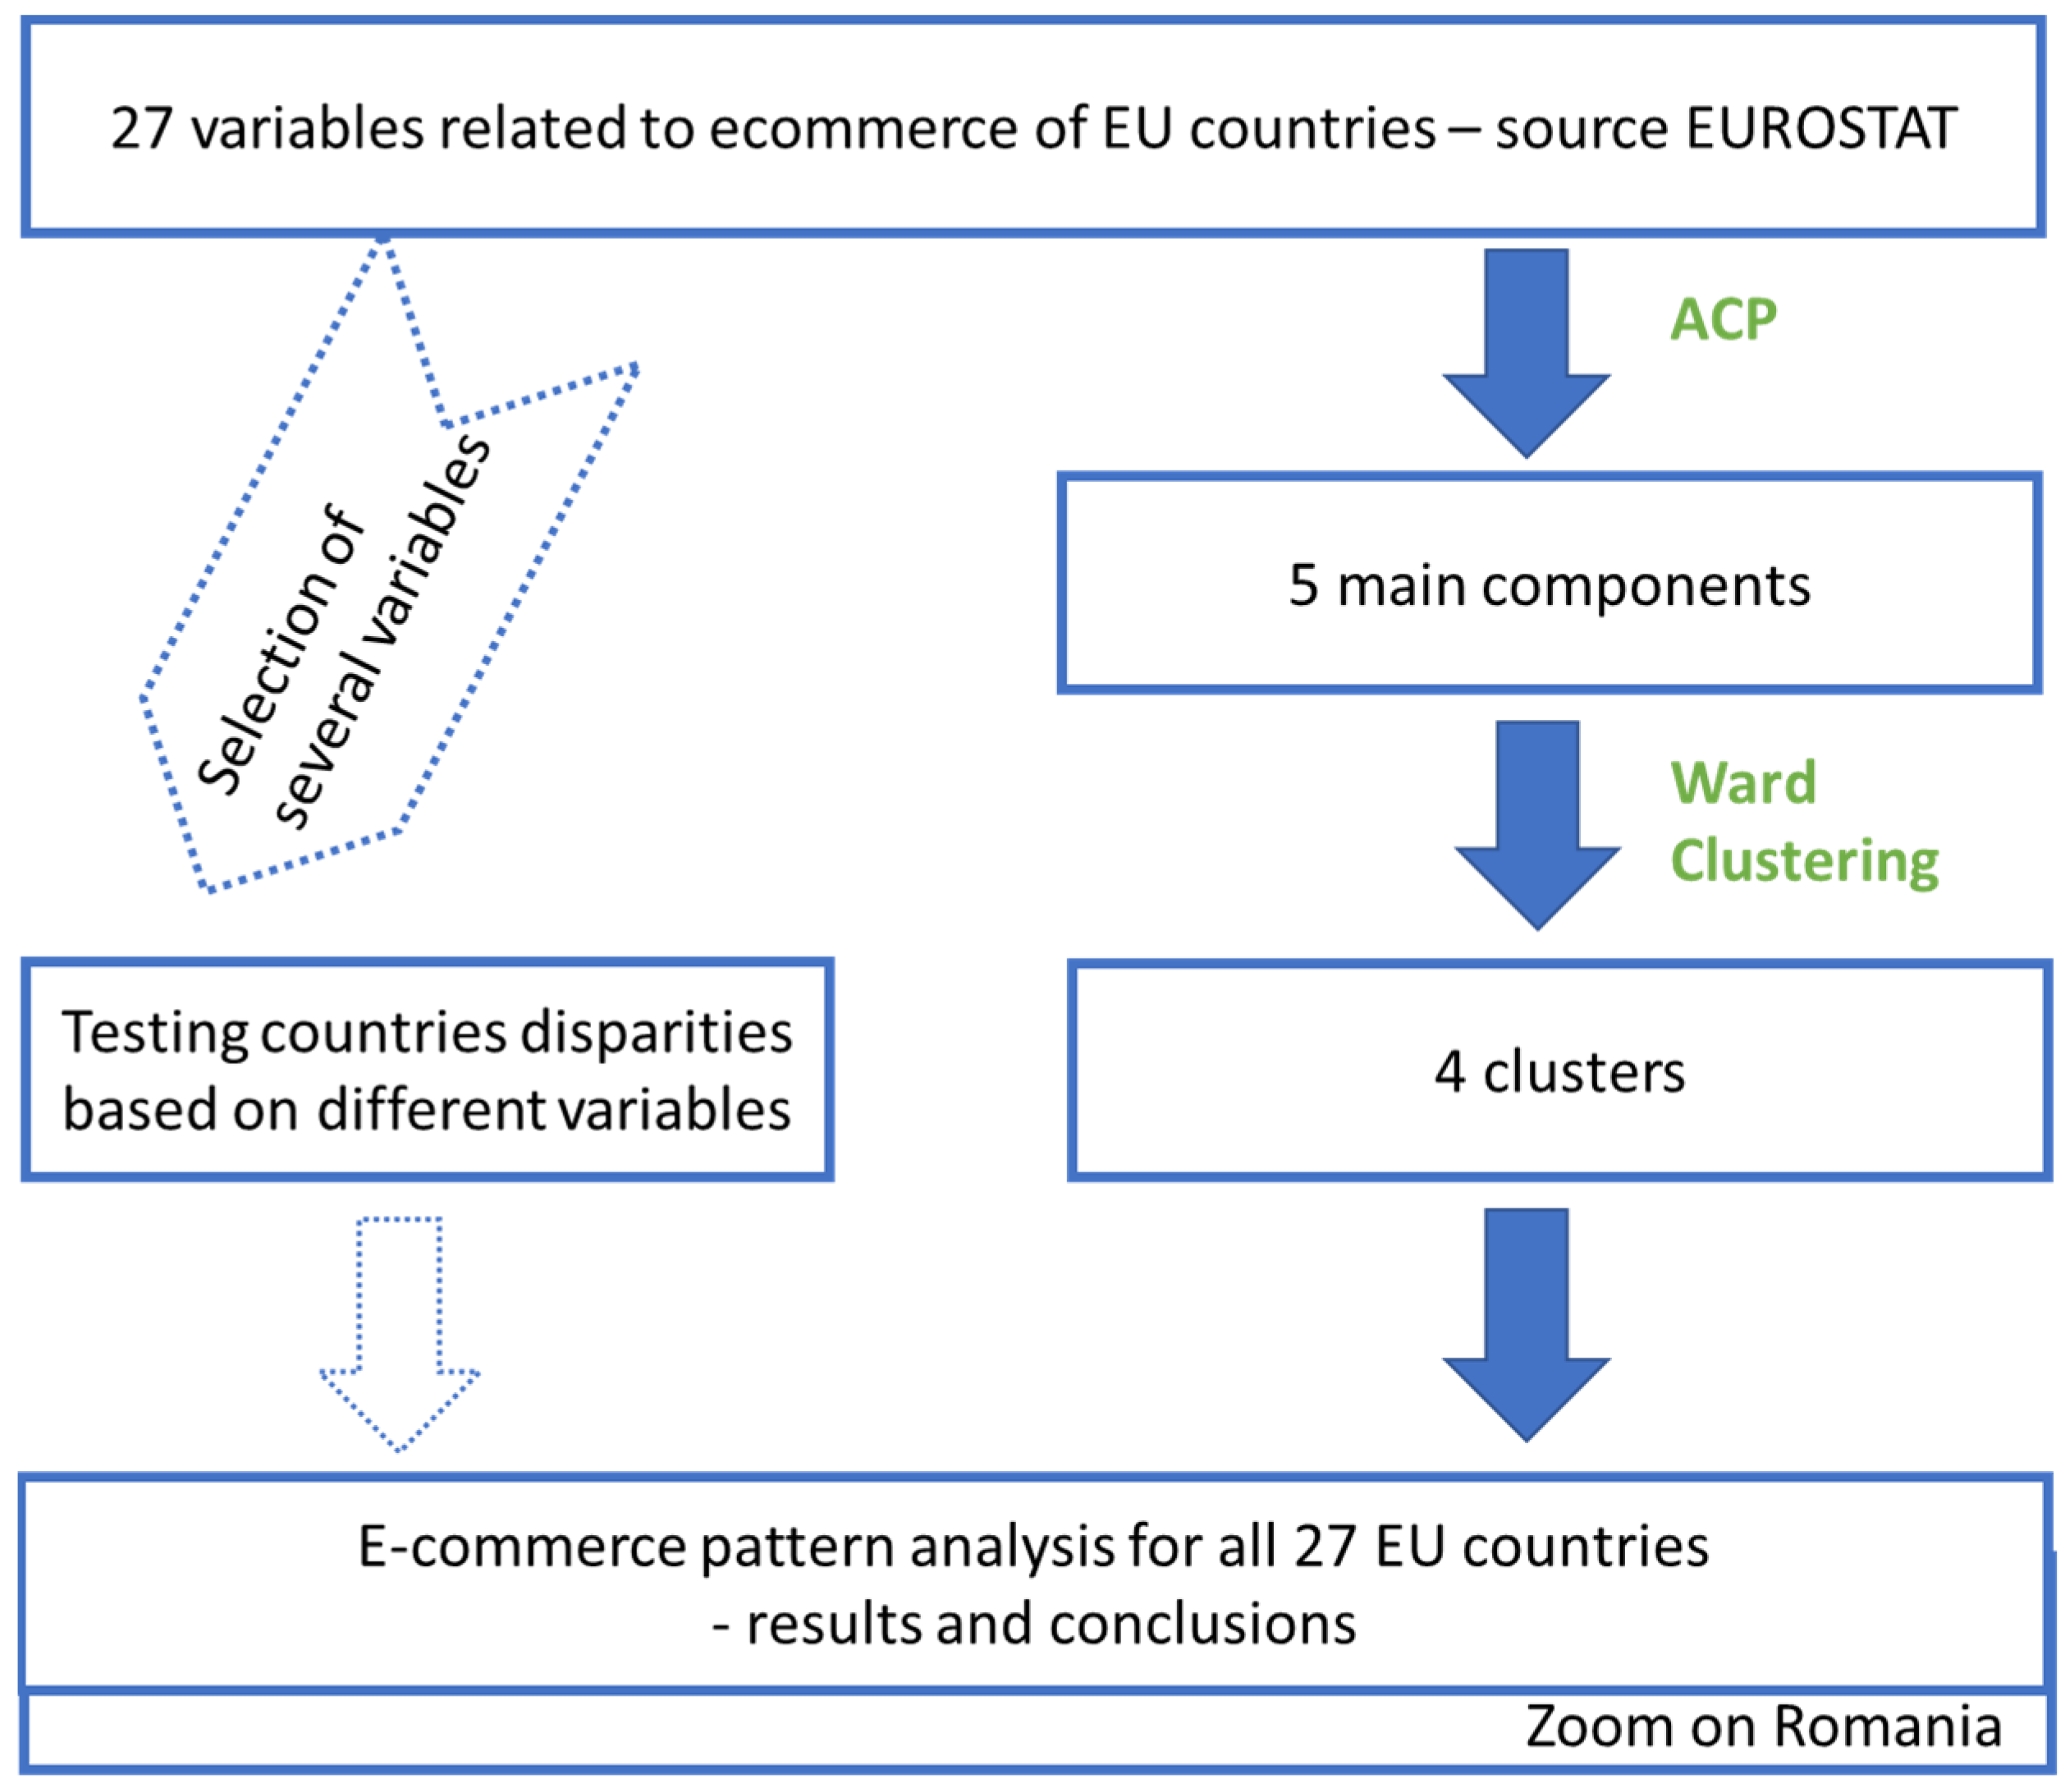
The above first step in the analysis is represented by the dotted part from the left side of the research conceptual model (Figure 3).
The second step, represented by the right side of Figure 3, will explore the extent of variables related to e-commerce existing in European Union countries.
In order to determine the patterns of online commerce in European countries, the following 27 variables were extracted from the EUROSTAT website:
- Last online purchase: in 3 or 12 months—2020 and dynamic vs. 2019: percentage of the individuals who purchased online in the last 3, respectively, in the last 12 months. The indicator is revealed for 2020 (2 variables) and also in dynamics as a rhythm versus 2019 level of the last online purchase in the last 12 months (1 variable).
- Frequency of online purchases in the last 3 months—2020 (4 variables): percentage of individuals who bought or ordered goods or services over the Internet for private use in the previous 3 months:
- o
- At least 1 or 2 times
- o
- 3 to 5 times
- o
- 6 to 10 times
- o
- More than 10 times
- Online purchases made in the last 3 months for different types of goods and services—2020 (7 variables): percentage of individuals who ordered or bought over the internet for private use in the previous 3 months:
- o
- At least one of the financial activities
- o
- Clothes (including sport clothing), shoes, or accessories
- o
- Furniture, home accessories, or gardening products
- o
- Printed books, magazines, or newspapers
- o
- Deliveries from restaurants, fast-food chains, catering services
- o
- Music as a streaming service or downloads
- o
- Films or series as a streaming service or downloads
- Individuals who have the above basic overall digital skills—2019 (1 variable) calculated as percentage of individuals
- Internet access penetration in households—2020 and dynamic vs. 2019 (2 variables)
- variables regarding barriers perceived when being online, including:
- o
- Trust concerns about receiving/returning goods, complaint concerns—percentage of individuals who, in the last 12 months, have not ordered goods or services over the Internet, because of trust concerns about receiving or returning goods, complaint/redress concerns (until 2019)
- o
- Payment security concerns—percentage of individuals who, in the last 12 months, have not bought/ordered goods or services over the Internet for their own private use, because: payment security concerns (until 2019)
- o
- Not having a payment card—percentage of individuals who, in the last 12 months, have not ordered goods or services over the Internet because they do not have a payment card (until 2019)
- o
- Preference for buying direct in shop—percentage of individuals who, in the last 12 months, have not ordered goods or services over the internet, because they prefer to shop in person, they like to see products, loyalty to shops, or force of habit (until 2019)
- Individuals using the internet for internet banking—2020 and dynamic vs. 2019 (2 variables)
- Internet use: interaction with public authorities (last 12 months)—2020 and dynamic vs. 2019 (2 variables)
- Enterprises with e-commerce sales—2020 and dynamic vs. 2019 (2 variables).
These variables are analyzed for all 27 countries in the European Union.
Taking into consideration the EUROSTAT indicators, there will be the need to reduce their dimensions to only a few factors for better visualization. In order to achieve this, principal components analysis method—the technique for reducing the dimensionality of such datasets, increasing interpretability but at the same time minimizing information loss—will be applied. Principal component analysis (PCA) is used to reduce the complexity of the data and to present the information in fewer dimensions when all the variables are quantitative [39]. It is mathematically defined as an orthogonal linear transformation that projects the data to a new coordinate system (which is made by principal components) in order to obtain the greatest variance explained by this projection of data.
Principal component analysis is a method of extracting important variables from a large set of variables available in a dataset. It extracts low-dimensional sets of features from a high-dimensional dataset with a motive to capture as much information as possible. With fewer variables, visualization also becomes much more meaningful. PCA is more useful when dealing with 3 or more dimensional data; otherwise, the visualization with our 27 variables will be quite difficult to realize.
Considering only those 5 dimensions, in the next step, through the clustering method, we will group the countries with similar online patterns and consistent differences from one cluster to another.
4. Results
By applying the PCA method, the projection of data, the first five principal components preserved 83% of the total inertia (58.7% for the first axis, 9.3% for the second axis, 6.4% for the third axis, 4.6% for the fourth axis, and 4.0% for the fifth axis).
As per Table 1, the first axis could be called heavy purchasers, as the best represented variables on the positive side are the ones regarding consumers that often use the Internet and frequently order online as they have: online purchases in the last 3 months on various type of goods, high frequency of online purchases (more than three times in the last 3 months), at least one purchase in the last 3 or 12 months, Internet access penetration in households, and individuals with above basic overall digital skills. On the negative side, there is a variable from the same area, but this time with opposite connotations: individuals who have not ordered online because they prefer to shop in person, who like to see products, have loyalty to shops, and one variable of dynamics: increase in Internet access penetration in households.
The second axis could be called triggers of embracing digital, taking into consideration that this component is represented by some reasons why the individual uses the Internet (internet banking, interaction with public authorities, financial activity): individual using the internet for internet banking, Internet use: interaction with public authorities (last 12 months), online purchases (3 months): at least one of the financial activities, frequency of online purchases in the last 3 months: one or two times. On the negative side, there are two variables of dynamics measuring the increase in the online purchase number made in the cities and the increase in internet usage for internet banking.
The third axis could be called perceived barriers against buying/ordering over the Internet because it accounts for some of the most important problems that individuals might face when going online: trust concerns receiving/returning goods, complaint concerns, payment security concerns, and not having a payment card.
The fourth axis is the one regarding dynamics in online interaction with public authorities, a fact that looks powerful and unique, a genuine driver in the determination of the online pattern behavior in EU countries.
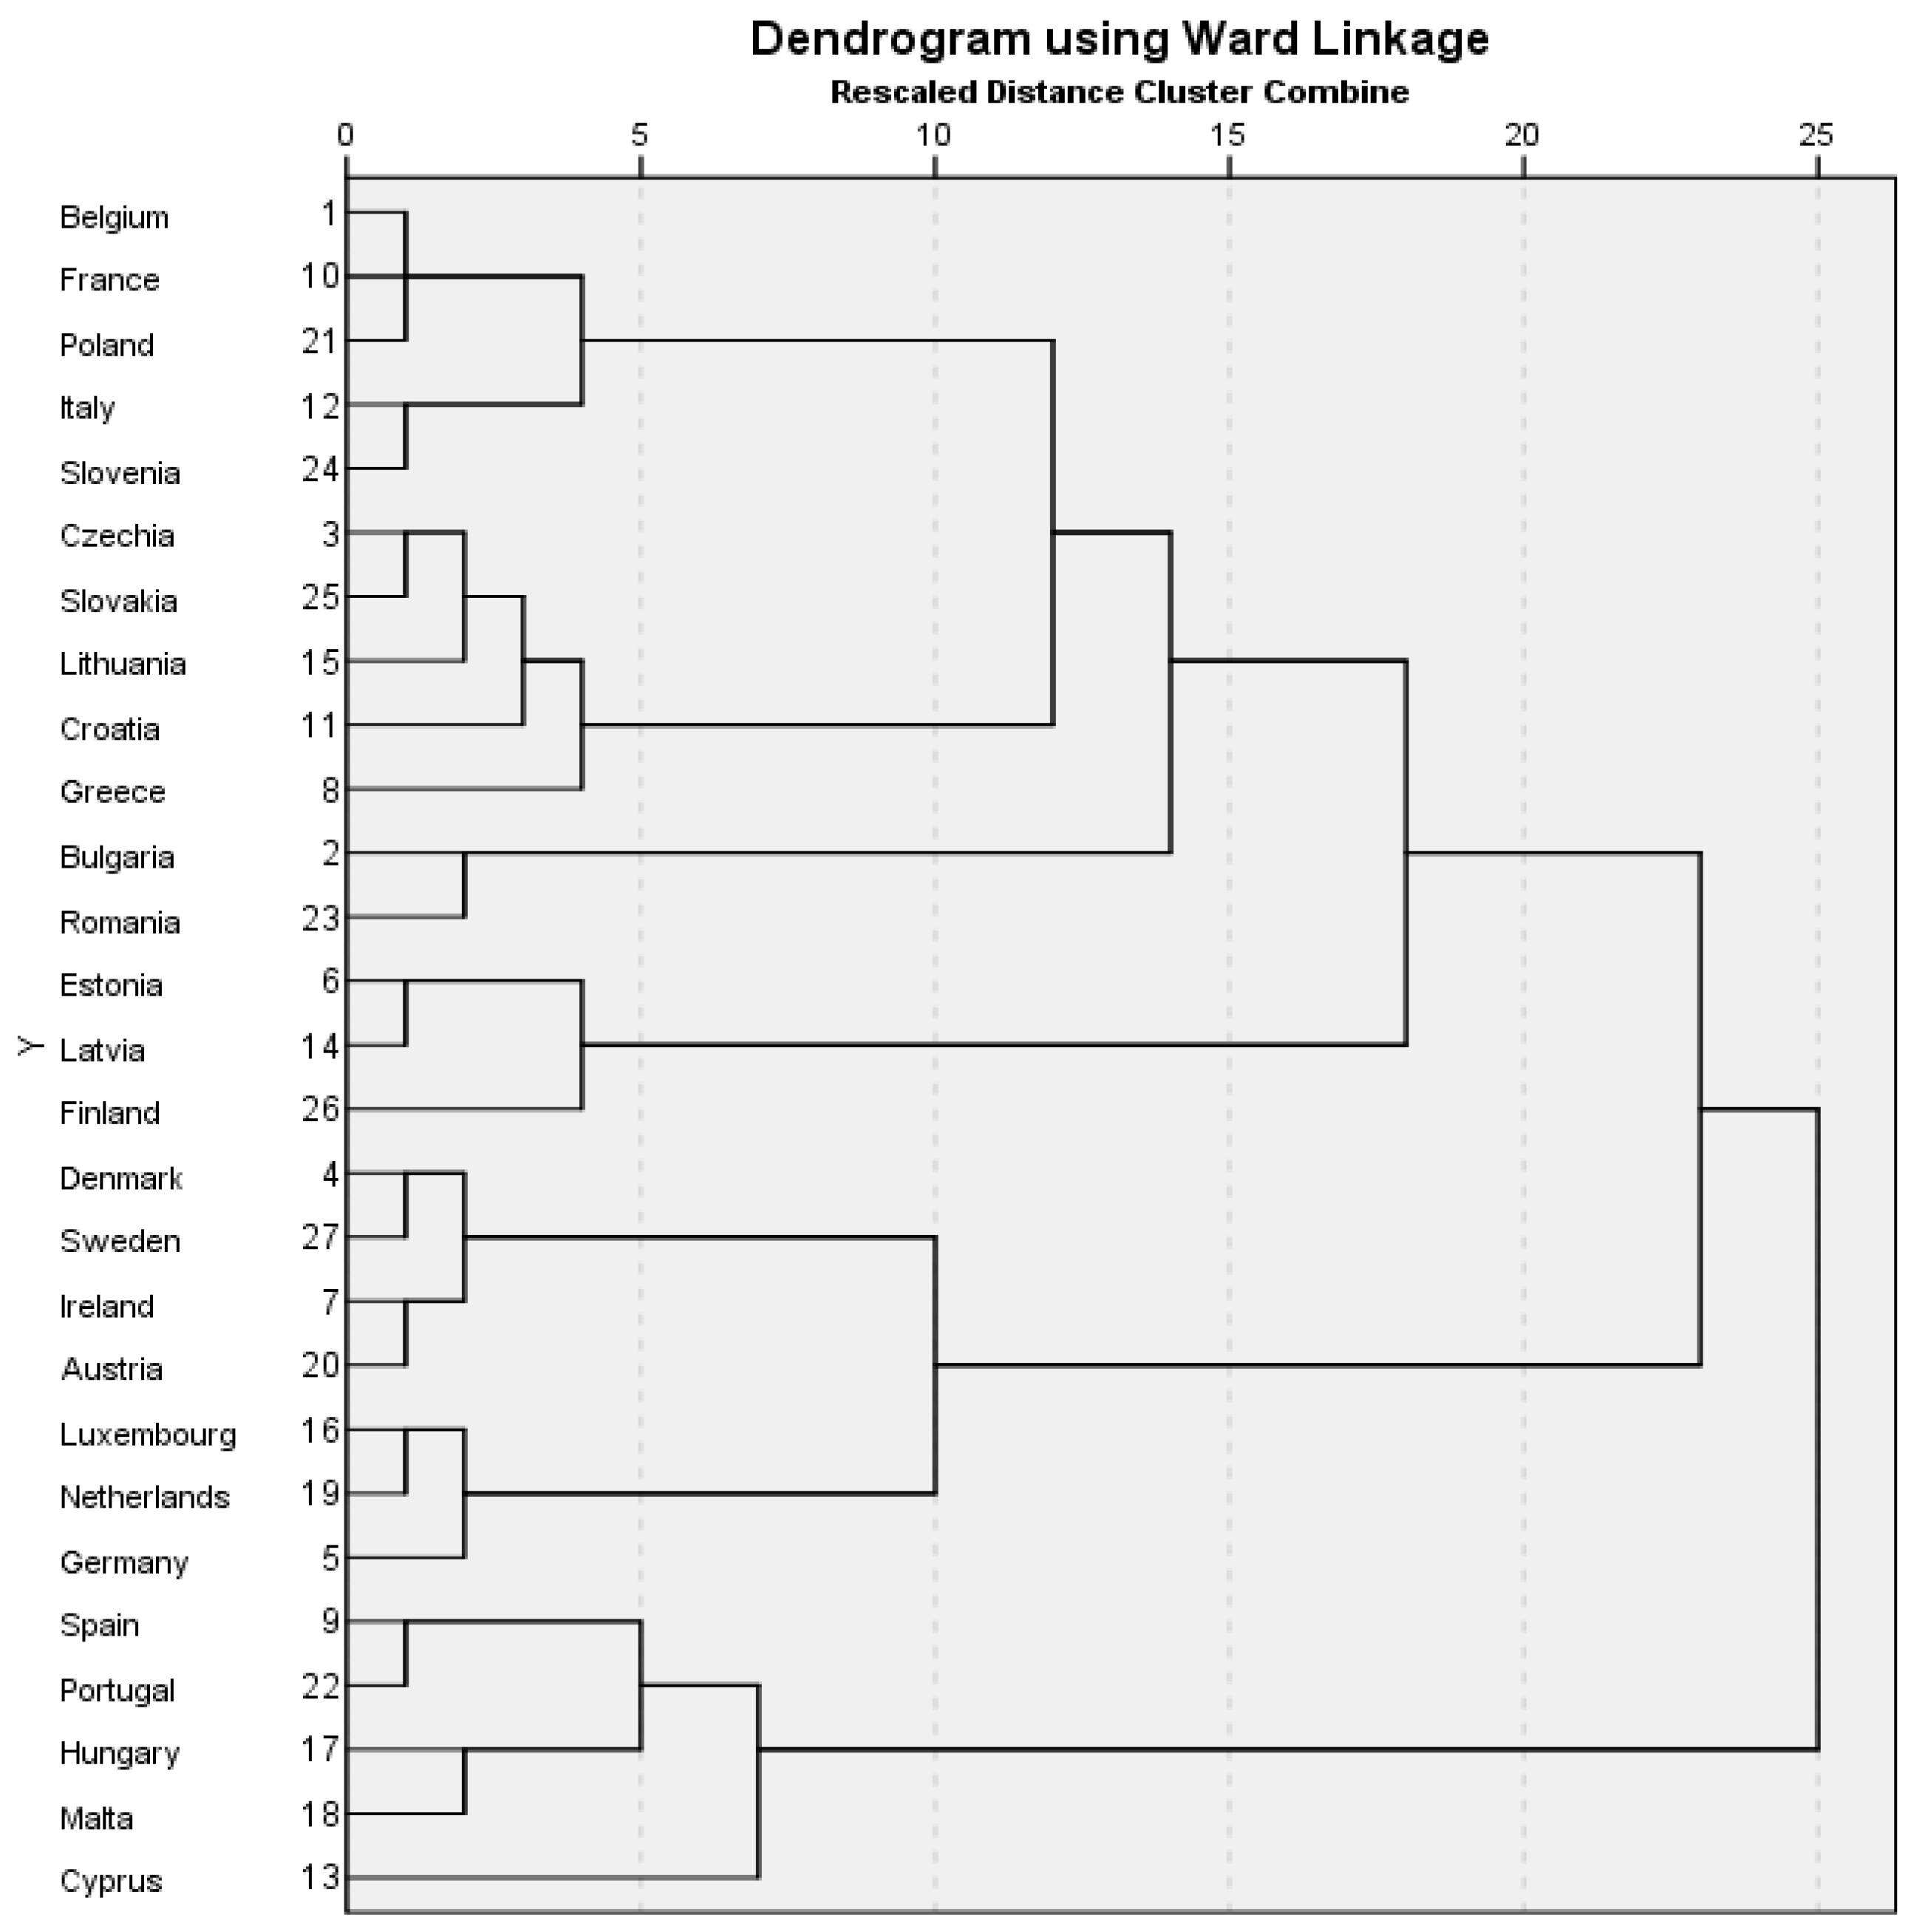
The fifth axis contains variables related to enterprises and their e-commerce sales and the dynamic versus 2019. The ability of enterprises to generate revenues from e-commerce is a powerful signal for digital adoption at the national level [40]; therefore, it is recommended that European economic policies mediate the promotion of e-commerce use. Having defined those fewer dimensions, a classification of countries based on them is the natural following step. Classification necessitates the construction of clusters of countries according to the level of similarity between them, considering the characteristics to be analyzed—those five axes in our case. The hierarchical classification method pursues more agglomerations in size and as homogeneous as possible. Among these hierarchical classifications, the Ward method is the technique used to create homogenous groups with the minimum variance within the groups, being based on maximizing class variability and minimizing variability within classes. By applying this technique to the data, four clusters could be defined (Figure 4).
The first cluster contains 12 countries with the lowest rate of online heavy purchasers but with highest dynamics in this area in the pandemic period, especially in online interaction with public authorities and with rather low barriers to consider online shopping.
The second cluster is represented by seven countries, mostly from the Northwestern EU, which are the most advanced in online purchases, having a higher percentage of heavy online purchasers, with the lowest rate of dynamic during the pandemic mostly, due to the already highest online adoption rate and no barriers considering online purchasing.
The third cluster is made by three Northeastern countries (Estonia, Latvia, and Finland) that have a similar level as cluster 1 in terms of development of online commerce (heavy purchasers) but with higher scores in embracing the digital component and authorities’ axis. All three countries have lower scores on enterprise axes.
The fourth cluster is characterized by five countries with the highest barriers in considering online shopping: Spain, Cyprus, Hungary, Malta, and Portugal.
By representing the countries in the first five principal components (Figure 5), we observe that countries, such as Germany, the Netherlands, and Denmark (cluster 2), have high values for online heavy purchasers with medium to high scores also for the variables from triggers of embracing digital. Latvia from cluster 3 and Bulgaria and Lithuania from cluster 1 are the countries with the lowest levels of this axis of heavy online purchasers.
Considering the axis regarding triggers of embracing digital, Finland and Latvia from cluster 3 are at the top and the last countries from this perspective are Romania and Bulgaria. These consumers are not using the Internet for Internet banking, neither for financial services nor online interaction with authorities, this being at the minimum level. The minimum frequency of using the Internet—1 or 2 online purchases in the last 3 months—is also at the minimum level. Being at impressive lower levels, the growth rates for last online purchase and for a number of individuals using the Internet for Internet banking are the highest.
Portugal, Cyprus, Spain, and Hungary (from cluster 4) are the countries that perceive the most barriers towards going online, experiencing the most payment security concerns, trust concerns about receiving or returning goods, complaint/redress concerns, and lack of a payment card. The high scores of this axis of barriers are defining cluster 4. Despite this existing low level of trust inherited from the past [41] and its importance for e-commerce growth [42], the e-commerce in these countries is projected to grow [43,44]. By properly addressing these aspects of customer behavior and perceptions, the growth would be higher. Czechia, Poland, Bulgaria (cluster 1), and also Estonia (cluster 3) are countries where the fear of what is on the other side is not so present.
The highest presence of online interaction with authorities is significant for defining cluster 3, as the countries Estonia, Finland, and Latvia are the most successful in having it. On the other side, no moves in that direction are registered by Slovenia and Italy (cluster 1) where there is no increasing trend in obtaining information from public authorities through their website. Considering the axis regarding the enterprises e-commerce sales and the dynamic versus 2019, the top two countries are Greece and Croatia (from cluster 1), having a consistent score to triggers of embracing digital. In Croatia, online commerce is heavily promoted in the media [45]. Native advertising, adverts integrated within content, and web page design are becoming more and more popular, while 80% of Croatian enterprises advertise by e-mail and 80% of online retailers promotes their business on Facebook. A key to success for their e-commerce share could be the usage of new technologies and business models, such as voice-driven acquisition process or requiring a subscription to access special offers. The key to success in Greece is driven by some categories that are heavily requested online: fashion (31%), electronics and media (25%), food and personal care (19%), toys, hobby and DIY (16%), and furniture and appliances (9%). As per Digital Transformation Observatory of the Hellenic Federation of Enterprise (SEV) study, the market volume of the top-100 online stores has grown to 71% since 2018.
At the other end of the axis, with the lowest level, is Cyprus with web-based commerce that is relatively small, although progressively increasing. Most enterprises now have their own websites, Facebook pages, and an enlarged social media presence. Although the Government has been involved in the digitalization of its institutions and they have websites, and some are starting to offer services, unfortunately, authorities continue to lag behind the private sector in this regard.
Within countries in the European Union, for 2020, Romania, alongside Bulgaria, records the lowest percentage of online consumers (Figure 6), despite the highest increase versus the previous year. Thus, 46% of the total city population in Romania uses the Internet to buy goods and services online for personal use. However, having the highest growth of online consumer share versus previously, we focus on the description of this country as having the highest potential for growth and improving all the other axis scores.
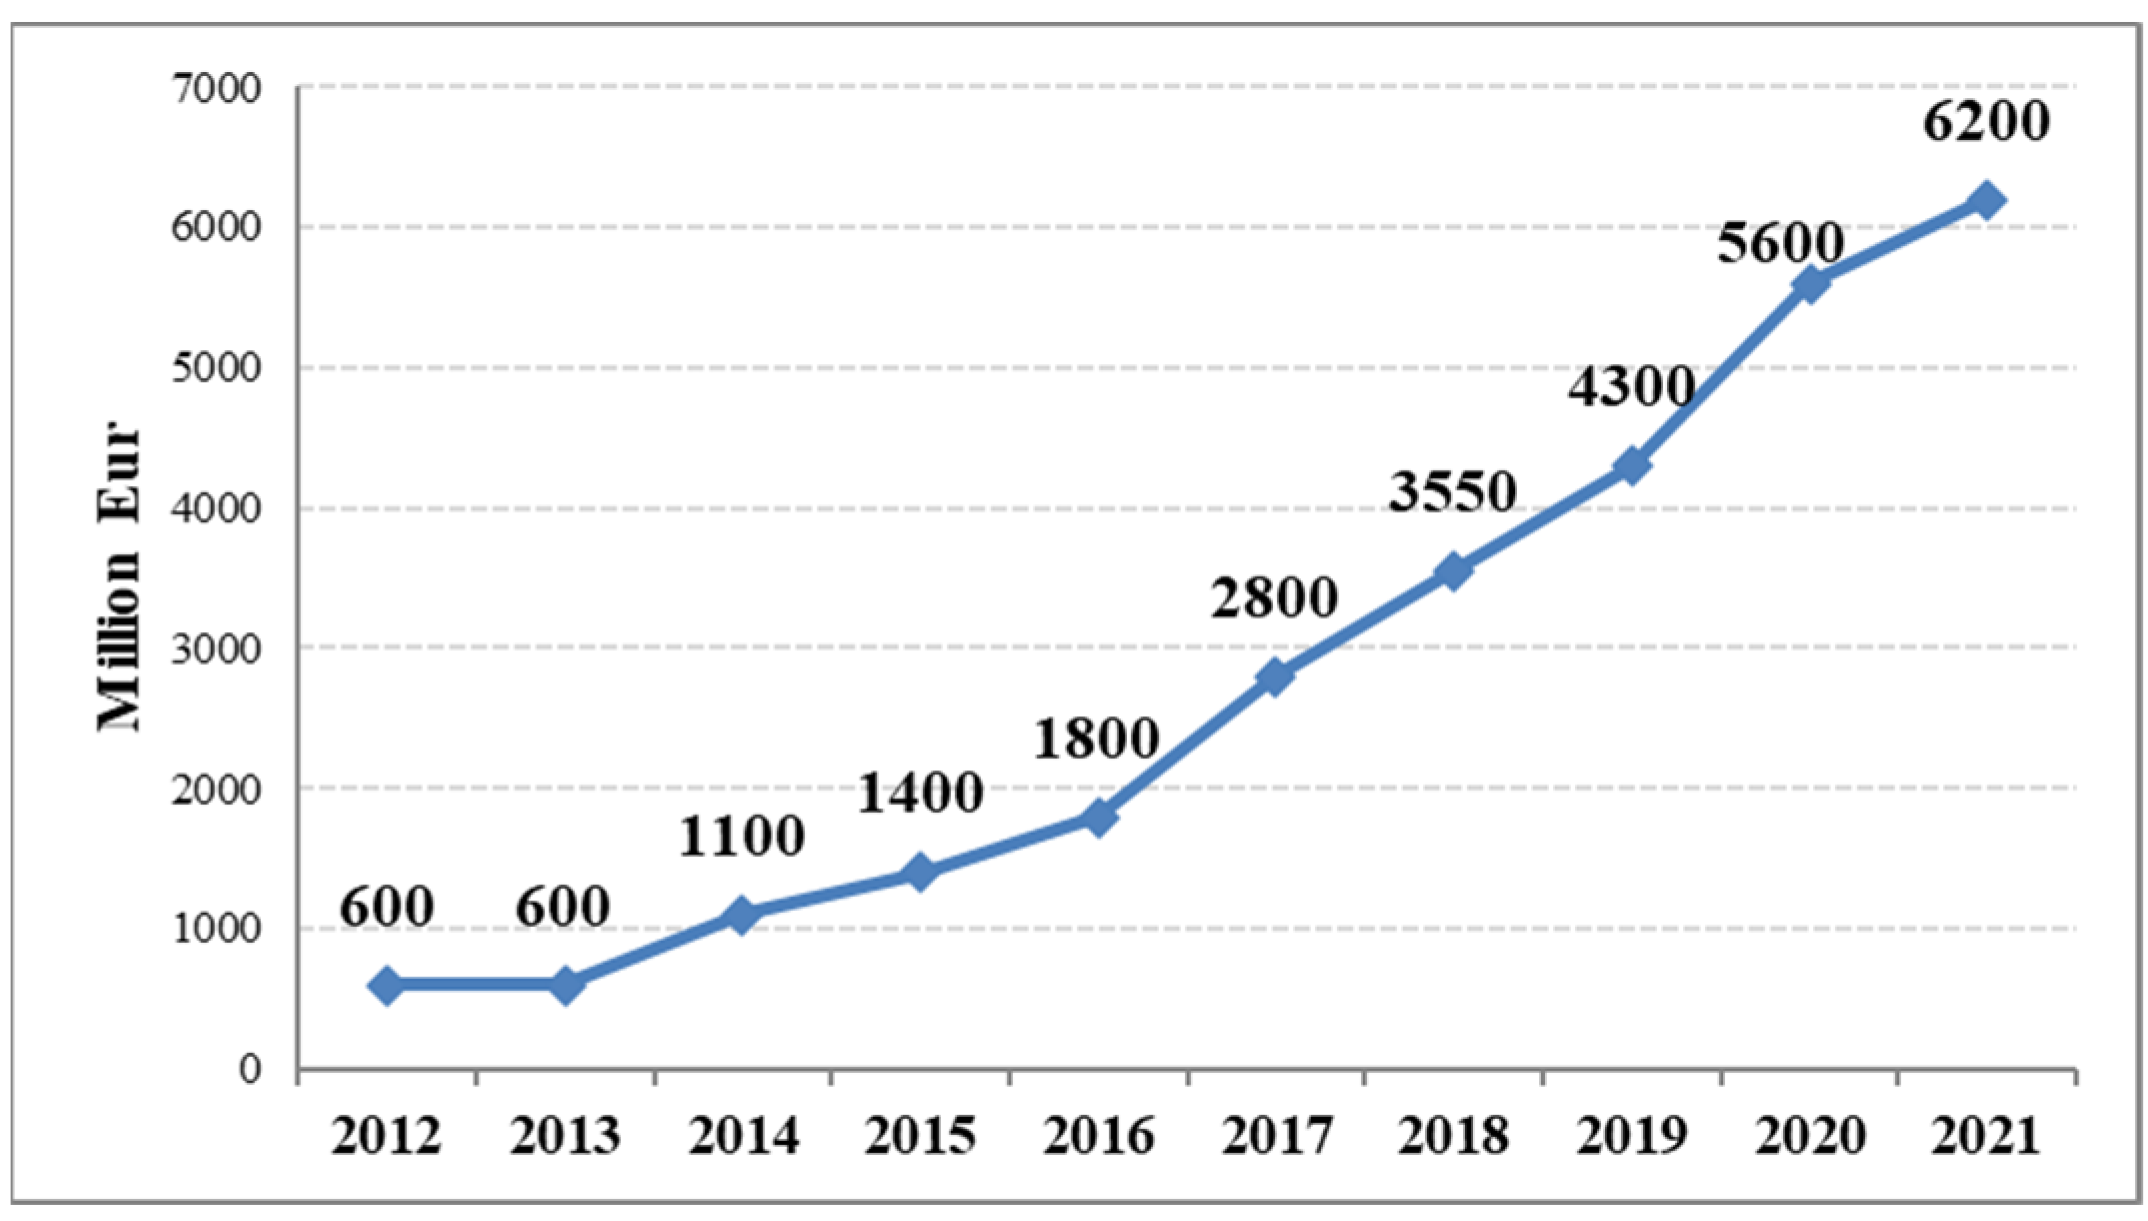
The evolution of online commerce in Romania in recent years has been a significant one. In 2021, the total amount spent on Internet purchases was slightly below the expectations of EUR 6.5 billion, reaching EUR 6.2 billion (Figure 7), with an increase of 10% compared to 2020, lower than the increase from the previous year (30%).
This continuous increase is due to the COVID-19 pandemic that has accelerated the pace of online shopping as well as the penetration of online card payments. According to GpeC [46], during the last 10 years, the Romanian consumers’ orientation towards this new form of commerce has been caused by factors, such as penetration and the intense use of the Internet, wage growth, VAT decreases, and, implicitly, prices. It is also considered that online trade is one of the few industries that grows steadily every year in Romania.
Although electronic sales are an efficient and dynamic business domain, in Romania, the level of online commerce cannot be compared with that of the developed countries in Europe. By the end of 2001, marked by the emergence of the eMAG online store, we could not even talk about the existence of Romanian online trade.
The slow pace of online business development in Romania is influenced by the still low number of people who hold credit cards, which means they cannot pay online, although the payment has become ordinary and one of the most widespread methods of payment in the world. The availability of infrastructure, level of distribution costs, legal, linguistic, and cultural aspects are other impediments that prevent the Romanian business community from developing online trading platforms. In addition to the issue of payment and distribution, the issue of security is also highlighted, as there is a risk that when the credit card number is entered on the Internet for a transaction, it can be intercepted and easily used by hackers.
Based on Eurostat data, the main barriers to online commerce in Romania are the preference for traditional stores for reasons of loyalty or habit, not using Internet for Internet banking for interactions with public authorities, security barriers and lack of necessary skills, and low Internet access penetration in the household as a consequence.
Therefore, in order to attract more people to online purchasing, it is a must to focus, more than ever, on building trust in electronic systems. However, the effort of Romanian companies to improve this bridge of trust seems to be quite limited, as only 19% of enterprises provides e-commerce sales. Businesses currently operating in the traditional economy should want to be present in the online environment with web pages of their offerings in order to assure their awareness and notoriety, even if they do not intend to practice e-commerce.
5. Conclusions
The results of the current study provide a synthesis of indicators that might characterize the e-commerce situation in EU countries. Out of 27 variables, based on PCA, 5 main components were extracted in order to have a better synthetic visualization of e-commerce pattern for all 27 EU countries. Based on Ward clustering, the four groups have different situations in e-commerce. The first cluster, the most comprehensive one, has all the countries that are not so advanced in terms of using the Internet and ordering online, while the countries from cluster 2 could be considered the virtuous ones.
Therefore, we can conclude that the e-commerce pattern in European countries is very much based on online heavy purchasers, triggers of embracing digital, and barriers to not going online. The way that countries choose to attack the other two areas, dynamic in online interaction with public authorities and enterprise e-commerce share, would differentiate the future mapping on e-commerce.
The current context needs to be analyzed from two perspectives. At the governmental level, it is critical to identify the status of e-commerce in countries in comparison to their counterparts in the European context. Creating these kinds of assessments between countries would permit the different European organizations to identify and put into practice policies to endorse the least-advanced areas. At the business level, it is important to realize the requirements and concerns of customers in their use of e-commerce from an overall perspective. Regardless of the pandemic period, e-commerce is now a new reality that must be accepted and acted on, and businesses that do not succeed to assume this challenge will jeopardize not expanding or even consolidating their market share. Based on the results of the previous analysis, countries, such as Bulgaria and Romania, are the most differentiated among these countries as having the lowest triggers of embracing digital, thus, being the least digital savvy, with the lowest number of online consumers and the lowest skills in digital. Romania is the country with the lowest level of online shopping. The main reason is the lack of trust in the online payment system, financial instability, and accessibility to technologies that are too expensive or inconvenient for the Romanian standard of living. The second reason is the very low level of education in IT. However, regardless of the state of a society, technical progress is always required, and there are studies that predict that the level of online shopping in Romania will grow exponentially over time, a fact already revealed during pandemic. Certainly, companies must invest more in their websites and tailor their online platforms in order to provide all necessary information that customers are looking for in their process of taking the decision to buy. Moreover, all people should develop their knowledge of IT and the young generation should study IT-related subjects from primary education.
Building on a strong repository of rigorous research on online commerce patterns, academia has the methodological tools to explore, describe, and further investigate country positioning in the context of e-commerce.
Each of the four clusters revealed in this paper can inspire further in-depth studies that use academia’s methodological repository to either create new or deep insights on why certain phenomena exist or to design new areas to develop or to improve one or more aspects of e-commerce.
Future work needs to be conducted in order to explore new ways to address the identified challenges in the development of e-commerce and m-commerce by protecting vulnerable consumers as well as creating innovative business e-commerce models [38,47]. E-commerce is prepared to continue its growing trend and this places pressure on policy makers to service adoptions that balance development in our societies with sustainability and fairness [7].
Funding
This research received no external funding.
Institutional Review Board Statement
Not applicable.
Informed Consent Statement
Not applicable.
Data Availability Statement
All data are available on request.
Conflicts of Interest
The authors declare no conflict of interest.
References
- Rosário, A.; Raimundo, R. Consumer Marketing Strategy and E-Commerce in the Last Decade: A Literature Review. J. Theor. Appl. Electron. Commer. Res. 2021, 16, 3003–3024. [Google Scholar] [CrossRef]
- Dimitrov, L.O. E-Commerce Shopping in EU Countries during and after Coronavirus Pandemic. Ph.D. Thesis, Technische Hochschule Ingolstadt, Ingolstadt, Germany, 3 June 2021. [Google Scholar]
- Andonov, A.; Dimitrov, G.P.; Totev, V. Impact of E-commerce on Business Performance. TEM J. 2021, 10, 1558–1564. [Google Scholar] [CrossRef]
- Treiblmaier, H.; Sillaber, C. The impact of blockchain on e-commerce: A framework for salient research topics. Electron. Commer. Res. Appl. 2021, 48, 101054. [Google Scholar] [CrossRef]
- Tolstoy, D.; Nordman, E.R.; Vu, U. The indirect effect of online marketing capabilities on the international performance of e-commerce SMEs. Int. Bus. Rev. 2022, 31, 101946. [Google Scholar] [CrossRef]
- Svobodová, Z.; Rajchlová, J. Strategic Behavior of E-Commerce Businesses in Online Industry of Electronics from a Customer Perspective. Adm. Sci. 2020, 10, 78. [Google Scholar] [CrossRef]
- D’Adamo, I.; González-Sánchez, R.; Medina-Salgado, M.S.; Settembre-Blundo, D. E-Commerce Calls for Cyber-Security and Sustainability: How European Citizens Look for a Trusted Online Environment. Sustainability 2021, 13, 6752. [Google Scholar] [CrossRef]
- Gu, S.; Ślusarczyk, B.; Hajizada, S.; Kovalyova, I.; Sakhbieva, A. Impact of the COVID-19 Pandemic on Online Consumer Purchasing Behavior. J. Theor. Appl. Electron. Commer. Res. 2021, 16, 2263–2281. [Google Scholar] [CrossRef]
- Zumstein, D.; Oswald, C.; Brauer, C. Development of E-Commerce in Times of the Corona Crisis, International Conferences e-Society 2022 and Mobile Learning 2022. 2022. Available online: https://www.researchgate.net/publication/359191166_Development_of_E-Commerce_in_Times_of_the_Corona_Crisis (accessed on 15 October 2022).
- Silveira, P.; Morais, R.; Petrella, S. A Communication Study of Young Adults and Online Dependency during the COVID-19 Pandemic. Societies 2022, 12, 109. [Google Scholar] [CrossRef]
- Safa, S.E.N.; de Figueiredo, S.A. Impact of COVID-19 Pandemic on Financial Inclusion and Digital Adoption. J. Bus. Manag. Stud. 2021, 3, 108–119. [Google Scholar]
- Quelch, J.A.; Lisa, R.K. The Internet and International Marketing. Sloan Manag. Rev. 1996, 37, 60–75. [Google Scholar]
- Hamill, J.; Gregory, K. Internet Marketing in the Internationalisation of UK SME’s. J. Mark. Manag. 1997, 13, 9–28. [Google Scholar] [CrossRef]
- Zhelyazkova, V. E-Commerce and Distance Selling in the European Union. Int. Conf. Knowl. Based Organ. 2020, 26, 262–267. [Google Scholar] [CrossRef]
- D’Adamo, I.; González-Sánchez, R.; Medina-Salgado, M.S.; Settembre-Blundo, D. Methodological Perspective for Assessing European Consumers’ Awareness of Cybersecurity and Sustainability in E-Commerce. Sustainability 2021, 13, 11343. [Google Scholar] [CrossRef]
- Tutsch, C. Think locally, fight globally. Comput. Fraud. Secur. 2016, 2016, 5–8. [Google Scholar] [CrossRef]
- Nawi, N.C.; Al Mamun, A.; Hamsani, N.H.B.; Muhayiddin, M.N.B. Effect of Consumer Demographics and Risk Factors on Online Purchase Behaviour in Malaysia. Societies 2019, 9, 10. [Google Scholar] [CrossRef] [Green Version]
- Alkis, A.; Kose, T. Privacy concerns in consumer E-commerce activities and response to social media advertising: Empirical evidence from Europe. Comput. Hum. Behav. 2022, 137, 107412. [Google Scholar] [CrossRef]
- Lin, W.B. Construction of on-line consumer behavior models: A comparative study of industries in Taiwan. Int. J. Commer. Manag. 2008, 18, 123–149. [Google Scholar] [CrossRef]
- Paris, D.L.; Bahari, M.; Iahad, N.A. Exploring Implementation Factors Influencing Business-to-Customer (B2C) e-Commerce. Adv. Sci. Lett. 2015, 21, 1455–1459. [Google Scholar] [CrossRef]
- Straub, J.; Spradling, M.; Fedor, B. Assessment of Factors Impacting the Perception of Online Content Trustworthiness by Age, Education and Gender. Societies 2022, 12, 61. [Google Scholar] [CrossRef]
- Goyal, S.; Esposito, M.; Sergi, B. Literature Review of Emerging Trends and Future Directions of E-Commerce in Global Business Landscape. World Rev. Entrep. Manag. Sustain. Dev. 2019, 15, 226–255. [Google Scholar] [CrossRef]
- Xifei, F.; Jin, Q. The Five Dimensions of E-tailing Service Reliability. J. Mark. Dev. Compet. 2015, 9, 83–92. [Google Scholar]
- Vărzaru, A.A.; Bocean, C.G. A Two-Stage SEM–Artificial Neural Network Analysis of Mobile Commerce and Its Drivers. J. Theor. Appl. Electron. Commer. Res. 2021, 16, 2304–2318. [Google Scholar] [CrossRef]
- Campisi, T.; Russo, A.; Tesoriere, G.; Bouhouras, E.; Basbas, S. COVID-19’s Effects over E-commerce: A Preliminary Statistical Assessment for Some European Countries. In Computational Science and Its Applications—ICCSA 2021; Gervasi, O., Murgante, B., Misra, S., Garau, C., Blečić, I., Taniar, D., Apduhan, B.O., Rocha, A.M.A.C., Tarantino, E., Torre, C.M., Eds.; ICCSA 2021; Lecture Notes in Computer Science; Springer: Cham, Switzerland, 2021; Volume 12954. [Google Scholar] [CrossRef]
- Koch, J.; Frommeyer, B.; Schewe, G. Online Shopping Motives during the COVID-19 Pandemic—Lessons from the Crisis. Sustainability 2020, 12, 10247. [Google Scholar] [CrossRef]
- Guthrie, C.; Fosso-Wamba, S.; Arnaud, J.B. Online consumer resilience during a pandemic: An exploratory study of e-commerce behavior before, during and after a COVID-19 lockdown. J. Retail. Consum. Serv. 2021, 61, 102570. [Google Scholar] [CrossRef]
- Mazorenko, O.V. How COVID-19 pandemic boosts the European and Ukrainian electronic commerce. Econ. Soc. 2021, 25, 25–59. [Google Scholar]
- Ballestar, M.T. Editorial: Segmenting the Future of E-Commerce, One Step at a Time. J. Theor. Appl. Electron. Commer. Res. 2021, 16, i–iii. [Google Scholar] [CrossRef]
- Florea, N.V.; Ionescu, C.A.; Duică, M.C.; Căpușneanu, S.; Paschia, L.; Stanescu, S.G.; Coman, M.D. Trends and Perspectives of Romanian E-Commerce Sector Based on Mathematical Simulation. Electronics 2022, 11, 2295. [Google Scholar] [CrossRef]
- Comanescu, A.S. Post-Pandemic Challenges and Evolutions for the Romanian E-Commerce Market; “Ovidius” University Annals, Economic Sciences Series; Ovidius University of Constanța: Constanța, Romania, 2021; Volume XXI, Available online: https://stec.univ-ovidius.ro/html/anale/RO/2021-2/Section%204/44.pdf (accessed on 9 October 2022).
- Hategan, C.-D.; Pitorac, R.-I.; Hategan, V.-P.; Imbrescu, C.M. Opportunities and Challenges of Companies from the Romanian E-Commerce Market for Sustainable Competitiveness. Sustainability 2021, 13, 13358. [Google Scholar] [CrossRef]
- Tita, R.F. The Utility of Blockchain Technology in the Electronic Commerce of Tourism Services: An Exploratory Study on Romanian Consumers. Sustainability 2022, 14, 943. [Google Scholar] [CrossRef]
- Lup, P.S.; Negrea, R.; Proștean, G. Testing the Trust Dimensions of Romanian Consumers in E-Commerce for Electronic and Household Appliances. Acta Tech. Napoc. Ser. Appl. Math. Mech. Eng. 2021, 64, 265–274. Available online: https://atna-mam.utcluj.ro/index.php/Acta/article/view/1519 (accessed on 15 October 2022).
- Purcarea, I.M. The Digital Transformation and E-Commerce. Holist. Mark. Manag. J. 2022, 12, 40–67. [Google Scholar]
- Verhoef, P.C.; Broekhuizen, T.; Bart, Y.; Bhattacharya, A.; Dong, J.Q.; Fabian, N.; Haenlein, M. Digital transformation: A multidisciplinary reflection and research agenda. J. Bus. Res. 2021, 122, 889–901. [Google Scholar] [CrossRef]
- Costa, J.; Castro, R. SMEs Must Go Online—E-Commerce as an Escape Hatch for Resilience and Survivability. J. Theor. Appl. Electron. Commer. Res. 2021, 16, 3043–3062. [Google Scholar] [CrossRef]
- Paraschiv, D.M.; Țițan, E.; Manea, D.I.; Ionescu, C.D.; Mihai, M.; Șerban, O. The change in e-commerce in the context of the Coronavirus pandemic. Manag. Mark. Chall. Knowl. Soc. 2022, 17, 220–233. [Google Scholar] [CrossRef]
- Boboc, C. Analiza Statistica Multidimensionala. Aplicații in Studiul Calității Produselor și Serviciilor; Publisher Meteor Press: Bucharest, Romania, 2007; ISBN 978-973-728-241-5. [Google Scholar]
- Leogrande, A. The Turnover of e-Commerce of SMEs in Europe. Available online: https://www.researchgate.net/profile/Angelo-Leogrande/publication/361553143_The_Turnover_of_e-Commerce_of_SMEs_in_Europe/links/62b89deddc817901fc7e853a/The-Turnover-of-e-Commerce-of-SMEs-in-Europe.pdf (accessed on 15 November 2022).
- Gallego, M.D.; Bueno, S.; Terreno, J.F. Motivations and barriers to set up e-commerce in Spain: A Delphi study. Estud. Gerenc. 2016, 32, 221–227. [Google Scholar] [CrossRef]
- Fernández-Bonilla, F.; Gijón, C.; De la Vega, B. E-commerce in Spain: Determining factors and the importance of the e-trust. Telecommun. Policy 2022, 46, 102280. [Google Scholar] [CrossRef]
- Palandi, V.C. Analysis and Projection of Ecommerce in Portugal. Master’s Dissertation, University of Lisbon, Higher Institute of Economics and Management, Lisbon, Portugal, 2021. Available online: http://hdl.handle.net/10400.5/22752 (accessed on 15 November 2022).
- Khoury, E.M.; Antoniou, P.; Grande, C.; Estphan, J.; Constantinou, G. E-Commerce in Cyprus One Year after COVID in the Food & Beverage and Electronics Sectors; Faculty of Economics and Management, University of Cyprus: Nicosia, Cyprus, 2021. [Google Scholar]
- Available online: https://www.trade.gov/trade-search?q=ecommerce (accessed on 15 November 2022).
- GpeC. 20 Trends in Digital Marketing for E-Commerce in 2018; GpeC: Phoenix, AZ, USA, 2018. [Google Scholar]
- Dumanska, I.; Hrytsyna, L.; Kharun, O.; Matviiets, O. E-Commerce and MCommerce as Global Trends of International Trade Caused by the COVID-19 Pandemic. Wseas Trans. Environ. Dev. 2021, 17, 386–397. [Google Scholar] [CrossRef]
Figure 1.
Last online purchases in the 12 months vs. dynamic in last purchases in the last 12 months across European countries in 2020 vs. 2019. Source data: own representation based on Eurostat data, 2020.
Figure 1.
Last online purchases in the 12 months vs. dynamic in last purchases in the last 12 months across European countries in 2020 vs. 2019. Source data: own representation based on Eurostat data, 2020.

Figure 2.
Enterprises with e-commerce sales vs. dynamic in internet usage based on interaction with public authorities in the 12 months across European countries in 2020 vs. 2019. Source data: own representation based on Eurostat data, 2020.
Figure 2.
Enterprises with e-commerce sales vs. dynamic in internet usage based on interaction with public authorities in the 12 months across European countries in 2020 vs. 2019. Source data: own representation based on Eurostat data, 2020.

Figure 3.
The conceptual research model.

Figure 4.
Dendrogram using Ward clustering. Source data: own representation based on Eurostat databases 2020 using SPSS.
Figure 4.
Dendrogram using Ward clustering. Source data: own representation based on Eurostat databases 2020 using SPSS.

Figure 5.
Projection of countries on the first five principal components. Source data: own representation based on Eurostat databases 2020.
Figure 5.
Projection of countries on the first five principal components. Source data: own representation based on Eurostat databases 2020.

Figure 6.
Percentage of consumers of goods and services for personal use at the European Union level for 2020 and increase versus 2019. Source data: own representation based on Eurostat database.
Figure 6.
Percentage of consumers of goods and services for personal use at the European Union level for 2020 and increase versus 2019. Source data: own representation based on Eurostat database.

Figure 7.
Online sales value in Romania 2012–2020 (without services, only tangible goods included) Source data: own representation based on GpeC blog.
Figure 7.
Online sales value in Romania 2012–2020 (without services, only tangible goods included) Source data: own representation based on GpeC blog.


Table 1.
Rotated component matrix (PCA).
| Component | |||||
|---|---|---|---|---|---|
| 1 | 2 | 3 | 4 | 5 | |
| 2020_Online purchases (3 months): printed books, magazines or newspapers | 0.894 | 0.246 | −0.140 | −0.001 | −0.069 |
| 2020_Online purchases (3 months): clothes (including sport clothing), shoes or accessories | 0.894 | 0.309 | −0.209 | 0.027 | 0.071 |
| 2020_Online purchases (3 months): furniture, home accessories or gardening products | 0.863 | 0.340 | −0.170 | 0.082 | −0.043 |
| 2020_Online purchases (3 months): films or series as a streaming service or downloads | 0.855 | 0.238 | −0.064 | 0.248 | 0.088 |
| 2020_Online purchases (3 months): deliveries from restaurants, fast-food chains, catering services | 0.853 | 0.154 | 0.092 | 0.231 | −0.022 |
| 2020_Online purchases (3 months): music as a streaming service or downloads | 0.845 | 0.263 | −0.155 | 0.274 | 0.004 |
| 2020_Frequency of online purchases in the last 3 months: more than 10 times | 0.863 | 0.273 | −0.093 | 0.121 | −0.038 |
| 2020_Frequency of online purchases in the last 3 months: 6 to 10 times | 0.814 | 0.338 | −0.093 | 0.151 | 0.142 |
| 2020_Frequency of online purchases in the last 3 months: 3 to 5 times | 0.783 | 0.494 | −0.169 | 0.131 | 0.007 |
| 2020_Last online purchase: in the last 3 months | 0.810 | 0.522 | −0.207 | 0.059 | 0.064 |
| 2020_Last online purchase: in the 12 months | 0.778 | 0.547 | −0.224 | 0.125 | −0.014 |
| 2020_Internet access penetration in households | 0.713 | 0.373 | 0.087 | 0.088 | −0.365 |
| 2019_Individuals who have above basic overall digital skills | 0.692 | 0.593 | 0.125 | 0.211 | 0.127 |
| 2019_Individuals who have not ordered goods or services over the internet, because they prefer to shop in person, they like to see product, loyalty to shops or force of habit | −0.602 | −0.520 | 0.483 | 0.010 | −0.053 |
| 20/19_Internet access penetration in households | −0.576 | −0.170 | 0.293 | −0.267 | −0.126 |
| 2020_Individuals using the internet for internet banking | 0.514 | 0.748 | −0.033 | 0.369 | −0.026 |
| 2020_Internet use: interaction with public authorities (last 12 months) | 0.481 | 0.708 | 0.011 | 0.403 | 0.000 |
| 2020_Frequency of online purchases in the last 3 months: 1 or 2 times | 0.292 | 0.635 | −0.218 | −0.156 | −0.006 |
| 2020_Online purchases (3 months): at least one of the financial activities | 0.218 | 0.591 | −0.148 | 0.542 | −0.116 |
| 20/19_Last online purchase: in the 12 months cities | −0.352 | −0.773 | −0.060 | −0.084 | 0.051 |
| 20/19_Individuals using the internet for internet banking | −0.358 | −0.846 | 0.101 | −0.004 | −0.048 |
| 2019_Individuals who have not ordered goods or services over the internet, because of trust concerns about receiving or returning goods, complaint/redress concerns | −0.158 | −0.016 | 0.921 | −0.029 | 0.008 |
| 2019_Individuals who have not bought/ordered goods or services over the internet for their own private use, because: Payment security concerns | −0.101 | 0.091 | 0.917 | −0.097 | 0.174 |
| 2019_Individuals who have not ordered goods or services over the internet, because they don’t have a payment card | −0.049 | −0.368 | 0.736 | −0.008 | −0.276 |
| 20/19_Internet use: interaction with public authorities (last 12 months) | −0.270 | −0.026 | 0.061 | −0.816 | −0.079 |
| 2020_Enterprises with e-commerce sales | 0.412 | 0.277 | −0.098 | 0.138 | 0.667 |
| 20/19_Enterprises with e-commerce sales | −0.302 | −0.458 | 0.125 | −0.044 | 0.663 |
Extraction method: PCA. Rotation Method: Varimax. Source data: Eurostat database.
Disclaimer/Publisher’s Note: The statements, opinions and data contained in all publications are solely those of the individual author(s) and contributor(s) and not of MDPI and/or the editor(s). MDPI and/or the editor(s) disclaim responsibility for any injury to people or property resulting from any ideas, methods, instructions or products referred to in the content. |
© 2022 by the author. Licensee MDPI, Basel, Switzerland. This article is an open access article distributed under the terms and conditions of the Creative Commons Attribution (CC BY) license (https://creativecommons.org/licenses/by/4.0/).
Share and Cite
MDPI and ACS Style
Burlacioiu, C. Online Commerce Pattern in European Union Countries between 2019 and 2020. Societies 2023, 13, 4. https://doi.org/10.3390/soc13010004
AMA Style
Burlacioiu C. Online Commerce Pattern in European Union Countries between 2019 and 2020. Societies. 2023; 13(1):4. https://doi.org/10.3390/soc13010004
Chicago/Turabian StyleBurlacioiu, Cristina. 2023. "Online Commerce Pattern in European Union Countries between 2019 and 2020" Societies 13, no. 1: 4. https://doi.org/10.3390/soc13010004
Note that from the first issue of 2016, this journal uses article numbers instead of page numbers. See further details here.