


Digitalization of Educational Organizations: Evaluation and Improvement Based on DigCompOrg Model


Abstract
:1. Introduction
2. Research Problem and Objectives
- Evaluating the digital capacity of the educational institution based on the perception of the main agents involved (school leaders, teachers and students).
- Analyzing the improvement processes through a longitudinal analysis that allows us to observe the evolution of the study over time.
3. Materials and Methods
3.1. Participants
3.2. Phases
3.3. Instruments to Collect Data
3.4. Procedure
4. Results
4.1. Leadership
4.2. Collaboration and Networking
4.3. Infrastructure and Equipment
4.4. Continuing Professional Development
4.5. Pedagogy: Supports and Resources
4.6. Pedagogy: Implementation in the Classroom
4.7. Assessment Practices
4.8. Student Digital Competence
5. Discussion and Conclusions
Author Contributions
Funding
Institutional Review Board Statement
Informed Consent Statement
Data Availability Statement
Acknowledgments
Conflicts of Interest
References
- Rodríguez-Alayo, A.O.; Cabell-Rosales, N.V. Importancia de la competencia digital docente en el confinamiento social. Polo Conoc. 2021, 6, 1091–1109. [Google Scholar] [CrossRef]
- Teräs, M.; Suoranta, J.; Teräs, H.; Curcher, M. Post-Covid-19 education and education technology ‘solutionism’: A seller’s market. Postdigit. Sci. Educ. 2020, 2, 863–878. [Google Scholar] [CrossRef]
- European Commission. Digital Education Action Plan (2021–2027). 2020. Available online: https://education.ec.europa.eu/focus-topics/digital-education/action-plan (accessed on 3 October 2022).
- Castaño-Muñoz, J.; Weikert García, L. La Capacidad Digital de los Centros Educativos de España. Muestra Representativa a Través de la Herramienta SELFIE. CINE-2011 2. 1º, 2º y 3º ESO; Oficina de Publicaciones de la Unión Europea: Luxemburg, 2021. [Google Scholar] [CrossRef]
- Rawashdeh, M.; Almasarweh, M.S.; Alhyasat, E.B.; Rawashdeh, O.M. The relationship between the quality knowledge management and organizational performance via the mediating role of organizational learning. Int. J. Qual. Res. 2021, 15, 373–386. [Google Scholar] [CrossRef]
- Wang, Z.; Zong, K.; Jin, K.H. The Multinational New Ventures on Corporate Performance Under the Work Environment and Innovation Behavior. Front. Psychol. 2022, 13, 762331. [Google Scholar] [CrossRef] [PubMed]
- Tight, M. Twenty-first century skills: Meaning, usage and value. Eur. J. High. Educ. 2020, 11, 160–174. [Google Scholar] [CrossRef]
- United Nations Educational Scientific and Cultural Organization (UNESCO). Education: From Disruption to Recovery. 2020. Available online: https://en.unesco.org/covid19/educationresponse/ (accessed on 3 October 2022).
- European Council. Recommendation of the European Parliament and of the Council of 18 December 2006 on Key Competences for Lifelong Learning; Publications Office of the European Union: Luxembourg, 2006; Available online: https://eur-lex.europa.eu/LexUriServ/LexUriServ.do?uri=OJ:L:2006:394:0010:0018:en:PDF (accessed on 3 October 2022).
- Valverde-Crespo, D.; Pro-Bueno, A.J.; González-Sánchez, J. La competencia informacional-digital en la enseñanza y aprendizaje de las ciencias en la educación secundaria obligatoria actual: Una revisión teórica. Rev. Eureka Enseñanza Divulg. Cienc. 2018, 15, 2105. [Google Scholar] [CrossRef]
- Ferrari, A. DIGCOMP: A Framework for Developing and Understanding Digital Competence in Europe; Publications Office of the European Union: Luxembourg, 2013. [Google Scholar] [CrossRef]
- Vuorikari, R.; Punie, Y.; Gomez, S.C.; Van Den Brande, G. DigComp 2.0: The Digital Competence Framework for Citizens. Update Phase 1: The Conceptual Reference Model; Publications Office of the European Union: Luxembourg, 2016. [Google Scholar] [CrossRef]
- Redecker, C.; Punie, Y. Digital Competence Framework for Educators (DigCompEdu); Publications Office of the European Union: Luxembourg, 2017; Available online: https://joint-research-centre.ec.europa.eu/digcompedu_en (accessed on 3 October 2022).
- Bacigalupo, M. Competence frameworks as orienteering tools. RiiTE Rev. Interuniv. Investig. Tecnol. Educ. 2022, 12, 20–33. [Google Scholar] [CrossRef]
- Kampylis, P.; Punie, Y.; Devine, J. Promoting Effective Digital-Age Learning. A European Framework for Digitally-Competent Educational Organisations; Publications Office of the European Union: Luxembourg, 2015; Available online: https://doi.org/10.2791/54070 (accessed on 3 October 2022).
- Balaban, I.; Redjep, N.B.; Calopa, M.K. The Analysis of Digital Maturity of Schools in Croatia. Int. J. Emerg. Technol. Learn. 2018, 6, 4–15. [Google Scholar] [CrossRef] [Green Version]
- Chopra, N. E-governance Framework to Measure Digital Competence of HEIs in India. Eur. Sci. J. 2019, 15, 181–193. [Google Scholar] [CrossRef] [Green Version]
- Fernández Miravete, Á.D.; Prendes Espinosa, M.P. Marco Europeo para Organizaciones Educativas Digitalmente Competentes: Revisión sistemática 2015–2020. Rev. Fuentes 2022, 24, 65–76. [Google Scholar] [CrossRef]
- Giunti, C.; Naldini, M.; Orlandini, L. Professional development to support teaching innovation. The experiences of the schools leading the Avanguardie Educative Movement. Form@re Re-Open J. Form. Rete 2018, 18, 103–115. [Google Scholar] [CrossRef]
- European Commission. SELFIE, Self-Reflection on Effective Learning by Fostering the Use of Innovative Educational Technologies. 2018. Available online: https://education.ec.europa.eu/es/selfie (accessed on 3 October 2022).
- European Commission. SELFIEforTEACHERS, Self-Reflection on Effective Learning by Fostering the Use of Innovative Educational Technologies for Teachers. 2021. Available online: https://education.ec.europa.eu/selfie-for-teachers (accessed on 3 October 2022).
- Bourgeois, A.; Birch, P.; Davydovskaia, O. Digital Education at School in Europe. Eurydice Report; Publications Office of the European Union: Luxembourg, 2019. [Google Scholar] [CrossRef]
- Gobierno de España. Ley Orgánica 3/2020, de 29 de Diciembre, por la que se Modifica la Ley Orgánica 2/2006, de 3 de Mayo, de Educación; Boletín Oficial del Estado: Madrid, España, 2020; Available online: https://boe.es/boe/dias/2020/12/30/pdfs/BOE-A-2020-17264.pdf (accessed on 3 October 2022).
- Agut, M.; del Pilar, M. Análisis de la LOMLOE (Ley Orgánica 3/2020, de 29 de diciembre, por la que se modifica la ley orgánica 2/2006, de 3 de mayo, de educación) y su repercusión en los profesionales de la educación no formal: Equidad, inclusión, servicio a la comunidad (APS), educación para la sostenibilidad y la ciudadanía mundial. Quad. Anim. Educ. Soc. 2021, 33, 1–20. Available online: https://hdl.handle.net/10550/80813 (accessed on 3 October 2022).
- Cabero-Almenara, J.; Fernández Romero, C.; Palacios Rodríguez, A.D.P. La competencia digital educativa en Andalucía (España). El programa# PRODIG. Temas Comun. 2020, 41, 59–71. Available online: https://revistasenlinea.saber.ucab.edu.ve/index.php/temas/article/view/4730 (accessed on 3 October 2022).
- Cabero-Almenara, J.; Barragán-Sánchez, R.; Palacios-Rodríguez, A.D.P. DigCompOrg: Marco de referencia para la transformación digital de los centros educativos andaluces. Eco Rev. Digit. Educ. Form. Profr. 2021, 18, 1–21. Available online: https://hdl.handle.net/11441/107955 (accessed on 3 October 2022).
- Casillas-Martín, S.; Cabezas-González, M.; García-Valcárcel, A. Análisis psicométrico de una prueba para evaluar la competencia digital de estudiantes de Educación Obligatoria. RELIEVE Rev. Electron. Investig. Eval. Educ. 2020, 26, 1–22. [Google Scholar] [CrossRef]
- Consejería de Educación y Universidades de la Región de Murcia. Resolución de 21 de Marzo de 2017, de la Dirección General de Innovación Educativa y Atención a la Diversidad para el Desarrollo del Programa: Centros Digitales; Boletín Oficial de la Región de Murcia: Región de Murcia, España, 2017; Available online: https://programaseducativos.es/programa/centros-digitales/ (accessed on 3 October 2022).
- Consejería de Educación y Cultura de la Región de Murcia. Resolución de 16 de Noviembre de 2021de la Consejería de Educación y Cultura por la que se Dictan Instrucciones sobre el Plan Prodigi-e para la Transformación Digital Educativa de la Región de Murcia y su Implantación en el Curso Escolar 2021–2022; Boletín Oficial de la Región de Murcia: Región de Murcia, España, 2021; Available online: https://servicios.educarm.es/templates/portal/ficheros/websDinamicas/45/Res%20instrucciones%20y%20su%20implantacion%202021-22%20CI%20259846.pdf (accessed on 3 October 2022).
- Instituto Nacional de Tecnologías Educativas y de Formación del Profesorado (INTEF). El Plan Digital de Centro. Un Marco para la Integración de las Tecnologías. 2020. Available online: https://intef.es/wp-content/uploads/2020/07/2020_0707_Plan-Digital-deCentro_-INTEF.pdf (accessed on 3 October 2022).
- Beardsley, M.; Albó, L.; Aragón, P.; Hernández-Leo, D. Emergency education effects on teacher abilities and motivation to use digital technologies. Br. J. Educ. Technol. 2021, 52, 1455–1477. [Google Scholar] [CrossRef]
- Begicevic Redjep, N.; Balaban, I.; Zugec, B. Assessing digital maturity of schools: Framework and instrument. Technol. Pedagog. Educ. 2021, 30, 643–658. [Google Scholar] [CrossRef]
- Bocconi, S.; Panesi, S.; Kampylis, P. Fostering the digital competence of schools: Piloting SELFIE in the Italian education context. IEEE-Rev. Iberoam. Tecnol. Aprendiz. 2020, 15, 417–425. [Google Scholar] [CrossRef]
- Castaño-Muñoz, J.; Pokropek, A.; Weikert García, L. For to all those who have, will more be given? Evidence from the adoption of the SELFIE tool for the digital capacity of schools in Spain. Br. J. Educ. Technol. 2022, 53, 1937–1955. [Google Scholar] [CrossRef]
- Castaño-Muñoz, J.; Weikert García, L.; Herrero Rámila, C. Analysing the Digital Capacity of Spanish Schools Using SELFIE; Publications Office of the European Union: Luxembourg, 2021. [Google Scholar] [CrossRef]
- Mišianiková, A.; Hubeňáková, V.; Kireš, M.; Babinčáková, M.; Šveda, D.; Šafárik, P.J. Assessment of Digitalization in Primary and Secondary Schools by SELFIE Survey as a part of School Leaders Training. In Proceedings of the 2021 19th International Conference on Emerging eLearning Technologies and Applications (ICETA), Košice, Slovakia, 11–12 November 2021. [Google Scholar] [CrossRef]
- Panesi, S.; Bocconi, S.; Ferlino, L. Promoting Students’ Well-Being and Inclusion in Schools Through Digital Technologies: Perceptions of Students, Teachers, and School Leaders in Italy Expressed Through SELFIE Piloting Activities. Front. Psychol. 2020, 11, 1563. [Google Scholar] [CrossRef]
- Arnal, J.; Rincón, D.; Latorre, A. Bases Metodológicas de la Investigación Educativa; Ediciones Experiencia S.L.: Barcelona, España, 2003. [Google Scholar]
- Escudero, T. La investigación evaluativa en el Siglo XXI: Un instrumento para el desarrollo educativo y social cada vez más relevante. RELIEVE Rev. Electron. Investig. Eval. Educ. 2016, 22, 1–21. [Google Scholar] [CrossRef] [Green Version]
- Creswell, J.W. Research Design. Qualitative, Quantitative and Mixed Methods Approaches; Sage publications: London, UK, 2009; p. 31. [Google Scholar]
- Molenda, M. In search of the elusive ADDIE model. Perform. Improv. 2003, 42, 34–37. [Google Scholar] [CrossRef]
- Morales-González, B.; Edel-Navarro, R.; Aguirre-Aguilar, G. Modelo ADDIE (Análisis, Diseño, Desarrollo, Implementación y Evaluación): Su Aplicación en Ambientes Educativos. In Los Modelos Tecno-Educativos, Revolucionando el Aprendizaje del Siglo XXI, 1st ed.; Esquivel Gámez, I., Ed.; Veracruz: México, Mexico, 2014; pp. 33–46. Available online: https://www.uv.mx/personal/iesquivel/files/2015/03/los_modelos_tecno_educativos__revolucionando_el_aprendizaje_del_siglo_xxi-4.pdf#page=33 (accessed on 3 October 2022).
- Fernández-Miravete, Á.D.; Prendes-Espinosa, M.P. Evaluación de la competencia digital de una organización educativa de enseñanza secundaria a partir del modelo DigCompOrg. Rev. Complutense de Educ. 2021, 32, 651–661. [Google Scholar] [CrossRef]
- Fernández-Miravete, Á.D.; Prendes-Espinosa, M.P. Análisis del proceso de digitalización de un centro de Enseñanza Secundaria desde el modelo DigCompOrg. RELATEC- Rev. Latinoam. Tecnol. Educ. 2021, 20, 9–25. [Google Scholar] [CrossRef]
- Fernández-Miravete, Á.D.; Prendes-Espinosa, M.P. Evaluación del proceso de digitalización de un centro de Enseñanza Secundaria con la herramienta SELFIE. Contextos Educ. 2022, 30, 99–116. [Google Scholar] [CrossRef]
- Riesco González, M. La Investigación Cualitativa. In Fundamentos Básicos de Metodología de Investigación Educativa, 1st ed.; Quintanal, J., García, B., Eds.; Editorial CCS: Madrid, España, 2012; pp. 93–134. [Google Scholar]
- Hippe, R.; Brolpito, A.; Broek, S. SELFIE for Work-Based Learning; Publications Office of the European Union: Luxembourg, 2006. [Google Scholar] [CrossRef]
- Brolpito, A.; Lightfoot, M.; Radišic, J.; Šcepanovic, D. Digital and Online Learning in Vocational Education and Training in Serbia: A Case Study; European Training Foundation (ETF): Turin, Italy, 2016; Available online: https://www.etf.europa.eu/sites/default/files/m/DC024C02AA9B9384C12580280043A0B6_DOL%20in%20VET%20in%20Serbia.pdf (accessed on 3 October 2022).
- González, A.; Urdaneta, K.; Muñoz, D. Liderazgo organizacional y responsabilidad socioambiental, una mirada desde la complejidad y postmodernidad. Rev. Venez. Gerencia 2017, 22, 11–23. Available online: https://www.redalyc.org/pdf/290/29051457002.pdf (accessed on 3 October 2022). [CrossRef]
- Maureira Cabrera, Ó.J. Prácticas del liderazgo educativo: Una mirada evolutiva e ilustrativa a partir de sus principales marcos, dimensiones e indicadores más representativos. Rev. Educ. 2018, 42, 1–19. [Google Scholar] [CrossRef] [Green Version]
- Sosa-Díaz, M.J.; Sierra-Daza, M.C.; Arriazu-Muñoz, R.; Llamas-Salguero, F.; Durán-Rodríguez, N. “EdTech Integration Framework in Schools”: Systematic Review of the Literature. Front. Educ. 2022, 7, 895042. [Google Scholar] [CrossRef]
- López, A.J.G.; Lanzat, A.M.A.; González, M.L.C. Análisis de la capacidad de innovación escolar desde la perspectiva del profesorado de educación secundaria. La escuela como organización que aprende. Educar 2018, 54, 449–468. [Google Scholar] [CrossRef]
- Quispe, M.A.F.; García, R.S.B.; Borjas, L.G.R. Organización educativa que aprende: Transformación y gestión del conocimiento. Rev. Educ. 2018, 14, 13–23. Available online: http://fh.mdp.edu.ar/revistas/index.php/r_educ/article/view/2687/2918 (accessed on 3 October 2022).
- Capperucci, D.; Scierri, I.D.M.; Salvadori, I.; Batini, F.; Toti, G.; Barbisoni, G.; Pera, E. Remote Teaching during COVID-19 Emergency: Teaching and Assessment Strategies and the Role of Previous Training. Educ. Sci. 2022, 12, 646. [Google Scholar] [CrossRef]
- Acero, J.M.A.; Coca, M.M.; Coca, D.M. Motivación de alumnos de Educación Secundaria y Bachillerato hacia el uso de recursos digitales durante la crisis del Covid-19. Rev. Estilos Aprendiz. 2020, 13, 68–81. [Google Scholar] [CrossRef]
- Mercader, C. Las resistencias del profesorado universitario a la utilización de las tecnologías digitales. Aula Abierta 2019, 48, 167–174. [Google Scholar] [CrossRef]
- Tierney, R.J.; Bond, E.; Bresler, J. Examining Literate Lives as Students Engage with Multiple Literacies. Theory Pract. 2006, 45, 359–367. [Google Scholar] [CrossRef]
- Pruulmann-Vengerfeldt, P.; Kalmus, V.; Runnel, P. Creating Content or Creating Hype: Practices of Online Content Creation and Consumption in Estonia. Cyberpsychol. J. Psychosoc. Res. Cybersp. 2008, 2. Available online: https://cyberpsychology.eu/article/view/4209 (accessed on 3 October 2022).
- Costa, P.; Castaño-Muñoz, J.; Kampylis, P. Capturing schools’ digital capacity: Psychometric analyses of the SELFIE self-reflection tool. Comput. Educ. 2021, 162, 104080. [Google Scholar] [CrossRef]
- Fraillon, J.; Ainley, J.; Schulz, W.; Friedman, T.; Duckworth, D. Preparing for Life in a Digital World: IEA International Computer and Information Literacy Study 2018 International Report; International Association for the Evaluation of Educational Achievement (IEA): Amsterdam, The Netherlands, 2020. [Google Scholar] [CrossRef]
- García-Ruiz, R.; Escoda, A.P. La Competencia Digital Docente como Clave para Fortalecer el Uso Responsable de Internet. Camp. Virtu. 2021, 10, 59–71. Available online: http://www.uajournals.com/ojs/index.php/campusvirtuales/article/view/781 (accessed on 3 October 2022).
- Tejada Garitano, E.; Castaño Garrido, C.; Romero Andonegui, A. Los hábitos de uso en las redes sociales de los preadolescentes. RIED Rev. Iberoam. Educ. Distancia 2019, 22, 119–133. [Google Scholar] [CrossRef]
- González, W.O.L. El estudio de casos: Una vertiente para la investigación educativa. Educere 2013, 17, 139–144. Available online: https://www.redalyc.org/pdf/356/35630150004.pdf (accessed on 3 October 2022).
- Salinas, J. La investigación ante los desafíos de los escenarios de aprendizaje futuros. RED Rev. Educ. Distancia 2012, 32, 1–23. Available online: https://revistas.um.es/red/article/view/233091 (accessed on 3 October 2022). [CrossRef]
- García-Aretio, L. Necesidad de una educación digital en un mundo digital. RIED Rev. Iberoam. Educ. Distancia 2019, 22, 9–22. [Google Scholar] [CrossRef]
- Kampylis, P.; Hodson, D.; Petkova, S.; Hippe, R.; Cachia, R.; Sala, A.; Weikert García, L.; Castaño-Muñoz, J.; Punie, Y. SELFIE Forum–Teaching and Learning in the Digital Age; Publications Office of the European Union: Luxembourg, 2019; Available online: https://publications.jrc.ec.europa.eu/repository/handle/JRC117482 (accessed on 3 October 2022).


| Education Agent | Invited Sample | Participant Sample | |||||||
|---|---|---|---|---|---|---|---|---|---|
| SELFIE | Focus Group | ||||||||
| 2018–19 | 2020–21 | 2021–22 | 2018–19 | 2020–21 | 2021–22 | 2018–19 | 2020–21 | 2021–22 | |
| School Leaders (SL) | 30 | 27 | 27 | 25 | 25 | 26 | 5 | 4 | 9 |
| Teachers (T) | 75 | 49 | 48 | 61 | 43 | 46 | 7 | 6 | 8 |
| Students (ST) | 450 | 542 | 490 | 440 | 393 | 374 | 9 | 8 | 6 |
| TOTAL | 555 | 618 | 565 | 526 | 461 | 446 | 21 | 18 | 23 |
| A. Leadership | 2018–2019 | 2020–2021 | 2021–2022 | |||
|---|---|---|---|---|---|---|
| SL | T | SL | T | SL | T | |
| “Copyright and licensing rules” (A4) | 3 | 3.4 | 4 | 4.3 | 3.9 | 4.3 |
| “Time to explore digital teaching” (A5) | No data | No data | 2.1 | 2.6 | 2.2 | 2.6 |
| B. Collaboration and Networking | 2018–2019 | 2020–2021 | 2021–2022 | |||
|---|---|---|---|---|---|---|
| SL | T | SL | T | SL | T | |
| “Progress review” (B1) | 2.8 | 3 | 3.1 | 3.7 | 3.4 | 3.7 |
| “Synergies for blended learning” (B4) | 2 | 2.2 | 2.8 | 3.1 | 3 | 3.3 |
| C. Infrastructure and Equipment | 2018–2019 | 2020–2021 | 2021–2022 | ||||||
|---|---|---|---|---|---|---|---|---|---|
| SL | T | ST | SL | T | ST | SL | T | ST | |
| “Bring your own device” (C13) | No data | No data | No data | 4.2 | 3.9 | 3.6 | 4.3 | 4.2 | 3.9 |
| “Digital devices for learning” (C8) | 2.8 | 2.9 | 3.3 | 4 | 4 | 3.4 | 4 | 4.2 | 3.8 |
| “Online libraries/repositories” (C16) | No data | No data | No data | 2.6 | 3 | 3.1 | 2.5 | 3 | 3.7 |
| D. Continuing Professional Development | 2018–2019 | 2020–2021 | 2021–2022 | |||
|---|---|---|---|---|---|---|
| SL | T | SL | T | SL | T | |
| “Participation in CPD” (D2) | 3.7 | 3.2 | 4 | 3.8 | 3.6 | 3.8 |
| “CPD needs” (D1) | 3.2 | 2.9 | 3.5 | 3.6 | 3.2 | 3.5 |
| “Sharing experiences” (D3) | 3.2 | 2.8 | 3.4 | 3.7 | 3 | 3.7 |
| E. Pedagogy: Supports and Resources | 2018–2019 | 2020–2021 | 2021–2022 | |||
|---|---|---|---|---|---|---|
| SL | T | SL | T | SL | T | |
| “Online educational resources” (E1) | 3.8 | 4.1 | 4.1 | 4.6 | 4 | 4.5 |
| “Communicating with the school community” (E4) | 3.6 | 4.1 | 4.5 | 4.3 | 3.9 | 4.4 |
| “Using virtual learning environments” (E3) | 3.2 | 3.2 | 3.8 | 3.6 | 3.7 | 3.9 |
| “Open educational resources” (E5) | No data | No data | 3.8 | 4 | 3.6 | 3.9 |
| “Creating digital resources” (E2) | 3.1 | 3.3 | 3.6 | 3.9 | 3.3 | 4 |
| F. Pedagogy: Implementation in the Classroom | 2018–2019 | 2020–2021 | 2021–2022 | ||||||
|---|---|---|---|---|---|---|---|---|---|
| SL | T | ST | SL | T | ST | SL | T | ST | |
| “Engaging students” (F4) | 3.2 | 3.6 | 3.4 | 3.9 | 4 | 3.4 | 3.8 | 3.9 | 3.6 |
| “Cross-curricular projects” (F6) | 23 | 2.6 | 3.2 | 2.9 | 3.2 | 3 | 3 | 3.2 | 3.3 |
| G. Assessment Practices | 2018–2019 | 2020–2021 | 2021–2022 | ||||||
|---|---|---|---|---|---|---|---|---|---|
| SL | T | ST | SL | T | ST | SL | T | ST | |
| “Using data to improve learning” (G9) | No data | No data | Does not apply | 3.2 | 3.7 | Does not apply | 3.4 | 3.8 | Does not apply |
| “Assessing skills” (G1) | 2.5 | 2.9 | Does not apply | 3.5 | 3.5 | Does not apply | 3.3 | 3.7 | Does not apply |
| “Digital assessment” (G7) | 2.8 | 2.9 | Does not apply | 3.6 | 3.5 | Does not apply | 3.4 | 3.5 | Does not apply |
| “Feedback to other students” (G6) | 23 | 23 | 2.6 | 2.8 | 2.9 | 23 | 2.9 | 2.9 | 2.8 |
| H. Student Digital Competence | 2018–2019 | 2020–2021 | 2021–2022 | ||||||
|---|---|---|---|---|---|---|---|---|---|
| SL | T | ST | SL | T | ST | SL | T | ST | |
| “Learning to communicate” (H8) | 3.4 | 3.3 | 3.2 | 4.2 | 4 | 3.2 | 4 | 4.2 | 3.5 |
| “Safe behavior” (H1) | 3 | 3 | 3.7 | 3.8 | 3.7 | 3.5 | 3.8 | 3.8 | 3.8 |
| “Responsible behavior” (H3) | 3 | 3.1 | 3.2 | 3.6 | 3.7 | 3.6 | 3.7 | 3.6 | 3.8 |
| “Solving technical problems” (H13) | No data | No data | No data | 3 | 3.3 | 2.7 | 2.8 | 3.1 | 3.2 |
| “Learning coding or programming” (H11) | No data | No data | No data | 2.7 | 2.7 | 2.5 | 2.6 | 2.8 | 2.9 |
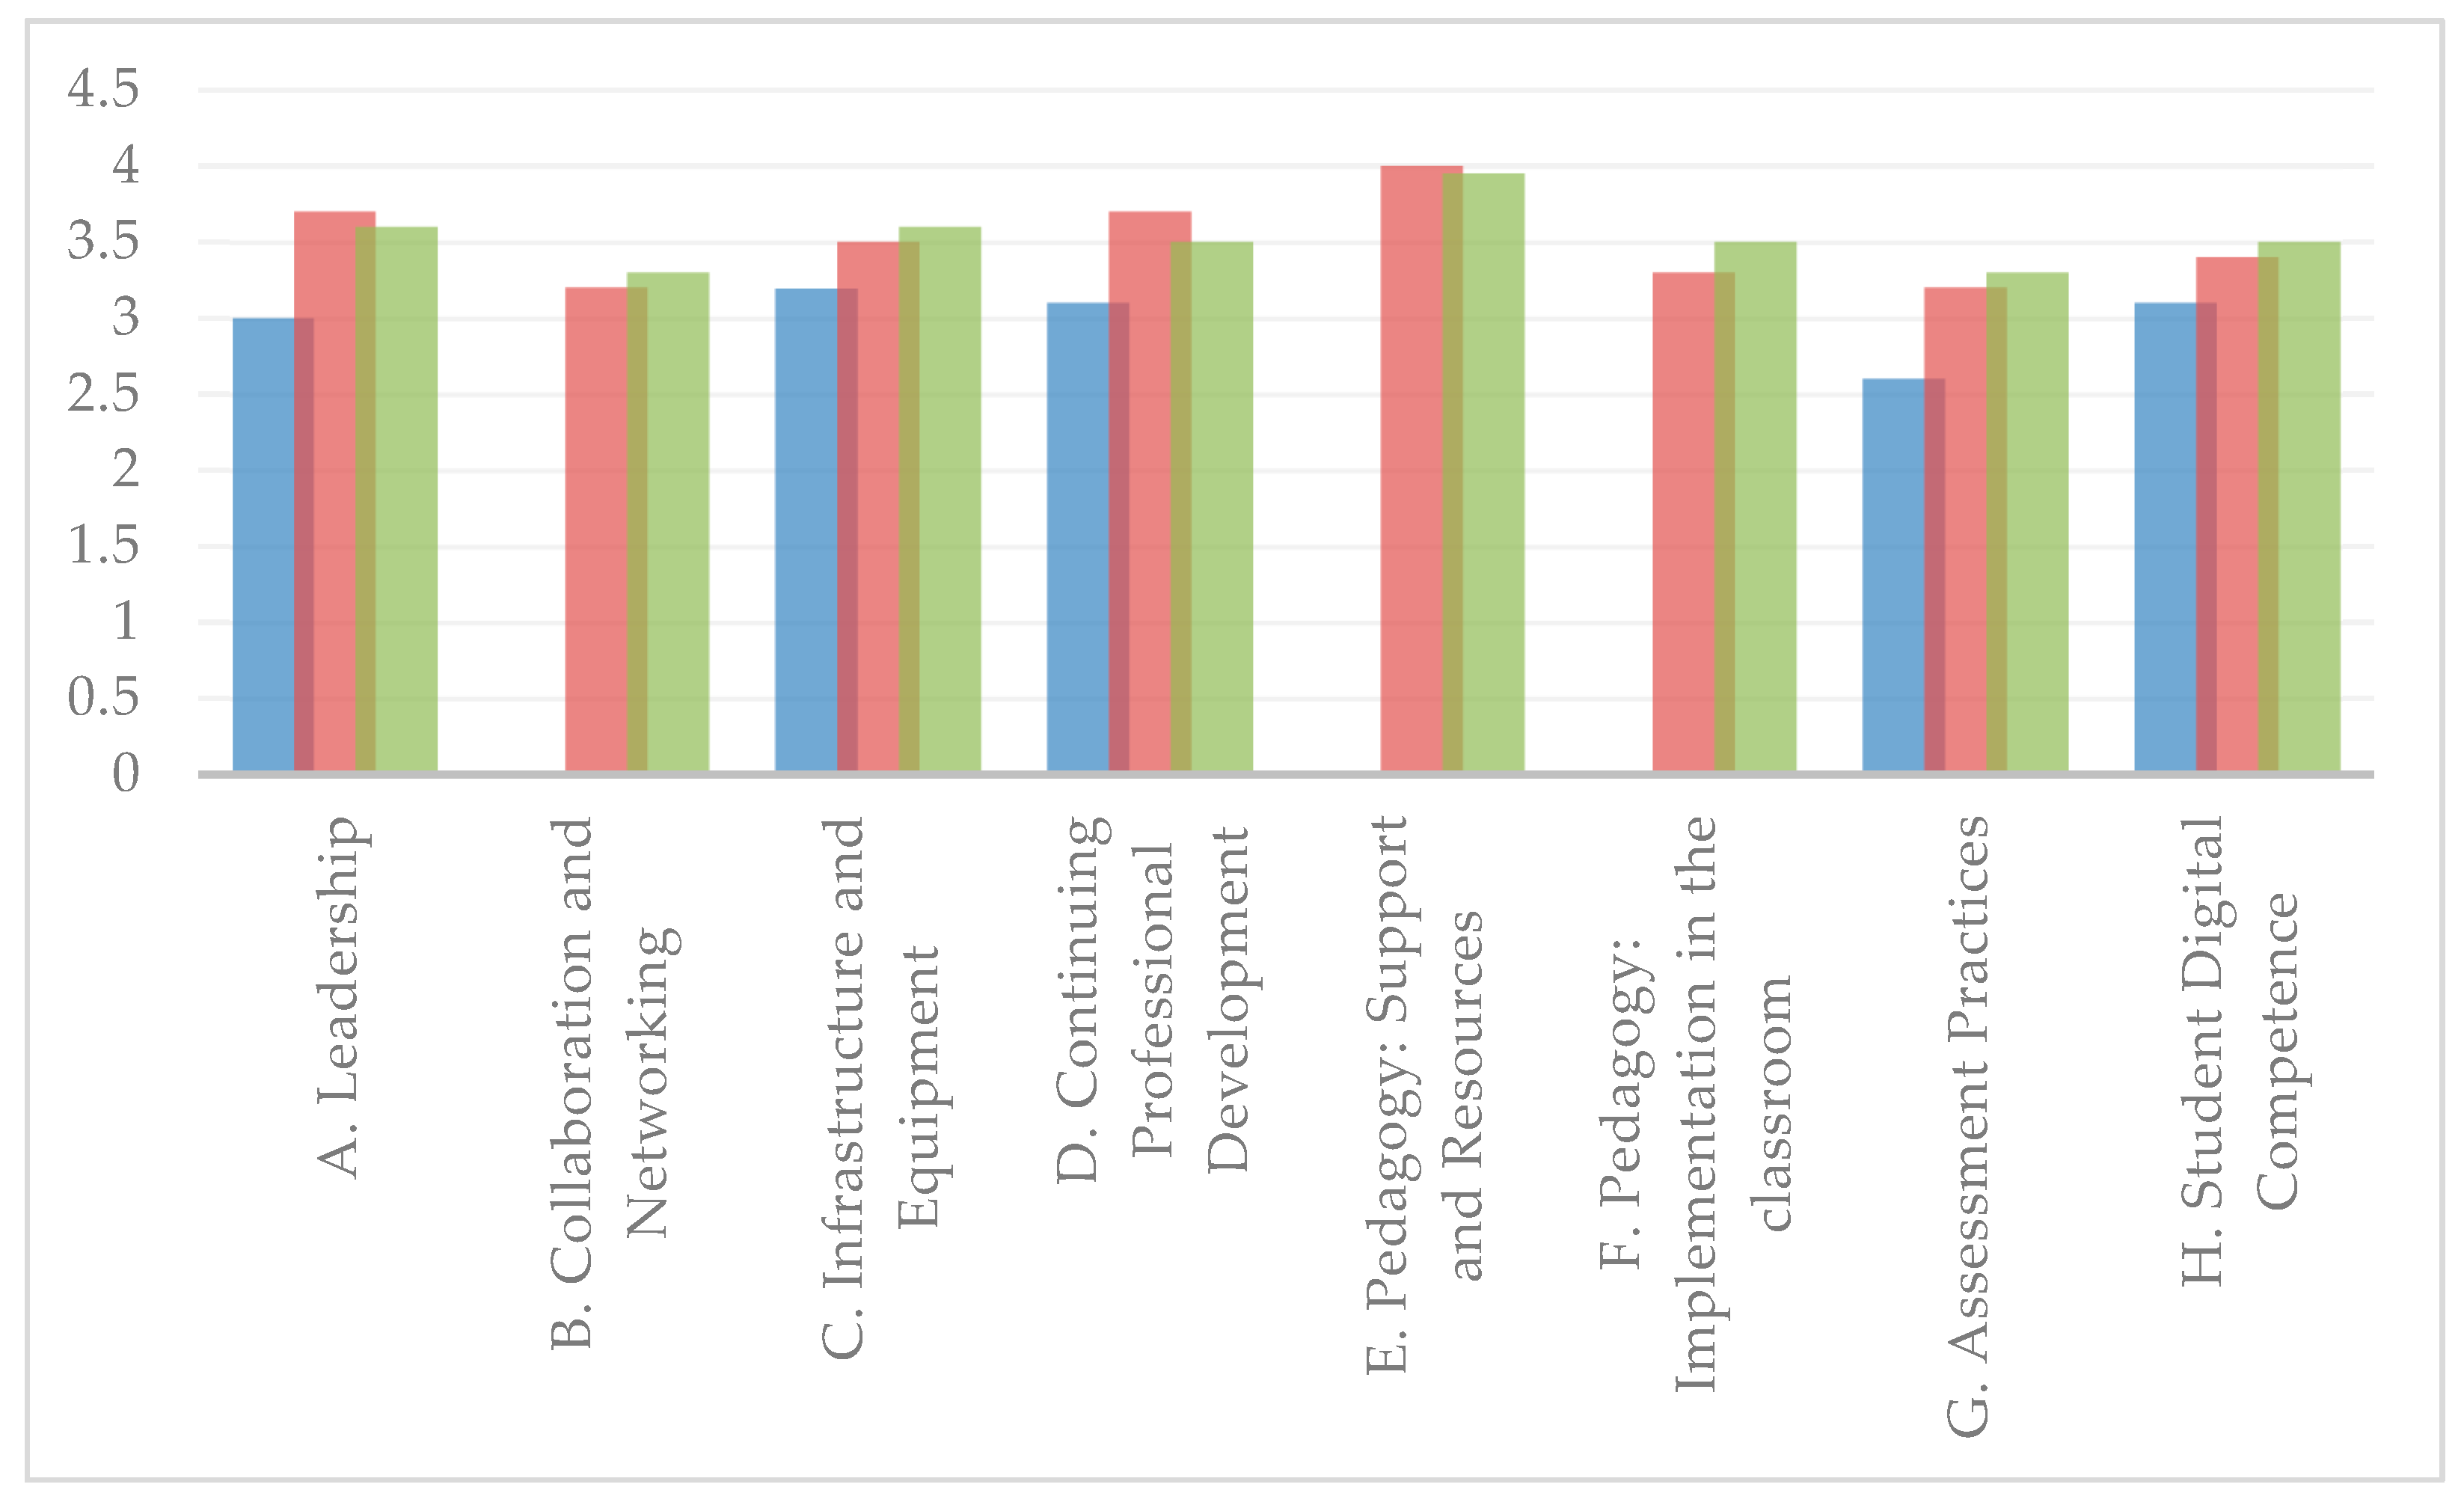
| SELFIE Areas | 2018–2019 | 2020–2021 | 2021–2022 |
|---|---|---|---|
| 3 | 3.7 | 3.6 |
| * | 3.2 | 3.3 |
| 3.2 | 3.5 | 3.6 |
| 3.1 | 3.7 | 3.5 |
| * | 4 | 3.9 |
| * | 3.3 | 3.5 |
| 2.6 | 3.2 | 3.3 |
| 3.1 | 3.4 | 3.5 |
| Area SELFIE | Descriptor SELFIE | Average | Objective |
|---|---|---|---|
| A.4. Time to explore digital teaching | 2.4 | Design a schedule to explore how to improve the teaching with digital technologies. |
| B.4. Synergies for Blended Learning | 3.1 | Establish collaborative networks with other schools or organizations to support the use of digital technologies. |
| C.16. Online libraries/repositories | 3.1 | Create online libraries or repositories with teaching and learning materials. |
| D.3. Sharing experiences | 3.4 | Support teachers to share experiences within the school community about teaching with digital technologies. |
| E.5. Open educational resources” | 3.8 | Promote the use of open educational resources in teachers and students. |
| F.6. Cross-curricular projects | 3.2 | Engage students in using digital technologies for cross-curricular projects. |
| G.6. Feedback to other students | 2.9 | Use digital technologies to enable students to provide feedback on other students’ work. |
| H.11. Learning coding or programming | 2.8 | Promote the learning of coding or programming in students. |
Publisher’s Note: MDPI stays neutral with regard to jurisdictional claims in published maps and institutional affiliations. |
© 2022 by the authors. Licensee MDPI, Basel, Switzerland. This article is an open access article distributed under the terms and conditions of the Creative Commons Attribution (CC BY) license (https://creativecommons.org/licenses/by/4.0/).
Share and Cite
Fernández-Miravete, Á.D.; Prendes-Espinosa, P. Digitalization of Educational Organizations: Evaluation and Improvement Based on DigCompOrg Model. Societies 2022, 12, 193. https://doi.org/10.3390/soc12060193
Fernández-Miravete ÁD, Prendes-Espinosa P. Digitalization of Educational Organizations: Evaluation and Improvement Based on DigCompOrg Model. Societies. 2022; 12(6):193. https://doi.org/10.3390/soc12060193
Chicago/Turabian StyleFernández-Miravete, Ángel David, and Paz Prendes-Espinosa. 2022. "Digitalization of Educational Organizations: Evaluation and Improvement Based on DigCompOrg Model" Societies 12, no. 6: 193. https://doi.org/10.3390/soc12060193