1. Introduction
The concern about environmental degradation and the overuse of natural resources has led scientists and governments to try to raise public awareness of the importance of environmental conservation [
1]. Sustainable development has thus become one of the main concerns of the generations of this century. The term sustainable development focuses on the goal of meeting the needs of present-day society without harming the well-being of future generations [
2].
The Brundtland Report “Our Common Future”, published in 1987 for the United Nations, addressed the concept of sustainable development for the first time. It highlighted the urgency of implementing actions that would interconnect governments, businesses, educational institutions, and citizens to achieve environmental protection. A few years later, in September 2015, the United Nations Assembly adopted the 2030 Agenda, a commitment of 193 countries to universally achieve social justice from a triple dimension: social, economic, and environmental [
3]. A total of 17 sustainable development goals (SDGs) were developed, along with specific targets for each of them that must be achieved during that period. All the goals are multidimensional, i.e., they must achieve different aspects in a related and interconnected way [
4].
The 2030 Agenda assigns a leading role to higher education institutions [
5], given their work in generating and disseminating knowledge and their outstanding role in society [
6]. These institutions are an invaluable source of research and education expertise across all SDG sectors and are considered natural and influential actors that promote the growth of partnerships with governments and communities [
7]. There is, therefore, a consensus in the literature on the crucial role of higher education institutions in global efforts to achieve sustainability [
8,
9,
10].
Goal number 4 focuses more specifically on the quality of education and naturally fits the functions of the university [
4], recognizing it as the most crucial means for the worldwide reshaping of views and values for a just society [
11]. Likewise, education is a key element for a reduction in inequalities and gender equity; goals number 5 and 10 represent, in turn, the cross-cutting purposes of the 2030 Agenda that are related to its motto, “no one is left behind” [
12]. Therefore, universities must have a relevant role in the indicators related to social inclusion and incorporate important references in this area to ensure gender equity and a reduction in inequalities [
13].
Therefore, educational inclusion becomes a determinant factor because it impacts personal development and shapes the labor and social and cultural future of students [
14]. It implies the right to learn for all, regardless of individual characteristics [
15], and entails respect for fundamental rights, such as the right to equal opportunities, universal accessibility, and quality education [
14]. Inclusion implies, hence, breaking critical situations of inequality [
16], which is one of the great challenges facing humanity today [
17]. On the one hand, this is due to its rapid growth throughout the world and, on the other, to the serious social, economic, and political consequences that it brings, such as curbing growth, reducing social mobility, political corruption, or the promotion of crime. In addition, inequality is a clear obstacle to poverty eradication [
17]. It affects people in the poorest countries but also those in the wealthiest countries, as inequalities between groups in the same society persist, along with the inequalities between nations or countries [
18].
Although the topic of social inequalities and gender is widely addressed in research on sustainability reporting, less research has focused specifically on these issues in the university context [
19,
20]. Several studies have focused on showing that students whose parents have fewer economic resources prefer to enter the labor market immediately instead of spending several years at university [
21,
22]. Others conclude that parents without an education and with few economic resources raise their children with a set of values, knowledge, and skills different from those necessary to succeed in university [
23,
24], and their attitude can influence, thus, the interest of their descendants in this type of education [
25]. Disadvantaged students have lower cultural capital levels, meaning lower aspirations and academic performance. On the other hand, these students lack the necessary economic resources to attend university [
22]. Although according to Giraldo-Zuluaga [
26], the nonenrollment of first-generation students may be due more to inequalities in cultural capital than to the lack of economic resources.
For these reasons, it is natural that the United Nations has included a reduction in inequalities among the SDGs, and its goals show that it is impossible to advance in a new development paradigm if the issue of inequality at all levels of society and between countries is not addressed first. Although SDG 10 was one of the last additions to the 2030 Agenda, it is of great importance due to the exacerbation of the phenomenon of growing wealth disparity identified around the world, as well as the different ways in which political factors respond to these disparities [
18]. It is an extremely complex and challenging topic and is the most interesting and far-reaching global goal, as it addresses a wide range of inequality problems [
27,
28].
Within the area of social inequalities, the 2030 Agenda has addressed the issue of gender equity in a more specific way through goal number 5. As de Lauretis pointed out [
29], gender is not just a product but a process. It is necessary to implement new strategies that allow a more global, systemic, and structured understanding of such a relevant problem [
30]. Equality does not mean that women and men are equal but that the rights, responsibilities, and opportunities of women and men do not depend on their sex or gender [
31]. Success in this area depends mainly on the collaboration of multiple stakeholders, i.e., governments, corporations, higher education institutions, and civil society organizations [
32]. Furthermore, if there are human resources to promote this new approach, they are undoubtedly in the universities [
30].
In order to implement inclusive actions in higher education that respond to the goals set by the 2030 Agenda, it is necessary to understand diversity and heterogeneity as a value, a possibility of growth for institutions [
33]. An active social inclusion policy should encompass the participation, presence, and achievement of the entire student body [
34], as well as the involvement of faculty and administrative and service staff [
35]. Some actions that can favor this process are admission pathways with special conditions to promote access for groups with particular characteristics, programs to support retention and graduation, affirmative action policies such as scholarships, faculty training in educational inclusion, or awareness campaigns on campus [
33].
The actions that universities are implementing in this area address different aspects. Some countries, such as Venezuela or Mexico, promote universities for disadvantaged groups [
15,
36]. Others, such as Peru or Ecuador, are oriented toward disability, and in Colombia, it is considered that higher education institutions are heterogeneous and require policies that cover all groups [
35]. In Spain, actions are focused on the development of accessibility practices and policies or the promotion of student support services [
35].
Thus, the university becomes an appropriate framework for implementing new institutional governance based on equality at all levels, including gender [
30]. The main idea starts from the basis that universities are institutions dedicated to knowledge development from an idea of universal rationality that is incompatible with the inequalities between human beings [
30]. These institutions have the role of preventing any form of discrimination to ensure equality in training by profession and access to university careers and research [
37].
2. THE Ranking
The great concern that exists in the best universities around the world for issues related to sustainability has led to the emergence of several international classifications. Among them, THE Impact Rankings is the only list that measures the impact of the SDGs [
4,
38], allowing a comparison of universities worldwide by continent, country, and region. This classification, therefore, becomes a cornerstone for assessing these objectives in an international context [
37].
THE Impact Rankings was launched in April 2019, and the first edition featured more than 450 institutions from 76 countries. The last edition of the year 2022 has classified 1410 universities around the world. According to its editors, the list uses calibrated indicators that provide comprehensive and balanced comparisons in three major areas: research, community engagement and university extension, and administration and management. The universities in the ranking have had to provide data that indicate that they are universities committed to sustainability since sending data involves a significant investment in time, coordination, and personnel resources.
Participation in THE is voluntary, its coverage is global, and an evaluation is carried out at the institutional level for all the SDGs, as well as separately for each of them. In order to participate, institutions must submit information on at least three goals and also on goal number 17, which is mandatory. The ranking of each goal has different categories of indicators used to evaluate the development of the university in that specific goal. The better positioned the university is in each SDG, the better the final score.
Table 1 shows the five dimensions of goal number 10 and the different associated indicators. The analysis focuses on universities’ research on social inequalities, their policies on discrimination, and their commitment to hiring staff and students from underrepresented groups.
Table 2 shows the six dimensions of goal number 5 on gender equity and the different associated indicators. The ranking focuses on universities’ research on the study of gender equality, their policies in this area, and their commitment to the recruitment and promotion of women.
Table 3 shows the six dimensions of goal number 4 related to the quality of education and the different indicators associated with each of them. The ranking focuses on universities’ contribution to early childhood and lifelong learning, their research on quality education in general, and their commitment to inclusive education.
As with the rest of the university rankings, THE Impact Rankings are not exempt from criticism, although they focus more on incorporating new indicators than on the criticism of the existing ones. For Uslu [
39], the fact that the universities themselves report the data highlights the problem of its reliability. In addition, the author considers that future research should incorporate other variables related to the age of higher education institutions or economic resources. Breuer et al. [
40] consider the SDGs to be conceptually very complex and cannot be translated into measurable indicators. Other authors, such as Reverter [
30], point out that, concerning gender equity, the ranking does not measure the progress of women in their academic careers, nor does it provide data about professional promotion outside the university of the graduates.
Despite criticism and reluctance, designing internationally comparable indicators makes it possible to assess the progress of institutions [
41]. THE Impact Ranking methodology has been designed in collaboration with its partners Vertigo Ventures and Elsevier, following consultation and the input received from universities and their academics. Likewise, a shared and accepted knowledge base can better inform sustainability policies and create synergies between global efforts [
42]. The change toward sustainability is challenging and complex. It is a complicated process to understand and manage [
43]. Therefore, strategies are required for evaluating and monitoring the implementation of the SDGs in universities that allow for a more complete picture of their state [
44].
As a result of the previous considerations, it is proposed as a hypothesis that social inclusion is not the priority area of universities that carry out an active policy on sustainability. It is assumed that THE Impact Rankings is the only ranking that attempts to assess performance in all SDGs and is, therefore, a useful tool for their analysis. The continued and growing participation of universities in the ranking and efforts to collect and share data for global benchmarking are important aspects for consideration. Institutions reporting to the ranking integrate the SDGs into their strategic management and are, consequently, contributing to sustainable development.
Based on this hypothesis, the following research questions are proposed and will be answered in this study:
Do the leading universities in sustainability have an active policy of social inclusion? Is this aspect a determining factor in the overall ranking of the most sustainable universities?
In which area related to social inclusion do more universities stand out?
What is the relationship between the indicators of social inequalities, gender equity, and quality of education? In which of these have universities improved the most in recent years?
This work aims to identify the top 100 institutions classified in the global list of THE Impact Rankings, observe their behavior in the SDGs related to social inequalities, gender equity, and quality of education, and analyze their trajectory in the last three years. The purpose is to analyze how the world’s most sustainable universities behave on issues related to social inclusion, to study whether this field is decisive for their global classification, and to analyze their evolution over time. The research will allow us to reflect on the role of universities in the most cross-cutting goals of the 2030 Agenda and conclude that there is still a long way to go.
3. Materials and Methods
Academic rankings related to sustainability have been approached from different perspectives [
45,
46]. However, an absence has been detected in the literature regarding research analyzing social inclusion in the field of the university in a multivariate and dynamic way.
For the development of the research, THE Impact Rankings was selected as it is considered to be the only international classification that addresses all of the SDGs of the 2030 Agenda [
4,
37,
38]. The source used for the design of the databases was the ranking website (
https://www.timeshighereducation.com/impactrankings) (accessed on 1 March 2022). Through it, the top 100 universities in the global ranking were identified. Their data were obtained in the objectives related to the quality of teaching, social inequalities, and gender equity for three consecutive years. The values of all the variables from the years 2020 to 2022 were collected.
The technique selected to inspect the relationship between a set of multivariate data that occurred on more than one occasion was the dynamic biplot [
47]. This is an extension of the biplot methods for processing three-way data. It has the advantage that, instead of taking a consensus matrix as a reference, it makes it possible to choose any of the individual matrices and study the evolution of the reference situation with respect to it. It starts from a three-way data matrix: the universities for the rows, specific sustainable development goals for the columns, and situations for the various time periods. The dynamic biplot is developed in two steps: first, a biplot analysis of the two-way data matrix of the reference year is carried out; second, the rest of the time periods to be studied are projected onto the biplot graph obtained in the previous stage, generating their trajectories throughout different contexts. The first step studies the multivariate correlations between SDGs, universities, and both; the second step studies trajectories and represents the dynamism of analysis.
The dynamic biplot can be used on any of the factorizations of the biplot. Nevertheless, the best simultaneous representation of the trajectories of the variables and the points are obtained on the HJ biplot that manages to represent both types of elements with the highest quality of representation [
48]. The HJ biplot [
48] simultaneously analyzes universities and the specific SDGs on a plane in which the similarity between universities is inversely proportional to the Euclidean distance between them. The angles between the indicators make it possible to assess the degree of covariation between them: acute angles indicate a direct correlation, obtuse angles an inverse correlation, and right angles indicate independence. The length of the vectors approximates the standard deviation of the goals.
The order of the orthogonal projections of the row markers on a column marker approximates the order of the row elements (universities) in that column (SDG). The larger the projection of a point onto a vector, the more the university deviates from the mean of the goal.
The biplot plane on which universities and goals are represented has, as reference axes for the main components obtained, eigenvectors of the matrix of covariances between the indicators. The associated eigenvalues make it possible to assess the amount of information explained by each biplot plane (variance explained). The angle formed by each indicator with the factorial axis 1 is known as the contribution of factor 1 to the variability of that indicator; an analogous explanation can be given for the angle with the factorial axis 2. The sum of both contributions determines the quality of representation at the factorial level.
The analysis was performed in R with the dynBiplotGUI package developed by Egido [
47]. Applications of the dynamic biplot are found in economics [
47] or to classify Spanish universities according to their performance in global rankings [
49,
50]. However, no application oriented to the study of social inequalities has been made so far in the best universities in the world regarding sustainability.
4. Results
The top 100 universities ranked in the global list of the THE Impact Rankings in 2022 were selected. Their values were calculated for the SDGs related to social inequalities, gender equity, and quality of education for the last three years. Of the top 100 universities, 56 that showed data on the three SDGs were selected for research. The reference situation for the biplot elaboration was set in the year 2022, which was the last known situation and, therefore, the most interesting for the study. Data from the reference period were centered and standardized.
In the HJ biplot graphs, the values of the analyzed goals were represented by vectors, while the universities were identified by points whose label collected their abbreviated name.
Table 4 shows the 56 universities that form part of the Top-100 THE Impact Rankings and shows data on the goals related to social inclusion, as well as their position in the global ranking.
The countries that manage to position a more significant number of universities among the top 56 are Australia (thirteen institutions), the United Kingdom (nine institutions), and Canada (eight institutions).
The information captured in the HJ biplot is displayed in
Table 5. Three axes were retained because the maximum possible inertia was achieved (100%), which allowed us to determine the positioning of all the universities concerning all the variables considered.
Table 6 shows the contribution of each factorial axis to the variability of the three indicators in the ranking. Based on the contributions of the factor to the element for the columns, it was observed that all the variables could be interpreted in the factorial plane 1–2 and showed a good quality of representation. Gender and Inequalities received a high contribution to axis 1, and axis 2 provided information of interest in Education.
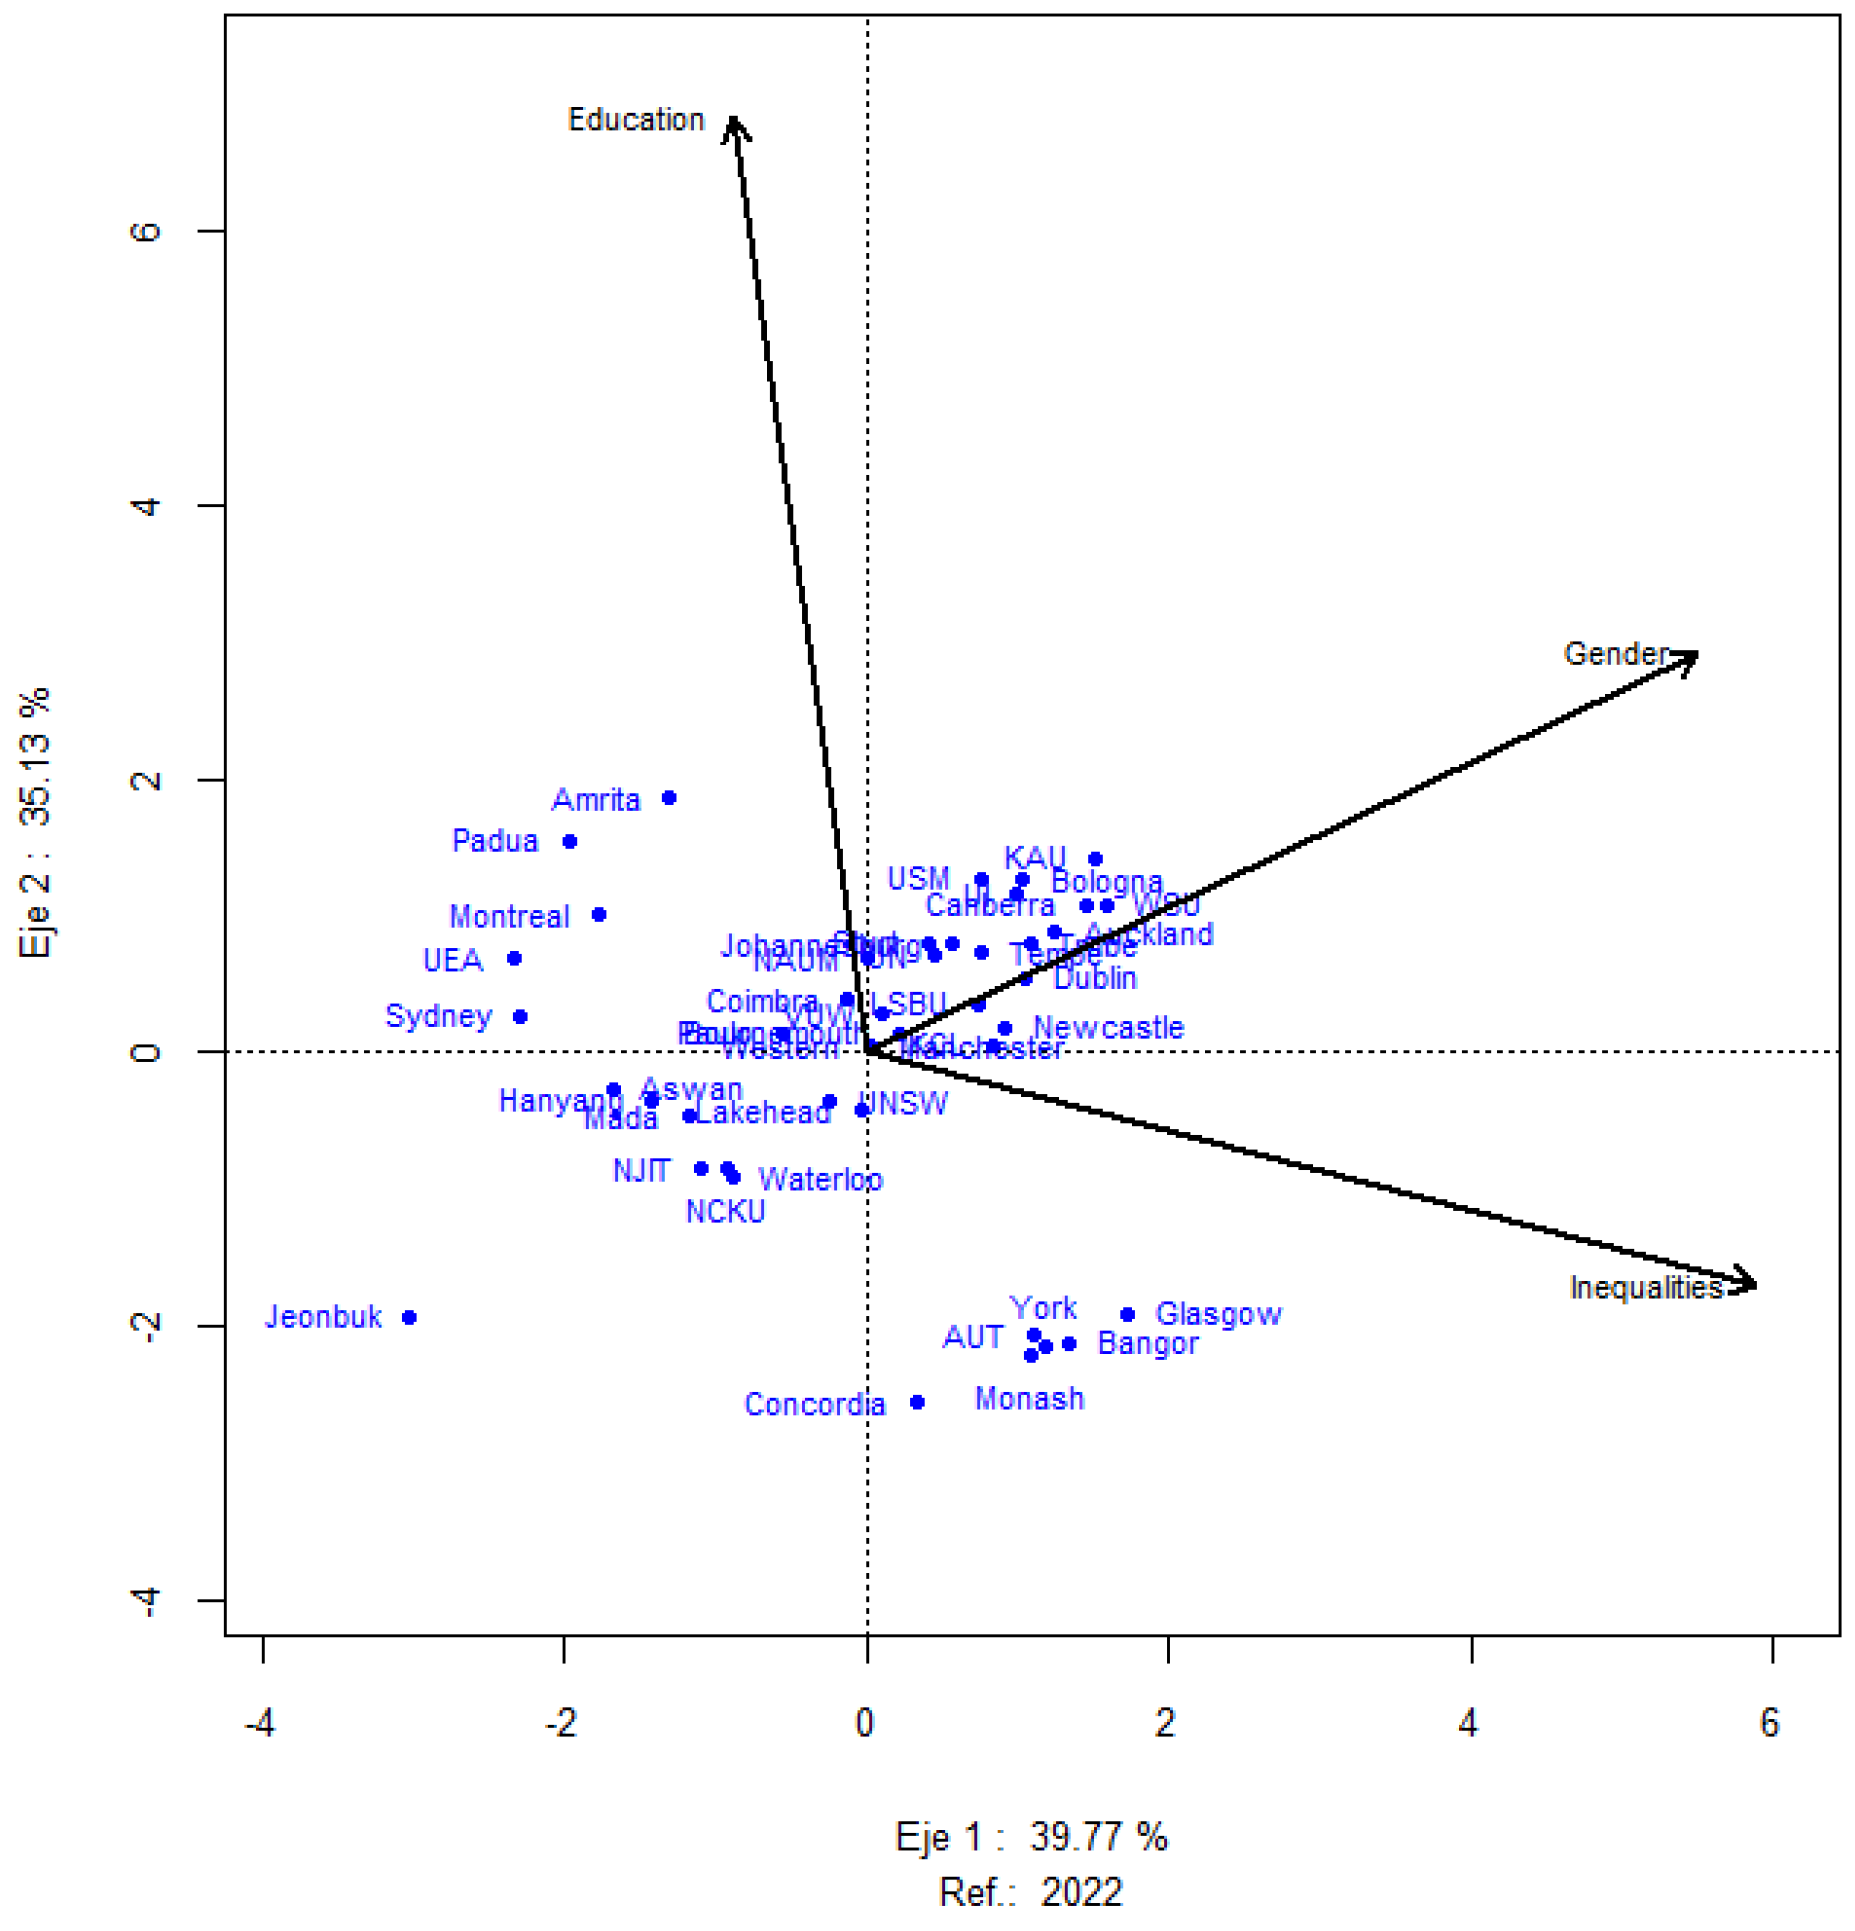
Figure 1 shows the HJ biplot for the data matrix for the year 2022, which provides as much knowledge of the reference as possible. A direct correlation was observed between Gender and Inequalities and between Gender and Education, which was stronger in the first case. However, Education and Inequalities correlated indirectly. The vectors of the three variables presented a similar length, thus showing similar variability.
Regarding the rows, the 56 universities obtained a good representation quality, 43 in the 1–2 plane and the remaining 13 universities in the 1–3 plane. Therefore, all institutions could be represented in the factorial planes, and several groupings were established according to their similar properties.
In the first quadrant appeared eight universities characterized by the variable Education: Amrita (India), NAUM (Mexico), Coimbra (Portugal), UEA (UK), Montreal (Canada), Padua (Italy), Paulo (Brazil), and Sydney (Australia).
Close to Gender were 20 universities, six belonging to Australia (Sturt, Trobe, Canberra, VUW, WSU, and Western), five belonging to the UK (Bournemouth, KCL, LSBU, Newcastle, and Manchester), and universities from other countries such as USA (Tempe), Ireland (Dublin), Saudi Arabia (KAU), Malaysia (USM), New Zealand (Auckland), Italy (Bologna), Indonesia (IU) or South Africa (Johannesburg). However, in this plane, only six institutions were close to the variable related to social inequalities: AUT (New Zealand), Bangor (UK), Glasgow (UK), Concordia (Canada), York (Canada), and Monash (Australia).
In this plane, there were also nine universities belonging to seven countries that were not characterized by any variable: Canada, South Korea, Australia, Egypt, Indonesia, the USA, and Taiwan.
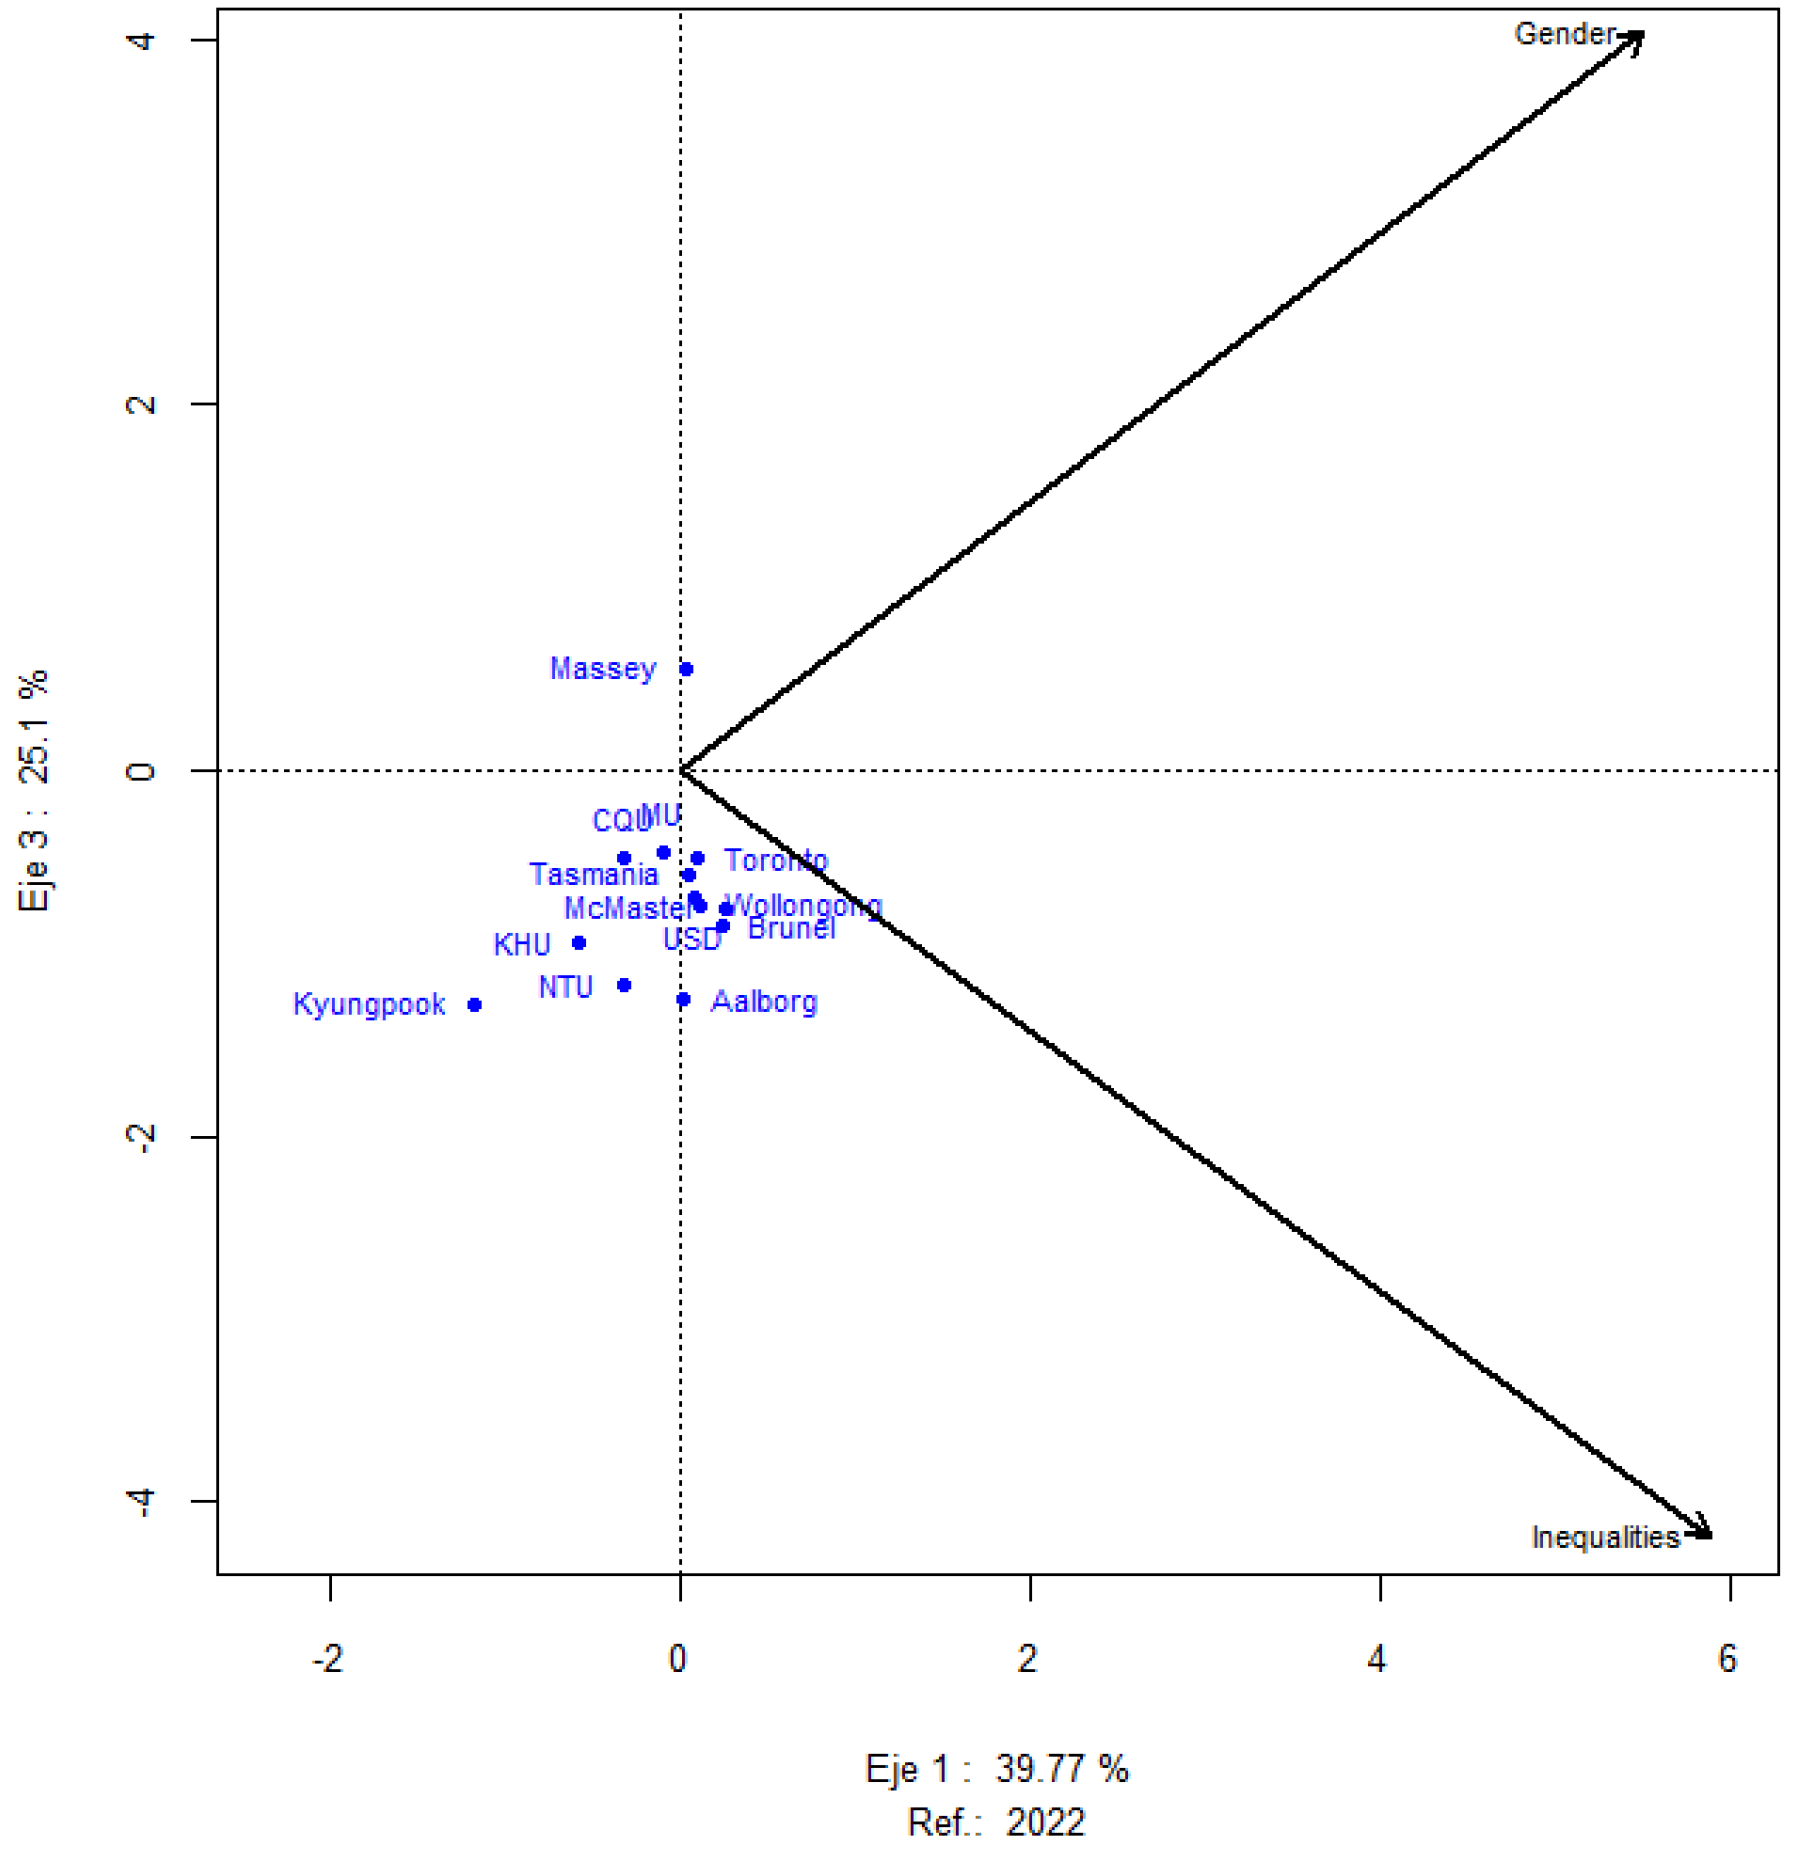
Figure 2 shows the biplot of the year 2020 for the 1–3 plane, which allowed us to characterize the remaining 13 universities that did not obtain a sufficient quality of representation in the 1–2 plane. The Inequalities variable characterized two Australian universities (Tasmania and Wollongong), two Canadian (McMaster and Toronto), two Danish (Aalborg and USD), and one British (Brunel). Also appearing on this plane was an institution in New Zealand characterized by the variable Gender (Massey) and five other centers in Australia, South Korea, and Taiwan not characterized by any variable (CQU, KHU, Kyungpook, MU, and NTU).
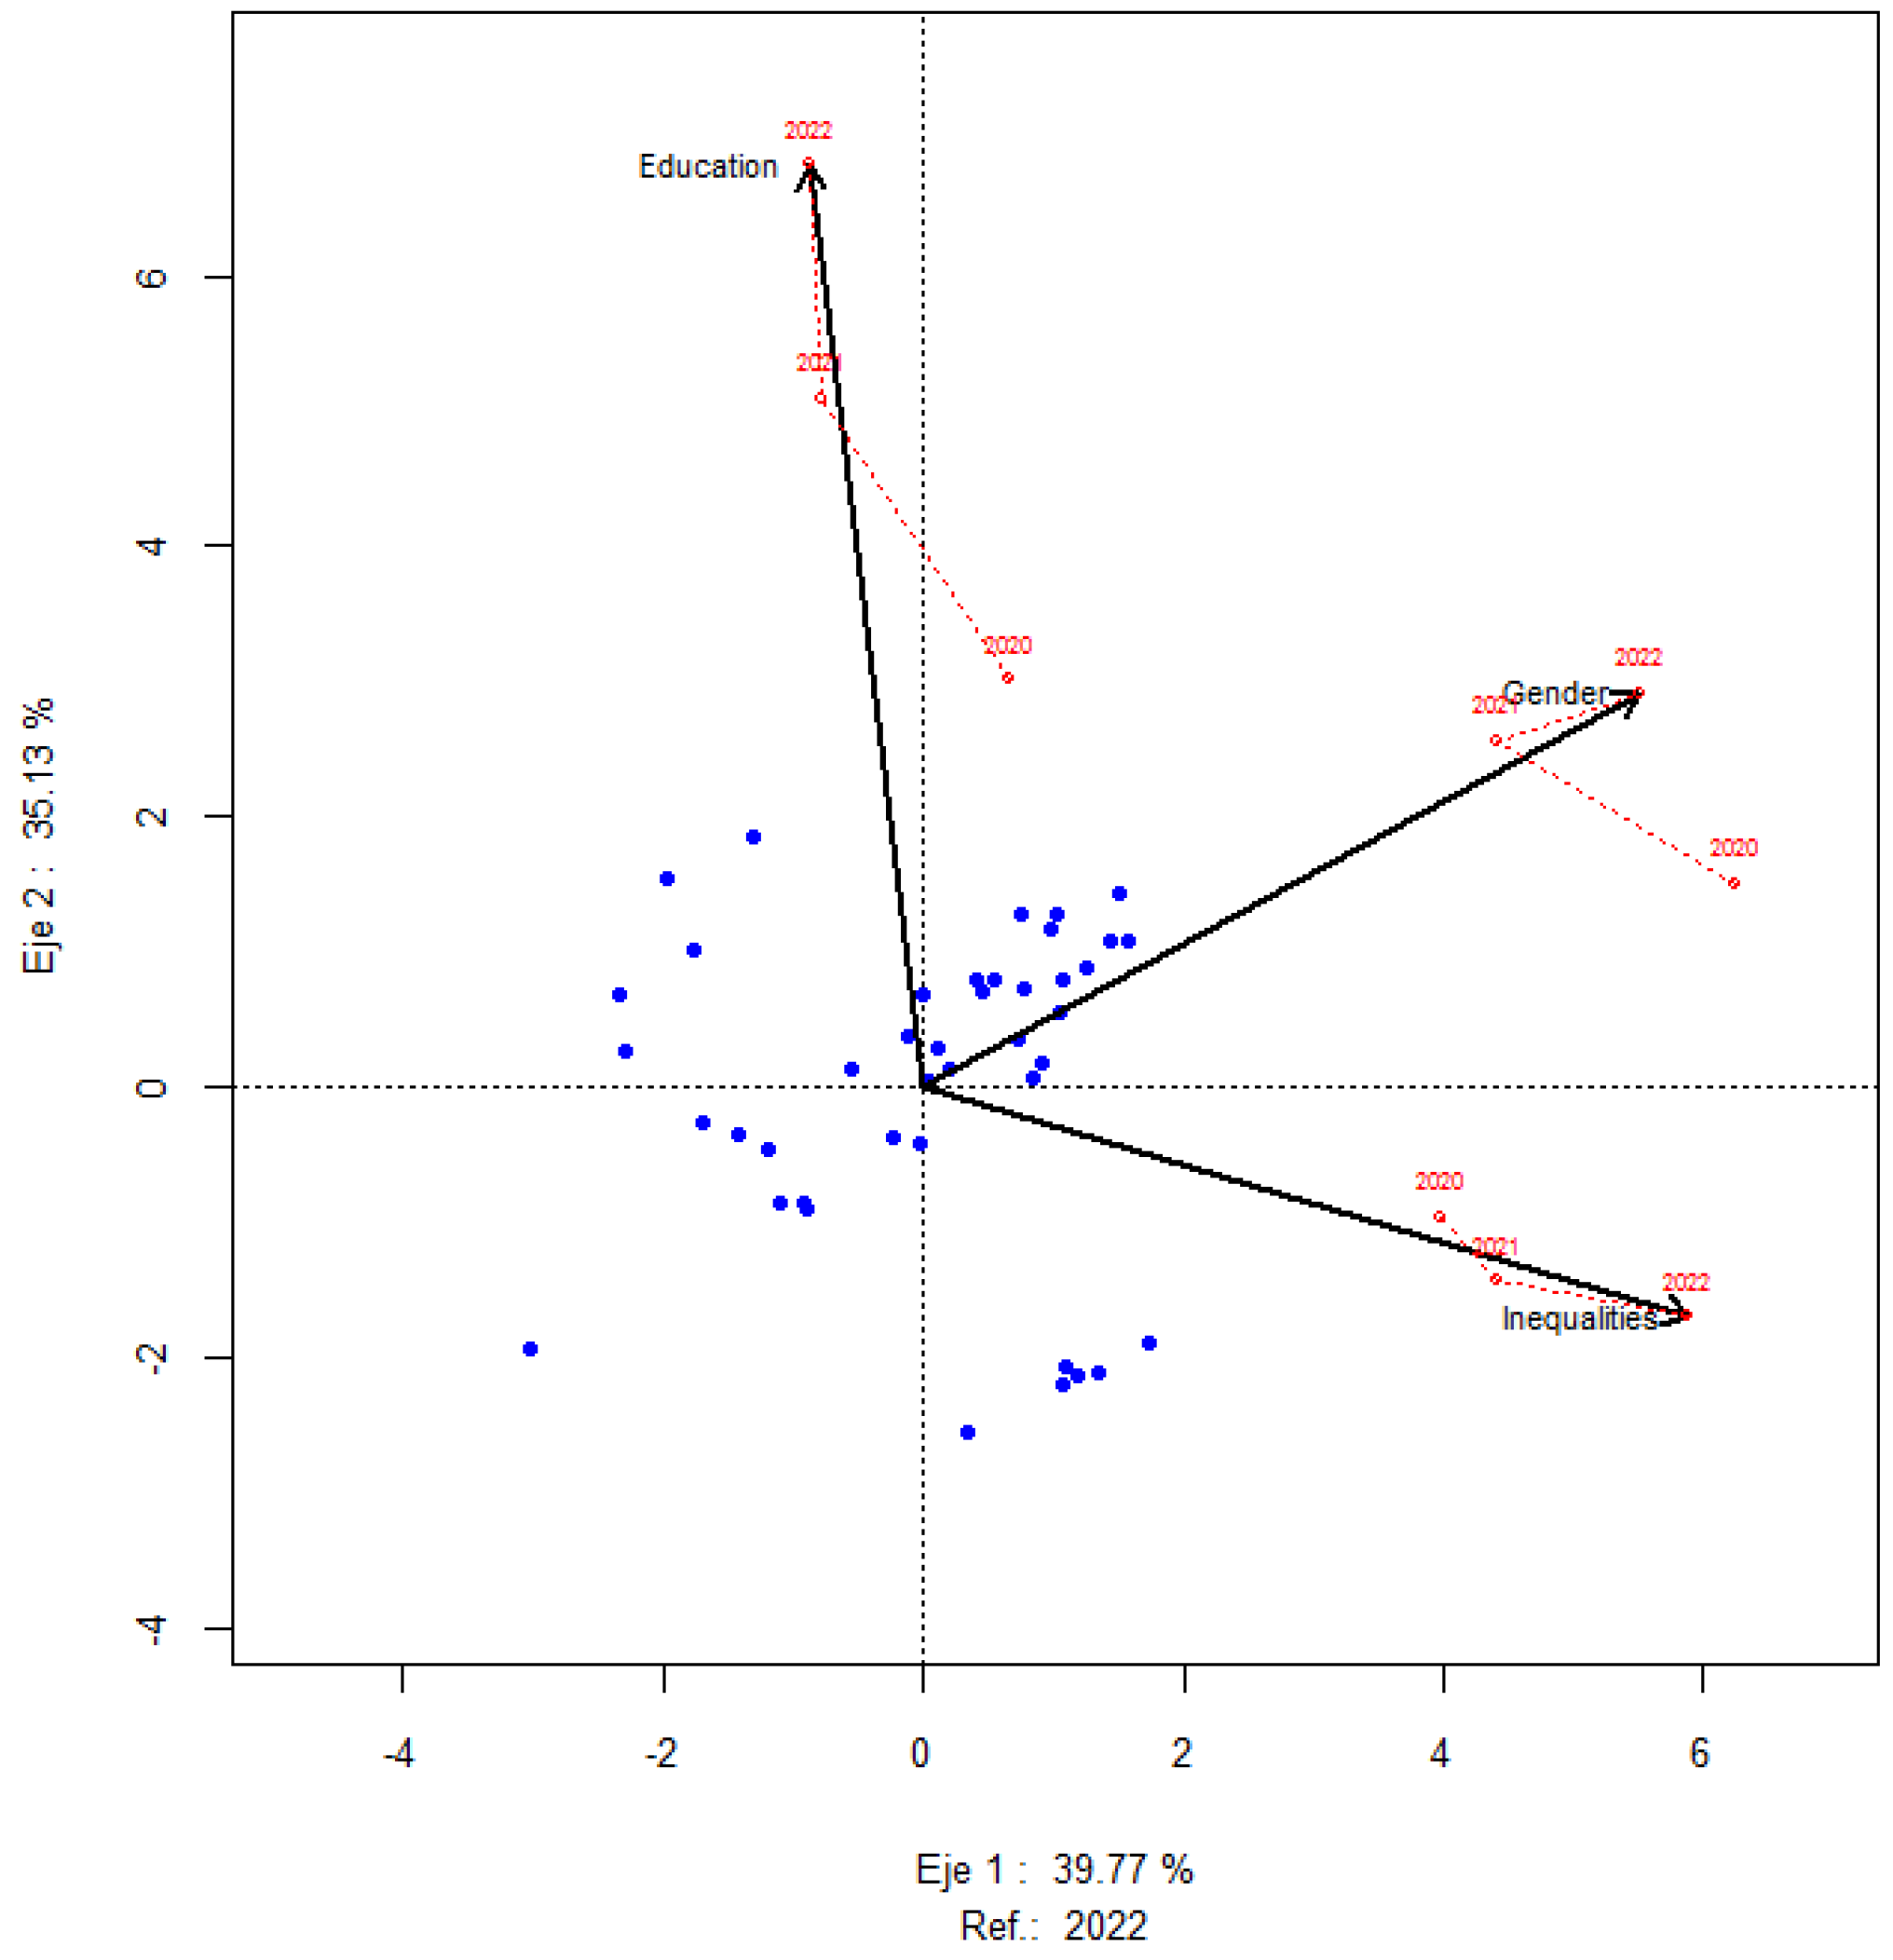
Figure 3 shows the dynamic biplot, which allowed us to project the situation of the variables in each of the years, obtaining their trajectories. It can be seen that Education was the variable that experienced a more significant change in its trajectory over the three years, increasing its value significantly. The Gender variable experienced a significant displacement in 2021, and Inequalities increased its value in the period analyzed, but less significantly.
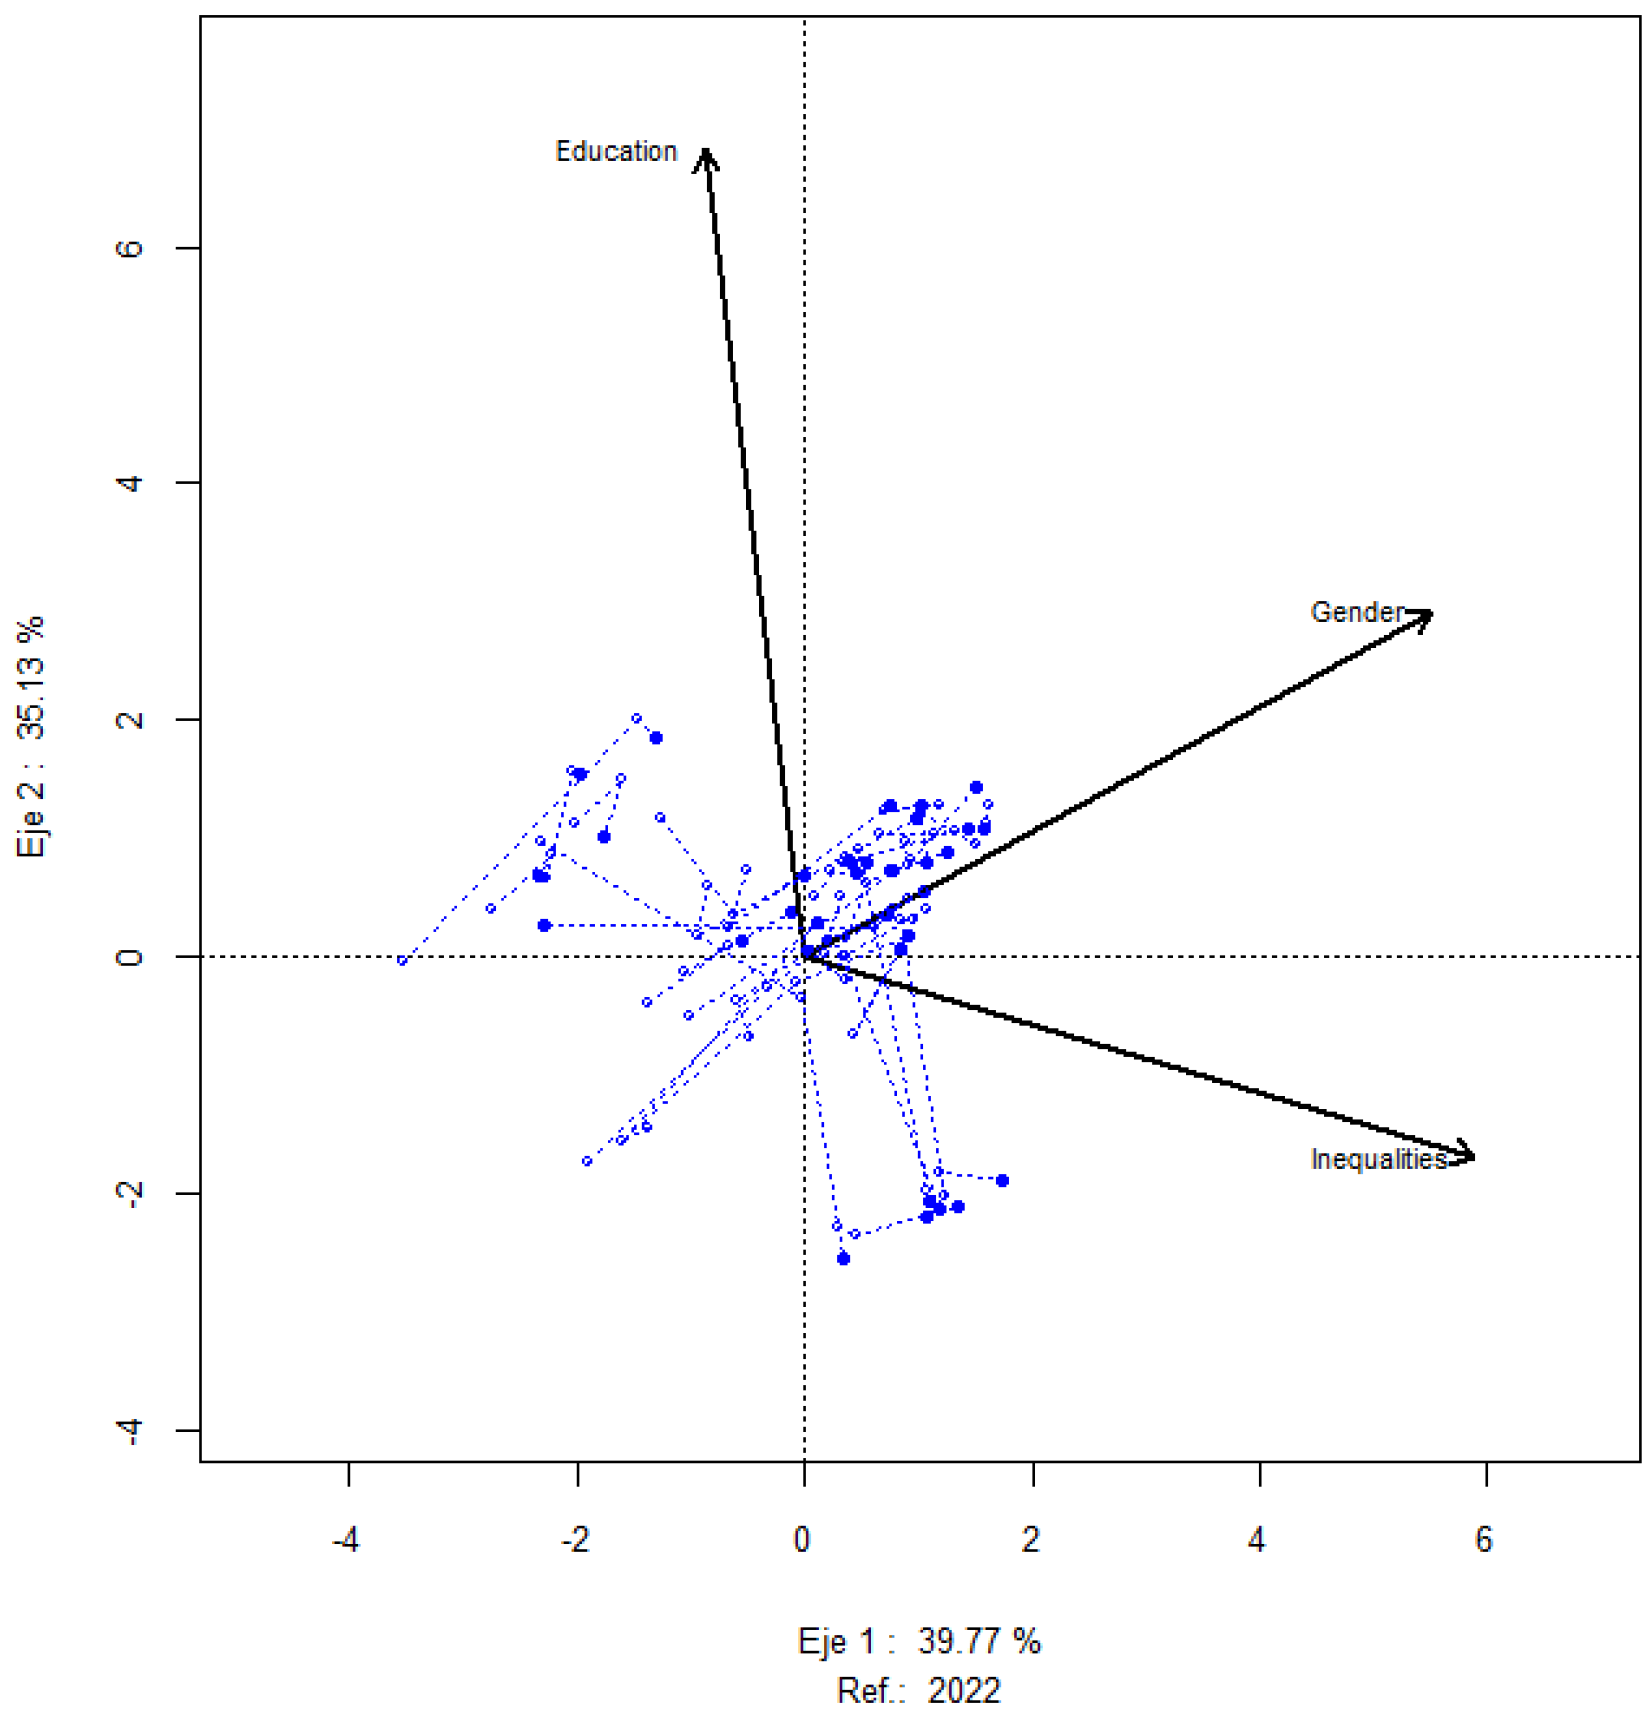
Figure 4 shows us an image of the trajectory of universities. It can be observed how most of the centers have been approaching the Gender variable during the period analyzed. This variable is, therefore, the one that has most influenced the evolution.
5. Discussion and Conclusions
The research demonstrated the practical utility of the dynamic biplot [
47] for studying the SDGs related to social inclusion, as well as for the inspection of the trajectories of indicators and universities. The HJ biplot technique [
48] allowed a graphic representation in which universities and SDGs could be superimposed in the same reference system with the highest quality of representation.
The study examined the top 100 universities ranked in the THE Impact Rankings’ global list to see if they ranked on the SDG lists related to social inclusion. Only 56 of the 100 best universities in the world had indicators in all the SDGs related to this aspect. Of these, only 42 stand out in any of the three indicators that work on inequalities. Therefore, less than half of the leading universities in sustainability carry out an active social inclusion policy. These results align with what De la Herrán et al. [
51] affirm when pointing out that there is no specific inclusive education movement in many university environments, but only individual initiatives in this regard. Cai and Ahmad [
52] also conclude that the pace at which sustainability transformations take place in higher education institutions varies considerably depending on each of their local context and capacity.
The best universities in sustainability that show activity in the most cross-cutting goals of the 2030 Agenda, as Muñoz-Suárez et al. point out [
53], are scattered throughout the world and appear mostly in the continents of Europe, Oceania, North America, and Asia. Along the same lines, Sedlacek [
54] states that both universities in economically high countries and less developed countries contribute to sustainable development.
Goal 4 on quality education only characterized 14% of the universities analyzed. This goal commits institutions to offer inclusive and quality education for all. According to Gibson [
55], fulfilling it requires changing university cultures and policies based on equity and social justice. Dias [
56] also indicates that organizations must make structural and functional changes to support their development.
Goal 10 regarding social inequalities stood out in 13 of the 56 higher education institutions analyzed. Likewise, the trajectory of the three years analyzed did not show a significant increase, nor was an important evolution of the universities toward it. As Cojocarú states [
18], reducing inequalities is an extremely difficult and complex goal to achieve because the objective addresses a wide range of aspects. In addition, situations such as the pandemic or the war in Ukraine have altered the current and future state of inequalities between countries. Also, the high level of inflation is affecting the economic resources of the population, which can lead to an increased risk of exclusion with negative effects on SDG 10 [
18]. Therefore, it is important that universities promote sustainable policies over time [
57] and make efforts to integrate all the SDGs [
58].
The presence of SDG 5 in education policy is also a necessary condition for ensuring sustainable development [
59,
60]. In the research carried out, it is concluded that this goal is the one that characterized a more significant number of institutions (38%) and the one that experienced the most evolution in the period analyzed. Likewise, universities have varied their position over the years to approach it, which shows that they have significantly improved their policies regarding gender equity. This indicator also showed a direct relationship with both quality education and social inequalities. Despite the important and undeniable progress in achieving gender equality, there is still little research development in this area that, as Bernis argues [
61], causes the exclusion of women as agents of sustainability. Education shapes attitudes and beliefs, but its effect on gender-related attitudes is likely to differ between men and women [
62]. Therefore, a greater academic legitimization of gender theories and analysis within universities [
63], a recognition of these studies as an area of knowledge [
64], or greater teacher training [
65,
66] may be some measures that favor their impulse to create a change in mentality in students and future professionals to achieve a just society [
67]. As Merma-Molina et al. [
68] state, universities can be effective tools for change, so it is crucial to integrate equity into their strategic plans.
Hence, the research shows that there is room for improvement in the top universities in sustainability regarding aspects related to social inequalities. Although inclusive education is already regulated in higher education, its implementation is still a major challenge [
14]. Universities define themselves as institutions that promote inclusion as a generating value for fairer societies, but the fact that they do not expressly identify this factor in their mission and vision denotes an institutional culture still focused on the concept of integration [
69]. As stated by Sandoval et al. [
70], it is necessary to incorporate it as a transversal element and foundation at the institutional level.
An active social inclusion policy requires implementing a series of strategies that each university must define. First, a cultural transformation of the university community is needed because not all of its members are open to it and any change, no matter how small, usually generates resistance [
36]. Second, adequate teacher training is crucial since the design of learning environments that guarantee the success of all students, regardless of their characteristics, implies the development of pedagogical competencies of teachers [
35]. Third, administrative staff training is needed to promote inclusive initiatives on campuses. Finally, there is a need for more significant promotion of research in this field and its transfer to society. In summary, more outstanding efforts must be made to ensure education becomes an engine of greater social equity [
71] through teaching, research, and innovation. Furthermore, a series of changes are therefore required to allow the construction of more supportive universities [
72]. Based on its particular characteristics, each institution should determine what mechanisms it will implement to develop models that simultaneously embrace the concepts of equality, equity, accessibility, and educational excellence [
35].
Only responsible academia, with new visions and a commitment to changes in society, and recognizing the existence of a heterogeneous student body, can promote this kind of action [
33]. It is a long road, but it is also urgent because young people must have quality educational opportunities that provide them with the tools to build a dignified and productive future [
16].
Promoting the implementation of more inclusive policies and practices requires the availability of evaluation tools that allow a prior X-ray [
73]. Although this research can be an advance to address the issue of social inclusion in universities, it is recognized that capturing its progress through a single instrument is a complicated task that could be completed with future work that combines other procedures or tools. As Lombardi et al. state [
74], there is a lack of instruments capable of measuring its global reach. The evaluation of social inclusion at the university level is still a field to be explored, but necessary to build more just and equitable societies [
73].


