Drifting Phenologies Cause Reduced Seasonality of Butterflies in Response to Increasing Temperatures


Abstract
:1. Introduction
2. Materials and Methods
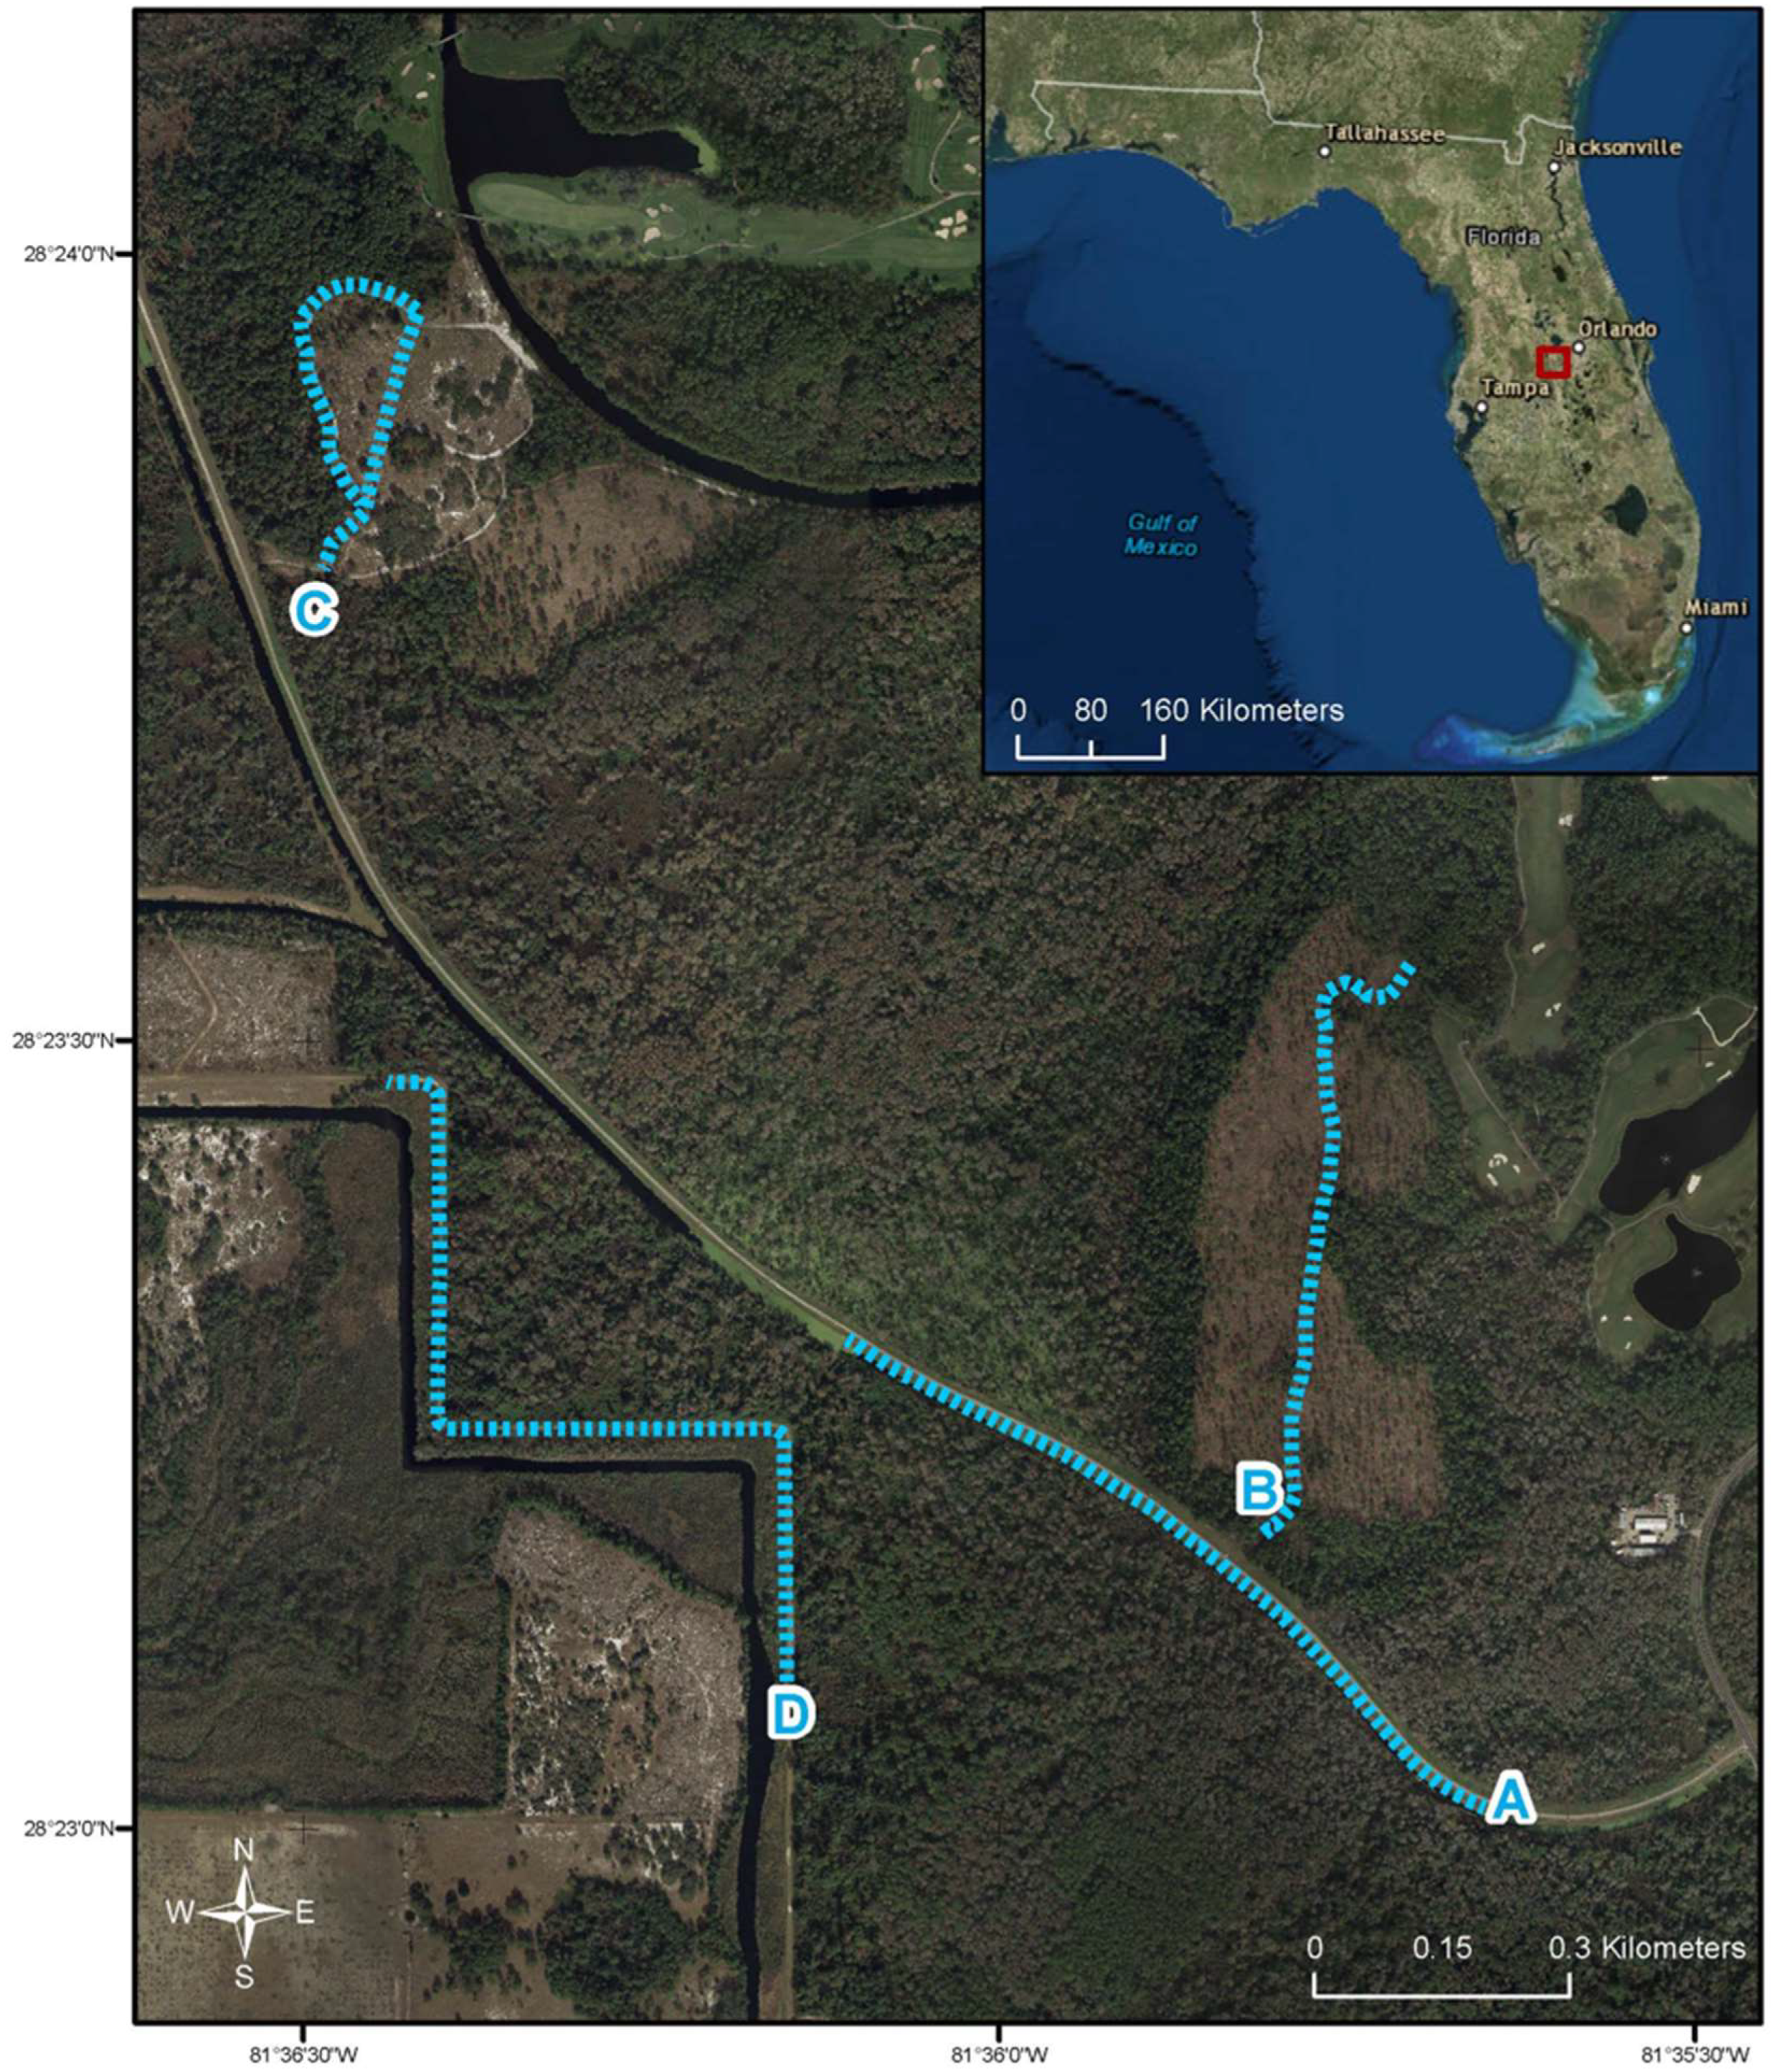
2.1. Study System
2.2. Sampling Design
2.3. Analyses
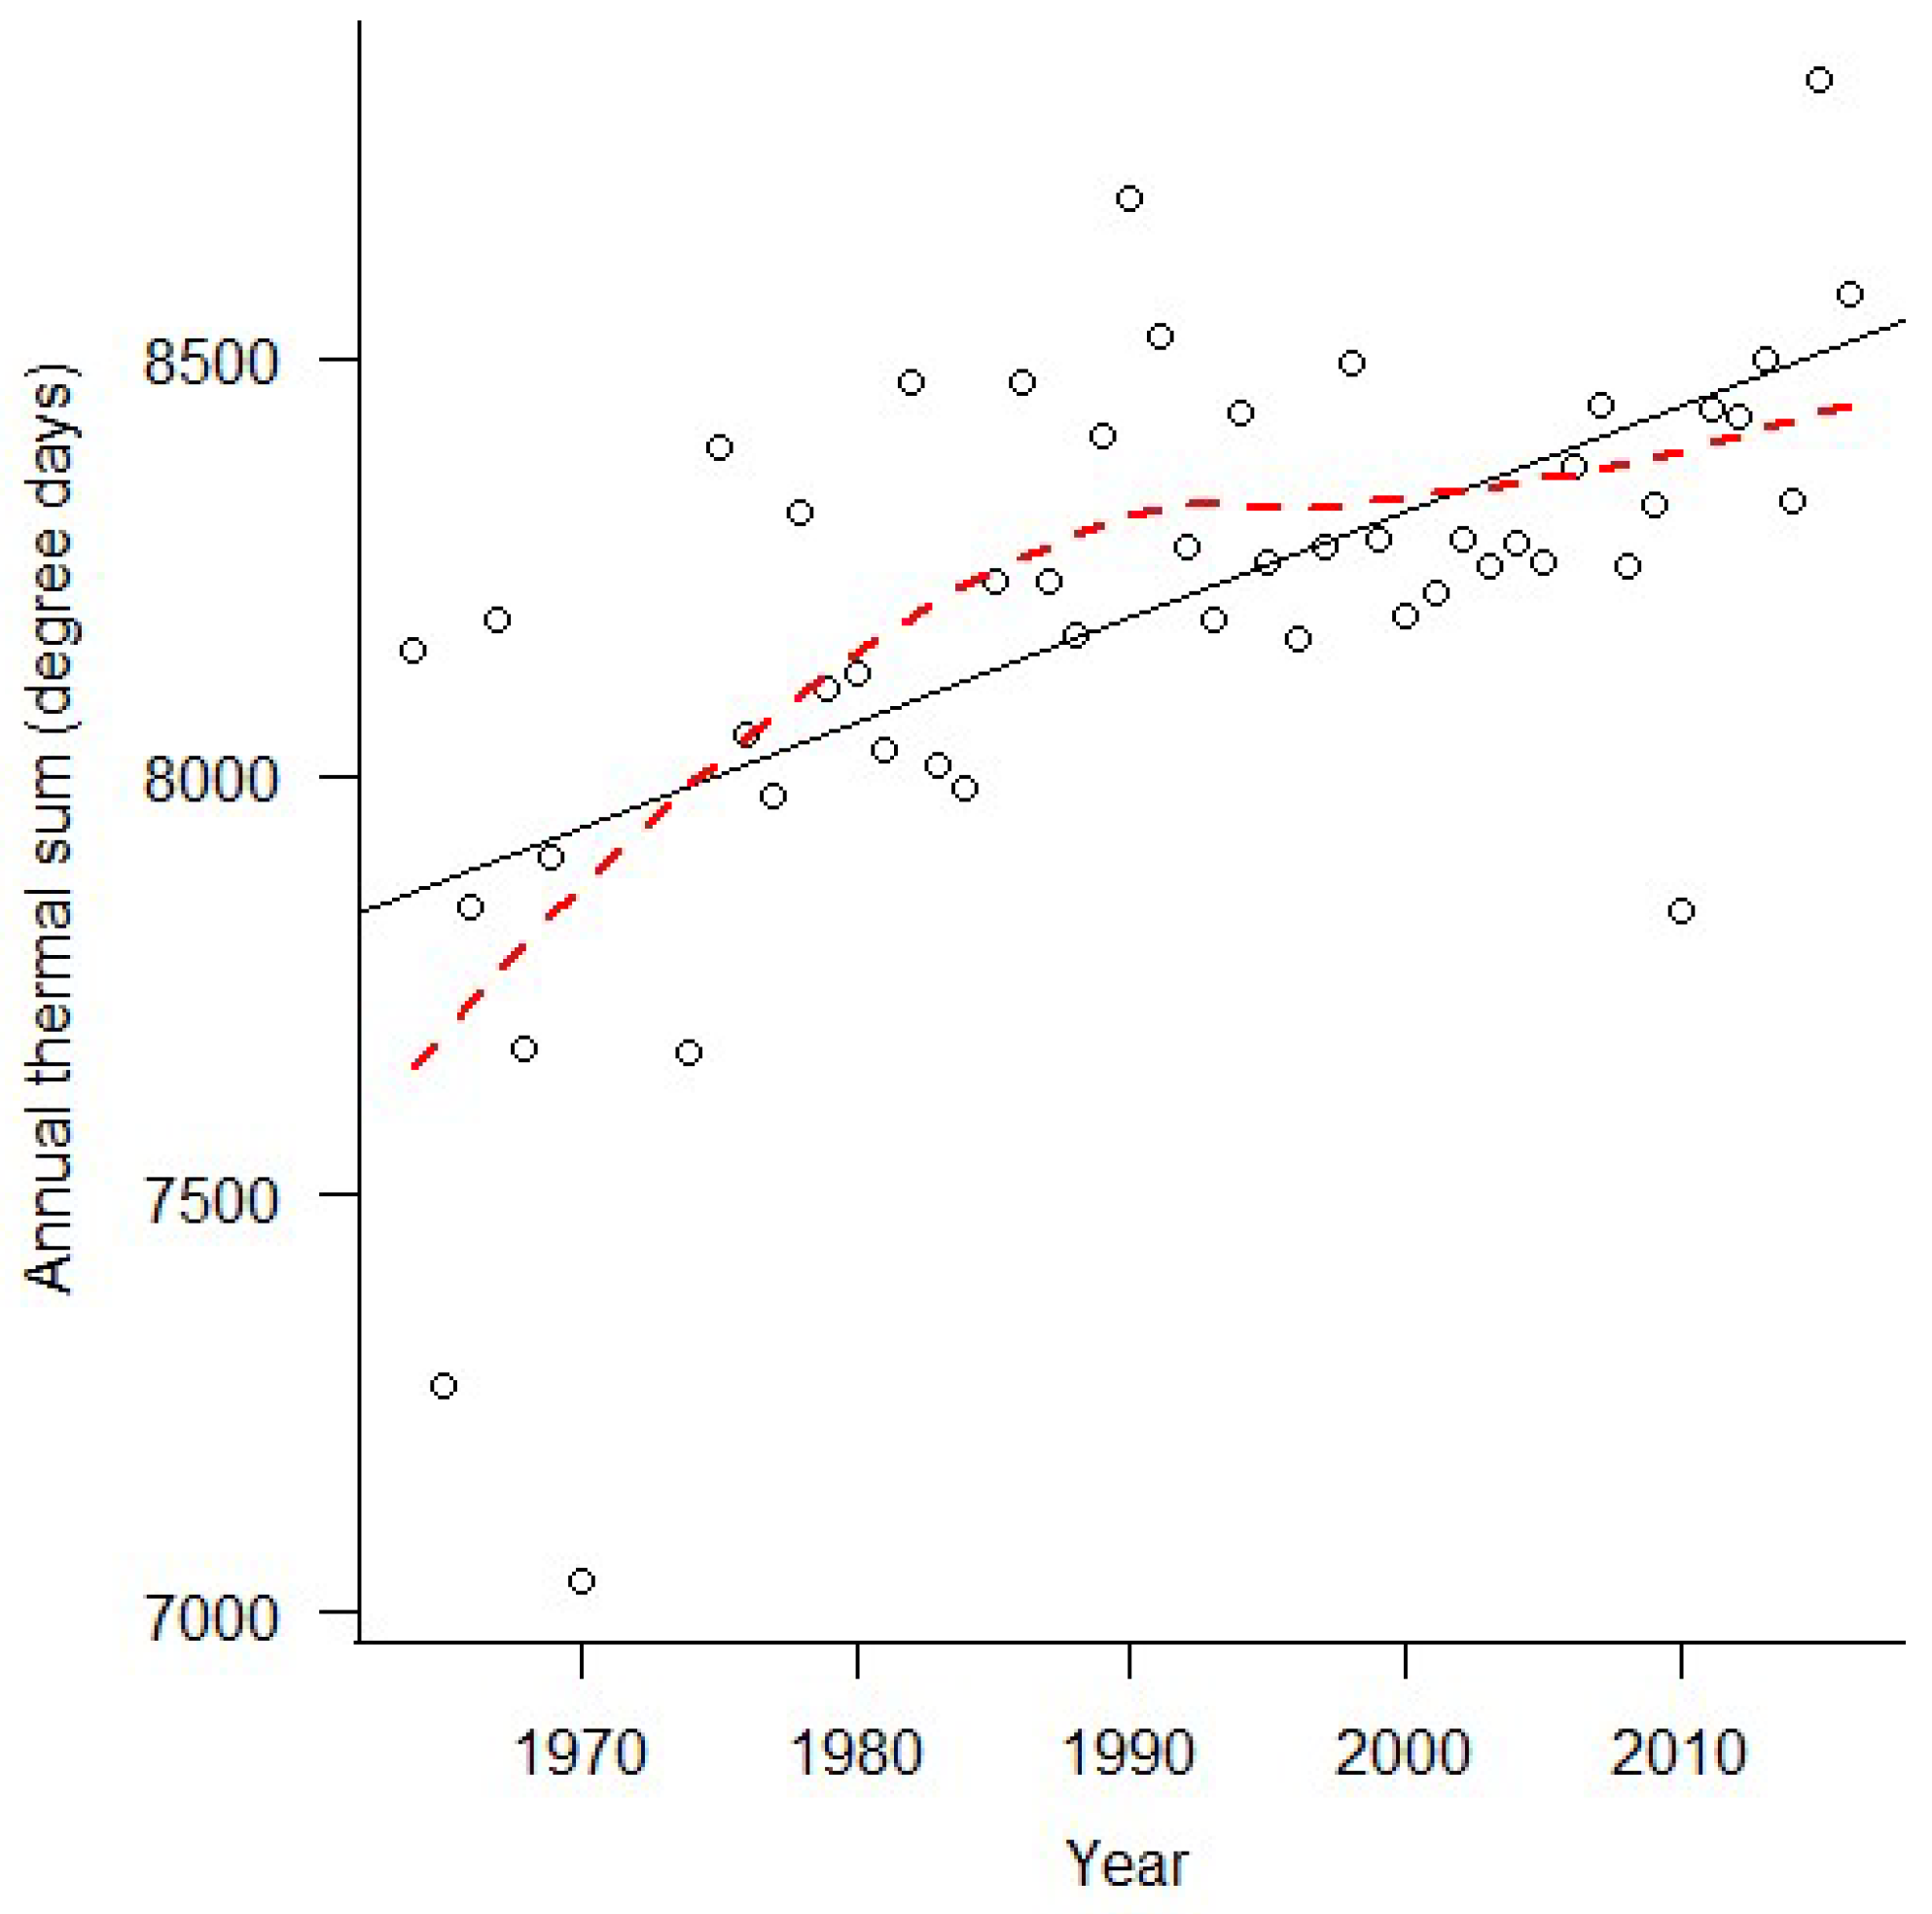
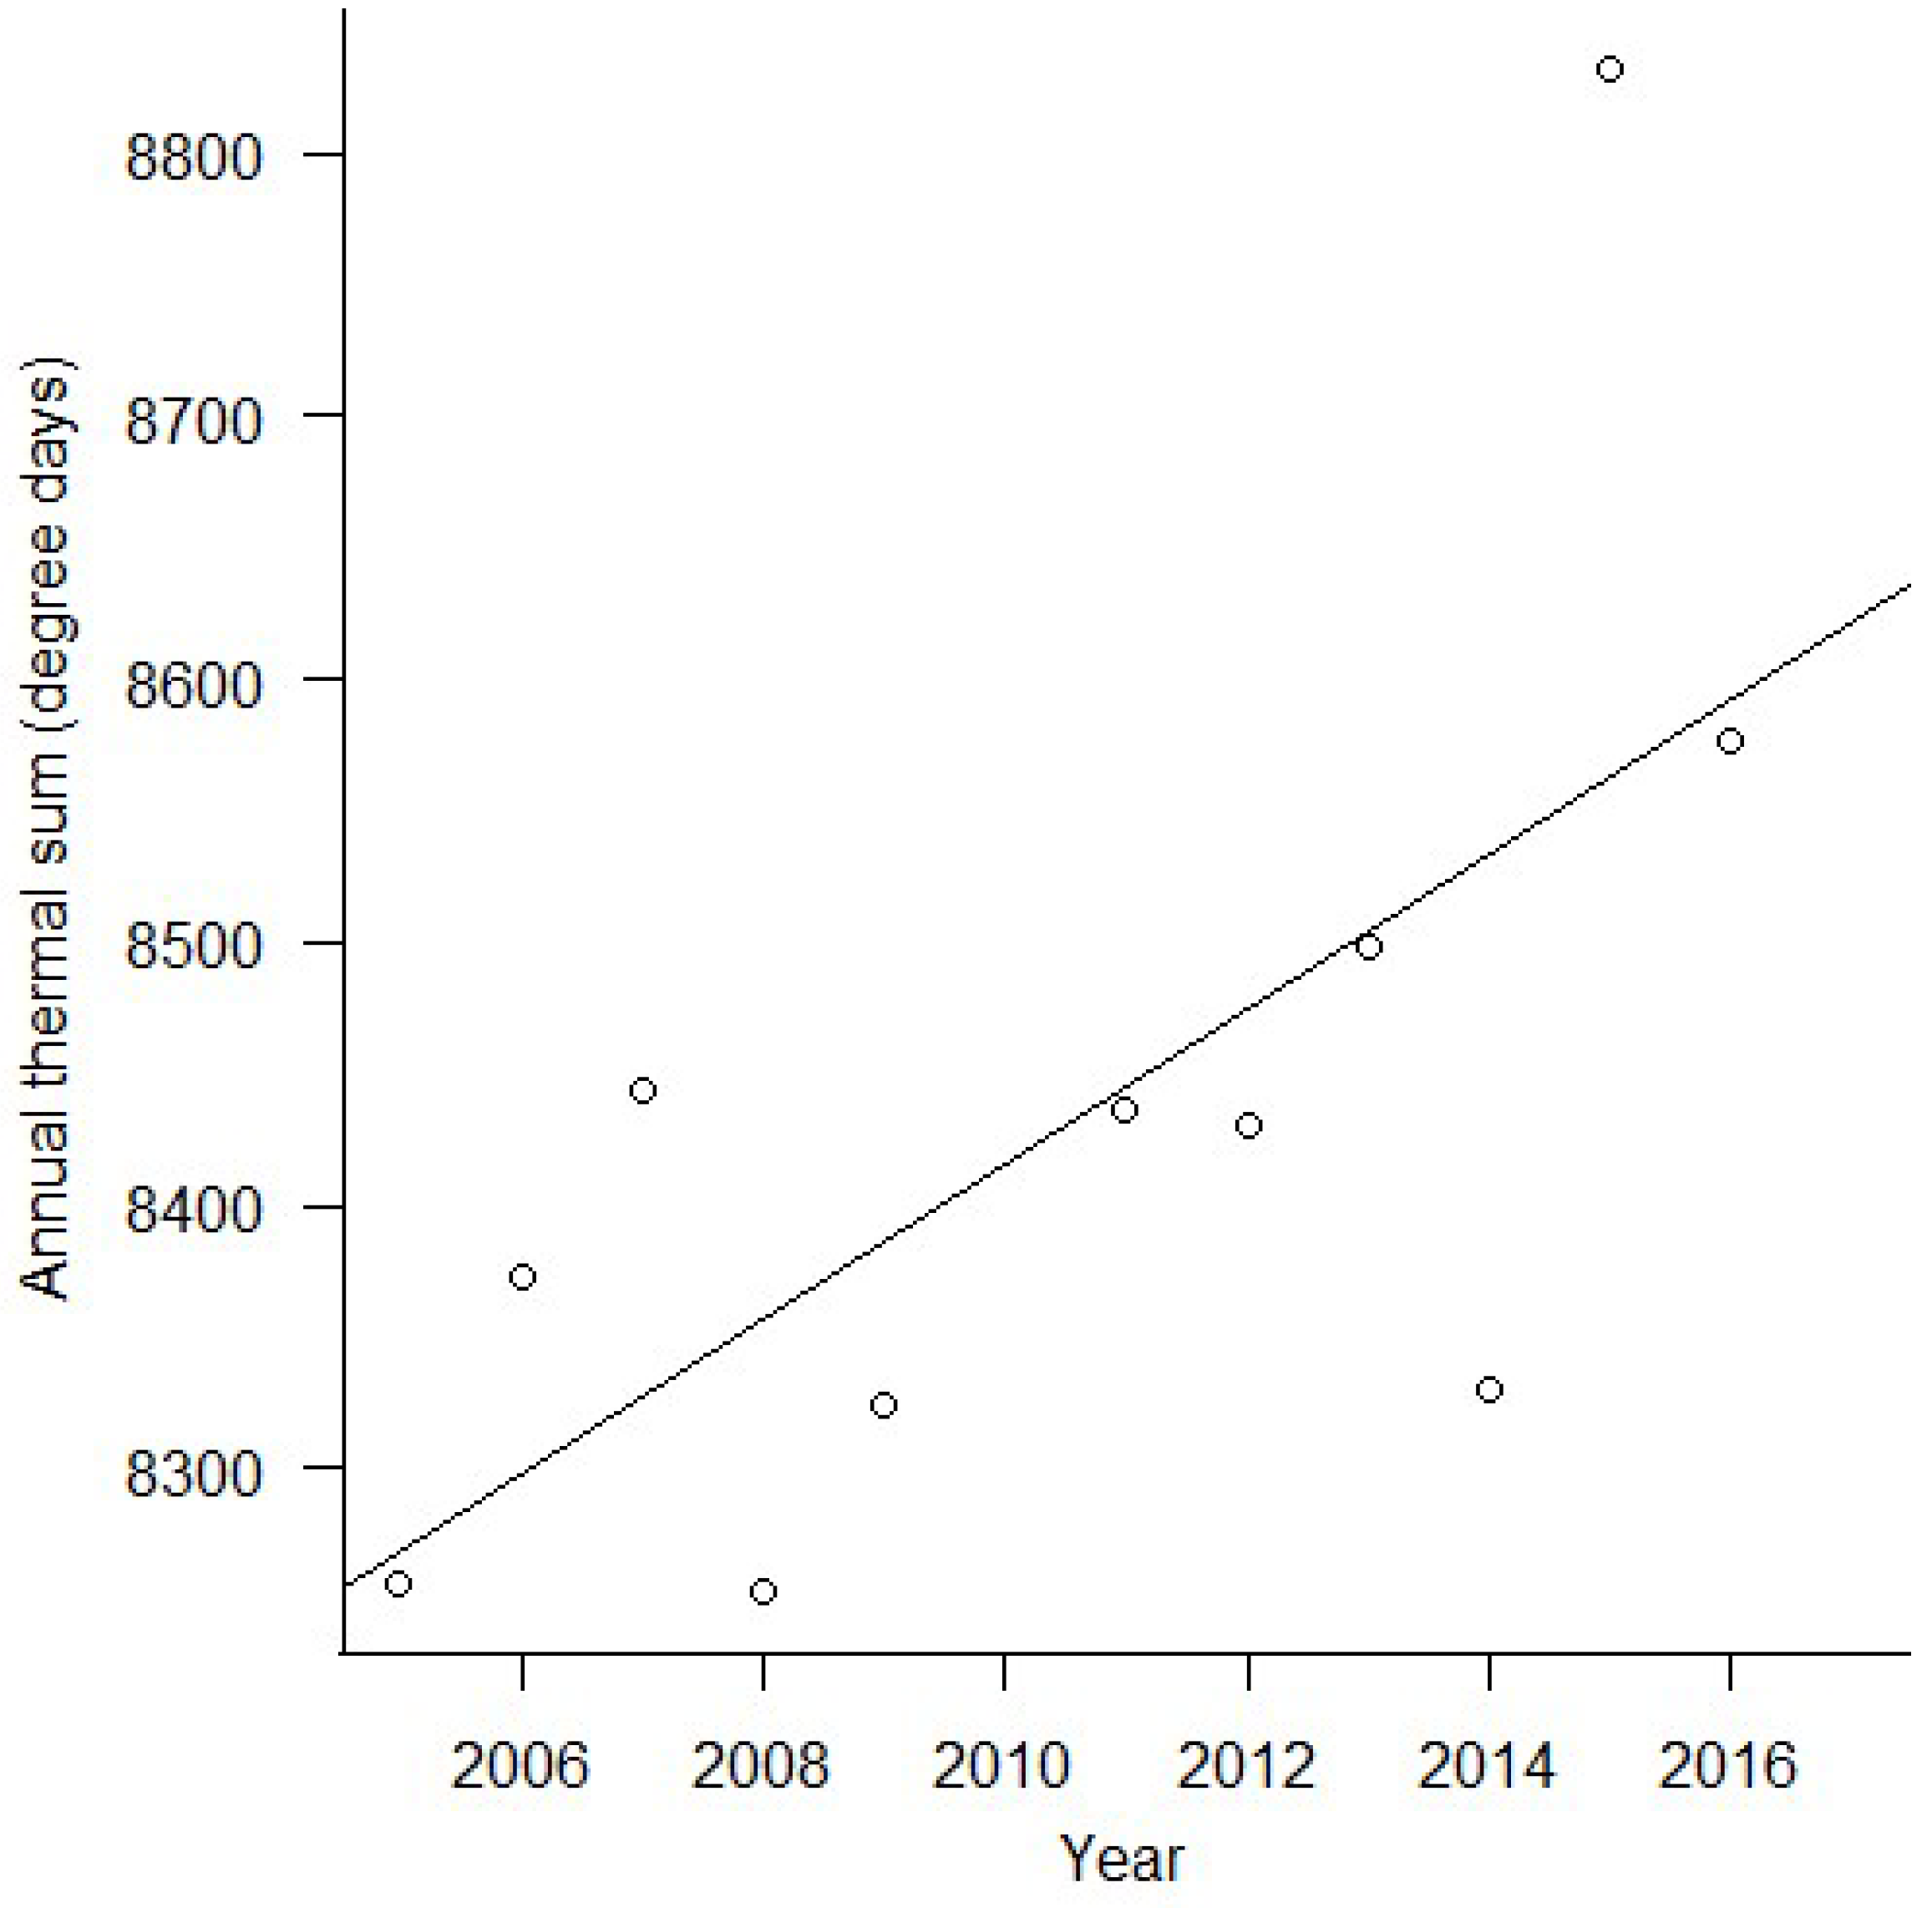
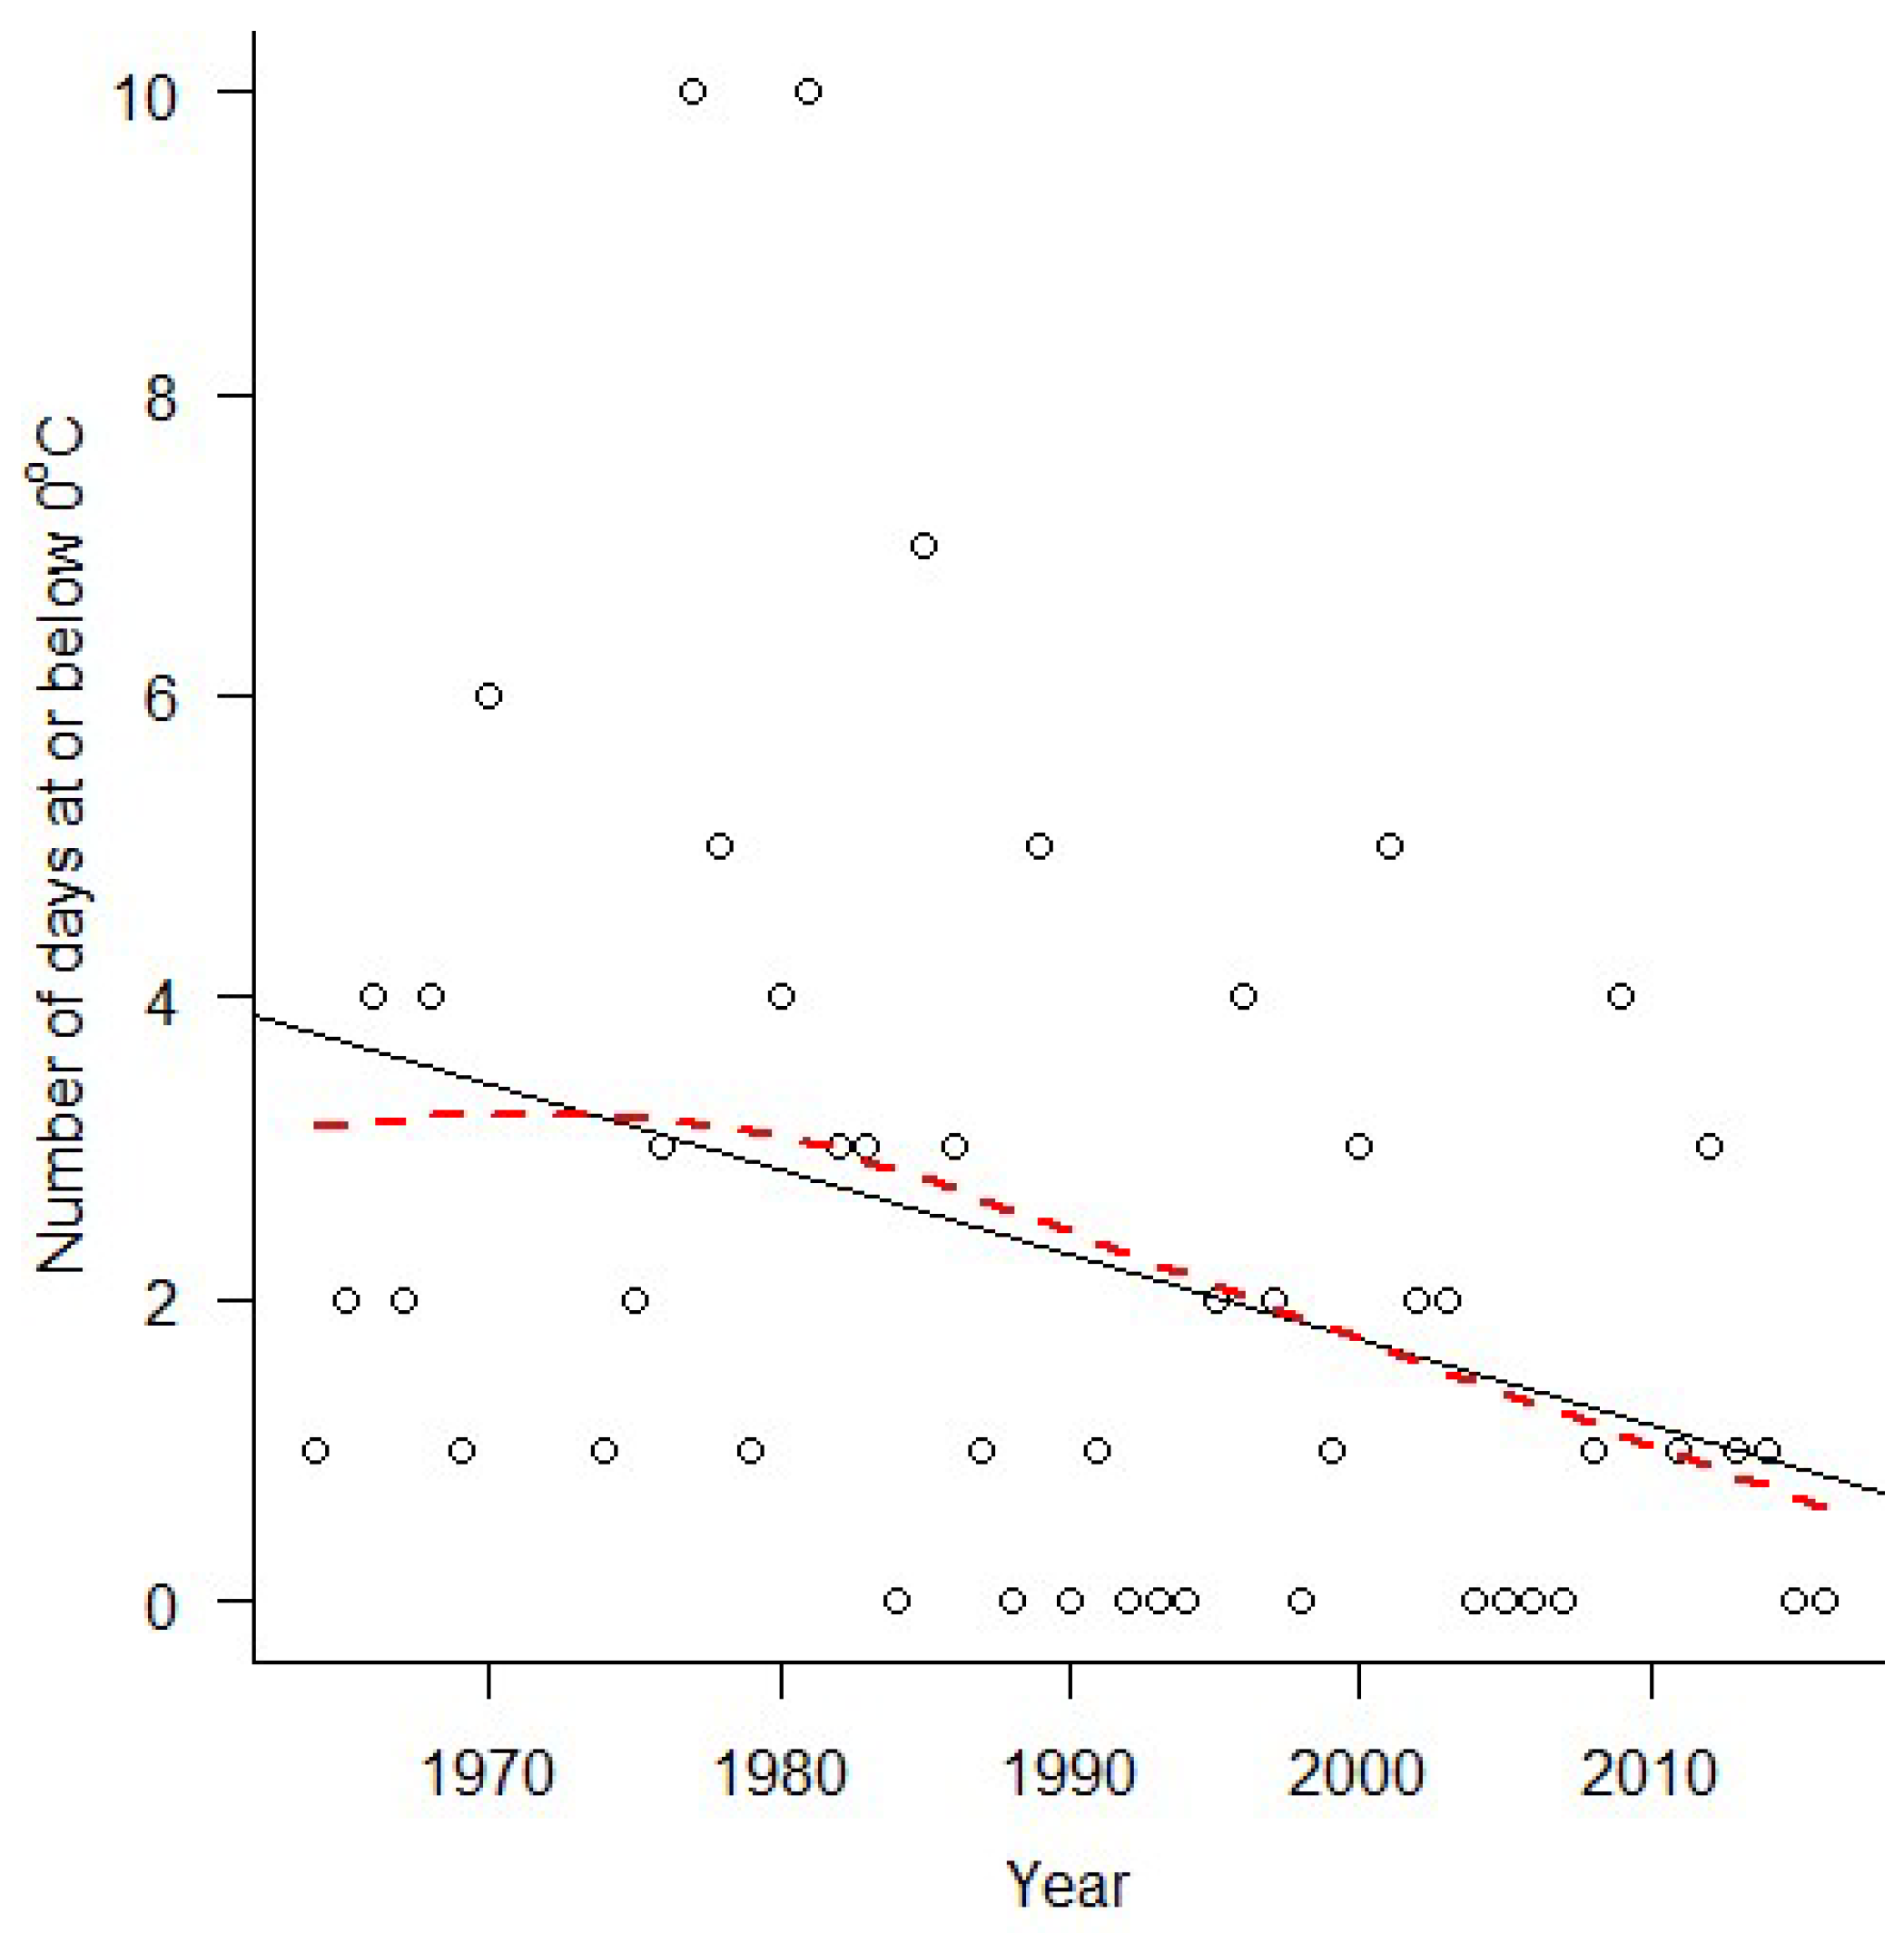
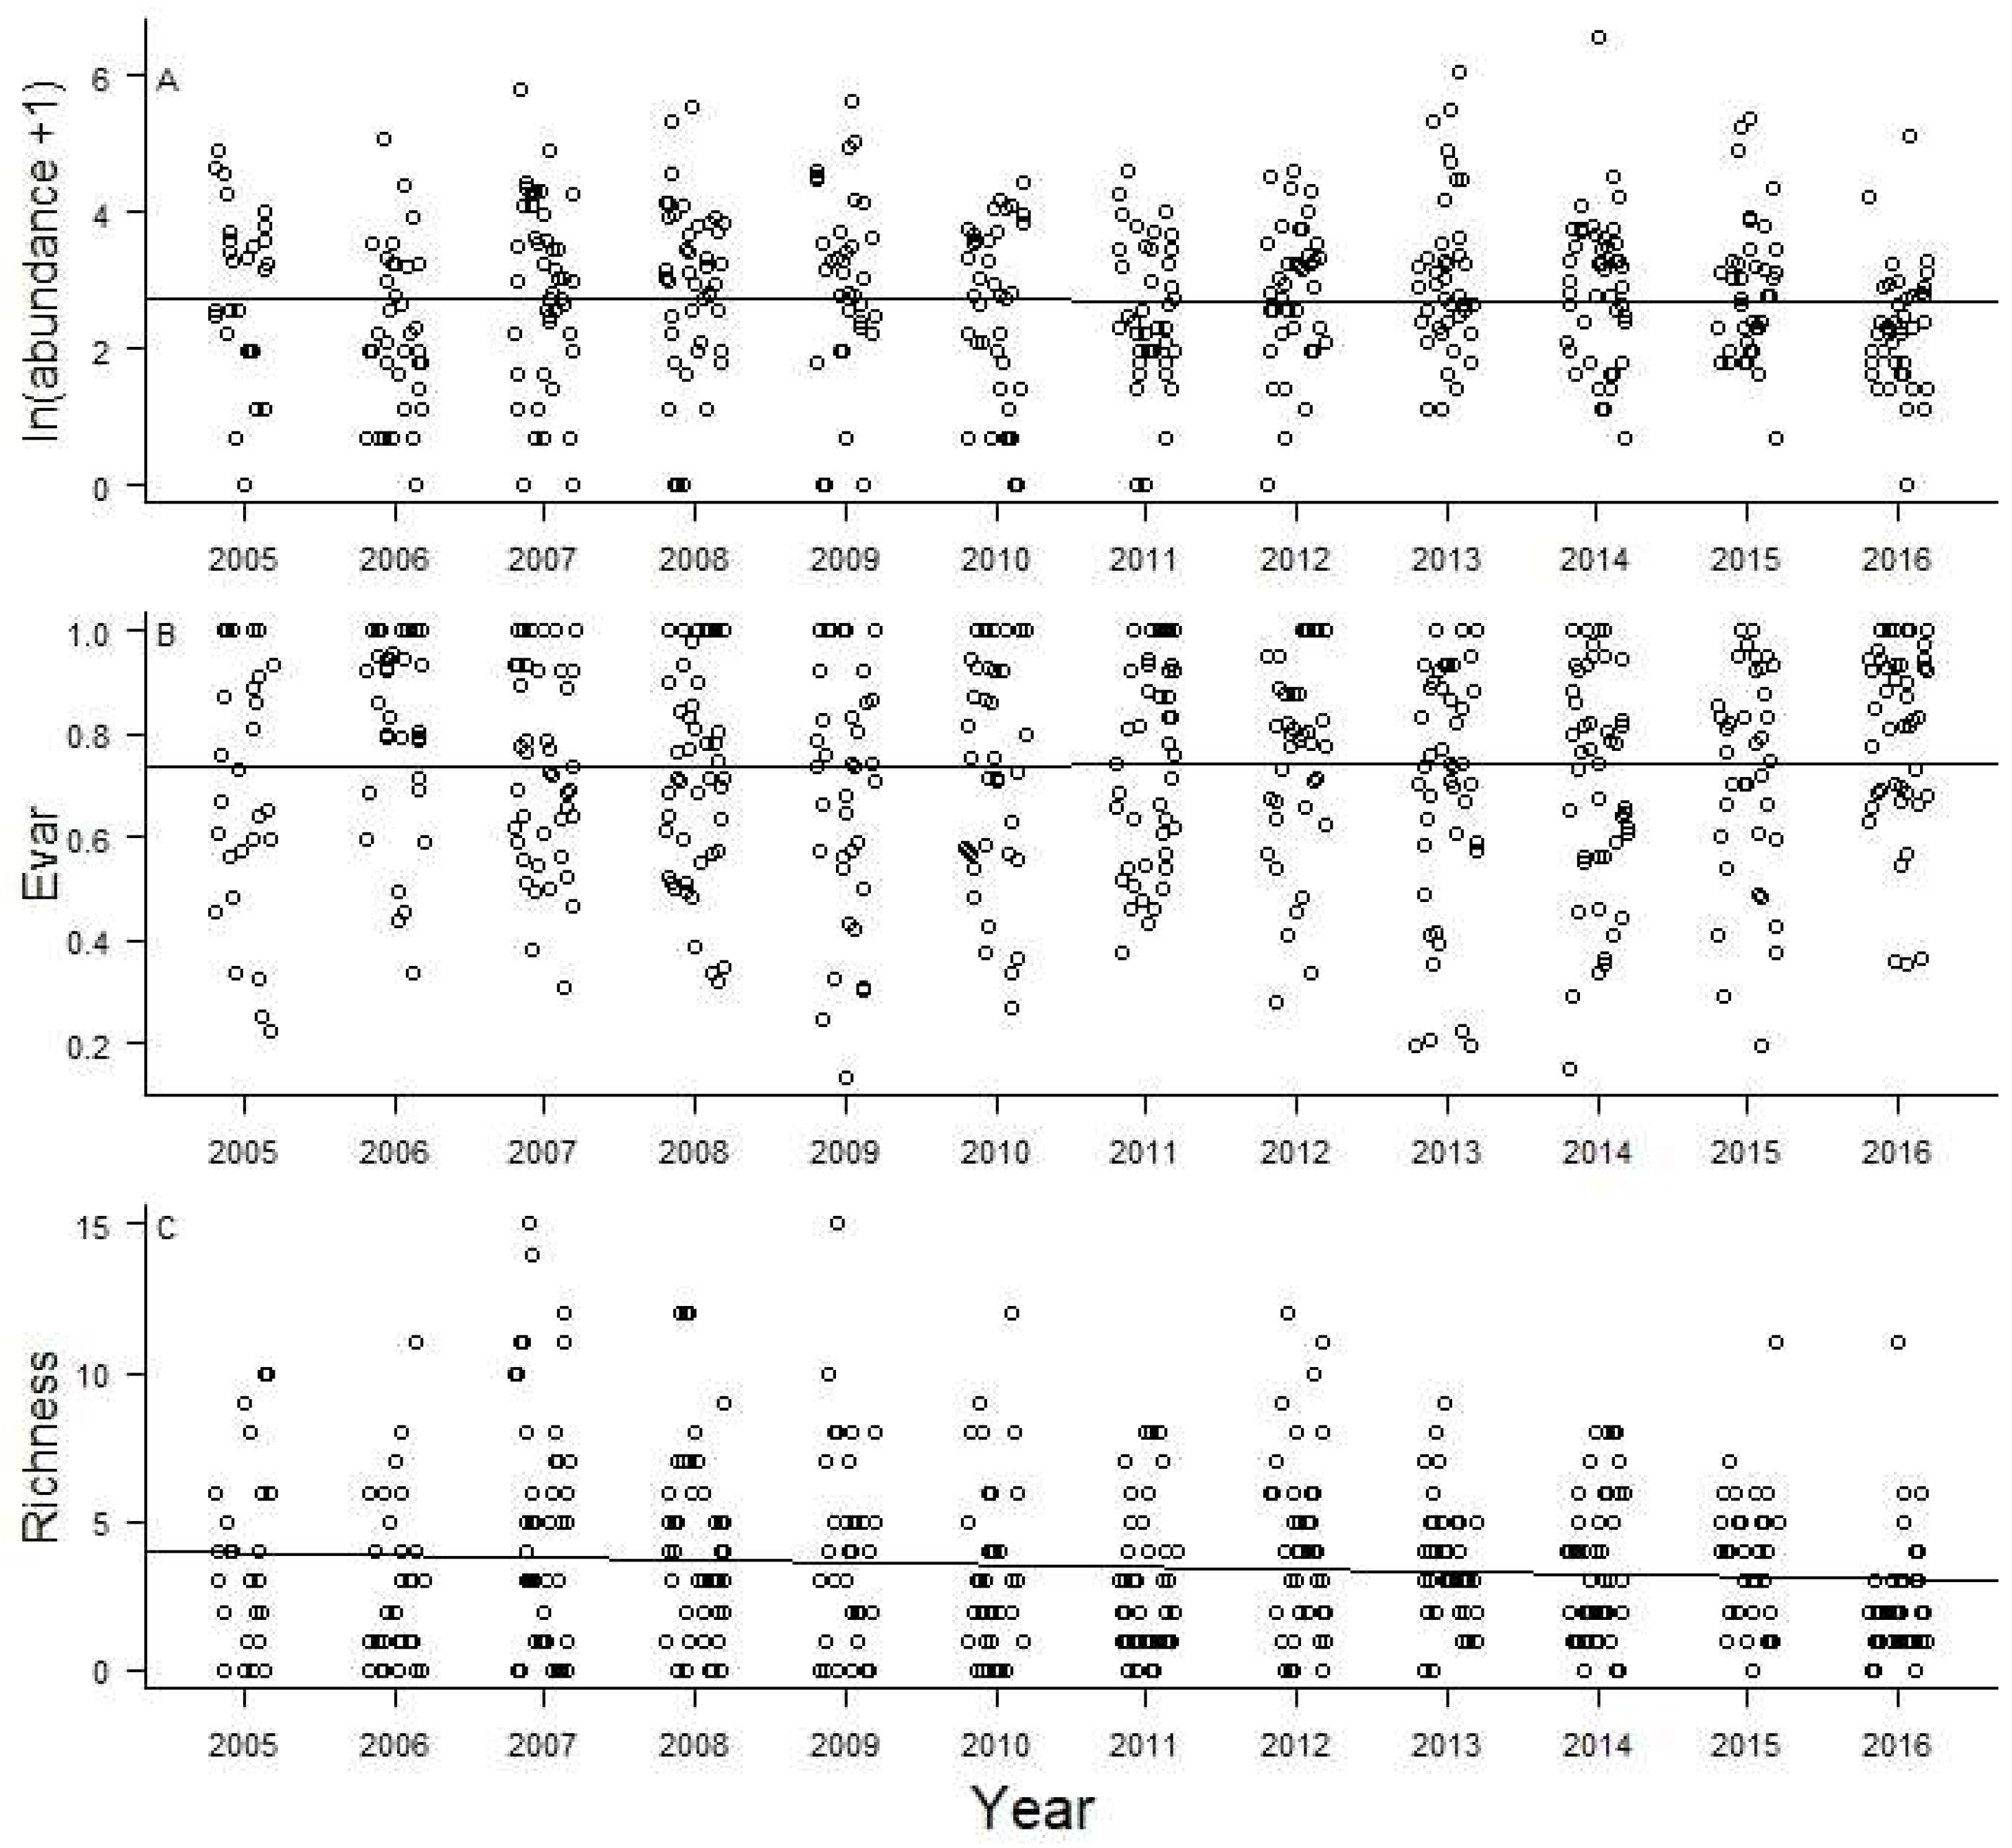
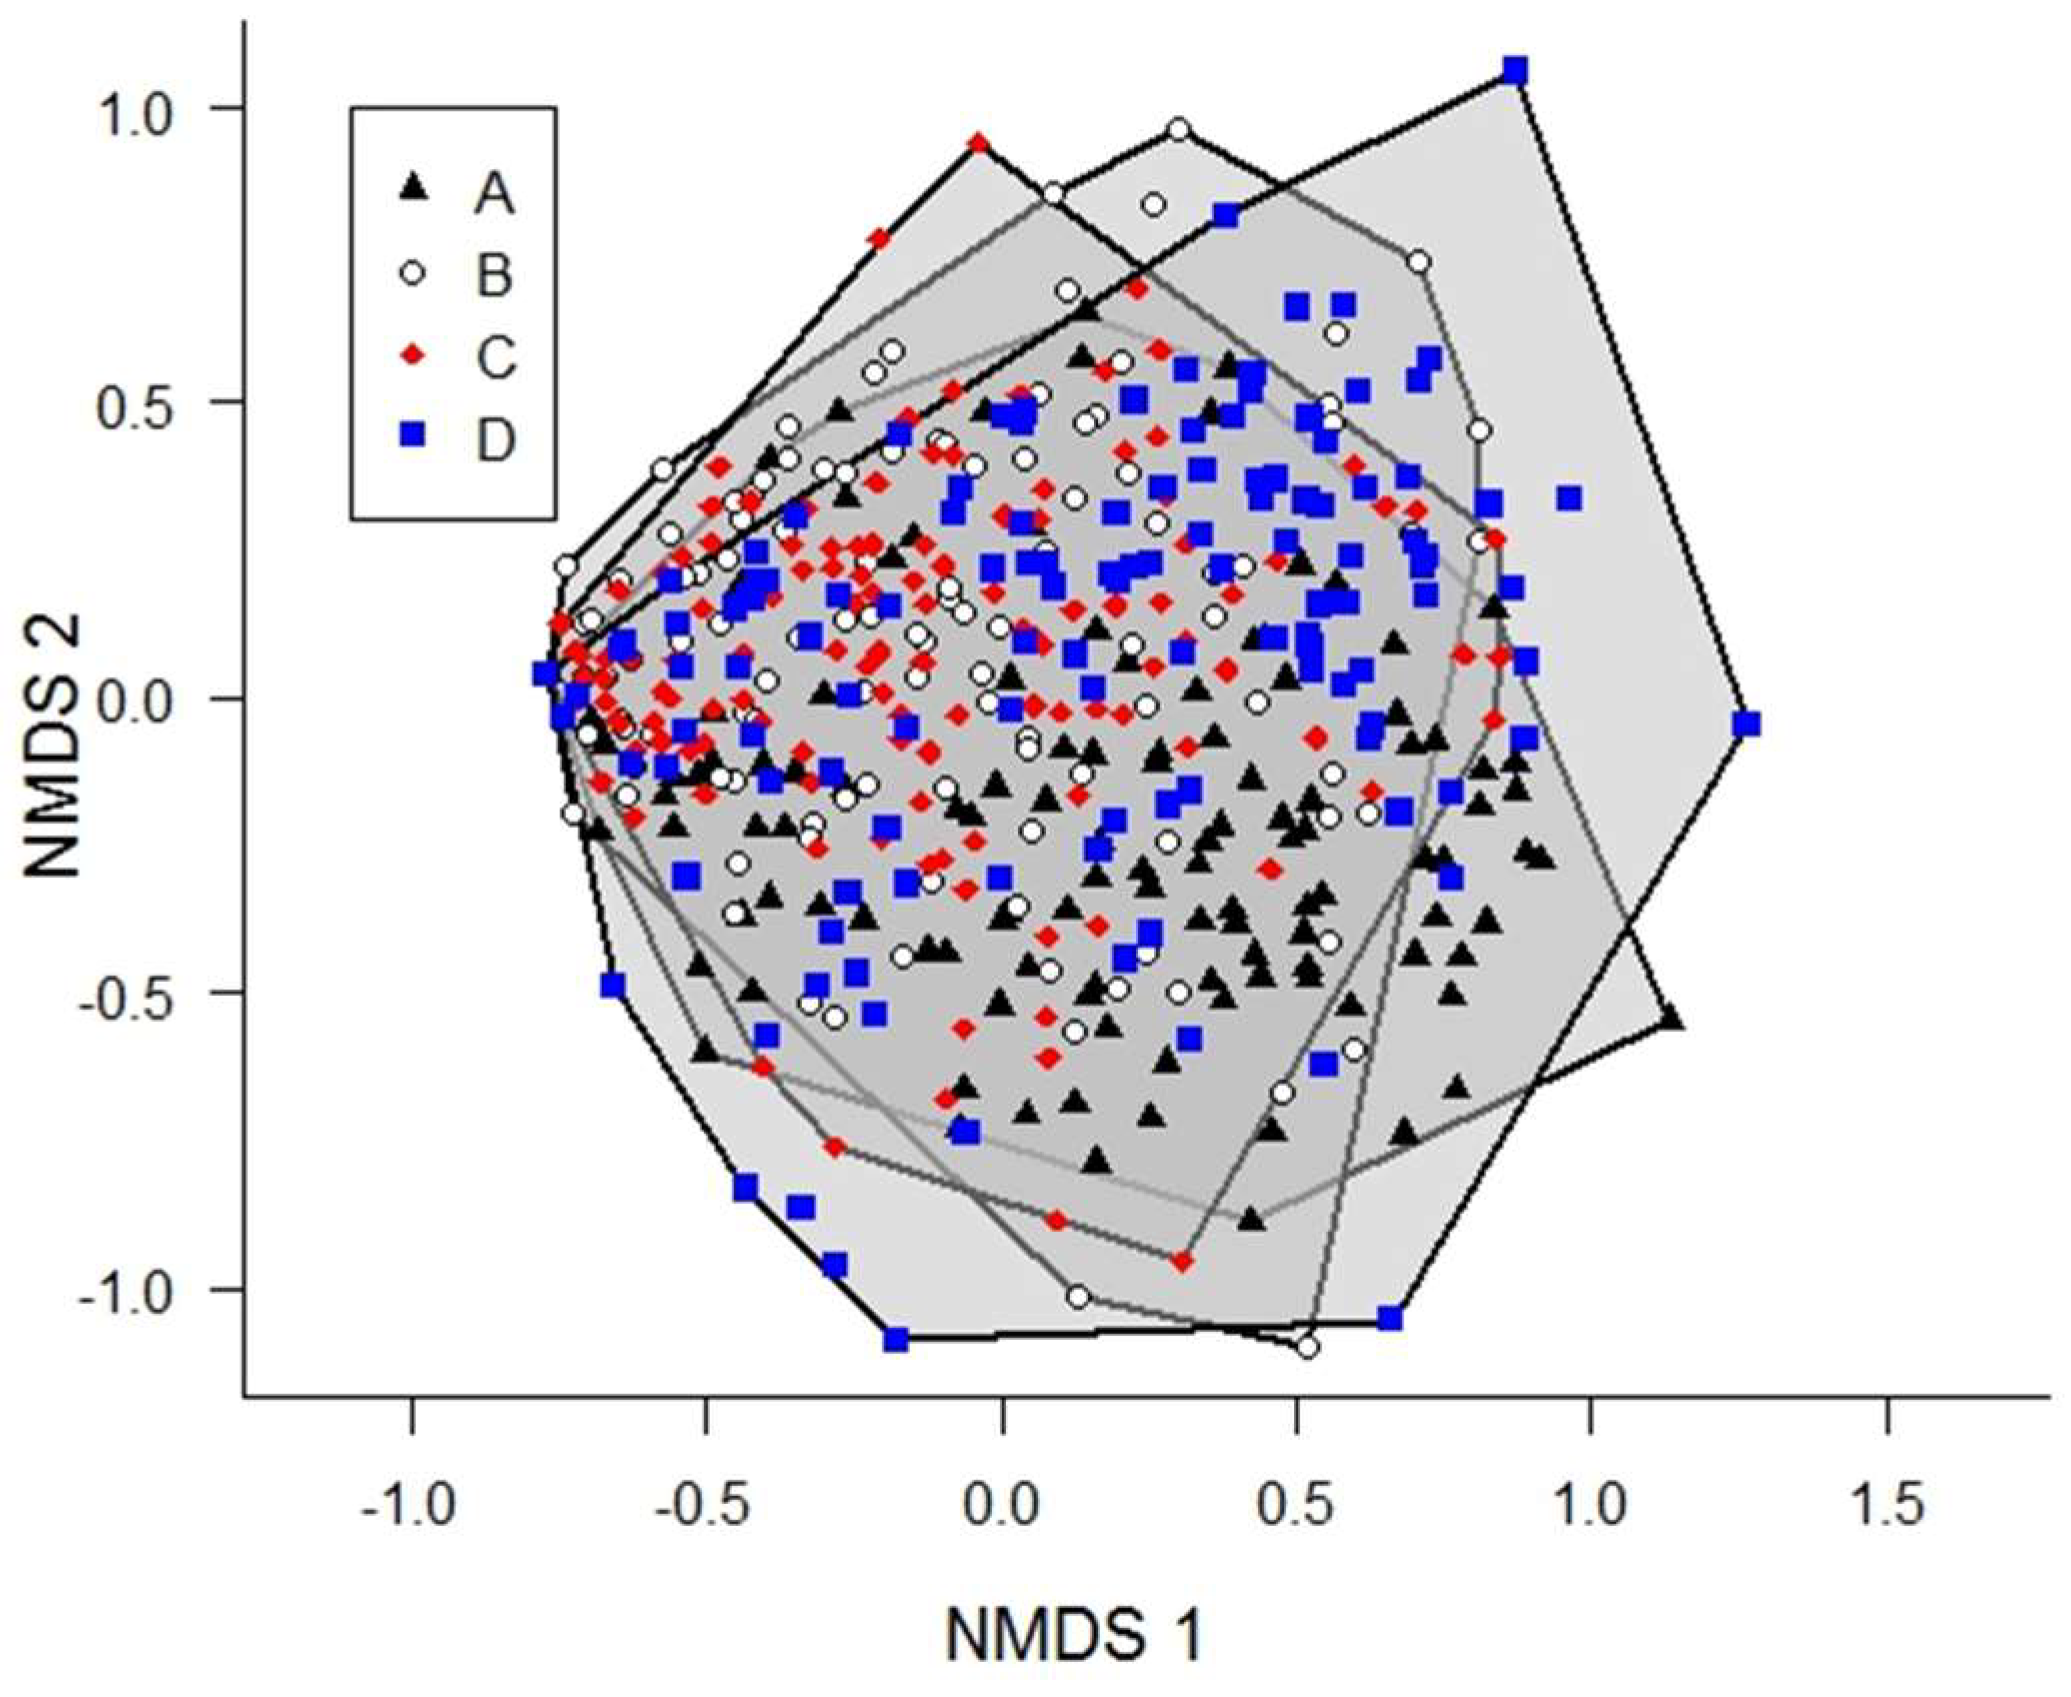
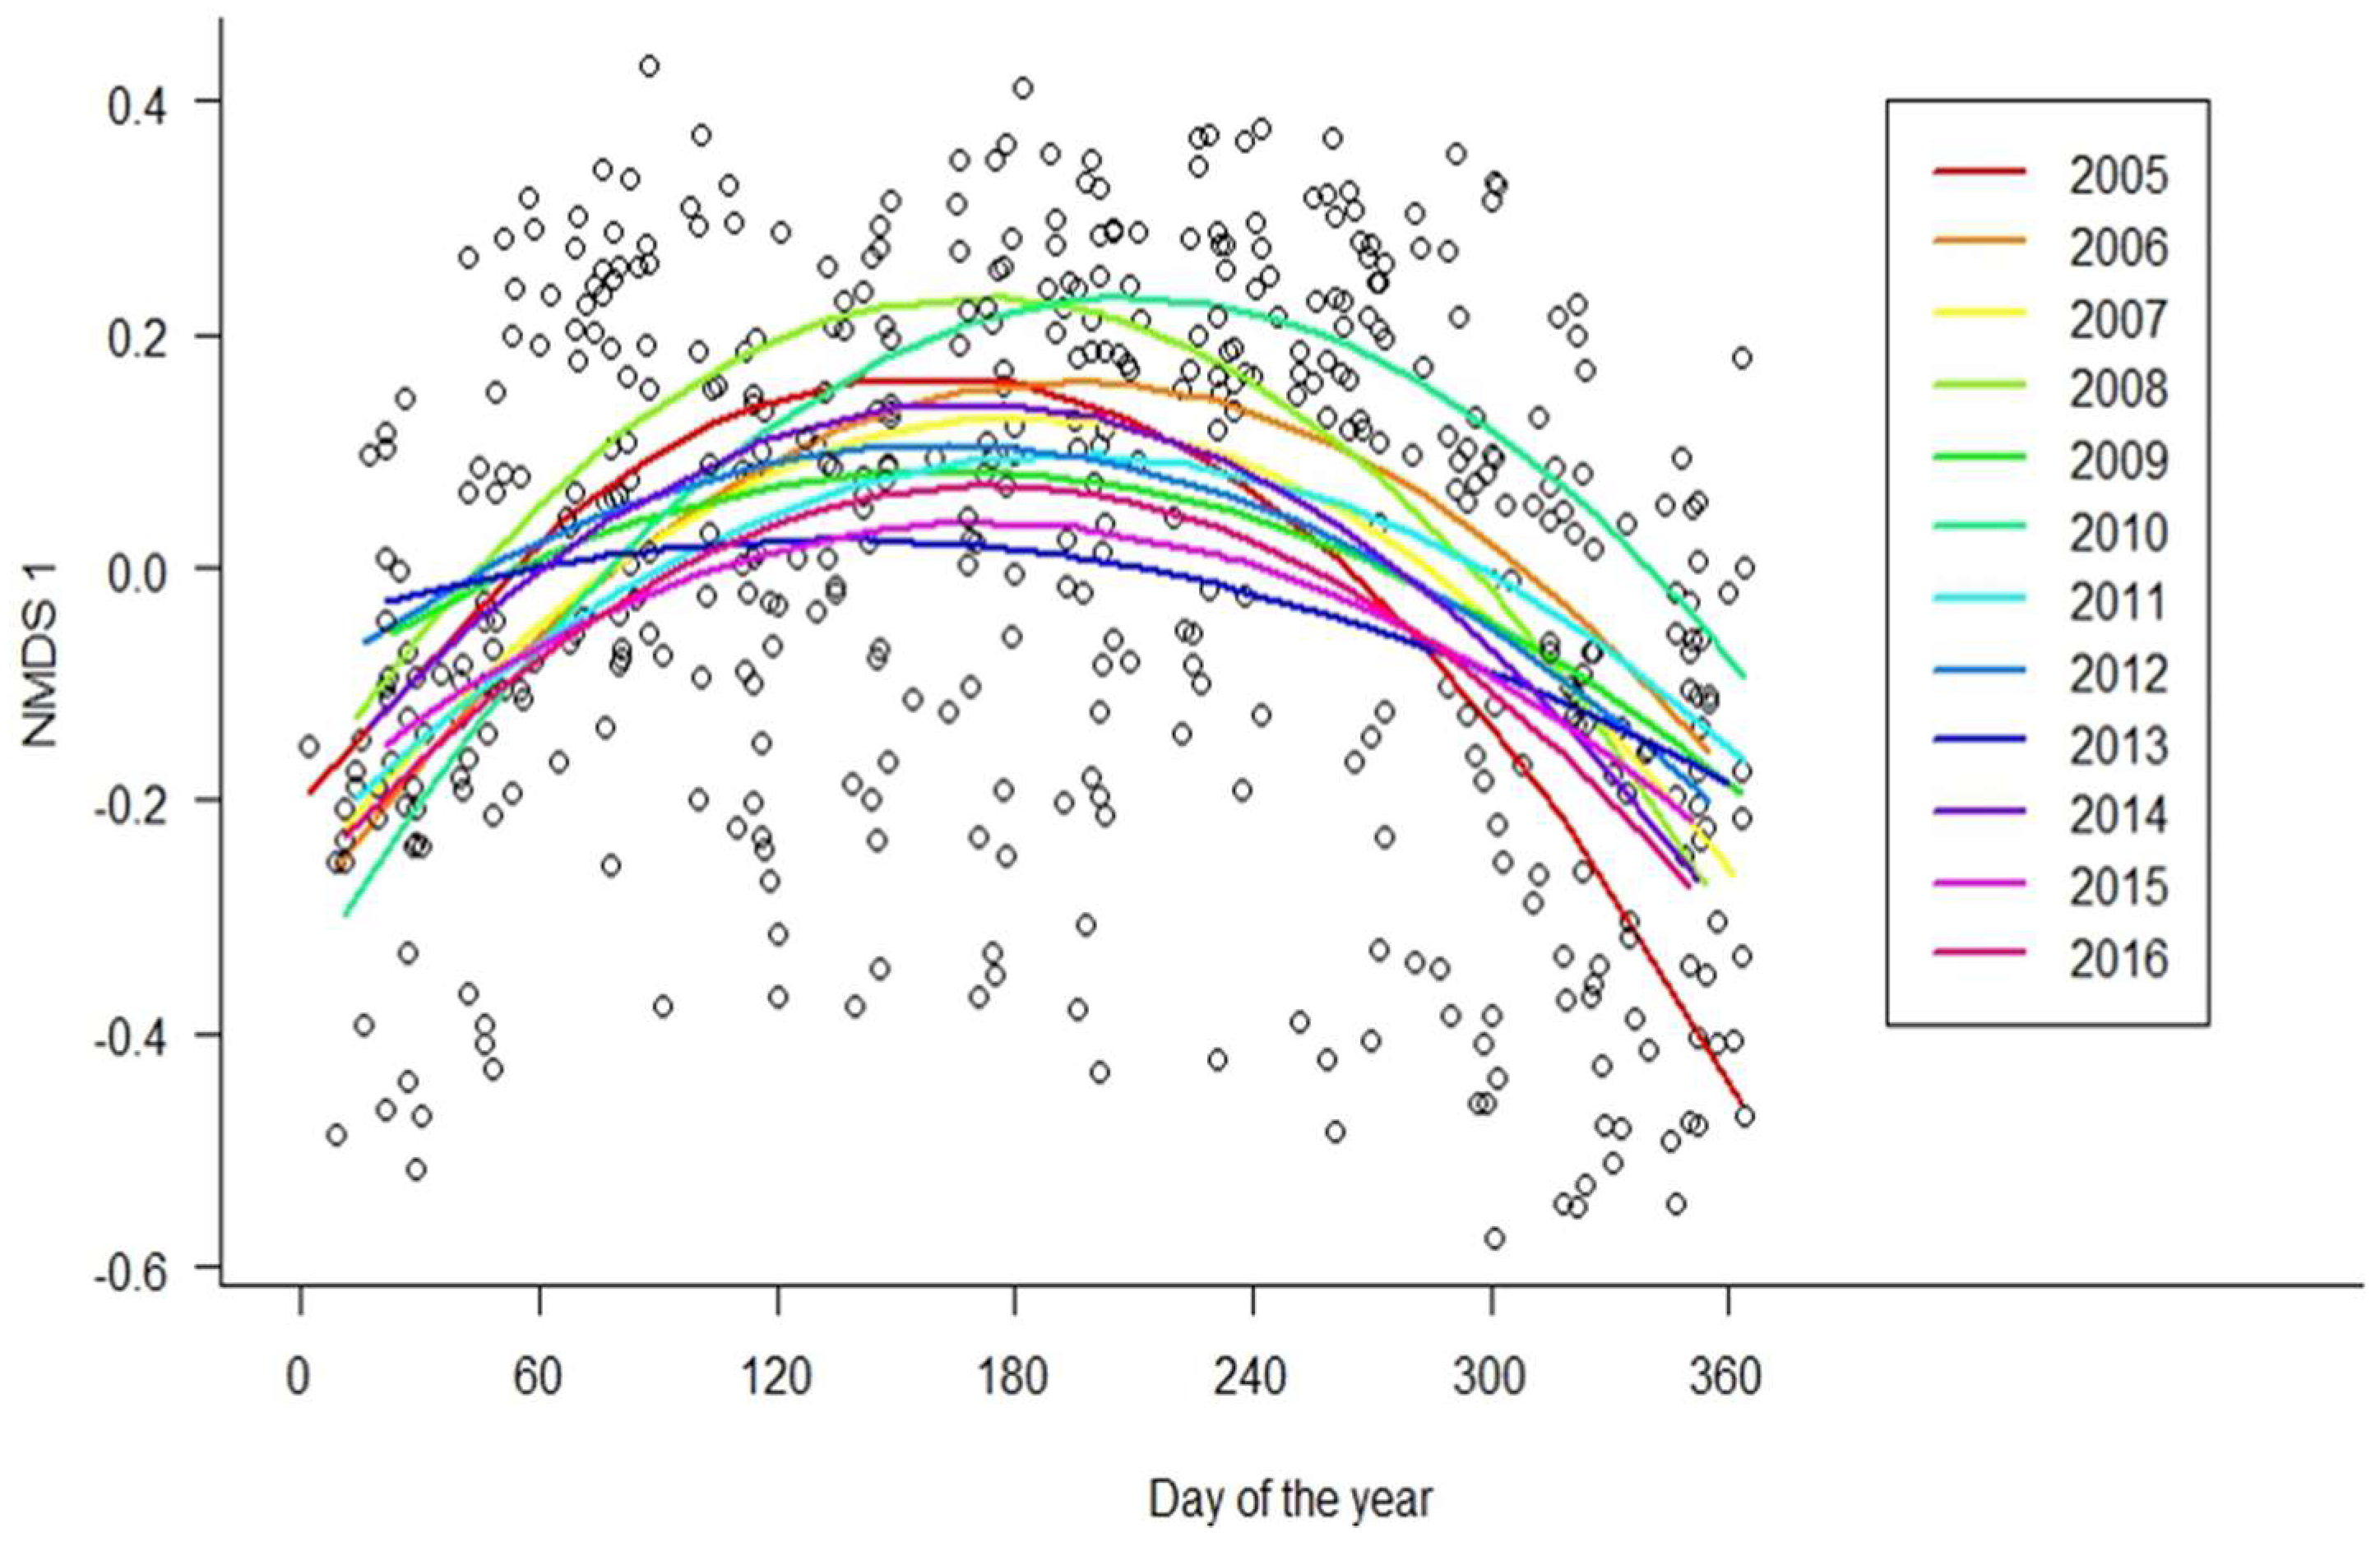
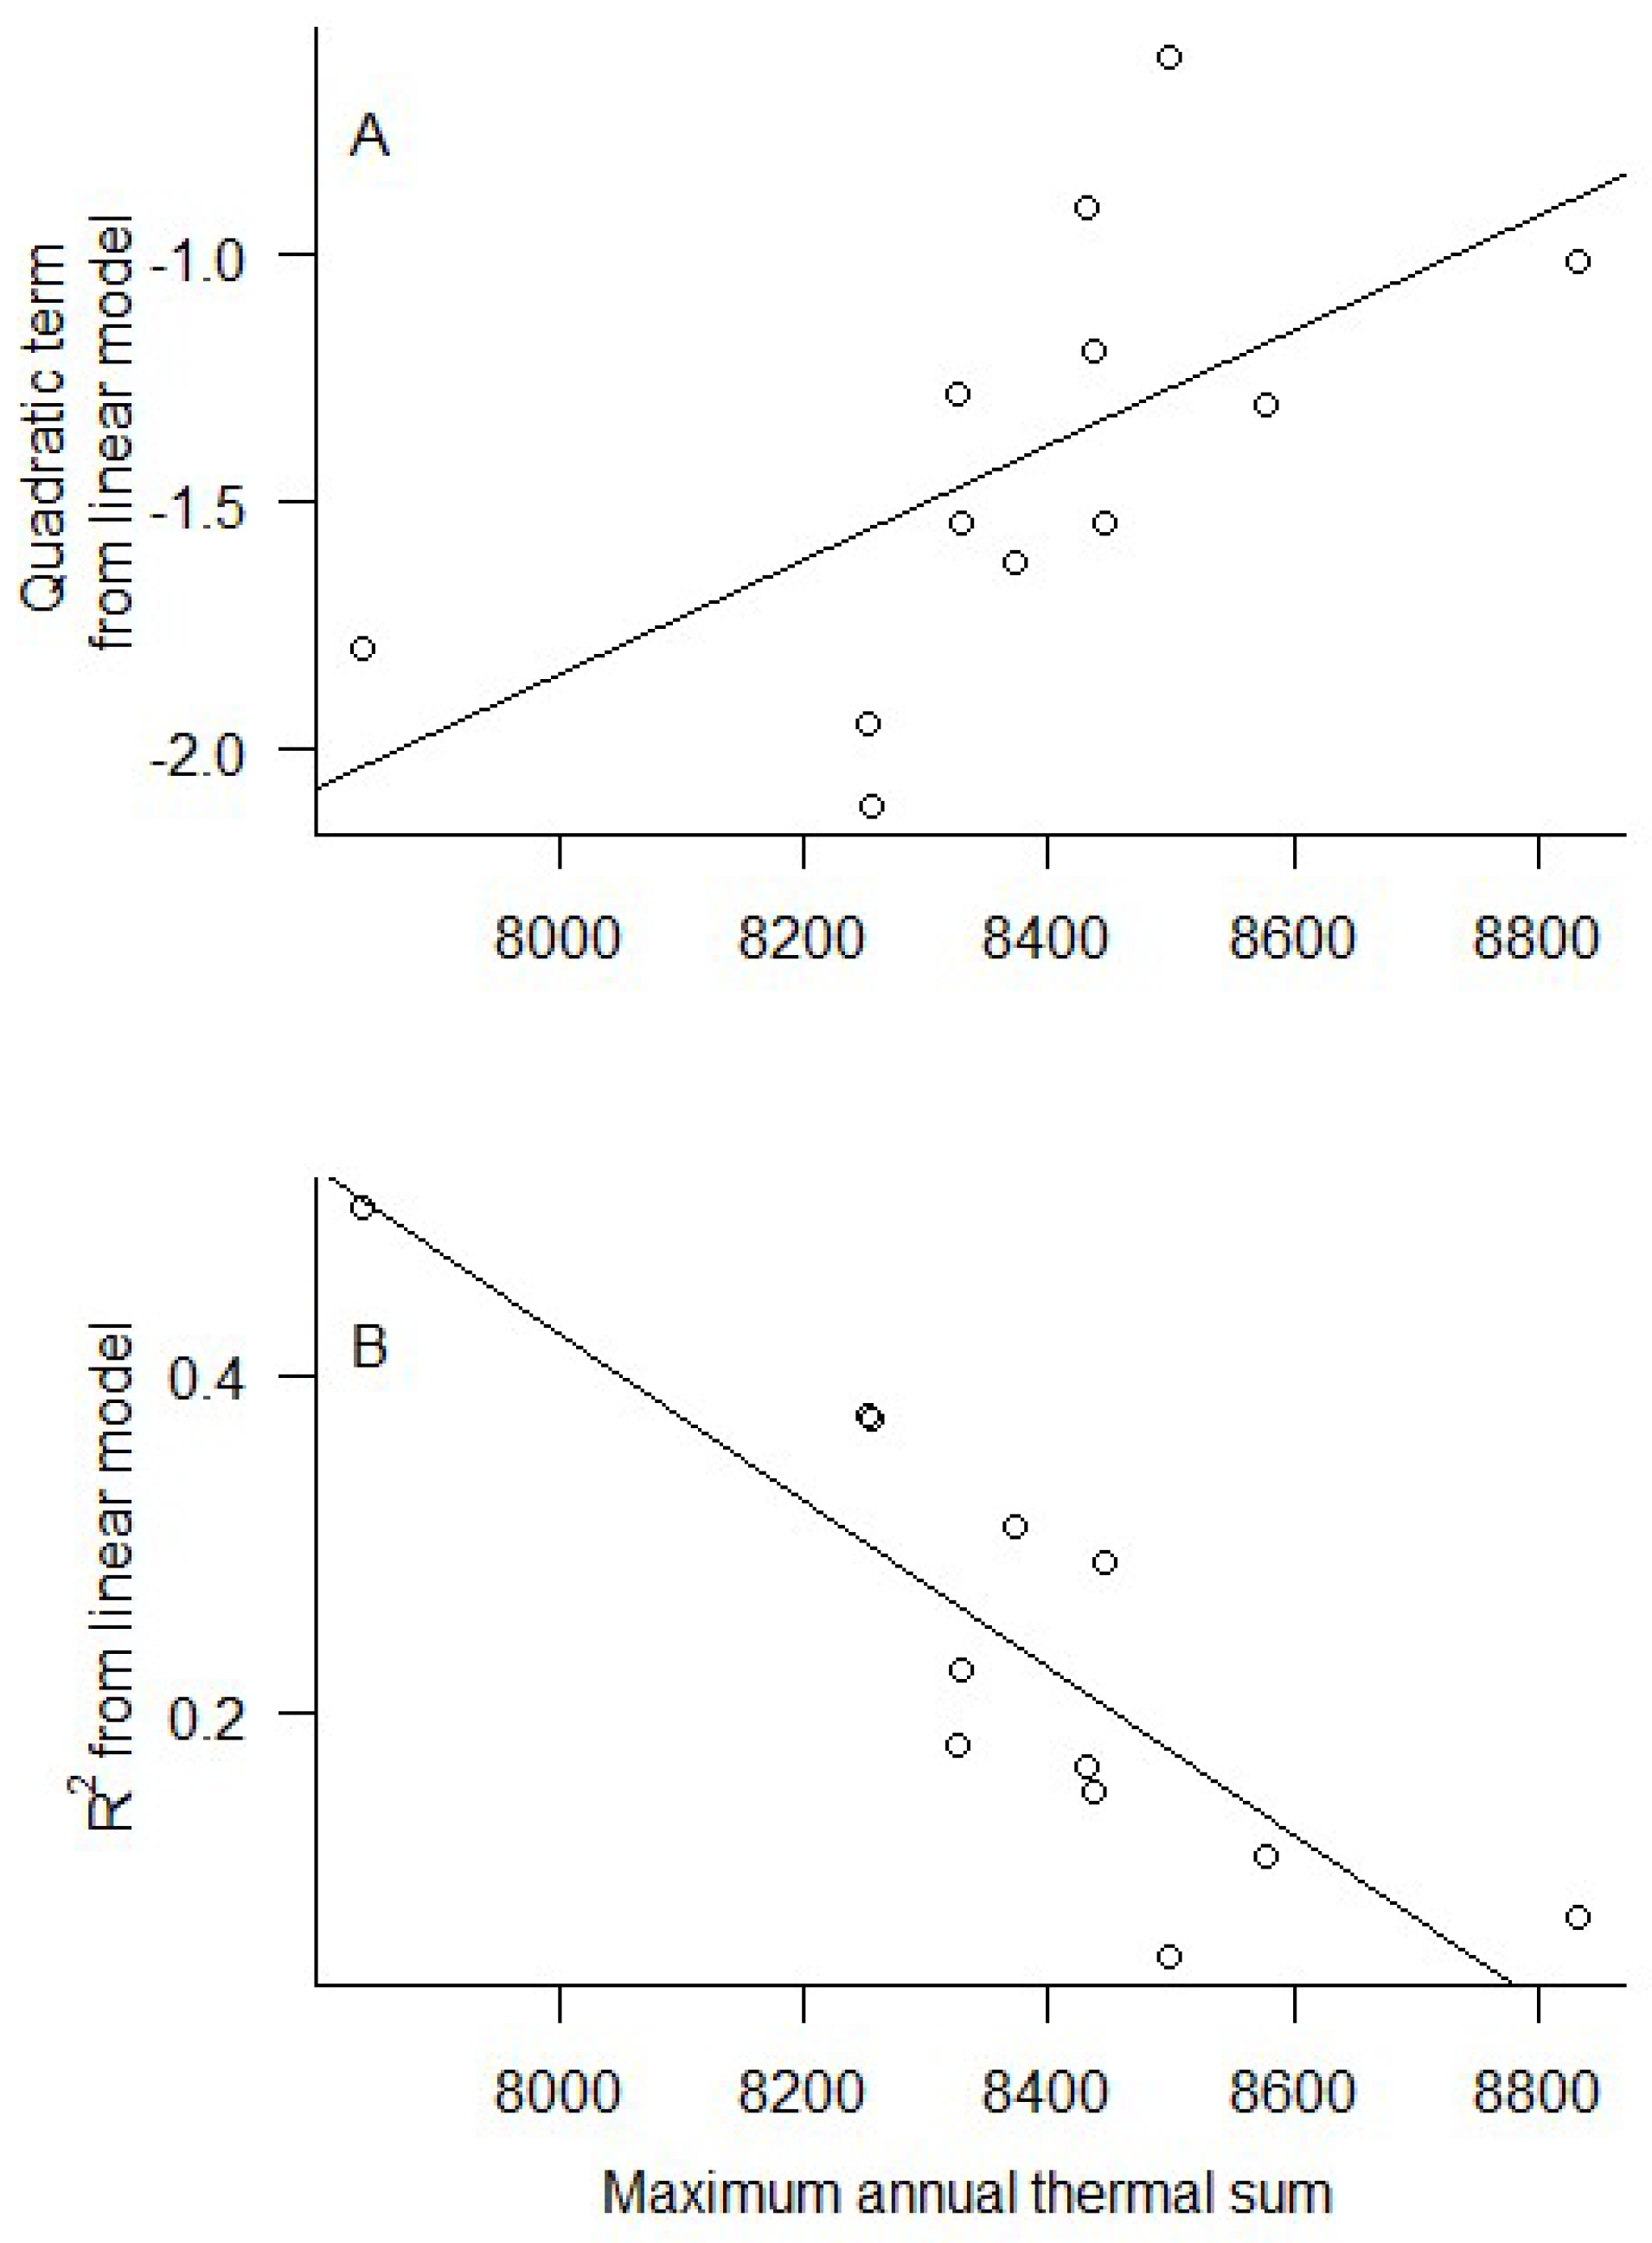
3. Results
4. Discussion
5. Conclusions
Supplementary Materials
Author Contributions
Funding
Acknowledgments
Conflicts of Interest
References
- Parmesan, C.; Ryrholm, N.; Stefanescu, C.; Hill, J.K.; Thomas, C.D.; Descimon, H.; Huntley, B.; Kaila, L.; Kullberg, J.; Tammaru, T.; et al. Poleward shifts in geographical ranges of butterfly species associated with regional warming. Nature 1999, 399, 579–583. [Google Scholar] [CrossRef]
- Root, T.L.; Price, J.T.; Hall, K.R.; Schneider, S.H.; Rosenzweig, C.; Pounds, J.A. Fingerprints of global warming on wild animals and plants. Nature 2003, 421, 57–60. [Google Scholar] [CrossRef] [PubMed]
- Hughes, L. Biological consequences of global warming: Is the signal already apparent? Trends Ecol. Evol. 2000, 15, 56–61. [Google Scholar] [CrossRef]
- Thuiller, W.; Richardson, D.M.; Midgley, G.F. Will Climate Change Promote Alien Plant Invasions. In Biological Invasions; Nentwig, D.W., Ed.; Ecological Studies; Springer: Berlin/Heidelberg, Germany, 2008; ISBN 978-3-540-77375-7. [Google Scholar]
- Parmesan, C. Ecological and evolutionary responses to recent climate change. In Annual Review of Ecology Evolution and Systematics; Annu. Rev. Ecol. Evol. Syst. 2006, 37, 637–669. [Google Scholar] [CrossRef]
- Alan Pounds, J.; Bustamante, M.R.; Coloma, L.A.; Consuegra, J.A.; Fogden, M.P.L.; Foster, P.N.; La Marca, E.; Masters, K.L.; Merino-Viteri, A.; Puschendorf, R.; et al. Widespread amphibian extinctions from epidemic disease driven by global warming. Nature 2006, 439, 161–167. [Google Scholar] [CrossRef] [PubMed]
- Parmesan, C.; Yohe, G. A globally coherent fingerprint of climate change impacts across natural systems. Nature 2003, 421, 37–42. [Google Scholar] [CrossRef] [PubMed]
- Forrest, J.; Miller-Rushing, A.J. Toward a synthetic understanding of the role of phenology in ecology and evolution. Philos. Trans. R. Soc. B Biol. Sci. 2010, 365, 3101–3112. [Google Scholar] [CrossRef] [PubMed] [Green Version]
- Cayton, H.L.; Haddad, N.M.; Gross, K.; Diamond, S.E.; Ries, L. Do growing degree days predict phenology across butterfly species? Ecology 2015, 96, 1473–1479. [Google Scholar] [CrossRef]
- Kimball, S.; Angert, A.L.; Huxman, T.E.; Venable, D.L. Contemporary climate change in the Sonoran Desert favors cold-adapted species. Glob. Change Biol. 2010, 16, 1555–1565. [Google Scholar] [CrossRef]
- Guo, H.; Yang, H.; Mockler, T.C.; Lin, C. Regulation of flowering time by Arabidopsis photoreceptors. Science 1998, 279, 1360–1363. [Google Scholar] [CrossRef] [PubMed]
- Lambert, A.M.; Miller-Rushing, A.J.; Inouye, D.W. Changes in snowmelt date and summer precipitation affect the flowering phenology of Erythronium grandiflorum (glacier lily; Liliaceae). Am. J. Bot. 2010, 97, 1431–1437. [Google Scholar] [CrossRef] [PubMed]
- Dunne, J.A.; Harte, J.; Taylor, K.J. Subalpine meadow flowering phenology responses to climate change: integrating experimental and gradient methods. Ecol. Monogr. 2003, 73, 69–86. [Google Scholar] [CrossRef]
- Miller-Rushing, A.J.; Primack, R.B. Global warming and flowering times in Thoreau’s concord: A community perspective. Ecology 2008, 89, 332–341. [Google Scholar] [CrossRef] [PubMed]
- CaraDonna, P.J.; Iler, A.M.; Inouye, D.W. Shifts in flowering phenology reshape a subalpine plant community. Proc. Natl. Acad. Sci. 2014, 111, 4916–4921. [Google Scholar] [CrossRef] [PubMed] [Green Version]
- Gezon, Z.J.; Inouye, D.W.; Irwin, R.E. Phenological change in a spring ephemeral: implications for pollination and plant reproduction. Glob. Change Biol. 2016, 22, 1779–1793. [Google Scholar] [CrossRef] [PubMed]
- Burgess, K.S.; Etterson, J.R.; Galloway, L.F. Artificial selection shifts flowering phenology and other correlated traits in an autotetraploid herb. Heredity 2007, 99, 641–648. [Google Scholar] [CrossRef] [PubMed] [Green Version]
- Memmott, J.; Craze, P.G.; Waser, N.M.; Price, M.V. Global warming and the disruption of plant-pollinator interactions. Ecol. Lett. 2007, 10, 710–717. [Google Scholar] [CrossRef] [PubMed]
- Anderson, J.T.; Inouye, D.W.; McKinney, A.M.; Colautti, R.I.; Mitchell-Olds, T. Phenotypic plasticity and adaptive evolution contribute to advancing flowering phenology in response to climate change. Proc. R. Soc. B Biol. Sci. 2012, 279, 3843–3852. [Google Scholar] [CrossRef] [PubMed] [Green Version]
- McKinney, A.M.; CaraDonna, P.J.; Inouye, D.W.; Barr, B.; Bertelsen, C.D.; Waser, N.M. Asynchronous changes in phenology of migrating Broad-tailed Hummingbirds and their early-season nectar resources. Ecology 2012, 93, 1987–1993. [Google Scholar] [CrossRef] [PubMed] [Green Version]
- Forrest, J.; Inouye, D.W.; Thomson, J.D. Flowering phenology in subalpine meadows: Does climate variation influence community co-flowering patterns? Ecology 2010, 91, 431–440. [Google Scholar] [CrossRef] [PubMed]
- Gilman, S.E.; Urban, M.C.; Tewksbury, J.; Gilchrist, G.W.; Holt, R.D. A framework for community interactions under climate change. Trends Ecol. Evol. 2010, 25, 325–331. [Google Scholar] [CrossRef] [PubMed]
- Bonebrake, T.C.; Ponisio, L.C.; Boggs, C.L.; Ehrlich, P.R. More than just indicators: A review of tropical butterfly ecology and conservation. Biol. Conserv. 2010, 143, 1831–1841. [Google Scholar] [CrossRef]
- Inouye, D.W. Effects of climate change on phenology, frost damage, and floral abundance of montane wildflowers. Ecology 2008, 89, 353–362. [Google Scholar] [CrossRef] [PubMed]
- Altermatt, F. Tell me what you eat and I’ll tell you when you fly: diet can predict phenological changes in response to climate change. Ecol. Lett. 2010, 13, 1475–1484. [Google Scholar] [CrossRef] [PubMed]
- Janzen, D.H. Why mountain passes are higher in the tropics. Am. Nat. 1967, 101, 233–249. [Google Scholar] [CrossRef]
- Diamond, S.E.; Chick, L.; Penick, C.A.; Nichols, L.M.; Cahan, S.H.; Dunn, R.R.; Ellison, A.M.; Sanders, N.J.; Gotelli, N.J. Heat tolerance predicts the importance of species interaction effects as the climate changes. Integr. Comp. Biol. 2017, 57, 112–120. [Google Scholar] [CrossRef] [PubMed]
- Pollard, E. A method of assessing the abundance of butterflies in Monks Wood National Nature Reserve in 1973. Ent. Gaz. 1975, 26, 79–88. [Google Scholar]
- Pollard, E. A method for assessing changes in the abundance of butterflies. Biol. Conserv. 1977, 12, 115–134. [Google Scholar] [CrossRef]
- Smith, B.; Wilson, J.B. A consumer’s guide to evenness indices. Oikos 1996, 76, 70–82. [Google Scholar] [CrossRef]
- Oksanen, J.; Blanchet, F.G.; Friendly, M.; Kindt, R.; Legendre, P.; McGlinn, D.; Minchin, P.R.; O’Hara, R.B.; Simpson, G.L.; Solymos, P.; et al. vegan: Community Ecology Package. Available online: https://cran.r-project.org/web/packages/vegan/index.html (accessed on 12 September 2018).
- Team, R.C. R: A Language and Environment for Statistical Computing; R Foundation for Statistical Computing: Vienna, Austria, 2011; ISBN 3-900051-07-0. [Google Scholar]
- Mazerolle, M.J. AICcmodavg: Model Selection and Multimodel Inference Based on (Q) AIC (c). Available online: https://cran.r-project.org/web/packages/AICcmodavg/index.html (accessed on 12 September 2018).
- Bates, D.; Maechler, M.; Bolker, B.; Walker, S.; Christensen, R.H.B.; Singmann, H.; Dai, B.; Grothendieck, G.; Green, P. lme4: Linear Mixed-Effects Models using “Eigen” and S4. Available online: https://cran.r-project.org/web/packages/lme4/index.html (accessed on 12 September 2018).
- Kuznetsova, A.; Brockhoff, P.B.; Christensen, R.H.B. lmerTest: Tests in Linear Mixed Effects Models. Available online: https://cran.r-project.org/web/packages/lmerTest/index.html (accessed on 12 September 2018).
- Lefcheck, J.S. piecewiseSEM: Piecewise structural equation modelling in r for ecology, evolution, and systematics. Methods Ecol. Evol. 2016, 7, 573–579. [Google Scholar] [CrossRef]
- Lefcheck, J. piecewiseSEM: Piecewise structural equation modeling. Methods Ecol. Evol. 2016, 7, 573–579. [Google Scholar] [CrossRef]
- Wickham, H. RStudio scales: Scale Functions for Visualization. Available online: https://cran.r-project.org/web/packages/scales/index.html (accessed on 8 May 2018).
- Clarke, K.R.; Warwick, R.M. Change in Marine Communities: An Approach to Statistical Analysis and Interpretation; Primer-E Ltd.: Plymouth, UK, 2016. [Google Scholar]
- Cavanaugh, K.C.; Kellner, J.R.; Forde, A.J.; Gruner, D.S.; Parker, J.D.; Rodriguez, W.; Feller, I.C. Poleward expansion of mangroves is a threshold response to decreased frequency of extreme cold events. Proc. Natl. Acad. Sci. 2014, 111, 723–727. [Google Scholar] [CrossRef] [PubMed]
- Holle, B.V.; Wei, Y.; Nickerson, D. Climatic Variability Leads to Later Seasonal Flowering of Floridian Plants. PLOS ONE 2010, 5, e11500. [Google Scholar] [CrossRef]
- Roy, D.B.; Sparks, T.H. Phenology of British butterflies and climate change. Glob. Change Biol. 2000, 6, 407–416. [Google Scholar] [CrossRef]
- Stålhandske, S.; Gotthard, K.; Leimar, O. Winter chilling speeds spring development of temperate butterflies. J. Anim. Ecol. 2017, 86, 718–729. [Google Scholar] [CrossRef]
- Donnelly, A.; Caffarra, A.; O’Neill, B.F. A review of climate-driven mismatches between interdependent phenophases in terrestrial and aquatic ecosystems. Int. J. Biometeorol. 2011, 55, 805–817. [Google Scholar] [CrossRef] [PubMed]


| Model | K | AICc | ΔAICc | wi | cwi | Log L |
|---|---|---|---|---|---|---|
| doy + doy2 | 4 | −162.46 | 0 | 0.73 | 0.73 | 85.27 |
| doy + precipitation + doy2 | 5 | −160.43 | 2.03 | 0.27 | 1 | 85.28 |
| Precipitation × doy2 | 4 | −95.4 | 67.06 | 0 | 1 | 51.74 |
| Precipitation | 3 | −75.01 | 87.45 | 0 | 1 | 40.53 |
| doy | 4 | −73.88 | 88.58 | 0 | 1 | 40.98 |
| doy2 | 3 | −70.71 | 91.76 | 0 | 1 | 38.38 |
| precipitation + precipitation2 | 3 | −56.8 | 105.66 | 0 | 1 | 31.43 |
| Model | K | AICc | ΔAICc | wi | cwi | log L |
|---|---|---|---|---|---|---|
| route | 5 | −378.46 | 0 | 0.54 | 0.54 | 194.29 |
| effort + route | 6 | −376.42 | 2.04 | 0.19 | 0.74 | 194.3 |
| route + temperature | 6 | −376.41 | 2.05 | 0.19 | 0.93 | 194.29 |
| effort + route + temperature | 7 | −374.36 | 4.1 | 0.07 | 1 | 194.3 |
| effort | 5 | −148.75 | 229.71 | 0 | 1 | 79.44 |
| effort + temperature | 6 | −146.7 | 231.77 | 0 | 1 | 79.44 |
| temperature | 5 | −145.55 | 232.91 | 0 | 1 | 77.84 |
© 2018 by the authors. Licensee MDPI, Basel, Switzerland. This article is an open access article distributed under the terms and conditions of the Creative Commons Attribution (CC BY) license (http://creativecommons.org/licenses/by/4.0/).
Share and Cite
Gezon, Z.J.; Lindborg, R.J.; Savage, A.; Daniels, J.C. Drifting Phenologies Cause Reduced Seasonality of Butterflies in Response to Increasing Temperatures. Insects 2018, 9, 174. https://doi.org/10.3390/insects9040174
Gezon ZJ, Lindborg RJ, Savage A, Daniels JC. Drifting Phenologies Cause Reduced Seasonality of Butterflies in Response to Increasing Temperatures. Insects. 2018; 9(4):174. https://doi.org/10.3390/insects9040174
Chicago/Turabian StyleGezon, Zachariah J., Rebekah J. Lindborg, Anne Savage, and Jaret C. Daniels. 2018. "Drifting Phenologies Cause Reduced Seasonality of Butterflies in Response to Increasing Temperatures" Insects 9, no. 4: 174. https://doi.org/10.3390/insects9040174