Article

Spatial Distribution Pattern and Sampling Plans for Two Sympatric Tomicus Species Infesting Pinus yunnanensis during the Shoot-Feeding Phase

1
College of Forestry, Guizhou University, Guiyang 550025, China
2
Guizhou Provincial Key Laboratory for Agriculture, Pest Management of the Mountainous Region, Institute of Entomology, Scientific Observing and Experimental Station of Crop Pest in Guiyang, College of Agriculture, Guizhou University, Guiyang 550025, China
3
Key Laboratory of Forest Protection of National Forestry and Grassland Administration, Research Institute of Forest Ecology, Environment and Protection, Chinese Academy of Forestry, Beijing 100091, China
*
Authors to whom correspondence should be addressed.
Insects 2023, 14(1), 60; https://doi.org/10.3390/insects14010060
Submission received: 15 November 2022 / Revised: 3 January 2023 / Accepted: 5 January 2023 / Published: 9 January 2023
(This article belongs to the Section Insect Ecology, Diversity and Conservation)

Abstract

:

Simple Summary

Tomicus minor (Hartig) and Tomicus yunnanensis Kirkendall and Faccoli are two sympatric species that infest Pinus yunnanensis (Franchet) in southwest China. Sound knowledge of the two pine shoot beetles’ distribution within P. yunnanensis is needed to formulate accurate sampling methods. Three pine forests with different experimental sites in Yuxi, Yunnan province, China were investigated from 2016 to 2018. Field counts were modeled in various spatial models, and it was determined that two species adults showed aggregated spatial distributions. A fixed-precision sampling plan showed that, for a D of 0.25 and 0.10, sample sizes of 41 plants and 259 plants for T. minor and 33 plants and 208 plants for T. yunnanensis were adequate, respectively. This sampling program could be useful for the integrated pest management of two sympatric Tomicus species.

Abstract

Tomicus minor (Hartig) and Tomicus yunnanensis Kirkendall and Faccoli are two sympatric species that infest Pinus yunnanensis (Franchet) in southwest China, contributing to growth losses. Accurate sampling plans are needed to make informed control decisions for these species. We investigated three pine forests within experimental sites in Yuxi, Yunnan province, China from 2016 to 2018. The spatial distribution patterns of two pine shoot beetles during the shoot-feeding phase were determined using Taylor’s power law. The optimum sample sizes and stop lines for precision levels of 0.25 and 0.10 were calculated. The model was validated using an additional 15 and 17 independent field datasets ranging in density from 0.06 to 1.90 beetles per tree. T. minor and T. yunnanensis adults showed aggregated spatial distributions. For T. minor, sample sizes of 41 and 259 trees were adequate for a D of 0.25 and 0.10, respectively, while for T. yunnanensis, a mean density of one individual per tree required sample sizes of 33 plants (D = 0.25) and 208 plants (D = 0.10). The software simulations of this sampling plan showed precision levels close to the desired levels. At a fixed-precision level of 0.25, sampling is easily achievable. This sampling program is useful for the integrated pest management (IPM) of two sympatric Tomicus species.

1. Introduction

Eight pine shoot beetles of the genus Tomicus (Latreille) (Coleoptera: Curculionidae: Scolytinae) around the world [1,2] are destructive to conifer forests [3] and contribute to growth losses in the Palearctic [4,5,6,7,8]. Among them, Tomicus minor (Hartig) is widely distributed in Eurasia [9], while Tomicus yunnanensis Kirkendall and Faccoli has been re-identified as a new and highly aggressive species after molecular and morphological studies [1,10]. These two species have caused massive mortality to Pinus yunnanensis (Franchet) stands in southwestern China, where outbreaks are ongoing [11,12,13].
Adults of these two Tomicus species have the same maturation period [3]. Newly emerged adults fly to the crowns of nearby pine trees, usually in late spring, where they bore into shoots for the next seven to ten months, until they are sexually mature [14]. Although they only weakly attack the bole, these two pine shoot beetles aggregate densely during the shoot-feeding period in P. yunnanensis, subsequently reducing the resistance of the pine trees and facilitating the reproduction (mating and oviposition) of the beetles in the living trunks [14]. In recent studies, T. yunnanensis and T. minor were shown to often infest pine trees together [15,16], meanwhile, the attack pattern of the latter has evolved to be regulated by the former’s attack habits and time during the trunk-breeding phase [11]. Therefore, it is possible that interspecific competition affects the spatial distributions of sympatric Tomicus species. Interestingly, our previous study found that coexistence and homologous competition between T. yunnanensis and T. minor could be achieved through the allocation and compensation of spatial and temporal resources [17]. At the same time, the coexistence of groups of these two sympatric species with different population densities could have impacted prior semivariogram models and model parameters [18]. Interspecific competition between sympatric species may be an important factor regulating population distributions and dynamics [11,19]. After long-lasting and overlapping shoot-feeding periods, significant tree mortality occurs following bole attacks by T. minor and T. yunnanensis. The complexity of sympatric pests increases the difficulty of integrated pest management (IPM).
The development of IPM systems for insects requires an understanding of their spatial and temporal distributions for accurate population density estimation [20]; appropriate fixed-precision sampling plans are also basic components of a successful IPM program [21], as they improve the decision-making process by accurately estimating pest populations in the field [22]. Field sampling is often very time-consuming, and a 35–50% reduction in sampling effort can result from fixed-precision sequential sampling [23]. Determinations of the types and spatial distribution parameters are critical for the development of sequential sampling plans [24]. In the evaluations of the effectiveness of control measures, this method has been widely reported in the research on agricultural and forestry pests, such as Scirtothrips dorsalis Hood (Thysanoptera: Thripidae) in Florida blueberry [25], Citrus aphids (Hom., Aphididae) on two orange species [26], and Mesoplatys ochroptera Stål (Coleoptera: Chrysomelidae) on Sesbania [27]. However, there has been no effort to develop a fixed-precision sequential sampling plan for the sympatric Tomicus species infesting P. yunnanensis. The present study was designed to investigate the spatial distributions of T. minor and T. yunnanensis in P. yunnanensis forests and to develop sampling plans that will be useful for IPM.

2. Materials and Methods

2.1. Study Area

The study area was a nature reserve on Hongta mountain in Yuxi, Yunnan province, southwestern China, where two sympatric Tomicus species are perennially endangered in the same domain. The spatial distribution patterns were determined in October 2016, October 2017, and October 2018 in the reserve. The studies were conducted in three different artificial forest experimental sites of 20-year-old P. yunnanensis naturally infested by T. minor and T. yunnanensis. The experimental sites were as follows: EXP. A, Ketudi (24°18′34″ N, 102°34′33.34″ E), EXP. B, Guanyinshan (24°18′30″ N, 102°34′25″ E), and EXP. C, Tuoniaoyuan (24°18′27.89″ N, 102°34′27.75″ E). The average diameter of the survey shoots (diameter of the entrance hole) was 0.73 cm, and the average diameter at breast height of the Yunnan pine trees was 6.6 cm (range 2.1–10.1 cm) with an average tree height of 4.3 m (range 1.9–7 m). No pesticides were applied during the study period.

2.2. Field Sampling

The fields were sampled in October late in the shoot-feeding phase of the beetles, when the damage produced by the Tomicus species is obvious and easy to investigate. Three experimental sites were traced out, and counts were performed each year. Each experimental site was 10 rows in width (50 m) and 10 columns (50 m) in length, having an area of 2500 m2. The distance between the trees was approximately 5 m, of which GPS coordinates were recorded; in all, 100 trees in each sample plot were selected and inspected for beetles based on naturally yellow shoots, which were cut approximately 10 cm from the top of the tips with high-branch scissors because our investigation found that the entrance hole of Tomicus was approximately 4 cm to 7 cm away from the top of the tips. When the infection is not serious, there is only one beetle in a shoot. A sampling unit of one tree was collected. All possible damaged shoots from each sampled tree were cut, and the pine needles were removed; all shoots with beetles from each tree were placed in labeled 50-mL centrifuge tubes. Finally, all samples were brought back to the laboratory. The beetles were dissected from the shoots and identified based on their external morphological characteristics as described by Kirkendall et al. [1] and Li et al. [2] using a dissection microscope (Olympus SZX7, Olympus, Tokyo, Japan).

2.3. Statistical Analysis

Data were analyzed using SPSS 19.0 software (IBM Corp., Armonk, NY, USA). Each tree was considered a single replication for analysis. Taylor’s power law was used to evaluate the spatial distributions of the pine shoot beetle adults according to the following equation [28,29]:
lg ( S 2 ) = lg ( a ) + b × lg ( m )
where S2 is the Tomicus population variance, m is the Tomicus population mean, coefficient a is the Y-intercept, and coefficient b is the slope of the regression line; lg(a) is the intercept, and b is the slope or the aggregation parameter. The distributions were considered aggregated (b > 1), random (b = 1), or uniform (b < 1). The general linear model regression procedure (GLM; SPSS) was used to compute the regression of the means and variances. Also, the regression coefficient (R2) was calculated to obtain goodness-of-fit to Taylor’s power law. The different linear regressions were tested for the equality of slopes by performing an analysis of covariance on the data obtained from different times of the season and during different years.

2.4. Fixed-Precision Sequential Sampling Plan

The optimum sample size (n) for estimating the T. minor and T. yunnanensis densities was calculated at two levels of fixed precision, 0.1 and 0.25, using the following equation [30]:
n = a m ( b 2 ) D 2
where n is the number of samples needed, a and b are the coefficients obtained from the regression of Taylor’s power law, m is the Tomicus population mean, and D is a fixed-precision level (0.10 or 0.25, which are acceptable for sampling for IPM purposes) [31].
Green’s formula [32] was used to establish the stop lines for the fixed-precision levels for sequential sampling of the Tomicus species,
ln ( T n ) = ln ( D 2 / a ) b 2 + b 1 b 2 ln ( n )
where n is the number of counted trees, Tn is the number of insects observed in n samples, b is the coefficient of Taylor’s power law, and D is the precision level (0.10 or 0.25).

2.5. Model Validation

To assess the reliability of Green’s sequential sampling plan, 15 and 17 additional independent datasets for T. minor and T. yunnanensis populations were collected in 2018 from 15 forests in Yuxi City. The beetles were sampled as described previously, but from 300–400 trees per plot. The validation was performed following the resampling approach, using the Resampling Validation of Sample Plans (RVSP) software developed by Naranjo and Hutchison [33] based on a resampling simulation technique. The simulations were conducted using 500 sampling bouts without replacement with a minimum sample size of 10 for a fixed-precision level of D = 0.25. At D = 0.10, resampling without replacement failed, and we tested this level of precision using resampling with replacement [33].

3. Results

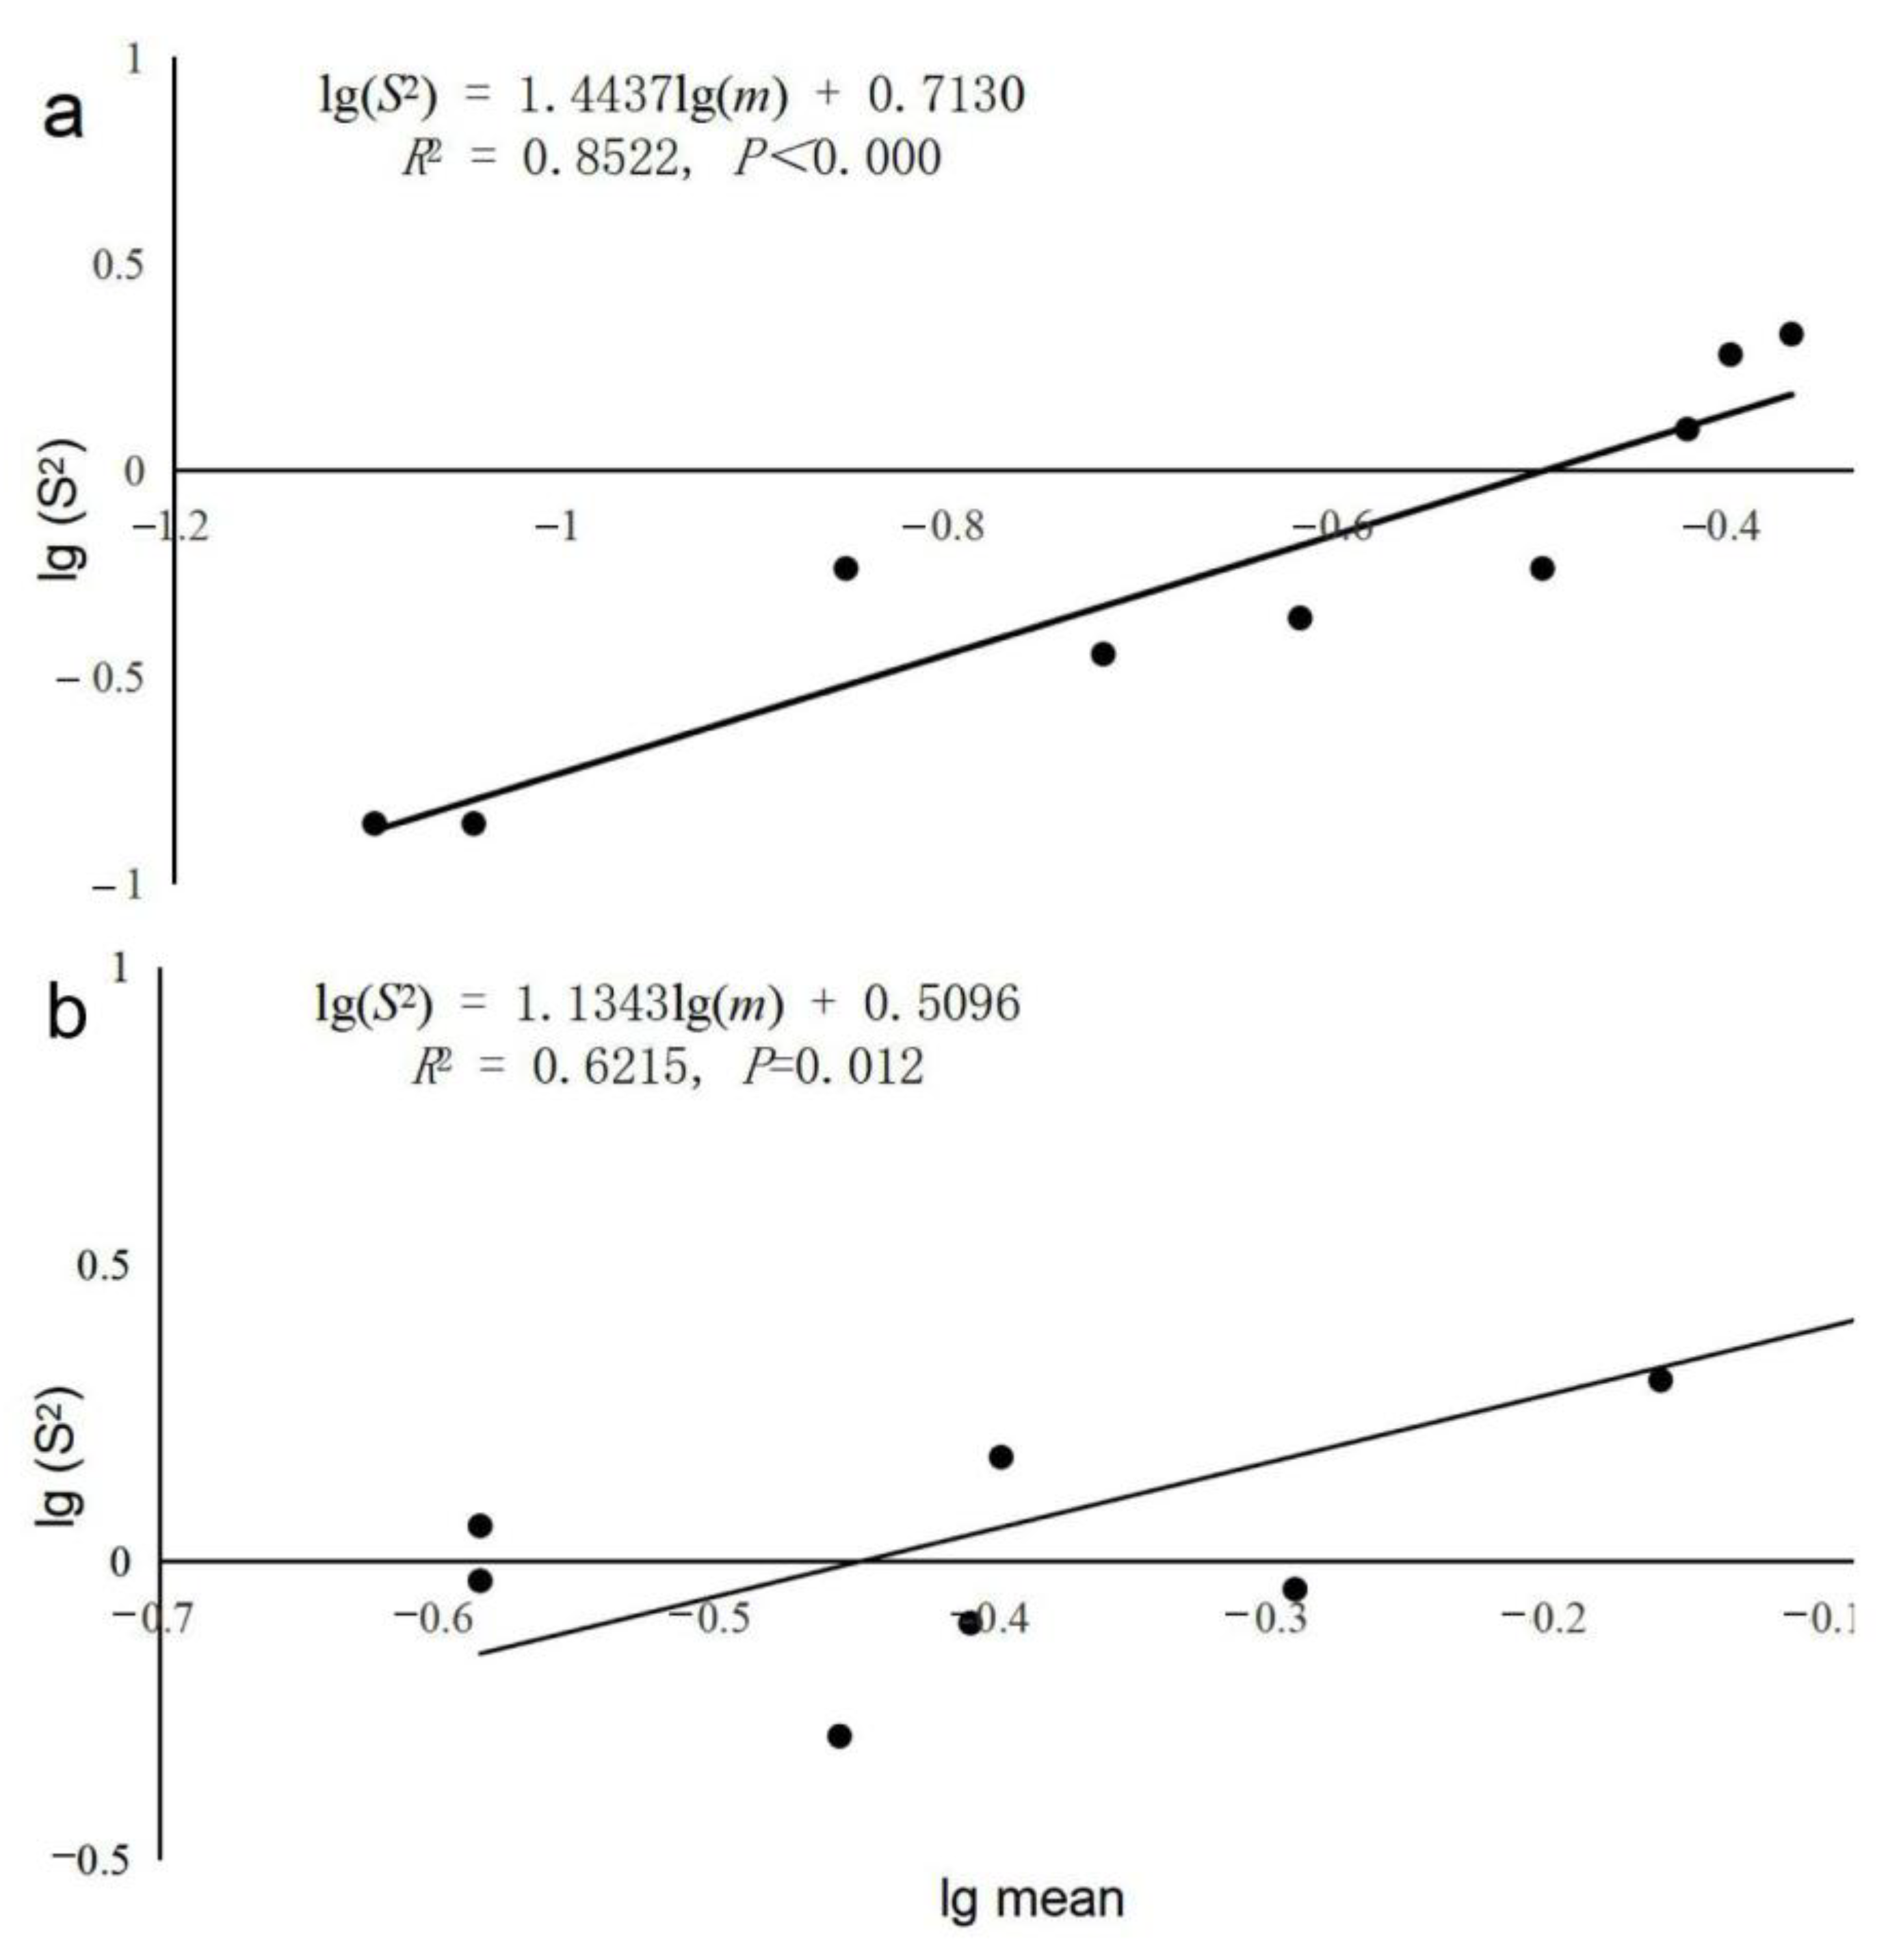
3.1. Spatial Distribution of Two Sympatric Tomicus spp.

The mean number of T. minor individuals per plant was 0.08–0.43 (Table 1), while that of T. yunnanensis was 0.26–0.86. There were no significant differences between the slopes for the different years or for different species (different years: df = 8, F = 0.034, p = 0.859; different species: df = 8, F = 0.106, p = 0.754). Therefore, common regression was used to predict the lg(S2) versus lg(m) relationship. The slopes for T. minor and T. yunnanensis were significantly greater than 1.0 (T. minor: b = 1.444, R2 = 0.852, t = 6.352, df = 1, 7, p < 0.001; T. yunnanensis: b = 1.134, R2 = 0.621, t = 3.390, df = 1, 7, p = 0.012), The variances and means were significantly related as shown with Taylor’s power law, indicating an aggregated distribution of the two species in P. yunnanensis forests (Figure 1).

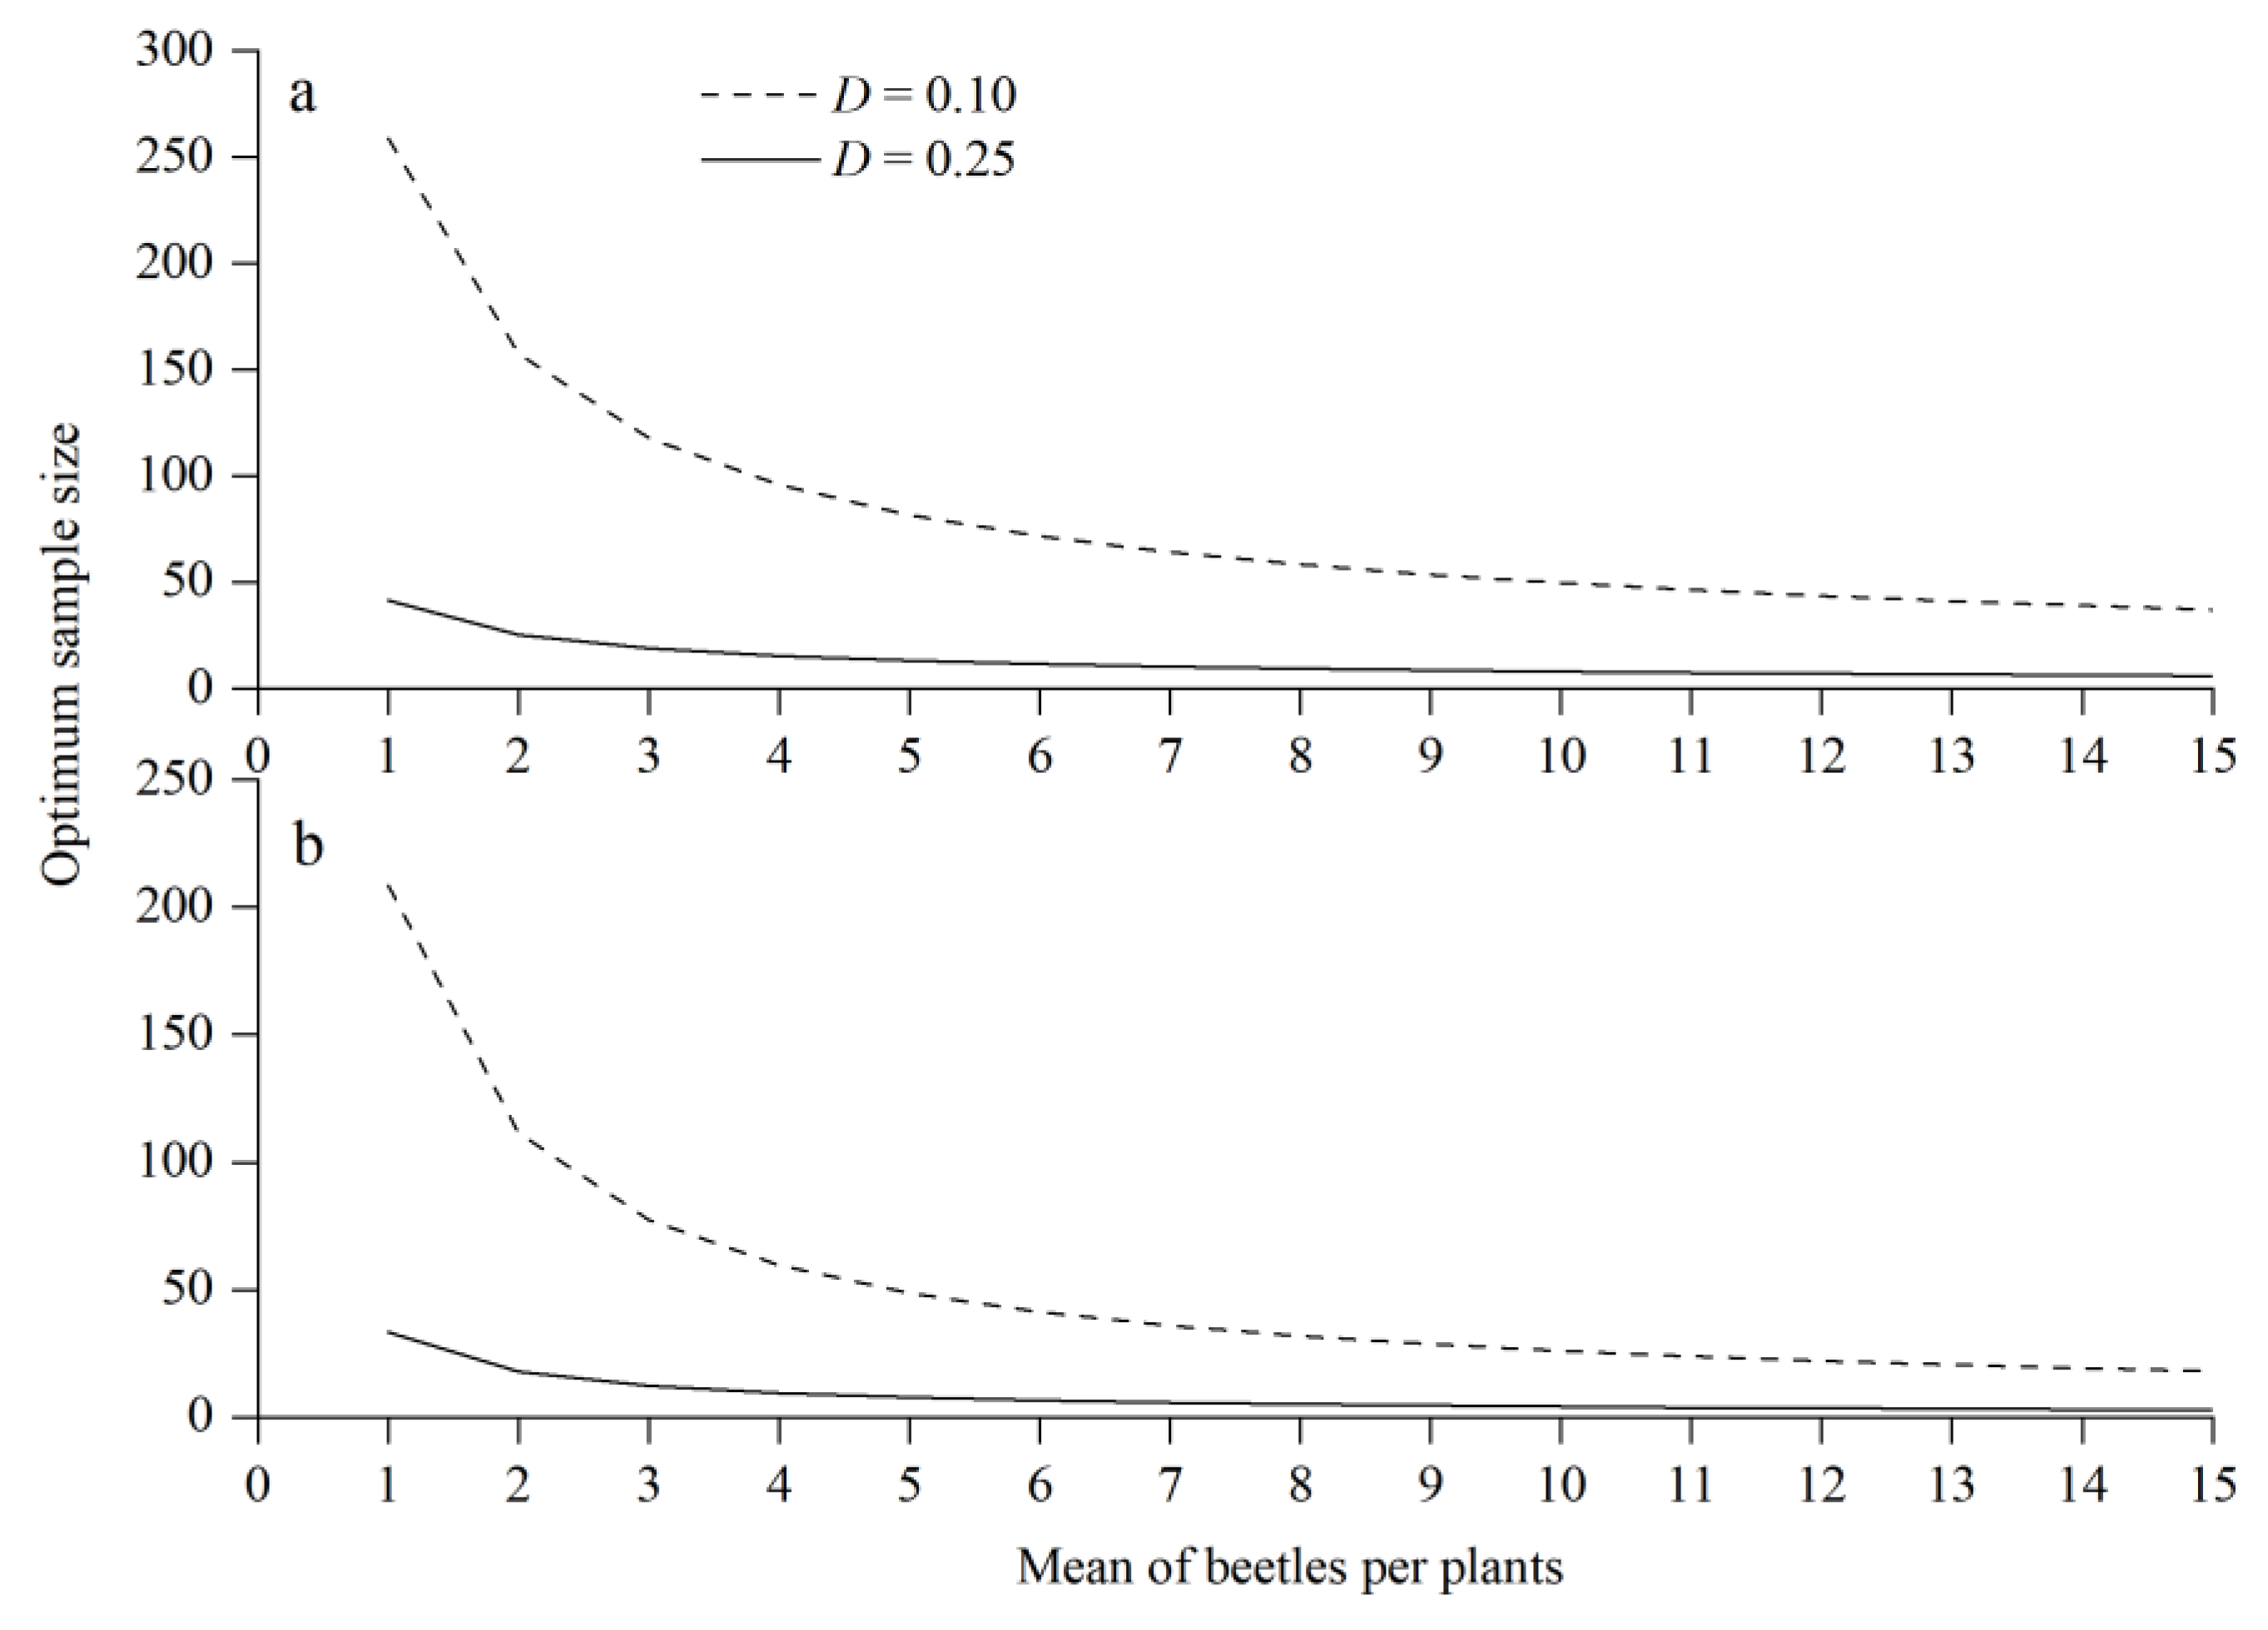
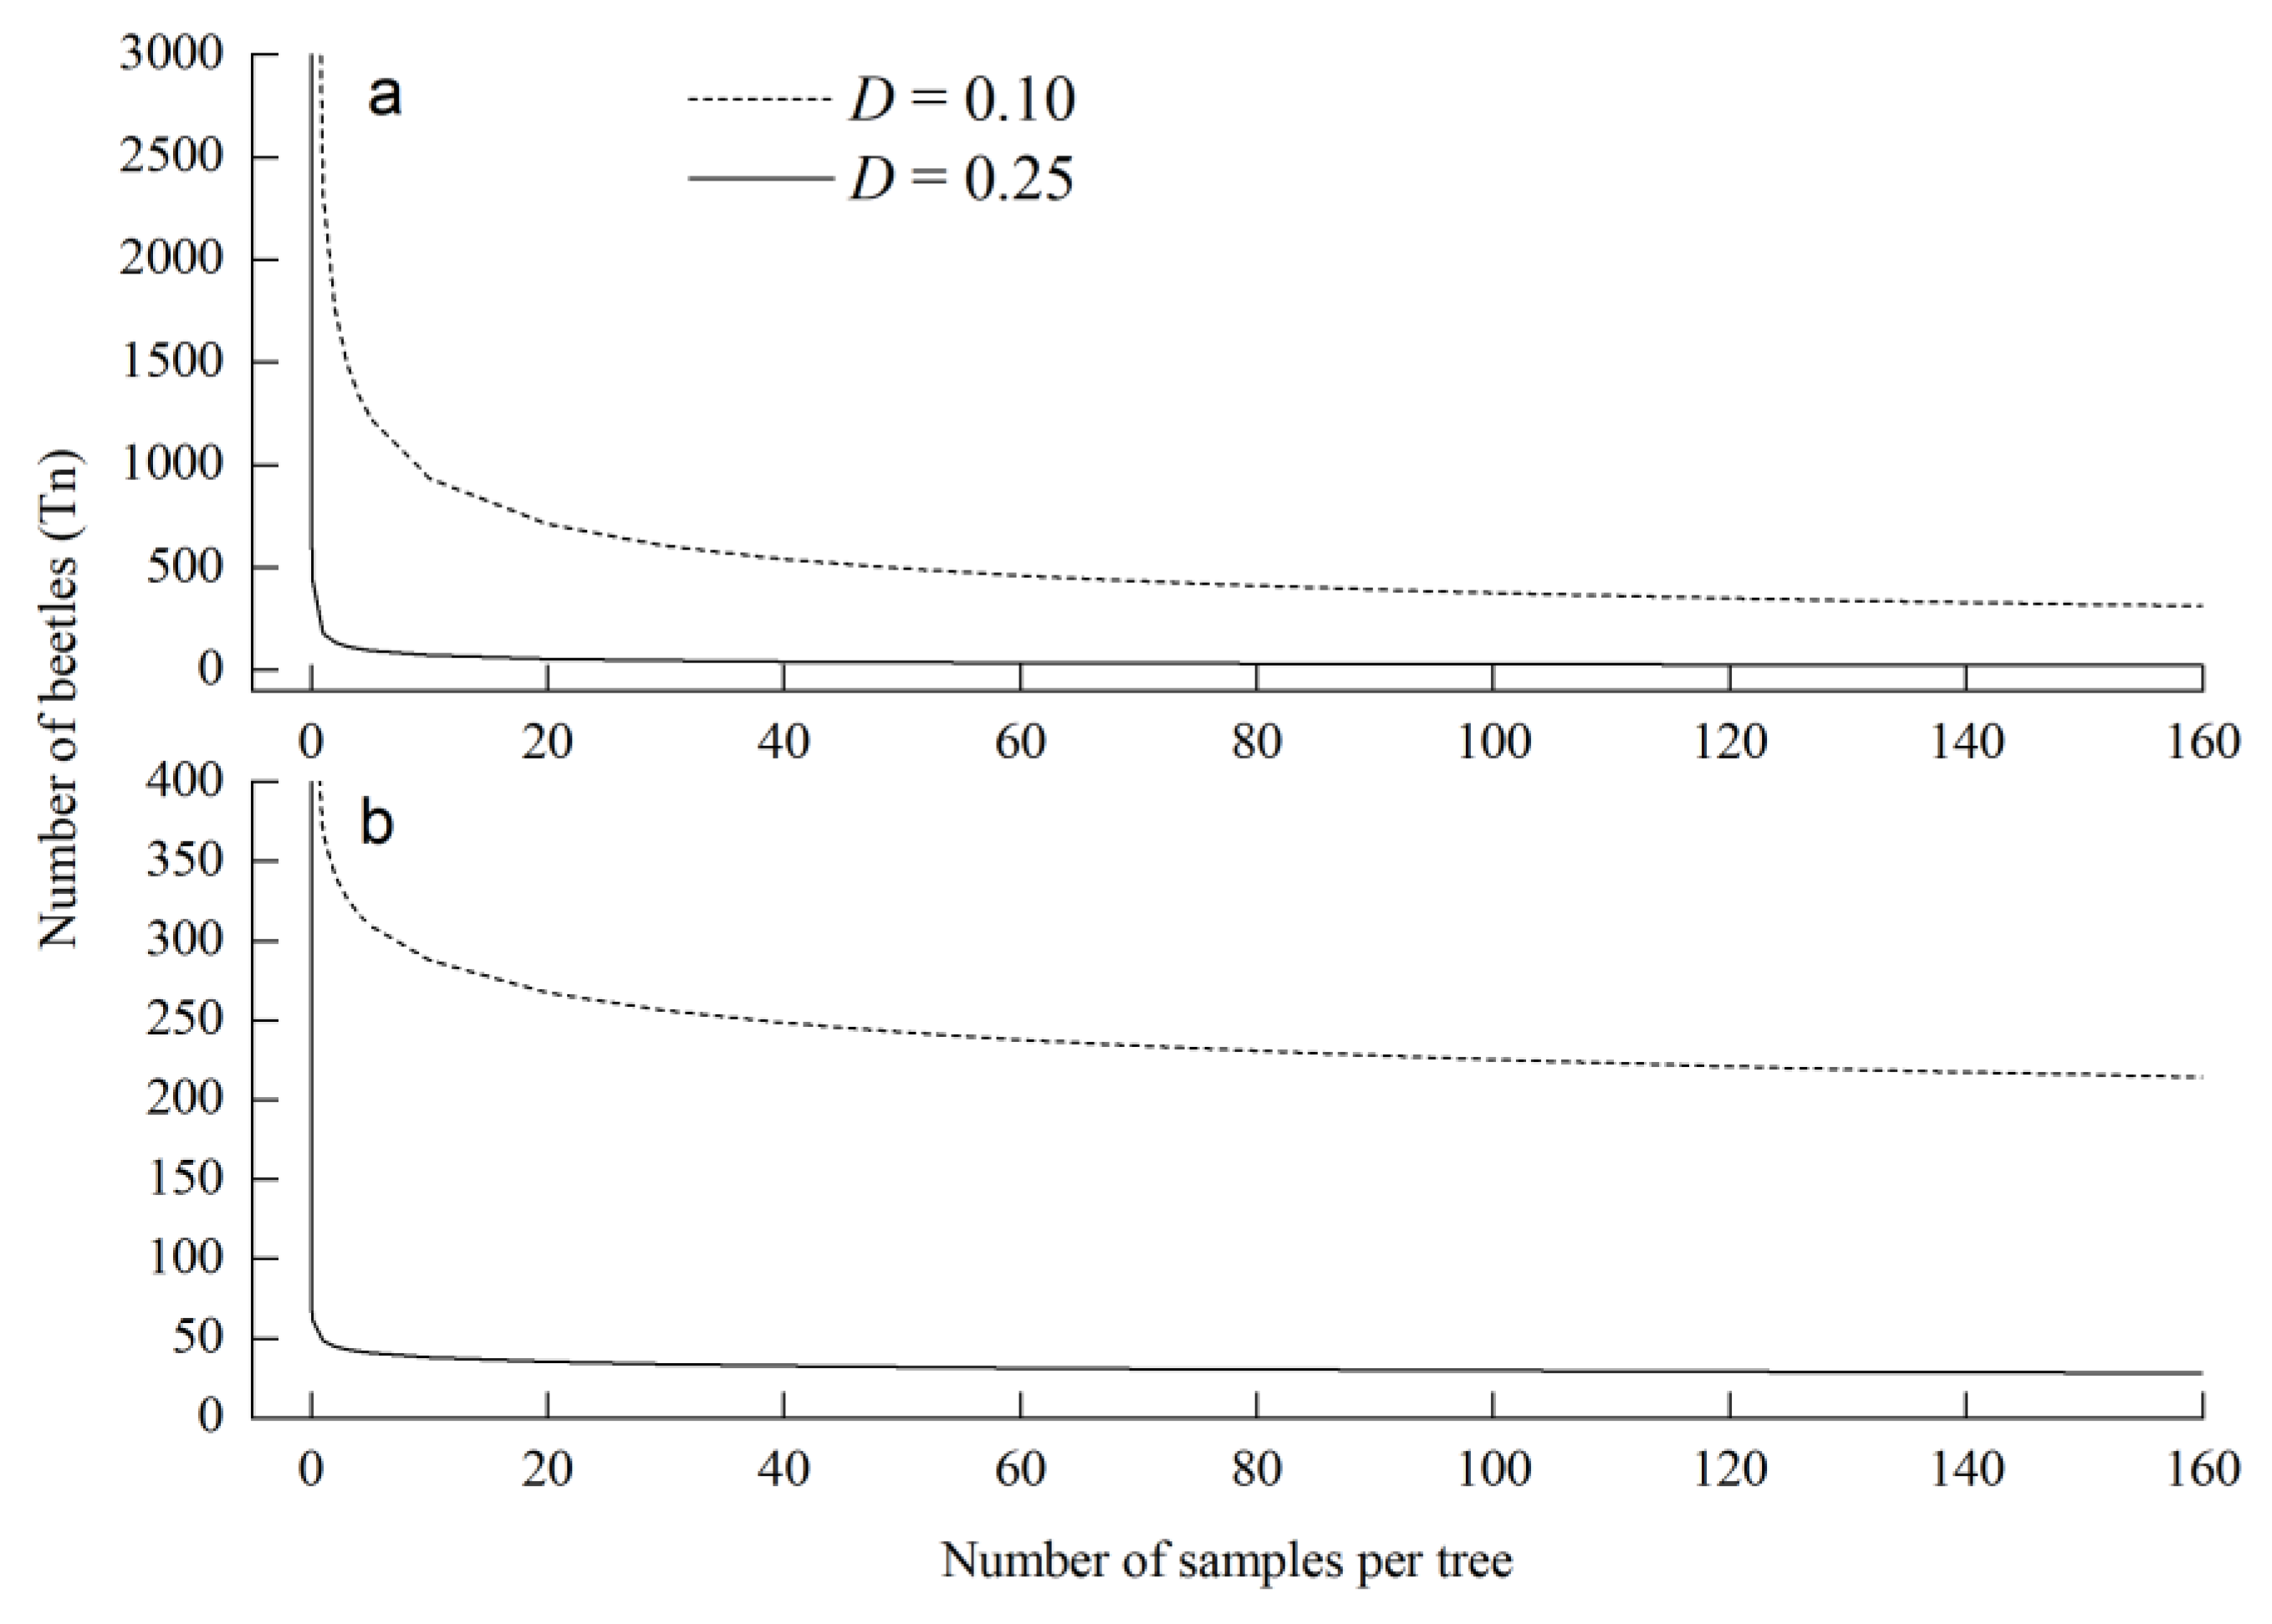
3.2. Fixed-Precision Sequential Sampling

The optimum sample sizes of T. minor and T. yunnanensis at the fixed-precision levels of 0.25 and 0.1 are presented in Figure 2. With increasing beetle density, the optimum sample size decreased rapidly. However, there was less variability among sampling bouts for any one field data set, particularly at mean densities greater than 2 insects per sample unit. Moreover, the optimum size at a fixed-precision level of 0.1 was always higher than that at a fixed-precision level of 0.25.
Numerical sample size curves were obtained from Taylor’s power law coefficients. A mean density of one T. minor individual per plant required a sample size of 41 plants for D = 0.25 and of 259 plants for D = 0.10. A mean density of one T. yunnanensis individual per plant required a sample size of 33 plants for D = 0.25 and 208 plants for D = 0.10 (Figure 2).
The calculated stop lines using Taylor’s model at two given precision levels are shown in Figure 3. The numbers of required shoot samples to cross the stop lines were significantly changed. The results indicated that the sampling of T. minor and T. yunnanensis must continue until the cumulative number of Tomicus spp. reached 24 and 28 beetles per tree at precision levels of 0.25 or 313 and 214 beetles per tree at precision levels of 0.10, respectively (Figure 3).

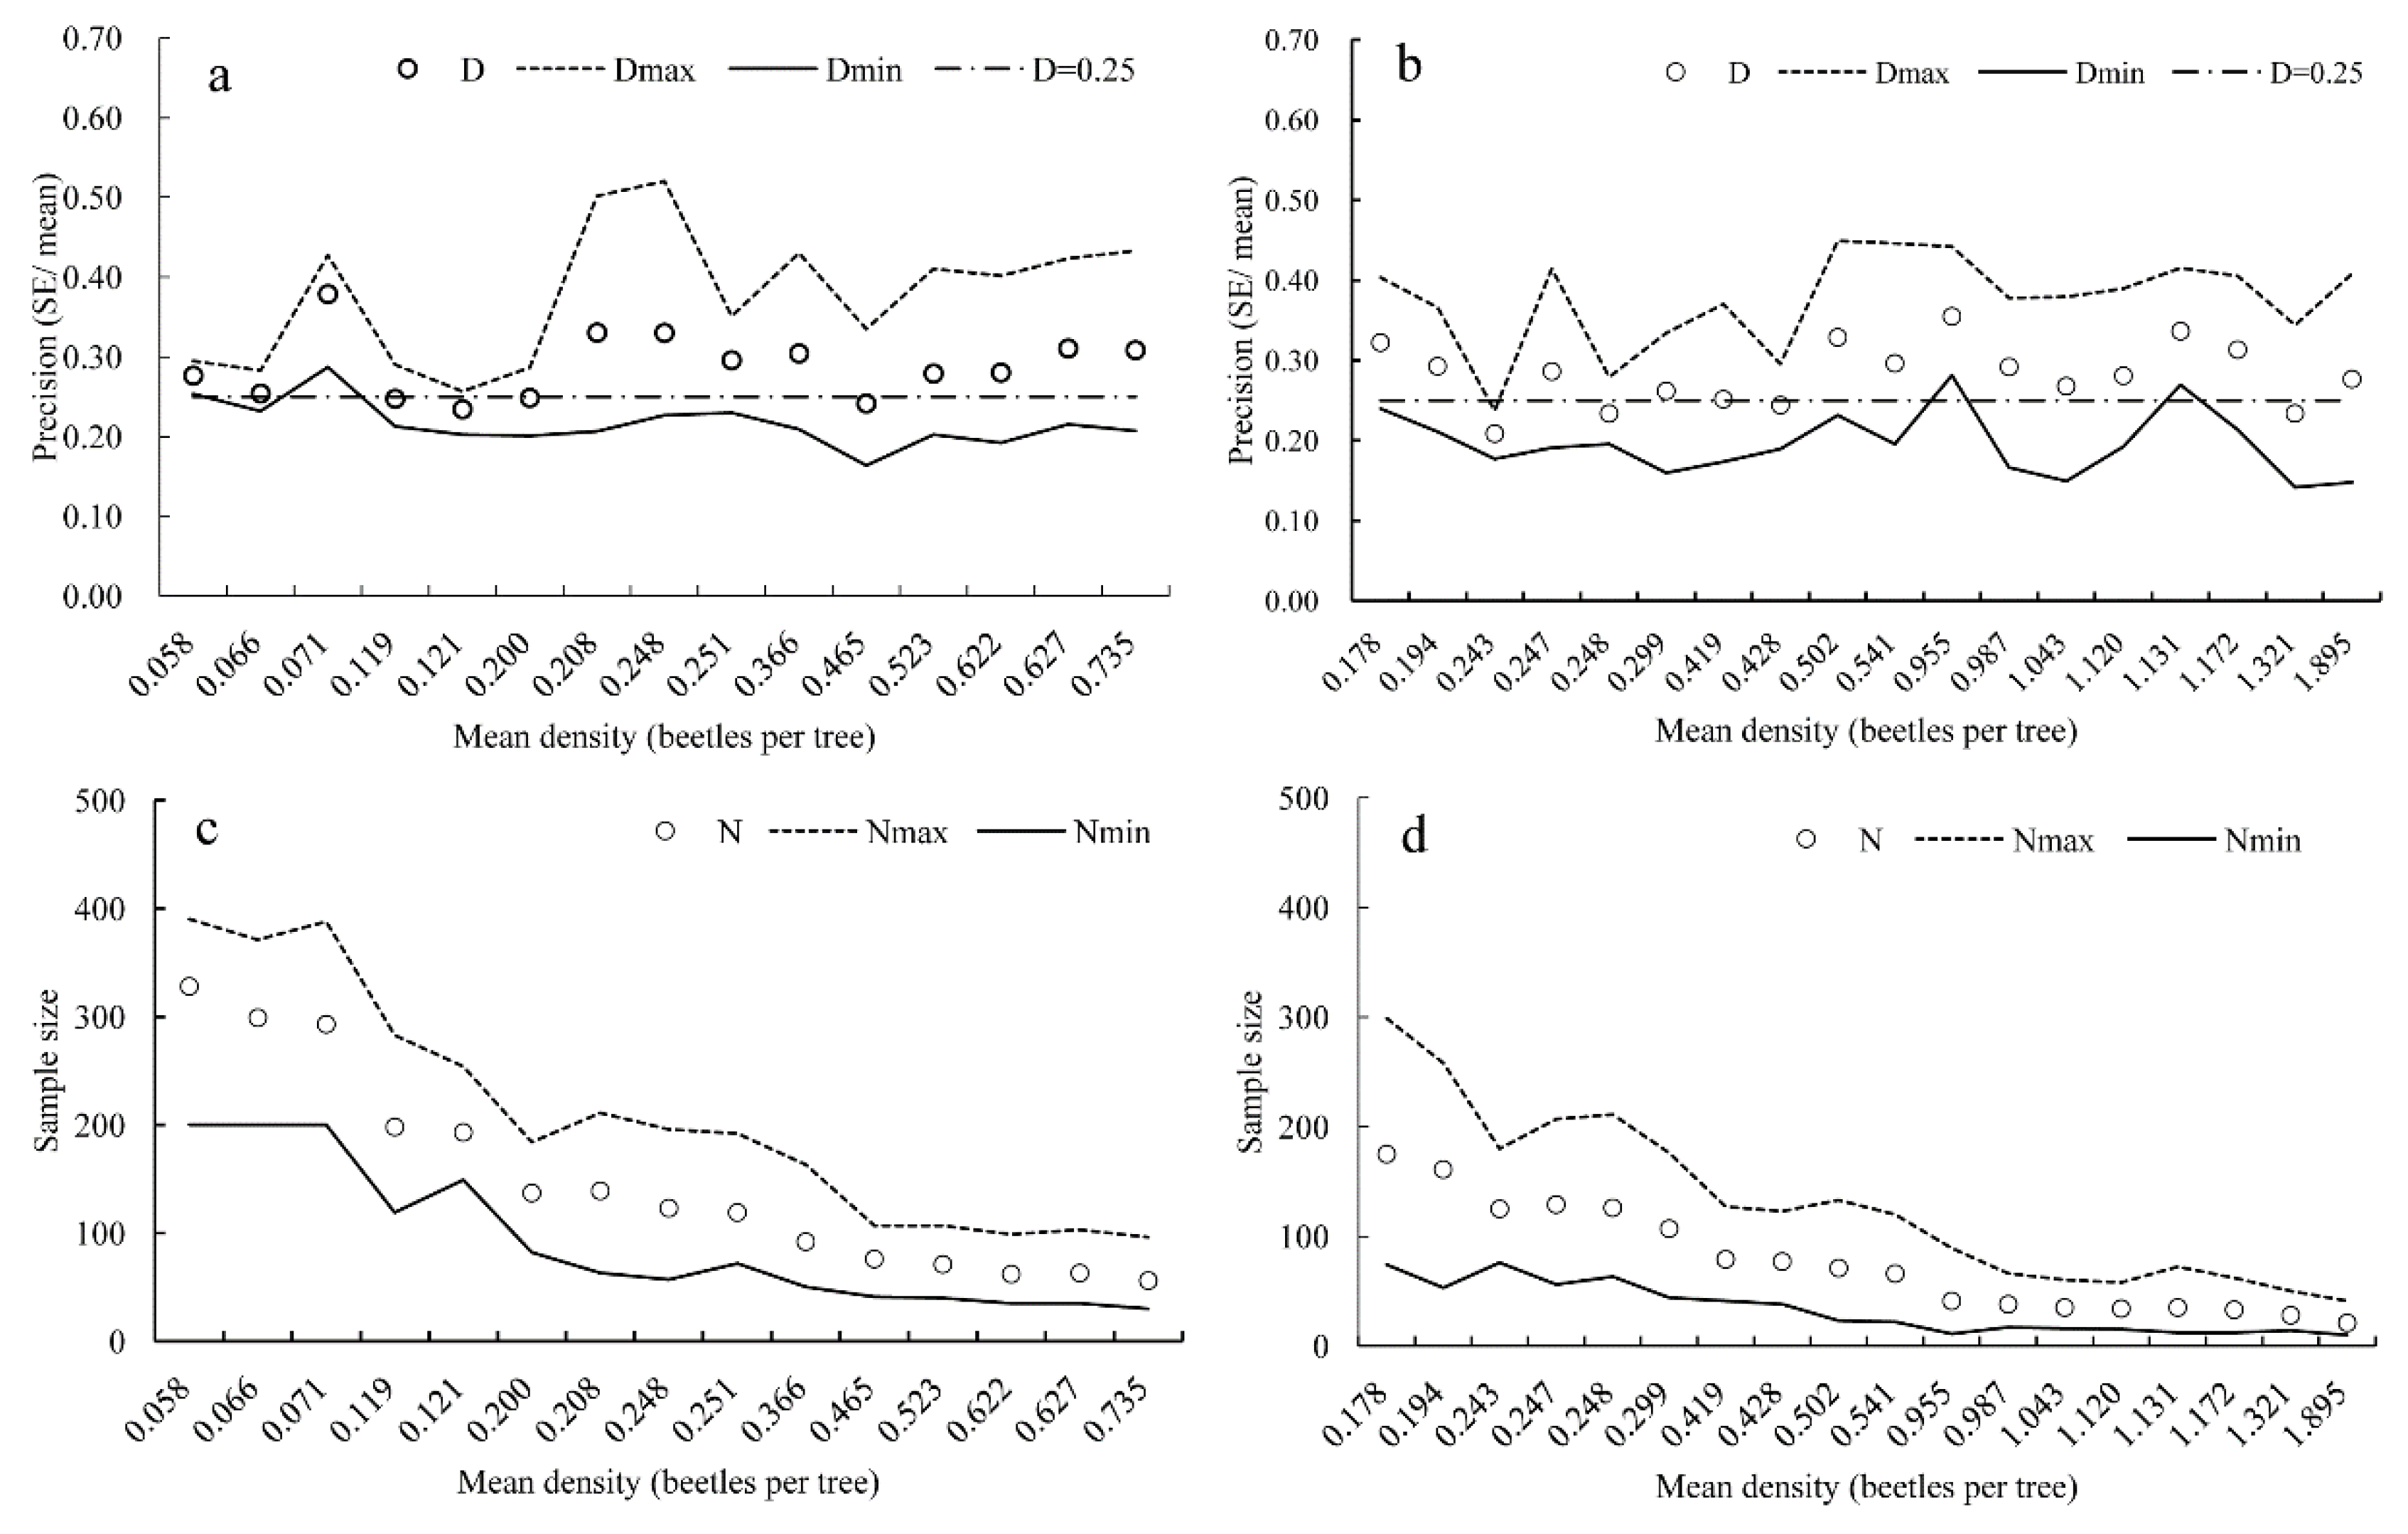
3.3. Validation of Developed Sampling Plan

The simulations performed with RVSP software for T. minor and T. yunnanensis populations produced average precisions (D) of 0.29 and 0.28, respectively; these were close to the desired precision of 0.25. On average, the sequential sampling model performed better than expected, and the precision was better than the pre-set value in only a few cases (Figure 4a,b). The mean optimum sample sizes for T. minor and T. yunnanensis were 150 and 77 trees at a precision level of 0.25 (Figure 4c,d), respectively.

4. Discussion

The spatial distribution models fit to the data showed a consistent aggregated distribution of the two Tomicus species in P. yunnanensis forests in Yuxi, Yunnan Province. A similar distribution pattern has been also observed for T. piniperda (L.) (Curculionidae, Scolytidae) [11,34] and T. brevipilosus (Eggers) (Curculionidae, Scolytidae) [35], which are closely related species to those in the present study [1]. This supported our previous research [17,18,36] in Pu’er city, where three Tomicus species compete and coexist. The distribution of the two species in the particular fields was stable between seasons, allowing the sampling plans to be used throughout the season in the P. yunnanensis plantations. The mean optimum sample sizes for T. minor and T. yunnanensis were 150 and 77 trees, respectively, at a precision level of 0.25.
Taylor et al. [37] indicated that the spatial distribution of a species is completely density dependent with a positive correlation between population aggregation intensity and population density. Although the densities of the two Tomicus species here were low, an aggregated spatial distribution of T. minor and T. yunnanensis was documented. The aggregated distributions of these two species in P. yunnanensis forests are likely due to their own aggregated behavior based on semiochemicals, which was confirmed in our previous studies [37]. Beetle concentrations in the shoots and subsequent feeding both considerably weaken the tree, decreasing its resistance to bole attacks and requiring a high number of stem attacks for the insects to overcome this resistance [38,39]. Other pine shoot beetles showed similar behaviors in pine plants, where adults moved slowly between plants and were aggregated in the trunks of certain pine trees [38]. Similar results were obtained for some Tomicus species, such as T. piniperda (L.) (Curculionidae, Scolytidae) [39,40,41], T. brevipilosus (Eggers) (Curculionidae, Scolytidae) [42], and T. destruens Woll. (Curculionidae, Scolytidae) [43]. Therefore, there is an opportunity to test field experiments using the push–pull strategy based on aggregation and anti-aggregation pheromones of Tomicus to develop potential IPM techniques. The present results were not consistent with those from other insects; for example, Shahbi and Rajabpour [44] showed that the spatial distribution of Phthorimea operculella Zeller (Lepidoptera: Gelechidae) tended toward randomness with low egg and larval densities.
The key limitation in this study was determining the effects of interspecific competition on the spatial distribution patterns. The results were consistent with a single population without interspecific competition [34], indicating that interspecific competition did not affect the spatial distribution patterns of these sympatric species. This could be the consequence of aggregation pheromones produced by Tomicus [45,46]; moreover, the Tomicus spp. were more strongly attracted to damaged shoots than to undamaged shoots, and they showed an attraction to shoots damaged by their own species [47]. The benefits of aggregation have been well established for ‘aggressive’ bark beetle species that primarily attack living trees. When adults can aggregate in pine trees, it subsequently reduces the resistance of the pine trees and facilitates the reproduction of the beetles in the living trunks [14,48].
The Tomicus densities and given precision levels are two key factors that determined the optimum sample sizes for the measurements of their populations. As a consequence of their aggregated distribution patterns, the numerical sample size for correct estimates of the Tomicus density can be very high at low population levels. Therefore, Green’s stop lines could be a suitable method for estimating the population density of these two sympatric Tomicus species. Meanwhile, the number of samples required to attain a certain precision seems to be a function of density; fewer samples are required at higher densities. This is the result of the relationship between the mean and the variance of the population density [49]. The average sample number in this case was 150 and 77 plants for T. minor and T. yunnanensis, respectively, which can be easily covered in 30 min by a single data collector (personal observation). For IPM purposes, this level of precision is acceptable [20].
When Tomicus individuals at high population levels attack the shoots, one shoot might be infected by multiple individuals, meanwhile [15], this will also affect our simulated result. However, the methods of spatial distribution according to the quantity of fallen shoots pruned by the pine shoot beetles and mass felling of the sample pine were difficult to carry out [50]. We then focused on the sequential sampling of hazards at different population densities. No previous studies have been performed to develop fixed-precision sequential sampling of the Tomicus species on Yunnan pine trees. Therefore, we cannot compare the present results with other studies. However, Naranjo and Hutchison [33] put forward that all fixed-precision sample plans normally perform poorly at low population densities (<0.2 insects per sample unit), which is similar to the density of T. minor. However, it is not clear for T. yunnanensis why the fixed-precision sample plans performed poorly at mean densities of 0.955–1.131. We recommend the use of Green’s model with a D of 0.25 for sampling of the Tomicus spp. However, achieving a precision level of 0.10 would require an average sample number of 313 and 214 trees for T. minor and T. yunnanensis, respectively, which is very time-consuming and not feasible for most IPM specialists.

5. Conclusions

No effects of interspecific competition on the populations’ spatial distribution patterns were found. The spatial distribution parameters of the two sympatric Tomicus species slightly differed with no significance. Further, the optimum sample sizes and fixed-precision sequential sampling stop lines were different for the two Tomicus species and desired precision levels. The sampling program developed here could be useful for IPM programs for these two sympatric Tomicus species.

Author Contributions

Conceptualization, C.W. and Z.Z.; methodology, Z.Z.; software, C.W. and S.C.; validation, M.Y. and Z.Z.; formal analysis, C.W.; investigation, C.W.; resources, M.Y. and Z.Z.; data curation, Z.Z.; writing—original draft preparation, C.W.; writing—review and editing, C.W., S.C., M.Y. and Z.Z.; visualization, C.W.; supervision, Z.Z.; project administration, Z.Z.; funding acquisition, Z.Z. All authors have read and agreed to the published version of the manuscript.

Funding

This research was funded by the National Natural Science Foundation of China (32260396), the Cultivation Project of Guizhou University (Cultivation of Guizhou University [2020] 63), Guizhou Province Important Crop Pests Natural Enemy Expansion and Application of Science and Technology Innovation Personnel Team Building, Project Number: Guizhou Kong Science and Technology Cooperation Platform TALENT-CXTD [2021] 004, Construction Project of Natural Enemy Expansion Breeding Room in Guizhou Province, Guizhou Development and Reform Investment [2021] 318.

Data Availability Statement

The data presented in this study are available in this manuscript.

Acknowledgments

We would like to thank Naranjo for providing RVSP software.

Conflicts of Interest

The authors declare that they have no known competing financial interests or personal relationships that could have appeared to influence the work reported in this paper.

References

  1. Kirkendall, L.R.; Faccoli, M.; Ye, H. Description of the Yunnan shoot borer, Tomicus yunnanensis Kirkendall & Faccoli sp. n. (Curculionidae, Scolytinae), an unusually aggressive pine shoot beetle from southern China, with a key to the species of Tomicus. Zootaxa 2008, 1819, 25–39. [Google Scholar]
  2. Li, X.; Zhang, Z.; Wang, H.; Wu, W.; Cao, P.; Zhang, P. Tomicus armandii Li & Zhang (Curculionidae, Scolytinae), a new pine shoot borer from China. Zootaxa 2010, 2572, 57–64. [Google Scholar]
  3. Lieutier, F.; Långström, B.; Faccoli, M. The Genus Tomicus. In Bark Beetles: Biology and Ecology of Native and Invasive Species; Vega, F.E., Hofstetter, R.W., Eds.; Elsevier Academic Press: Amsterdam, The Netherlands, 2015; pp. 371–426. [Google Scholar]
  4. Långström, B.; Hellqvist, C. Spatial distribution of crown damage and growth losses caused by recurrent attacks of pine shoot beetles in pine stands surrounding a pulpmill in southern Sweden. J. Appl. Entomol. 1990, 110, 261–269. [Google Scholar] [CrossRef]
  5. Långström, B.; Hellqvist, C. Shoot damage and growth losses following three years of Tomicus attack in Scots pine stand close to a timber storage site. Silva Fenn. 1991, 25, 133–145. [Google Scholar] [CrossRef]
  6. Czokajlo, D.; Wink, R.A.; Warren, J.C.; Teale, S.A. Growth reduction of Scots pine, Pinus sylvestris, caused by the larger pine shoot beetle, Tomicus piniperda (Coleoptera, Scolytidae), in New York state. Can. J. For. Res. 1997, 27, 1394–1397. [Google Scholar] [CrossRef]
  7. Borkowski, A. Threats to pine stands by the pine shoot beetles Tomicus piniperda (L.) and T. minor (Hart.) around a sawmill in southern Poland. J. Appl. Entomol. 2001, 125, 489–492. [Google Scholar] [CrossRef]
  8. Borkowski, A. A spatial distribution of losses in growth of trees caused by feeding of pine shoot beetles Tomicus piniperda and T. minor (Col., Scolytidae) in Scots pine stands growing within the range of influence of a timber yard in southern Poland. J. For. Sci. 2006, 52, 130–135. [Google Scholar] [CrossRef] [Green Version]
  9. Wood, S.L.; Bright, D.E. A catalogue of Scolytidae and Platypodidae (Coleoptera), part 2: Taxonomic index. Great Basin Nat. Mem. 1992, 13, 1–1553. [Google Scholar]
  10. Duan, Y.; Kerdelhué, C.; Ye, H.; Lieutier, F. Genetic study of the forest pest Tomicus piniperda (Col., Scolytinae) in Yunnan province (China) compared to Europe: New insights for the systematics and evolution of the genus Tomicus. Heredity 2004, 93, 416. [Google Scholar] [CrossRef] [Green Version]
  11. Ye, H.; Ding, X.S. Impacts of Tomicus minor on distribution and reproduction of Tomicus piniperda (Col., Scolytidae) on the trunk of the living Pinus yunnanensis trees. J. Appl. Entomol. 1999, 123, 329–333. [Google Scholar]
  12. Långström, B.; Lisha, L.; Hongpin, L.; Peng, C.; Haoran, L.; Hellqvist, C.; Lieutier, F. Shoot feeding ecology of Tomicus piniperda and T. minor (Col., Scolytidae) in southern China. J. Appl. Entomol. 2002, 126, 333–342. [Google Scholar] [CrossRef]
  13. Liu, H.; Zhang, Z.; Ye, H.; Wang, H.B.; Clarke, S.R.; Jun, L. Response of Tomicus yunnanensis (Coleoptera: Scolytinae) to infested and uninfested Pinus yunnanensis bolts. J. Econ. Èntomol. 2010, 103, 95–100. [Google Scholar] [CrossRef] [PubMed]
  14. Lu, J.; Zhao, T.; Ye, H. The shoot-feeding ecology of three Tomicus species in Yunnan Province, southwestern China. J. Insect Sci. 2014, 14, 37. [Google Scholar] [CrossRef] [Green Version]
  15. Ye, H. Studies on the biology of Tomicus piniperda (L.) (Co., Scolytidae) in the shoot-feeding period (in Chinese). Acta Entomol. Sin. 1996, 39, 58–62. [Google Scholar]
  16. Ye, H. Mass attack by Tomicus piniperda L. (Col., Scolytidae) on Pinus yunnanensis tree in the Kunming region, southwestern China. In Proceedings: Integrating Cultural Tactics into the Management of Bark Beetle and Reforestation Pests; Gregoire, J.C., Liebhold, A.M., Day, K.R., Salom, S.M., Eds.; Forest Service General Technical Report, Vallombrosa, Italy, NE-236; U.S. Department of Agriculture: Washington, DC, USA, 1997; pp. 225–227. [Google Scholar]
  17. Wu, C.X.; Zang, L.P.; Zhang, S.F.; Kong, X.B.; Liu, F.; Zhang, Z.; Li, Y.; Xu, F.L.; Huang, G.Y. Spatial distribution patterns of three sympatric Tomicus species initially infecting Pinus yunnanensis trunks. Acta Ecol. Sin. 2020, 40, 3646–3655. [Google Scholar]
  18. Wu, C.X.; Liu, F.; Kong, X.B.; Zhang, S.F.; Zhang, Z. Spatiotemporal niche of competition and coexistence of three Tomicus spp. Infesting Pinus yunnanensis during the transferring stage from shoots to trunk. Sci. Silvae Sin. 2020, 56, 90–99. [Google Scholar]
  19. Milinski, M.; Parker, G.A. Competition for Resources. Behavioural Ecology, Evolutionary Approach, 3rd ed.; Krebs, J.R., Davies, N.B., Eds.; Blackwell Scientific Publications: London, UK, 1991; pp. 137–168. [Google Scholar]
  20. Southwood, T.R.E. Ecological methods with particular reference to the study of insect populations. Ecology 1979, 60, 1290–1291. [Google Scholar]
  21. Namvar, P.; Safaralizadeh, M.H.; Baniameri, V.; Pourmiza, A.A.; Karimzadeh Isfahani, J. Spatial distribution and fixed-precision sequential sampling of Liriomyza sativae Blanchard (Diptera: Agromyzidae) on cucumber greenhouse. Mid. East J Sci. Res. 2011, 10, 157–163. [Google Scholar]
  22. Southwood, T.R.E.; Henderson, P.A. Ecological Methods, 4th ed.; John Wiley & Sons: Hoboken, NJ, USA, 2016; ISBN 9781118895252. [Google Scholar]
  23. Binns, M.R. Sequential sampling for classifying pest status. In Handbook of Sampling Methods for Arthropods in Agriculture; Pedigo, L.P., Buntin, G.D., Eds.; CRC Press: Boca Raton, FL, USA, 1994; pp. 137–174. [Google Scholar]
  24. Kogan, M.; Herzog, D.C. Sampling Methods in Soybean Entomology; Springer: New York, NY, USA, 1980; pp. 30–60. [Google Scholar]
  25. Panthi, B.R.; Renkema, J.M.; Lahiri, S.; Liburd, O.E. Spatio-temporal distribution and fixed-precision sampling plan of Scirtothrips dorsalis (Thysanoptera: Thripidae) in Florida blueberry. Insects 2021, 12, 256. [Google Scholar] [CrossRef]
  26. Kafeshani, F.A.; Rajabpour, A.; Aghajanzadeh, S.; Gholamian, E.; Farkhari, M. Spatial distribution and sampling plans with fixed level of precision for Citrus aphids (Hom., Aphididae) on two orange species. J. Econ. Entomol. 2018, 111, 931–941. [Google Scholar]
  27. Sileshi, G.J.; Baumgaertner, J.; Sithanantham, S.; Ogol, C.K.P.O. Spatial distribution and sampling plans for Mesoplatys ochroptera (Coleoptera: Chrysomelidae) on sesbania. J. Econ. Entomol. 2002, 95, 499–506. [Google Scholar] [CrossRef]
  28. Taylor, L.R. Aggregation, variance and the mean. Nature 1961, 189, 732–735. [Google Scholar] [CrossRef]
  29. Taylor, L.R. Assessing and interpreting the spatial distribution of insect populations. Annu. Rev. Entomol. 1984, 29, 321–357. [Google Scholar] [CrossRef]
  30. Hutchison, W.D. Sequential sampling to determine population density. In Handbook of Sampling Methods for Arthropods in Agriculture; Pedigo, L.P., Buntin, G.D., Eds.; CRC Press: Boca Raton, FL, USA, 1994; pp. 207–244. [Google Scholar]
  31. Southwood, T.R.E. Ecological Methods, with Particular Reference to the Study of Insect Population; Chapman and Hall: London, UK, 1995. [Google Scholar]
  32. Green, R.H. On fixed precision sequential sampling. Popul. Ecol. 1970, 12, 249–251. [Google Scholar] [CrossRef]
  33. Naranjo, S.E.; Hutchison, W.D. Validation of arthropod sampling plans using a resampling approach: Software and analysis. Am. Entomol. 1997, 43, 48–57. [Google Scholar] [CrossRef]
  34. Ye, H.; Li, L.S. The distribution of Tomicus piniperda (L.) population in the crown of Yunnan pine during the shoot feeding period (in Chinese). Acta Entomol. Sin. 1994, 37, 311–316. [Google Scholar]
  35. Chen, P.; Lu, J.; Haack, R.A.; Ye, H. Attack pattern and reproductive ecology of Tomicus brevipilosus (Coleoptera: Curculionidae) on Pinus yunnanensis in Southwestern China. J. Insect Sci. 2015, 15, 43. [Google Scholar] [CrossRef] [Green Version]
  36. Wu, C.X.; Liu, F.; Zhang, S.F.; Kong, X.B.; Zhang, Z. Semiochemical regulation of the intraspecific and interspecific behavior of Tomicus yunnanensis and Tomicus minor during the shoot-feeding phase. J. Chem. Ecol. 2019, 45, 227–240. [Google Scholar] [CrossRef]
  37. Taylor, L.R.; Wolwod, I.P.; Perry, J.N. The density-dependence of spatial behavior and the rarity of randomness. J. Anim. Ecol. 1978, 47, 383–406. [Google Scholar] [CrossRef]
  38. Ye, H.; Lieutier, F. Shoot aggregation by Tomicus piniperda L (col: Scolytidae) in Yunnan, southwestern China. Ann. For. Sci. 1997, 54, 635–641. [Google Scholar]
  39. Lieutier, F.; Ye, H.; Yart, A. Shoot damage by Tomicus sp. (Coleoptera: Scolytidae) and effect on Pinus yunnanensis resistance to subsequent reproductive attacks in the stem. Agric. For. Entomol. 2003, 5, 227–233. [Google Scholar] [CrossRef]
  40. Lanne, B.S.; Schlyter, F.; Byers, J.A.; Lofqvist, J.; Leufven, A.; Bergstrom, G.; van der Pers, J.N.; Unelius, R.; Baeckstrom, P.; Norin, T. Differences in attraction to semiochemicals present in sympatric pine shoot beetles, Tomicus minor and T. piniperda. J. Chem. Ecol. 1987, 13, 1045–1067. [Google Scholar] [CrossRef] [PubMed]
  41. Romón, P.; Aparicio, D.; Palacios, F.; Iturrondobeitia, J.C.; Hance, T.; Goldarazena, A. Seasonal terpene variation in needles of Pinus radiata (Pinales: Pinaceae) trees attacked by Tomicus piniperda (Coleoptera: Scolytinae) and the effect of limonene on beetle aggregation. J. Insect Sci. 2017, 17, 98. [Google Scholar] [CrossRef] [PubMed] [Green Version]
  42. Liu, F.; Wu, C.; Zhang, S.; Kong, X.; Zhang, Z.; Wang, P. Initial location preference together with aggregation pheromones regulate the attack pattern of Tomicus brevipilosus (Coleoptera: Curculionidae) on Pinus kesiya. Forests 2019, 10, 156. [Google Scholar] [CrossRef] [Green Version]
  43. Faccoli, M.; Anfora, G.; Tasin, M. Responses of the Mediterranean pine shoot beetle Tomicus destruens (Wollaston) to pine shoot and bark volatiles. J. Chem. Ecol. 2008, 34, 1162–1169. [Google Scholar] [CrossRef]
  44. Shahbi, M.; Rajabpour, A. A fixed-precision sequential sampling plan for the potato tuberworm moth, Phthorimaea operculella Zeller (Lepidoptera: Gelechidae), on potato cultivars. Neotrop. Entomol. 2017, 46, 388–395. [Google Scholar] [CrossRef]
  45. Borden, J.H. Semiochemical-mediated aggregation and dispersion in the Coleoptera. In Insect Communication; Lewis, T., Ed.; Academic Press: London, UK, 1984; pp. 123–149. [Google Scholar]
  46. Wood, D.L.; Akers, R.P.; Owen, D.R.; Parmeter, J.R., Jr. The behaviour of bark beetles colonizing ponderosa pine. In Insects and the Plant Surface; Juniper, B., Southwood, R., Eds.; Edward Arnold: London, UK, 1986; pp. 91–103. [Google Scholar]
  47. Wang, J.; Zhang, Z.; Kong, X.; Wang, H.; Zhang, S. Intraspecific and interspecific attraction of three Tomicus beetle species during the shoot-feeding phase. Bull. Entomol. Res. 2015, 105, 225–233. [Google Scholar] [CrossRef]
  48. Raffa, K.F.; Berryman, A.A. The role of host plant resistance in the colonization behaviour and ecology of bark beetles (Coleoptera: Scolytidae). Ecol. Monogr. 1983, 53, 27–49. [Google Scholar] [CrossRef] [Green Version]
  49. Kapatos, E.T.; Stratopoulou, E.T.; Sahinoglu, A.; Tsitsipis, J.A.; Lycouresis, D.P. Development of an optimum sampling plan for population of Aphis gossypii (Hom., Aphididae) on cotton in Greece. J. Appl. Entomol. 1996, 120, 245–248. [Google Scholar] [CrossRef]
  50. Borkowski, A. Spatial distribution of fallen shoots of Scots pine pruned by pine shoot beetles (Tomicus spp.), and evaluation of methods of shoot collection in central Poland. J. Forest Res. 2007, 12, 358–364. [Google Scholar] [CrossRef]
Figure 1. Linear relationship between the field variances and means of Tomicus minor (a) and Tomicus yunnanensis (b) infested Pinus yunnanensis collected at all experimental sites during the shoot-feeding phase with Taylor’s power law regression from 2016 to 2018.
Insects 14 00060 g001
Figure 2. Optimum sample size of Tomicus minor (a) and Tomicus yunnanensis (b) in three Pinus yunnanensis tree sizes at precision levels of 0.1 and 0.25.
Insects 14 00060 g002
Figure 3. Green’s stop lines for fixed-precision sequential sampling of Tomicus minor (a) and Tomicus yunnanensis (b) in three Pinus yunnanensis tree sizes at precision levels of 0.1 and 0.25.
Insects 14 00060 g003
Figure 4. Resampling analyses of Green’s sequential sampling plan using independent field data for Tomicus minor (a,c) and Tomicus yunnanensis (b,d). The dash horizontal lines in (a,b) represent the desired level of precision (0.25).
Insects 14 00060 g004
Table 1. Sampling of Tomicus minor and Tomicus yunnanensis infested on Pinus yunnanensis from different experimental sites during the late shoot-feeding phase from 2016 to 2018.
Sampling
Data Sets
EXPYrNum.Tomicus minorTomicus yunnanensis
MeanSEVariance S2MeanSEVariance S2
1A20161000.380.111.26 0.510.090.90
2B20161000.080.040.14 0.260.111.15
3C20161000.400.141.91 0.260.100.93
4A20171000.140.080.58 0.390.090.79
5B20171000.090.040.14 0.400.121.50
6C20171000.190.060.36 0.690.142.02
7A20181000.320.080.58 0.860.193.46
8B20181000.240.070.44 0.350.070.51
9C20181000.430.152.14 0.850.193.54
EXP, experimental sites; Yr, year of sampling; Num., number of plants; SE, standard error.
Disclaimer/Publisher’s Note: The statements, opinions and data contained in all publications are solely those of the individual author(s) and contributor(s) and not of MDPI and/or the editor(s). MDPI and/or the editor(s) disclaim responsibility for any injury to people or property resulting from any ideas, methods, instructions or products referred to in the content.

