
REDfly: An Integrated Knowledgebase for Insect Regulatory Genomics


Abstract
:Simple Summary
Abstract
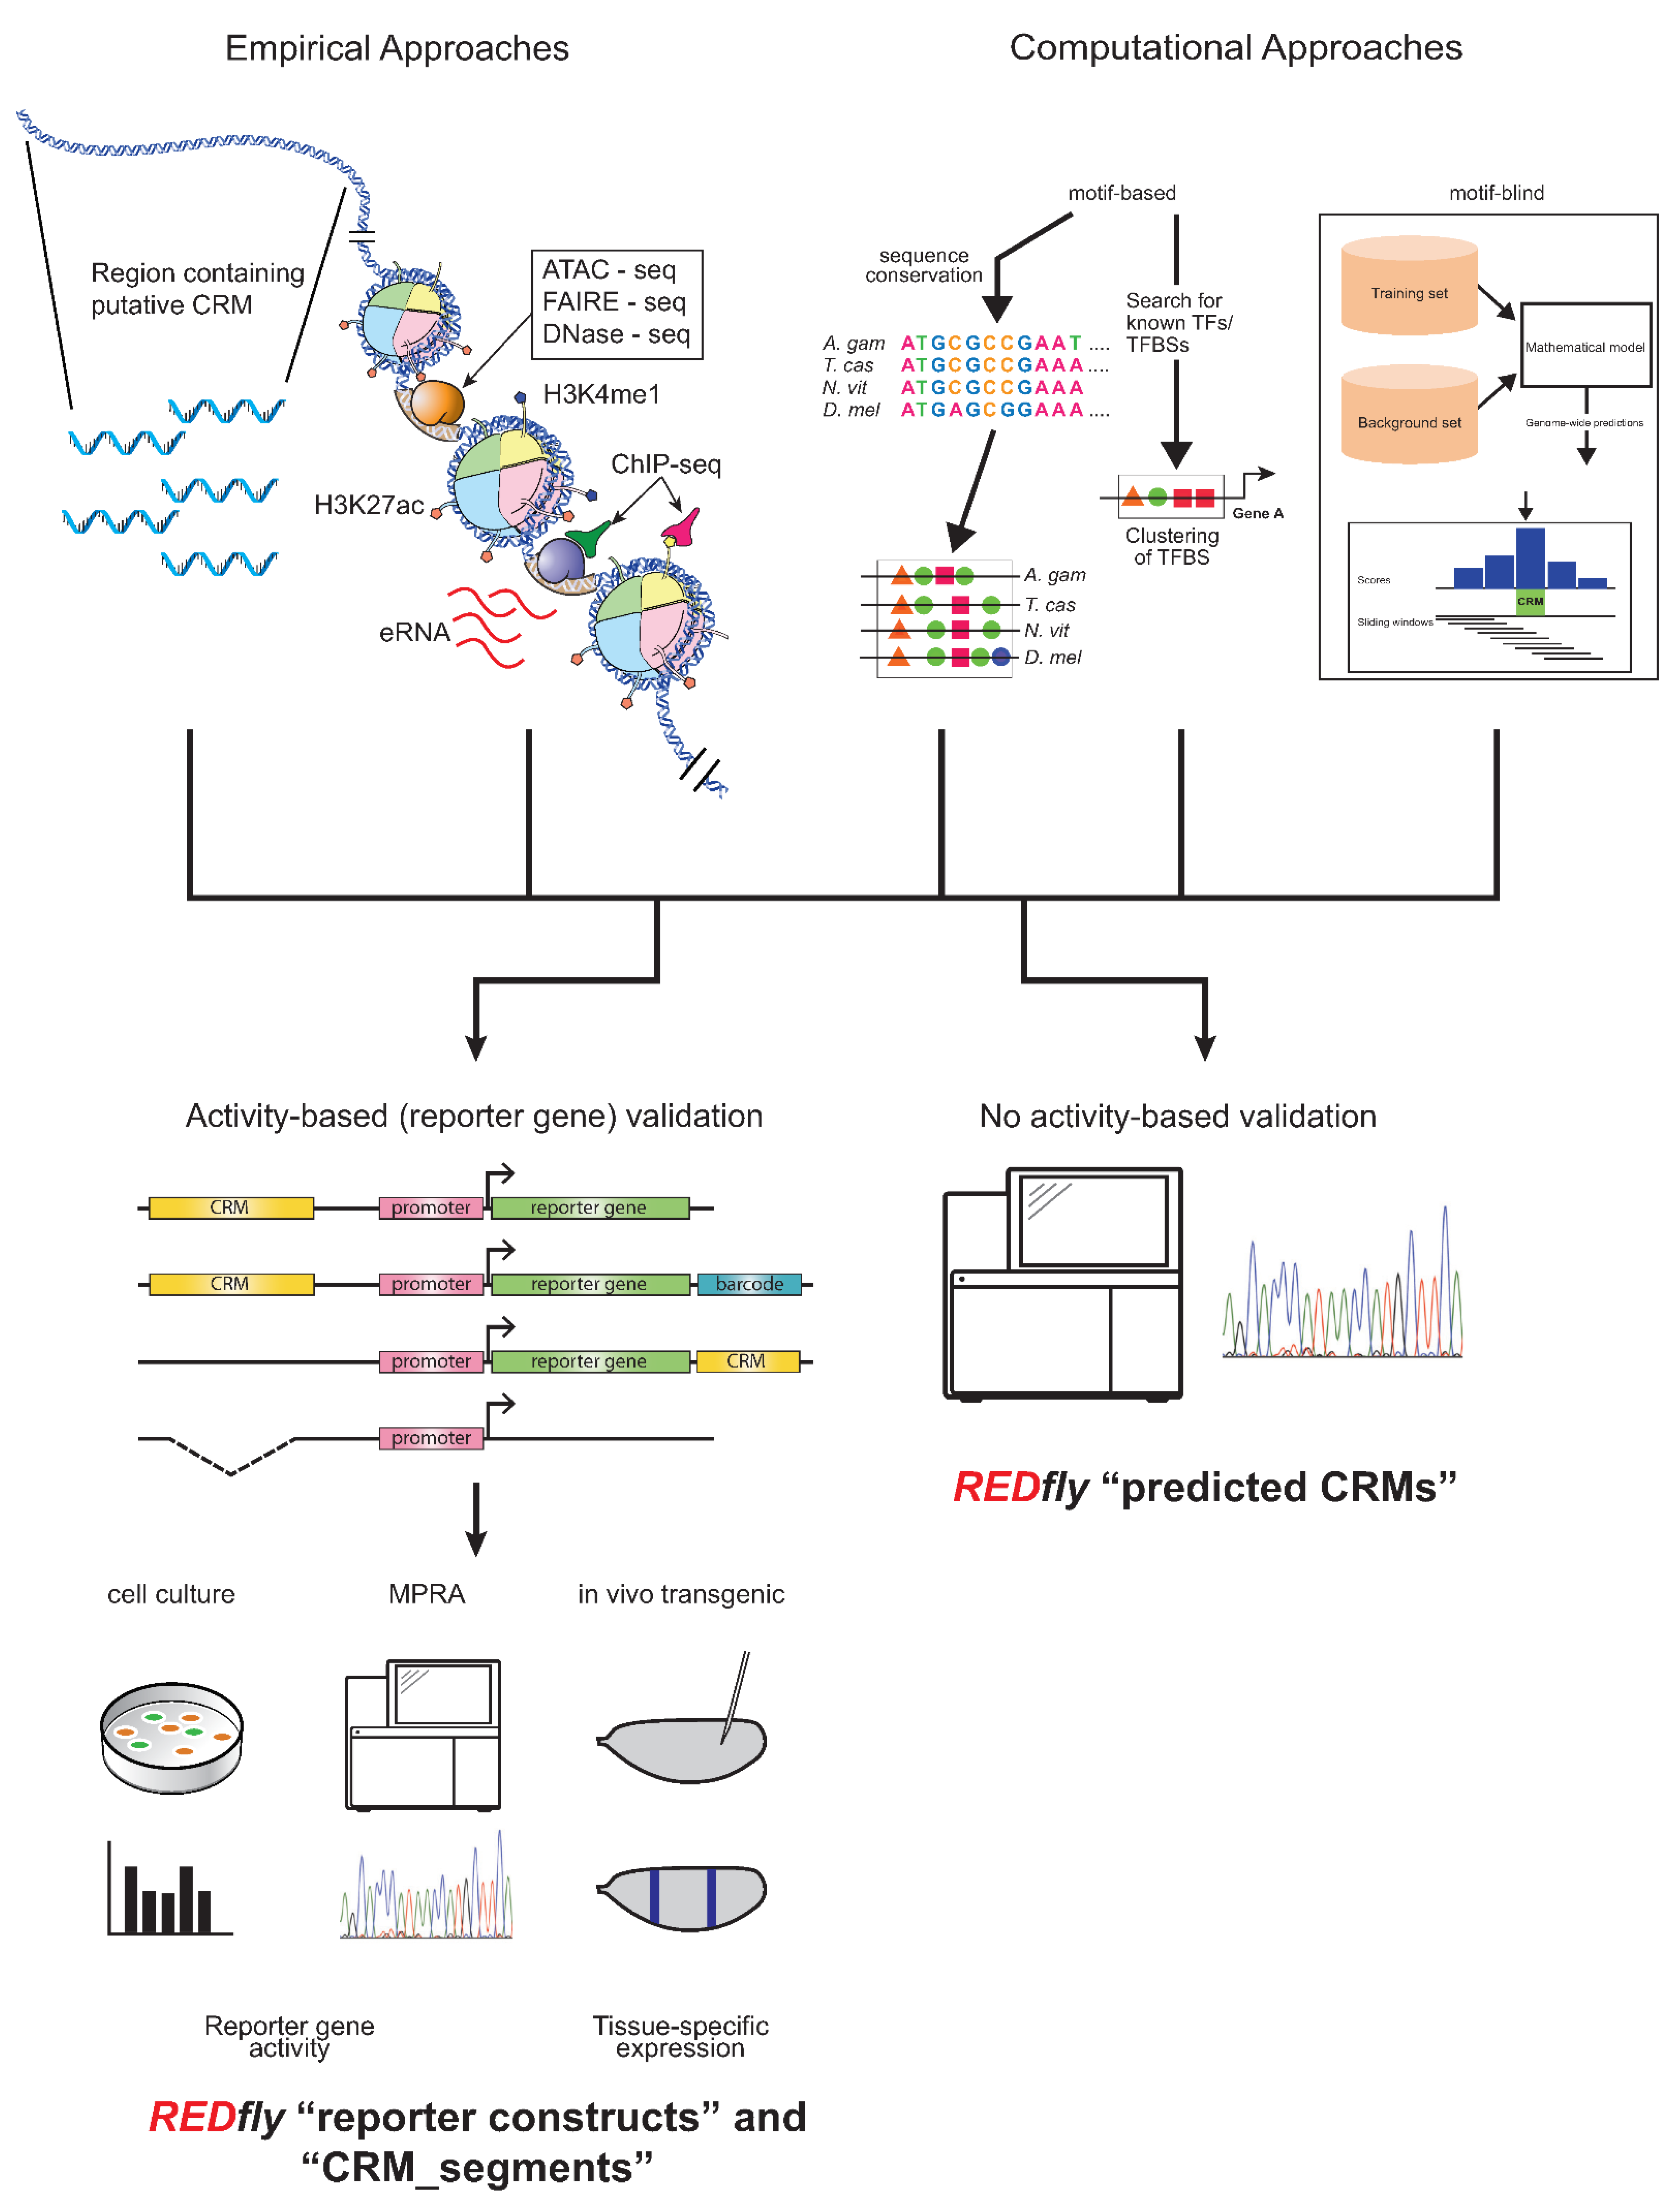
1. Introduction
2. Utility of REDfly
3. REDfly Data Model
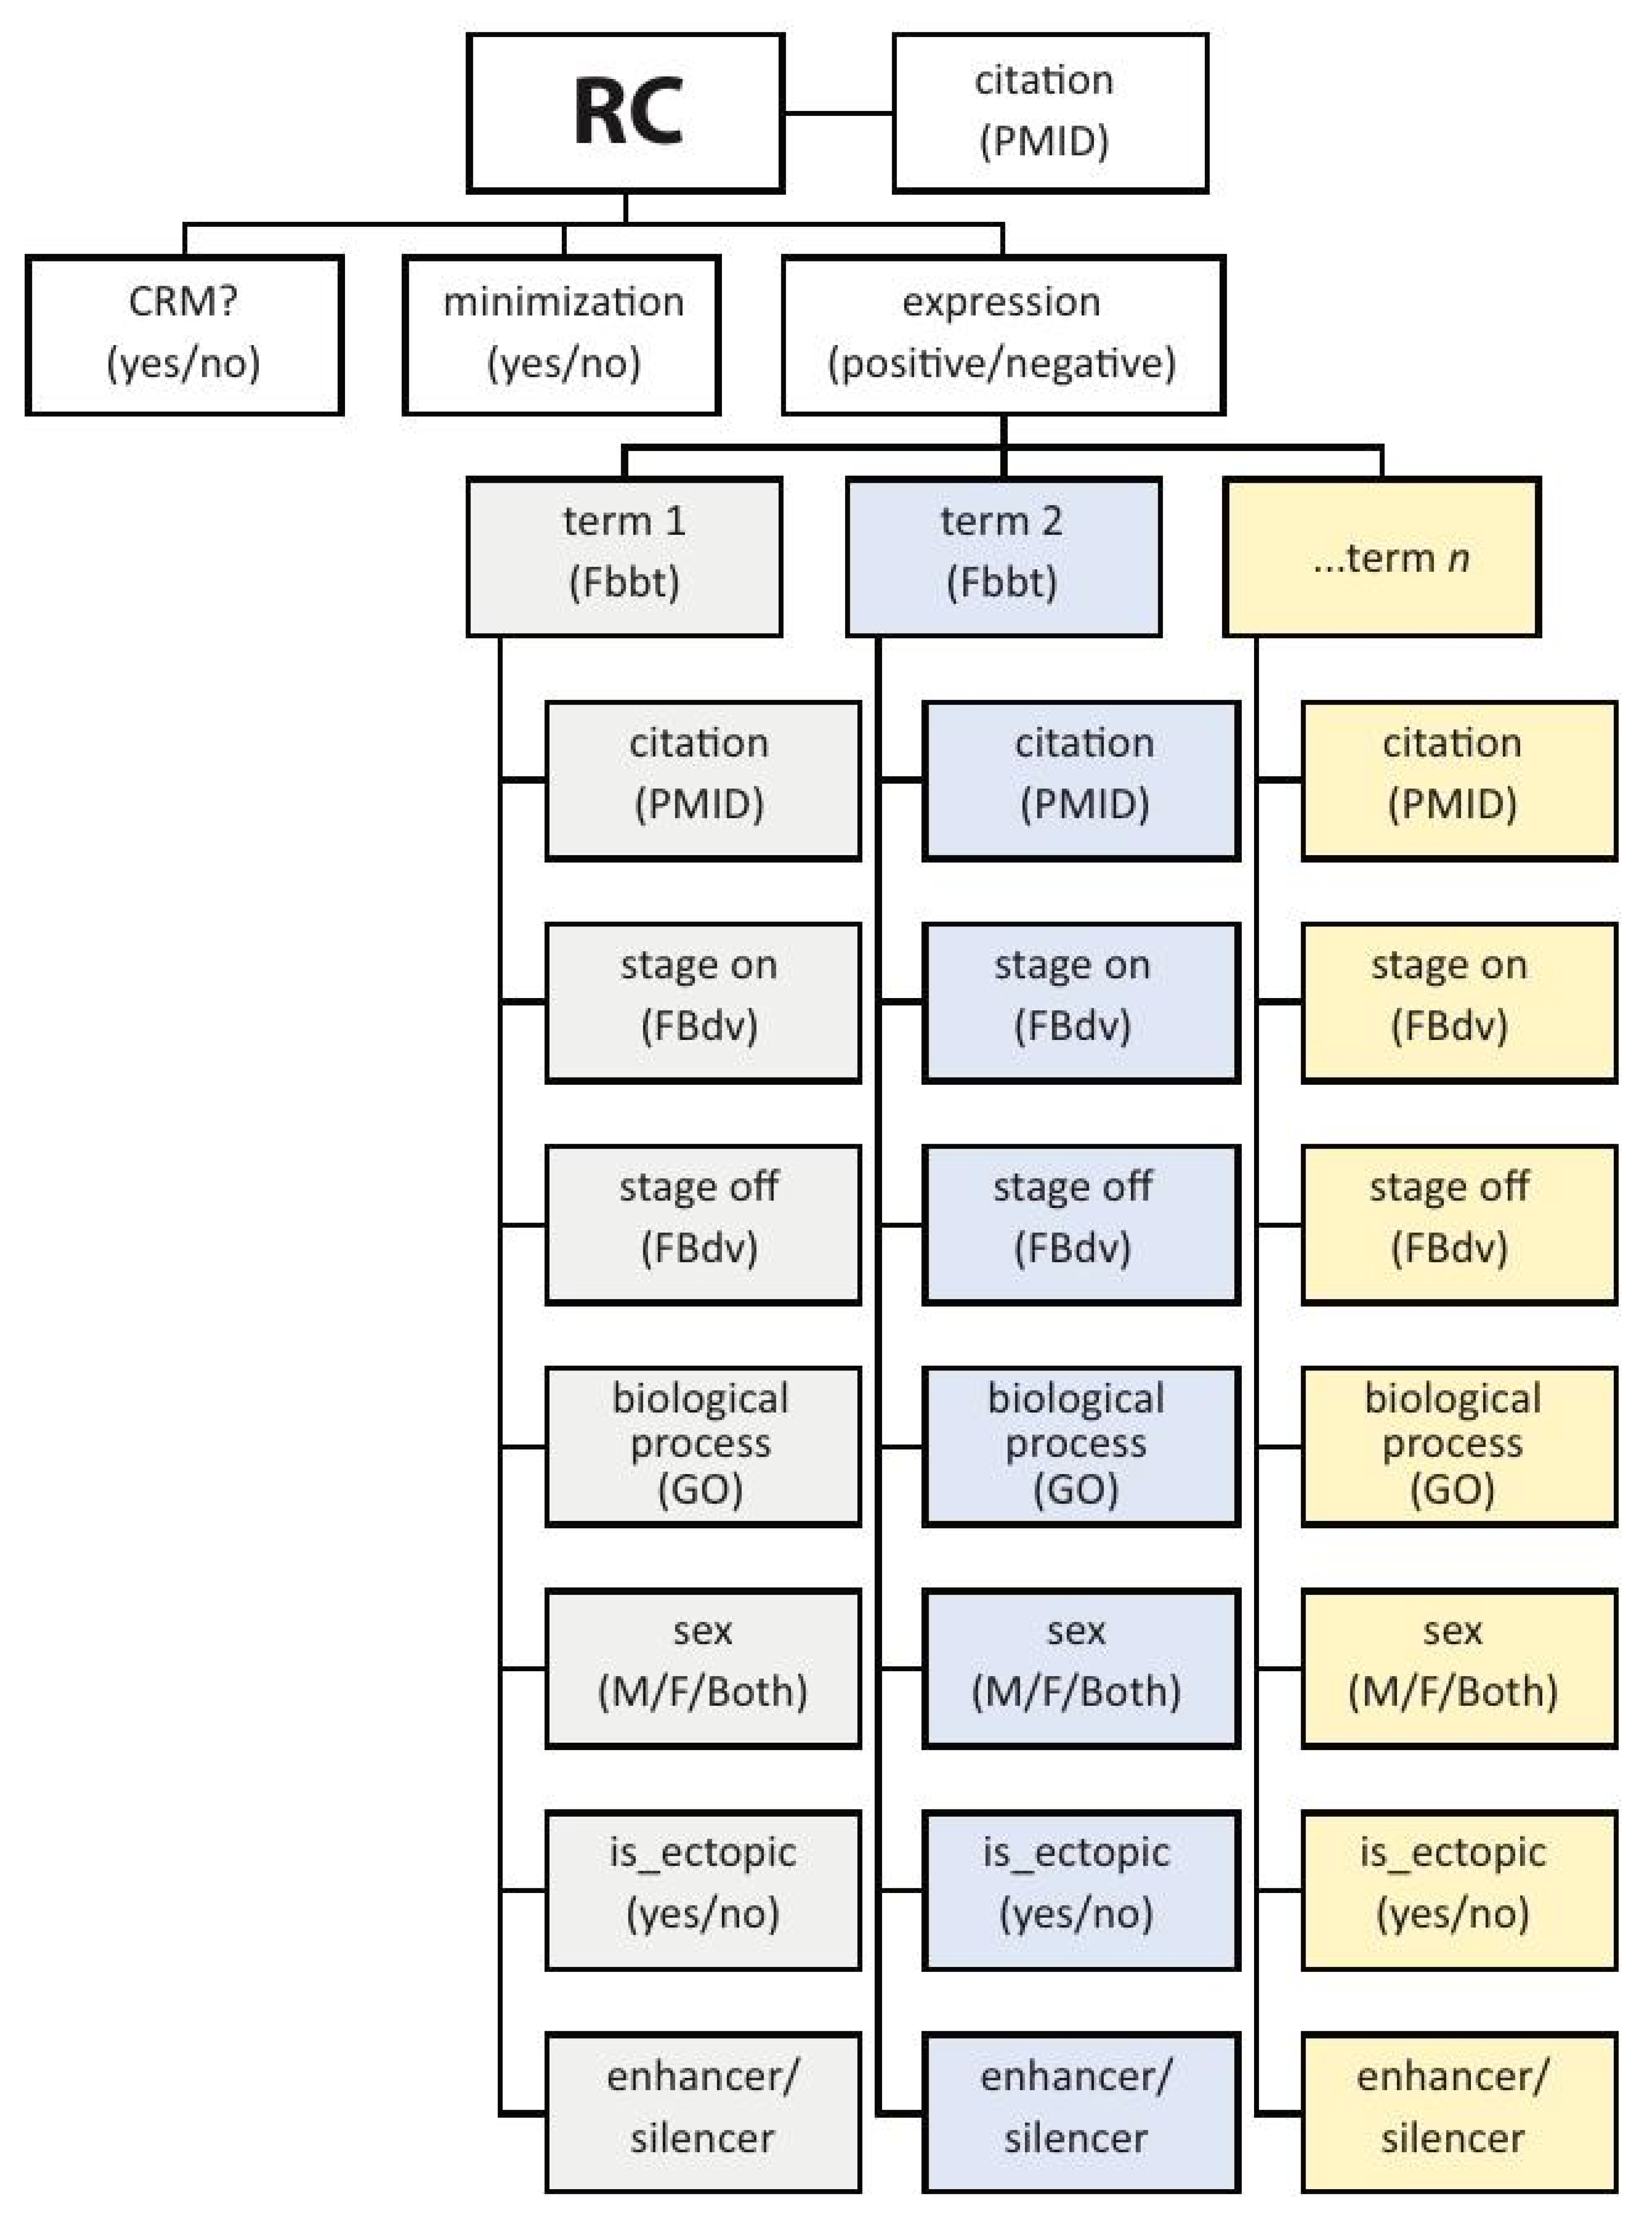
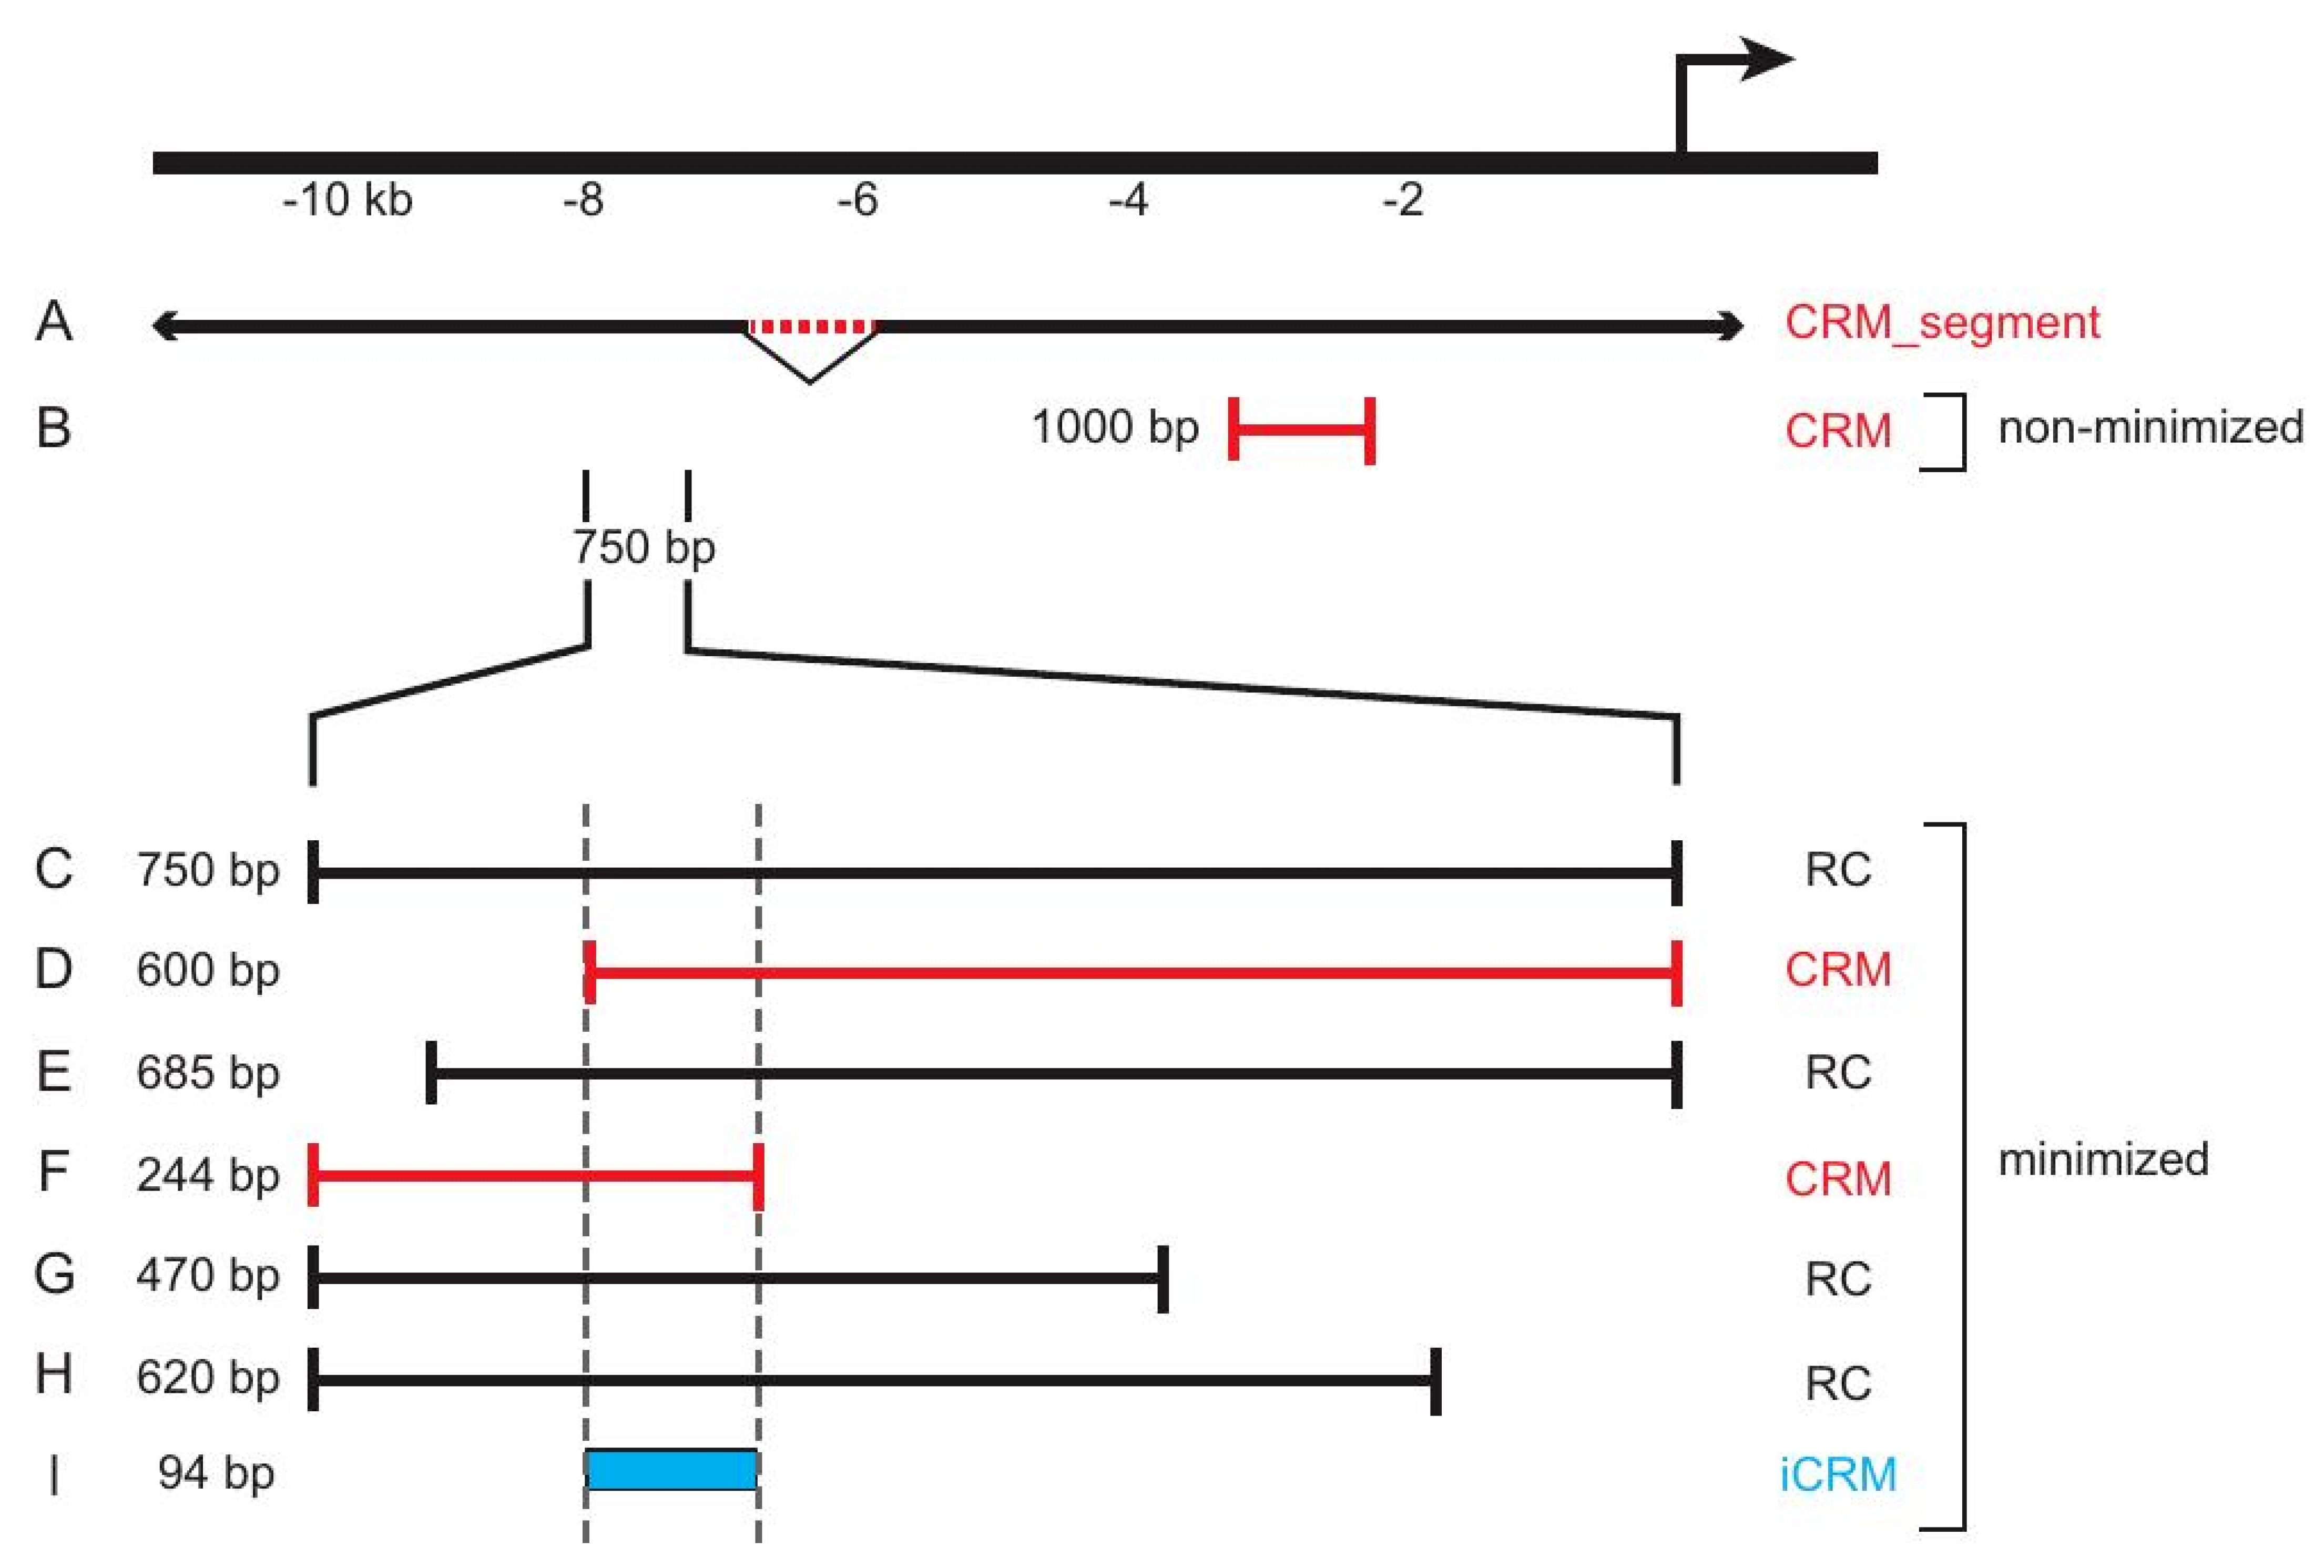
3.1. “Reporter Constructs” and Their Attributes
3.2. “Inferred CRMs”
4. Species in REDfly
5. Contents of REDfly
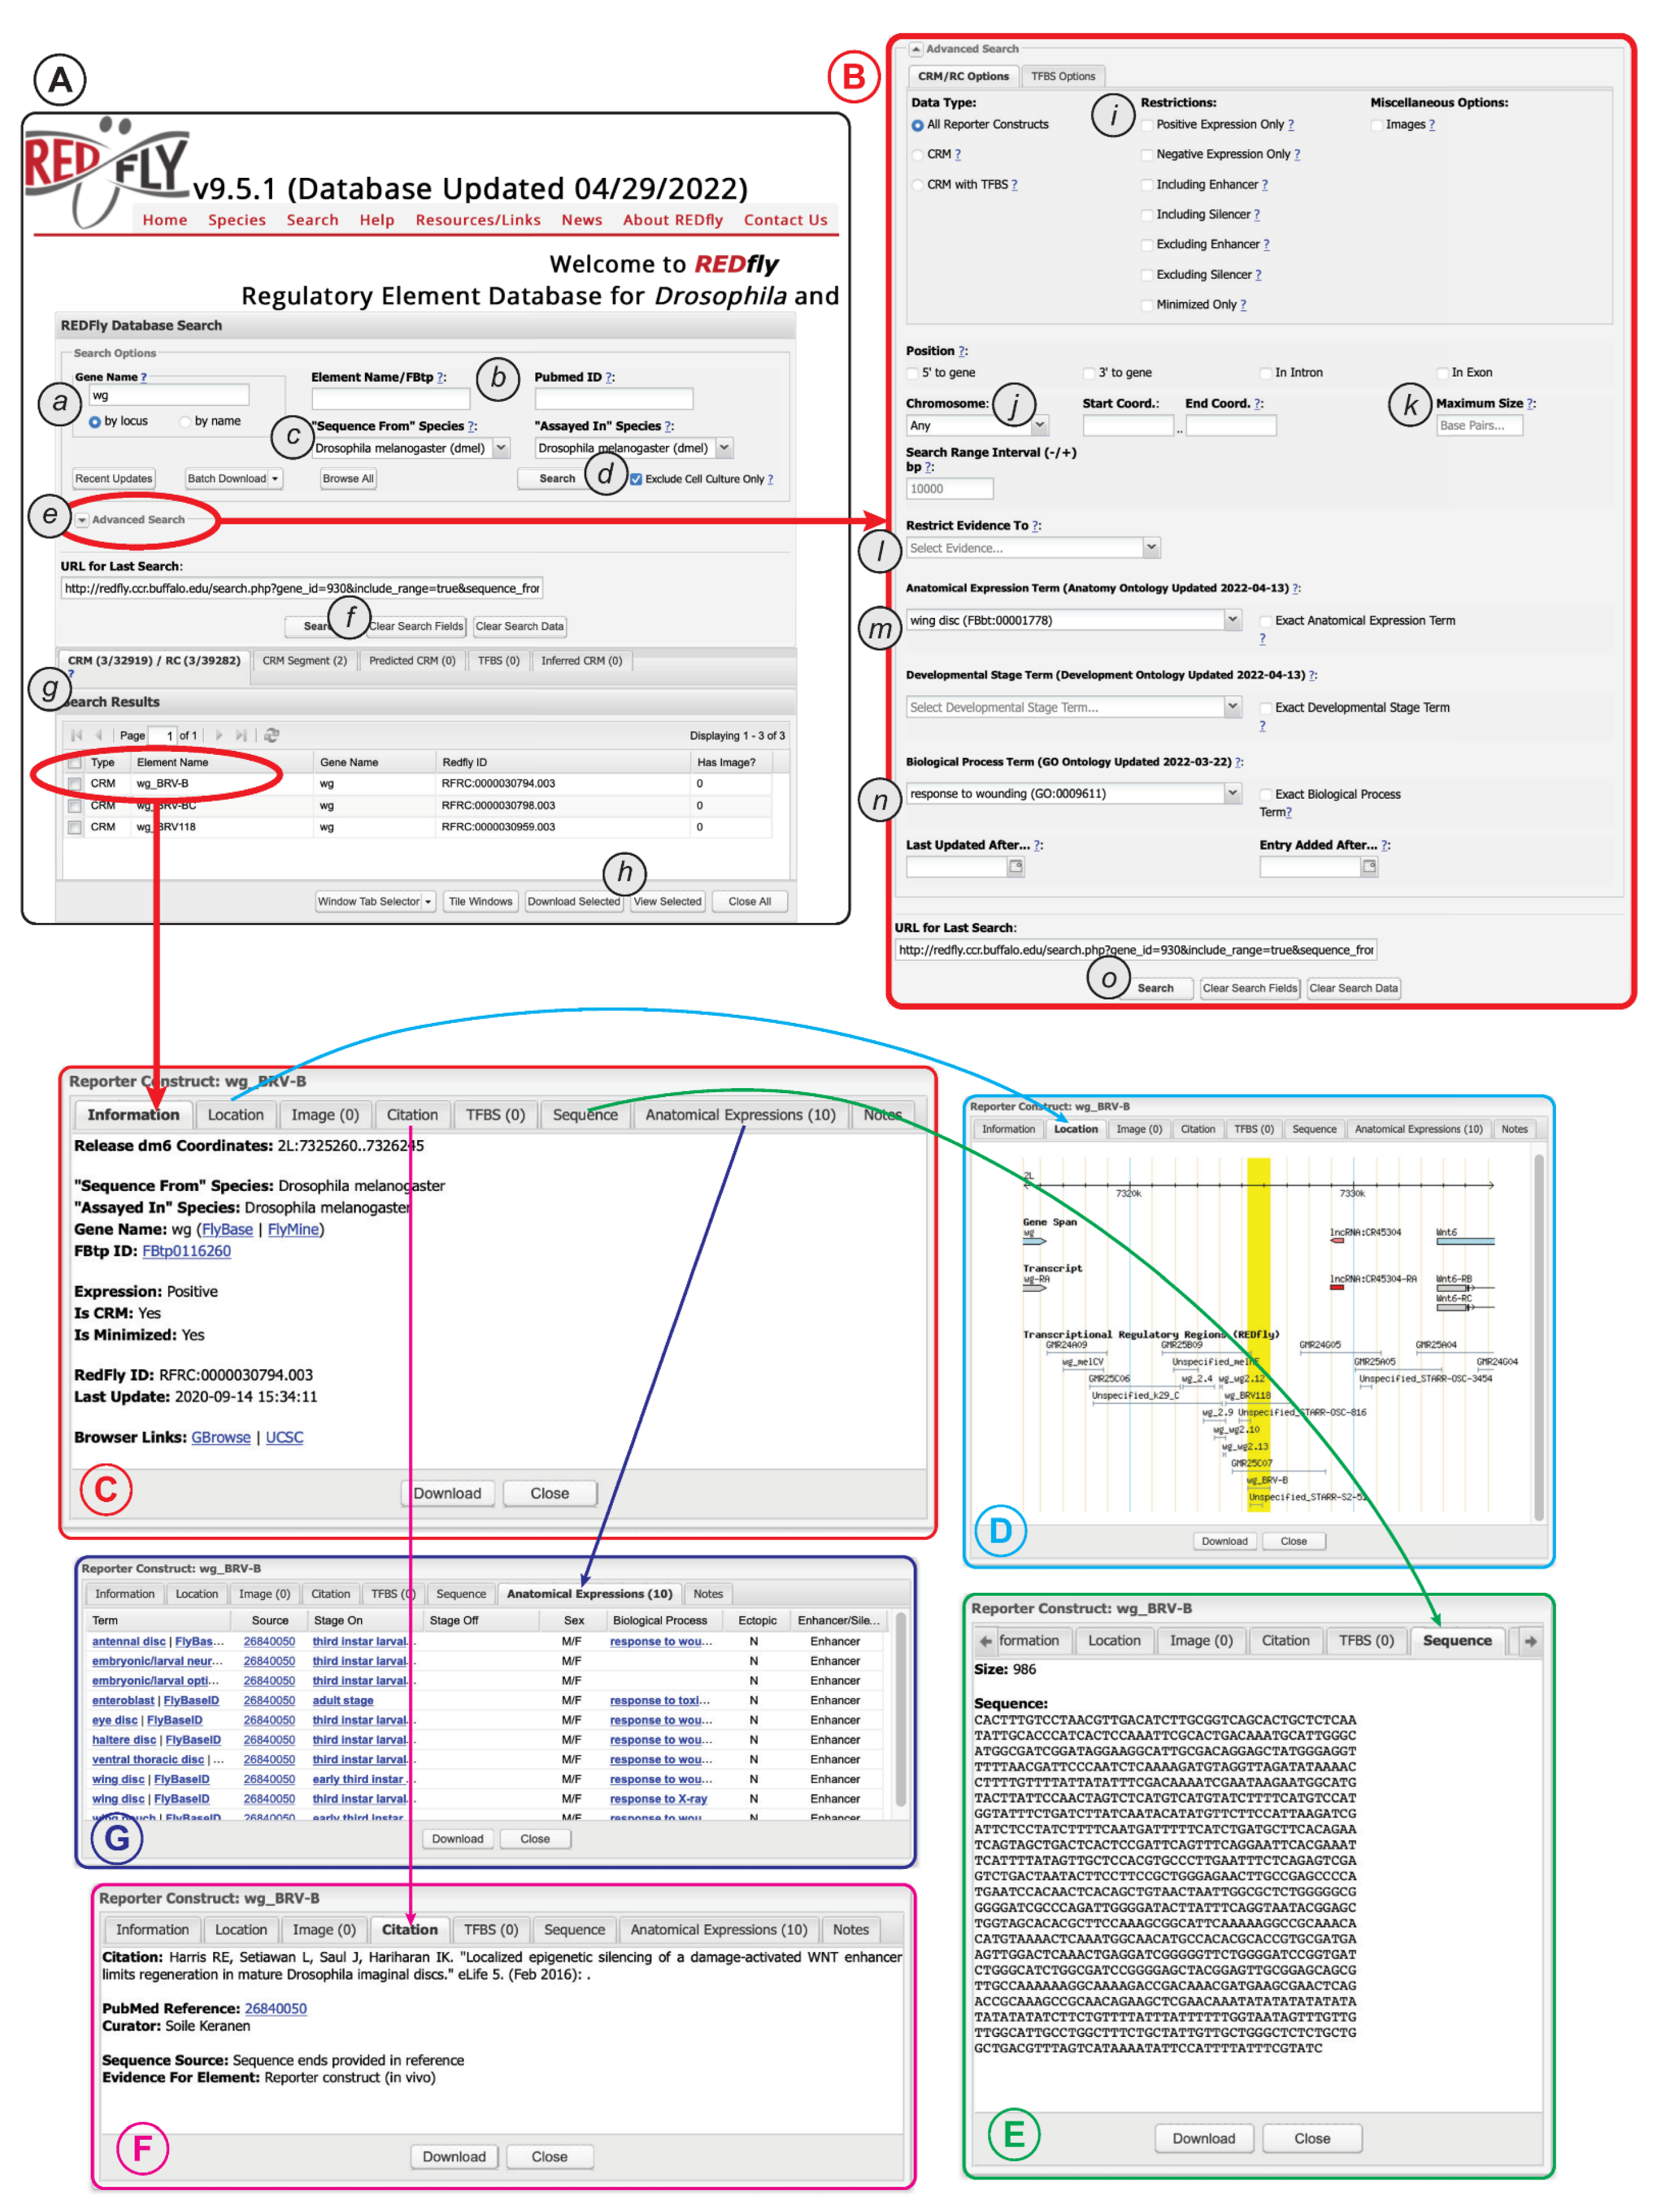
6. Using REDfly
7. Use Cases
- (a)
- Make sure that both the “sequence from” and “assayed in” fields (Figure 4A(c)) are set to Drosophila melanogaster;
- (b)
- Open the Advanced Search box (Figure 4A(e));
- (c)
- Set the “Chromosome”, “Start Coord.”, and “End Coord.” fields (Figure 4B(j)) to reflect your region of interest (make sure that the chromosomes are from the correct species, e.g., “3R (dmel)”;
- (d)
- Click on “search” (Figure 4B(o)).
- (a)
- Set the “sequence from” field (Figure 4A(c)) to “Aedes aegypti”;
- (b)
- Set the “assayed in” field “Drosophila melanogaster”;
- (c)
- Click on “search” (Figure 4A(d)).
- (a)
- Make sure that both the “sequence from” and “assayed in” fields (Figure 4A(c)) are set to Drosophila melanogaster;
- (b)
- Make sure the “Exclude Cell Culture Only” box is checked (Figure 4A(d));
- (c)
- Open the Advanced Search box (Figure 4A(e));
- (d)
- In the “Restrictions” section (Figure 4B(i)), check the “Negative Expression Only” box;
- (e)
- Click on “search” (Figure 4B(o)).
- (a)
- Make sure that both the “sequence from” and “assayed in” fields (Figure 4A(c)) are set to Drosophila melanogaster;
- (b)
- Uncheck the “Exclude Cell Culture” box (Figure 4A(d));
- (c)
- Open the Advanced Search box (Figure 4A(e));
- (d)
- Type “1000” in the “Maximum Size” box (Figure 4B(k));
- (e)
- In the “Restrict evidence to” dropdown select “reporter construct (cell culture)” (Figure 4B(l));
- (f)
- Click on “search” (Figure 4B(o)).
- (a)
- Make sure that both the “sequence from” and “assayed in” fields (Figure 4A(c)) are set to Drosophila melanogaster;
- (b)
- Open the Advanced Search box (Figure 4A(e));
- (c)
- In the “Anatomical Expression Term” box (Figure 4B(m)), begin typing “wing disc” and select this term when it appears in the completion list;
- (d)
- In the “Biological Process Term” box (Figure 4B(n)), begin typing “wound healing” and select “Response to wounding” from the completion list;
- (e)
- Click on “search” (Figure 4B(o)).
8. Access to REDfly
9. Data Submission
Funding
Institutional Review Board Statement
Informed Consent Statement
Data Availability Statement
Acknowledgments
Conflicts of Interest
References
- Adams, M.D.; Celniker, S.E.; Holt, R.A.; Evans, C.A.; Gocayne, J.D.; Amanatides, P.G.; Scherer, S.E.; Li, P.W.; Hoskins, R.A.; Galle, R.F.; et al. The genome sequence of Drosophila melanogaster. Science 2000, 287, 2185–2195. [Google Scholar] [CrossRef] [PubMed] [Green Version]
- C. elegans Sequencing Consortium. Genome sequence of the nematode C. elegans: A platform for investigating biology. Science 1998, 282, 2012–2018. [CrossRef] [PubMed]
- Holt, R.A.; Subramanian, G.M.; Halpern, A.; Sutton, G.G.; Charlab, R.; Nusskern, D.R.; Wincker, P.; Clark, A.G.; Ribeiro, J.M.; Wides, R.; et al. The genome sequence of the malaria mosquito Anopheles gambiae. Science 2002, 298, 129–149. [Google Scholar] [CrossRef] [PubMed]
- Waterston, R.H.; Lindblad-Toh, K.; Birney, E.; Rogers, J.; Abril, J.F.; Agarwal, P.; Agarwala, R.; Ainscough, R.; Alexandersson, M.; An, P.; et al. Initial sequencing and comparative analysis of the mouse genome. Nature 2002, 420, 520–562. [Google Scholar] [CrossRef]
- The Alliance of Genome Resources Consortium. The Alliance of Genome Resources: Building a Modern Data Ecosystem for Model Organism Databases. Genetics 2019, 213, 1189–1196. [Google Scholar] [CrossRef] [Green Version]
- Grosveld, F.; van Staalduinen, J.; Stadhouders, R. Transcriptional Regulation by (Super)Enhancers: From Discovery to Mechanisms. Annu. Rev. Genom. Hum. Genet. 2021, 22, 127–146. [Google Scholar] [CrossRef]
- Chen, D.; Lei, E.P. Function and regulation of chromatin insulators in dynamic genome organization. Curr. Opin. Cell Biol. 2019, 58, 61–68. [Google Scholar] [CrossRef]
- Segert, J.A.; Gisselbrecht, S.S.; Bulyk, M.L. Transcriptional Silencers: Driving Gene Expression with the Brakes On. Trends Genet. 2021, 37, 514–527. [Google Scholar] [CrossRef]
- Batut, P.J.; Bing, X.Y.; Sisco, Z.; Raimundo, J.; Levo, M.; Levine, M.S. Genome organization controls transcriptional dynamics during development. Science 2022, 375, 566–570. [Google Scholar] [CrossRef]
- Kassis, J.A.; Brown, J.L. Polycomb group response elements in Drosophila and vertebrates. Adv. Genet. 2013, 81, 83–118. [Google Scholar] [CrossRef] [Green Version]
- Atkinson, T.J.; Halfon, M.S. Regulation of Gene Expression in the Genomic Context. Comput. Struct. Biotechnol. J. 2014, 9, e201401001. [Google Scholar] [CrossRef] [PubMed] [Green Version]
- Gallo, S.M.; Gerrard, D.T.; Miner, D.; Simich, M.; Des Soye, B.; Bergman, C.M.; Halfon, M.S. REDfly v3.0: Toward a comprehensive database of transcriptional regulatory elements in Drosophila. Nucleic Acids Res. 2011, 39, D118–D123. [Google Scholar] [CrossRef] [PubMed]
- Gallo, S.M.; Li, L.; Hu, Z.; Halfon, M.S. REDfly: A Regulatory Element Database for Drosophila. Bioinformatics 2006, 22, 381–383. [Google Scholar] [CrossRef] [PubMed] [Green Version]
- Halfon, M.S.; Gallo, S.M.; Bergman, C.M. REDfly 2.0: An integrated database of cis-regulatory modules and transcription factor binding sites in Drosophila. Nucl. Acids Res. 2008, 36, D594–D598. [Google Scholar] [CrossRef] [PubMed] [Green Version]
- Rivera, J.; Keranen, S.V.E.; Gallo, S.M.; Halfon, M.S. REDfly: The transcriptional regulatory element database for Drosophila. Nucleic Acids Res. 2018, 47, D828–D834. [Google Scholar] [CrossRef] [Green Version]
- Abnizova, I.; te Boekhorst, R.; Walter, K.; Gilks, W.R. Some statistical properties of regulatory DNA sequences, and their use in predicting regulatory regions in the Drosophila genome: The fluffy-tail test. BMC Bioinform. 2005, 6, 109. [Google Scholar] [CrossRef] [Green Version]
- Arnone, M.I.; Davidson, E.H. The hardwiring of development: Organization and function of genomic regulatory systems. Development 1997, 124, 1851–1864. [Google Scholar] [CrossRef]
- Lifanov, A.P.; Makeev, V.J.; Nazina, A.G.; Papatsenko, D.A. Homotypic regulatory clusters in Drosophila. Genome Res. 2003, 13, 579–588. [Google Scholar] [CrossRef] [Green Version]
- Wilkinson, M.D.; Dumontier, M.; Aalbersberg, I.J.; Appleton, G.; Axton, M.; Baak, A.; Blomberg, N.; Boiten, J.W.; da Silva Santos, L.B.; Bourne, P.E.; et al. The FAIR Guiding Principles for scientific data management and stewardship. Sci. Data 2016, 3, 160018. [Google Scholar] [CrossRef] [Green Version]
- Li, L.; Zhu, Q.; He, X.; Sinha, S.; Halfon, M.S. Large-scale analysis of transcriptional cis-regulatory modules reveals both common features and distinct subclasses. Genome Biol. 2007, 8, R101. [Google Scholar] [CrossRef] [Green Version]
- Papatsenko, D.; Goltsev, Y.; Levine, M. Organization of developmental enhancers in the Drosophila embryo. Nucleic Acids Res. 2009, 37, 5665–5677. [Google Scholar] [CrossRef] [PubMed] [Green Version]
- Zinzen, R.P.; Girardot, C.; Gagneur, J.; Braun, M.; Furlong, E.E. Combinatorial binding predicts spatio-temporal cis-regulatory activity. Nature 2009, 462, 65–70. [Google Scholar] [CrossRef] [PubMed]
- Soluri, I.V.; Zumerling, L.M.; Parra, O.A.P.; Clark, E.G.; Blythe, S.A. Zygotic pioneer factor activity of Odd-paired/Zic is necessary for late function of the Drosophila segmentation network. Elife 2020, 9, e53916. [Google Scholar] [CrossRef] [PubMed]
- Blick, A.J.; Mayer-Hirshfeld, I.; Malibiran, B.R.; Cooper, M.A.; Martino, P.A.; Johnson, J.E.; Bateman, J.R. The Capacity to Act in Trans Varies Among Drosophila Enhancers. Genetics 2016, 203, 203–218. [Google Scholar] [CrossRef] [Green Version]
- Halfon, M.S. Silencers, Enhancers, and the Multifunctional Regulatory Genome. Trends Genet. 2020, 36, 149–151. [Google Scholar] [CrossRef]
- Erceg, J.; Pakozdi, T.; Marco-Ferreres, R.; Ghavi-Helm, Y.; Girardot, C.; Bracken, A.P.; Furlong, E.E.M. Dual functionality of cis-regulatory elements as developmental enhancers and Polycomb response elements. Genes Dev. 2017, 31, 590–602. [Google Scholar] [CrossRef] [Green Version]
- Gisselbrecht, S.S.; Palagi, A.; Kurland, J.V.; Rogers, J.M.; Ozadam, H.; Zhan, Y.; Dekker, J.; Bulyk, M.L. Transcriptional Silencers in Drosophila Serve a Dual Role as Transcriptional Enhancers in Alternate Cellular Contexts. Mol. Cell 2020, 77, 324–337.e8. [Google Scholar] [CrossRef]
- Li, X.Y.; MacArthur, S.; Bourgon, R.; Nix, D.; Pollard, D.A.; Iyer, V.N.; Hechmer, A.; Simirenko, L.; Stapleton, M.; Luengo Hendriks, C.L.; et al. Transcription factors bind thousands of active and inactive regions in the Drosophila blastoderm. PLoS Biol. 2008, 6, e27. [Google Scholar] [CrossRef] [Green Version]
- Li, X.Y.; Thomas, S.; Sabo, P.J.; Eisen, M.B.; Stamatoyannopoulos, J.A.; Biggin, M.D. The role of chromatin accessibility in directing the widespread, overlapping patterns of Drosophila transcription factor binding. Genome Biol. 2011, 12, R34. [Google Scholar] [CrossRef] [Green Version]
- Negre, N.; Brown, C.D.; Shah, P.K.; Kheradpour, P.; Morrison, C.A.; Henikoff, J.G.; Feng, X.; Ahmad, K.; Russell, S.; White, R.A.; et al. A comprehensive map of insulator elements for the Drosophila genome. PLoS Genet. 2010, 6, e1000814. [Google Scholar] [CrossRef] [Green Version]
- Moshkovich, N.; Nisha, P.; Boyle, P.J.; Thompson, B.A.; Dale, R.K.; Lei, E.P. RNAi-independent role for Argonaute2 in CTCF/CP190 chromatin insulator function. Genes Dev. 2011, 25, 1686–1701. [Google Scholar] [CrossRef] [PubMed] [Green Version]
- Bonn, S.; Zinzen, R.P.; Girardot, C.; Gustafson, E.H.; Perez-Gonzalez, A.; Delhomme, N.; Ghavi-Helm, Y.; Wilczynski, B.; Riddell, A.; Furlong, E.E. Tissue-specific analysis of chromatin state identifies temporal signatures of enhancer activity during embryonic development. Nat. Genet. 2012, 44, 148–156. [Google Scholar] [CrossRef]
- Khoroshko, V.A.; Levitsky, V.G.; Zykova, T.Y.; Antonenko, O.V.; Belyaeva, E.S.; Zhimulev, I.F. Chromatin Heterogeneity and Distribution of Regulatory Elements in the Late-Replicating Intercalary Heterochromatin Domains of Drosophila melanogaster Chromosomes. PLoS ONE 2016, 11, e0157147. [Google Scholar] [CrossRef]
- Zhou, J.; Troyanskaya, O.G. Probabilistic modelling of chromatin code landscape reveals functional diversity of enhancer-like chromatin states. Nat. Commun. 2016, 7, 10528. [Google Scholar] [CrossRef] [PubMed] [Green Version]
- Mateo, L.J.; Murphy, S.E.; Hafner, A.; Cinquini, I.S.; Walker, C.A.; Boettiger, A.N. Visualizing DNA folding and RNA in embryos at single-cell resolution. Nature 2019, 568, 49–54. [Google Scholar] [CrossRef] [PubMed]
- Bozek, M.; Cortini, R.; Storti, A.E.; Unnerstall, U.; Gaul, U.; Gompel, N. ATAC-seq reveals regional differences in enhancer accessibility during the establishment of spatial coordinates in the Drosophila blastoderm. Genome Res. 2019, 29, 771–783. [Google Scholar] [CrossRef] [Green Version]
- Ghavi-Helm, Y.; Klein, F.A.; Pakozdi, T.; Ciglar, L.; Noordermeer, D.; Huber, W.; Furlong, E.E.M. Enhancer loops appear stable during development and are associated with paused polymerase. Nature 2014, 512, 96–100. [Google Scholar] [CrossRef]
- Li, X.; Zhou, B.; Chen, L.; Gou, L.T.; Li, H.R.; Fu, X.D. GRID-seq reveals the global RNA-chromatin interactome. Nat. Biotechnol. 2017, 35, 940–950. [Google Scholar] [CrossRef]
- Schor, I.E.; Bussotti, G.; Males, M.; Forneris, M.; Viales, R.R.; Enright, A.J.; Furlong, E.E.M. Non-coding RNA Expression, Function, and Variation during Drosophila Embryogenesis. Curr. Biol. 2018, 28, 3547–3561.e9. [Google Scholar] [CrossRef]
- Mikhaylichenko, O.; Bondarenko, V.; Harnett, D.; Schor, I.E.; Males, M.; Viales, R.R.; Furlong, E.E.M. The degree of enhancer or promoter activity is reflected by the levels and directionality of eRNA transcription. Genes Dev. 2018, 32, 42–57. [Google Scholar] [CrossRef] [Green Version]
- Haines, J.E.; Eisen, M.B. Patterns of chromatin accessibility along the anterior-posterior axis in the early Drosophila embryo. PLoS Genet. 2018, 14, e1007367. [Google Scholar] [CrossRef] [PubMed] [Green Version]
- Cusanovich, D.A.; Reddington, J.P.; Garfield, D.A.; Daza, R.M.; Aghamirzaie, D.; Marco-Ferreres, R.; Pliner, H.A.; Christiansen, L.; Qiu, X.J.; Steemers, F.J.; et al. The cis-regulatory dynamics of embryonic development at single-cell resolution. Nature 2018, 555, 538–542. [Google Scholar] [CrossRef] [PubMed]
- Arunachalam, M.; Jayasurya, K.; Tomancak, P.; Ohler, U. An alignment-free method to identify candidate orthologous enhancers in multiple Drosophila genomes. Bioinformatics 2010, 26, 2109–2115. [Google Scholar] [CrossRef] [PubMed] [Green Version]
- Kantorovitz, M.R.; Kazemian, M.; Kinston, S.; Miranda-Saavedra, D.; Zhu, Q.; Robinson, G.E.; Gottgens, B.; Halfon, M.S.; Sinha, S. Motif-blind, genome-wide discovery of cis-regulatory modules in Drosophila and mouse. Dev. Cell 2009, 17, 568–579. [Google Scholar] [CrossRef] [Green Version]
- Kazemian, M.; Zhu, Q.; Halfon, M.S.; Sinha, S. Improved accuracy of supervised CRM discovery with interpolated Markov models and cross-species comparison. Nucleic Acids Res. 2011, 39, 9463–9472. [Google Scholar] [CrossRef] [Green Version]
- Arbel, H.; Basu, S.; Fisher, W.W.; Hammonds, A.S.; Wan, K.H.; Park, S.; Weiszmann, R.; Booth, B.W.; Keranen, S.V.; Henriquez, C.; et al. Exploiting regulatory heterogeneity to systematically identify enhancers with high accuracy. Proc. Natl. Acad. Sci. USA 2019, 116, 900–908. [Google Scholar] [CrossRef] [Green Version]
- Aerts, S.; van Helden, J.; Sand, O.; Hassan, B.A. Fine-tuning enhancer models to predict transcriptional targets across multiple genomes. PLoS ONE 2007, 2, e1115. [Google Scholar] [CrossRef]
- Brody, T.; Yavatkar, A.S.; Kuzin, A.; Kundu, M.; Tyson, L.J.; Ross, J.; Lin, T.Y.; Lee, C.H.; Awasaki, T.; Lee, T.; et al. Use of a Drosophila genome-wide conserved sequence database to identify functionally related cis-regulatory enhancers. Dev. Dyn. 2012, 241, 169–189. [Google Scholar] [CrossRef]
- Ivan, A.; Halfon, M.S.; Sinha, S. Computational discovery of cis-regulatory modules in Drosophila without prior knowledge of motifs. Genome Biol. 2008, 9, R22. [Google Scholar] [CrossRef] [Green Version]
- Guo, H.T.; Huo, H.W.; Yu, Q. SMCis: An Effective Algorithm for Discovery of Cis-Regulatory Modules. PLoS ONE 2016, 11, e0162968. [Google Scholar] [CrossRef]
- Asma, H.; Halfon, M.S. Computational enhancer prediction: Evaluation and improvements. BMC Bioinform. 2019, 20, 174. [Google Scholar] [CrossRef] [PubMed] [Green Version]
- Su, J.; Teichmann, S.A.; Down, T.A. Assessing computational methods of cis-regulatory module prediction. PLoS Comput. Biol. 2010, 6, e1001020. [Google Scholar] [CrossRef] [PubMed]
- Kazemian, M.; Suryamohan, K.; Chen, J.Y.; Zhang, Y.; Samee, M.A.; Halfon, M.S.; Sinha, S. Evidence for deep regulatory similarities in early developmental programs across highly diverged insects. Genome Biol. Evol. 2014, 6, 2301–2320. [Google Scholar] [CrossRef] [PubMed] [Green Version]
- Asma, H.; Halfon, M.S. Annotating the Insect Regulatory Genome. Insects 2021, 12, 591. [Google Scholar] [CrossRef] [PubMed]
- Clark, A.G.; Eisen, M.B.; Smith, D.R.; Bergman, C.M.; Oliver, B.; Markow, T.A.; Kaufman, T.C.; Kellis, M.; Gelbart, W.; Iyer, V.N.; et al. Evolution of genes and genomes on the Drosophila phylogeny. Nature 2007, 450, 203–218. [Google Scholar] [CrossRef]
- He, B.Z.; Holloway, A.K.; Maerkl, S.J.; Kreitman, M. Does positive selection drive transcription factor binding site turnover? A test with Drosophila cis-regulatory modules. PLoS Genet. 2011, 7, e1002053. [Google Scholar] [CrossRef] [Green Version]
- Holloway, A.K.; Begun, D.J.; Siepel, A.; Pollard, K.S. Accelerated sequence divergence of conserved genomic elements in Drosophila melanogaster. Genome Res. 2008, 18, 1592–1601. [Google Scholar] [CrossRef] [Green Version]
- Macdonald, S.J.; Long, A.D. Fine scale structural variants distinguish the genomes of Drosophila melanogaster and D. pseudoobscura. Genome Biol. 2006, 7, R67. [Google Scholar] [CrossRef] [Green Version]
- Jiang, P.; Ludwig, M.Z.; Kreitman, M.; Reinitz, J. Natural variation of the expression pattern of the segmentation gene even-skipped in melanogaster. Dev. Biol. 2015, 405, 173–181. [Google Scholar] [CrossRef] [Green Version]
- Yang, B.; Wittkopp, P.J. Structure of the Transcriptional Regulatory Network Correlates with Regulatory Divergence in Drosophila. Mol. Biol. Evol. 2017, 34, 1352–1362. [Google Scholar] [CrossRef] [Green Version]
- Khoueiry, P.; Girardot, C.; Ciglar, L.; Peng, P.C.; Gustafson, E.H.; Sinha, S.; Furlong, E.E.M. Uncoupling evolutionary changes in DNA sequence, transcription factor occupancy and enhancer activity. Elife 2017, 6, e28440. [Google Scholar] [CrossRef] [PubMed]
- Wang, X.F.; Zhou, T.Y.; Wunderlich, Z.; Maurano, M.T.; DePace, A.H.; Nuzhdin, S.V.; Rohs, R. Analysis of Genetic Variation Indicates DNA Shape Involvement in Purifying Selection. Mol. Biol. Evol. 2018, 35, 1958–1967. [Google Scholar] [CrossRef] [PubMed]
- Peng, P.C.; Khoueiry, P.; Girardot, C.; Reddington, J.P.; Garfield, D.A.; Furlong, E.E.M.; Sinha, S. The Role of Chromatin Accessibility in cis-Regulatory Evolution. Genome Biol. Evol. 2019, 11, 1813–1828. [Google Scholar] [CrossRef] [PubMed] [Green Version]
- Benton, M.L.; Talipineni, S.C.; Kostka, D.; Capra, J.A. Genome-wide enhancer annotations differ significantly in genomic distribution, evolution, and function. BMC Genom. 2019, 20, 511. [Google Scholar] [CrossRef] [Green Version]
- Halfon, M.S. Studying Transcriptional Enhancers: The Founder Fallacy, Validation Creep, and Other Biases. Trends Genet. 2019, 35, 93–103. [Google Scholar] [CrossRef] [PubMed]
- Lindhorst, D.; Halfon, M.S. Reporter gene assays and chromatin-level assays define substantially non-overlapping sets of enhancer sequences. bioRxiv 2022. [Google Scholar] [CrossRef]
- Costa, M.; Reeve, S.; Grumbling, G.; Osumi-Sutherland, D. The Drosophila anatomy ontology. J. Biomed. Semant. 2013, 4, 32. [Google Scholar] [CrossRef] [Green Version]
- Ashburner, M.; Ball, C.A.; Blake, J.A.; Botstein, D.; Butler, H.; Cherry, J.M.; Davis, A.P.; Dolinski, K.; Dwight, S.S.; Eppig, J.T.; et al. Gene ontology: Tool for the unification of biology. The Gene Ontology Consortium. Nat. Genet. 2000, 25, 25–29. [Google Scholar] [CrossRef] [Green Version]
- Gremke, L.; Lord, P.C.; Sabacan, L.; Lin, S.C.; Wohlwill, A.; Storti, R.V. Coordinate regulation of Drosophila tropomyosin gene expression is controlled by multiple muscle-type-specific positive and negative enhancer elements. Dev. Biol. 1993, 159, 513–527. [Google Scholar] [CrossRef]
- Kent, W.J. BLAT--the BLAST-like alignment tool. Genome Res. 2002, 12, 656–664. [Google Scholar]
- Kent, W.J.; Sugnet, C.W.; Furey, T.S.; Roskin, K.M.; Pringle, T.H.; Zahler, A.M.; Haussler, D. The human genome browser at UCSC. Genome Res. 2002, 12, 996–1006. [Google Scholar] [CrossRef] [PubMed] [Green Version]
- Arnold, C.D.; Gerlach, D.; Stelzer, C.; Boryn, L.M.; Rath, M.; Stark, A. Genome-Wide Quantitative Enhancer Activity Maps Identified by STARR-seq. Science 2013, 339, 1074–1077. [Google Scholar] [CrossRef] [PubMed]
- Buenrostro, J.D.; Wu, B.; Litzenburger, U.M.; Ruff, D.; Gonzales, M.L.; Snyder, M.P.; Chang, H.Y.; Greenleaf, W.J. Single-cell chromatin accessibility reveals principles of regulatory variation. Nature 2015, 523, 486–490. [Google Scholar] [CrossRef]
- Larkin, A.; Marygold, S.J.; Antonazzo, G.; Attrill, H.; Dos Santos, G.; Garapati, P.V.; Goodman, J.L.; Gramates, L.S.; Millburn, G.; Strelets, V.B.; et al. FlyBase: Updates to the Drosophila melanogaster knowledge base. Nucleic Acids Res. 2021, 49, D899–D907. [Google Scholar] [CrossRef] [PubMed]
- Lyne, R.; Smith, R.; Rutherford, K.; Wakeling, M.; Varley, A.; Guillier, F.; Janssens, H.; Ji, W.; McLaren, P.; North, P.; et al. FlyMine: An integrated database for Drosophila and Anopheles genomics. Genome Biol. 2007, 8, R129. [Google Scholar] [CrossRef] [PubMed] [Green Version]


| Reporter Constructs (RCs) | 43,819 |
| From in vivo reporter genes | 21,690 |
| Associated with staging and other attributes | 17,961 |
| CRM_segments | 16 |
| Predicted CRMs (pCRMs) | 14,318 |
| Inferred CRMs (iCRMs) | 7760 |
| Transcription Factor Binding Sites (TFBS) | 2717 |
| Publications curated | 1366 |
Publisher’s Note: MDPI stays neutral with regard to jurisdictional claims in published maps and institutional affiliations. |
© 2022 by the authors. Licensee MDPI, Basel, Switzerland. This article is an open access article distributed under the terms and conditions of the Creative Commons Attribution (CC BY) license (https://creativecommons.org/licenses/by/4.0/).
Share and Cite
Keränen, S.V.E.; Villahoz-Baleta, A.; Bruno, A.E.; Halfon, M.S. REDfly: An Integrated Knowledgebase for Insect Regulatory Genomics. Insects 2022, 13, 618. https://doi.org/10.3390/insects13070618
Keränen SVE, Villahoz-Baleta A, Bruno AE, Halfon MS. REDfly: An Integrated Knowledgebase for Insect Regulatory Genomics. Insects. 2022; 13(7):618. https://doi.org/10.3390/insects13070618
Chicago/Turabian StyleKeränen, Soile V. E., Angel Villahoz-Baleta, Andrew E. Bruno, and Marc S. Halfon. 2022. "REDfly: An Integrated Knowledgebase for Insect Regulatory Genomics" Insects 13, no. 7: 618. https://doi.org/10.3390/insects13070618