
Metabolic Tolerance to Atmospheric Pressure of Two Freshwater Endemic Amphipods Mostly Inhabiting the Deep-Water Zone of the Ancient Lake Baikal

 , , , , , , , and
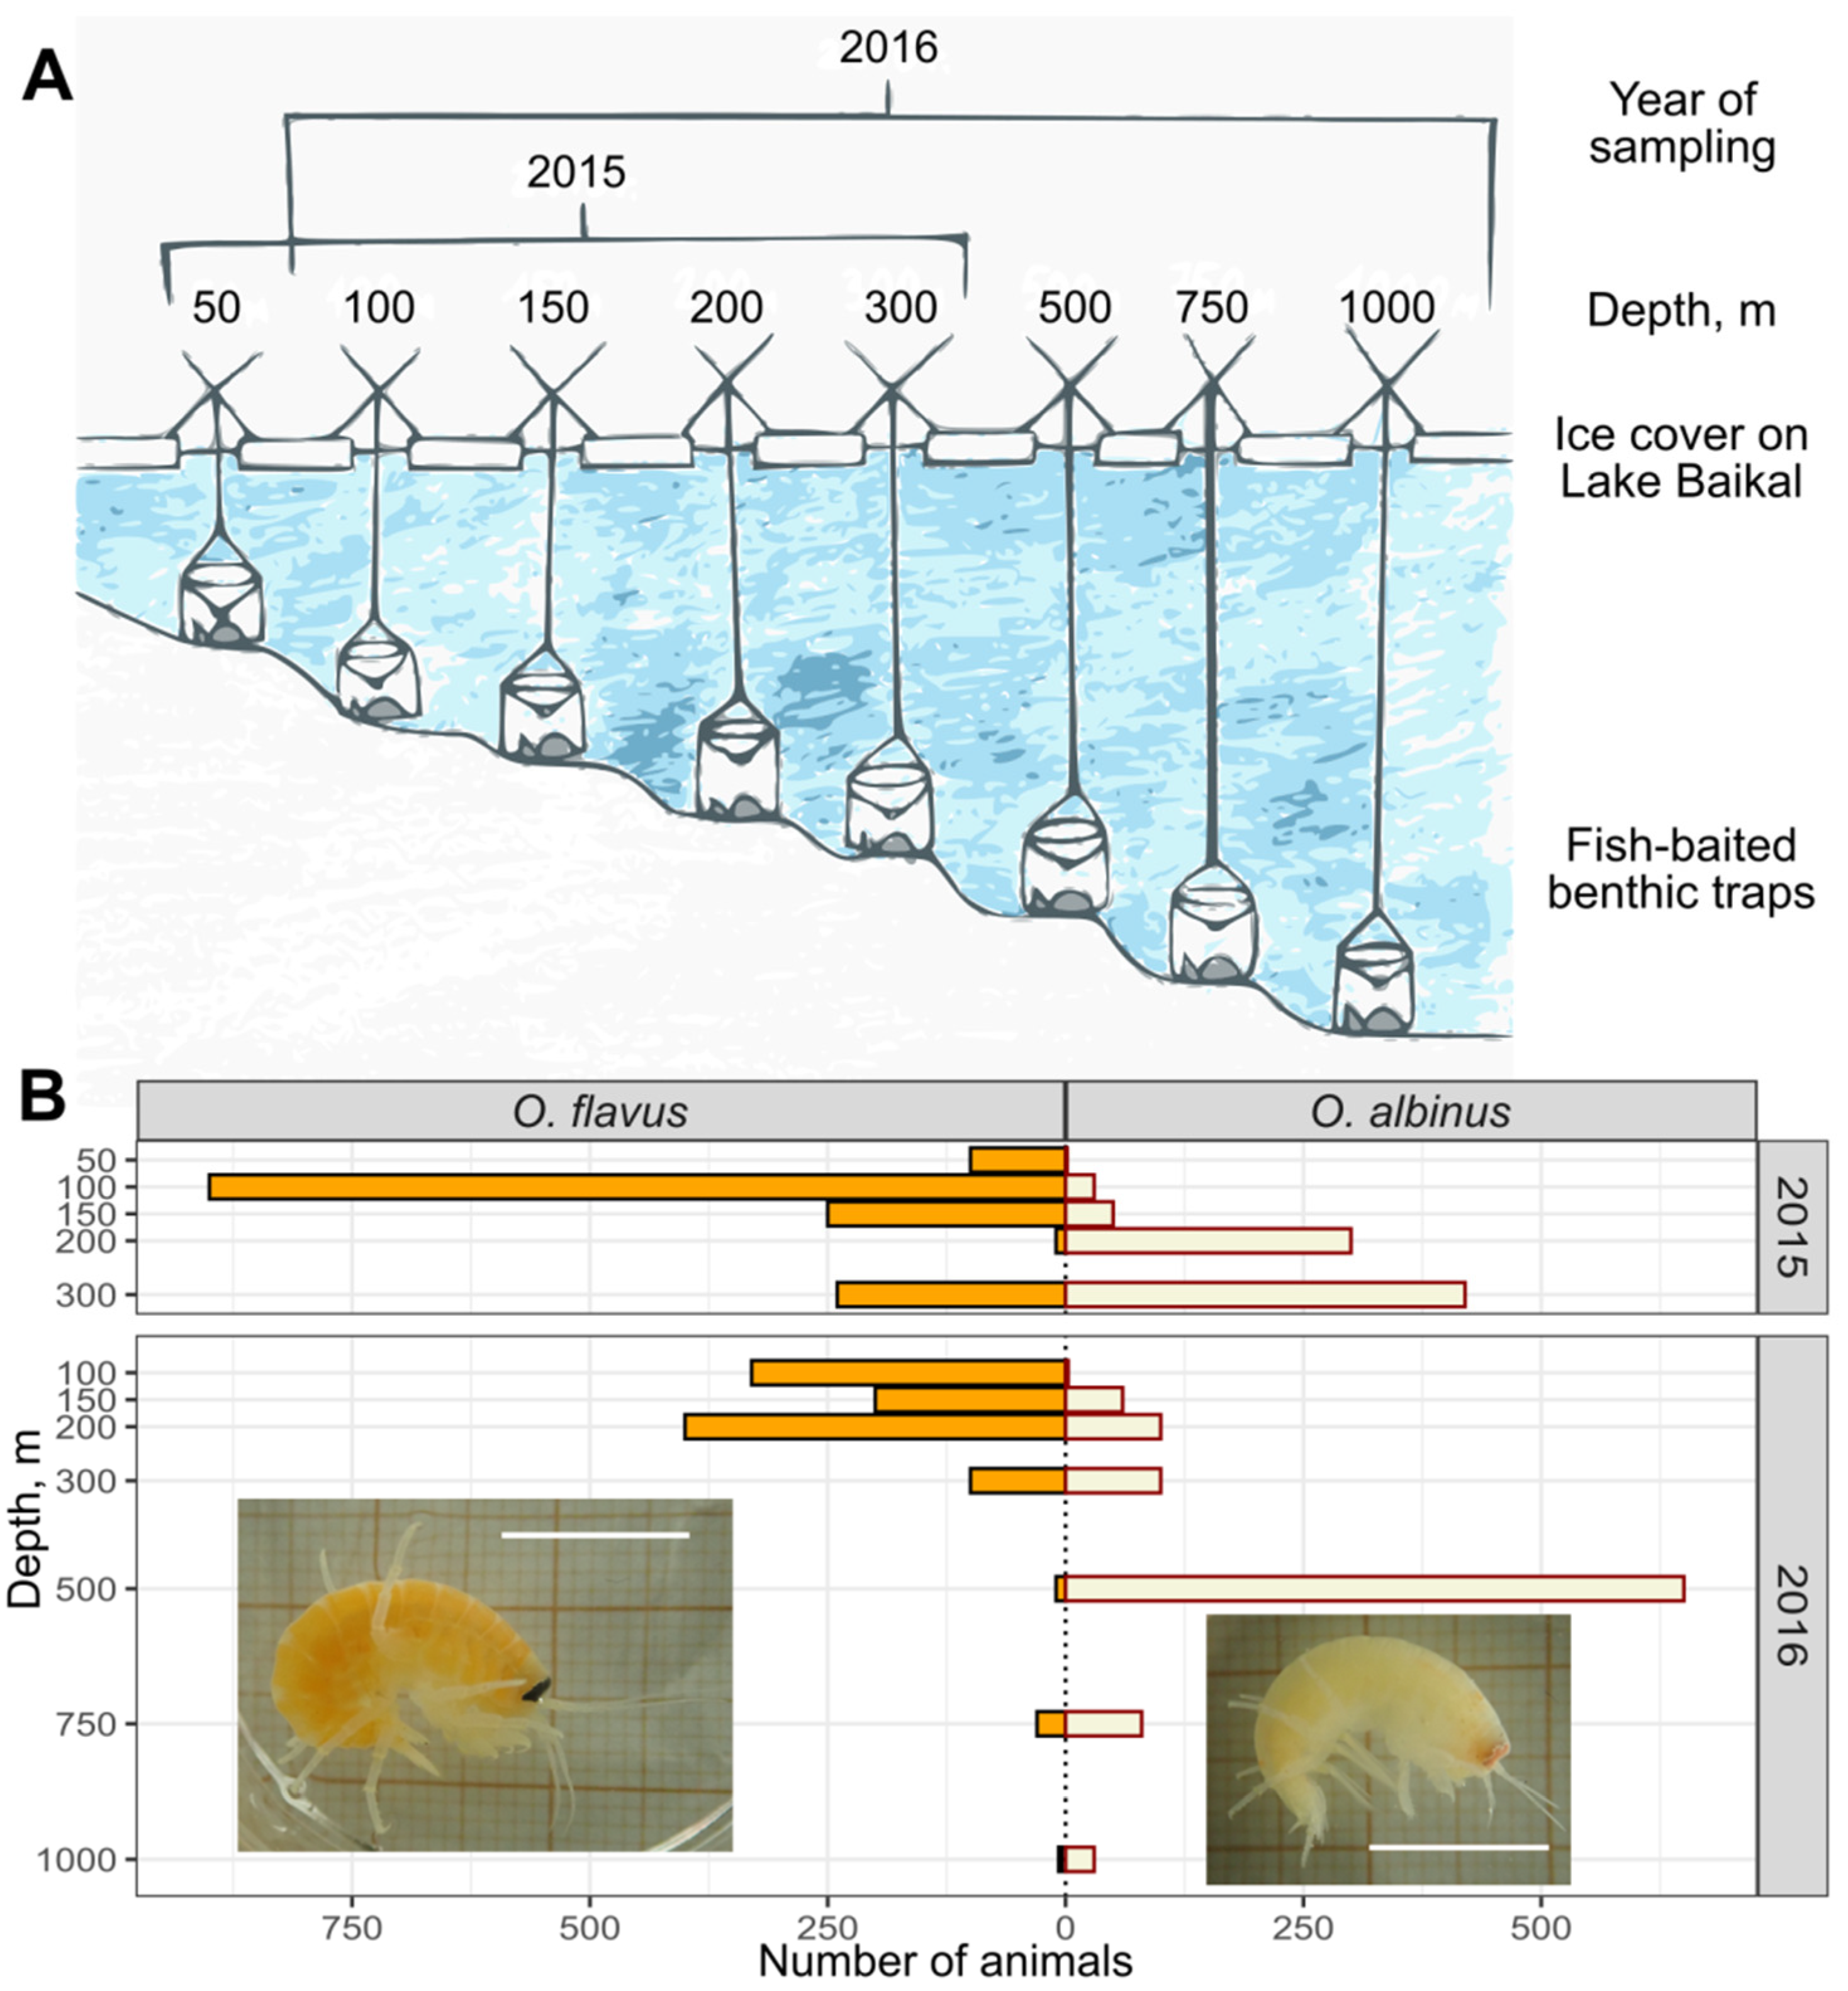
Abstract
:Simple Summary
Abstract
1. Introduction
2. Materials and Methods
2.1. Amphipod Sampling
2.2. Laboratory Acclimation
2.3. Sample Processing
2.4. Enzymatic Activities
2.5. Content of Lipid Peroxidation Products
2.6. Concentrations of Energy-Related Molecules
2.7. Data Analysis and Statistics
3. Results
3.1. Vertical Distribution of O. flavus and O. albinus
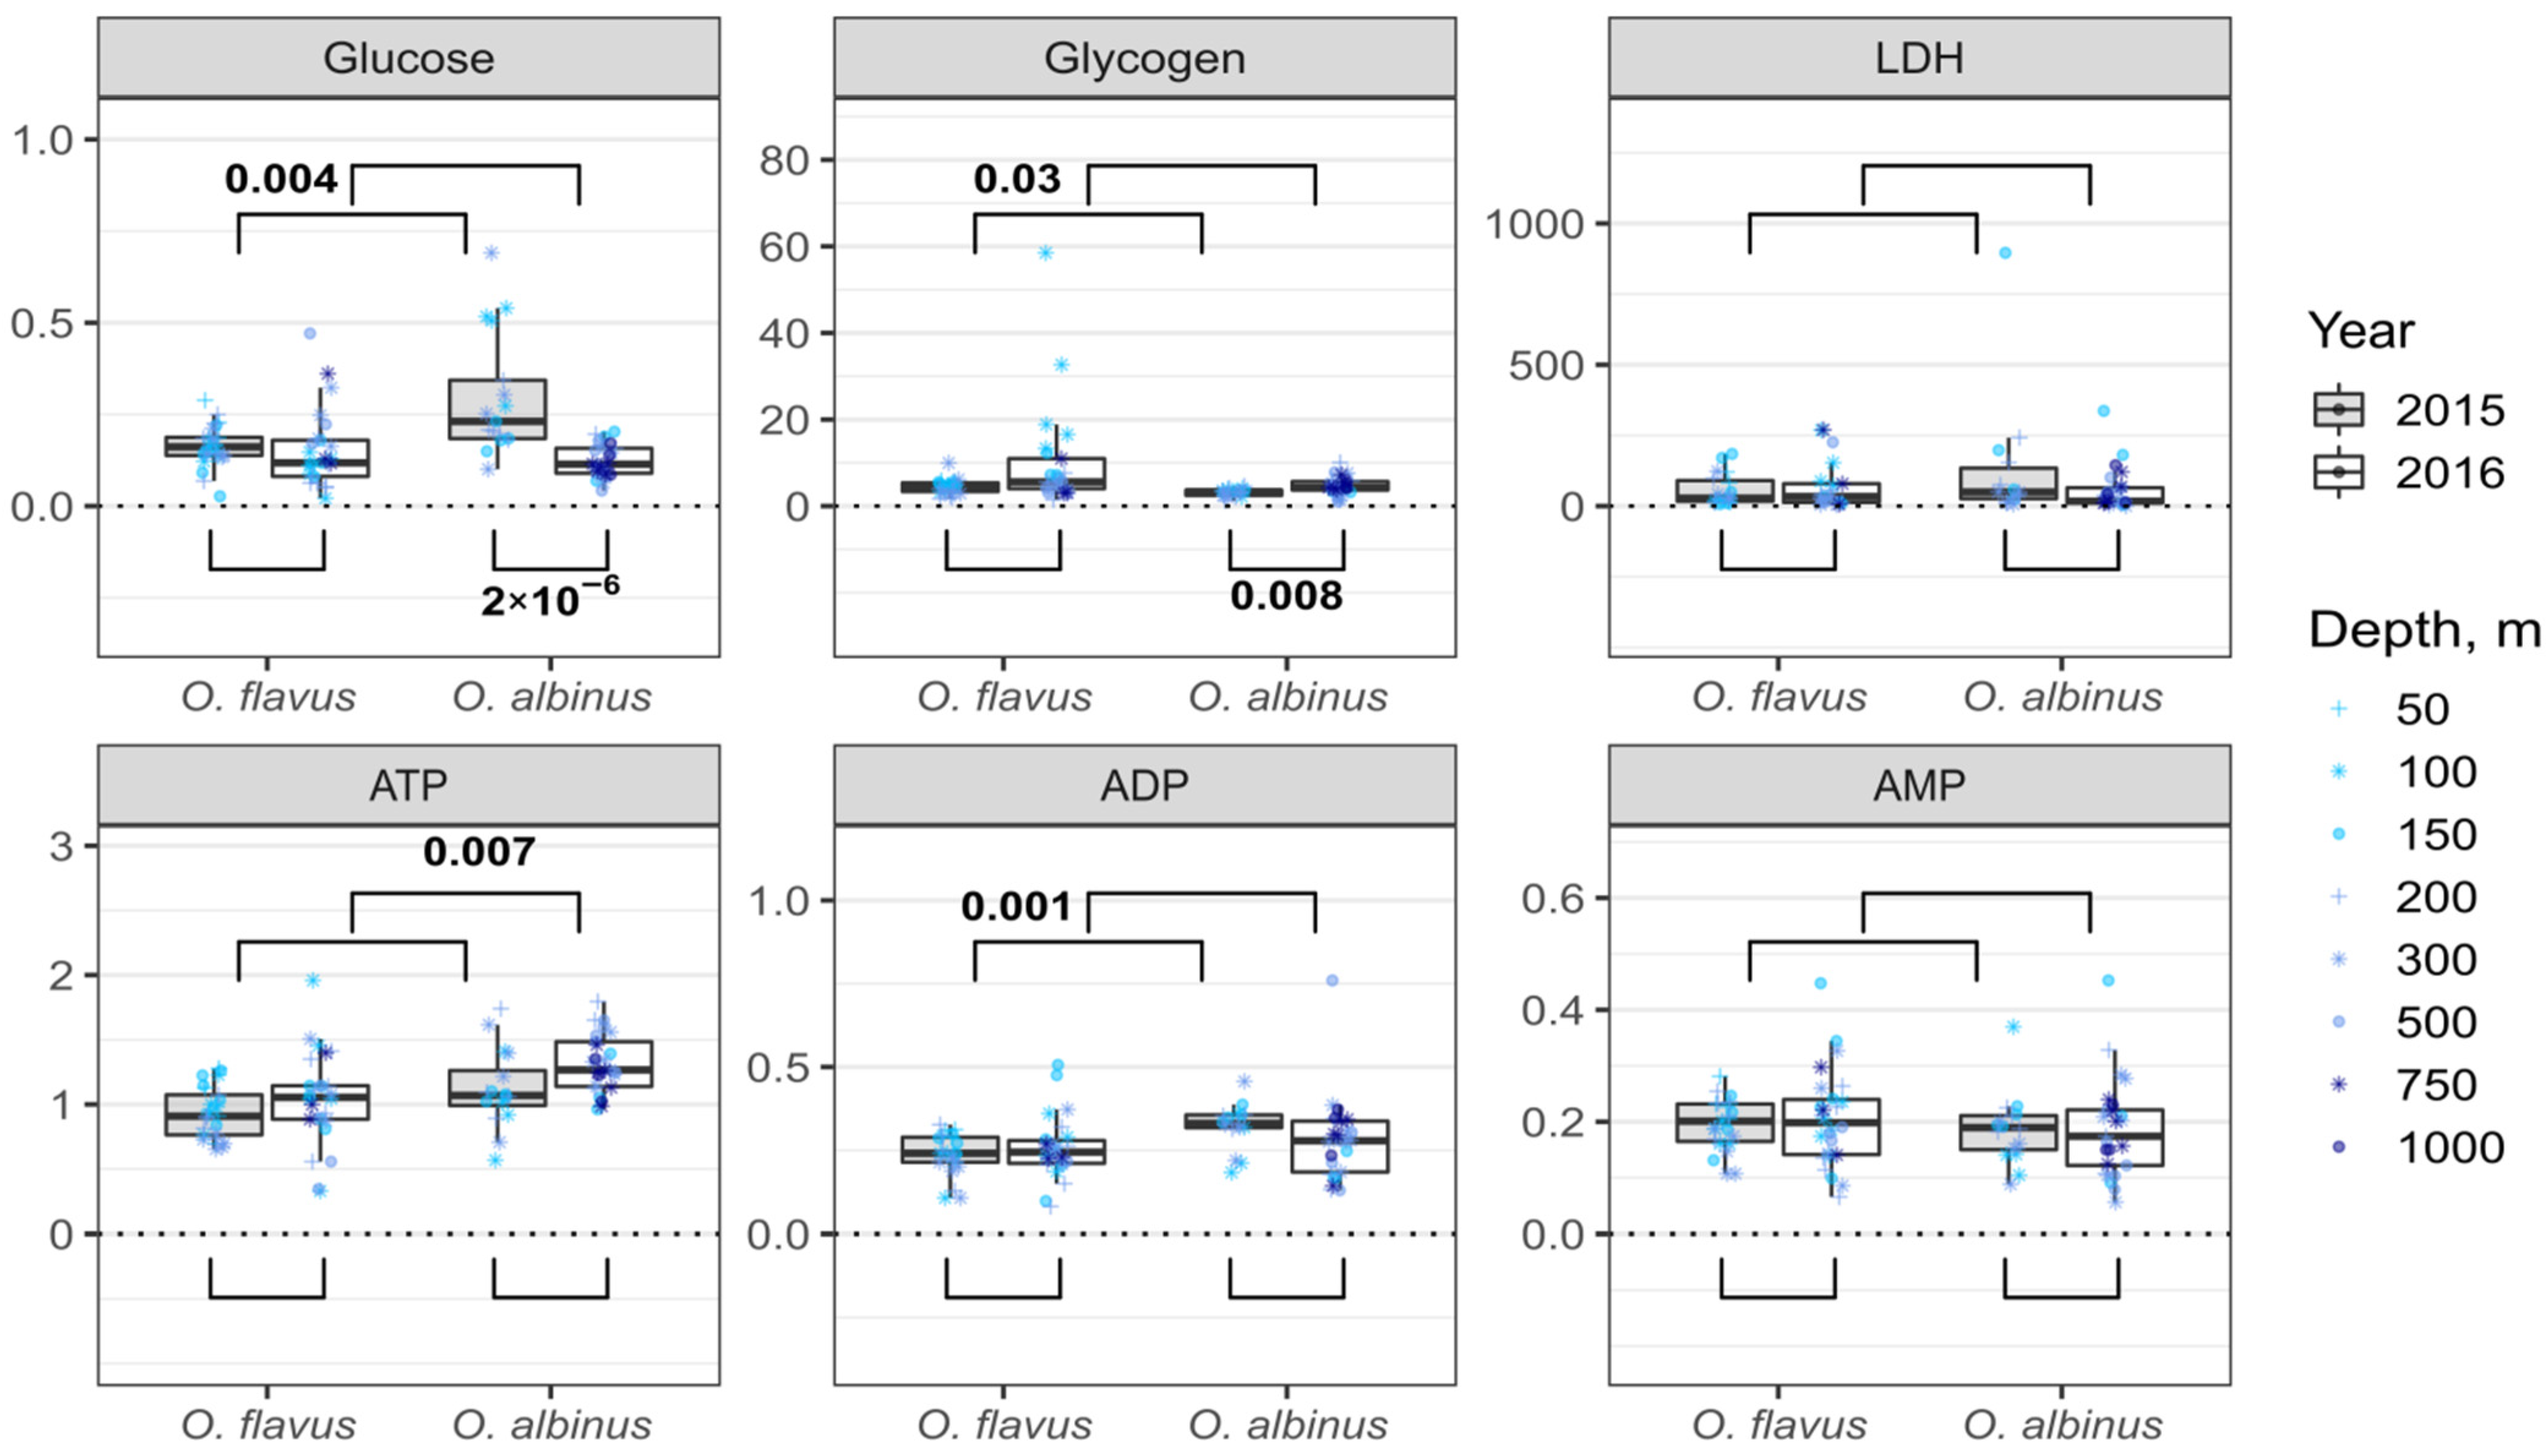
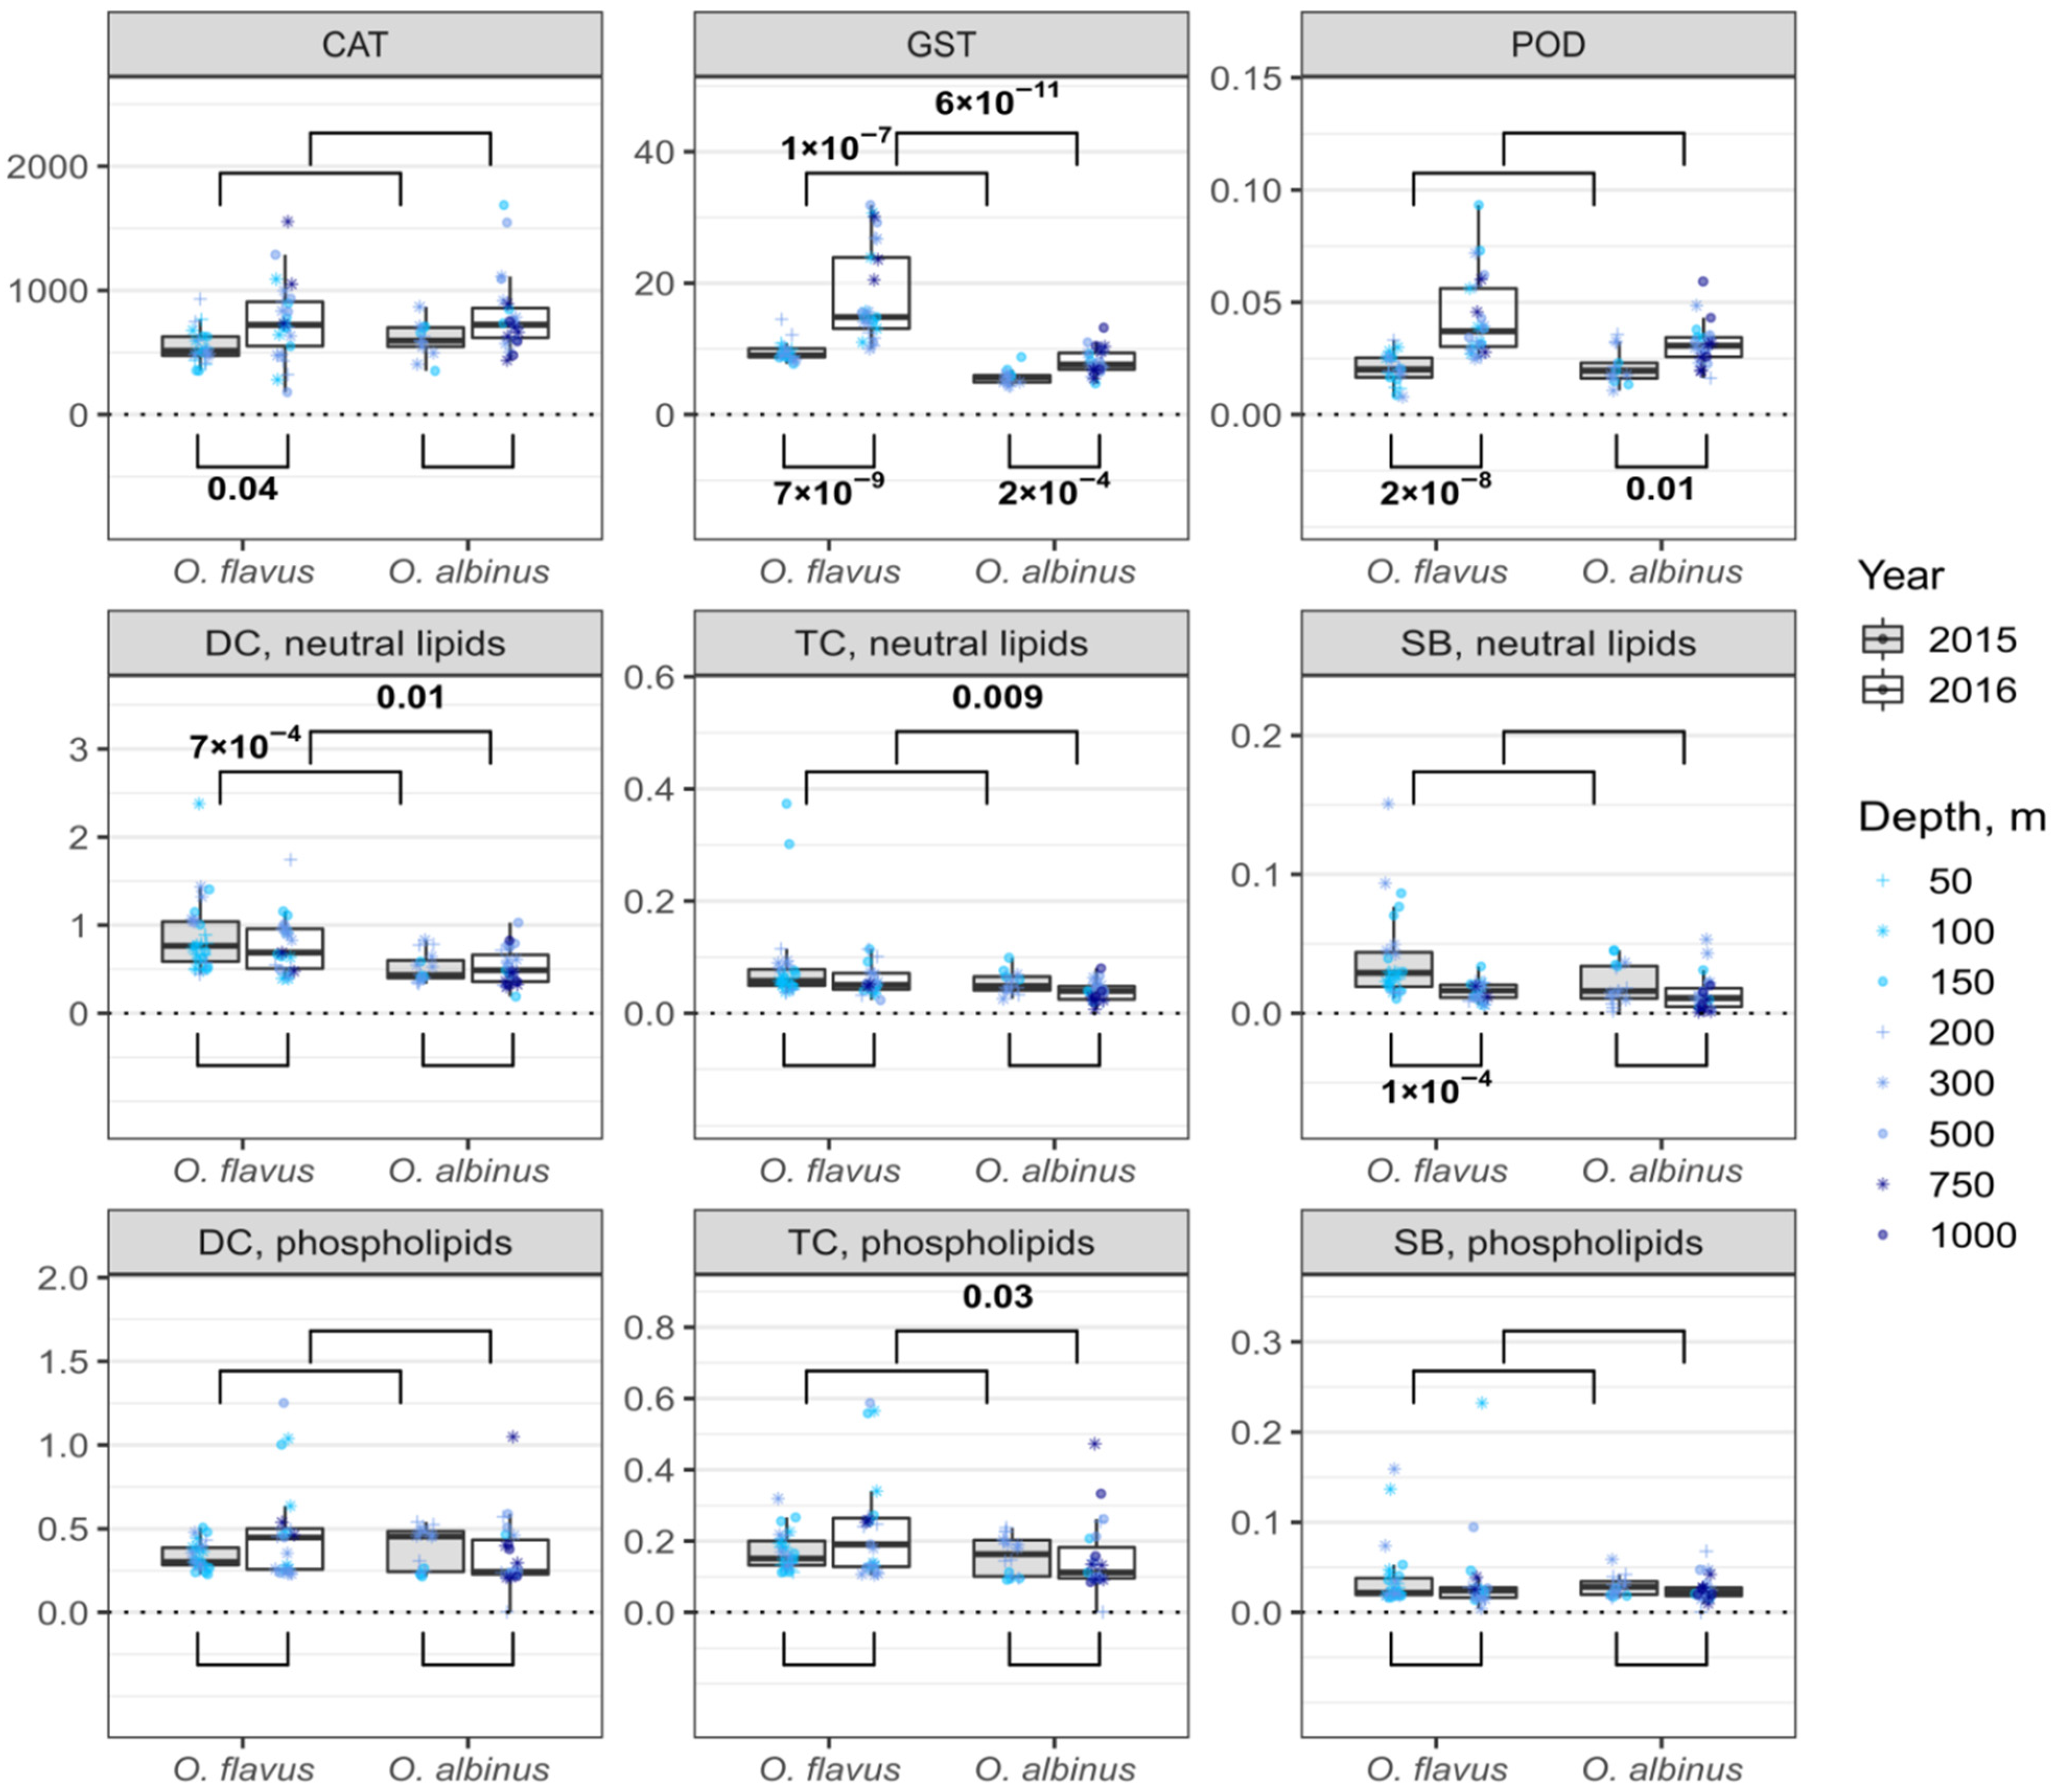
3.2. Variability of Biochemical Traits with Sampling Depth
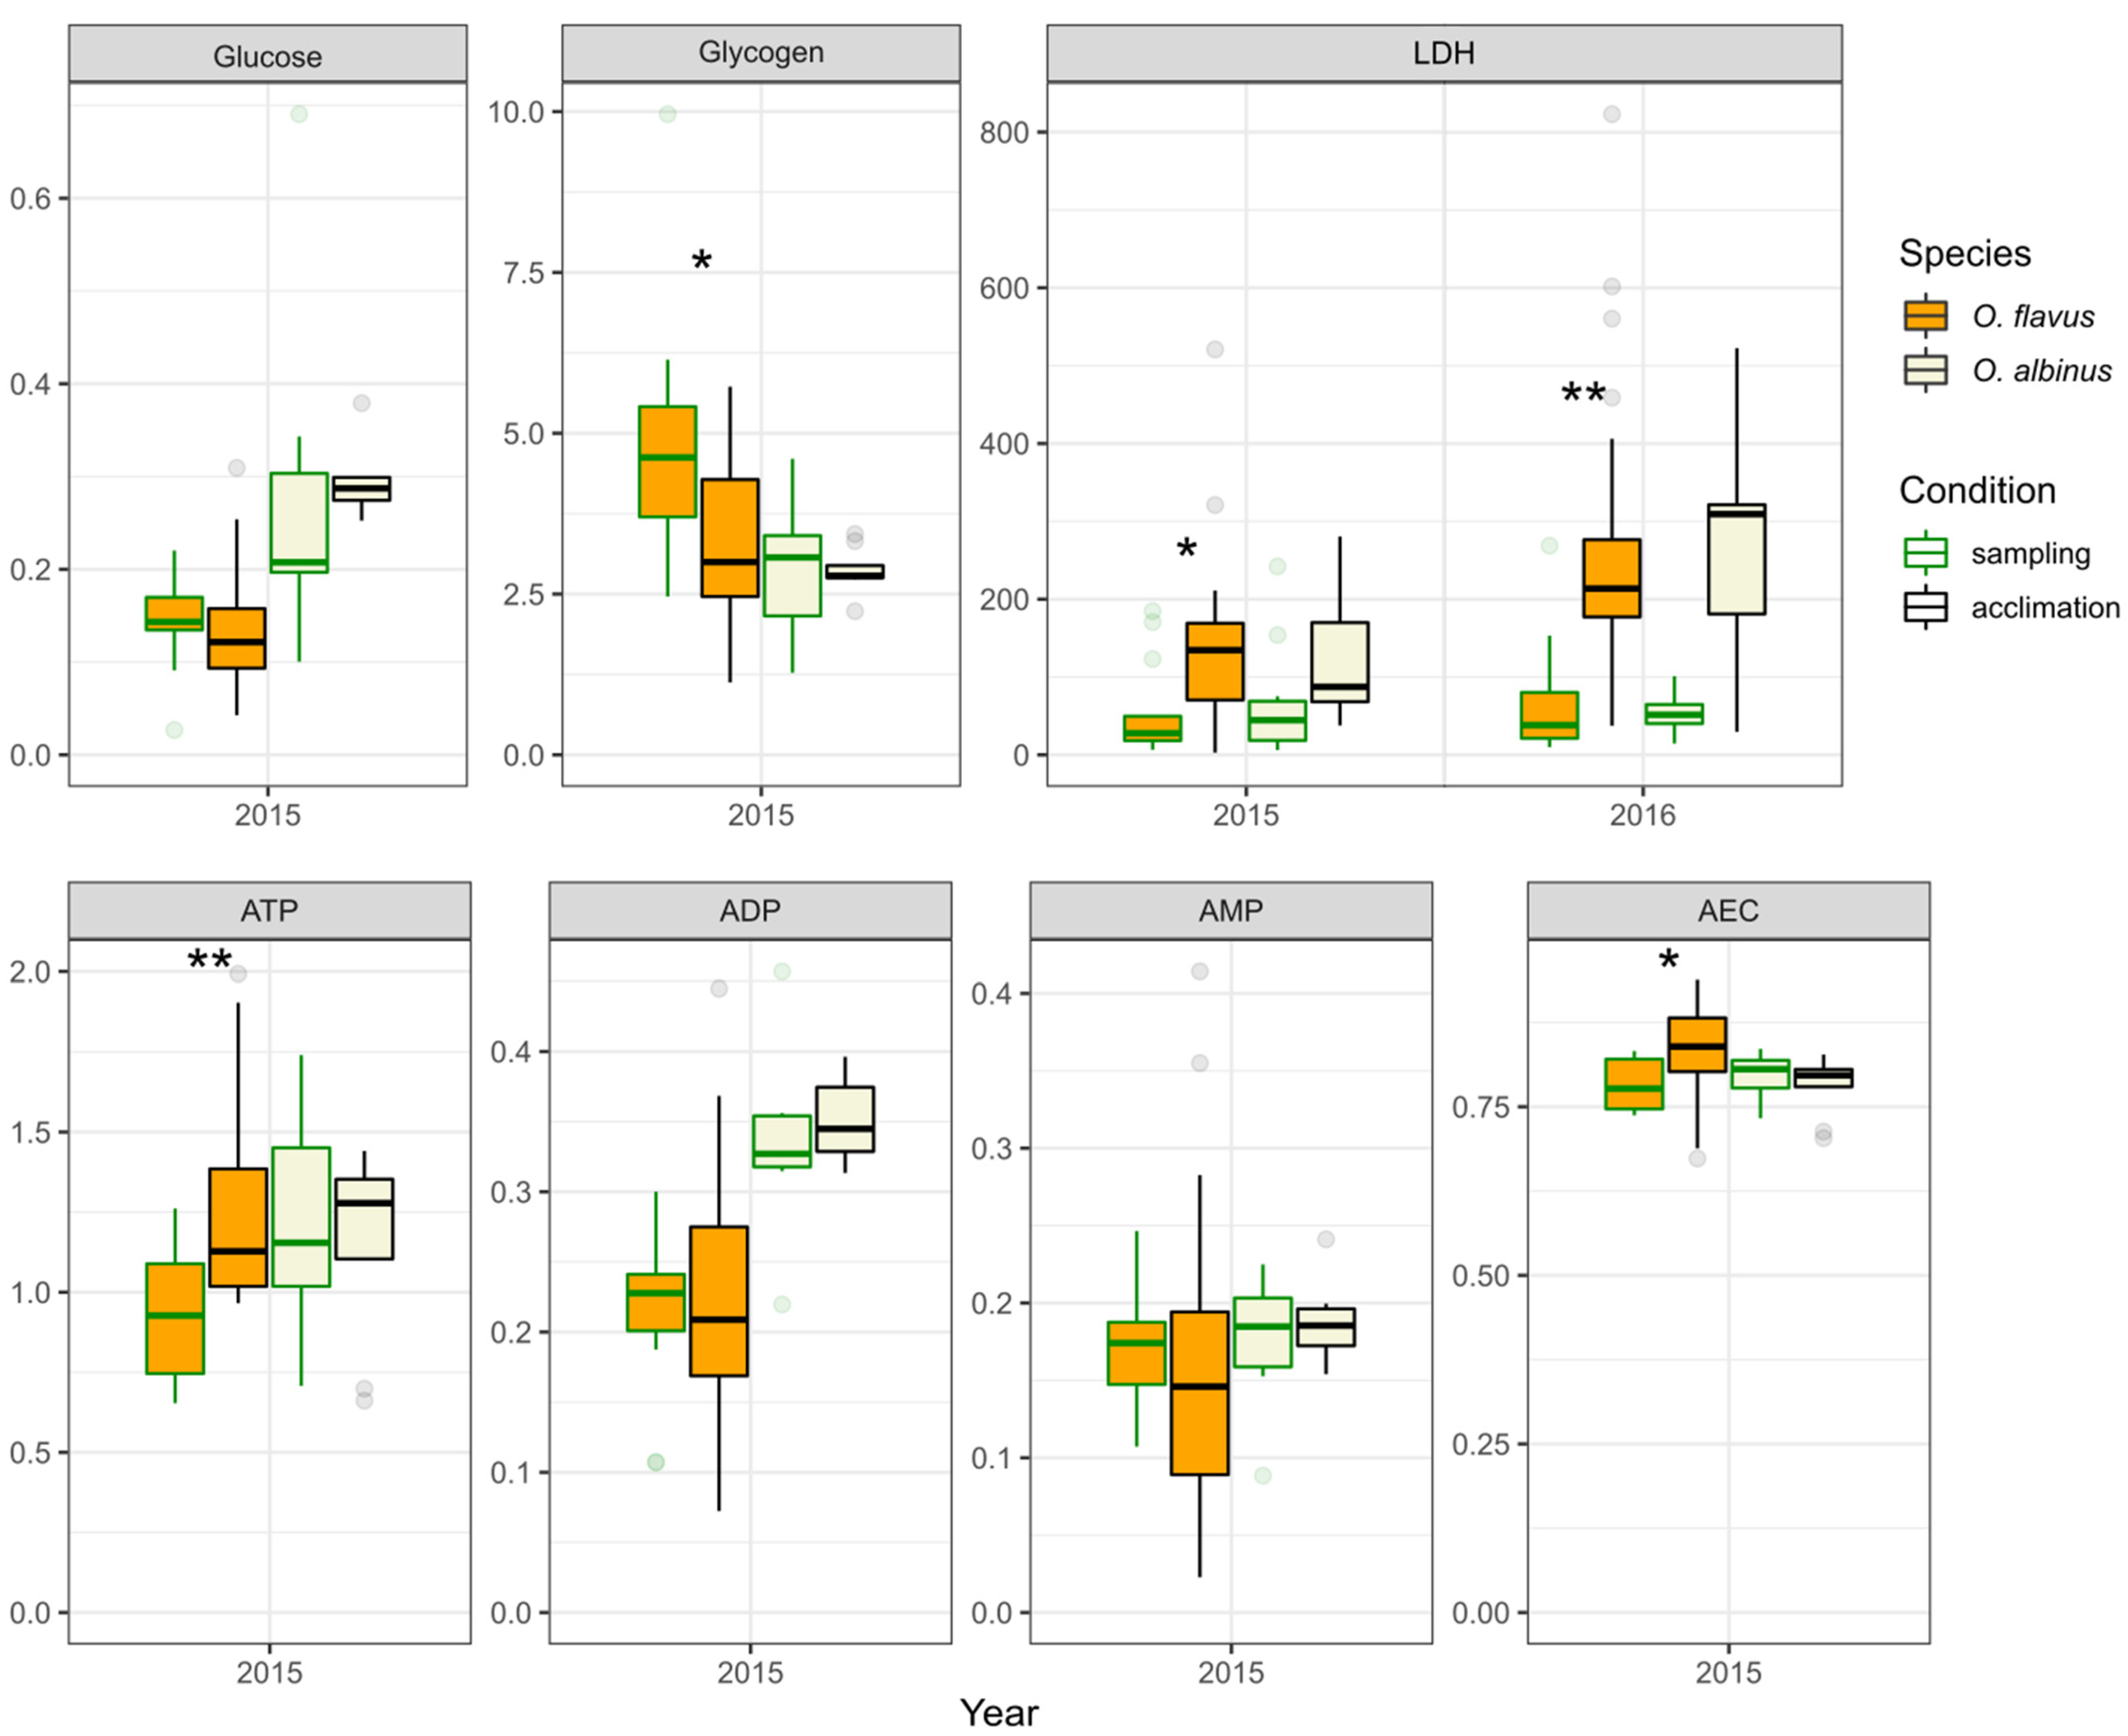
3.3. Interannual and Species-Specific Differences in Biochemical Traits
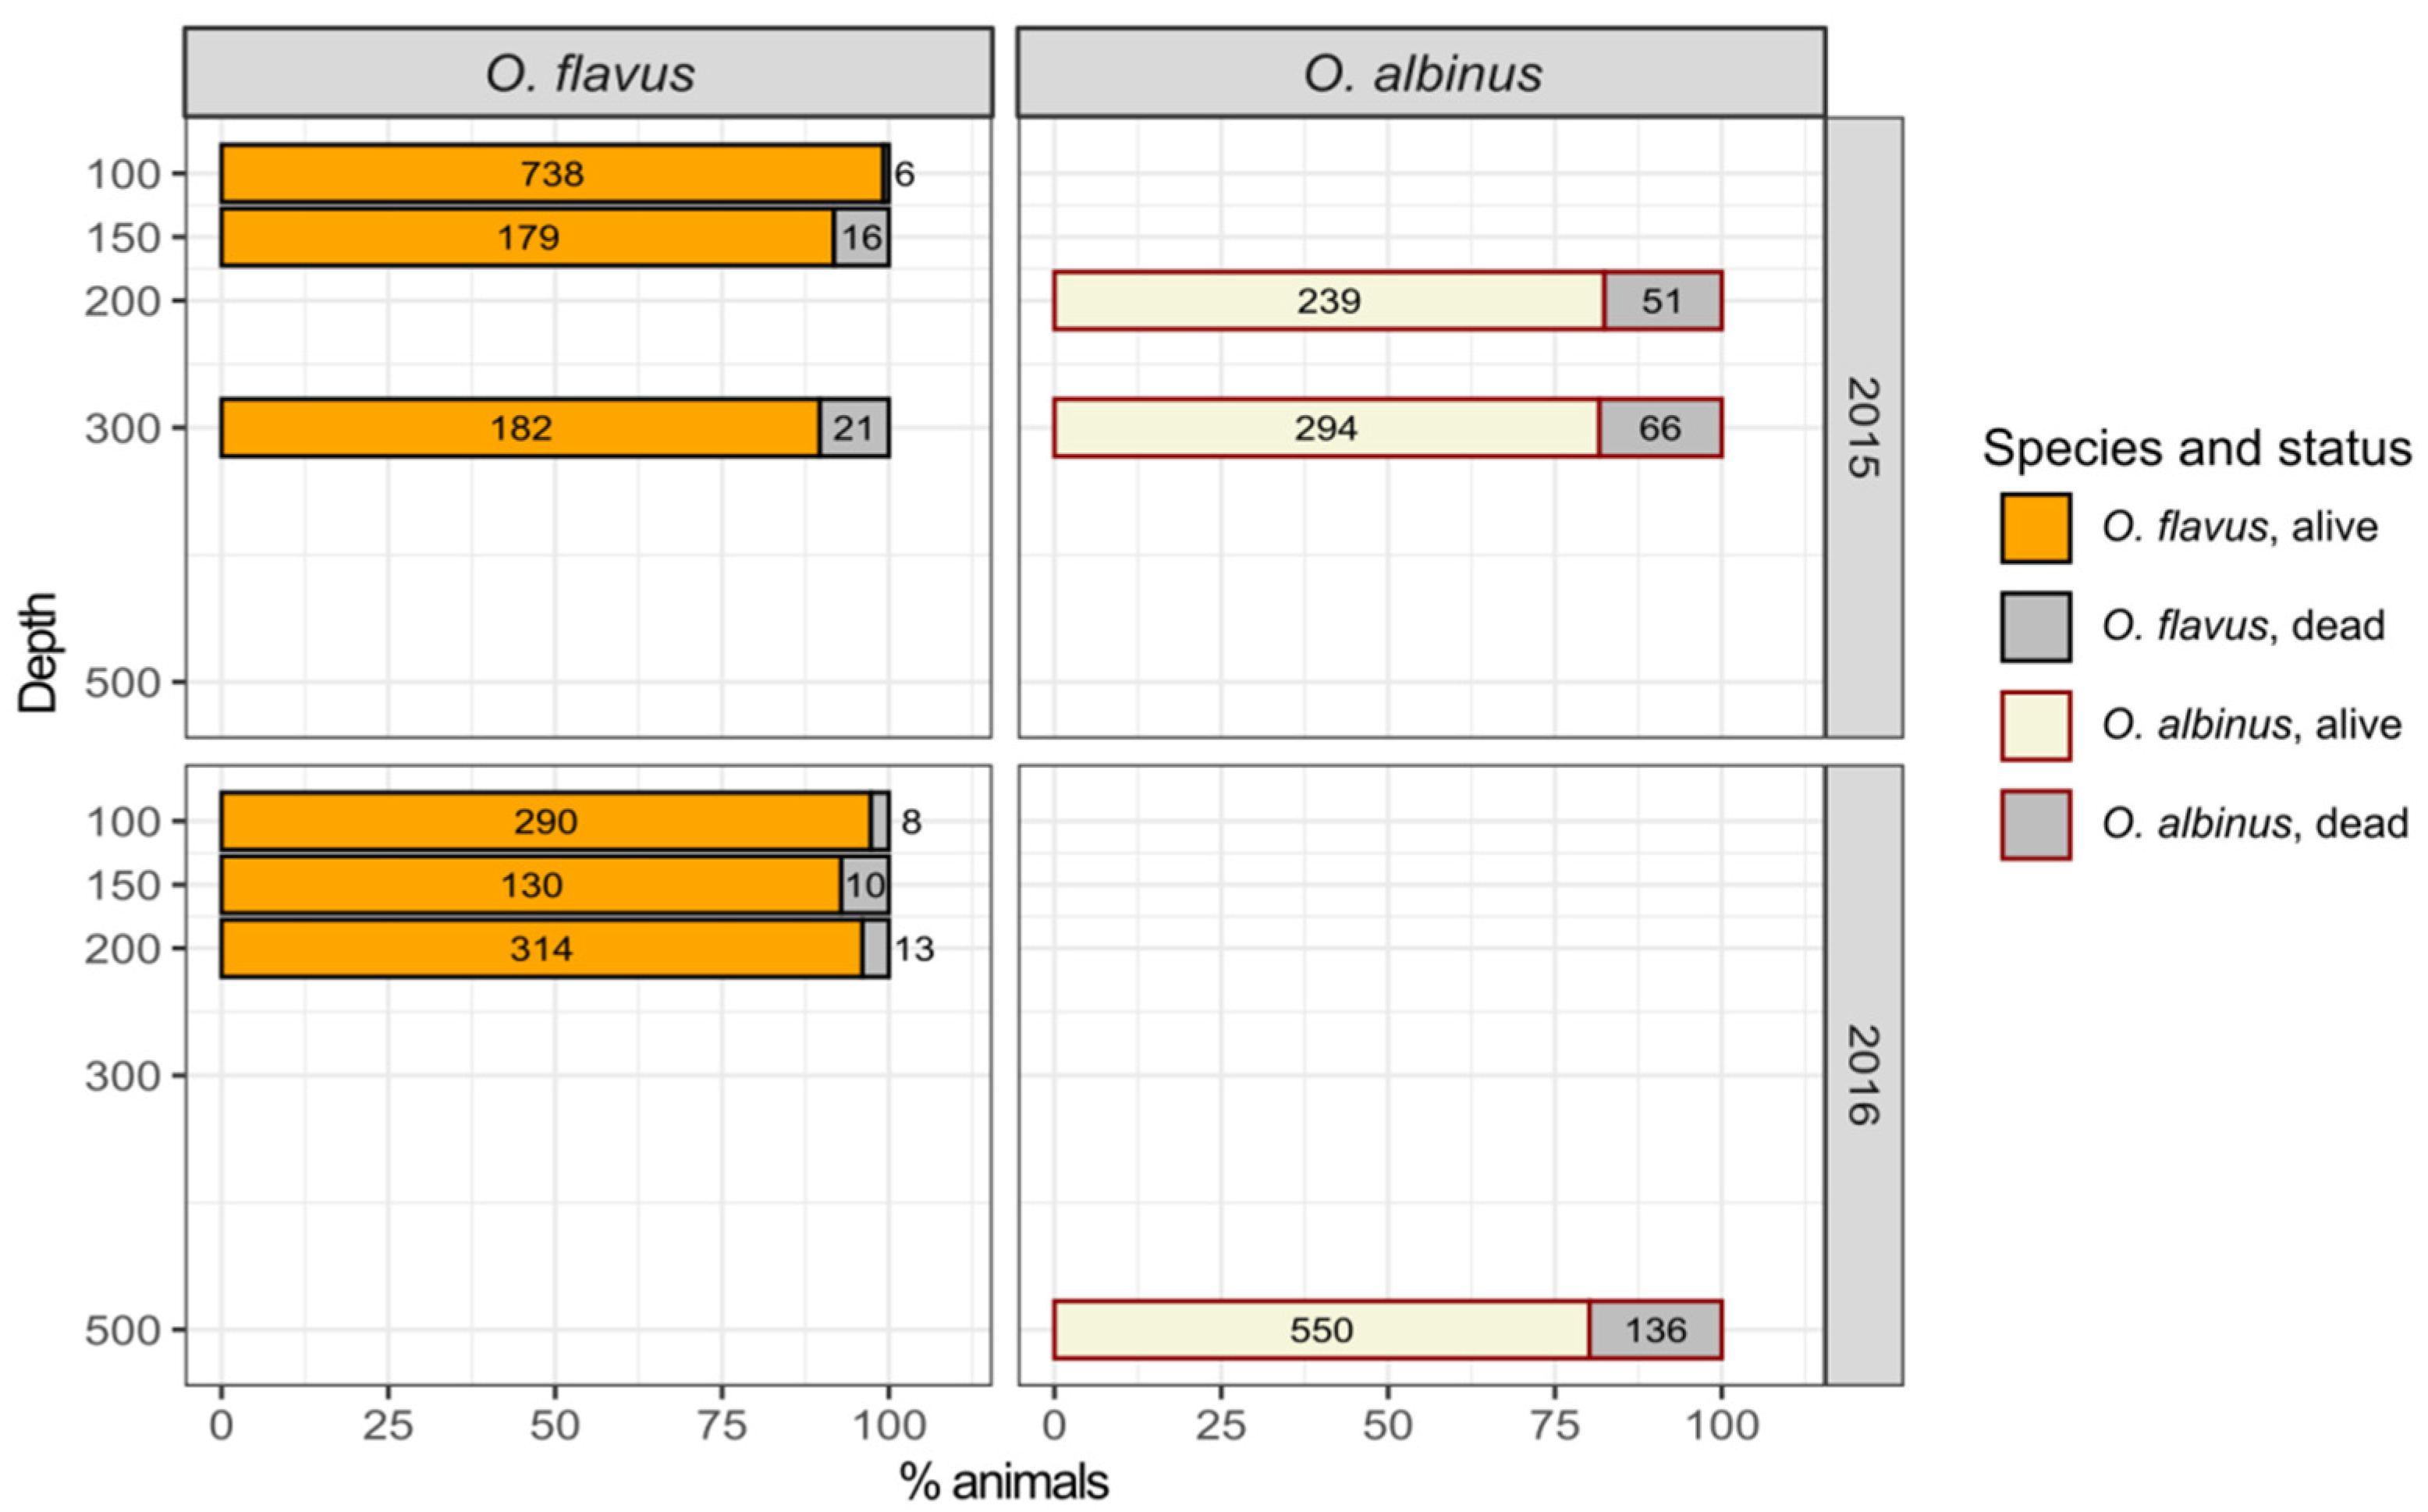
3.4. Survival during Laboratory Acclimation
3.5. Influence of Laboratory Acclimation on Biochemical Traits
4. Discussion
Supplementary Materials
Author Contributions
Funding
Institutional Review Board Statement
Informed Consent Statement
Data Availability Statement
Acknowledgments
Conflicts of Interest
References
- Levin, L.A.; Bett, B.J.; Gates, A.R. Global Observing Needs in the Deep Ocean. Front. Mar. Sci. 2019, 6, 1–32. [Google Scholar] [CrossRef]
- Mengerink, K.J.; Van Dover, C.L.; Ardron, J.; Baker, M.; Escobar-Briones, E.; Gjerde, K.; Koslow, J.A.; Ramirez-Llodra, E.; Lara-Lopez, A.; Squires, D. A Call for Deep-Ocean Stewardship. Science 2014, 344, 696–698. [Google Scholar] [CrossRef] [PubMed] [Green Version]
- Danovaro, R.; Corinaldesi, C.; Dell’Anno, A.; Snelgrove, P.V. The Deep-Sea under Global Change. Curr. Biol. 2017, 27, R461–R465. [Google Scholar] [CrossRef] [PubMed] [Green Version]
- Levin, L.A.; Le Bris, N. The Deep Ocean under Climate Change. Science 2015, 350, 766–768. [Google Scholar] [CrossRef] [Green Version]
- Brito-Morales, I.; Schoeman, D.S.; Molinos, J.G.; Burrows, M.T.; Klein, C.J.; Arafeh-Dalmau, N.; Kaschner, K.; Garilao, C.; Kesner-Reyes, K.; Richardson, A.J. Climate Velocity Reveals Increasing Exposure of Deep-Ocean Biodiversity to Future Warming. Nat. Clim. Chang. 2020, 10, 576–581. [Google Scholar] [CrossRef]
- Yancey, P.H. Cellular Responses in Marine Animals to Hydrostatic Pressure. J. Exp. Zool. Part Ecol. Integr. Physiol. 2020, 333, 398–420. [Google Scholar] [CrossRef]
- Macdonald, A. High-Pressure Equipment for Use in the Laboratory, at Sea and at Depth. In Life at High Pressure: In the Deep Sea and Other Environments; Macdonald, A., Ed.; Springer International Publishing: Cham, Germany, 2021; pp. 353–417. ISBN 978-3-030-67587-5. [Google Scholar]
- Treberg, J.R.; Speers-Roesch, B. Does the Physiology of Chondrichthyan Fishes Constrain Their Distribution in the Deep Sea? J. Exp. Biol. 2016, 219, 615–625. [Google Scholar] [CrossRef] [Green Version]
- Brown, A.; Thatje, S. Explaining Bathymetric Diversity Patterns in Marine Benthic Invertebrates and Demersal Fishes: Physiological Contributions to Adaptation of Life at Depth. Biol. Rev. 2014, 89, 406–426. [Google Scholar] [CrossRef]
- Somero, G.N. Biochemical Ecology of Deep-Sea Animals. Experientia 1992, 48, 537–543. [Google Scholar] [CrossRef]
- Havermans, C.; Smetacek, V. Bottom-up and Top-down Triggers of Diversification: A New Look at the Evolutionary Ecology of Scavenging Amphipods in the Deep Sea. Prog. Oceanogr. 2018, 164, 37–51. [Google Scholar] [CrossRef]
- Copilaş-Ciocianu, D.; Borko, Š.; Fišer, C. The Late Blooming Amphipods: Global Change Promoted Post-Jurassic Ecological Radiation despite Palaeozoic Origin. Mol. Phylogenet. Evol. 2020, 143, 106664. [Google Scholar] [CrossRef] [PubMed]
- Havermans, C.; Nagy, Z.T.; Sonet, G.; De Broyer, C.; Martin, P. Incongruence between Molecular Phylogeny and Morphological Classification in Amphipod Crustaceans: A Case Study of Antarctic Lysianassoids. Mol. Phylogenet. Evol. 2010, 55, 202–209. [Google Scholar] [CrossRef] [PubMed]
- Corrigan, L.J.; Horton, T.; Fotherby, H.; White, T.A.; Hoelzel, A.R. Adaptive Evolution of Deep-Sea Amphipods from the Superfamily Lysiassanoidea in the North Atlantic. Evol. Biol. 2014, 41, 154–165. [Google Scholar] [CrossRef] [Green Version]
- Martens, K. Speciation in Ancient Lakes. Trends Ecol. Evol. 1997, 12, 177–182. [Google Scholar] [CrossRef]
- Timoshkin, O.A. Lake Baikal: Diversity of Fauna, Problems of Its Immiscibility and Origin, Ecology and “Exotic” Communities. Index Anim. Species Inhabiting Lake Baikal Its Catchment Area 2001, 1, 74–113. [Google Scholar]
- Takhteev, V.V. Trends in the Evolution of Baikal Amphipods and Evolutionary Parallels with Some Marine Malacostracan Faunas. Adv. Ecol. Res. 2000, 31, 197–220. [Google Scholar]
- Naumenko, S.A.; Logacheva, M.D.; Popova, N.V.; Klepikova, A.V.; Penin, A.A.; Bazykin, G.A.; Etingova, A.E.; Mugue, N.S.; Kondrashov, A.S.; Yampolsky, L.Y. Transcriptome-Based Phylogeny of Endemic Lake Baikal Amphipod Species Flock: Fast Speciation Accompanied by Frequent Episodes of Positive Selection. Mol. Ecol. 2017, 26, 536–553. [Google Scholar] [CrossRef] [PubMed]
- Hou, Z.; Sket, B. A Review of Gammaridae (Crustacea: Amphipoda): The Family Extent, Its Evolutionary History, and Taxonomic Redefinition of Genera. Zool. J. Linn. Soc. 2016, 176, 323–348. [Google Scholar] [CrossRef] [Green Version]
- Mats, V.D.; Shcherbakov, D.Y.; Efimova, I.M. Late Cretaceous-Cenozoic History of the Lake Baikal Depression and Formation of Its Unique Biodiversity. Stratigr. Geol. Correl. 2011, 19, 404–423. [Google Scholar] [CrossRef]
- Kniesz, K.; Jazdzewska, A.; Martinez Arbizu, P.; Kihara, T. DNA Barcoding of Scavenging Amphipod Communities at Active and Inactive Hydrothermal Vents in the Indian Ocean. Front. Mar. Sci. 2022, 8, 752360. [Google Scholar] [CrossRef]
- Bazikalova, A.Y. Amphipods of Lake Baikal. Proc. Baikal Limnol. Stn. 1945, 11, 1–440. [Google Scholar]
- Axenov-Gribanov, D.; Bedulina, D.; Shatilina, Z.; Jakob, L.; Vereshchagina, K.; Lubyaga, Y.; Gurkov, A.; Shchapova, E.; Luckenbach, T.; Lucassen, M. Thermal Preference Ranges Correlate with Stable Signals of Universal Stress Markers in Lake Baikal Endemic and Holarctic Amphipods. PLoS ONE 2016, 11, e0164226. [Google Scholar] [CrossRef] [PubMed] [Green Version]
- Takhteev, V.V. Deep-water amphipods of Lake Baikal collected using Pisces-class deep submergence vehicles. Baikal Zool. J. 2009, 2, 13–16. (In Russian) [Google Scholar]
- Bal, A.; Panda, F.; Pati, S.G.; Das, K.; Agrawal, P.K.; Paital, B. Modulation of Physiological Oxidative Stress and Antioxidant Status by Abiotic Factors Especially Salinity in Aquatic Organisms. Comp. Biochem. Physiol. Part C Toxicol. Pharmacol. 2021, 241, 108971. [Google Scholar] [CrossRef]
- Frías-Espericueta, M.G.; Bautista-Covarrubias, J.C.; Osuna-Martínez, C.C.; Delgado-Alvarez, C.; Bojórquez, C.; Aguilar-Juárez, M.; Roos-Muñoz, S.; Osuna-López, I.; Páez-Osuna, F. Metals and Oxidative Stress in Aquatic Decapod Crustaceans: A Review with Special Reference to Shrimp and Crabs. Aquat. Toxicol. 2022, 242, 106024. [Google Scholar] [CrossRef]
- la Fuente, I.M.D.; Cortés, J.M.; Valero, E.; Desroches, M.; Rodrigues, S.; Malaina, I.; Martínez, L. On the Dynamics of the Adenylate Energy System: Homeorhesis vs. Homeostasis. PLoS ONE 2014, 9, e108676. [Google Scholar] [CrossRef] [Green Version]
- Sokolova, I.M. Energy-Limited Tolerance to Stress as a Conceptual Framework to Integrate the Effects of Multiple Stressors. Integr. Comp. Biol. 2013, 53, 597–608. [Google Scholar] [CrossRef] [Green Version]
- Koukourakis, M.I.; Giatromanolaki, A. Warburg Effect, Lactate Dehydrogenase, and Radio/Chemo-Therapy Efficacy. Int. J. Radiat. Biol. 2019, 95, 408–426. [Google Scholar] [CrossRef]
- Shimaraev, M.N.; Verbolov, V.I. Water Temperature and Circulation. In Lake Baikal Evolution and Biodiversity; Kozhova, O.M., Izmesteva, L.R., Eds.; Backhuys Publishers: Leiden, The Netherlands, 1998; pp. 26–44. [Google Scholar]
- Shimaraev, M.N.; Domysheva, V.M. Trends in Hydrological and Hydrochemical Processes in Lake Baikal under Conditions of Modern Climate Change. In Climatic Change and Global Warming of Inland Waters: Impacts and Mitigation for Ecosystems and Societies; John Wiley & Sons, Ltd.: Hoboken, NJ, USA, 2013; pp. 43–66. [Google Scholar]
- Aebi, H. Catalase in Vitro. In Methods in Enzymology; Elsevier: Amsterdam, The Netherlands, 1984; Volume 105, pp. 121–126. [Google Scholar]
- Drotar, A.; Phelps, P.; Fall, R. Evidence for Glutathione Peroxidase Activities in Cultured Plant Cells. Plant Sci. 1985, 42, 35–40. [Google Scholar] [CrossRef]
- Habig, W.H.; Pabst, M.J.; Fleischner, G.; Gatmaitan, Z.; Arias, I.M.; Jakoby, W.B. The Identity of Glutathione S-Transferase B with Ligandin, a Major Binding Protein of Liver. Proc. Natl. Acad. Sci. USA 1974, 71, 3879–3882. [Google Scholar] [CrossRef] [Green Version]
- Bradford, M.M. A Rapid and Sensitive Method for the Quantitation of Microgram Quantities of Protein Utilizing the Principle of Protein-Dye Binding. Anal. Biochem. 1976, 72, 248–254. [Google Scholar] [CrossRef]
- Khyshiktuev, B.S.; Khyshiktueva, N.A.; Ivanov, V.N. Methods of measuring lipid peroxidation products in exhaled air condensate and their clinical significance. Klin. Lab. Diagn. 1996, 3, 13–15. (In Russian) [Google Scholar]
- Vereshchagina, K.; Kondrateva, E.; Axenov-Gribanov, D.; Shatilina, Z.; Khomich, A.; Bedulina, D.; Zadereev, E.; Timofeyev, M. Nonspecific Stress Response to Temperature Increase in Gammarus Lacustris Sars with Respect to Oxygen-Limited Thermal Tolerance Concept. PeerJ 2018, 6, e5571. [Google Scholar] [CrossRef] [Green Version]
- Keppler, D.; Decker, K. Glycogen: Metabolites and Carbohydrates. Methods Enzym. Anal. 1984, 4, 11–18. [Google Scholar]
- Ivanina, A.V.; Froelich, B.; Williams, T.; Sokolov, E.P.; Oliver, J.D.; Sokolova, I.M. Interactive Effects of Cadmium and Hypoxia on Metabolic Responses and Bacterial Loads of Eastern Oysters Crassostrea Virginica Gmelin. Chemosphere 2011, 82, 377–389. [Google Scholar] [CrossRef] [PubMed]
- Grieshaber, M.K.; Hardewig, I.; Kreutzer, U.; Pörtner, H.-O. Physiological and Metabolic Responses to Hypoxia in Invertebrates. Rev. Physiol. Biochem. Pharmacol. 1993, 125, 43–147. [Google Scholar]
- Ivanina, A.V.; Sokolov, E.P.; Sokolova, I.M. Effects of Cadmium on Anaerobic Energy Metabolism and MRNA Expression during Air Exposure and Recovery of an Intertidal Mollusk Crassostrea Virginica. Aquat. Toxicol. 2010, 99, 330–342. [Google Scholar] [CrossRef]
- Sokolova, I.M.; Frederich, M.; Bagwe, R.; Lannig, G.; Sukhotin, A.A. Energy Homeostasis as an Integrative Tool for Assessing Limits of Environmental Stress Tolerance in Aquatic Invertebrates. Mar. Environ. Res. 2012, 79, 1–15. [Google Scholar] [CrossRef]
- Atkinson, D.E. Energy Charge of the Adenylate Pool as a Regulatory Parameter. Interaction with Feedback Modifiers. Biochemistry 1968, 7, 4030–4034. [Google Scholar] [CrossRef]
- R Core Team. R: A Language and Environment for Statistical Computing; R Foundation for Statistical Computing: Vienna, Austria, 2022. [Google Scholar]
- Wickham, H. ggplot2: Elegant Graphics for Data Analysis; Springer: Berlin/Heidelberg, Germany, 2016. [Google Scholar]
- Kassambara, A. ggpubr: ‘ggplot2’ based Publication Ready Plots. R Package Version 0.4.0. 2020. Available online: https://CRAN.R-project.org/package=ggpubr (accessed on 22 January 2021).
- Lu, Y.; Wang, F.; Dong, S. Energy Response of Swimming Crab Portunus Trituberculatus to Thermal Variation: Implication for Crab Transport Method. Aquaculture 2015, 441, 64–71. [Google Scholar] [CrossRef]
- Xu, D.; Wu, J.; Sun, L.; Qin, X.; Fan, X.; Zheng, X. Energy Metabolism Response of Litopenaeus Vannamei to Combined Stress of Acute Cold Exposure and Waterless Duration: Implications for Physiological Regulation and Waterless Live Transport. J. Therm. Biol. 2022, 104, 103149. [Google Scholar] [CrossRef]
- de Souza, D.M.; Martins, Á.C.; Jensen, L.; Wasielesky, W., Jr.; Monserrat, J.M.; Garcia, L.d.O. Effect of Temperature on Antioxidant Enzymatic Activity in the Pacific White Shrimp Litopenaeus Vannamei in a BFT (Biofloc Technology) System. Mar. Freshw. Behav. Physiol. 2014, 47, 1–10. [Google Scholar] [CrossRef]
- Vinagre, C.; Madeira, D.; Mendonça, V.; Dias, M.; Roma, J.; Diniz, M.S. Effect of Temperature in Multiple Biomarkers of Oxidative Stress in Coastal Shrimp. J. Therm. Biol. 2014, 41, 38–42. [Google Scholar] [CrossRef] [PubMed]
- Pekkoeva, S.N.; Voronin, V.P.; Shatilina, Z.M.; Madyarova, E.V.; Axenov-Gribanov, D.V.; Shirokova, Y.A.; Timofeyev, M.A.; Nemova, N.N.; Murzina, S.A. Lipid and Fatty Acid Composition of Scavenging Amphipods Ommatogammarus Spp. from Different Depths of Lake Baikal. Limnology 2021, 22, 299–311. [Google Scholar] [CrossRef]
- Park, J.C.; Hagiwara, A.; Park, H.G.; Lee, J.-S. The Glutathione S-Transferase Genes in Marine Rotifers and Copepods: Identification of GSTs and Applications for Ecotoxicological Studies. Mar. Pollut. Bull. 2020, 156, 111080. [Google Scholar] [CrossRef] [PubMed]


Publisher’s Note: MDPI stays neutral with regard to jurisdictional claims in published maps and institutional affiliations. |
© 2022 by the authors. Licensee MDPI, Basel, Switzerland. This article is an open access article distributed under the terms and conditions of the Creative Commons Attribution (CC BY) license (https://creativecommons.org/licenses/by/4.0/).
Share and Cite
Madyarova, E.; Shirokova, Y.; Gurkov, A.; Drozdova, P.; Baduev, B.; Lubyaga, Y.; Shatilina, Z.; Vishnevskaya, M.; Timofeyev, M. Metabolic Tolerance to Atmospheric Pressure of Two Freshwater Endemic Amphipods Mostly Inhabiting the Deep-Water Zone of the Ancient Lake Baikal. Insects 2022, 13, 578. https://doi.org/10.3390/insects13070578
Madyarova E, Shirokova Y, Gurkov A, Drozdova P, Baduev B, Lubyaga Y, Shatilina Z, Vishnevskaya M, Timofeyev M. Metabolic Tolerance to Atmospheric Pressure of Two Freshwater Endemic Amphipods Mostly Inhabiting the Deep-Water Zone of the Ancient Lake Baikal. Insects. 2022; 13(7):578. https://doi.org/10.3390/insects13070578
Chicago/Turabian StyleMadyarova, Ekaterina, Yulia Shirokova, Anton Gurkov, Polina Drozdova, Boris Baduev, Yulia Lubyaga, Zhanna Shatilina, Maria Vishnevskaya, and Maxim Timofeyev. 2022. "Metabolic Tolerance to Atmospheric Pressure of Two Freshwater Endemic Amphipods Mostly Inhabiting the Deep-Water Zone of the Ancient Lake Baikal" Insects 13, no. 7: 578. https://doi.org/10.3390/insects13070578