
The Impact of Insect Flour on Sourdough Fermentation-Fatty Acids, Amino-Acids, Minerals and Volatile Profile

 , , ,
, , ,  ,
,  ,
,  ,
,  , , ,
, , ,
Abstract
:Simple Summary
Abstract
1. Introduction
2. Materials and Methods
2.1. Materials and Reagents
2.2. Proximate Composition, Microbial Starter Culture Preparation, Sourdough Preparation
2.3. pH, TTA, and Microbial Counts
2.4. Organic Acids and Alcohols
2.5. Fatty Acid Profile
2.6. Amino Acids Content
2.7. Qualitative ITEX/GC-MS Volatile Compounds Profile
2.8. Minerals Determination through AAS (Atomic Absorption Spectrophotometry)
2.9. Statistical Analysis
3. Results
3.1. Chemical Characterization of Insect Flour
3.2. Sourdough Characterization
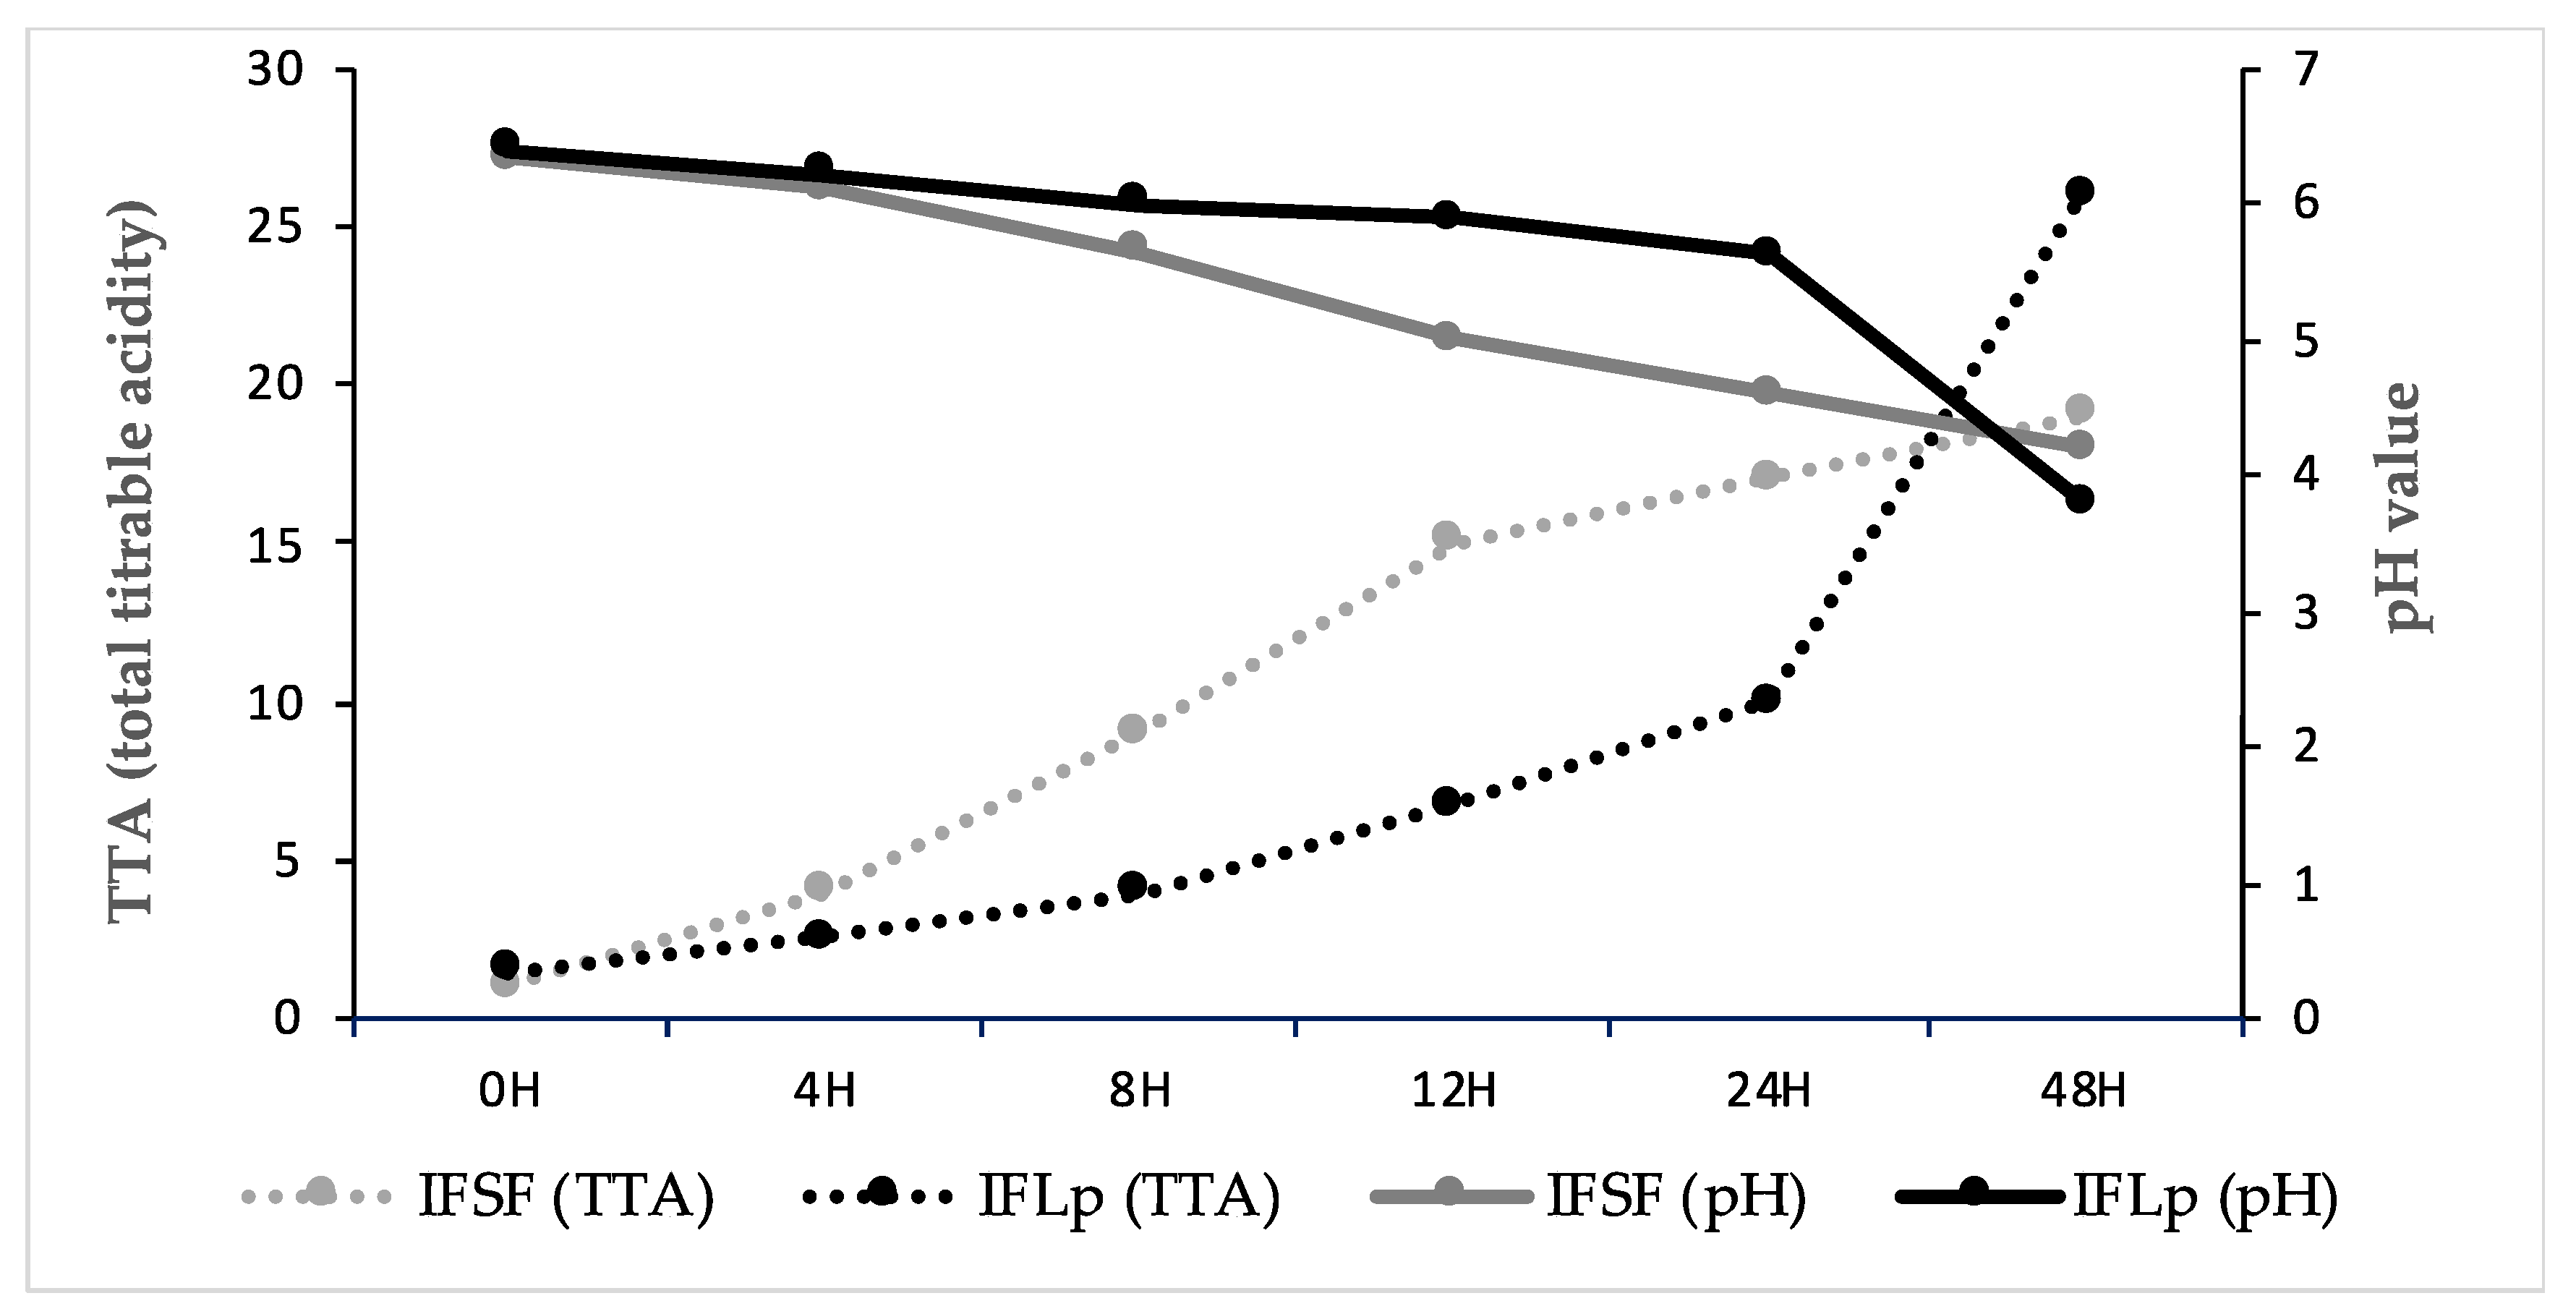
3.2.1. Microbial growth, pH, TTA (Total Titratable Acidity)
3.2.2. Sourdough Organic Acids, Fatty Acids, Amino Acids, and Aroma Volatile Compounds
3.2.3. Minerals Sourdough Evolution
4. Discussion
5. Conclusions
Supplementary Materials
Author Contributions
Funding
Institutional Review Board Statement
Data Availability Statement
Conflicts of Interest
References
- Mancini, S.; Sogari, G.; Diaz, S.E.; Menozzi, D.; Paci, G.; Moruzzo, R. Exploring the Future of Edible Insects in Europe. Foods 2022, 11, 455. [Google Scholar] [CrossRef] [PubMed]
- Osimani, A.; Milanović, V.; Cardinali, F.; Roncolini, A.; Garofalo, C.; Clementi, F.; Pasquini, M.; Mozzon, M.; Foligni, R.; Raffaelli, N.; et al. Bread enriched with cricket powder (Acheta domesticus): A technological, microbiological and nutritional evaluation. Innov. Food Sci. Emerg. Technol. 2018, 48, 150–163. [Google Scholar] [CrossRef]
- Gan, J.; Zhao, M.; He, Z.; Sun, L.; Li, X.; Feng, Y. The Effects of Antioxidants and Packaging Methods on Inhibiting Lipid Oxidation in Deep Fried Crickets (Gryllus bimaculatus) during Storage. Foods 2022, 11, 326. [Google Scholar] [CrossRef] [PubMed]
- Fernandez-Cassi, X.; Supeanu, A.; Vaga, M.; Jansson, A.; Boqvist, S.; Vagsholm, I. The house cricket (Acheta domesticus) as a novel food: A risk profile. J. Insects Food Feed. 2019, 5, 137–157. [Google Scholar] [CrossRef]
- Meyer-Rochow, V.B.; Gahukar, R.T.; Ghosh, S.; Jung, C. Chemical composition, nutrient quality and acceptability of edible insects are affected by species, developmental stage, gender, diet, and processing method. Foods 2021, 10, 1036. [Google Scholar] [CrossRef] [PubMed]
- Navarro del Hierro, J.; Gutiérrez-Docio, A.; Otero, P.; Reglero, G.; Martin, D. Characterization, antioxidant activity, and inhibitory effect on pancreatic lipase of extracts from the edible insects Acheta domesticus and Tenebrio molitor. Food Chem. 2020, 309, 125742. [Google Scholar] [CrossRef] [PubMed]
- Cappelli, A.; Oliva, N.; Bonaccorsi, G.; Lorini, C.; Cini, E. Assessment of the rheological properties and bread characteristics obtained by innovative protein sources (Cicer arietinum, Acheta domesticus, Tenebrio molitor): Novel food or potential improvers for wheat flour? LWT 2020, 118, 108867. [Google Scholar] [CrossRef]
- González, C.M.; Garzón, R.; Rosell, C.M. Insects as ingredients for bakery goods. A comparison study of H. illucens, A. domestica and T. molitor flours. Innov. Food Sci. Emerg. Technol. 2019, 51, 205–210. [Google Scholar] [CrossRef]
- Zielińska, E.; Pankiewicz, U.; Sujka, M. Nutritional, physiochemical, and biological value of muffins enriched with edible insects flour. Antioxidants 2021, 10, 1122. [Google Scholar] [CrossRef]
- Jakab, I.; Tormási, J.; Dhaygude, V.; Mednyánszky, Z.S.; Sipos, L.; Szedljak, I. Cricket flour-laden millet flour blends’ physical and chemical composition and adaptation in dried pasta products. Acta Aliment. 2020, 49, 4–12. [Google Scholar] [CrossRef] [Green Version]
- Ali, L.; Ali, F. Perceived risks related to unconventional restaurants: A perspective from edible insects and live seafood restaurants. Food Control 2022, 131, 108471. [Google Scholar] [CrossRef]
- Global Edible Insects Market (2021 to 2027)-Environmental Benefits is Driving Growth. Available online: https://www.prnewswire.com/news-releases/global-edible-insects-market-2021-to-2027---environmental-benefits-is-driving-growth-301206304.html (accessed on 28 May 2022).
- Igual, M.; García-Segovia, P.; Martínez-Monzó, J. Effect of Acheta domesticus (house cricket) addition on protein content, colour, texture, and extrusion parameters of extruded products. J. Food Eng. 2020, 282, 110032. [Google Scholar] [CrossRef]
- Nissen, L.; Samaei, S.P.; Babini, E.; Gianotti, A. Gluten free sourdough bread enriched with cricket flour for protein fortification: Antioxidant improvement and Volatilome characterization. Food Chem. 2020, 333, 127410. [Google Scholar] [CrossRef] [PubMed]
- Galli, V.; Venturi, M.; Pini, N.; Granchi, L. Technological feature assessment of lactic acid bacteria isolated from cricket powder’s spontaneous fermentation as potential starters for cricket-wheat bread production. Foods 2020, 9, 1322. [Google Scholar] [CrossRef]
- Gaglio, R.; Barbera, M.; Tesoriere, L.; Osimani, A.; Busetta, G.; Matraxia, M.; Attanzio, A.; Restivo, I.; Aquilanti, L.; Settanni, L. Sourdough “ciabatta” bread enriched with powdered insects: Physicochemical, microbiological, and simulated intestinal digesta functional properties. Innov. Food Sci. Emerg. Technol. 2021, 72, 102755. [Google Scholar] [CrossRef]
- Chiş, M.S.; Păucean, A.; Man, S.M.; Vodnar, D.C.; Teleky, B.E.; Pop, C.R.; Stan, L.; Borsai, O.; Kadar, C.B.; Urcan, A.C.; et al. Quinoa sourdough fermented with Lactobacillus plantarum ATCC 8014 designed for gluten-free muffins—A powerful tool to enhance bioactive compounds. Appl. Sci. 2020, 10, 7140. [Google Scholar] [CrossRef]
- Kewuyemi, Y.O.; Kesa, H.; Chinma, C.E.; Adebo, O.A. Fermented edible insects for promoting food security in Africa. Insects 2020, 11, 283. [Google Scholar] [CrossRef]
- Paucean, A.; Vodnar, D.C.; Socaci, S.A.; Socaciu, C. Carbohydrate metabolic conversions to lactic acid and volatile derivatives, as influenced by Lactobacillus plantarum ATCC 8014 and Lactobacillus casei ATCC 393 efficiency during in vitro and sourdough fermentation. Eur. Food Res. Technol. 2013, 237, 679–689. [Google Scholar] [CrossRef]
- Gänzle, M.G.; Zheng, J. Lifestyles of sourdough lactobacilli—Do they matter for microbial ecology and bread quality? Int. J. Food Microbiol. 2019, 302, 15–23. [Google Scholar] [CrossRef]
- AACC International, International Approved Methods of the American Association of Cereal Chemists, 10th ed.; The Association: Saint Paul, MN, USA, 2000.
- Boulos, S.; Tännler, A.; Nyström, L. Nitrogen-to-Protein Conversion Factors for Edible Insects on the Swiss Market: T. molitor, A. domesticus, and L. migratoria. Front. Nutr. 2020, 7, 89. [Google Scholar] [CrossRef]
- Chiș, M.S.; Păucean, A.; Stan, L.; Mureșan, V.; Vlaic, R.A.; Man, S.; Muste, S. Lactobacillus plantarum ATCC 8014 in quinoa sourdough adaptability and antioxidant potential. Rom. Biotechnol. Lett. 2018, 23, 13581–13591. [Google Scholar]
- Chiş, M.S.; Păucean, A.; Man, S.M.; Mureşan, V.; Socaci, S.A.; Pop, A.; Stan, L.; Rusu, B.; Muste, S. Textural and sensory features changes of gluten free muffins based on rice sourdough fermented with Lactobacillus spicheri DSM 15429. Foods 2020, 9, 363. [Google Scholar] [CrossRef] [PubMed] [Green Version]
- Duca, A.; Alexa, E.; Dehelean, C.A.; Șoica, C.; Danciu, C.; Popescu, I.; Cocan, I.; Lalescu, D.; Muntean, D.M. Assessment of lipid profile of eight propolis samples from western Romania. Farmacia 2019, 67, 126–132. [Google Scholar] [CrossRef]
- Pop, A.; Paucean, A.; Socaci, S.A.; Alexa, E.; Man, S.M.; Muresan, V.; Chis, M.S.; Salanta, L.; Popescu, I.; Berbecea, A.; et al. Quality characteristics and volatile profile of macarons modified withwalnut oilcake by-product. Molecules 2020, 25, 2214. [Google Scholar] [CrossRef]
- Chiș, M.S.; Păucean, A.; Stan, L.; Suharoschi, R.; Socaci, S.A.; Man, S.M.; Pop, C.R.; Muste, S. Impact of protein metabolic conversion and volatile derivatives on gluten-free muffins made with quinoa sourdough. CYTA-J. Food 2019, 17, 744–753. [Google Scholar] [CrossRef]
- The Pherobase Database of Pheromones and Semiochemicals. Available online: https://www.pherobase.com/ (accessed on 10 January 2022).
- Flavornet and Human Odor Space. Available online: http://www.flavornet.org (accessed on 9 January 2022).
- Paucean, A.; Moldovan, O.P.; Mureșan, V.; Socaci, S.A.; Dulf, F.V.; Alexa, E.; Man, S.M.; Mureșan, A.E.; Muste, S. Folic acid, minerals, amino-acids, fatty acids and volatile compounds of green and red lentils. Folic acid content optimization in wheat-lentils composite flours. Chem. Cent. J. 2018, 12, 88. [Google Scholar] [CrossRef] [PubMed] [Green Version]
- Igual, M.; García-Segovia, P.; Martínez-Monzó, J. Amino acids release from enriched bread with edible insect or pea protein during in vitro gastrointestinal digestion. Int. J. Gastron. Food Sci. 2021, 24, 100351. [Google Scholar] [CrossRef]
- García-Segovia, P.; Igual, M.; Noguerol, A.T.; Martínez-Monzó, J. Use of insects and pea powder as alternative protein and mineral sources in extruded snacks. Eur. Food Res. Technol. 2020, 246, 703–712. [Google Scholar] [CrossRef]
- Williams, J.P.; Williams, J.R.; Kirabo, A.; Chester, D.; Peterson, M. Nutrient Content and Health Benefits of Insects. Insects Sustain. Food Ingred. 2016, I, 61–84. [Google Scholar] [CrossRef]
- Kosečková, P.; Zvěřina, O.; Pěchová, M.; Krulíková, M.; Duborská, E.; Borkovcová, M. Mineral profile of cricket powders, some edible insect species and their implication for gastronomy. J. Food Compos. Anal. 2022, 107, 104340. [Google Scholar] [CrossRef]
- Atowa, C.O.; Okoro, B.C.; Umego, E.C.; Atowa, A.O.; Emmanuel, O.; Ude, V.C.; Ugbogu, E.A. Nutritional values of Zonocerus variegatus, Macrotermes bellicosus and Cirina forda insects: Mineral composition, fatty acids and amino acid profiles. Sci. Afr. 2021, 12, e00798. [Google Scholar] [CrossRef]
- Burt, K.G.; Kotao, T.; Lopez, I.; Koeppel, J.; Goldstein, A.; Samuel, L.; Stopler, M. Acceptance of Using Cricket Flour as a Low Carbohydrate, High Protein, Sustainable Substitute for All-Purpose Flour in Muffins. J. Culin. Sci. Technol. 2020, 18, 201–213. [Google Scholar] [CrossRef]
- Payne, C.L.R.; Scarborough, P.; Rayner, M.; Nonaka, K. A systematic review of nutrient composition data available for twelve commercially available edible insects, and comparison with reference values. Trends Food Sci. Technol. 2016, 47, 69–77. [Google Scholar] [CrossRef]
- Messina, C.M.; Gaglio, R.; Morghese, M.; Tolone, M.; Arena, R.; Moschetti, G.; Santulli, A.; Francesca, N.; Settanni, L. Microbiological profile and bioactive properties of insect powders used in food and feed formulations. Foods 2019, 8, 400. [Google Scholar] [CrossRef] [PubMed] [Green Version]
- Lucas-González, R.; Fernández-López, J.; Pérez-Álvarez, J.A.; Viuda-Martos, M. Effect of drying processes in the chemical, physico-chemical, techno-functional and antioxidant properties of flours obtained from house cricket (Acheta domesticus). Eur. Food Res. Technol. 2019, 245, 1451–1458. [Google Scholar] [CrossRef]
- Kowalski, S.; Mikulec, A.; Mickowska, B.; Skotnicka, M.; Mazurek, A. Wheat bread supplementation with various edible insect flours. Influence of chemical composition on nutritional and technological aspects. LWT 2022, 159, 113220. [Google Scholar] [CrossRef]
- Lee, S.M.; Hwang, Y.R.; Kim, M.S.; Chung, M.S. Comparison of Volatile and Nonvolatile Compounds in Rice Fermented by Different Lactic Acid Bacteria. Molecules 2019, 24, 1183. [Google Scholar] [CrossRef] [Green Version]
- Boontiam, W.; Hong, J.; Kitipongpysan, S.; Wattanachai, S. Full-fat field cricket (Gryllus bimaculatus) as a substitute for fish meal and soybean meal for weaning piglets: Effects on growth performance, intestinal health, and redox status. J. Anim. Sci. 2022, 100, skac080. [Google Scholar] [CrossRef]
- Debonne, E.; Van Schoors, F.; Maene, P.; Van Bockstaele, F.; Vermeir, P.; Verwaeren, J.; Eeckhout, M.; Devlieghere, F. Comparison of the antifungal effect of undissociated lactic and acetic acid in sourdough bread and in chemically acidified wheat bread. Int. J. Food Microbiol. 2020, 321, 108551. [Google Scholar] [CrossRef]
- Teleky, B.E.; Martău, A.G.; Ranga, F.; Chețan, F.; Vodnar, D.C. Exploitation of lactic acid bacteria and Baker’s yeast as single or multiple starter cultures of wheat flour dough enriched with soy flour. Biomolecules 2020, 10, 778. [Google Scholar] [CrossRef]
- Wang, Y.; Wu, J.; Lv, M.; Shao, Z.; Hungwe, M.; Wang, J.; Bai, X.; Xie, J.; Wang, Y.; Geng, W. Metabolism Characteristics of Lactic Acid Bacteria and the Expanding Applications in Food Industry. Front. Bioeng. Biotechnol. 2021, 9, 612285. [Google Scholar] [CrossRef] [PubMed]
- Teleky, B.E.; Martău, G.A.; Vodnar, D.C. Physicochemical effects of Lactobacillus plantarum and Lactobacillus casei cocultures on soy–wheat flour dough fermentation. Foods 2020, 9, 1894. [Google Scholar] [CrossRef] [PubMed]
- Xu, Q.; Li, S.; Huang, H.; Wen, J. Key technologies for the industrial production of fumaric acid by fermentation. Biotechnol. Adv. 2012, 30, 1685–1696. [Google Scholar] [CrossRef] [PubMed]
- Ilica, R.A.; Kloetzer, L.; Galaction, A.I.; Caşcaval, D. Fumaric acid: Production and separation. Biotechnol. Lett. 2019, 41, 47–57. [Google Scholar] [CrossRef]
- Castro-López, C.; Santiago-López, L.; Vallejo-Cordoba, B.; González-Córdova, A.F.; Liceaga, A.M.; García, H.S.; Hernández-Mendoza, A. An insight to fermented edible insects: A global perspective and prospective. Food Res. Int. 2020, 137, 109750. [Google Scholar] [CrossRef]
- Ogawa, J.; Kishino, S.; Ando, A.; Sugimoto, S.; Mihara, K.; Shimizu, S. Production of conjugated fatty acids by lactic acid bacteria. J. Biosci. Bioeng. 2005, 100, 355–364. [Google Scholar] [CrossRef]
- Hayek, S.A.; Ibrahim, S.A. Current Limitations and Challenges with Lactic Acid Bacteria: A Review. Food Nutr. Sci. 2013, 04, 73–87. [Google Scholar] [CrossRef] [Green Version]
- Rasi, S.; Vainio, M.; Blasco, L.; Kahala, M.; Leskinen, H.; Tampio, E. Changes in volatile fatty acid production and microbiome during fermentation of food waste from hospitality sector. J. Environ. Manag. 2022, 308, 114640. [Google Scholar] [CrossRef]
- Pétel, C.; Onno, B.; Prost, C. Sourdough volatile compounds and their contribution to bread: A review. Trends Food Sci. Technol. 2017, 59, 105–123. [Google Scholar] [CrossRef]
- Maiyo, N.C.; Khamis, F.M.; Okoth, M.W.; Abong, G.O.; Subramanian, S.; Egonyu, J.P.; Xavier, C.; Ekesi, S.; Omuse, E.R.; Nakimbugwe, D.; et al. Nutritional Quality of Four Novel Porridge Products Blended with Edible Cricket (Scapsipedus icipe) Meal for Food. Foods 2022, 11, 1047. [Google Scholar] [CrossRef]
- Mendoza-Salazar, A.; Santiago-López, L.; Torres-Llanez, M.J.; Hernández-Mendoza, A.; Vallejo-Cordoba, B.; Liceaga, A.M.; González-Córdova, A.F. In vitro antioxidant and antihypertensive activity of edible insects flours (Mealworm and grasshopper) fermented with Lactococcus lactis strains. Fermentation 2021, 7, 153. [Google Scholar] [CrossRef]
- Pico, J.; Bernal, J.; Gómez, M. Wheat bread aroma compounds in crumb and crust: A review. Food Res. Int. 2015, 75, 200–215. [Google Scholar] [CrossRef] [PubMed]
- Sharma, N.; Angural, S.; Rana, M.; Puri, N.; Kondepudi, K.K.; Gupta, N. Phytase producing lactic acid bacteria: Cell factories for enhancing micronutrient bioavailability of phytate rich foods. Trends Food Sci. Technol. 2020, 96, 1–12. [Google Scholar] [CrossRef]


| Sample Codes | ||
|---|---|---|
| Sampling Times (h) | Sourdough Spontaneous Fermentation (IFSF) | Sourdough with Lactobacillus plantarum Fermentation (IFLp) |
| 0 | IFSF0H | IFLp0H |
| 4 | IFSF4H | IFLp4H |
| 8 | IFSF8H | IFLp8H |
| 12 | IFSF12H | IFLp12H |
| 24 | IFSF24H | IFLp24H |
| 48 | IFSF48H | IFLp48H |
| Parameters | Insect Flour |
|---|---|
| Protein (%) * | 72.60 ± 0.34 |
| Fat (%) * | 6.13 ± 0.22 |
| Ash (%) * | 5.04 ± 0.33 |
| Moisture (%) * | 6.67 ± 0.67 |
| Minerals (mg/100 g d.w.) | |
| K | 560.46 ± 0.94 |
| P | 150.80 ± 0.85 |
| Cu | 46.16 ± 0.24 |
| Zn | 15.11 ± 0.77 |
| Mg | 11.32 ± 0.44 |
| Fe | 7.20 ± 0.32 |
| Mn | 2.21 ± 0.11 |
| Ca | 1.90 ± 0.22 |
| Ni | 0.14 ± 0.04 |
| Parameters | IF | Retention Times (min) |
|---|---|---|
| Organic acids (mg/g f.w.) | ||
| Oxalic acid | 1.70 ± 0.05 | 7.78 |
| Citric acid | 12.87 ± 0.07 | 9.45 |
| Succinic acid | 5.71 ± 0.05 | 12.88 |
| Lactic acid | 8.51 ± 0.07 | 13.77 |
| Fumaric acid | 13.70 ± 0.21 | 14.63 |
| Acetic acid | 0.55 ± 0.06 | 15.83 |
| Ascorbic acid | 1.04 ± 0.04 | 10.50 |
| Alcohols (mg/g f.w.) | ||
| 1.3 PD | 1.37 ± 0.03 | 18.01 |
| 2.3 PD | 0.10 ± 0.05 | 18.88 |
| Shorthand Nomenclature | Fatty Acid Name | Type | IF (%) * | |
|---|---|---|---|---|
| 14:0 | Myristic | SFA | 0.51 ± 0.01 | |
| 16:0 | Palmitic | SFA | 16.29 ± 0.18 | |
| C16:1 cis | Palmitoleic | MUFA | 0.41 ± 0.03 | |
| C16:1 ω − 7 | Palmitolinoleic | MUFA | 0.73 ± 0.02 | |
| 17:0 | Margaric acid | SFA | 0.21 ± 0.03 | |
| 18:0 | Stearic acid | SFA | 10.59 ± 0.21 | |
| 18:1 (n − 9) | Oleic acid | MUFA | 27.47 ± 0.07 | |
| 18:2 (n − 6) | Linoleic acid | PUFA, ω − 6 | 41.91 ± 0.04 | |
| 20:0 | Arachidic | SFA | 0.33 ± 0.02 | |
| 18:2 (n − 3) | Linolenic | PUFA, ω − 3 | 1.37 ± 0.03 | |
| ∑ SFA | 27.94 ± 0.45 | |||
| ∑ MUFA | 29.39 ± 0.14 | |||
| ∑ PUFA | 43.28 ± 0.07 | |||
| ∑ PUFAs/SFAs | 1.47 ± 0.15 | |||
| Volatile profile | ||||
| Volatile compounds | Characteristic odor | Conc. (% of the total peak area) * | ||
| Alcohols | ||||
| 1-Pentanol | Pungent, fermented, bready, wine. | n.d. | ||
| 3-methyl-1-Butanol | Whiskey, malt, burnt | 8.55 ± 0.22 | ||
| 2-methyl-1-Butanol | Malt | 7.99 ± 0.31 | ||
| Aldehydes | ||||
| Hexanal | Intense green, fruity, aldehydic odor, grass, leafy | 17.93 ± 0.46 | ||
| Heptanal | Fresh, Aldehydic, Fatty, Green. | n.d. | ||
| Benzaldehyde | Almond, fruity, powdery, nutty | 6.34 ± 0.55 | ||
| 2,4-Nonadienal, (E,E)- | Fatty, waxy odor | 2.33 ± 0.19 | ||
| Octanal | fruit-like odor | n.d. | ||
| Ketones | ||||
| Acetophenone | Floral, Almond | 3.18 ±0.03 | ||
| 2-methyl-5-propan-2-ylcyclohex-2-en-1-one | Spicy, minty, caraway, bread, rye bread | 16.00 ± 0.18 | ||
| 2-Heptanone | Fruity, cinnamon | 14.56 ± 0.88 | ||
| Terpenes and terpenoids | ||||
| p-Cymene | Citrus, Sweet, Herbal, Spicy | 5.52 ± 0.77 | ||
| β-Myrcene | Balsamic, must, spice | 10.65 ± 0.22 | ||
| Benzoic Acid | Faint, Balsam | 1.22 ± 0.33 | ||
| Others | ||||
| Dimethyl-disulfide | Garlic | 5.75 ± 0.09 | ||
| Amino Acids (mg/g f.w.) | |
|---|---|
| Essential amino acid | |
| Leucine | 45.00 ± 0.08 |
| Lysine | 46.14 ± 0.12 |
| Phenylalanine | 18.58 ± 0.33 |
| Isoleucine | 23.70 ± 0.21 |
| Methionine | 11.77 ± 0.55 |
| Threonine | 14.86 ± 0.42 |
| Tryptophan | 18.48 ± 0.78 |
| Valine | 41.53 ± 0.83 |
| Total | 220.06 ± 3.32 |
| Non-essential amino acid | |
| Alanine | 221.21 ± 0.88 |
| Glycine | 93.73 ± 0.66 |
| Amino-Butyric Acid | n.d. |
| β-aminoisobutyric acid | n.d. |
| L-Alloisoleucine | 88.28 ± 0.34 |
| Serine | 7.56 ± 0.55 |
| Sarcosine | n.d. |
| Proline | 84.26 ± 0.39 |
| Asparagine | n.d. |
| Tetratricopeptide | n.d. |
| Aspartic Acid | 16.77 ± 0.52 |
| Hydroxy Proline | n.d. |
| Glutamic Acid | 37.72 ± 0.49 |
| G-protein regulatory (GPR) motif | n.d. |
| Glutamine | n.d. |
| Ornithine | 10.74 ± 0.77 |
| Total | 560.27 ± 4.60 |
| Samples | Oxalic Acid mg/100 g | Citric Acid mg/100 g | Ascorbic Acid mg/100 g | Succinic Acid mg/100 g | Lactic Acid mg/100 g | Fumaric Acid mg/100 g | Acetic Acid mg/100 g | 1.3 PD mg/100 g | 2.3 BD mg/100 g |
|---|---|---|---|---|---|---|---|---|---|
| IFSF0H | 0.34 ± 0.02 a | 3.04 ± 0.05 c | 0.26 ± 0.04 a | 1.48 ± 0.03 bc | 2.11 ± 0.05 b | 3.58 ± 0.07 de | 0.14 ± 0.03 a | 0.34 ± 0.02 a | 0.04 ± 0.01 a |
| IFLp0H | 0.36 ± 0.02 a | 3.10 ± 0.21 c | 0.24 ± 0.11 a | 1.35 ± 0.04 ab | 2.01 ± 0.05 b | 3.43 ± 0.03 d | 0.16 ± 0.02 a | 0.33 ± 0.02 a | 0.05 ± 0.01 a |
| IFSF4H | 0.39 ± 0.03 a | 2.99 ± 0.02 c | 0.21 ± 0.03 a | 1.41 ± 0.02 abc | 2.03 ± 0.03 b | 3.23 ± 0.08 cd | 0.12 ± 0.03 a | 0.30 ±0.04 a | 0.03± 0.01 a |
| IFLp4H | 0.38 ± 0.02 a | 3.01 ± 0.03 c | 0.27 ± 0.02 a | 1.31 ± 0.04 a | 2.12 ± 0.03 b | 3.14 ± 0.22 cd | 0.18 ± 0.01 a | 0.28 ± 0.05 a | 0.04 ± 0.02 a |
| IFSF8H | 0.37 ± 0.02 a | 3.27 ± 0.03 cd | 0.26 ± 0.01 a | 1.35 ± 0.02 ab | 1.88 ± 0.03 b | 3.20 ± 0.22 cd | 0.34 ± 0.11 ab | 0.36 ± 0.02 a | 0.03 ± 0.01 a |
| IFLp8H | 0.57 ± 0.02 b | 3.65 ± 0.05 de | 0.30 ± 0.02 a | 1.53 ± 0.03 cd | 2.57 ± 0.05 bc | 2.90 ± 0.04 bc | 0.21 ± 0.03 a | 0.40 ± 0.07 a | 0.04 ± 0.02 a |
| IFSF12H | 0.64 ± 0.02 bc | 3.04 ± 0.03 c | 0.21 ± 0.02 a | 1.68 ± 0.22 d | 2.01 ± 0.21 b | 3.40 ± 0.11 d | 0.57 ± 0.12 b | 0.45 ± 0.03 a | 0.06 ± 0.03 a |
| IFLp12H | 0.57 ± 0.03 b | 3.92 ± 0.02 e | 0.32 ± 0.03 ab | 1.90 ± 0.05 de | 3.02 ± 0.07 c | 2.36 ± 0.06 a | 0.87 ± 0.02 c | 0.43 ± 0.03 a | 0.06 ± 0.02 a |
| IFSF24H | 0.64 ± 0.03 bc | 2.50 ± 0.05 b | 0.27 ± 0.03 a | 1.69 ± 0.06 d | 2.25 ± 0.04 b | 3.56 ± 0.05 de | 0.93 ± 0.02 c | 1.09 ± 0.04 b | 0.12 ± 0.03 ab |
| IFLp24H | 0.83 ± 0.05 d | 3.07 ± 0.04 c | 0.38 ± 0.03 b | 2.24 ± 0.05 f | 3.62 ± 0.05 d | 2.51 ± 0.03 ab | 1.27 ± 0.03 d | 0.42 ± 0.05 a | 0.06 ± 0.02 a |
| IFSF48H | 0.81 ± 0.02 d | 2.01 ± 0.02 a | n.d. | 1.86 ± 0.05 de | 0.63 ± 0.03 a | 4.01 ± 0.02 e | 2.03 ± 0.04 e | 0.90 ± 0.03 b | 0.33 ± 0.05 c |
| IFLp48H | 0.91 ± 0.03 d | 2.88 ± 0.03 bc | n.d. | 2.14 ± 0.03 f | 2.57 ± 0.02 bc | 3.14 ± 0.05 cd | 1.89 ± 0.06 e | 0.39 ± 0.04 a | 0.21 ± 0.02 b |
| Shorthand Nomenclature | Fatty Acid Name | Type | IFSF0H | IFLp0H | IFSF4H | IFLp4H | IFSF8H | IFLp8H | IFSF12H | IFLp12H | IFSF24H | IFLp24H | IFSF48H | IFLp48H |
|---|---|---|---|---|---|---|---|---|---|---|---|---|---|---|
| 14:0 | Myristic | SFA | 0.45 ± 0.02 a | 0.43 ± 0.02 a | 0.48 ± 0.03 a | 0.38 ± 0.02 a | 0.49± 0.03 a | 0.45 ± 0.02 a | 0.48 ± 0.02 a | 1.62 ± 0.07 b | 0.66 ± 0.09 a | 1.55 ± 0.02 b | 0.69 ± 0.03a | 1.78 ± 0.05b |
| 16:0 | Palmitic | SFA | 14.08 ± 0.03 a | 14.11 ± 0.04 a | 15.03 ± 0.02 a | 15.99 ± 0.18 ab | 14.22 ± 0.05 a | 17.99 ± 0.63 b | 24.56 ± 0.77 c | 26.85 ± 0.39 d | 26.07 ± 0.84 cd | 29.04 ± 0.55 e | 27.62 ± 0.77d | 30.22 ± 0.55e |
| C16:1 cis | Palmitoleic | MUFA | 0.22 ± 0.03 a | 0.24 ± 0.03 ab | 0.22 ± 0.01 a | 0.24 ± 0.03 ab | 0.21 ± 0.02 a | 0.33 ± 0.01 b | 0.30 ± 0.01 b | 0.37 ± 0.03 b | 0.20 ± 0.01 a | 0.40± 0.06 bc | 0.22 ± 0.03a | 0.22± 0.05 a |
| C16:1 ω - 7 | Palmitolinoleic | MUFA | 0.40 ± 0.02 a | 0.43 ± 0.02 a | 0.41 ± 0.04 a | 0.40 ± 0.02 a | 0.43 ± 0.05 a | 0.61 ± 0.05 b | 0.67 ± 0.04 b | 0.71 ± 0.05 b | 0.67 ± 0.03 b | 0.40 ± 0.03 a | 0.41 ± 0.02 a | 0.44 ± 0.01 a |
| 17:0 | Margaric acid | SFA | 0.15 ± 0.05 a | 0.18 ± 0.03 ab | 0.12 ± 0.02 a | 0.22 ± 0.01 ab | 0.20 ± 0.03 ab | 0.27 ± 0.03 b | 0.21 ± 0.02 ab | 0.27 ± 0.02 b | 0.21 ± 0.02 ab | 0.17± 0.03 a | 0.18 ± 0.05ab | 0.18 ± 0.02 ab |
| 18:0 | Stearic acid | SFA | 9.83 ± 0.04 b | 10.11 ± 0.02 b | 10.00 ± 0.05 b | 9.99 ± 0.44 b | 9.89 ± 0.39 b | 10.00 ± 0.33 b | 9.32 ± 0.06 a | 10.26 ± 0.53 b | 9.43 ± 0.19 a | 10.81 ± 0.09 c | 10.79 ± 0.03c | 10.56± 0.55 c |
| 18:1 (n - 9) | Oleic acid | MUFA | 18.99 ± 0.02 a | 19.01 ± 0.04 a | 19.06 ± 0.12 a | 19.0 ± 0.23 a | 20.08 ± 0.46 ab | 20.99 ± 0.29 bc | 21.28 ± 0.55 c | 22.66 ± 0.88 d | 23.00 ± 0.36 d | 25.45 ± 0.55 e | 26.99 ± 0.72f | 28.09 ± 0.09 |
| 18:2 (n -6 ) | Linoleic acid | PUFA, ω - 6 | 33.77 ± 0.03 f | 34.02 ± 0.07 f | 33.88 ± 0.33 f | 33.99 ± 0.47 f | 32.52 ± 0.88 ef | 34.77 ± 0.55 f | 23.00 ± 0.44 a | 24.66 ± 0.44 ab | 27.55 ± 0.68 c | 30.05 ± 0.44 d | 25.81± 0.88b | 27.77 ± 0.03c |
| 20:0 | Arachidic | SFA | n.d. | n.d. | n.d. | n.d. | n.d. | n.d. | n.d. | n.d. | n.d. | n.d. | n.d. | n.d. |
| 18:2 (n - 3) | Linolenic | PUFA, ω - 3 | 0.52 ± 0.05 a | 0.52 ± 0.03 a | 0.52 ± 0.03 a | 0.77± 0.04 ab | 0.99 ± 0.05 ab | 0.88 ± 0.07 ab | 1.02 ± 0.04 b | 1.94 ± 0.05 d | 1.04 ± 0.05 b | 1.40 ± 0.07 c | 0.49 ± 0.07a | 0.90 ± 0.05ab |
| ∑ SFA | 24.52 ± 0.09a | 24.84± 0.06 a | 25.64± 0.12 a | 26.59 ± 0.65 b | 24.81 ± 0.93 a | 28.72 ± 1.01 c | 34.59 ± 0.85 d | 39.01 ± 1.01 e | 36.39 ± 1.14 d | 41.58 ± 0.69 f | 39.31± 0.92 e | 42.74 ± 1.17 f | ||
| ∑ MUFA | 19.62 ± 0.06a | 19.68± 0.06 a | 19.69± 0.15 a | 19.64 ± 0.28 a | 20.72 ± 0.06 b | 21.93 ± 0.61 c | 22.26 ± 0.60 c | 23.75 ± 1.30 d | 23.88 ± 0.40 d | 26.26 ± 0.64 e | 27.62 ± 0.77 f | 29.56 ± 0.12 g | ||
| ∑ PUFA | 34.30 ± 0.08e | 34.55± 0.10 e | 34.41 ± 0.36 e | 34.76 ± 0.51 e | 33.51 ± 0.93 e | 35.65 ± 0.62 f | 24.02 ± 0.48 a | 26.61 ± 0.49 b | 28.59 ± 0.73 c | 31.45 ± 0.51 d | 26.30 ± 0.95 b | 28.67 ± 0.08 c | ||
| ∑ PUFAs/SFAs | 1.40 | 1.39 | 1.34 | 1.31 | 1.35 | 1.24 | 0.69 | 0.68 | 0.79 | 0.76 | 0.67 | 0.67 | ||
| Amino acids | IFSF0H | IFLp0H | IFSF4H | IFLp4H | IFSF8H | IFLp8H | IFSF12H | IFLp12H | IFSF24H | IFLp24H | IFSF48H | IFLp48H |
|---|---|---|---|---|---|---|---|---|---|---|---|---|
| Essential amino acid | ||||||||||||
| Leucine | 25.09 ± 0.05 bc | 25.21 ± 0.55 bc | 25.11 ± 0.55 bc | 24.89 ± 0.33 bc | 26.88 ± 0.88 c | 29.99 ± 0.55 d | 21.09 ± 0.65 a | 39.66 ± 0.75 e | 22.55 ± 0.22 ab | 49.99 ± 0.77 f | 24.00 ± 0.77 bc | 50.33 ± 0.72 f |
| Lysine | 21.09 ± 0.88 a | 21.55 ± 0.77 a | 21.67 ± 0.88 a | 21.98 ± 0.83 ab | 22.09 ± 0.41 ab | 23.99 ± 0.99 bc | 24.62 ± 0.63 c | 30.67 ± 0.29 e | 25.88 ± 0.44 c | 39.00 ± 0.44 g | 27.98 ± 0.54 d | 37.37 ± 0.42 f |
| Phenylalanine | 9.23 ± 0.22 a | 9.45 ± 0.29 a | 9.31 ± 0.36 a | 9.56 ± 0.77 a | 9.67 ± 0.99 a | 10.88 ± 0.88 b | 11.02 ± 0.34 b | 15.00 ± 0.39 d | 12.88 ± 0.32 c | 37.09 ± 0.27 e | 13.99 ± 0.38 d | 39.03 ±0.53 f |
| Isoleucine | 11.09 ± 0.88 a | 11.21 ± 0.44 a | 11.44 ± 0.11 a | 11.88 ± 0.77 a | 12.03 ± 0.11 a | 14.01 ± 0.55 b | 12.77 ± 0.71 ab | 18.74 ± 0.59 c | 14.09 ± 0.82 b | 28.99 ± 0.37 e | 21.66 ± 0.41 d | 30.00 ± 0.64 ef |
| Methionine | 5.25 ± 0.22 b | 5.30 ± 0.11 b | 5.27 ± 0.67 b | 5.40 ± 0.87 b | 5.88 ± 0.22 b | 6.39 ± 0.57 b | 3.12 ± 0.31 a | 12.77 ± 0.48 c | 5.13 ± 0.93 b | 15.22 ± 0.36 d | 5.99 ± 0.81 b | 16.04 ± 0.67 d |
| Threonine | 7.22 ± 0.32 a | 7.44 ± 0.21 a | 7.33 ± 0.22 a | 7.55 ± 0.38 a | 7.09 ± 0.44 a | 7.99 ± 0.23 ab | 8.09 ± 0.42 ab | 10.22 ± 0.62 b | 9.11 ± 0.39 ab | 15.66 ± 0.55 d | 9.22 ± 0.39 ab | 13.35 ± 0.42 c |
| Tryptophan | 8.66 ± 0.31 a | 8.69 ± 0.55 a | 8.90 ± 0.88 a | 9.03 ± 0.77 a | 9.21 ± 0.67 a | 9.55 ± 0.62 ab | 9.33 ± 0.50 a | 11.50 ± 0.55 c | 9.90 ± 0.61 ab | 12.55 ± 0.62 d | 10.22 ± 0.31 b | 13.03 ± 0.52 d |
| Valine | 22.04 ± 0.02 a | 22.33 ± 0.22 a | 22.08 ± 0.66 a | 22.33 ± 0.29 a | 23.04 ± 0.33 a | 28.6 ± 0.77 b | 22.89 ± 0.29 a | 49.06 ± 0.61 c | 26.09 ±0.31 b | 80.99 ± 0.41 e | 27.77 ± 0.42 b | 75.55 ± 0.93 d |
| Total | 109.67 a | 111.18 ab | 111.11 ab | 112.62 b | 115.89 c | 131.40 e | 112.93 b | 187.62 g | 125.63 d | 279.49 i | 140.83 f | 274.7 h |
| Non-essential amino acid | ||||||||||||
| Alanine | 119.09 ± 0.03 a | 119.55 ± 0.79 a | 120.04 ± 0.99 a | 120.33 ± 0.33 a | 120.99 ± 0.44 ab | 125.99 ± 0.66 c | 121.93 ± 0.81 ab | 199.03 ± 0.55 d | 123.09 ± 0.77 b | 210.03 ± 0.83 e | 127.03 ± 0.28 c | 201.54 ± 0.08 d |
| Glycine | 54.58 ± 0.05 a | 55.02 ± 0.99 a | 55.03 ± 0.33 a | 55.03 ± 0.99 a | 54.09 ± 0.77 a | 60.22 ± 0.88 b | 54.58 ± 0.73 a | 73.60 ± 0.22 c | 56.09 ± 0.88 a | 76.88 ± 0.65 d | 111.82 ± 0.53 d | 77.99 ± 0.87 e |
| Amino-Butyric Acid | n.d. | n.d. | n.d. | n.d. | n.d. | n.d. | n.d. | n.d. | n.d. | n.d. | n.d. | n.d. |
| β -aminoisobutyric acid | n.d. | n.d. | n.d. | n.d. | n.d. | n.d. | n.d. | n.d. | n.d. | n.d. | n.d. | n.d. |
| L-Alloisoleucine | 40.23 ± 0.27 a | 40.55 ± 0.22 a | 40.12 ± 0.88 a | 40.33 ± 0.88 a | 41.09 ± 0.22 a | 43.09 ± 0.88 b | 42.00 ± 0.83 ab | 51.00 ± 0.53 d | 43.00 ± 0.44 b | 66.00 ± 0.15 f | 44.00 ± 0.51 c | 63.00 ± 0.52 e |
| Serine | 3.33 ± 0.12 ab | 3.64 ± 0.11 ab | 3.89 ± 0.11 ab | 3.99 ± 0.21 ab | 3.99 ± 0.55 ab | 4.55 ± 0.71 b | 2.77 ± 0.83 a | 7.56 ± 0.25 c | 3.09 ± 0.22 ab | 17.09 ± 0.48 d | 5.99 ± 0.55 bc | 18.09 ± 0.33 d |
| Proline | 40.22 ± 0.87 a | 40.56 ± 0.22 a | 41.03 ± 0.99 a | 40.89 ±0.22 a | 40.33 ± 0.34 a | 42.04 ± 0.99 b | 43.09 ± 0.76 bc | 64.44 ± 0.11 e | 44.09 ± 0.36 cd | 78.99 ± 0.52 f | 45.66 ± 0.36 d | 80.44 ± 0.98 f |
| Asparagine | n.d. | n.d. | n.d. | n.d. | n.d. | n.d. | n.d. | n.d. | n.d. | n.d. | n.d. | n.d. |
| Tetratricopeptide | n.d. | n.d. | n.d. | n.d. | n.d. | n.d. | n.d. | n.d. | n.d. | n.d. | n.d. | n.d. |
| Aspartic Acid | 7.44 ± 0.45 a | 6.99 ± 0.33 a | 7.55 ± 0.22 a | 7.04 ± 0.33 a | 7.44 ± 0.33 a | 8.09 ± 0.31 ab | 8.00 ± 0.67 ab | 14.03 ± 0.25 c | 8.66 ± 0.45 ab | 16.83 ± 0.88 d | 9.05 ± 0.65 b | 17.09 ± 0.82 d |
| Hydroxy Proline | n.d. | n.d. | n.d. | n.d. | n.d. | n.d. | n.d. | n.d. | n.d. | n.d. | n.d. | n.d. |
| Glutamic Acid | 25.73 ± 0.89 a | 25.94 ± 0.88 a | 25.66 ± 0.99 a | 25.88 ± 0.44 a | 25.71 ± 0.67 a | 26.78 ± 0.65 a | 26.83 ± 0.52 a | 33.02 ± 0.71 c | 27.04 ± 0.67 a | 40.23 ± 0.65 d | 33.71 ± 0.49 c | 28.77 ± 0.88 b |
| G-protein regulatory (GPR) motif | n.d. | n.d. | n.d. | n.d. | n.d. | n.d. | n.d. | n.d. | n.d. | n.d. | n.d. | n.d. |
| Ornithine | 3.78 ± 0.34 a | 3.99 ± 0.12 a | 4.03 ± 0.17 a | 4.34 ± 0.32 ab | 4.77 ± 0.33 ab | 7.11 ± 0.44 c | 5.75 ± 0.60 b | 9.20 ± 0.33 d | 6.25 ± 0.58 bc | 11.09 ± 0.39 e | 6.77 ± 0.67 c | 11.88 ± 0.55 e |
| Total | 294.40 a | 296.24 ab | 297.35 b | 297.83 b | 298.41 b | 317.87 e | 304.95 c | 451.88 g | 311.31 d | 517.13 i | 384.03 f | 498.80 h |
| Volatile Compounds | Perceived Flavor | IFSF0H | IFLp0H | IFSF4H | IFLp4H | IFSF8H | IFLp8H | IFSF12H | IFLp12H | IFSF24H | IFLp24H | IFSF48H | IFLp48H |
|---|---|---|---|---|---|---|---|---|---|---|---|---|---|
| Alcohols | |||||||||||||
| 1-Pentanol | Pungent, fermented, bready, wine | n.d. | n.d. | 0.58 ± 0.02 a | 0.31± 0.03 a | 1.77 ± 0.02 b | 0.22± 0.01 a | 2.02 ± 0.03 bc | 0.16 ± 0.02 a | 2.62 ± 0.02 c | 0.23 ± 0.03 a | 6.62 ± 0.03 d | 1.77 ± 0.03 b |
| 3-methyl-1-butanol | Whiskey, malt, burnt | 7.01 ± 0.03 a | 6.99 ± 0.06 a | 7.22 ± 0.03 a | 7.33 ± 0.22 a | 7.38 ± 0.07 a | 18.09 ± 0.05 d | 15.67 ± 0.05 c | 19.57 ± 0.08 e | 18.89 ± 0.05 d | 21.77 ± 0.05 f | 16.33 ± 0.11 cd | 10.02 ± 0.05 b |
| 2-methyl-1-butanol | malt | 5.55 ± 0.02 a | 5.67 ± 0.08 a | 5.77 ± 0.05 a | 6.33 ± 0.33 a | 9.88 ± 0.44 b | 10.99 ± 0.21 bc | 12.55 ± 0.03 c | 12.09 ± 0.05 c | 13.93 ± 0.03 d | 14.22 ± 0.05 d | 10.22 ± 0.77 b | 5.99 ± 0.03 a |
| Total | 12.56 ± 0.05 a | 12.66 ± 0.12 a | 13.57± 0.55 ab | 13.97 ± 0.58 b | 19.03 ± 0.53 d | 29.30 ± 0.27 e | 30.24 ± 0.11 e | 31.82 ± 0.15 f | 35.44 ± 0.1 h | 36.22 ± 0.12 i | 33.17± 0.91 g | 17.78 ± 0.11 c | |
| Aldehydes | |||||||||||||
| Hexanal | Intense green, fruity, aldehydic odor, grass, leafy | 17.64 ± 0.07 d | 17.06 ± 0.09 d | 15.03 ± 0.55 c | 16.22 ± 0.24 d | 14.55 ± 0.98 c | 15.09 ± 0.89 c | 16.89 ± 0.33 d | 18.23 ± 0.09 e | 18.15 ± 0.06 e | 4.21 ± 0.06 a | 13.22 ± 0.67 b | 20.31 ± 0.07 f |
| Heptanal | Fresh, Aldehydic, Fatty, Green. | 1.33 ± 0.02 a | 1.19 ± 0.03 a | 1.51 ± 0.33 a | 1.56 ± 0.88 a | 1.77 ± 0.05 a | 2.75 ± 0.08 b | 1.89 ± 0.22 ab | 3.89 ± 0.14 c | 2.68 ± 0.01 b | 5.32± 0.02 d | 2.88 ± 0.23 b | 5.03 ± 0.23 d |
| Benzaldehyde | Almond, fruity, powdery, nutty | 3.28 ± 0.03 b | 3.23 ± 0.02 b | 3.40 ± 0.03 bc | 3.29 ± 0.03 b | 3.11 ± 0.03 b | 3.55 ± 0.11 bc | 3.01 ± 0.16 b | 3.89 ± 0.22 c | 1.80 ± 0.05 a | 6.12 ± 0.07 d | 2.45 ± 0.05 ab | 4.02 ± 0.12 c |
| 2,4-Nonadienal, (E,E)- | Fatty, waxy odor | 5.99 ± 0.05 c | 6.77 ± 0.07 d | 6.84 ± 0.04 d | 7.03 ± 0.29 d | 7.89 ± 0.22 e | 5.73 ± 0.33 c | 8.88 ± 0.71 f | 0.44 ± 0.05 a | 6.04 ± 0.22 c | 0.12 ± 0.05 a | 3.86 ± 0.80 b | 5.95 ± 0.34 c |
| Octanal | Fruit-like odor | 0.29 ± 0.01 ab | 0.32 ± 0.05 ab | 0.33 ± 0.06 ab | 0.21 ± 0.05 ab | 0.99 ± 0.11 bc | 0.45 ± 0.05 ab | 2.77 ± 0.44 d | 0.66 ± 0.09 ab | 0.27 ± 0.55 ab | 0.88 ± 0.03 b | 0.02 ± 0.01 a | 1.35 ± 0.13 c |
| Total | 28.53 ± 0.18 d | 28.57 ± 0.26 d | 27.11 ± 1.01 c | 28.31 ± 1.49 d | 28.31 ± 1.39 d | 27.57 ± 0.1.46 cd | 33.44 ± 1.86 e | 27.11 ± 0.59 c | 28.94 ± 0.89 d | 16.65 ± 0.23 a | 22.42 ± 1.76 b | 36.66 ± 0.61 f | |
| Ketones | |||||||||||||
| Acetophenone | Floral, Almond | 1.25 ± 0.03 ab | 1.21 ± 0.05 ab | 1.01 ± 0.22 a | 1.22 ± 0.56 ab | 1.54 ± 0.04 b | 1.79 ± 0.88 b | 1.41 ± 0.05 ab | 2.50 ± 0.08 c | 1.66 ± 0.07 b | 3.22± 0.11 d | 1.99 ± 0.06 bc | 1.56 ± 0.12 b |
| 2-methyl-5-propan-2-ylcyclohex-2-en-1-one | Spicy, minty, caraway, bread rye bread | 7.77 ± 0.06 bc | 7.99 ± 0.11 b | 7.11 ± 0.08 b | 7.15 ± 0.38 b | 8.20 ± 0.03 bc | 9.66 ± 0.09 d | 8.50 ± 0.32 c | 11.06 ± 0.03 e | 4.47 ± 0.11 a | 12.49± 0.05 f | 8.68 ± 0.33 c | 11.04 ± 0.05 e |
| 2-Heptanone | Fruity, cinnamon | 20.09 ± 0.03 f | 19.55 ± 0.22 f | 23.25 ± 0.14 g | 23.44 ± 0.88 g | 16.25 ± 0.72 d | 15.22 ± 0.07 c | 12.33 ± 0.08 a | 15.74 ± 0.05 cd | 13.11 ± 0.05 ab | 17.73 ± 0.02 e | 14.11 ± 0.55 b | 18.31 ± 0.88 e |
| Total | 29.11 ± 0.12 e | 28.75 ± 0.38 e | 31.35 ± 0.24 g | 31.81 ± 1.82 g | 25.99 ± 0.14 d | 26.67 ± 1.04 d | 22.24 ± 0.45 b | 29.30 ± 0.16 e | 19.24 ± 0.23 a | 33.44 ± 0.17 h | 24.78 ± 0.94 c | 30.91 ± 2.45 f | |
| Terpenes and terpenoids | |||||||||||||
| p-Cymene | Citrus, Sweet, Herbal, Spicy | 3.20 ± 0.07 bc | 3.11± 0.02 bc | 3.09± 0.05 bc | 3.65 ± 0.03 bc | 3.22 ± 0.03 bc | 4.09 ± 0.02 c | 2.88 ± 0.02 b | 5.55 ± 0.21 d | 2.55 ± 0.03 b | 6.99 ± 0.07 e | 1.05 ± 0.22 a | 3.89 ± 0.11 bc |
| β-Myrcene | Balsamic, must, spice | 5.53 ± 0.03 d | 5.12 ± 0.03 d | 4.55 ± 0.03 c | 5.00 ± 0.02 d | 4.01 ± 0.04 bc | 5.50 ± 0.05 d | 3.55 ± 0.03 bc | 5.53 ± 0.05 d | 3.01 ± 0.02 b | 6.49 ± 0.05 e | 2.01 ± 0.05 a | 5.00 ± 0.04 d |
| Total | 8.73 ± 0.10 d | 8.23 ± 0.05 d | 7.64 ± 0.08 c | 8.65 ± 0.05 d | 7.23 ± 0.07 c | 9.59 ± 0.07 e | 6.43± 0.05 bc | 11.08 ± 0.26 f | 5.56 ± 0.05 b | 13.48 ± 0.12 g | 3.06 ± 0.27 a | 8.89 ± 0.05 d | |
| Acids | |||||||||||||
| Benzoic Acid | Faint, balsam | 2.09 ± 0.02 b | 2.71 ± 0.05 bc | 2.55 ± 0.11 b | 1.50 ± 0.10 b | 3.09 ± 0.55 c | 0.67 ± 0.03 a | 03.03 ± 0.04 c | 0.19 ± 0.02 a | 5.09 ± 0.07 d | 0.12 ± 0.02 a | 9.58 ± 0.04 e | 0.55 ± 0.03 a |
| total | 2.09 ± 0.02 b | 2.71 ±0.05 bc | 2.55 ± 0.11 b | 1.50 ± 0.10 b | 3.09 ± 0.76 c | 3.09 ± 0.03 a | 0.67 ± 0.04 c | 0.19 ± 0.02 a | 5.09 ± 0.07 d | 0.12 ± 0.02 a | 9.58 ± 0.04 e | 0.55 ± 0.03 a | |
| Others | |||||||||||||
| Disulfide, dimethyl | Garlic | 4.35 ± 0.05 d | 4.29 ± 0.04 d | 3.22 ± 0.05 c | 3.11 ± 0.88 c | 3.77 ± 0.21 cd | 2.05 ± 0.03 b | 5.22 ± 0.11 e | 0.50 ± 0.04 a | 5.78 ± 0.10 e | 0.11 ± 0.11 a | 7.03 ± 0.43 f | 5.31 ± 0.88 e |
| Total | 4.35 ± 0.05 d | 4.29 ± 0.04 d | 3.22 ± 0.05 c | 3.11 ± 0.88 c | 3.77 ± 0.21 cd | 2.05 ± 0.03 b | 5.22 ± 0.11 e | 0.50 ± 0.04 a | 5.78 ± 0.10 e | 0.11 ± 0.11 a | 7.03 ± 0.43 f | 5.31 ± 0.88 e |
| Samples | Ca | Mg | K | P | Cu | Cr | Ni | Zn | Fe | Mn |
|---|---|---|---|---|---|---|---|---|---|---|
| mg/100 g | mg/100 g | mg/100 g | mg/100 g | mg/100 g | mg/100 g | mg/100 g | mg/100 g | mg/100 g | mg/100 g | |
| IFSF0H | 0.64 ± 0.03 a | 10.31 ± 0.59 a | 179.73 ± 0.88 a | 67.36 ± 0.17 ab | 31.90 ± 0.39 a | 0.26 ± 0.03 a | 0.13 ± 0.05 a | 4.67 ± 0.12 abc | 4.32± 0.05 abc | 0.82 ± 0.88 a |
| IFLp0H | 0.66 ± 0.05 a | 10.47 ± 0.88 a | 180.09 ± 0.73 a | 68.03 ± 0.59 ab | 32.23 ± 0.88 a | 0.30 ± 0.02 a | 0.20 ± 0.03 ab | 4.88 ± 0.22 bc | 4.34 ± 0.03 abc | 0.91 ± 0.36 a |
| IFSF4H | 0.66 ± 0.02 a | 10.50 ± 0.76 a | 180.03 ± 0.92 | 68.55 ± 0.93 ab | 32.03 ± 0.54 a | 0.29 ± 0.08 a | 0.27± 0.04 ab | 4.55 ± 0.13 abc | 4.55 ± 0.11 bc | 0.88 ± 0.37 a |
| IFLp4H | 0.69 ± 0.07 a | 11.01 ± 0.91 ab | 180.09 ± 0.13 a | 68.02 ± 0.69 ab | 33.01 ± 0.71 abc | 0.33 ± 0.02 a | 0.25 ± 0.07 ab | 4.99 ± 0.03 cd | 4.45 ± 0.25 bc | 1.02 ± 0.06 ab |
| IFSF8H | 0.70 ± 0.03 a | 10.66 ± 0.05 ab | 183.99 ± 0.99 b | 68.09± 0.53 ab | 32.55 ± 0.93 a | 0.30 ± 0.05 a | 0.19 ± 0.05 ab | 4.03 ± 0.06 ab | 4.03 ± 0.19 ab | 0.91 ± 0.08 a |
| IFLp8H | 0.91 ± 0.06 a | 11.89 ± 0.04 b | 187.02 ± 0.83 b | 70.23 ± 0.58 b | 36.02 ± 0.71 d | 0.67 ± 0.02 a | 0.57 ± 0.09 b | 5.22 ± 0.03 cd | 4.99 ± 0.08 cd | 1.23 ± 0.09 b |
| IFSF12H | 0.73 ± 0.04 a | 10.90 ± 0.03 ab | 185.82 ± 0.71 b | 67.34 ± 0.53 ab | 31.55 ± 0.94 a | 0.15 ± 0.03 a | 0.15 ± 0.03 a | 4.00 ± 0.05 ab | 3.88 ± 0.17 ab | 1.03 ± 0.05 ab |
| IFLp12H | 1.22 ± 0.08 b | 13.09 ± 0.27 c | 193.03 ± 0.74 c | 73.05 ± 0.98 c | 39.27 ± 0.73 e | 1.20 ± 0.07 b | 1.01 ± 0.07 c | 5.86 ± 0.03 de | 5.58 ± 0.26 de | 1.55 ± 0.03 c |
| IFSF24H | 0.81 ± 0.05 a | 11.00 ± 0.52 ab | 186.09 ± 0.91 b | 66.55 ± 0.82 a | 32.99 ± 0.83 ab | 0.21 ± 0.05 a | 0.25 ± 0.09 ab | 3.89 ± 0.02 a | 3.55 ± 0.21 a | 1.22 ± 0.07 b |
| IFLp24H | 1.79 ± 0.09 c | 15.33 ± 0.18 d | 201.23 ± 0.83 d | 78.12 ± 0.93 d | 42.03 ± 0.94 f | 1.70 ± 0.03 c | 1.33 ± 0.06 cd | 6.52 ± 0.21 e | 6.05 ± 0.87 e | 1.98 ± 0.06 d |
| IFSF48H | 0.84 ± 0.10 a | 10.89 ± 0.32 ab | 185.77± 0.91 b | 65.99 ± 0.83 a | 33.05 ± 0.72 abc | 0.25 ± 0.02 a | 0.29 ± 0.03 ab | 4.01 ± 0.03 ab | 3.72 ± 0.09 ab | 1.44 ± 0.03 c |
| IFLp48H | 1.85 ± 0.08 c | 15.37 ± 0.33 d | 200.88 ± 0.88 d | 79.01 ± 0.59 d | 41.88 ± 0.86 f | 1.78 ± 0.04 c | 1.42 ± 0.05 cd | 6.77 ± 0.35 e | 6.29 ± 0.18 e | 2.02 ± 0.07 d |
Publisher’s Note: MDPI stays neutral with regard to jurisdictional claims in published maps and institutional affiliations. |
© 2022 by the authors. Licensee MDPI, Basel, Switzerland. This article is an open access article distributed under the terms and conditions of the Creative Commons Attribution (CC BY) license (https://creativecommons.org/licenses/by/4.0/).
Share and Cite
Vasilica, B.B.; Chiș, M.S.; Alexa, E.; Pop, C.; Păucean, A.; Man, S.; Igual, M.; Haydee, K.M.; Dalma, K.E.; Stănilă, S.; et al. The Impact of Insect Flour on Sourdough Fermentation-Fatty Acids, Amino-Acids, Minerals and Volatile Profile. Insects 2022, 13, 576. https://doi.org/10.3390/insects13070576
Vasilica BB, Chiș MS, Alexa E, Pop C, Păucean A, Man S, Igual M, Haydee KM, Dalma KE, Stănilă S, et al. The Impact of Insect Flour on Sourdough Fermentation-Fatty Acids, Amino-Acids, Minerals and Volatile Profile. Insects. 2022; 13(7):576. https://doi.org/10.3390/insects13070576
Chicago/Turabian StyleVasilica, Beldean (Tătar) Bianca, Maria Simona Chiș, Ersilia Alexa, Carmen Pop, Adriana Păucean, Simona Man, Marta Igual, Kovacs Melinda Haydee, Kovacs Emoke Dalma, Sorin Stănilă, and et al. 2022. "The Impact of Insect Flour on Sourdough Fermentation-Fatty Acids, Amino-Acids, Minerals and Volatile Profile" Insects 13, no. 7: 576. https://doi.org/10.3390/insects13070576