Article

Biodiversity and Distribution of Reticulitermes in the Southeastern USA

by
Allison Johnson
* and
Brian T. Forschler
Department of Entomology, University of Georgia, Athens, GA 30602, USA
*
Author to whom correspondence should be addressed.
Insects 2022, 13(7), 565; https://doi.org/10.3390/insects13070565
Submission received: 2 June 2022 / Revised: 17 June 2022 / Accepted: 20 June 2022 / Published: 22 June 2022

Abstract

:

Simple Summary

Describing global biodiversity involves identifying species and describing their distributions. The subterranean termite genus Reticulitermes represents an important group of wood-destroying organisms; however, little is known about their species-specific distribution across the three northern hemisphere continents where they are endemic. We combined several taxonomic methods to identify the species of over 4000 specimens in the first statewide survey of subterranean termites from Georgia, USA. The area surveyed, 153,900 km2, represents eco-regions typical of most of the southeast and eastern seaboard of the United States. There were three species, R. flavipes, R. virginicus, and R. nelsonae, found throughout Georgia. R. malletei was predominantly collected in the northern Piedmont soil province, while R. hageni, the least encountered species, was not collected from South Georgia. Our findings support the need for a taxonomic revision of the genus Reticulitermes, agreement on an appropriate integrated taxonomic approach for species determination, and should stimulate future research on diverse topics such as biodiversity, monitoring for these structural pests, and identifying their role in forest ecosystems.

Abstract

Reticulitermes subterranean termites are widely distributed ecosystem engineers and structural pests, yet describing their species distribution worldwide or regionally has been hindered by taxonomic uncertainties. Morphological plasticity confounds the use of taxonomic keys, while recent species descriptions and molecular techniques lacking taxonomic support have caused a muddle in interpreting the literature on Reticulitermes species distributions. We employed an integrative taxonomic approach combining behavioral, morphological, and molecular techniques to identify 4371 Reticulitermes samples to species. Five Reticulitermes species were collected from wood-on-ground at 1570 sites covering 153,900 km2 in the state of Georgia, USA. Three species were collected throughout Georgia, with R. flavipes identified from every one of the 159 counties. R. nelsonae was the second most frequently collected species, found in 128 counties, with R. virginicus third with 122. Two species had distributions confined to the northern part of the state. R. malletei was collected from 73 counties, while the least collected species, R. hageni, was found in 16. Results show that the most recently described species (R. nelsonae, 2012) is widely distributed and the second-most frequently encountered termite, representing 23% of all samples. The invasive species R. flavipes represented half of all the samples collected, while R. hageni, the least at less than 1%. A search of GenBank identified a number of accessions mismatched to a species designation resulting in the literature under-reporting the biodiversity of the genus. We, therefore, outline a path to standardize methods for species identification using an integrated taxonomic approach with appropriate barcodes for consistent identification across research teams worldwide. The data also illuminate new opportunities to examine questions related to the ecology, evolution, dispersal, and resource partitioning behaviors of these sympatric species across distinct geographical regions.

1. Introduction

Biodiversity is a term used to describe the variety of living organisms on Earth that is founded on the nomenclature used to identify an animal life form to a species designation. A number of broad issues constrain delineating species, not the least of which are long-standing, global concerns affecting all biological systems, including the taxonomic impediment [1], taxonomic wrong-headiness [2], and lack of consensus on appropriate integrative methods for species identification [3,4,5,6,7] all contingent on adherence to the internationally agreed codes of rules for animals outlined in International Code of Zoological Nomenclature (ICZN) [8]. Measuring insect biodiversity is a critical component of understanding the impact of anthropogenic changes affecting life on Earth, as exemplified by discussions surrounding the so-called insect apocalypse [9,10]. The acknowledged diversity of insects, however, requires using a common system for identifying species that, if not consistent across studies, often hinders comparing results on any number of topics, including insect distributions [11].
The renowned ecological and economic impact of subterranean termites [12,13,14,15] has not translated into a concerted effort to understand the global distribution of Reticulitermes species across their Holarctic range. Subterranean termite risk maps of the USA place Georgia, and surrounding states, in the middle of a ‘very-high hazard’ termite belt [13,16,17,18]. Acknowledging the dense populations in the region has, however, translated into few concerted appraisals of Reticulitermes distributions in that same area. Impediments for synthesizing termite distribution data from the literature include the variety of techniques used to collect Reticulitermes, such as examining wood on ground, in-ground surveillance/monitoring devices, light traps, collections from Pest Management Professionals (PMPs) or property owners, and museum collections (Tables S1 and S2). Discerning Reticulitermes distributions in the southeastern USA from the literature is also complicated by two species descriptions in the last thirty years [19,20], meaning that surveys completed before 2012 should be interpreted with discretion. Nelson et al. [21] eloquently, more than a decade ago, detailed the main obstacles to Reticulitermes species identification while echoing the call for a taxonomic revision of the genus that goes back over 50 years [22].
The usefulness of taxonomic keys for Reticulitermes species identification is confounded by morphological plasticity and resulting range of phenotypes [21,23,24,25,26,27]. Molecular markers have numerous advantages for obtaining consistent across-research program species identification, yet markers used for Reticulitermes identification in the southeastern USA have been published with questionable, if any, taxonomic support, especially prior to 2012 rending those designations suspect [21,28,29,30]. An integrative taxonomic approach [ITA] using molecular markers must include reference sequences associated with specimens identified by morphology, behavioral attributes, or chemical signatures to interpret phylogenies and increase the confidence in species designations [3,31,32].
The objective of this study was to identify specimens using an ITA-validated mtDNA marker applied to 4371 samples collected from wood-on-ground (WoG) at 1570 wildland sites over the entire state of Georgia, USA, to illuminate species distributions and proportions. Results are reported for five described species, Reticulitermes flavipes (Kollar) 1837 (Rf), R. virginicus (Banks) 1907 (Rv), R. hageni Banks 1920 (Rh), R. malletei Clément et al. 1986 (Rm), R. nelsonae Lim and Forschler 2012 (Rn) and discussed in relation to the literature on the taxonomy, ecology, evolution, management, and future research directions with these pestiferous ecosystem engineers.

2. Materials and Methods
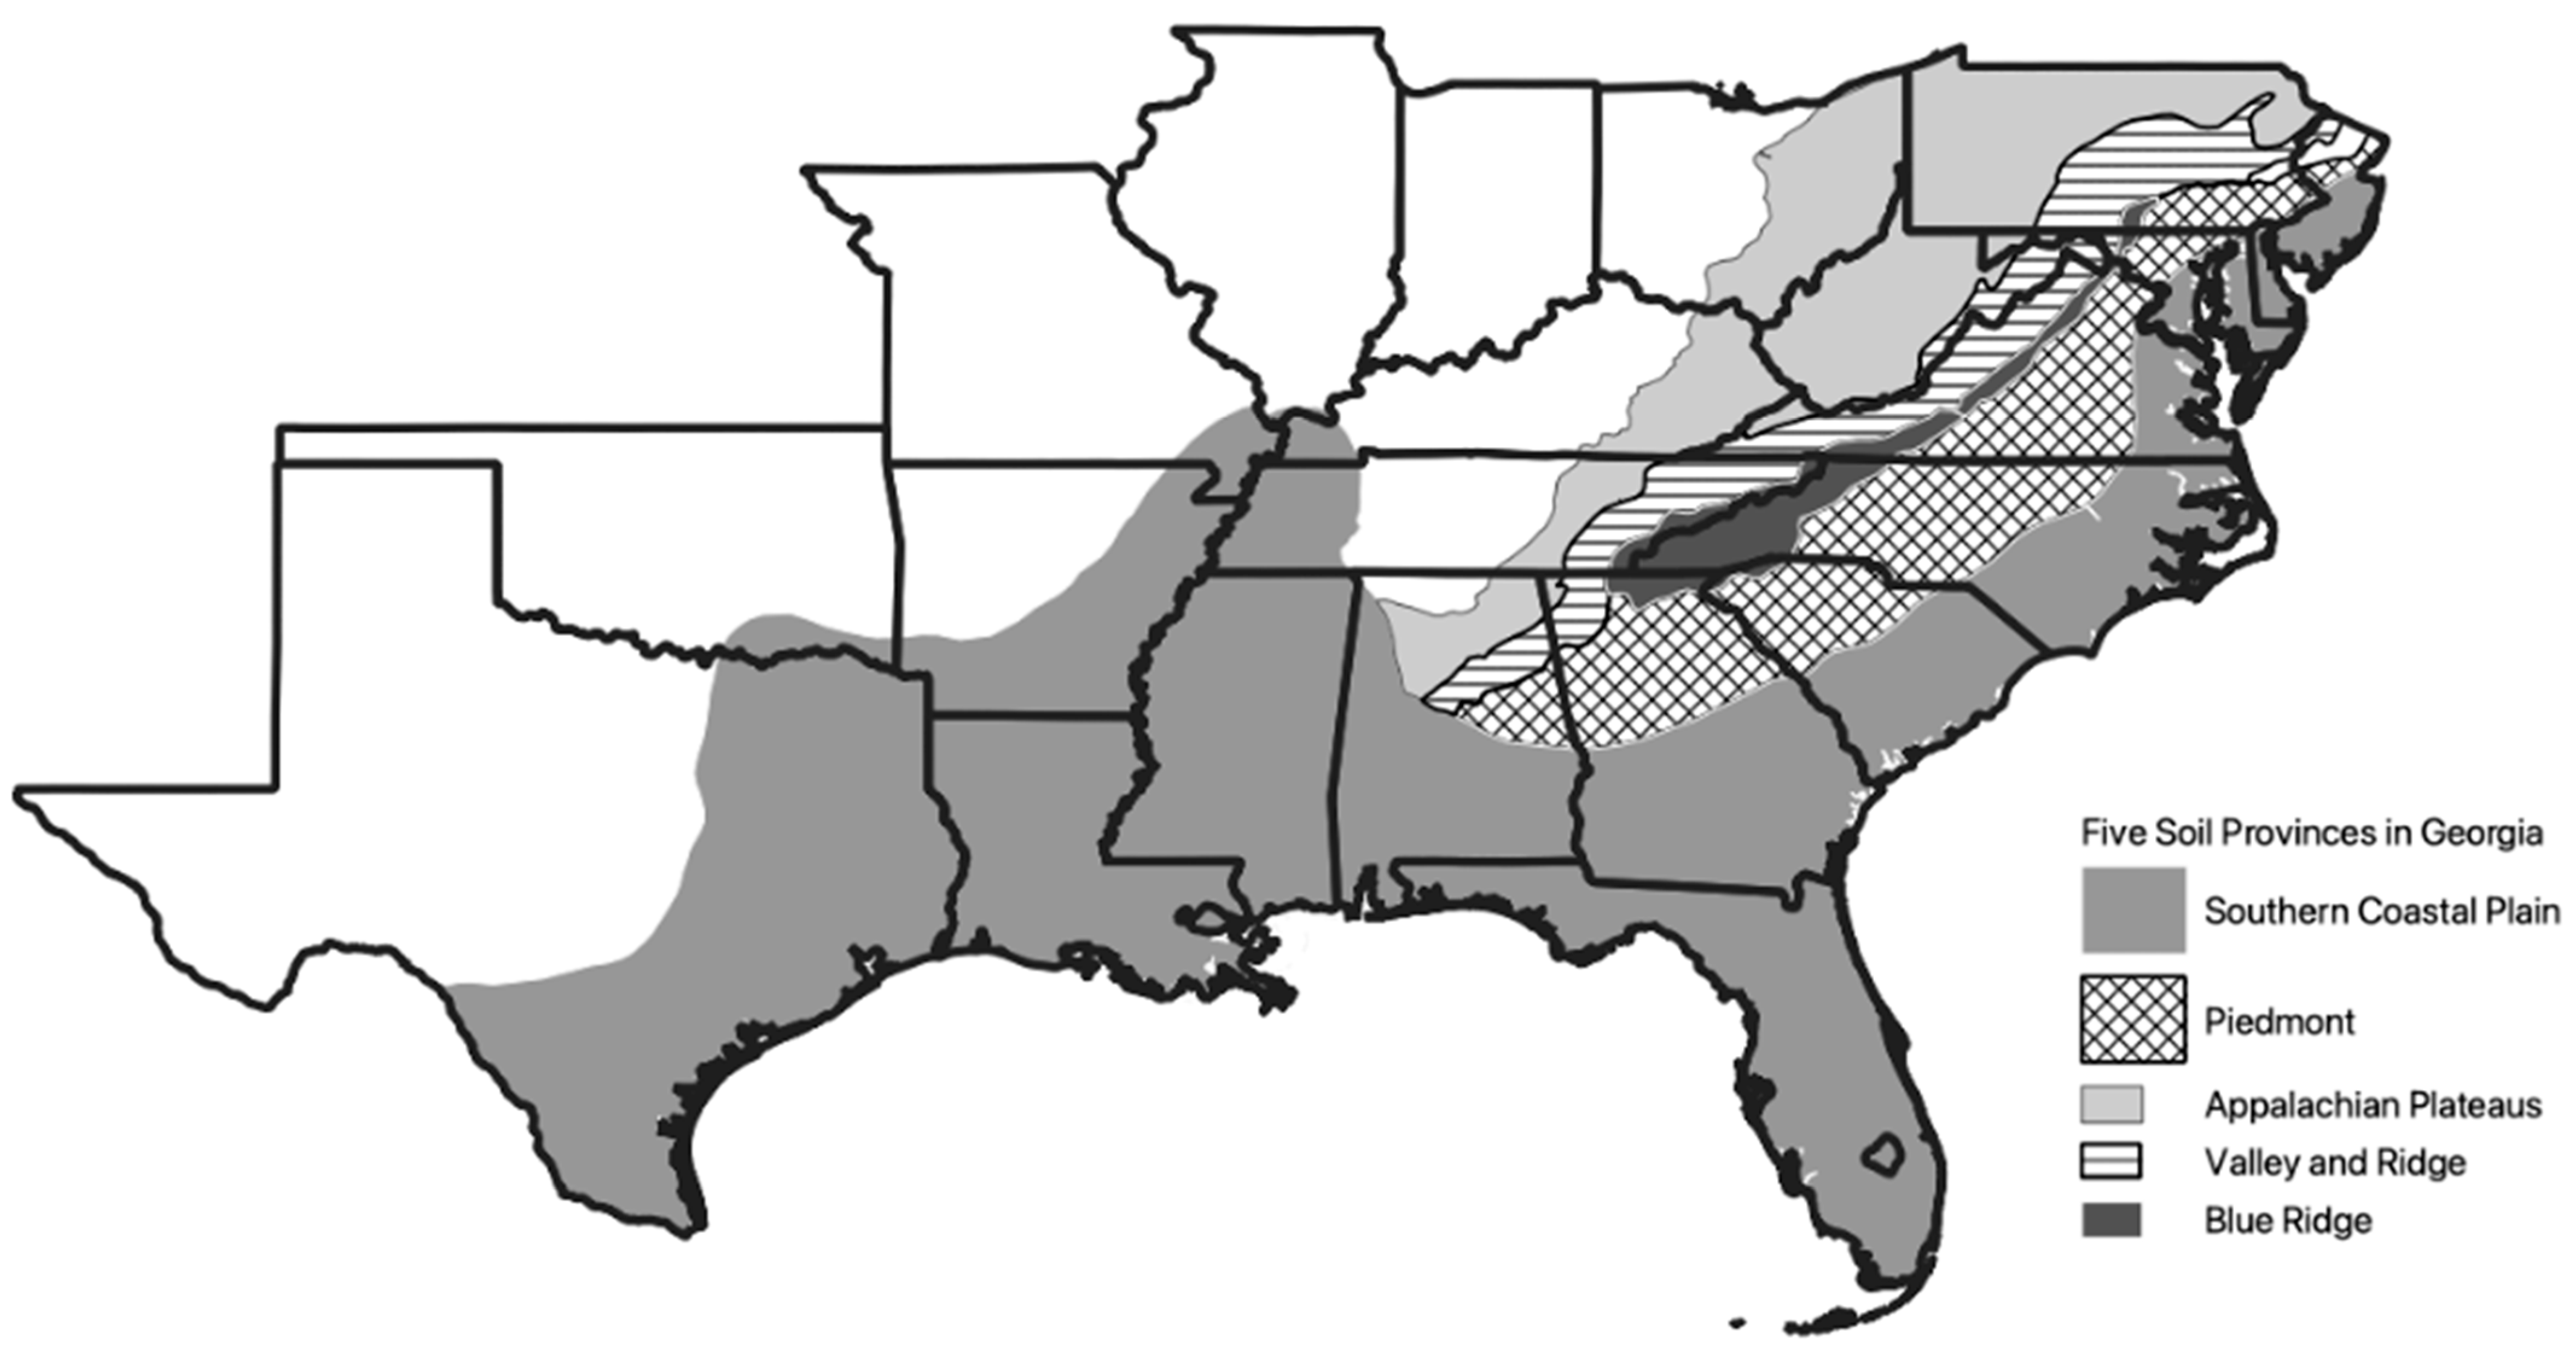
2.1. Sample Area

This survey sampled over 153,900 km2 or the entire state of Georgia, USA, and with 1570 sampling sites provided, on average, a sample for every 98 km2 between 30–35° N, 85–81° W. Georgia includes five soil provinces following the USDA-NRCS classification [33], with elevations ranging from 0–1400 m [34]. The two largest geographical regions, Piedmont and Coastal Plain, are separated by the Fall Line, a prehistoric shoreline during the Cretaceous period (66–140 mya) (Figure 1). The Fall Line extends from Alabama to New Jersey, separating the Piedmont from Coastal Plains in those southeastern states [35]. The land south of the Fall Line was subject to cycles of rising and falling sea levels during the quaternary period as the shoreline receded to present-day levels exposing the Coastal Plains and Atlantic Coastal Plains Soil Provinces between 20–5 million years ago [36].

2.2. Sample Collection

Samples were collected by a single collector from January 2015 to March 2017 from wood on ground (WoG) off of state highways and roads in Georgia, USA. Sampling routes were chosen based on access by roadways that provided coverage of accessible areas of every county (n = 159) in the State. Sampling was conducted within a 100 m radius of a GPS-recorded point termed a site, and there were 5–17 sites in each county. Sampling was conducted by locating all wood on ground (WoG) such as stumps, logs, or coarse woody debris and opening the WoG using a hatchet and chisel to collect all termites into vials of 100% ETOH. The number of samples per site ranged from 1 to 7. The survey included 4371 samples from 1570 sites (1 site per 98 km2) across all counties (n = 159) in the State of Georgia, USA.

2.3. Sample Processing

One termite from each sample was processed by extracting Genomic DNA using an adapted protocol (Supplemental Materials, Sample Preparation) from the Wizard® Genomic DNA Purification Kit (Promega, Fitchburg, WI, USA). Resuspended DNA was amplified using a 10 μL volume PCR protocol (Supplemental Materials, Sample Preparation) with published primers Modified A-t Leu [37] and B-t Lys [38]. PCR conditions were set in an Eppendorf Mastercycler X50s (Hamburg, Germany) at 95 °C for 2 min (1 cycle), 95 °C for 15 s, 53 °C for 15 s, and 68 °C for 45 s (35 cycles), followed by an extension of 68 °C for 5 min (1 cycle). The PCR product was purified using enzymatic digestion of 0.2 μL Exonuclease I (New England Biolabs, Ipswich, MA, USA) and 0.2 μL Calf Intestinal Alkaline Phosphatase (Quick CIP; New England Biolabs, Ipswich, MA, USA) per reaction. PCR purification conditions were set in an Eppendorf Mastercycler X50 s (Hamburg, Germany) at 37 °C for 15 min (1 cycle) and 85 °C for 15 min (1 cycle). The product was diluted 1:1 with Type 1 Ultrapure Water (Direct-Q 3 UV; Millipore Sigma, Burlington, MA, USA). Purified PCR product was sent to Eurofins Genomics (Eurofins, Louisville, KY, USA) for 96-Well Microplate Sanger sequencing.

2.4. Sample Identification

A reference sequence (Table S2) was an mtDNA haplotype attributed to a species designation from a sample, identified using morphology and flight phenology [27]. The reference sequences were included in a GTR + G + I model maximum likelihood tree with 1000 bootstrap replicates in IQ-TREE v2.6.12 to identify species-specific clades [39]. A published Coptotermes formosanus sequence (Ref no. AY683218) from GenBank was utilized as the extant group. Species designations for all haplotypes were inferred based on alignment with the aforementioned reference sequences in trees annotated and visualized in FigTree v1.4 (http://tree.bio.ed.ac.uk/software/figtree/: accessed on 12 May 2022).

2.5. GIS Visualization

All site coordinates were recorded with a GPS unit and compiled in an open-source geospatial information system (GIS) with identification attributes. Reticulitermes distribution across Georgia’s geographic features was visualized in QGIS Geographic Information System v 3.22.3 (QGIS Association; http://www.qgis.org: 28 March 2022). Features included a base map from the Georgia Association of Regional Commissions and 2016 Major Land Resource Areas soil survey data.

2.6. Spatial Data Analysis

Clark and Evans aggregation indices and Kernel Density Estimation maps were analyzed and developed in R 4.1.2 (The R Foundation for Statistical Computing, Vienna, Austria) using maptools, rgdal v1.5-28, sf v1.0-7, sp, and spatstat v2.3-3 packages [40,41,42,43,44]. Edge effects for Clark and Evans aggregation indices were corrected using the state border of Georgia as a guard buffer. Hill Numbers [45] for species richness and diversity were calculated for species at sites from the entire state as well as above and below the Fall Line [46]. Exponential Shannon entropy indices (H1) were calculated using:
e^(−Σpi × ln(pi))
where pi is the proportion of species collected from sites [47]. Hill Number (H2) was calculated using:
1/(Σn(n − 1)/(N(N − 1)
where N is the total number of species collected from sites and n is the total for each species collected from sites [48].

3. Results

3.1. Survey

We collected termites from all 159 counties at 1570 wildland sites illuminating the ubiquity of Reticulitermes as part of the soil macroarthropod fauna in Georgia. There were 78 sites (5%) where we collected three species, 643 sites (41%) had two species, 851 (54%) sites provided one species, and there were no sites where we identified four or more species. On a broader scale, 100% of the counties (P = 159) supplied at least two species, including five species from 7 counties, four species from 32 counties, three species from 98 counties, and two species in 22 counties (Figure S1). R. flavipes, R. virginicus, and R. nelsonae were collected throughout the state while R. malletei and R. hageni were found only in counties north of the 32nd parallel roughly approximating the geologic featured called the Fall Line (Figure 1).
Reticulitermes flavipes was the most frequently encountered termite, identified from every county in Georgia (P = 159), collected at 1131 sites (72%), and represented in 2260 samples (52%) that were distributed almost equitably north (53%) and south (51%) of the Fall Line (Figure 2, Table 1). Reticulitermes nelsonae was the second most common species collected statewide at 128 counties (81%), 559 sites (36%), and 1031 samples (23%) (Table 1). R. nelsonae was found in a higher proportion of counties below the Fall Line (99%) than above (60%) and represented 34% of samples south and 11% north of the Fall Line (Table 1). Reticulitermes virginicus was identified statewide from 318 sites (20%) and 122 counties (78%), with a slightly higher proportion of counties below (84%) than above (70%) the Fall line (Table 1). Statewide, R. virginicus was 11% of all samples (n = 494), with the proportion north of the Fall line (7%) more than doubled (15%) south of that geologic feature (Table 1). Reticulitermes malletei was identified from 73 counties (46%), collected at 323 sites (21%) with a much higher proportion of counties above (95%) than below (5%) the Fall Line (Table 1). R. malletei was represented statewide in 557 samples (13%) divided into 28% above and > 1% below the Fall Line (Table 1). Reticulitermes hageni was the least collected species identified from 18 counties (11%), 21 sites (1%), and 29 samples (> 1%), with all collections (100%) north of the Fall Line (Figure 2, Table 1).

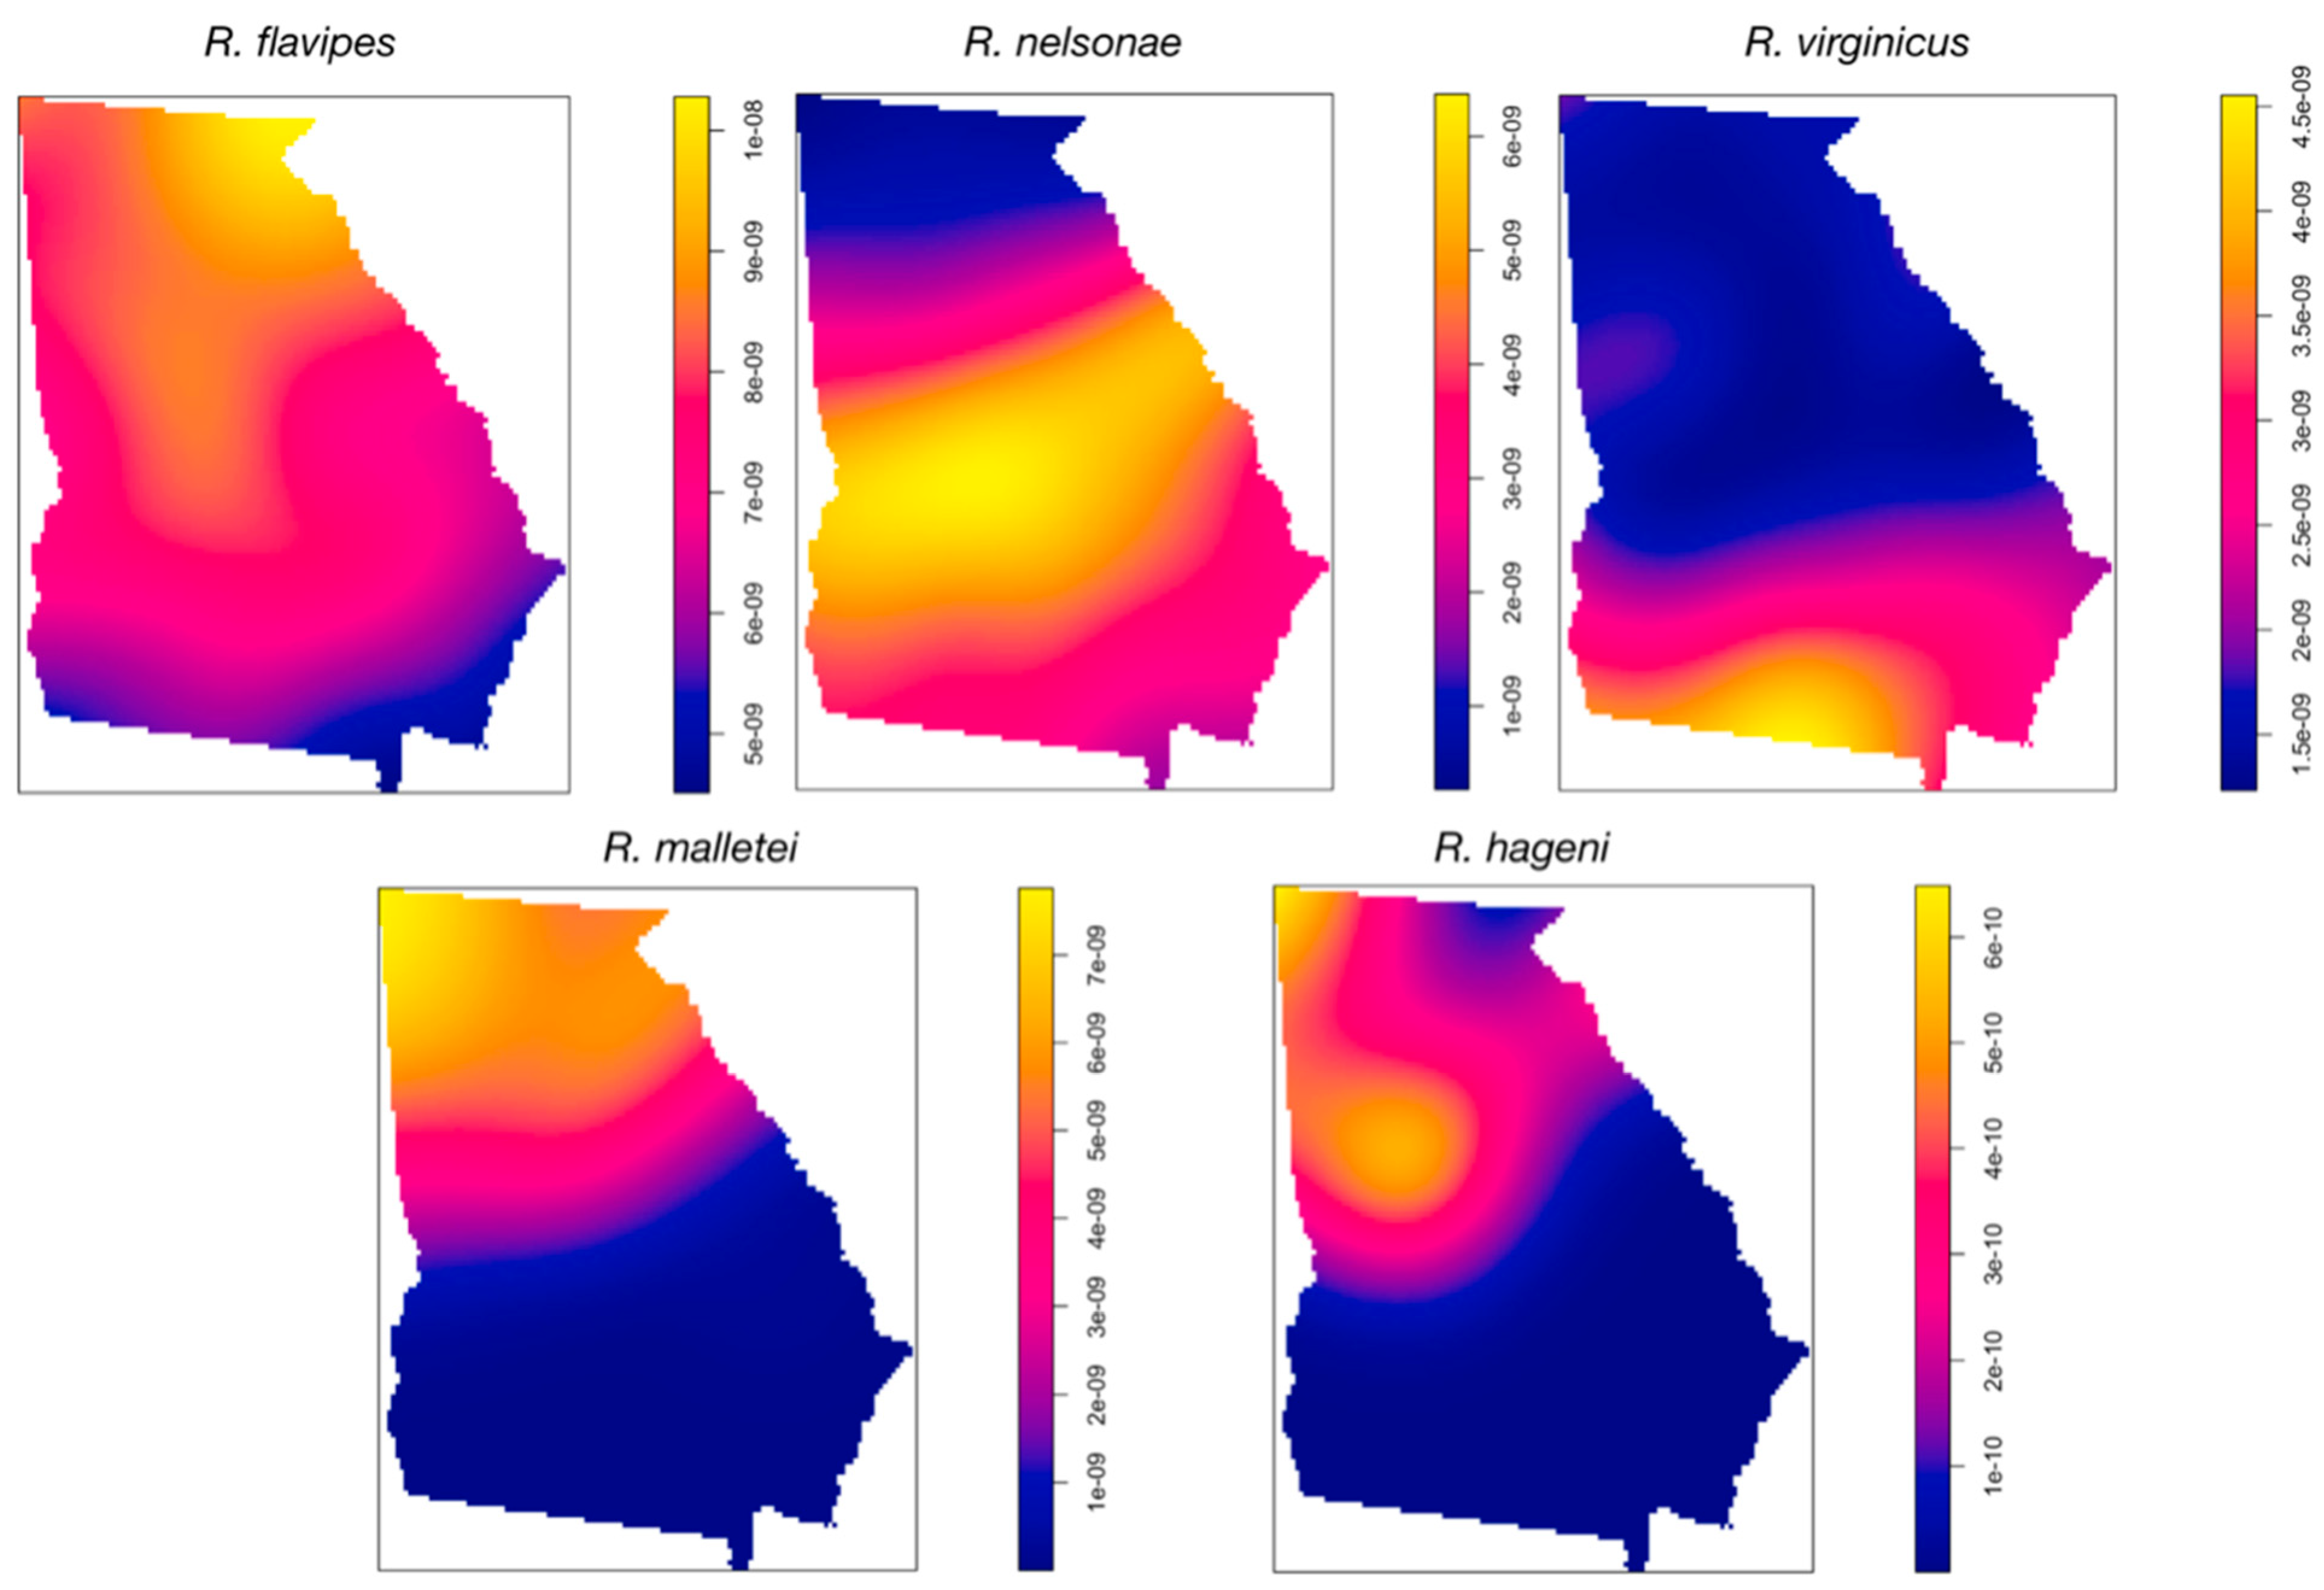
3.2. Spatial Data Analysis

Hill Numbers (r = 0, 1, 2, ∞) support the aforementioned distributions because there were N0 = 5 species collected north the Fall Line (N1 = 3.55) compared to N0 = 4 south (N1 = 2.88) (Table 2). Hill Number (N2) Reciprocal Simpson’s index values likewise reflected the species distributions for above and below the Fall Line, N2 = 3 and N2 = 2.65, respectively (Table 2). Clark and Evans aggregation indices supported a regular distribution for Rf, Rn, and Rv across the state, while Rm and Rh had significantly clustered distributions in the northern part of the state (Table 3). Kernel Density Estimation [kde] maps illustrate the interplay between site and county distributions. Despite being distributed throughout the state, Rn was more prevalent in the south (Figure 3). Rv, despite its statewide distribution, was, proportionally, more frequently collected in the southern part of the state while Rm and Rh clustered north of the Fall Line (Figure 3).

4. Discussion

The survey identified five Reticulitermes species across a landmass encompassing ecological sub-regions representative of the southeastern United States east of the Appalachian Mountains into the mid-Atlantic states (Figure 1) [35]. The transition zone between the Piedmont and the Southern Coastal Plains, formed about 500 million years ago (the Fall Line), is a demarcation of an ancient shoreline bordering a shallow sea that started receding 20 mya before taking its current position about 5 mya [36]. An examination of species proportions across Georgia shows widespread, regular distributions for Rf, Rn, and Rv, while Rh and Rm were found predominantly north of the Fall Line. This biogeographic distribution, similar to Loxoceles reclusa in the same state [49], raises interesting questions about the evolution and dispersal abilities of these species that should inspire future research projects.
A literature search of termite field studies in the southeastern USA published between 2012–2022 turned up 6 of 17 that mention either R. malletei or R. nelsonae (Table S3). The prevalence of R. nelsonae in Georgia, collected in 81% or 128 counties statewide, including 99% of counties and 34% of samples south of the Fall Line (Table 1), provides solid evidence it has been underrepresented in the literature. Strict deference to literature published before the descriptions of R. malletei and R. nelsonae can skew Reticulitermes distribution estimates and underestimate the biodiversity of this genus across a wider geographic area. The only published dichotomous key to all five eastern Reticulitermes species [27] states that Rn has a southerly distribution, which the present data clearly disputes while highlighting the possibility that much of the Rh reported from the southeastern USA are Rn [30,50,51,52,53,54,55]. We present three lines of evidence, morphological, behavioral (flight phenology), and genetic, to rationalize a re-examination of the species distributions in the United States and present a path toward a concerted global effort to identify Reticulitermes biodiversity.
Characteristic of the genus, a comparison of morphological measurements from descriptions of Rh and Rn reveals no quantifiable characters that clearly separate the diagnostic castes, although Rn alates are generally smaller (7.08 ± 0.29 mm) than Rh (7.81 ± 0.31 mm) [27,56]. The same ‘phenotypic overlap’ is revealed with qualitative characters where Rh “winged” forms were described as “Pale yellowish brown”, similar to the Rn “alate” described as “Body pale brown” [27,56]. There is, however, a significant behavioral character, flight phenology, that separates Rn from Rh. The description of Rh includes an alate Type Specimen collected north of the Fall Line, in Falls Church, Virginia, and the description states “In the vicinity of Washington (DC sic), hageni flies the later part of July or early in August” [56,57]. The description also contains the following entry: “Occurs from Florida (Jacksonville, April 29) to Maryland west to Illinois and Texas”, which has generally assumed to reference an ‘out-of-place’ collection of alates from FL in late April [56]. It is understandable prior to the description of Rn that passage in the original description provoked identifying ‘light-colored’ adult termites flying in Florida in springtime as Rh [24,55]. The original description of Rn reports adults collected in February, March, and May, while the present survey provided five Rn alate samples dated March and April [56]. All the ITA verified Rh (n = 17) in our archived assembly of alates (unpublished data) were collected in July–September. Rn flight phenology strongly suggests that the “R.h.” collected from springtime swarms in the United States should, regardless of precedence and in light of the more recent species description, be considered Rn.
The molecular markers (COI, COII, or 16S sequence) used to identify the five focal Reticulitermes species provide an equally compelling argument for the prevalence of Rn in southeastern USA. We searched GenBank and included sequences attributed to the five species with the ITA reference sequence (Table S2) to produce phylogenies (Figure 4). We found (186) COI GenBank accessions assigned to Rf, Rv, Rh, Rm, and Rn, and 185 aligned with their respective ITA-reference sequence except for one anomaly, collected in Florida, attributed to Rh that aligns with Rn (Figure S2, Table S4). COII accessions from GenBank attributed to all Rf (n = 558), Rn (4), and Rm (8) agreed with the ITA references, including an Rn sample collected in Louisiana and an Rm from Mississippi [58], which extends the western range of both species. The southern range of Rn was illuminated by three samples from Florida, including one of our ITA references [27,58]. There were 29 COII accessions in GenBank attributed to Rv, of which 21 agreed with the reference sequence while seven direct submissions grouped with Rn and one with Rm references (Figure 4, Table S4). There were nine Rh Genbank accessions and five grouped with the reference sequences, while anomalies included previously published incongruous Rh accessions that, unfortunately, have been used in studies published in the past decade (Table S4). There were four ‘Rh’ COII accessions, including one collected in Arkansas and seven ‘Rh’ 16S accessions, with one collected in Brazos, TX, that grouped with the Rn references, further extending the potential western distribution of Rn (Table S4). We posit, given the aforementioned morphological, behavioral, and genetic evidence and because we collected Rh infrequently (< 1% of > 4000 samples) and only from North Georgia, that the historic range of Rh has been overestimated and that of Rn underestimated.
Reticulitermes malletei, originally described from specimens collected near Athens, Georgia, in 1986 using chemical characters later clarified with morphological and genetic characters in 2007, has been reported from AL, MD, NC, SC, DE, GA, and MS [19,27,58,59,60,61,62]. The distribution of Rm from this survey (Figure 2), almost exclusively in north Georgia (Figure 1), coincides with its’ published range along the eastern coastal states, yet when combined with a GenBank accession from Indiana, our reference sequence from Mississippi and a GenBank accession from the same state [59] (Table S4) begs further investigation of their western distribution. The qualitative phenotypic character “dark wings” used in dichotomous keys for both Rm and Rf likely provoked misidentification affecting historic range estimates for Rm [20,63,64]. Quantifiable morphological characters for Rm and Rf overlap for the soldier caste while for the adult ablw measurements show Rm to be, in general, smaller (8.23 ± 0.39 mm) than Rf (8.97 ± 0.40 mm) [20]. The adult Rm from this survey were collected in May–June and Rf from February–May, indicating a temporal overlap that needs further clarification.
These data represent the largest survey of WOG over a contiguous land area, 153,900 km2, ever conducted for subterranean termites in the United States, but we caveat it should not be considered definitive. This research program, for example, has been located in Clarke County, Georgia, for 20 years, and we have collected Rh and Rv on several occasions, although the present survey did not collect either species in that county (Figure 2). This survey of wildland sites also failed to collect another invasive subterranean termite, Coptotermes formosanus, despite our program having identified C. formosanus from the built environment in Atlanta, Columbus, Savannah, Brunswick, Hinesville, and Thomasville, Georgia, in addition to a wildland site on Cumberland Island. Notwithstanding that proviso, the collection data from this extensive survey, when combined with examination of GenBank accessions and published literature, illuminated how Reticulitermes biodiversity in the eastern United States has been underestimated. The Reticulitermes literature in the USA continues to reference any number of approaches to species identification without heeding the taxonomic inconsistencies discussed 15 years ago [21].
The difficulties associated with identifying biologically cryptic insect complexes that display phenotypic plasticity make Reticulitermes an ideal candidate for species-specific molecular markers [65,66,67,68]. The monophyletic status of the genus makes it appropriate for a common set of ICZN-compliant, ITA-supported molecular marker(s) for species determination [69,70,71]. A common DNA barcode should interface with datasets of worldwide biodiversity and could set the foundation for broader discussions on a unified definition of what constitutes a species within this genus [72,73]. We suggest Reticulitermes surveys employ an ITA-validated mitochondrial DNA marker, specifically COI and/or COII sequence, as the species marker of choice given their widespread employment and reported advantages while acknowledging potential conflicts of linking phenotype with genotype [74,75]. We conducted a simple proof-of-concept test using the 55 COII reference sequences from this survey (Table S2) with GenBank accessions attributed to Reticulitermes species from the Western USA, Europe, and Asia (Table S5). All published species separated into strongly supported species-specific clades suggesting the utility of that mtDNA marker on a global scale (Figure 5). It is likely that the 16S sequence is too conserved to be useful across a global survey as there were 2 Rm 16S-haplotypes obtained from 22 samples collected across five states (estimated 1045 km linear distance), while we identified 15 Rm COII-haplotypes from 29 samples across five counties in north Georgia (estimated 60 km linear distance) [60,76]. In addition, attempts to corroborate 16S GenBank accessions for Rf, Rh, Rv, Rm, and Rn were thwarted by entries containing premature stop codons and ambiguities, leaving disproportionate gaps in the multiple sequence alignment needed for analysis [51,52,65,77]. Microsatellite markers or other electromorphs would be least preferred because they exhibit a propensity toward size homoplasy that would require additional research to verify repeatability and corroborate with IZCN-validated species designations [78,79,80].
This survey illustrates that subterranean termite biodiversity has been underestimated in the eastern United States and adds voice to the need for a concerted effort to develop a worldwide database suitable for assisting a generic taxonomic revision of Reticulitermes. That species complex would benefit from a formal reorganization following the ICZN code to provide an appropriate interpretation of the taxonomic literature and help correct the current muddle associated with inappropriate species attributions in the literature and datasets such as GenBank. In the meantime, the research community is encouraged to employ ITA-validated molecular markers to appropriately address biologically relevant research. Delineating species-level subterranean termite biodiversity should inspire future research in a broad array of topics, including evolution, ecology, sympatry, resource partitioning, and meaningful, identification-based pest-status monitoring of these important ecosystem engineers.

Supplementary Materials

The following supporting information can be downloaded at: https://www.mdpi.com/article/10.3390/insects13070565/s1, Supplementary Materials: Sample Preparation; Figure S1: Map of the State of Georgia showing the number of Reticulitermes species collected per county; Table S1: List of publications that provide information on subterranean termite species distributions in the Eastern United States; Table S2: GenBank Accession numbers for the ITA-Verified COI and COII sequences termed Reference Sequence; Table S3: Citations for the 17 Reticulitermes field surveys in the SE USA published between 2012–2022; Figure S2: Results from 213 partial COI sequences including ITA-Verified reference sequence and the one anomalous GenBank accession attributed to Rh that grouped with Rn references in a collapsed Maximum-Likelihood GTR + G + I tree topology; Table S4: COI, COII, and 16S accessions included in Maximum-Likelihood phylogenies with ITA-verified references that did not align in a clade matching the GenBank species designation; Table S5: Accession numbers for the 16 COII sequences used to construct the global comparison phylogeny in Figure 5.

Author Contributions

B.T.F. conceived and funded the research. A.J. organized, prepared, and identified samples and analyzed results. All authors have read and agreed to the published version of the manuscript.

Funding

This research was funded by the Georgia Department of Agriculture through Rule 620-3-.01(2) of the Georgia Pest Control Act.

Data Availability Statement

The data presented in this study are available on request from the corresponding author. A portion of the data is not publicly available due to time constraints in placing all 4000 samples into GenBank and pending publication of those same data in an examination of haplotypes.

Acknowledgments

We sincerely thank Jim Chase (Retired, Terminix) for collecting and donating all termite specimens identified in this survey. We also thank Olivia Katz, Hadden Duling, and Jake Wasdin for their assistance with sample maintenance and organization, as well as Jacob Winkles for data management, analysis, and figure creation. We dedicate this work to Kunio Tsunoda and Tsuyoshi Yoshimura for their support and inspiration due to their remarkable dedication researching wood destroying organisms while pursuing a relentless commitment to grooming the next generation of Isopterists.

Conflicts of Interest

The authors declare no conflict of interest.

References

  1. Engel, M.S.; Ceríaco, L.M.; Daniel, G.M.; Dellapé, P.M.; Löbl, I.; Marinov, M.; Reis, R.E.; Young, M.T.; Dubois, A.; Agarwal, I.; et al. The taxonomic impediment: A shortage of taxonomists, not the lack of technical approaches. Zool. J. Linn. Soc. 2021, 193, 381–387. [Google Scholar] [CrossRef]
  2. Lobl, I. Assessing biotic diversity: The glorious past, present, and the uncertain future. Bull. Entomol. Soc. Malta 2018, 10, 5–15. [Google Scholar]
  3. Sharkey, M.J.; Janzen, D.H.; Hallwachs, W.; Chapman, E.G.; Smith, M.A.; Dapkey, T.; Brown, A.; Ratnasingham, S.; Naik, S.; Manjunath, R.; et al. Minimalist revision and description of 403 new species in 11 subfamilies of costa Rican braconid parasitoid wasps, including host records for 219 species. ZooKeys 2021, 1013, 1–665. [Google Scholar] [CrossRef] [PubMed]
  4. Cardenas, C.R.; Luo, A.R.; Jones, T.H.; Schultz, T.R.; Adams, R.M.M. Using an integrative taxonomic approach to delimit a sibling species, Mycetomoellerius Mikromelanos Sp. Nov. (Formicidae: Attini: Attina). PeerJ 2021, 9, e11622. [Google Scholar] [CrossRef] [PubMed]
  5. Kjærandsen, J. Current state of DNA barcoding of sciaroidea (Diptera)—Highlighting the need to build the reference library. Insects 2022, 13, 147. [Google Scholar] [CrossRef]
  6. Petrović, A. Sizing the knowledge gap in taxonomy: The last dozen years of aphidiinae research. Insects 2022, 13, 170. [Google Scholar] [CrossRef]
  7. Dubois, A.; Ohler, A.; Pyron, R.A. New concepts and methods for phylogenetic taxonomy and nomenclature in zoology, exemplified by a new ranked cladonomy of recent amphibians (Lissamphibia). Megataxa 2021, 5, 1–738. [Google Scholar] [CrossRef]
  8. Ride, W.D.L. International Commission on Zoological Nomenclature, 4th ed.; International Union of Biological Sciences; Natural History Museum: London, UK, 1999. [Google Scholar]
  9. Wagner, D.L.; Grames, E.M.; Forister, M.L.; Berenbaum, M.R.; Stopak, D. Insect decline in the Anthropocene: Death by a thousand cuts. Proc. Natl. Acad. Sci. USA 2021, 118, e2023989118. [Google Scholar] [CrossRef]
  10. Saunders, M.E.; Janes, J.K.; O’Hanlon, J.C. Moving on from the insect apocalypse narrative: Engaging with evidence-based insect conservation. BioScience 2020, 70, 80–89. [Google Scholar] [CrossRef] [Green Version]
  11. Mallet, J.; Willmott, K. Taxonomy: Renaissance or Tower of Babel? Trends Ecol. Evol. 2003, 18, 57–59. [Google Scholar] [CrossRef]
  12. Rust, M.K.; Su, N.-Y. Managing social insects of urban importance. Annu. Rev. Entomol. 2012, 57, 355–375. [Google Scholar] [CrossRef] [PubMed]
  13. Peterson, C.; Wagner, T.L.; Mulrooney, J.E.; Shelton, T.G. Subterranean termites—Their prevention and control in buildings. U. S. Dep. Agric. For. Serv. Home Gard. Bull. 2006, 64, 38. [Google Scholar]
  14. Myer, A.; Forschler, B.T. Evidence for the role of subterranean termites (Reticulitermes spp.) in temperate forest soil nutrient cycling. Ecosystems 2018, 22, 602–618. [Google Scholar] [CrossRef]
  15. Jouquet, P.; Bottinelli, N.; Shanbhag, R.R.; Bourguignon, T.; Traoré, S.; Abbasi, S.A. Termites: The neglected soil engineers of tropical soils. Soil Sci. 2016, 181, 157–165. [Google Scholar] [CrossRef]
  16. International Code Council. International Building Code; International Code Council: Falls Church, VA, USA, 2000.
  17. ORKIN. Termite Infestation Probability Zones Map (TIP). Available online: https://www.orkin.com/pests/termites/termite-infestation-probability-zones-map (accessed on 30 May 2022).
  18. What Are the Worst U.S. States for Termites? Available online: https://www.groundworks.com/resources/worst-us-states-for-termites/ (accessed on 30 May 2022).
  19. Clément, J.-L.; Howard, R.W.; Blum, M.S.; Lloyd, H. L’isolement spécifique des termites du genre Reticulitermes (Isoptera) du sudest des Etats-Unis. Mise en èvidence grâce à la chimie et au comportement d’une espèce jumelle de R. virginicus = R. malletei sp. nov. et d’une semi-species de R. flavipes. Comptes Rendus Académie Sci. 1986, 302, 67–70. [Google Scholar]
  20. Lim, S.Y.; Forschler, B.T. A new species of Reticulitermes Holmgren, 1913 (Isoptera: Rhinotermitidae) from the Southeastern United States. Insecta Mundi 2012, 0252, 1–4. [Google Scholar]
  21. Nelson, L.J.; Cool, L.G.; Solek, C.W.; Haverty, M.I. Cuticular hydrocarbons and soldier defense secretions of Reticulitermes in Southern California: A critical analysis of the taxonomy of the genus in North America. J. Chem. Ecol. 2008, 34, 1452–1475. [Google Scholar] [CrossRef]
  22. Weesner, F.M. Termites of the Nearctic Region. In Biology of Termites, 1st ed.; Krishna, K., Weesner, F.M., Eds.; Academic Press: New York, NY, USA, 1970; Volume 2, pp. 477–525. [Google Scholar]
  23. Banks, F.A. Species Distinction in Reticulitermes (Isoptera: Rhinotermitidae). Master’s Thesis, University of Chicago, Chicago, IL, USA, 1946. [Google Scholar]
  24. Miller, E.M. Florida Termites: A Handbook; University of Miami Press: Coral Gables, FL, USA, 1949; pp. 1–30. [Google Scholar]
  25. Nutting, W.L. Insecta: Isotopera. In Soil Biology Guide, 1st ed.; Dindal, D.L., Ed.; John Wiley & Sons: New York, NY, USA, 1990; pp. 997–1032. [Google Scholar]
  26. Hostettler, N.C.; Hall, D.W.; Scheffrahn, R.H. Intracolony morphometric variation and labral shape in Florida Reticulitermes (Isoptera: Rhinotermitidae) soldiers: Significance for identification. Fla. Entomol. 1995, 78, 119–129. [Google Scholar] [CrossRef]
  27. Lim, S.Y.; Forschler, B.T. Reticulitermes nelsonae, a new species of subterranean termite (Rhinotermitidae) from the Southeastern United States. Insects 2012, 3, 62–90. [Google Scholar] [CrossRef] [Green Version]
  28. Copren, K.A.; Nelson, L.J.; Vargo, E.L.; Haverty, M.I. Phylogenetic analyses of MTDNA sequences corroborate taxonomic designations based on cuticular hydrocarbons in subterranean termites. Mol. Phylogenet. Evol. 2005, 35, 689–700. [Google Scholar] [CrossRef]
  29. Cameron, S.L.; Whiting, M.F. Mitochondrial genomic comparisons of the subterranean termites from the genus Reticulitermes (Insecta: Isoptera: Rhinotermitidae). Genome 2007, 50, 188–202. [Google Scholar] [CrossRef] [PubMed]
  30. Austin, J.W.; Szalanski, A.L.; Uva, P.; Kence, A. A comparative genetic analysis of the subterranean termite genus Reticulitermes (Isoptera: Rhinotermitidae). Ann. Entomol. Soc. Am. 2002, 95, 753–760. [Google Scholar] [CrossRef]
  31. Will, K.W.; Mishler, B.D.; Wheeler, Q.D. The perils of DNA barcoding and the need for integrative taxonomy. Syst. Biol. 2005, 54, 844–851. [Google Scholar] [CrossRef] [PubMed]
  32. Lumely, L.; Sperling, F.A.X. Integrating morphology and mitochondrial DNA for species delimitation within the spruce budworm (Choristoneura fumiferana) cryptic species complex (Lepidoptera: Tortricidae). Syst. Entomol. 2010, 35, 416–428. [Google Scholar] [CrossRef]
  33. United States Department of Agriculture, Natural Resources Conservation Service. Land Resource Regions and Major Land Resource Areas of the United States, the Caribbean, and the Pacific Basin. In U.S. Department of Agriculture Handbook 296; USDA: Washington, DC, USA, 2006. [Google Scholar]
  34. Jonathan, W.M. Digital Atlas of State of Georgia, Elevation; Digital Data Series; US Geological Survey: Atlanta, GA, USA, 1996.
  35. McNab, H.W.; Avers, P.E. Ecological Subregions of the United States. Southern Region and Southeastern Forest Experiment Station; USDA: Washington, DC, USA, 1996; Volume 21.
  36. Gore, P.J.W.; Witherspoon, W. Introduction. In Roadside Geology of Georgia, 1st ed.; Mountain Press Publishing Company: Missoula, MT, USA, 2013; pp. 2–21. [Google Scholar]
  37. Liu, H.; Beckenbach, A.T. Evolution of the mitochondrial cytochrome oxidase II gene among 10 orders of insects. Mol. Phylogenet. Evol. 1992, 41, 41–52. [Google Scholar] [CrossRef]
  38. Simon, C.; Frati, F.; Beckenbach, A.; Crespi, B.; Liu, H.; Flook, P. Evolution, weighting, and phylogenetic utility of mitochondrial gene sequences and a compilation of conserved polymerase chain reaction primers. Ann. Entomol. Soc. Am. 1994, 87, 651–701. [Google Scholar] [CrossRef]
  39. Nguyen, L.-T.; Schmidt, H.A.; von Haeseler, A.; Minh, B.Q. IQ-Tree: A fast and effective stochastic algorithm for estimating maximum-likelihood phylogenies. Mol. Biol. Evol. 2014, 32, 268–274. [Google Scholar] [CrossRef]
  40. Lewin-Koh, N.; Bivand, R.; Pebesma, E.; Archer, E.; Baddeley, A.; Bibiko, H.-J.; Dray, S.; Forrest, D.; Friendly, M.; Giraudoux, P. maptools: Tools for Reading and Handling Spatial Objects, R Package Version 0.8-27. 2011. Available online: https://scholar.google.com/citations?view_op=view_citation&hl=en&user=f151hGIAAAAJ&citation_for_view=f151hGIAAAAJ:4vMrXwiscB8C (accessed on 30 May 2022).
  41. Keitt, T.H.; Bivand, R.; Pebesma, E.; Rowlingson, B. rgdal: Bindings for the Geospatial Data Abstraction Library; R Package Version 0.6-27. 2022. Available online: https://cran.r-project.org/web/packages/rgdal/rgdal.pdf (accessed on 30 May 2022).
  42. Pebesma, E. Simple features for R: Standardized support for spatial vector data. R J. 2018, 10, 439–446. [Google Scholar] [CrossRef] [Green Version]
  43. Pebesma, E.J.; Bivand, R.S. Classes and methods for spatial data in R. R News 2005, 5, 9–13. [Google Scholar]
  44. Baddeley, A.; Rubak, E.; Turner, R. Spatial Point Patterns: Methodology and Applications with R, 1st ed.; Chapman and Hall, CRC Press: London, UK, 2015. [Google Scholar]
  45. Hill, M.O. Diversity and eveness: A unifying notation and its consequences. Ecology 1972, 54, 427–432. [Google Scholar] [CrossRef] [Green Version]
  46. Chao, A.; Chiu, C.-H.; Jost, L. Unifying species diversity, phylogenetic diversity, functional diversity, and related similarity and differentiation measures through hill numbers. Annu. Rev. Ecol. Evol. Syst. 2014, 45, 297–324. [Google Scholar] [CrossRef] [Green Version]
  47. Shannon, C.E.; Weaver, W. The Mathematical Theory of Communication; The University of Illinois Press: Urbana, IL, USA, 1949; p. 117. [Google Scholar]
  48. Simpson, E. Measurement of diversity. Nature 1949, 163, 688. [Google Scholar] [CrossRef]
  49. Vetter, R.S.; Hinkle, N.C.; Ames, L.M. Distribution of the brown recluse spider (Araneae: Sicariidae) in Georgia with comparison to poison center reports of envenomations. J. Med. Entomol. 2009, 46, 15–20. [Google Scholar] [CrossRef] [PubMed] [Green Version]
  50. Vargo, E.L.; Juba, T.R.; Deheer, C.J. Relative abundance and comparative breeding structure of subterranean termite colonies (Reticulitermes flavipes, Reticulitermes hageni, Reticulitermes virginicus, and Coptotermes formosanus) in a South Carolina Lowcountry Site as revealed by molecular markers. Ann. Entomol. Soc. Am. 2006, 99, 1101–1109. [Google Scholar] [CrossRef]
  51. Janowiecki, M.A.; Austin, J.W.; Szalanski, A.W.; Vargo, E. Identification of Reticulitermes subterranean termites (Blattodea: Rhinotermitidae) in the Eastern United States using inter-simple sequence repeats. J. Econ. Entomol. 2021, 114, 1242–1248. [Google Scholar] [CrossRef]
  52. Su, N.-Y.; Ye, W.; Ripa, R.; Scheffrahn, R.H.; Giblin-Davis, R.M. Identification of Chilean Reticulitermes (Isoptera: Rhinotermitidae) inferred from three mitochondrial gene DNA sequences and soldier morphology. Ann. Entomol. Soc. Am. 2006, 99, 352–363. [Google Scholar] [CrossRef]
  53. Chouvenc, T.; Scheffrahn, R.H.; Buss, L. Termite species distribution in Florida and UF termite identification services. EDIS 2022, 2022, 3. [Google Scholar] [CrossRef]
  54. Su, N.-Y.; Scheffrahn, R.H.; Cabrera, B. Native subterranean termites: Reticulitermes flavipes (Kollar), Reticulitermes virginicus (Banks), Reticulitermes hageni banks (Insecta: Isoptera: Rhinotermitidae). EDIS 2004, 2004, 5. [Google Scholar] [CrossRef]
  55. University of Florida, Institute of Food and Agricultural Sciences—UF/IFAS. Termite Distribution—Fort Lauderdale Research and Education Center. Available online: https://flrec.ifas.ufl.edu/termites-in-florida/termite-distribution/ (accessed on 30 May 2022).
  56. Banks, N.; Snyder, T.E. A revision of the Nearctic termites. Bull. United States Natl. Mus. 1920, 108, 288. [Google Scholar] [CrossRef]
  57. Smithsonian National Museum of Natural History. Entomology Collections Search. Available online: http://n2t.net/ark:/65665/3e999984f-7dbc-4a21-bc9b-348732688df1 (accessed on 31 May 2022).
  58. Dedeine, F.; Dupont, S.; Guyot, S.; Matsuura, K.; Wang, C.; Habibpour, B.; Bagnères, A.G.; Mantovani, B.; Luchetti, A. Historical biogeography of Reticulitermes termites (Isoptera: Rhinotermitidae) inferred from analyses of mitochondrial and nuclear loci. Mol. Phylogenet. Evol. 2016, 94, 778–790. [Google Scholar] [CrossRef]
  59. Garrick, R.C.; Collins, B.D.; Yi, R.N.; Dyer, R.J.; Hyseni, C. Identification of Eastern United States Reticulitermes termite species via PCR-RFLP, assessed using training and test data. Insects 2015, 6, 524–537. [Google Scholar] [CrossRef] [PubMed] [Green Version]
  60. Austin, J.; Bagnères, A.G.; Szalanski, A.; Scheffrahn, R.; Heintschel, B.P.; Messenger, M.; Clément, J.-L.; Gold, R. Reticulitermes malletei (Isoptera: Rhinotermitidae): A valid Nearctic subterranean termite from Eastern North America. Zootaxa 2007, 1554. [Google Scholar] [CrossRef]
  61. Whitney-King, S.; Austin, J.W.; Szalanski, A.L. Use of soldier pronotal width and mitochondrial DNA sequencing to distinguish the subterranean termites, Reticulitermes flavipes (Kollar) and R. virginicus (Banks) (Isoptera: Rhinotermitidae) on the Delmarva peninsula Delaware, Maryland, and Virginia, USA. Entomol. News 2007, 118, 41–48. [Google Scholar] [CrossRef] [Green Version]
  62. Stephens, C. Alabama Rhinotermitidae: Nomenclature, Identification, Survey and Phenology. Master’s Thesis, Auburn University, Auburn, AL, USA, 2012. [Google Scholar]
  63. Scheffrahn, R.; Su, N.Y. Keys to soldier and winged adult termites (Isoptera) of Florida. Fla. Entomol. 1994, 77, 460–474. [Google Scholar] [CrossRef]
  64. Messenger, M.T. New Orleans Mosquito & Termite Control Board Bulletin, 2nd ed.; No. 01; New Orleans Mosquito and Termite Control Board: New Orleans, LA, USA, 2002; Volume 2, pp. 1–12.
  65. Szalanski, A.L.; Austin, J.W.; Owens, C.B. Identification of Reticulitermes spp. (Isoptera: Reticulitermatidae) from South Central United States by PCR-RFLP. J. Econ. Entomol. 2003, 96, 1514–1519. [Google Scholar] [CrossRef] [PubMed]
  66. Lv, J.; Wu, S.; Zhang, Y.; Chen, Y.; Feng, C.; Yuan, X.; Jia, G.; Deng, J.; Wang, C.; Wang, Q.; et al. Assessment of four DNA fragments (COI, 16S rdna, ITS2, 12s rdna) for species identification of the IXODIDA (Acari: Ixodida). Parasites Vectors 2014, 7, 93. [Google Scholar] [CrossRef] [Green Version]
  67. Ruihua, Z.; Ping, J.; Chuanbo, S.; Deyong, S.; Feng, Z.; Chaochao, H. The analysis of genetic variation in the mitochondrial genome and its application for the identification of Papilio species. Mitochondr. DNA Part B 2018, 3, 687–690. [Google Scholar] [CrossRef] [Green Version]
  68. Jörger, K.M.; Schrödl, M. How to describe a cryptic species? Practical challenges of molecular taxonomy. Front. Zool. 2013, 10, 59. [Google Scholar] [CrossRef] [Green Version]
  69. Goulding, T.C.; Dayrat, B. Integrative taxonomy: Ten years of practice and looking into the future. Arch. Zool. Mus. Lomonosov Mosc. State Univ. 2016, 54, 116–133. [Google Scholar]
  70. Yeates, D.; Seago, A.; Nelson, L.; Cameron, S.; Joseph, L.; Trueman, J. Integrative taxonomy, or iterative taxonomy? Syst. Entomol. 2010, 36, 209–217. [Google Scholar] [CrossRef]
  71. Bourguignon, T.; Lo, N.; Šobotník, J.; Sillam-Dussès, D.; Roisin, Y.; Evans, T.A. Oceanic dispersal, vicariance and human introduction shaped the modern distribution of the termites Reticulitermes, Heterotermes and Coptotermes. Proc. R. Soc. B Boil. Sci. 2016, 283, 20160179. [Google Scholar] [CrossRef] [PubMed] [Green Version]
  72. De Queiroz, K. Species concepts and species delimitation. Syst. Biol. 2007, 56, 879–886. [Google Scholar] [CrossRef] [PubMed] [Green Version]
  73. Zachos, F.E. (New) species concepts, species delimitation and the inherent limitations of taxonomy. J. Genet. 2018, 97, 811–815. [Google Scholar] [CrossRef]
  74. Gross, M. Barcoding biodiversity. Curr. Biol. 2012, 22, R73–R76. [Google Scholar] [CrossRef] [Green Version]
  75. Ghiselli, F.; Milani, L. Linking the mitochondrial genotype to phenotype: A complex endeavour. Philos. Trans. R. Soc. B 2019, 375, 20190169. [Google Scholar] [CrossRef] [Green Version]
  76. Chan, A.H.; Chaisiri, K.; Saralamba, S.; Morand, S.; Thaenkham, U. Assessing the suitability of mitochondrial and nuclear DNA genetic markers for molecular systematics and species identification of helminths. Parasites Vectors 2021, 14, 233. [Google Scholar] [CrossRef]
  77. Austin, J.W.; Szalanski, A.L.; Messenger, M.T. Mitochondrial DNA variation and distribution of the subterranean termite genus Reticulitermes (Isoptera: Rhinotermitidae) in Arkansas and Louisiana. Fla. Entomol. 2004, 87, 473–480. [Google Scholar] [CrossRef]
  78. Estoup, A.; Jarne, P.; Cornuet, J.M. Homoplasy and mutation model at microsatellite loci and their consequences for population genetics analysis. Mol. Ecol. 2002, 11, 1591–1604. [Google Scholar] [CrossRef]
  79. Hausdorf, B.; Hennig, C. Species delimitation and geography. Mol. Ecol. Resour. 2020, 20, 950–960. [Google Scholar] [CrossRef]
  80. Nagaraju, J.; Reddy, K.D.; Nagaraja, G.M.; Sethuraman, B.N. Comparison of multilocus RFLPs and PCR-based marker systems for genetic analysis of the silkworm, Bombyx mori. Heredity 2001, 86, 588–597. [Google Scholar] [CrossRef] [Green Version]
Figure 1. Map of the eastern United States outlining the 5 major soil provinces in Georgia that extend through other states in southeastern USA. Two soil provinces, the Piedmont and Southern Coastal Plain, occupy 90% of the landmass of Georgia and are demarked by the Fall Line that extends from Alabama to New Jersey.
Insects 13 00565 g001
Figure 2. Distribution of four Reticulitermes species, out of P = 159 counties, in Georgia: upper left; R. nelsonae (P = 128); upper right; R. virginicus (P = 122); lower left; R. malletei (P = 73) and lower right; R. hageni (P = 18). Counties where designated species were found are shaded in dark gray for each map. A map of R. flavipes distribution was not included because it was found in every county. The dark line running east to west represents the position of the Fall line separating the Piedmont and Southern Coastal Plains soil provinces.
Insects 13 00565 g002
Figure 3. Kernel Density Estimation maps of Reticulitermes species distribution using site by species created in R. 4.0.5 (The R Foundation for Statistical Computing, Vienna, Austria). Areas of density based on distance between samples in km2, from high to low, are highlighted yellow to blue.
Insects 13 00565 g003
Figure 4. Collapsed Maximum-Likelihood GTR + G + I tree topology used to identify the survey samples to species, including 1186 full-length (685 bp) COII reads from the survey, highlighting the 55 full-length ITA-Verified references by species clade (Table S2). A Coptotermes formosanus COII sequence (AY683221) was used as the extant group. Branch numbers represent percentage of posterior probability from 1000 UF Bootstrap iterations. The tree also included 3 full and 1 aligned partial reads from GenBank COII accessions shown by collection site and accession number reported as Rh that should be considered anomalous because they grouped with Rn (Table S4). Full data available upon request from authors.
Insects 13 00565 g004
Figure 5. Collapsed Maximum-Likelihood GTR + G + I tree topology assembled using 55 full-length (685 bp) COII ITA-verified references for southeastern Reticulitermes (Table S2) and 22 full or partial reads of the same gene retrieved from GenBank for 10 additional species across Europe, Asia, and the western United States (Table S5). A Coptotermes formosanus sequence (AY683221) was used as the extant group. Strong node support from 1000 UF bootstrap iterations illustrates the global utility of this marker. Full data available upon request from authors.
Insects 13 00565 g005
Table 1. The number and proportion of counties, sites, and samples by Reticulitermes species collected from the entire state as well as north and south of the Fall Line.
Counties
StatewideNorth of Fall LineSouth of Fall Line
Species# of counties
(P = 159)
% of counties# of counties
(P = 73)
% of counties# of counties
(P = 86)
% of counties
Rf159100%73100%86100%
Rn12880.5%4358.9%8598.8%
Rm7345.9%6994.5%44.7%
Rv12276.7%5068.5%7283.7%
Rh1814.1%1824.7%00%
Sites
StatewideNorth of Fall LineSouth of Fall Line
Species# of sites
(P = 1570)
% of sites# of sites
(P = 688)
% of sites# of sites
(P = 882)
% of sites
Rf113172.0%50473.3%62771.1%
Rn55935.6%13018.9%42948.6%
Rm32320.6%31345.5%101.1%
Rv31820.3%9714.1%22125.1%
Rh211.3%213.0%00%
Samples
StatewideNorth of Fall LineSouth of Fall Line
Species# of samples
(n = 4371)
% of samples# of samples
(n = 1975)
% of samples# of samples
(n = 2396)
% of samples
Rf226051.7%103652.5%122451.1%
Rn103123.6%21911.1%81233.9%
Rm55712.7%54627.7%110.5%
Rv49411.3%1457.3%34914.6%
Rh290.7%291.5%00%
Table 2. Hill Numbers for Reticulitermes species collected by site from the entire state as well as north and south of the Fall Line.
Hill Numbers (r = 0, 1, 2, ∞)
Hill Number (N0)
Number of Species
Hill Number (N1)
Exponential Shannon (eH)
Hill Number (N2)
Inverse Simpson (1/D)
Entire State53.603.08
North of Fall Line53.553.00
South of Fall Line42.882.65
Table 3. Clark and Evans Aggregation Index scores for Reticulitermes species distribution point patterns by site (R. 4.0.5, The R Foundation for Statistical Computing, Vienna, Austria).
SpeciesClark and Evans R Scorep-Value
RfR = 1.19<0.001
RnR = 1.05<0.05
RmR = 0.71<0.001
RvR = 0.990.79
RhR = 0.58<0.001
Publisher’s Note: MDPI stays neutral with regard to jurisdictional claims in published maps and institutional affiliations.

