Article

Comparative Transcriptome Investigation of Nosema ceranae Infecting Eastern Honey Bee Workers

1
College of Animal Sciences (College of Bee Science), Fujian Agriculture and Forestry University, Fuzhou 350002, China
2
Jilin Province Institute of Apicultural Science, Jilin 132000, China
3
Apitherapy Research Institute, Fujian Agriculture and Forestry University, Fuzhou 350002, China
*
Authors to whom correspondence should be addressed.
Insects 2022, 13(3), 241; https://doi.org/10.3390/insects13030241
Submission received: 18 December 2021 / Revised: 22 February 2022 / Accepted: 23 February 2022 / Published: 28 February 2022
(This article belongs to the Section Insect Behavior and Pathology)

Abstract

:

Simple Summary

At present, interaction between Nosema ceranae and Apis cerana is poorly understood, though A. cerana is the original host for N. ceranae. Here, comparative investigation was conducted using transcriptome data from N. ceranae infecting Apis cerana cerana workers at seven days post inoculation (dpi) and 10 dpi (NcT1 and NcT2 groups) as well as N. ceranae spores (NcCK group). There were 1411, 604, and 38 DEGs identified in NcCK vs. NcT1, NcCK vs. NcT2, and NcT1 vs. NcT2 comparison groups. Additionally, 10 upregulated genes and nine downregulated ones were shared by above-mentioned comparison groups. GO classification and KEGG pathway analysis suggested that these DEGs were engaged in a number of key functional terms and pathways such as cell part and glycolysis. Further analysis indicated that most of virulence factor-encoding genes were upregulated, while a few were downregulated during the fungal infection. Findings in this current work provide a basis for clarifying the molecular mechanism udnerlying N. ceranae infection and host-microsporidian interaction during bee nosemosis.

Abstract

Apis cerana is the original host for Nosema ceranae, a widespread fungal parasite resulting in honey bee nosemosis, which leads to severe losses to the apiculture industry throughout the world. However, knowledge of N. ceranae infecting eastern honey bees is extremely limited. Currently, the mechanism underlying N. ceranae infection is still largely unknown. Based on our previously gained high-quality transcriptome datasets derived from N. ceranae spores (NcCK group), N. ceranae infecting Apis cerana cerana workers at seven days post inoculation (dpi) and 10 dpi (NcT1 and NcT2 groups), comparative transcriptomic investigation was conducted in this work, with a focus on virulence factor-associated differentially expressed genes (DEGs). Microscopic observation showed that the midguts of A. c. cerana workers were effectively infected after inoculation with clean spores of N. ceranae. In total, 1411, 604, and 38 DEGs were identified from NcCK vs. NcT1, NcCK vs. NcT2, and NcT1 vs. NcT2 comparison groups. Venn analysis showed that 10 upregulated genes and nine downregulated ones were shared by the aforementioned comparison groups. The GO category indicated that these DEGs were involved in a series of functional terms relevant to biological process, cellular component, and molecular function such as metabolic process, cell part, and catalytic activity. Additionally, KEGG pathway analysis suggested that the DEGs were engaged in an array of pathways of great importance such as metabolic pathway, glycolysis, and the biosynthesis of secondary metabolites. Furthermore, expression clustering analysis demonstrated that the majority of genes encoding virulence factors such as ricin B lectins and polar tube proteins displayed apparent upregulation, whereas a few virulence factor-associated genes such as hexokinase gene and 6-phosphofructokinase gene presented downregulation during the fungal infection. Finally, the expression trend of 14 DEGs was confirmed by RT-qPCR, validating the reliability of our transcriptome datasets. These results together demonstrated that an overall alteration of the transcriptome of N. ceranae occurred during the infection of A. c. cerana workers, and most of the virulence factor-related genes were induced to activation to promote the fungal invasion. Our findings not only lay a foundation for clarifying the molecular mechanism underlying N. ceranae infection of eastern honey bee workers and microsporidian–host interaction.

1. Introduction

Nosema ceranae is an obligate unicellular fungal parasite that specifically infects honey bee midgut epithelial cells. N. ceranae was first identified in eastern honey bee (Apis cerana) by Fries et al. [1], thereafter it swiftly spread to western honey bee (Apis mellifera) colonies reared in Europe and Taiwan province, China [2]. Currently, N. ceranae could be detected in colonies all over the world. N. ceranae infestation results in a battery of negative impacts on the honey bee host such as shortened life span, energy stress, immunosuppression, cell apoptosis inhibition [3,4,5,6], earlier foraging activity, and impaired navigation and cognitive ability [7,8]. A close connection between N. ceranae and colony collapse disorder (CCD) has been suggested by several studies [9,10].
N. ceranae exists outside the host cell only as dormant spores. After ingestion by the honey bee host, the inside polar tube is rapidly extruded to pierce the cell membrane followed by injection of the infective sporoplasm via hollow polar tubes [1,11,12]. The intracellular life cycle of N. ceranae can be divided into two phases including the proliferative phase (merogony) and the sporogonic phase (sporogony), and ends with the formation of spores. Nevertheless, it is hard to completely isolate N. ceranae at the above-mentioned two different phases, which is a key factor limiting further study on the fungal parasite during the infection process. Advances in next-generation sequencing technology have allowed for a deeper understanding of host response and parasite/pathogen infection. Previously, several studies have been conducted to investigate responses of western honey bee workers to microsporidian infestation, where Badaoui et al. analyzed the gene expression of A. m. ligustica workers at 5, 10, and 15 days post N. ceranae infection by RNA-Seq technology, and found that the expression of genes encoding host antimicrobial peptides, cuticle proteins, and odor binding proteins were downregulated, resulting in the decline in immune function of the host to promote the survival and propagation of N. ceranae at the colony level [13]; based on fluorescence in situ hybridization (FISH) and immunostaining experiments, Panek et al. investigated the impact of N. ceranae on A. m. ligustica workers’ epithelium renewal by following the mitotic index of midgut stem cells during a 22-day N. ceranae infection, and their results showed that N. ceranae can negatively alter the gut epithelium renewal rate and disrupt some signaling pathways involved in the gut homeostasis [14]. Transcriptome analysis of the intestinal tract of A. c. cerana exposed to N. ceranae demonstrated that microsporidian infection inhibited genes relevant to homeostasis and renewal in the wnt signaling pathway [15]. Comparatively, omics study on the N. ceranae infecting honey bee hosts is very limited, and the underlying mechanism of N. ceranae infection is still vague.
In our previous work, we performed RNA sequencing of clean spores of N. ceranae, followed by transcriptome-wide identification of ncRNAs such as miRNAs, lncRNAs, and circRNAs in N. ceranae spores [16,17,18]. Recently, we conducted deep sequencing of the midguts of A. c. cerana workers at 7- and 10-days post inoculation (dpi) with N. ceranae spores, and deciphered the host cellular and humoral responses to fungal infection [19]; in addition, we analyzed the expression profile of highly expressed genes (HEGs) and discussed their potential roles in N. ceranae infestation [20]. In light of the fact that transcriptomic study on N. ceranae during the infection process is still lagging behind, in the present study, based on the obtained transcriptome datasets, we first filtered out the parasite-derived data and then performed a comparative investigation combined with transcriptome data derived from N. ceranae spores, followed by deep investigation of the dynamics of genes in N. ceranae as well as the virulence factor-associated pathways and genes. To the best of our knowledge, this is the first report of omics study on N. ceranae invading eastern honey bees.

2. Materials and Methods

2.1. Fungal Spore and Honey Bee

Clean spores of N. ceranae were previously purified using Percoll discontinuous gradient centrifugation protocol and preserved in the Honey Bee Protection Laboratory [18], College of Animal Sciences (College of Bee Science). A. c. cerana workers were selected from three colonies located in the teaching apiary of the College of Animal Sciences (College of Bee Science) in Fujian Agriculture and Forestry University. No Varroa mite was observed during the whole study. The disappearance of seven common honey bee viruses (KBV, IAPV, ABPV, DWV, SBV, BQCV, and CBPV) and two honey bee microsporidia (Nosema apis and N. ceranae) in the newly emergent A. c. cerana workers was verified with the RT-PCR assay [21].

2.2. Microscopic Observation and PCR Validation of N. ceranae Spores

The prepared spores of N. ceranae were subjected to microscopic observation using an optical microscope (SIOM, Shanghai, China). Furthermore, the total RNA of spores were isolated and used as templates for reverse transcription; the resulting cDNA was then used as templates for PCR amplification with previously described specific primers for N. ceranae and N. apis [22,23] and the amplified products were detected by 1.5% agarose gel electrophoresis (AGE). Sterile water was set as a negative control.

2.3. Preparation and Detection of Paraffin Section of Honey Bee Midgut Tissue

One-day-old workers of A. c. cerana in N. ceranae-inoculated groups were each artificially fed with 5 μL 50% (w/v) sucrose solution containing 1 × 10⁶ spores; while 1-old-day workers in un-inoculated groups were each fed with 5 μL of 50% (w/v) sucrose solution without spores. At 11 dpi with N. ceranae spores, the midgut tissues in the N. ceranae-inoculated and un-inoculated groups were respectively harvested and fixed with 4% paraformaldehyde. According to our previously described protocol [21], on the basis of a microtome (Leica, Nussloch, Germany) and an embedding center (Junjie, Wuhan, China), paraffin sections were prepared and then stained with a hematoxylin eosin (HE) stain by Shanghai Sangon Biological Engineering Co. Ltd., followed by detection utilizing an optical microscope with a digital camera (SOPTOP, Shanghai, China).

2.4. Transcriptome Data Source

Midgut tissues of A. c. cerana workers at 7 dpi and 10 dpi with N. ceranae spores and corresponding un-inoculated worker’s midgut tissues was previously prepared and sequenced on an Illumina HiSeqTM 4000 platform with a stand-specific cDNA library-based strategy [17]. The raw datasets were deposited in the National Biotechnology Information Center (NCBI) SRA database (https://www.ncbi.nlm.nih.gov/sra) (accessed on 21 July 2018) under BioProject number: PRJNA395264. Quality control of the produced raw reads were previously conducted according to the method described by Chen et al. [17,24]. Briefly, raw reads containing adapters, more than 10% of unknown nucleotides (N), and more than 50% of low quality (q value ≤20) bases were removed to gain high-quality clean reads, which were then mapped to the ribosome RNA (rRNA) database (www.arb-silva.de/) (accessed on 20 March 2021) using Bowtie2 software [24]. The result indicated that 174, 700, 032; 205, 297, 946; 124, 216, 829 and 99, 030, 788 raw reads were generated, and after quality control, 171, 868, 061; 200, 570, 776; 121, 949, 977 and 97, 432, 267 clean reads were gained, with Q20 of 94.96%, 94.58%, 94.60%, and 94.91%, respectively [19] (Table S1). Hence, the high-quality RNA-Seq data can be used for transcriptomic analyses in the present study. The clean reads were first mapped to the reference genome of Apis cerana (assembly ACSNU-2.0) to remove host-derived data, and the unmapped clean reads were further mapped to the N. ceranae reference genome (assembly ASM98816v1) to gain microsporidian-derived data.
In another work, we conducted deep sequencing of clean spores of N. ceranae (NcCK) using Illumina HiSeq-based RNA-Seq [18]. A total of 416, 156, and 600 raw reads were produced, and after quality control, 210, 824, and 312 clean reads were obtained, with average a Q30 of 92.63%, which suggested that the high-quality transcriptome data can be used in this study. The clean reads were mapped to the reference genome of N. ceranae (assembly ASM98816v1). The relevant raw data were deposited in the NCBI SRA database (https://www.ncbi.nlm.nih.gov/sra) (accessed on 29 Augest 2019) under BioProject number: PRJNA562784 (Table S2).

2.5. Identification and Analysis of DEGs in N. ceranae

Following the standard of p value ≤ 0.05 and |log2(Fold change)| ≥ 1, the DEGs in NcCK vs. NcT1 and NcCK vs. NcT2 comparison groups were screened by edgeR software [25]. Venn analysis of up- and downregulated genes in these comparison groups and expression cluster analysis were carried out based on OmicShare platform (https://www.omicshare.com/) (accessed on 10 April 2021). GO (Gene Ontology) categorization of DEGs was carried out using WEGO software [26]. Blastall tool was employed to conduct pathway analysis by comparing DEGs against the KEGG (Kyoto Encyclopedia of Genes and Genomes) database (https://www.kegg.jp/) (accessed on 10 April 2021) [27].

2.6. Investigation of Virulence Factor-Associated DEGs

On the basis of associated documentations with N. ceranae and findings from our previous studies on N. ceranae [16,17,18,19,20,23,28,29,30], virulence factors such as spore wall protein, ricin B lectin, chitinase, polar tube protein, phosphofructokinase, ATP/ADP translocase, ABC transporter, hexokinase, and pyruvate kinase and associated DEGs were selected for further investigation. Expression clustering analysis of aforementioned DEGs was performed utilizing the OmicShare platform.

2.7. RT-qPCR Validation of DEGs

Fifteen DEGs were randomly selected from NcCK vs. NcT1 (XM_002994928.1, XM_002996348.1, XM_002996299.1, XM_002996655.1, XM_002996468.1 and XM_002996253.1), NcCK vs. NcT2 (XM_002996303.1, XM_002996294.1, XM_002995682.1, XM_002996538.1, XM_002996655.1 and XM_002996253.1), and NcT1 vs. NcT2 (XM_002996294.1 and XM_002996468.1) comparison groups and subjected to RT-qPCR validation. The actin gene (gene6001) in N. ceranae was used as an internal reference. Specific forward and reverse primers for these DEGs and actin were designed with primer premier 5 (Table S3). Total RNA of N. ceranae spores and the N. ceranae-inoculated workers’ midguts at 7 dpi and 10 dpi were respectively isolated using the RNA Extraction Kit (TaKaRa Company, Dalian, China). cDNA was synthesized through reverse transcription with the oligo dT primer and used as templates for the qPCR assay, which was carried out on a QuanStudio RealTime PCR System (ThemoFisher, Walthem, MA, USA). The qPCR reaction was conducted according to the instructions of the SYBR Green Dye Kit (Vazyme Company, Shanghai, China). Cycling parameters were as follows: 95 °C for 1 min, followed by 40 cycles at 95 °C for 15 s, 55 °C for 30 s, and 72 °C for 45 s. The relative gene expression was calculated based on the 2−ΔΔCt method [31]. The experiment was performed three times utilizing three independent biological samples.

2.8. Statistical Analysis

Statistical analyses were conducted with SPSS software (IBM, Armonk, NY, USA) and GraphPad Prism 7.0 software (GraphPad, San Diego, CA, USA). Data were presented as mean ± standard deviation (SD). Statistical analysis was performed using the Student’s t-test and one-way ANOVA. Additionally, significant (p < 0.05) GO terms and KEGG pathways were filtered by performing Fisher’s exact test with R software 3.3.1.

3. Results

3.1. Verification of Infection of A. c. cerana Worker by N. ceranae

Under an optical microscope, oval and highly refractive dispersed spores were observed (Figure 1A). Furthermore, AGE indicated that the expected fragment (approximately 76 bp) was amplified from the purified spores with specific primers for N. ceranae, while no signal band was detected using specific primers for N. apis (Figure 1B). These results verified that the purified spores were indeed N. ceranae spores.
Based on microscopic observation of paraffin sections, it was found that there were a number of N. ceranae spores in the A. c. cerana worker’s midgut epithelial cells at 11 dpi with N. ceranae (Figure 2A,B), whereas no fungal spores could be detected in the worker’s midgut epithelial cells at 11 dpi without N. ceranae (Figure 2C,D). In addition, the structure of the midgut epithelial cells of N. ceranae-infected workers was fragmentary and the nucleic acid substances were dispersed and unclear (Figure 2A,B), while that of the un-infected worker was intact and the deeply colored cell nucleus was visible (Figure 2C,D). The results together suggest that the A. c. cerana workers were infected by N. ceranae and the host midgut epithelial cell structure was destroyed by the fungal infection.

3.2. Differential Gene Expression Profile of N. ceranae Infecting A. c. cerana Workers

In total, 1411, 604, and 38 DEGs were identified in the NcCK vs. NcT1, NcCK vs. NcT2, and NcT1 vs. NcT2 comparison groups, respectively. The numbers of upregulated genes were 711, 240, and 17, while those of the downregulated ones were 700, 360, and 21, respectively (Figure 3A). Additionally, Venn analysis showed that there were 10 and nine shared up- and downregulated genes in the aforementioned three comparison groups, whereas the numbers of unique upregulated (downregulated) genes were 417 (354), two (20), and five (10), respectively (Figure 3B). It is speculated that these shared DEGs play a common role during the N. ceranae infection process, whereas the unique DEGs exert specific function at different time points of N. ceranae invasion. Moreover, the expression clustering analysis showed that expression levels of ten shared DEGs such as ricin b lectin encoding genes (XM_002996294.1 and XM_002995387.1) were continuously upregulated, while another nine shared DEGs were continuously downregulated during the N. ceranae infection, indicating that some shared genes were activated by the N. ceranae infection while other shared genes were inhibited (Figure 3C).

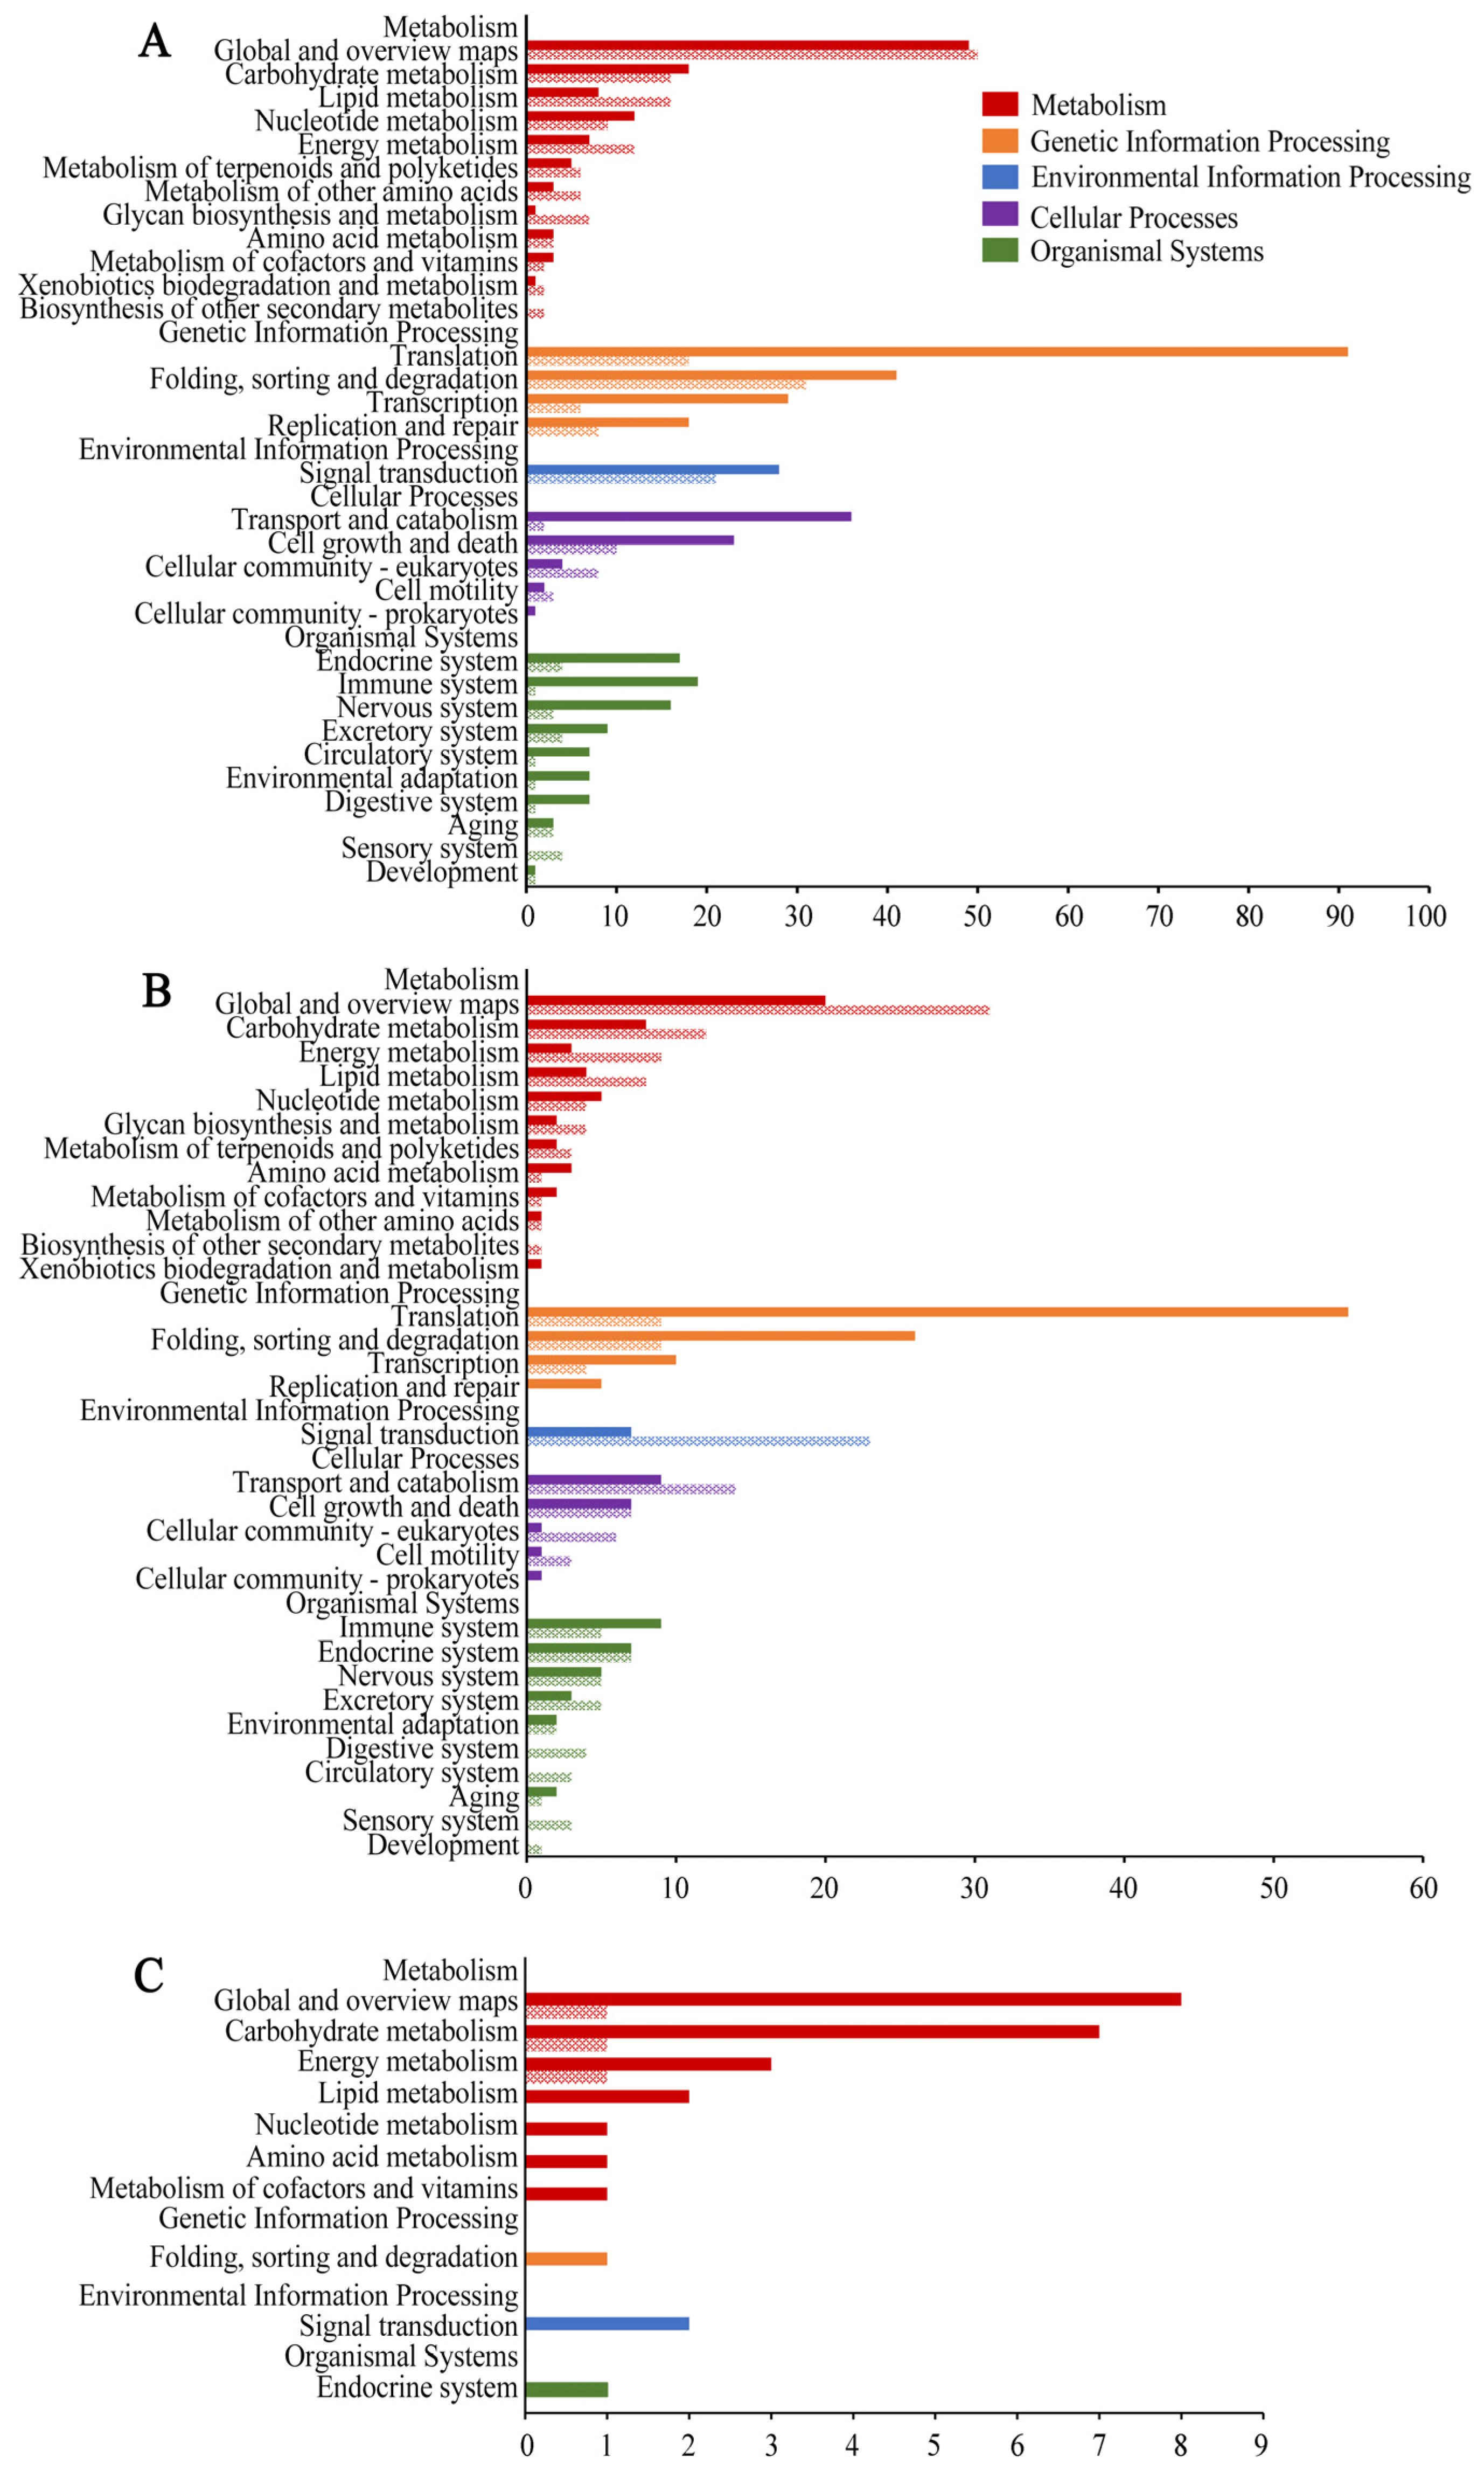
3.3. Function and Pathway Annotation of DEGs in N. ceranae Infesting A. c. cerana Workers

GO term analysis suggested that the DEGs in NcCK vs. NcT1 comparison group were engaged in 638 biological process-associated functional terms such as metabolic process, single-organism process, and cellular process; 377 cellular component-associated terms such as cell, cell part, and organelle; and 424 molecular function-associated terms such as catalytic activity, transport, and binding (Figure 4A). In the NcCK vs. NcT2 comparison group, the DEGs could annotate to 22 GO terms including 291 biological process-related items such as metabolic process and single-organism, 160 cellular component-related terms such as cell and cell part, and 237 molecular function-related items such as catalytic activity and nucleic acid binding transcription factor activity (Figure 4B). The DEGs in the NcT1 vs. NcT2 comparison group were involved in seven functional terms such as metabolic process, cell, and catalytic activity (Figure 4C).
In addition, the KEGG pathway analysis indicated that the DEGs in the NcCK vs. NcT1 comparison group were relevant to 241 pathways, among these the most abundant groups were metabolic pathway, biosynthesis of secondary metabolites, ribosome, ribosome biogenesis in eukaryotes, and biosynthesis of antibiotics (Figure 5A). In the NcCK vs. NcT2 comparison group, the DEGs were relative to 201 pathways including metabolic pathway, biosynthesis of secondary metabolites, ribosome, ribosome biogenesis in eukaryotes, and biosynthesis of antibiotics (Figure 5B). The DEGs in the NcT1 vs. NcT2 comparison group were associated with 32 pathways such as metabolic pathway, biosynthesis of antibiotics, biosynthesis of secondary metabolites, glycolysis/gluconeogenesis, and microbial metabolism in diverse environments (Figure 5C).

3.4. Virulence Factor-Associated DEGs in N. ceranae Invading A. c. cerana Workers

Further investigation was conducted to explore virulence factor-associated DEGs in above-mentioned comparison groups, where a total of 20 DEGs were identified including six spore wall protein coding genes, three ricin B lectin protein coding genes, three ATP/ADP translocase protein coding genes, two polar tube protein coding genes, two ABC transporter protein coding genes, one chitin synthase protein coding gene, one 6-phosphofructokinase protein coding genes, one hexokinase protein coding gene, and one pyruvate kinase protein coding gene. Moreover, the expression clustering showed that the majority of virulence factor-encoding genes were induced to activation during the infection process, whereas a few were suppressed to a large extent (Figure 6).

3.5. Verification of DEGs via RT-qPCR

Fifteen DEGs were randomly selected for RT-qPCR validation, where the results suggest that the expression trend of 14 was consistent with those in transcriptome data (Figure 7A,B), confirming the reliability of the sequencing data used in this current work.

4. Discussion

Here, in the NcCK vs. NcT1 and NcCK vs. NcT2 comparison groups, 1411 and 604 DEGs were respectively identified including 657 and 240 upregulated genes as well as 700 and 364 downregulated ones. This is indicative of the overall alteration of genes in N. ceranae during the infection process. The response of fungal cells to external signals is regulated by mitogen-activated protein kinase (MAPK), which phosphorylates many downstream proteins and further alters gene expression, followed by participation in various processes such as proliferation, differentiation, and apoptosis [32]. Here, three and two DEGs in NcCK vs. NcT1 and NcCK vs. NcT2 were found to enrich in the MAPK signaling pathway, among which XM_002995908.1 (log2FC = 4.44, 4.93) and XM_002996683.1 (log2FC = 4.63, 4.51) were shared by both comparison groups, while there was a unique DEG (XM_002996282.1, log2FC = −1.01) in NcCK vs. NcT1, indicating that the MAPK signaling pathway was significantly activated during N. ceranae infection and used by the fungal parasite to respond to the internal environment of host epithelial cells. Previously, we conducted transcriptomic investigation of the A. m. ligustica workers’ midguts responding to N. ceranae invasion, and detected that seven (GenBank accession no. 9423510, 424610, 9424462, 9422987, 9422306, 9411598, and 9424007) DEGs in the midguts at 7 dpi and 10 dpi were enriched in the MAPK signaling pathway [30]. These results together demonstrate that the MAPK signaling pathway is likely to play a vital part in N. ceranae infection, but there were differences in this signaling pathway in N. ceranae when infecting different honey bee species. Ricin, a type of toxic heterodimer protein in castor seed, has a ricin chain B (RTB) that connects a ricin chain A (RTA) via a disulfide bond [33]. Lectins are proteins that recognize the glycan ligand. As virulence factors of many pathogens, lectins exert function by mediating cell adhesion, innate immune defense, and pathogen infection [34]. The binding of ricin B lectin (RBL) contributes to microbial infection and promotes pathogen attachment or entry into host cells. NBRBL3, a lectin protein of Nosema bombyx, was confirmed to be secreted from the spore during fungal proliferation and then mediate host cell recognition and adhesion [34]. In this research, three ricin B lectin-associated DEGs were observed in both the NcCK vs. NcT1 and NcCK vs. NcT2 comparison groups including XM_002995387.1 (log2FC = 4.52, 5.67), XM_002996294.1 (log2FC = 4.66, 5.88), and XM_002996299.1 (log2FC = 2.31, 2.96), and all of these were apparently upregulated, implying that N. ceranae may synthesize and secrete ricin B lectin to increase the adhesion between spores and host cells, further promoting the fungal proliferation [30].
There is a hard spore wall outside the microsporidia, which is composed of the outer spore wall layer, inner spore wall layer, and fibrous plasma membrane. Spore wall protein (SWP) has been proven to be a crucial virulence factor of microsporidia, which can recognize and adhere to host cells during microsporidian infection [35]. The spore wall protein SWP25 of N. bombyx was located in the endospore layer with a signal peptide, which was suggested to be implicated in chitin interaction of endospore powder and spore wall construction via the heparin binding motif (HBM) [36]. Here, one SWP25-encoding gene (XM_002996293.1) showed an upregulation trend in host midguts at 7 dpi (log2FC = 4.82) and 10 dpi (log2FC = 4.77), suggestive of the participation of SWP25 in N. ceranae infection of A. c. cerana workers. Yang et al. analyzed the interaction between N. bombycis SWP9 (NbSWP9) with polar tube proteins PTP1 and PTP2 and found that NbSWP9 was mainly distributed in the polar tubes [37]. In this work, one gene encoding SWP9 (XM_002996348.1) was downregulated in the workers’ midguts at both 7 dpi (log2FC = −3.04) and 10 dpi (log2FC = −3.40), indicating that A. c. cerana workers may inhibit the interaction between SWP9 with PTPs via host–microsporidian interaction. However, additional work is required to decipher the underlying mechanism. Additionally, another two SWP encoding genes (XM_002996303.1, log2FC = 7.45, 7.90; XM_002994928.1, log2FC =5.08, 5.82), one SWP precursor encoding gene (XM_002996552.1, log2FC = 6.36, 6.90), and one spore wall and anchoring disk complex protein encoding gene (XM_002995858.1, log2FC = 3.41, 5.80) were identified and all were observed to upregulate in host midguts at both 7 dpi and 10 dpi, which demonstrated that these SWP-associated genes were activated to increase the synthesis of corresponding SWPs, further enhancing the N. ceranae invasion. For microsporidia, the infective protoplasm is transferred from the spore to the host cell through the polar tube, further starting the proliferation process, thus the polar tube protein is also considered as a virulence factor of importance. Yang et al. discovered that the polar tube and spore wall of microsporidia are the main components of mature spores adhering to and infecting the host cells [38]. Long et al. performed lectin blotting and β-elimination reaction of NbPTP1 in N. bombycis, where the results showed that NbPTP1 had O-glycosylation modification characteristics, which are conducive to adhesion, infection, and maintenance of the stability of the polar tube [39]. Here, two PTP1 encoding genes shared by the aforementioned two comparison groups were found to be upregulated including XM_002995447.1 (log2FC = 6.01, 6.84) and XM_002995446.1 (log2FC = 5.71, 6.48), indicating that both genes were induced to activation during the infection process to promote the proliferation of N. ceranae.
Due to the specific life cycle, microsporidia lost the typical mitochondria during long-term evolution, which was replaced by mitosis, an organelle that produces a small amount of ATP via glycolysis to meet the basic physiological needs [11]. Accordingly, microsporidia highly depend on stealing energy from the host cells, and glycolysis is the main manner for N. ceranae to produce ATP at a pretty low efficiency [12]. Huang et al. previously detected that the genes encoding three rate-limiting enzymes involved in catalyzing the glycolysis pathway continued to upregulate including hexokinase, pyruvate kinase, and phosphofructokinase [40]. Hexokinase catalyzes glucose phosphorylation to form glucose-6-phosphate (g-6-p), and the expression of hexokinase is regulated by ADP. Pyruvate kinase can catalyze the conversion of phosphoenolpyruvate to pyruvate and further enhance the production of ATP. Fructose-6-phosphate (f-6-p) is hydrolyzed by 6-phosphofructokinase, glucose-1 (F-1), and 6-diphosphate (6-2p) was inhibited by ATP with a high concentration [41,42,43]. Noticeably, the pyruvate kinase encoding gene XM_002996468.1 (log2FC = 2.81, 3.92) and hexokinase encoding gene XM_002995838.1 (log2FC = 3.78, 3.23) were upregulated in NcCK vs. NcT1 and NcCK vs. NcT2, which suggest that the activation of pyruvate kinase and hexokinase is a strategy of N. ceranae during the infection of A. c cerana workers. However, the 6-phosphofructokinase encoding gene XM_002994874.1 (log2FC = −4.72, −4.03) was downregulated, which was inconsistent with a previous study [40]. We inferred that it might be suppressed by ATP with high concentration. The underlying mechanism needs to be further explored.
ABC transporters represent the largest family of transmembrane proteins that contribute to ATP transportation. Most ABC transporters rely on ATP binding and hydrolysis to transport amino acids, lipids, sugars, peptides, ions, and other substrates from the cell fluid to the intracellular or extracellular region [44]. Here, the expression trend of two ABC transporter-encoding genes was altered in the above-mentioned two comparison groups: XM_002996245.1 (log2FC = 2.52, 2.86) was upregulated, while XM_002996253.1 (log2FC = −3.49, −3.68) was downregulated. This indicates that ABC transporters may play an essential role in the transmembrane transport of materials and energy during the N. ceranae infection, and different ABC transporters encoding genes may have different roles in this process. ATP/ADP translocase transports ATP synthesized in the mitochondrial matrix to cytoplasm for cell utilization in eukaryotes. N. ceranae needs to steal ATP from host cells by ATP/ADP translocase to meet its growth and development needs. Here, the upregulation of two ATP/ADP translocase genes was detected in NcCK vs. NcT1 and NcCK vs. NcT2 including XM_002995682.1 (log2FC = 3.82, 3.33) and XM_002996655.1 (log2FC = 3.70, 4.87), whereas another gene XM_002996538.1 (log2FC = −2.17, −2.08) was downregulated, indicative of the complex interaction between the microsporidian and host. The result supported the vital function of ATP/ADP transporters in the energy acquisition of N. ceranae invading A. c. cerana workers.

5. Conclusions

In summary, our results demonstrated that the overall transcriptome dynamics of N. ceranae was altered during the infection of A. c. cerana workers, and a number of virulence factor-associated genes were induced to activation to facilitate the fungal proliferation, but some other genes encoding virulence factors were suppressed via host–microsporidian interaction. Findings in this current work provide a basis for deciphering the mechanism underlying the N. ceranae infection of A. c cerana workers and microsporidian–host interaction.

Supplementary Materials

The following supporting information can be downloaded at: https://www.mdpi.com/article/10.3390/insects13030241/s1, Table S1: Primers for RT-qPCR validation performed in this study; Table S2: Summary of RNA-seq datasets (Nosema ceranae); Table S3: Primers used in this study.

Author Contributions

D.C. and R.G. designed this study. R.G., Y.F., J.W., K.Y., W.Z., Z.C., M.S., Y.H., X.Z. and C.X. performed bioinformatic analysis and molecular experiment. D.C., Q.N. and R.G. supervised the work and contributed to the preparation of the manuscript. All authors have read and agreed to the published version of the manuscript.

Funding

This work was founded by the National Natural Science Foundation of China (32172792), the Outstanding Scientific Research Manpower Fund of Fujian Agriculture and Forestry University (xjq201814), the Earmarked Fund for Modern Agro-industry Technology Research System (CARS-44-KXJ7), and the Master Supervisor Team Fund of Fujian Agriculture and Forestry University (Rui Guo).

Informed Consent Statement

Not applicable.

Data Availability Statement

The data presented in this study are available in article and Supplementary Material.

Acknowledgments

All of the authors thank all editors and reviewers for their helpful and constructive comments.

Conflicts of Interest

The authors declare no conflict of interest.

References

  1. Fries, I.; Feng, F.; Silva, A.D.; Slemenda, S.B.; Pieniazek, N.J. Nosema ceranae, n. sp. (Microspora, Nosematidae), morphological and molecular characterization of a microsporidian parasite of the Asian honey bee Apis cerana, (Hymenoptera, Apidae). Eur. J. Protistol. 1996, 32, 356–365. [Google Scholar] [CrossRef]
  2. Martín-Hernández, R.; Meana, A.; Prieto, L.; Salvador, A.M.; Garrido-Bailón, E.; Garrido-Bailón, E.; Higes, M. Outcome of colonization of Apis mellifera by Nosema ceranae. Appl. Environ. Microbiol. 2007, 73, 6331–6338. [Google Scholar] [CrossRef] [PubMed] [Green Version]
  3. Mayack, C.; Naug, D. Energetic stress in the honey bee Apis mellifera from Nosema ceranae infection. J. Invertebr. Pathol. 2009, 100, 185–188. [Google Scholar] [CrossRef]
  4. Zheng, S.B.; He, J.F.; Li, Z.G.; Gao, Z.S.; Yu, T.T.; Xu, W.J.; Su, S.K. Effects of Nosema ceranae on the expression of immune gene and hemolymph sugar levels of Apis cerana bees. Entomol. Knowl. 2017, 54, 392–399. [Google Scholar]
  5. Kurze, C.; Le, C.Y.; Dussaubat, C.; Erler, S.; Kryger, P.; Lewkowski, O.; Müller, T.; Widder, M.; Moritz, R.F. Nosema tolerant honey bees (Apis mellifera) escape parasitic manipulation of apoptosis. PLoS ONE 2015, 10, e0140174. [Google Scholar] [CrossRef]
  6. Fries, I. Nosema ceranae in European honey bees (Apis mellifera). J. Invertebr. Pathol. 2010, 103, S73–S79. [Google Scholar] [CrossRef]
  7. Lach, L.; Kratz, M.; Boris, B. Parasitized honey bees are less likely to forage and carry less pollen. J. Invertebr. Pathol. 2015, 130, 64–71. [Google Scholar] [CrossRef]
  8. Dussaubat, C.; Maisonnasse, A.; Crauser, D.; Beslay, D.; Costagliola, G.; Soubeyrand, S.; Kretzchmar, A.; Conte, Y.L. Flight behavior and pheromone changes associated to Nosema ceranae infection of honey bee workers (Apis mellifera) in field conditions. J. Invertebr. Pathol. 2013, 113, 42–51. [Google Scholar] [CrossRef]
  9. Higes, M.; Martín-Hernández, R.; Garrido-Bailón, E.; González-Porto, A.V.; García-Palencia, P.; Meana, A.; Nozal, M.J.D.; Mayo, R.; Bernal, J.L. Honey bee colony collapse due to Nosema ceranae in professional apiaries. Environ. Microbiol. Rep. 2009, 1, 110–113. [Google Scholar] [CrossRef]
  10. Bromenshenk, J.J.; Henderson, C.B.; Wick, C.H.; Stanford, M.F.; Zulich, A.W.; Jabbour, R.E.; Deshpande, S.V.; McCubbin, P.E.; Seccomb, R.A.; Welch, P.M.; et al. Iridovirus and microsporidian linked to honey bee colony decline. PLoS ONE 2010, 5, e13181. [Google Scholar] [CrossRef]
  11. Chen, Y.P.; Evans, J.D.; Charles, M.; Robin, G.; Michael, Z.; Gundensen-Rindal, D.; Pettis, J.S. Morphological, molecular, and phylogenetic characterization of Nosema ceranae, a microsporidian parasite isolated from the European honey bee, Apis mellifera. J. Eukaryot. Microbiol. 2009, 56, 142–147. [Google Scholar] [CrossRef] [PubMed] [Green Version]
  12. Huang, W.F.; Solter, L.F. Comparative development and tissue tropism of Nosema apis and Nosema ceranae. J. Invertebr. Pathol. 2013, 113, 35–41. [Google Scholar] [CrossRef] [PubMed]
  13. Badaoui, B.; Fougeroux, A.; Petit, F.; Anselom, A.; Gorni, C.; Cucurachi, M.; Cersini, A.; Granato, A.; Cardeti, G.; Formato, G.; et al. RNA-sequence analysis of gene expression from honey bees (Apis mellifera) infected with Nosema ceranae. PLoS ONE 2017, 12, e0173438. [Google Scholar] [CrossRef]
  14. Dussaubat, C.; Brunet, J.; Higes, M.; Colbourne, J.K.; Lopez, J.; Choi, J.H.; Martín-Hernández, R.; Botías, C.; Cousin, M.; McDonnell, C.; et al. Gut pathology and responses to the microsporidium Nosema ceranae in the honey bee Apis mellifera. PLoS ONE 2012, 7, e37017. [Google Scholar] [CrossRef] [PubMed] [Green Version]
  15. Panek, J.; Paris, L.; Roriz, D.; Mone, A.; Dubuffet, A.; Delbac, F.; Diogon, M.; Alaoui, H. Impact of the microsporidian Nosema ceranae on the gut epithelium renewal of the honey bee, Apis mellifera. J. Invertebr. Pathol. 2018, 159, 121–128. [Google Scholar] [CrossRef] [PubMed]
  16. Du, Y.; Zhou, D.; Chen, H.; Xiong, C.; Zheng, Y.; Chen, D.; Guo, R. MicroRNA dataset of normal and Nosema ceranae-infected midguts of Apis cerana cerana workers. Data Brief. 2019, 26, 104518. [Google Scholar] [CrossRef]
  17. Chen, D.; Chen, H.; Du, Y.; Zhou, D.; Geng, S.; Wang, H.; Wan, J.; Xiong, C.; Zheng, Y.; Guo, R. Genome-wide identification of long non-coding RNAs and their regulatory networks involved in Apis mellifera ligustica response to Nosema ceranae infection. Insects 2019, 10, 245. [Google Scholar] [CrossRef] [Green Version]
  18. Guo, R.; Chen, D.; Xiong, C.; Zheng, Y.; Hou, C.; Du, Y.; Geng, S.; Wang, H.; Zhou, D.; Guo, Y. Genome-wide identification of circular RNAs in fungal parasite Nosema ceranae. Curr. Microbiol. 2018, 29, 1655–1660. [Google Scholar] [CrossRef]
  19. Fu, Z.; Zhou, D.; Chen, H.; Geng, S.; Chen, D.; Zhen, Y.; Xiong, C.; Xu, G.; Zhang, X.; Guo, R. Analysis of highly expressed genes in Apis cerana cerana workers midguts responding to Nosema ceranae stress. J. Sichuan Univ. (Nat. Sci. Ed.) 2020, 57, 191–198. [Google Scholar] [CrossRef]
  20. Xiong, C.; Chen, H.; Geng, S.; Zhou, N.; Zhou, D.; Zhu, Z.; Chen, D.; Zheng, Y.; Xu, G.; Zhang, X.; et al. Expression profile of high-expressing genes and its potential role during Apis cerana cerana infected by Nosema ceranae. J. Sichuan Univ. (Nat. Sci. Ed.) 2020, 57, 596–604. [Google Scholar] [CrossRef]
  21. Xing, W.; Zhou, D.; Long, Q.; Sun, M.; Guo, R.; Wang, L. Immune Response of Eastern Honey bee Worker to Nosema ceranae Infection Revealed by Transcriptomic Investigation. Insects 2021, 12, 728. [Google Scholar] [CrossRef] [PubMed]
  22. Chen, D.; Du, Y.; Chen, H.; Fan, Y.; Fan, X.; Zhu, Z.; Wang, J.; Xiong, C.; Zheng, Y.; Hou, C.; et al. Comparative identification of microRNAs in Apis cerana cerana workers’ midguts in response to Nosema ceranae invasion. Insects 2019, 10, 258. [Google Scholar] [CrossRef] [PubMed] [Green Version]
  23. Chen, Y.; Evans, J.D.; Smith, I.B.; Pettis, J.S. Nosema ceranae is a long-present and wide-spread microsporidian infection of the European honey bee (Apis mellifera) in the United States. J. Invertebr. Pathol. 2008, 97, 186–188. [Google Scholar] [CrossRef] [PubMed]
  24. Langmead, B.; Salzberg, S.L. Fast gapped-read alignment with Bowtie 2. Nat. Methods 2012, 9, 357–359. [Google Scholar] [CrossRef] [Green Version]
  25. Chen, Y.; Carthy, D.M.; Robinson, M.; Robinson, M.; Smyth, G. edgeR: A Bioconductor package for differential expression analysis of digital gene expression data. Bioinformatics 2010, 26, 139–140. [Google Scholar] [CrossRef] [Green Version]
  26. Jia, Y.; Lin, F.; Hongkun, Z.; Zhang, Y.; Chen, J.; Zhang, Z.; Wang, J.; Li, S.; Li, R.; Bolund, L.; et al. WEGO: A web tool for plotting GO annotations. Nucleic Acids Res. 2005, 2, 293–297. [Google Scholar] [CrossRef]
  27. Kanehisa, M.; Araki, M.; Goto, S.; Hattori, M.; Hirakawa, M.; Itoh, M.; Katayama, T.; Kawashima, S.; Okuda, S.; Tokimatsu, T.; et al. KEGG for linking genomes to life and the environment. Nucleic Acids Res. 2008, 36, D480–D484. [Google Scholar] [CrossRef]
  28. Du, Y.; Fan, X.; Jiang, H.; Wang, J.; Feng, R.; Zhang, W.; Yu, K.; Long, Q.; Cai, Z.; Xiong, C.; et al. MicroRNA-mediated cross-kingdom regulation of Apis mellifera ligustica worker to Nosema ceranae. Sci. Agric. Sin. 2021, 54, 1805–1820. [Google Scholar] [CrossRef]
  29. Fan, X.; Du, Y.; Zhang, W.; Wang, J.; Jiang, H.; Fan, Y.; Feng, R.; Wang, J.; Zhou, Z.; Xiong, C.; et al. Omics analysis of Nosema ceranae miRNAs involved in gene expression regulation in the midgut of Apis mellifera ligustica workers and their regulatory networks. Acta Entomol. Sin. 2021, 64, 187–204. [Google Scholar] [CrossRef]
  30. Geng, S.; Zhou, D.; Fan, X.; Jiang, H.; Zhu, Z.; Wang, J.; Fan, Y.; Wang, X.; Xiong, C.; Zheng, Y.; et al. Transcriptomic analysis reveals the molecular mechanism underlying Nosema ceranae infection of Apis mellifera ligustica. Acta Entomol. Sin. 2020, 63, 294–308. [Google Scholar] [CrossRef]
  31. Livak, K.J.; Schmittgen, T.D. Analysis of relative gene expression data using real-time quantitative PCR and the 2(-Delta Delta C(T)) Method. Methods 2001, 25, 402–408. [Google Scholar] [CrossRef]
  32. Pérez, P.; Cansado, J. Cell integrity signaling and response to stress in fission yeast. Curr. Protein Pept. Sci. 2010, 11, 680–692. [Google Scholar] [CrossRef] [PubMed]
  33. Liu, H.; Li, M.; Cai, S.; He, X.; Shao, Y.; Lu, X. Ricin-B-lectin enhances microsporidia Nosema bombycis infection in BmN cells from silkworm Bombyx mori. Acta Biochim. Biophys. Sin. 2016, 48, 1020–1057. [Google Scholar] [CrossRef] [Green Version]
  34. Qi, X. Studies on the Functional Genome of Nosema Bombycis-Localization and Functional Analysis on Ricin B-Lectin NbRBL3 of Nosema bombycis; Chongqing Southwest University: Chongqing, China, 2014; pp. 1–88. [Google Scholar]
  35. Long, M.; Tan, Y.; Yu, B.; Pan, G.; Zhou, Z. Expression of Nosema bombycis polar tube protein 1 in lepidopteran sf9 cells and its effect on microsporidian proliferation. J. Invertebr. Pathol. 2020, 172, 107350. [Google Scholar] [CrossRef]
  36. Wu, Z.; Li, Y.; Pan, J.; Zhou, Z.; Xiang, Z. SWP25, a novel protein associated with the Nosema bombycis endospore. J. Eukaryot. Microbiol. 2009, 56, 113–118. [Google Scholar] [CrossRef]
  37. Yang, D.; Pan, L.; Peng, P.; Dang, X.; Li, C.; Li, T.; Long, M.; Chen, J.; Wu, Y.; Du, H.; et al. Interaction between SWP9 and polar tube proteins of the microsporidian Nosema bombycis and function of SWP9 as a scaffolding protein contribute to polar tube tethering to the spore wall. Infect. Immun. 2017, 85, e00872-16. [Google Scholar] [CrossRef] [PubMed] [Green Version]
  38. Yang, D.; Pan, L.; Chen, Z.; Du, H.; Luo, B.; Luo, J.; Pan, G. The roles of microsporidia spore wall proteins in the spore wall formation and polar tube anchorage to spore wall during development and infection processes. Exp. Parasitol. 2018, 187, 93–100. [Google Scholar] [CrossRef] [PubMed]
  39. Long, M.; Tan, Y.; Liu, K.; Wu, Y.; Lü, Q.; Pan, G.; Zhou, Z. Expression of Polar Tube Protein 1 (NbPTP1) from Nosema bombycis in Drosophila S2 cell lines and its glycosylation. Chin. J. Biotechnol. 2018, 34, 1460–1468. [Google Scholar] [CrossRef]
  40. Huang, Q.; Chen, Y.; Wang, R.; Cheng, S.; Evans, J. Host-parasite interactions and purifying selection in a microsporidian parasite of honey bees. PLoS ONE 2016, 11, e0147549. [Google Scholar] [CrossRef] [Green Version]
  41. Chen, X.; Peng, X.; Li, X.; Kye, I.B.; Shang, R.; Qi, J.; Zhang, Y.; Xu, L.; Sheng, Z. Cloning, sequence structure analysis and prokaryotic expression of Nosema bombycis hexokinase gene. Acta Sericologica Sin. 2018, 44, 70–76. [Google Scholar] [CrossRef]
  42. Zhang, Z.; Qi, J.; Shang, R.; Chen, H.; Zhang, Y.; Sheng, Z. Cloning and expression characteristics of pyruvate kinase gene of Nosema bombycis. Acta Sericologica Sin. 2019, 45, 212–217. [Google Scholar] [CrossRef]
  43. Yao, Q.; Yang, Y.; Cui, L.; Su, H.; Li, R.; Lu, G. Elementary analysis of 6-phosphofructokinase gene of Xanthomonas campestris. Genom. Appl. Biol. 2010, 29, 1047–1054. [Google Scholar] [CrossRef]
  44. Dermauw, W.; Leeuwen, T.V. The ABC gene family in arthropods comparative genomics and role in insecticide transport and resistance. Insect Biochem. Mol. Biol. 2014, 45, 89–110. [Google Scholar] [CrossRef] [PubMed]
Figure 1. Microscopic detection and PCR validation of N. ceranae spores. (A) Microscopic detection (400 times amplification). (B) AGE for PCR amplified fragments, Lane Nc: Specific primers for N. ceranae, Lane Na: Specific primers for N. apis, Lane N: Sterile water (Negative control), Lane M: DNA marker.
Insects 13 00241 g001
Figure 2. Microscopic observation of paraffin sections of N. ceranae-inoculated and un-inoculated A. c. cerana workers’ midguts. (A) Worker’s midgut at 11 dpi with N. ceranae under 200 times amplification. (B) Worker’s midgut at 11 dpi with N. ceranae under 400 times amplification. (C) Worker’s midgut at 11 dpi without N. ceranae under 200 times amplification. (D) Worker’s midgut at 11 dpi without N. ceranae under 400 times amplification. Black dashed box shows the region for observation under 400 times amplification.
Insects 13 00241 g002
Figure 3. Analysis of DEGs in N. ceranae. (A) Venn analysis of upregulated genes in NcCK vs. NcT1, NcCK vs. NcT2, and NcT1 vs. NcT2 comparison groups. (B) Venn analysis of downregulated genes in NcCK vs. NcT1, NcCK vs. NcT2, and NcT1 vs. NcT2 comparison groups. (C) Heatmap of common DEGs in the NcCK, NcT1, and NcT2 groups.
Insects 13 00241 g003
Figure 4. GO category of DEGs. (A) DEGs in NcCK vs. NcT1. (B) DEGs in NcCK vs. NcT2; (C) DEGs in NcT1 vs. NcT2.
Insects 13 00241 g004
Figure 5. Pathways annotated by DEGs. (A) DEGs in NcCK vs. NcT1. (B) DEGs in NcCK vs. NcT2. (C) DEGs in NcT1 vs. NcT2.
Insects 13 00241 g005
Figure 6. Heatmap of virulence factor-associated DEGs shared by the NcCK, NcT1, and NcT2 groups.
Insects 13 00241 g006
Figure 7. RT-qPCR verification of DEGs in N. ceranae infecting A. c. cerana workers. (A) DEGs in NcCK vs. NcT1. (B) DEGs in NcCK vs. NcT2. Error bars represent the variance of RT-qPCR results of each DEG. Bars with asterisk symbol indicate statistical differences (p < 0.05).
Insects 13 00241 g007
Publisher’s Note: MDPI stays neutral with regard to jurisdictional claims in published maps and institutional affiliations.

