Article

Analysis of the Genetic Variation of the Fruitless Gene within the Anopheles gambiae (Diptera: Culicidae) Complex Populations in Africa

by
Mahamadi Kientega
1,2,*,
Nace Kranjc
3,
Nouhoun Traoré
1,2,†,
Honorine Kaboré
1,2,†,
Dieudonné Diloma Soma
1,2,
Ioanna Morianou
3,
Moussa Namountougou
1,2,
Adrien Marie Gaston Belem
2 and
Abdoulaye Diabaté
1,*
1
Institut de Recherche en Sciences de la Santé (IRSS), Bobo-Dioulasso 01 BP 545, Burkina Faso
2
Laboratoire de Santé Animale Tropicale, Institut du Développement Rural, Université Nazi Boni, Bobo-Dioulasso 01 BP 1091, Burkina Faso
3
Department of Life Sciences, Imperial College, London SW7 2AZ, UK
*
Authors to whom correspondence should be addressed.
These authors contributed equally to this work.
Insects 2022, 13(11), 1048; https://doi.org/10.3390/insects13111048
Submission received: 14 September 2022 / Revised: 6 October 2022 / Accepted: 24 October 2022 / Published: 13 November 2022
(This article belongs to the Special Issue Biology, Genetics and Evolution of Mosquitoes)

Abstract

:

Simple Summary

In this study, we have characterized the genetic variation of the Fruitless gene (X: 1283016-1373662) within 18 populations of An. gambiae s.l in Africa. The variant density and the nucleotide diversity were low in the exonic regions of the fru gene, especially the male sex-specific region, the BTB-exons 1 and 2, and the zinc-finger B and C exons. These regions also showed high conservation scores. The allelic frequencies of the non-synonymous SNPs were low (freq < 0.26), except for two SNPs identified at high frequencies (freq > 0.8) in the zinc-finger A and B protein domains. These results showed a low genetic variation overall in the exonic regions of the fru gene, especially the male sex-specific exon and the BTB-exon 1. These findings are crucial for the development of a gene drive construct targeting the fru gene that can rapidly spread without encountering resistance in wild populations.

Abstract

Targeting genes involved in sexual determinism, for vector or pest control purposes, requires a better understanding of their polymorphism in natural populations in order to ensure a rapid spread of the construct. By using genomic data from An. gambiae s.l., we analyzed the genetic variation and the conservation score of the fru gene in 18 natural populations across Africa. A total of 34,339 SNPs were identified, including 3.11% non-synonymous segregating sites. Overall, the nucleotide diversity was low, and the Tajima’s D neutrality test was negative, indicating an excess of low frequency SNPs in the fru gene. The allelic frequencies of the non-synonymous SNPs were low (freq < 0.26), except for two SNPs identified at high frequencies (freq > 0.8) in the zinc-finger A and B protein domains. The conservation score was variable throughout the fru gene, with maximum values in the exonic regions compared to the intronic regions. These results showed a low genetic variation overall in the exonic regions, especially the male sex-specific exon and the BTB-exon 1 of the fru gene. These findings will facilitate the development of an effective gene drive construct targeting the fru gene that can rapidly spread without encountering resistance in wild populations.

1. Introduction

In the animal kingdom, the male and female sexes show different morphological and behavioral characteristics. These characteristics are governed by genetics elements that are expressed through various signals to determine the sex of the individual [1]. In insects, sexual dimorphism commonly starts by the primary activation of a central gene that induces molecular cascade mechanisms controlling alternative splicing of the Doublesex (dsx) and Fruitless (fru) genes [2,3,4]. Therefore, these two genes (dsx and fru) are considered as the endpoint in the sex-determination mechanism in insects. Although all the molecular processes involved in the sexual differentiation are less understood, the available data suggest the implication of the Yob1 gene, a maleness gene located on the An. gambiae Y chromosome, as the central gene trigging the male sexual differentiation of the Anopheles species [5,6].
In Drosophila melanogaster and Aedes aegypti, the fru gene is expressed in the central nervous system, and it takes part in the construction of a neuronal network to direct the male courtship behavior [2]. The courtship behavior, as complex as it is, regroups a set of behavioral interactions in which the male engages in a succession of actions including orientation and the pursuit of females until they copulate. Studies have also shown the role of the fru gene in the construction of a set of abdominal muscles, including the muscle of Lawrence (MOL) that is necessary for copulation [7,8]. In D. melanogaster, fru mutants show abnormal mating behavior due to the inability to distinguish the partner, a copulation failure, and a weakened abdominal muscle. These mutant males also exhibit a little wing extension, and no song pulse signal was generated when flapping their wings. The ectopic expression of FRUM in Drosophila females induced a masculinization of these females with MOL formation. The examination of the abdomen of the An. gambiae males compared to those of the females has led to the identification of a sexually dimorphic muscle structure in the A5 abdominal segment, similar to the Lawrence muscle [9]. This muscle structure appears thicker, significantly longer, and more built, with more protruding extension sites, than its corresponding in the female’s A5 abdominal segment. Although the direct involvement of the fru gene in Anopheles male sexual orientation is less known, previous data recorded from closely related species, notably the Drosophilidae species and Ae. Aegypti, confirm the role of the fru gene in male courtship regulation [8,10].
Comparative analysis of the fru gene of the three dipteran species, mainly An. Gambiae, D. melanogaster, and Ae. Aegypti, has revealed a similar sex-splicing pattern and conservation of certain domains and functions between these species. Comparing the male and female mRNA sequences of the fru gene provided insights into the sex-specific splicing pattern in An. gambiae. During splicing, the female-specific isoform incorporates an early stop codon, leading to the production of nonfunctional protein. Conversely in males, the sex-splicing pattern excludes the female-specific region, which is producing a transcript that is normally translated into functional protein. This sex-splicing pattern, previously well known in Drosophila species, is shown to be the fundamental element switching the sexual orientation in insect species [8,9].
An. gambiae s.l remains one of the main malaria vectors in Africa [11]. It is a complex of nine morphologically undistinguishable species, among which three species (An. Gambiae s.s., An. coluzzii, and An. arabiensis) well distributed from western to eastern Africa are responsible for almost all the malaria cases in sub-Saharan Africa [11,12]. Current malaria control strategies essentially rely on the use of antimalarial drugs (artemisinin-based combination therapies) against parasites and insecticides (mainly pyrethroids and carbamates) to target vector populations. The intensive use of these tools has contributed significantly to the reduction in malaria incidence, morbidity, and mortality over the past decade [13]. In recent years, due to the rapid rise and generalization of the technical and entomological issues in malaria control, the current control tools seem to have become ineffective and obsolete for reaching malaria elimination [14]. The emergence and rapid spread of insecticides’ resistance, as well as changes in biting and resting behavior and the diversity of the vectoral system in Africa, raise concerns about a dramatic reduction in long-lasting insecticidal nests (LLINs) and the effectiveness of indoor residual sprayings (IRS) [15,16,17,18]. To address these challenges, innovative malaria control tools are being developed to strengthen the current tools and accelerate malaria elimination. For example, genetic control strategies aim to reduce the reproductive and/or vectorial capacity of vectors by distorting the sex ratio, reducing females’ fecundity, or making females unable to transmit pathogens [19]. One of the most promising approaches uses gene drive technologies to reduce the reproductive potential of the mosquito by disrupting the genes essential for female reproduction [19,20,21]. Recently, a gene drive was used to disrupt the female-specific intron-4–exon-5 boundary of the dsx gene in the African malaria vector An. gambiae. Dsx mutant females showed deep morphological abnormalities and were unable to mate or take a blood meal, which are both essential for female reproduction. Releases of dsx mutant gene drive mosquitoes in small and large cages resulted in the rapid spread of the transgene and complete An. gambiae population suppression in less than a year [20,22]. Based on the success of the dsx gene drive, the development of self-sustaining and self-limiting genetic technologies targeting genes of the sex-determination pathway, to reduce the reproductive capacity and population size of vector species, has been a priority. Fru is an attractive candidate, since its disruption in D. melanogaster and Ae. aegypti was shown to alter courtship behavior and reduce successful matings [7,10,23]. For this purpose, it is crucial to target a genomic region showing minimal variability, to ensure the rapid spread of the genetic construct in the field, without the emergence of resistance [20,24]. To this end, we analyzed the diversity and the abundance of single nucleotide polymorphisms (SNPs) in the fru gene within An. gambiae complex populations, to identify the most conserved regions that would be suitable as gene drive targets. We also analyzed the dynamics of the non-synonymous variants and the conservation score throughout the gene. These findings are crucial for the development of a gene drive construct targeting the fru gene that can rapidly spread without encountering resistance in wild populations.

2. Materials and Methods

2.1. Genomics Data and Mosquito Collection

The genomic data used in this study are from the Ag1000G phase 3 project and were publicly published in February 2021. These data are from 2784 wild-caught An. gambiae s.l mosquito species, especially An. arabiensis, An. gambiae s.s., and An. coluzzii, collected in 19 malaria-endemic countries in sub-Saharan Africa [25]. More details on the mosquito samples’ collection; the sequencing technology used; the storage and the management of the genomic data, including the SNPs variants’ calling, haplotypes’ phasing, and copy number variants’ identification, including the rights to access these data, have been described on the homepage of MalariaGEN [25,26]. Briefly, the mosquito samples were individually sequenced at high coverage using Illumina technology at the Wellcome Sanger Institute. The genomic data were then analyzed using BWA version 0.7.15 and GATK version 3.7-0 to call high-quality SNPs and identify haplotypes and CNVs. After the analyses, the raw sequences in FASTQ format and the aligned sequences in BAM format were stored in the European Nucleotide Archive (ENA). The SNPs, haplotypes, and CNVs in VCF and zarr formats, including the samples’ metadata, have been stored on Google Cloud and are publicly accessible via the malariagen-data package or are directly downloadable [26].
In our study, the access to the SNPs and the haplotypes data was possible through the malariagen-data package, based on the Python programming language, to facilitate access and analysis of genomic data without downloading them. Thus, this package was used to locate and extract SNPs and haplotypes data called in the genomic region of chromosome X (X: 1283016-1373662), corresponding to the fru gene of An. gambiae s.l. The SNPs and haplotypes data were extracted as multidimensional arrays. The malariagen-data package also allows for access to the reference data of An. gambiae, including the reference genome and the transcripts of all the genes identified in the mosquito.

2.2. Data Analysis

The SNPs and haplotypes data were analyzed using Python programming on Jupyter Notebooks [27]. Python packages scikit-allel [28], malariagen-data [29], and others standard data-management packages including dask [30], pandas [31], numpy [32], matplotlib [33], and seaborn [34] were then used for the genomic analyses and data manipulation. All the graphs were created by using Python libraries matplotlib, seaborn, and R 4.1.3 [35]. Python 3.8.13 and R 4.1.3 codes for reproducing all analyses in this article are available on GitHub (https://github.com/mkient/fruitless_report) (accessed on 23 October 2022).

2.2.1. Genetic Variation Analysis

The malariagen-data package was used to locate and filter the SNPs and the haplotypes data, called in the genomic region of chromosome X corresponding to the fru gene (X: 1283016-1373662). These data were then analyzed using the scikit-allel v1.3.3 package to determine the genetic variation of the gene. Thus, the number of segregating sites, variants’ density, population mutation rate, nucleotide diversity, Tajima’s D neutrality test, and haplotype diversity were calculated over the entire gene and within a 0.5 kb window throughout the fru gene. Watterson’s theta estimator (θ) was calculated in the genomic region of the fru gene to estimate the mutation rate of the genomic region of the fru gene within each An. gambiae population. These parameters will provide insights into the genetic diversity of the gene among different anopheline species from different countries. To clarify the evolutionary processes that drive the observed genetic variation in the fru region, we performed a chromosome-wide selection scan using the Garud H statistics [36] to detect a signal of positive selection in the chromosome X.
The SNPs’ allele frequencies (the synonymous and non-synonymous SNPs) were calculated within the population using the 5 gene transcripts. Non-synonymous SNPs with maximum allelic frequencies that are greater than 5% in at least one population of An. gambiae complex species were defined as major SNPs. The major SNPs were filtered and grouped according to the African regions (West, Central, and East) for the analysis of their heterozygosity dynamics and the pattern of association of these SNPs between each pair of loci. The haplotypes identified at the major non-synonymous SNPs positions were selected for the linkage disequilibrium analysis between each pair of these SNPs. The Lewontin Linkage disequilibrium (D’) [37] was then calculated using the to understand the non-random association between each pair of the major non-synonymous SNPs.

2.2.2. Conservation of the fru Gene

The conservation score was obtained for the genomic region of the fru gene using the AgamP4 conservation score metric [38]. Conservation score integrates a systematic analysis of genetic variation data from wild populations of An. gambiae and synthetic conserved regions of 19 Anopheles species, D. melanogaster, and two other mosquito species (Ae. aegypti and Cx quinquefasciatus) that are phylogenetically more distant within the dipteran order. Thus, this program was used to calculate the conservation score of each nucleotide in the fru gene and generate a data table containing the conservation score. The data table was then imported into Jupyter notebooks via Pandas to analyze the distribution and the variation of the conservation score alongside and within the specific regions of the gene.

3. Results

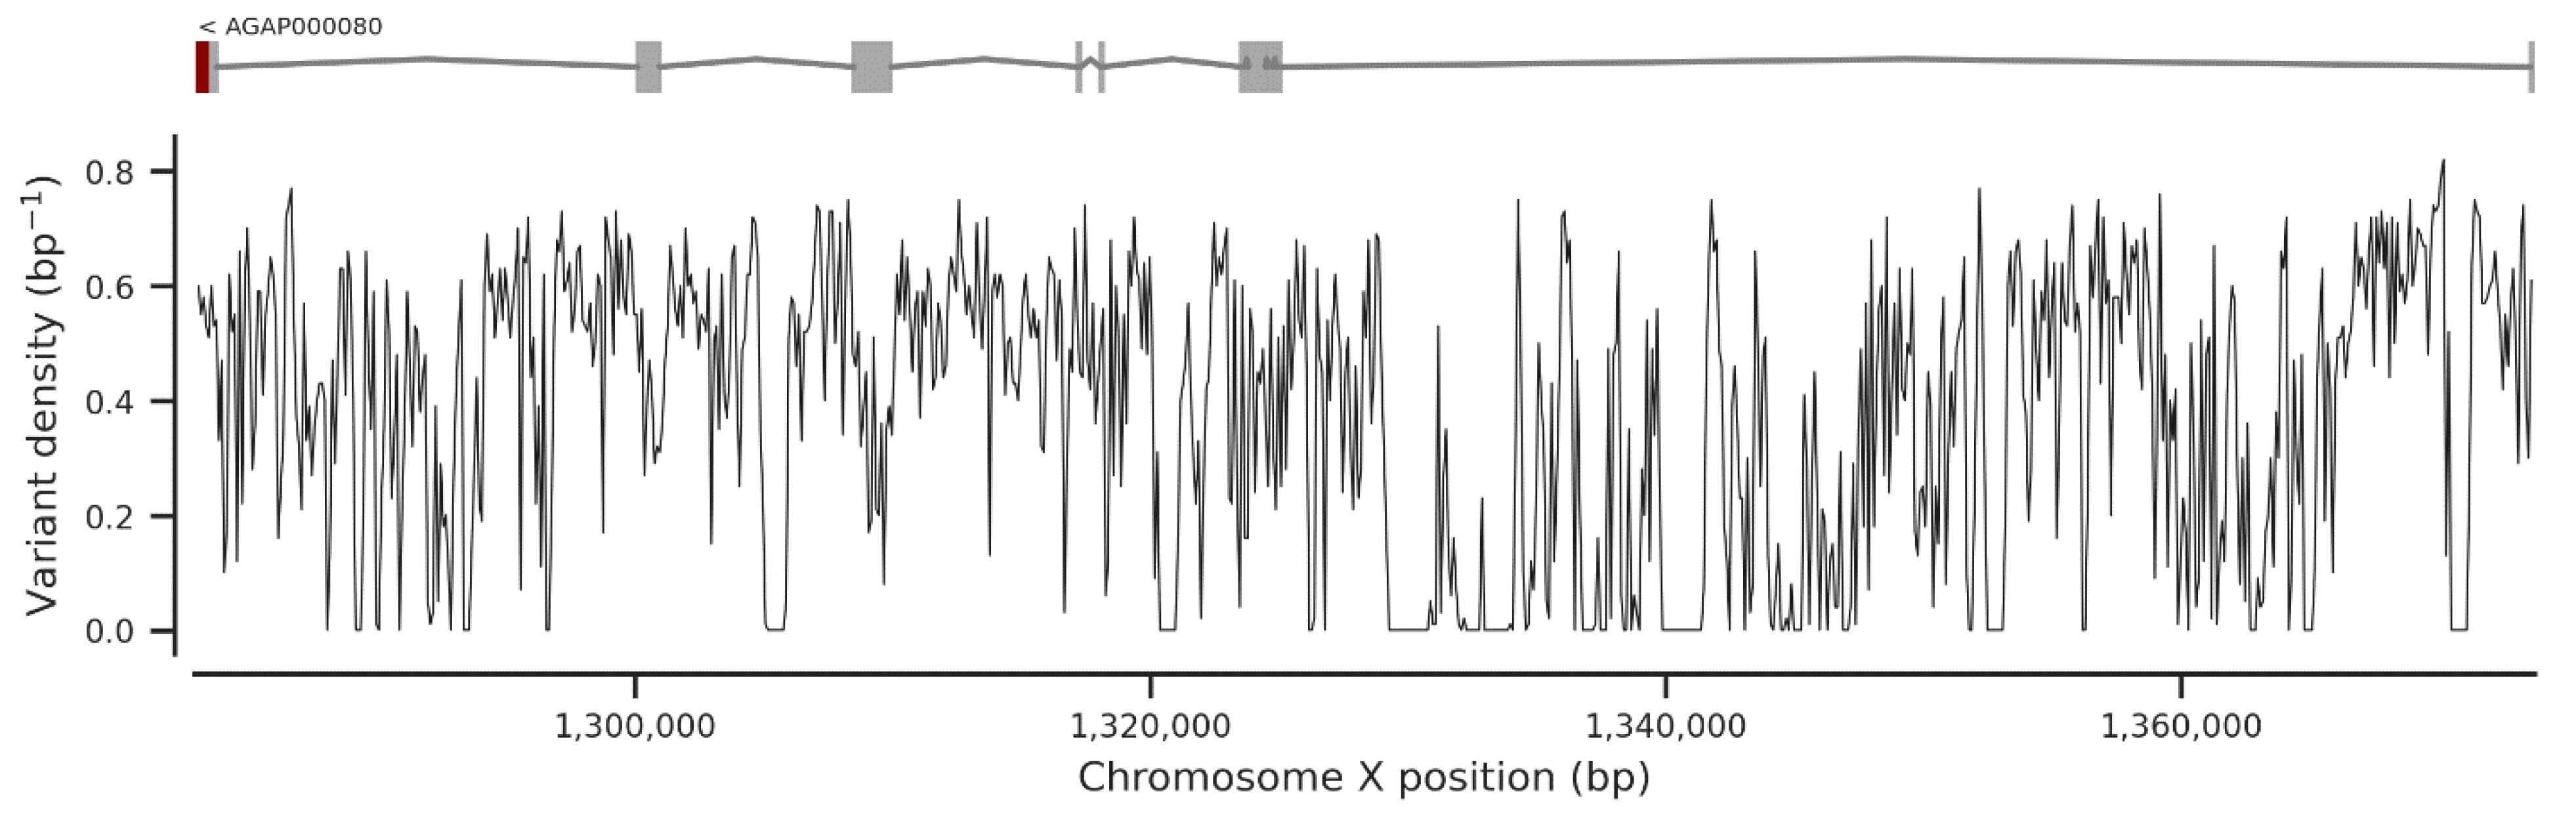
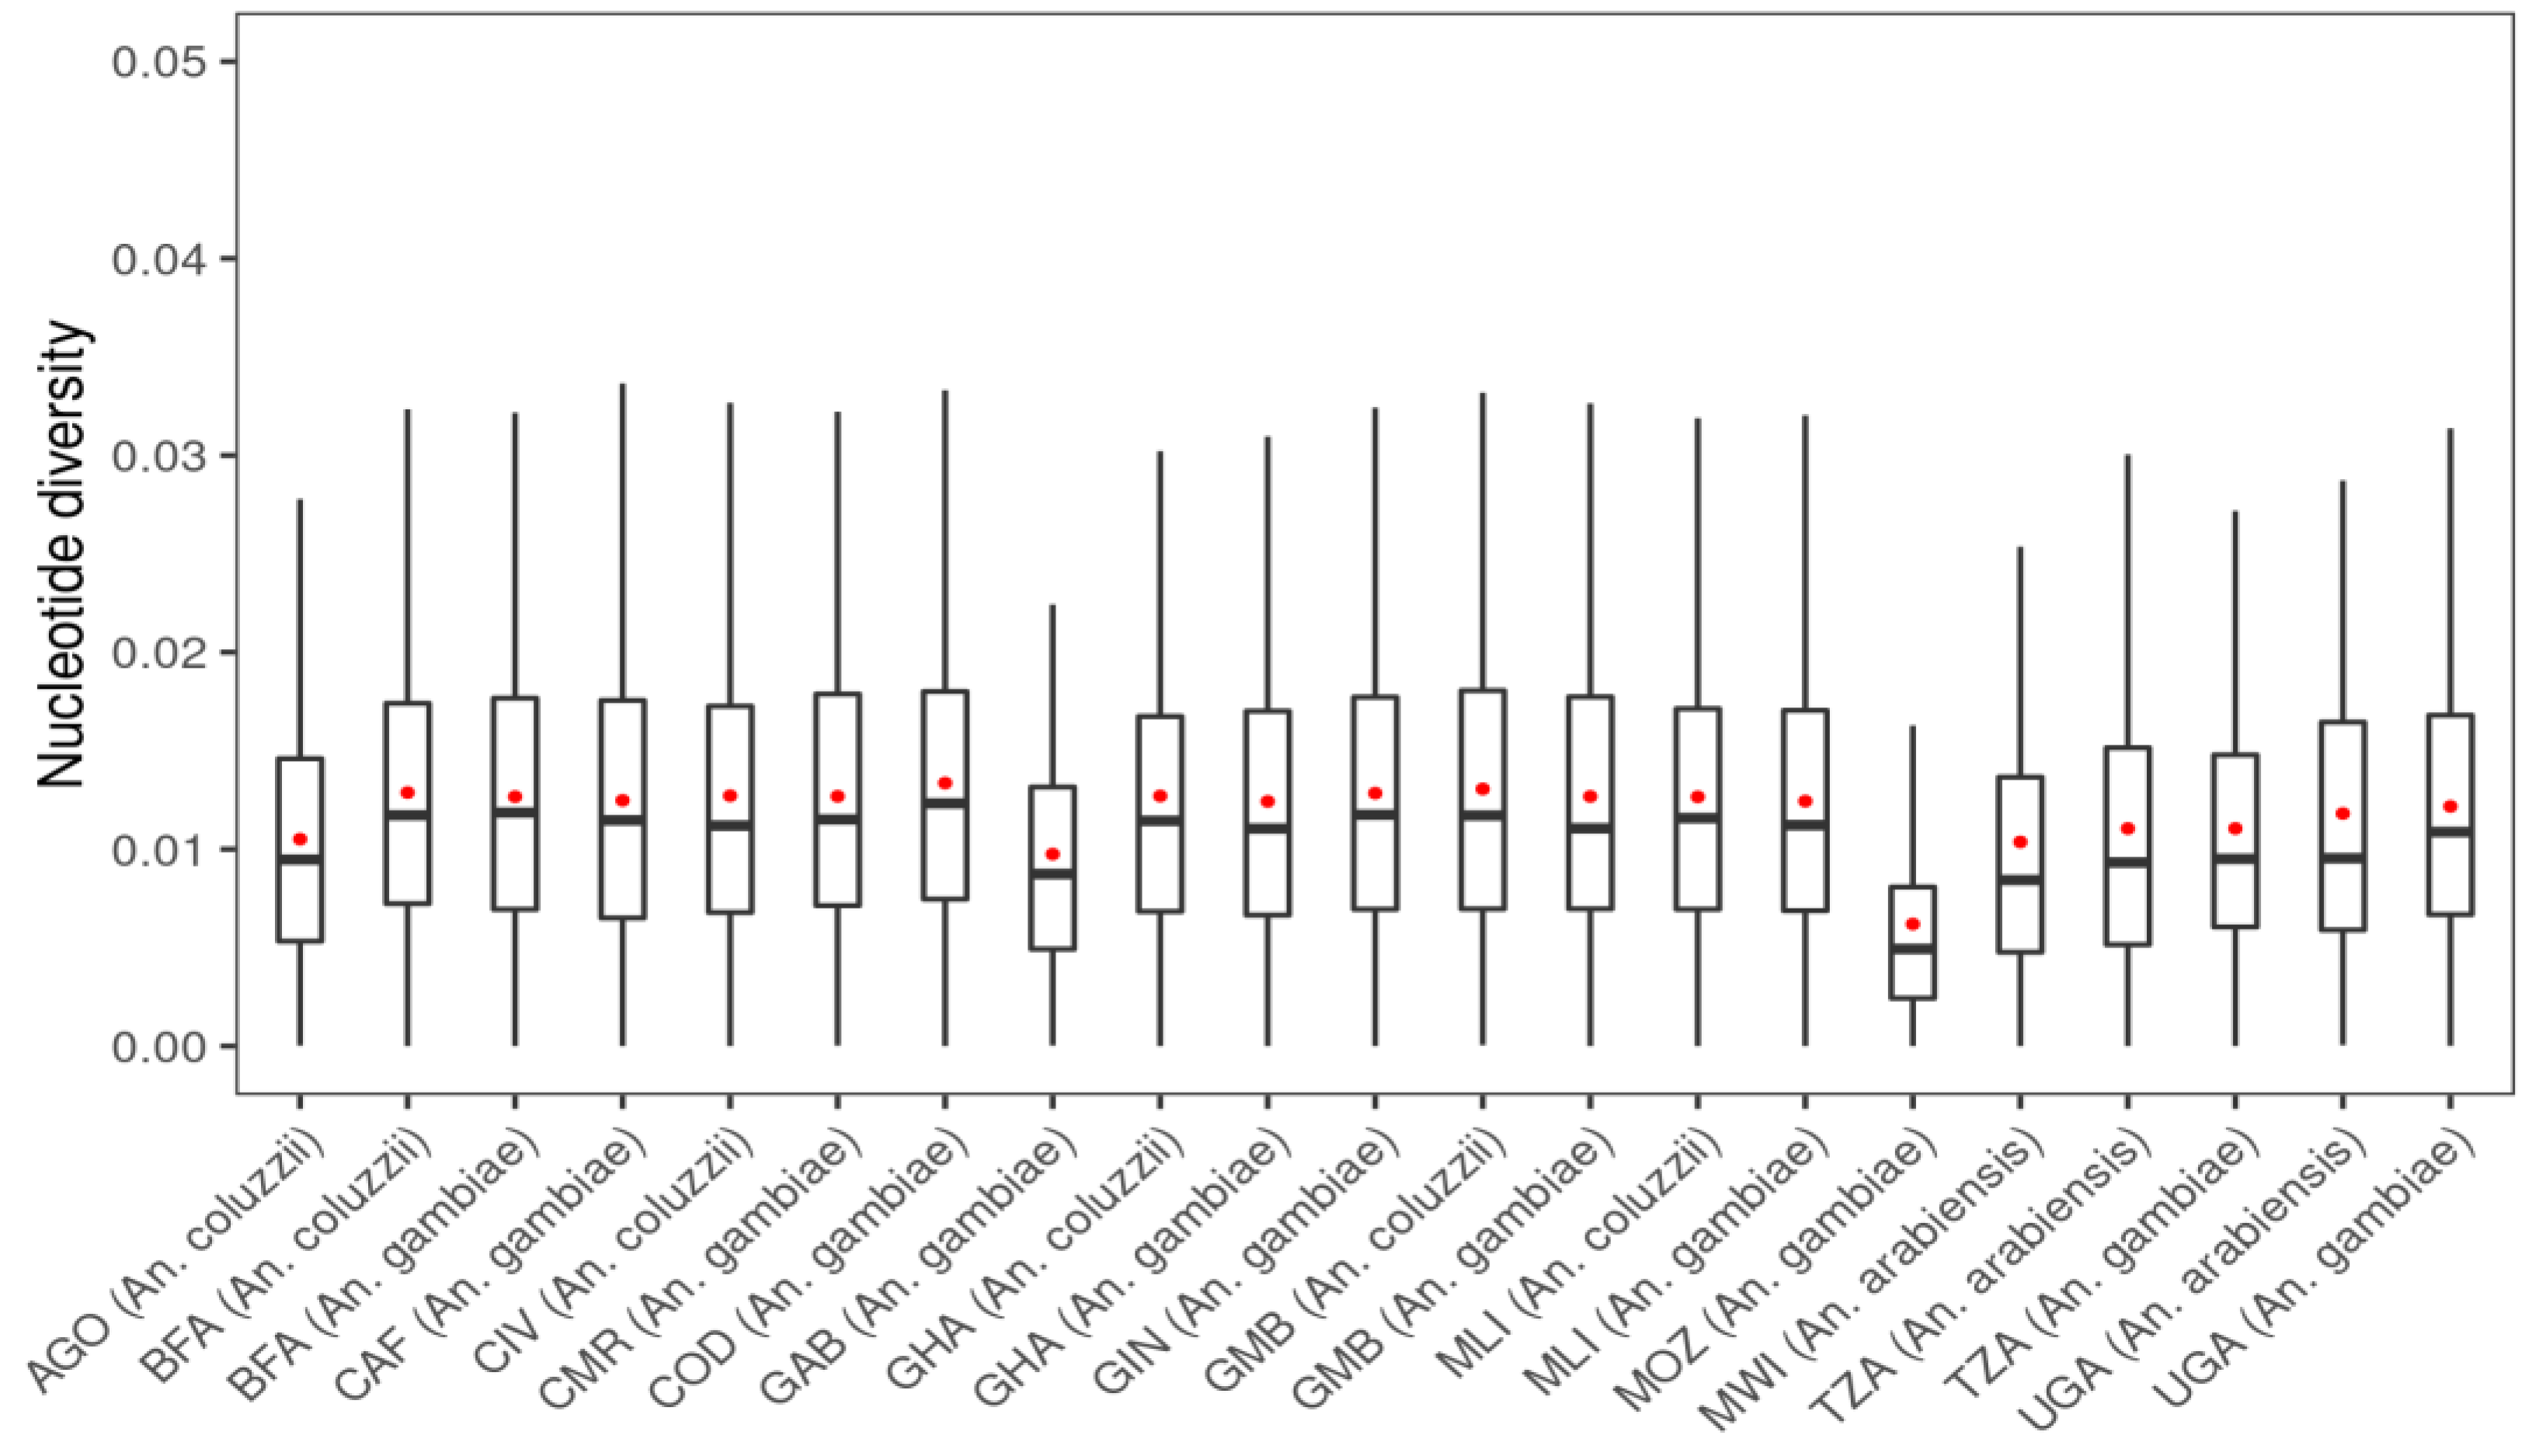
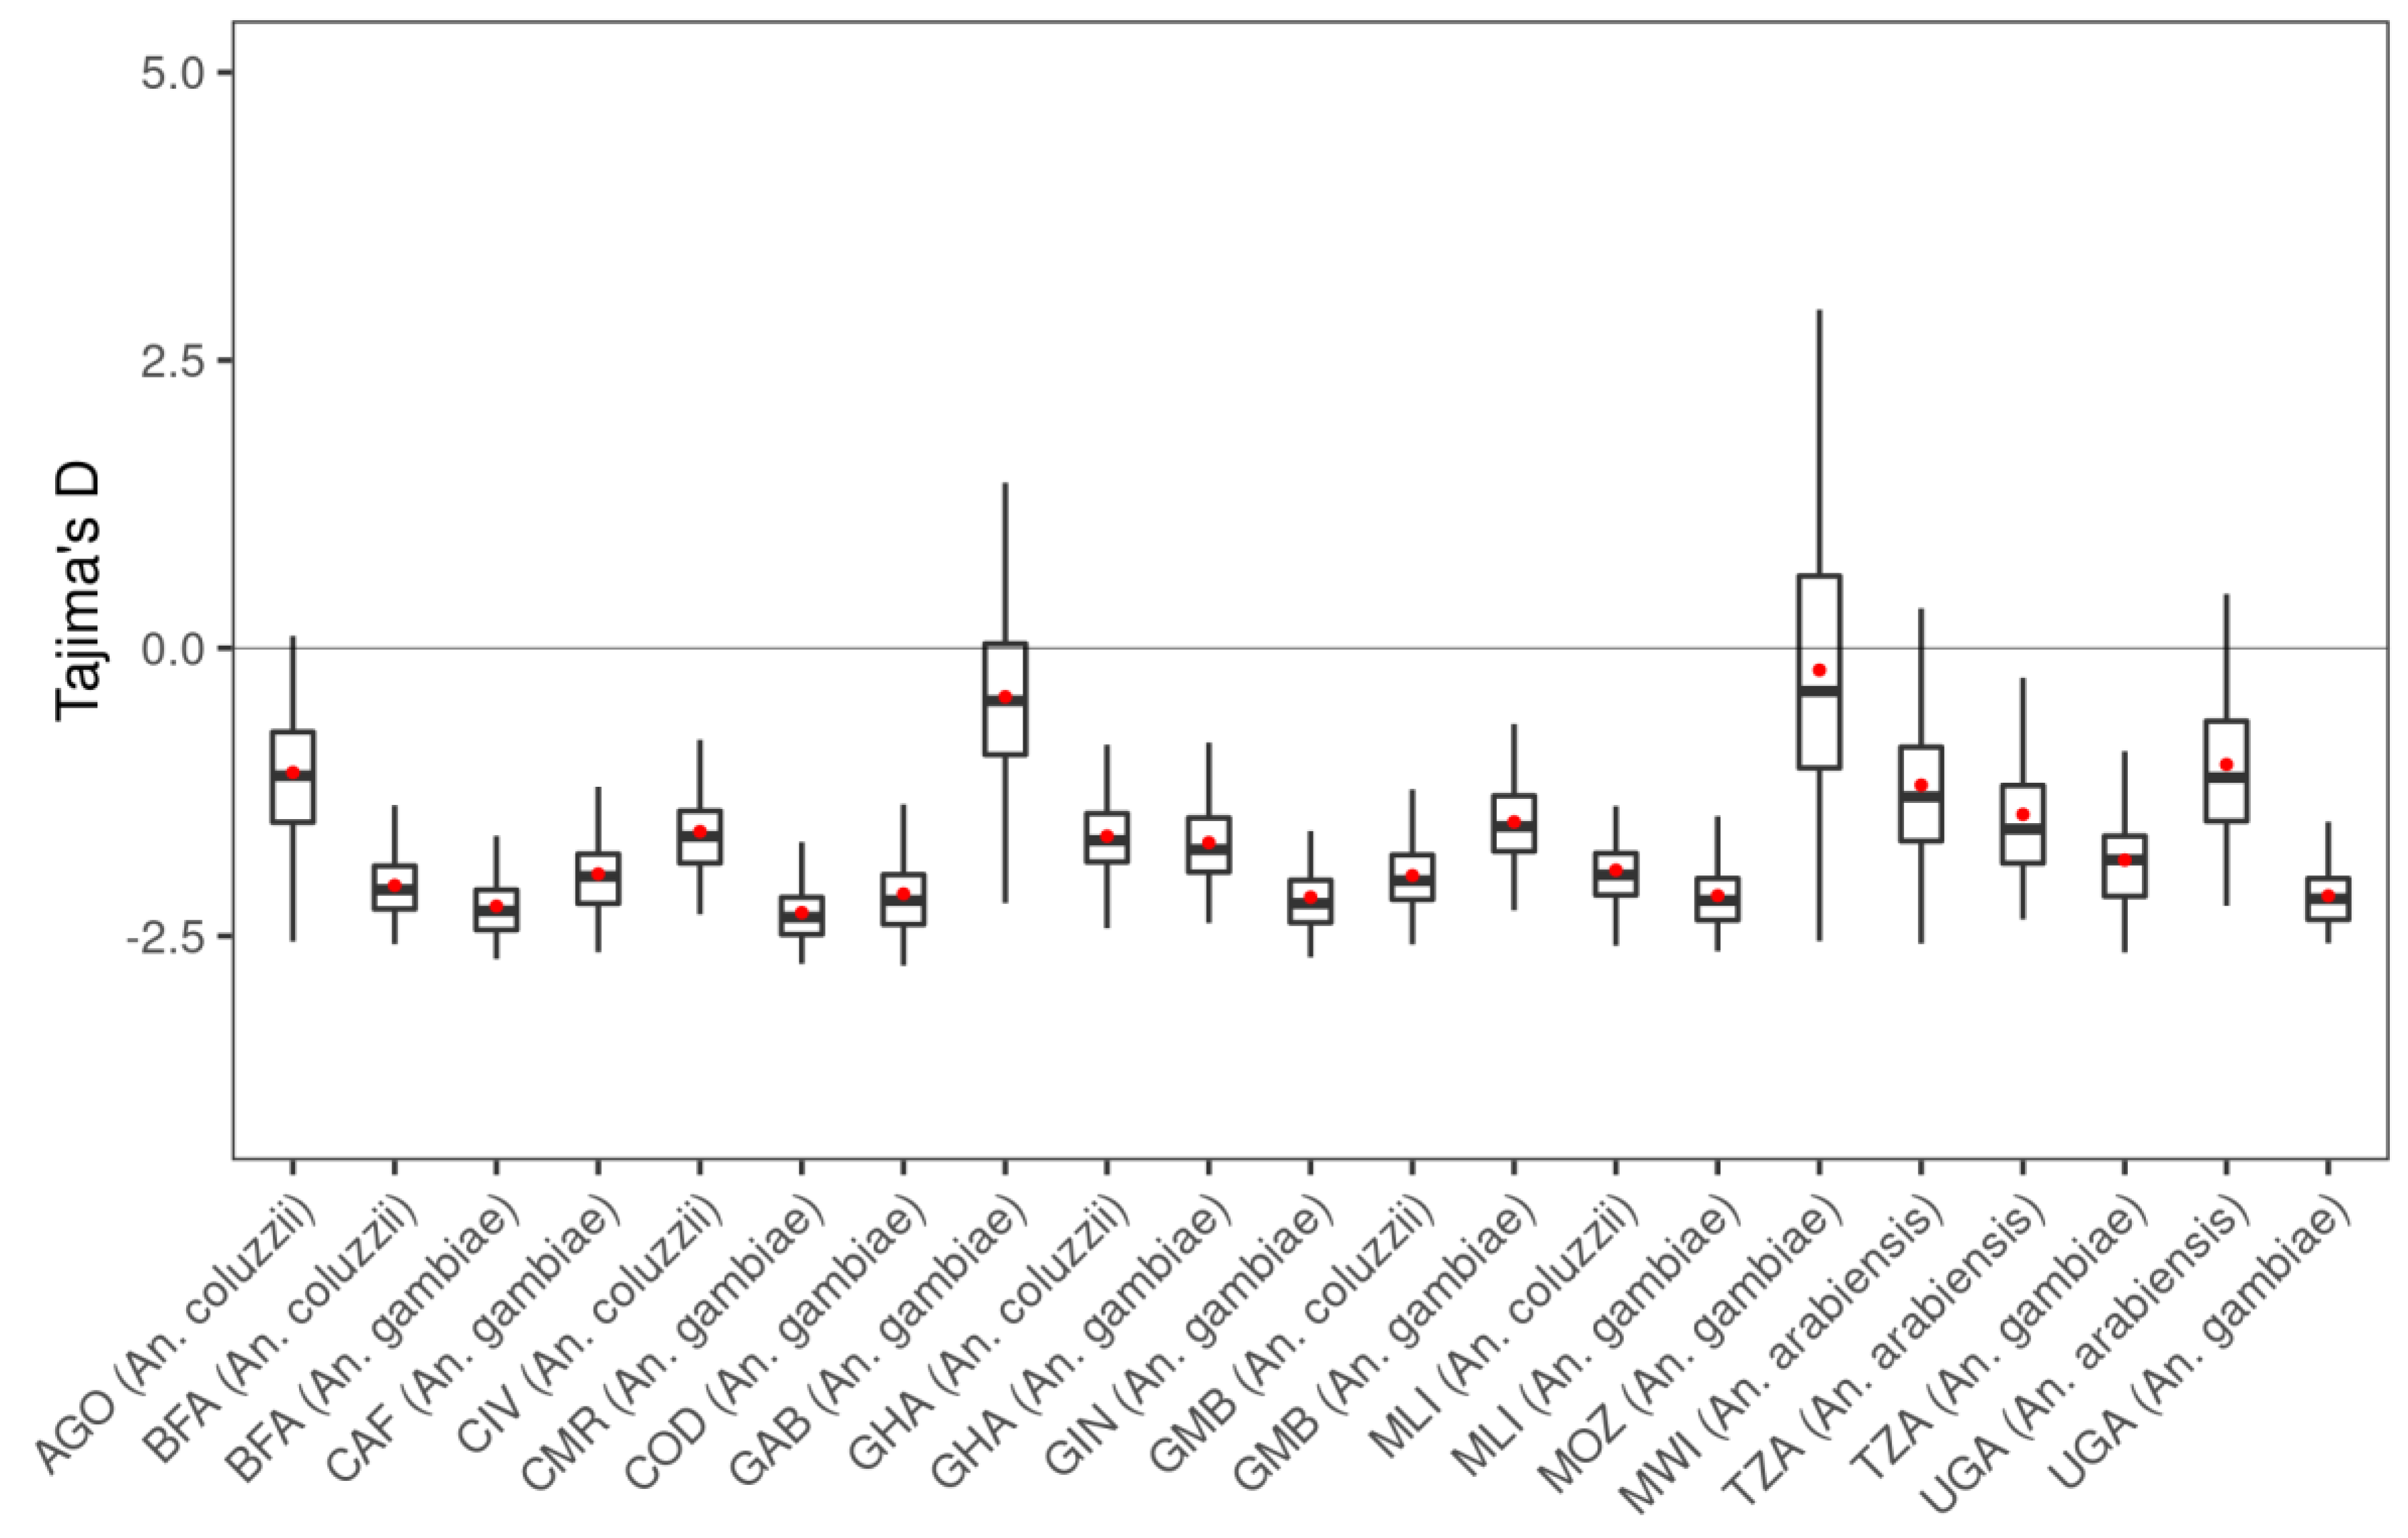
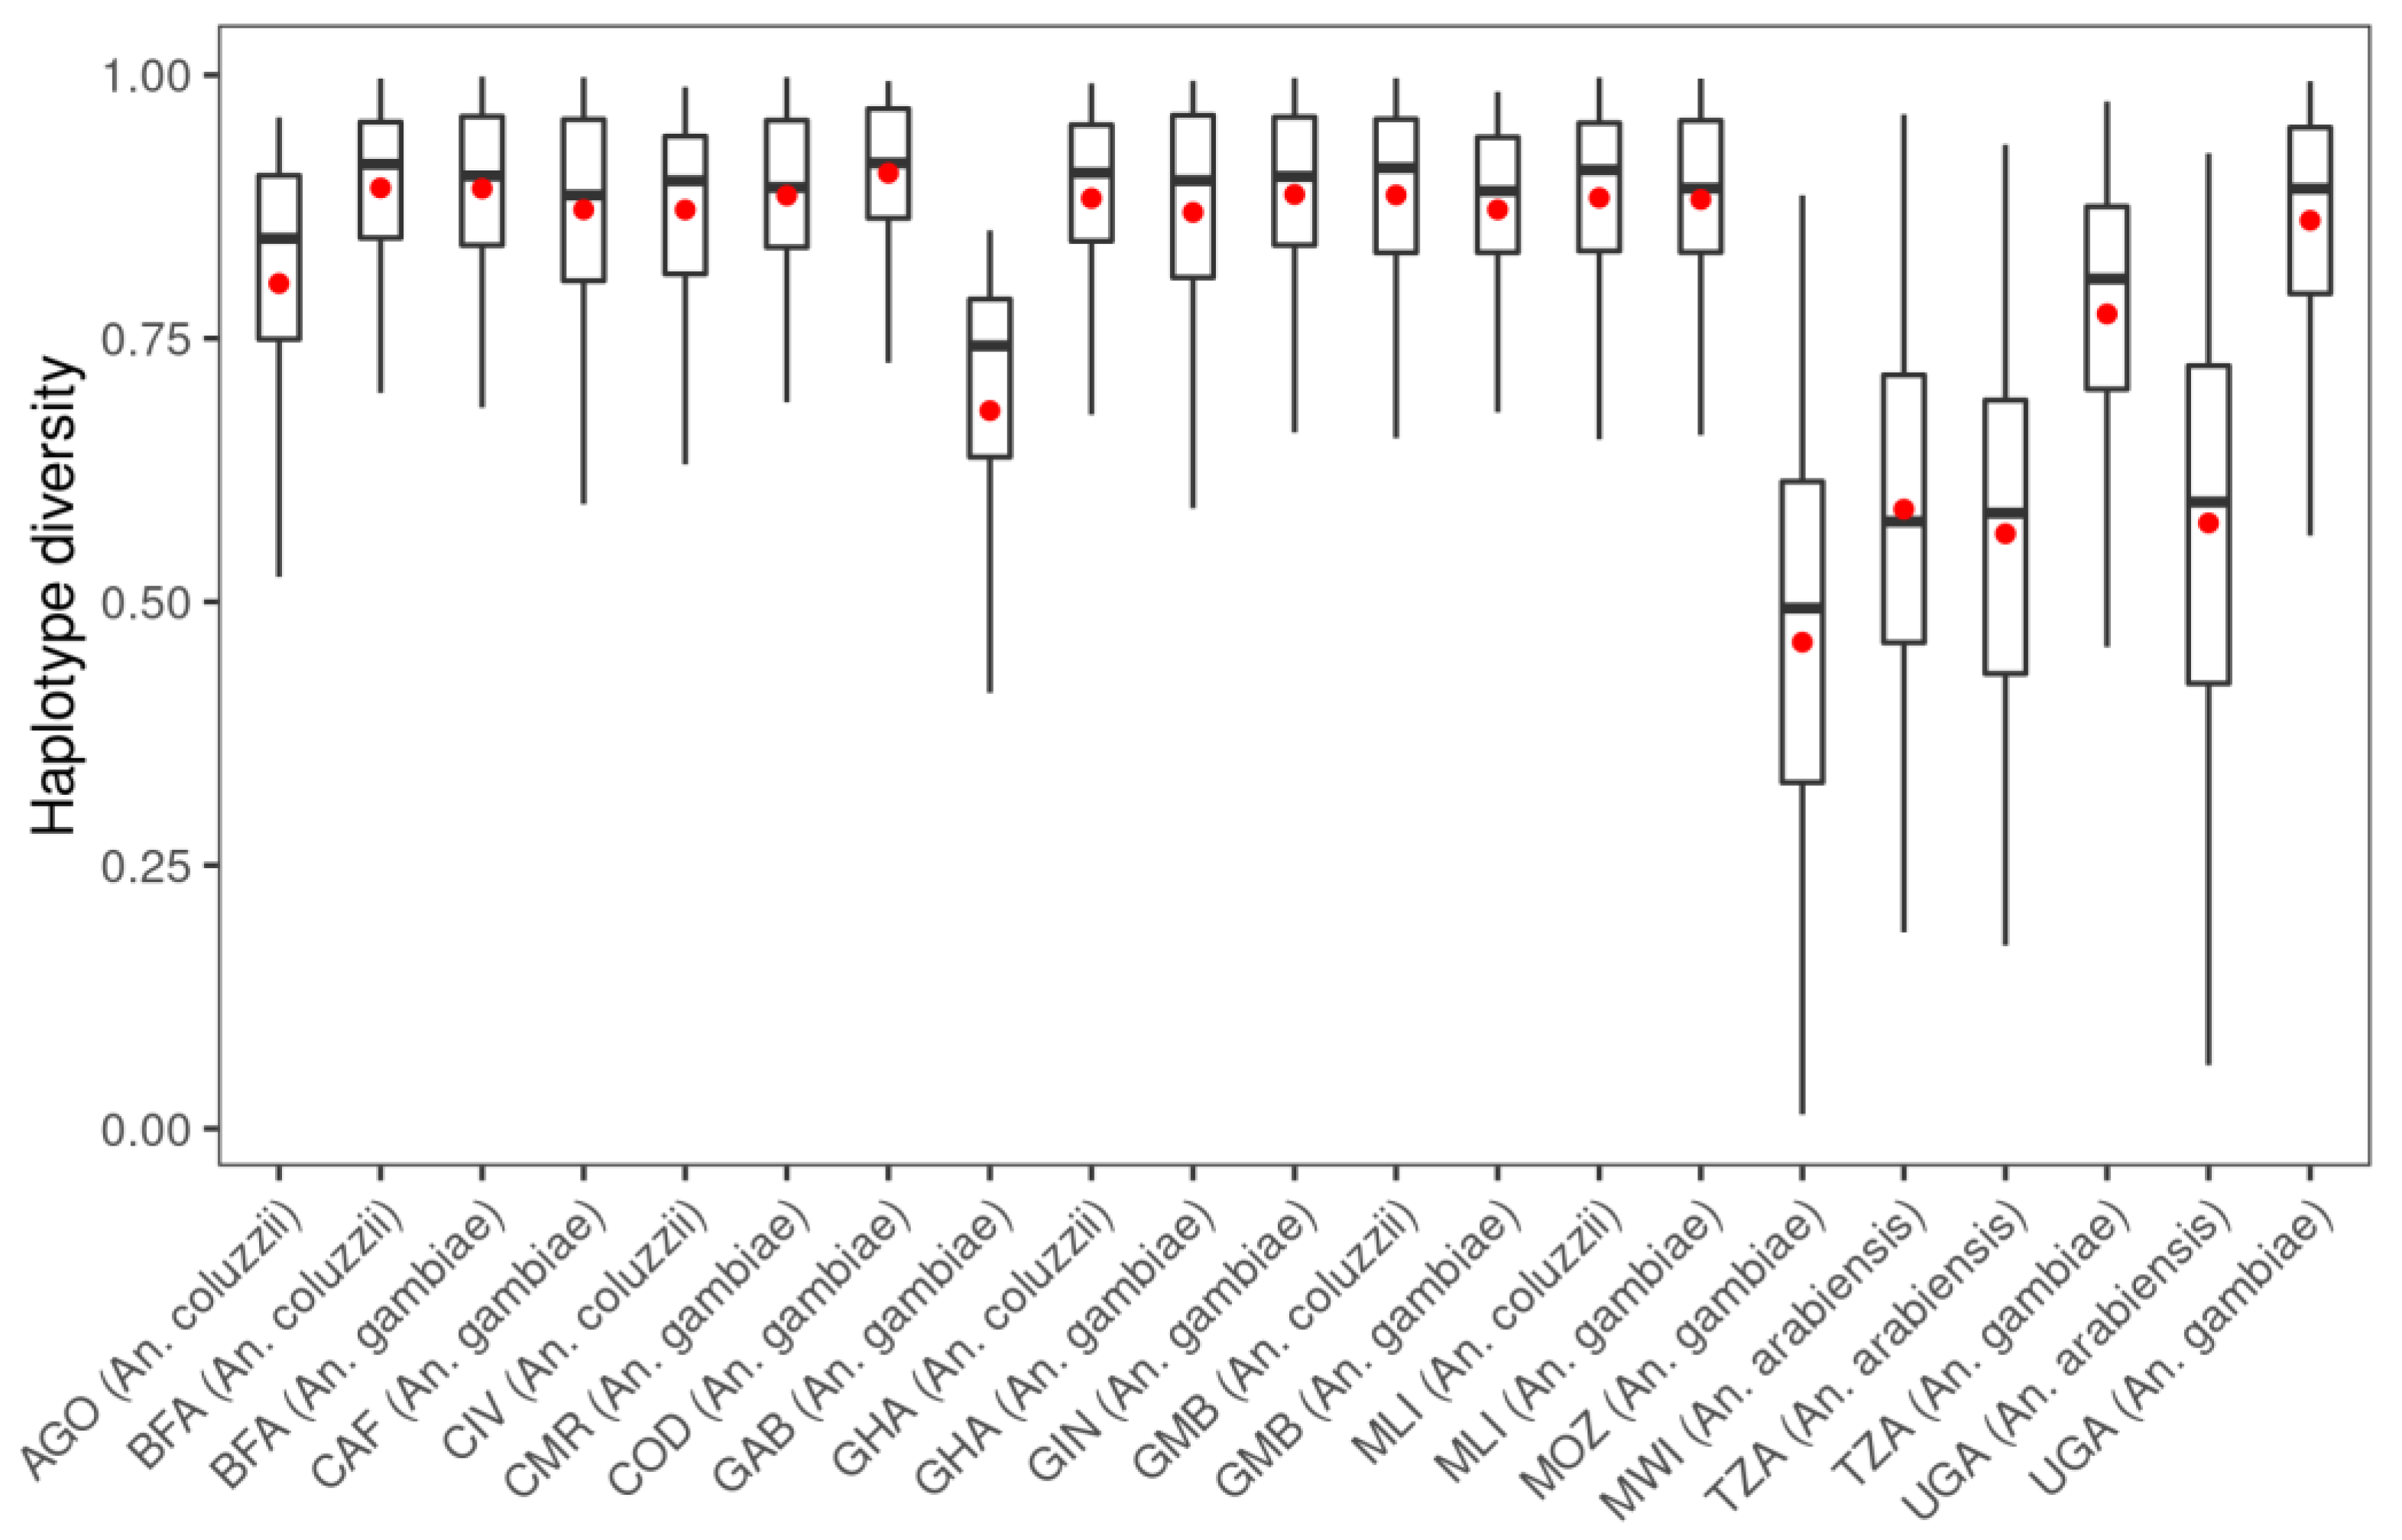
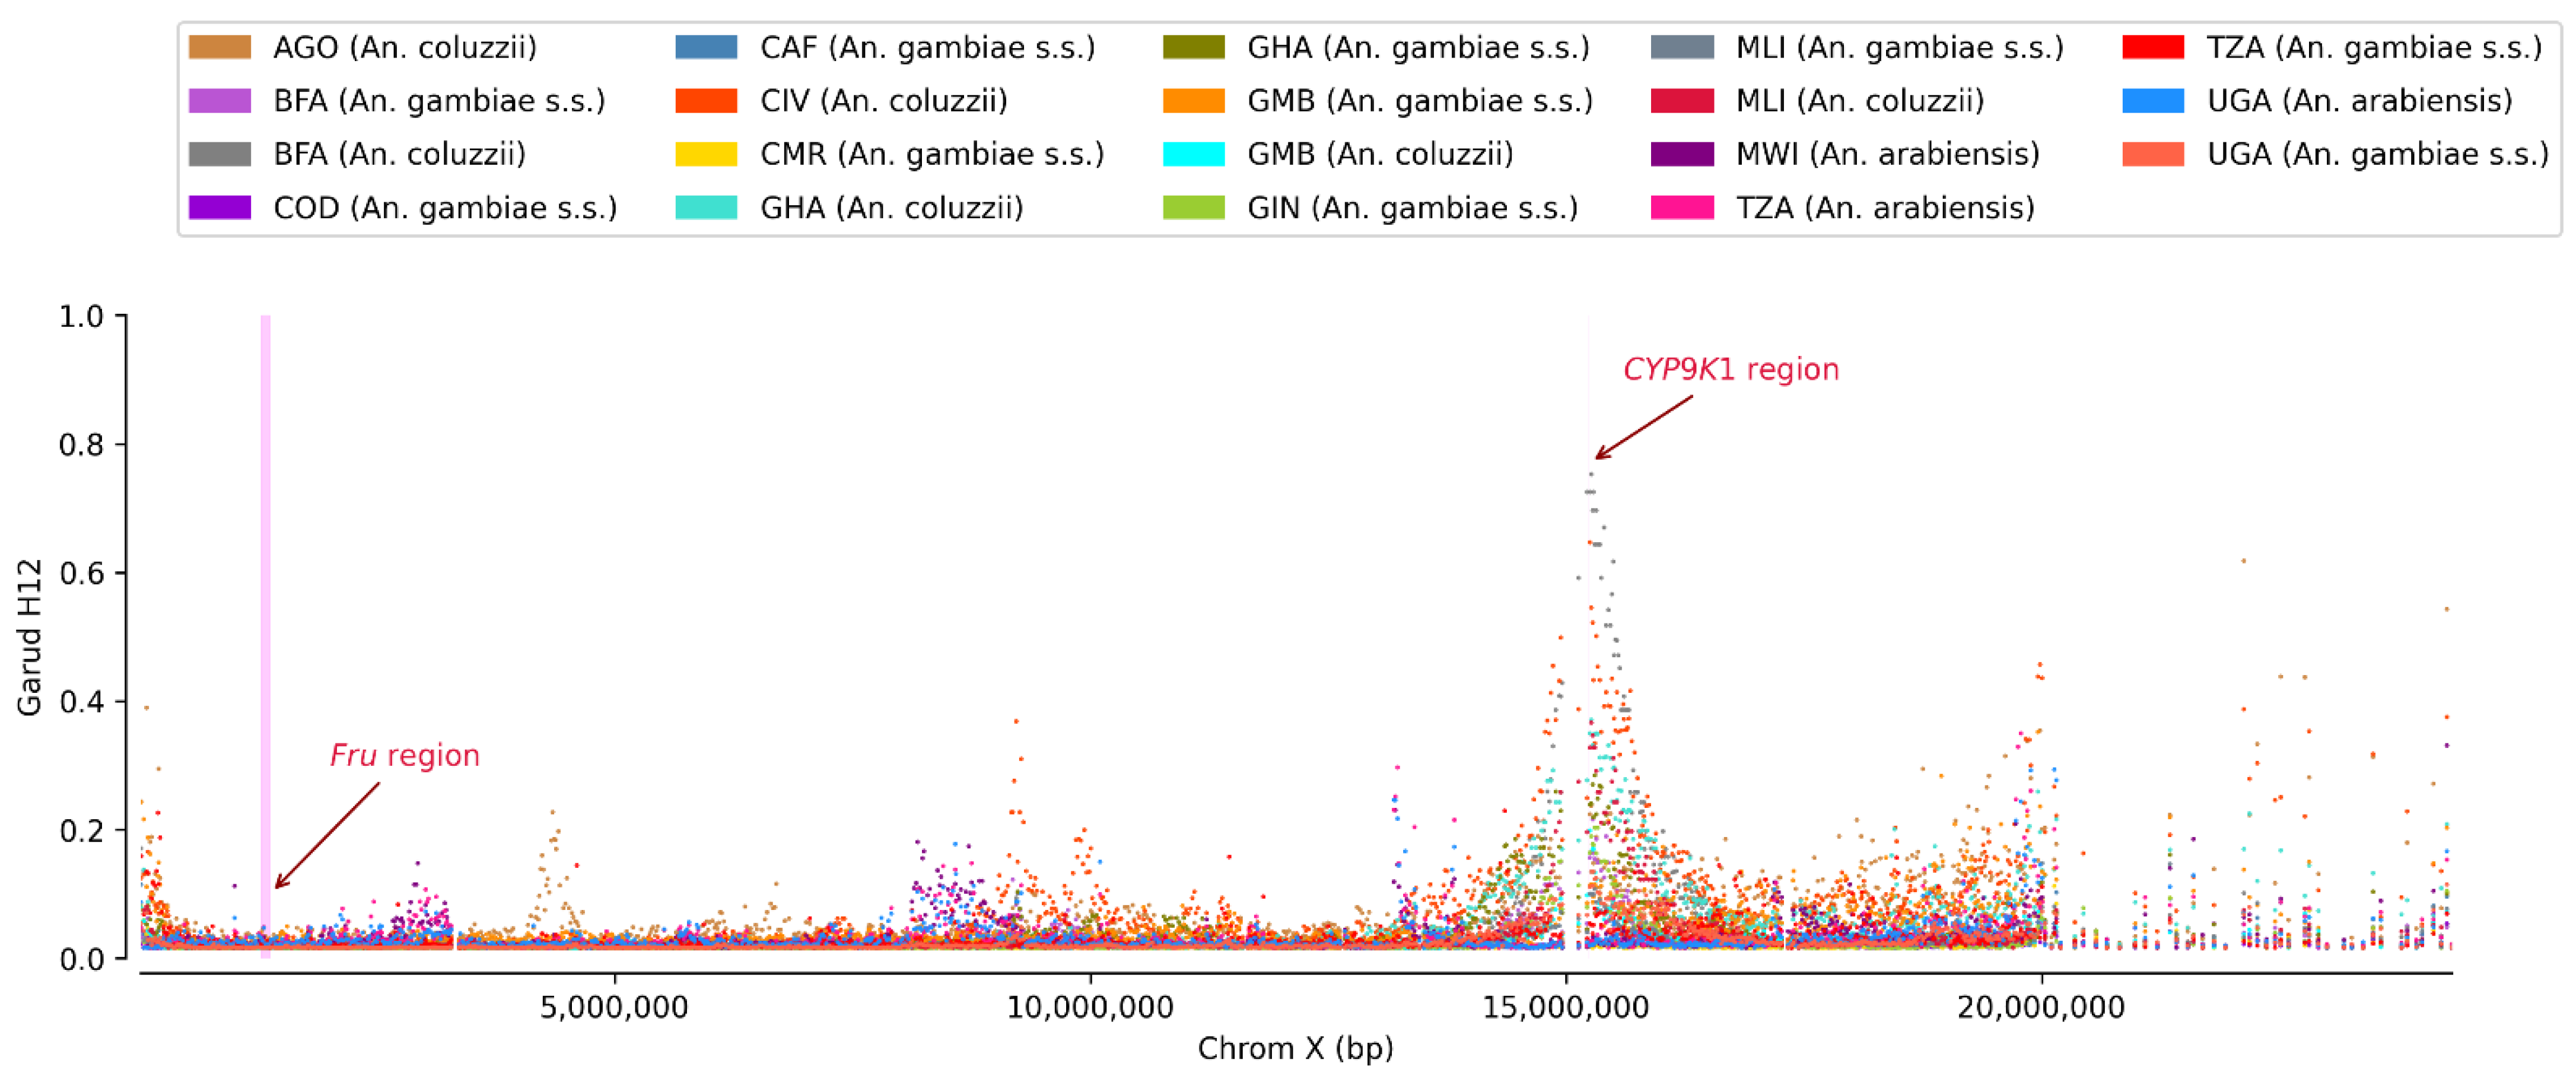
3.1. Genetic Variation within the fru Gene

In total, 34,339 segregating SNPs were identified, including 3.11% (1071 SNPs) non-synonymous segregating sites (750 biallelic non-synonymous variants) and 41.55% (14,268 SNPs) multi-allelic sites (more than two alleles). Many of these SNPs were identified in the intronic region (90.39% (31,042 SNPs)), and only 9.61% (3297 SNPs) were identified in the coding regions of the gene. The lowest SNP variants were identified in the male-specific exons (62 SNPs (0.508 bp−1)) and exon 2 (60 SNPs (0.48 bp−1)). Globally, the average of the variants’ density was 0.4 bp−1, indicating the occurrence of two SNPs in every five bp in the wild populations compared to the reference sequence of the fru gene (Figure A1). Compared to previous genome-wide analyses of An. gambiae (one SNP for every 1.9 bps) [39], this variant density was slightly lower in the genomic region of the fru gene. Table 1 shows the genetic diversity statistics of the fru gene, calculated using the SNPs data from each African country that was sampled and An. gambiae complex species. From these results, the highest number of SNPs (17,291 SNPs (sample size = 416)) was identified in the An. gambiae s.s. species collected in Cameroon.
The nucleotide diversity is a molecular genomic notion that estimates the level of polymorphism of a genomic region within a population. It measures the number of nucleotide differences per site between two randomly selected DNA sequences in the same population [40]. In our study, the overall nucleotide diversity was 0.0036 in the genomic region of the fru gene. Nucleotide diversity, calculated within a non-overlapping 0.5 kb window along the entire fru gene, was low in all populations, and the median values ranged from 0.0049 to 0.0157 (Table 1, Figure A2). The overall Tajima’s D test was negative (−2.52) within the genomic region of the fru gene (median values of Tajima’s D calculated in a non-overlapping window of 0.5 kb varied from −2.337 to 0.180) (Table 1, Figure A3), indicating an excess of low frequency variants [41]. This low nucleotide diversity and the negative sign of Tajima’s D could be due to an excess of rare variants within the genomic region of the fru gene in the An. gambiae complex populations. The excess of rare variants in a population may be caused by positive selection within the gene or rapid demographic changes causing the expansion of An. gambiae complex populations.
To elucidate the evolutionary processes (either a selective sweep or demographic changes) that drive the observed genetic variation, we performed a selection scan at the chromosome X level using the Garud H12 statistics in the An. gambiae s.l populations from different regions of Africa. The Garud H12 (<0.05) was low in the fru genomic region (Figure A4 and Figure A5). However, compared to the Cyp9k1 (X:15240572-15242864), a cytochrome P450 gene shown to be involved in pyrethroid resistance [42], the H12 (min = 0.026, median = 0.215, max = 0.782) values were high, suggesting a positive selection in this gene. These results suggest that the excess of rare variants in the population may be caused by rapid demographic changes of An. gambiae complex populations.

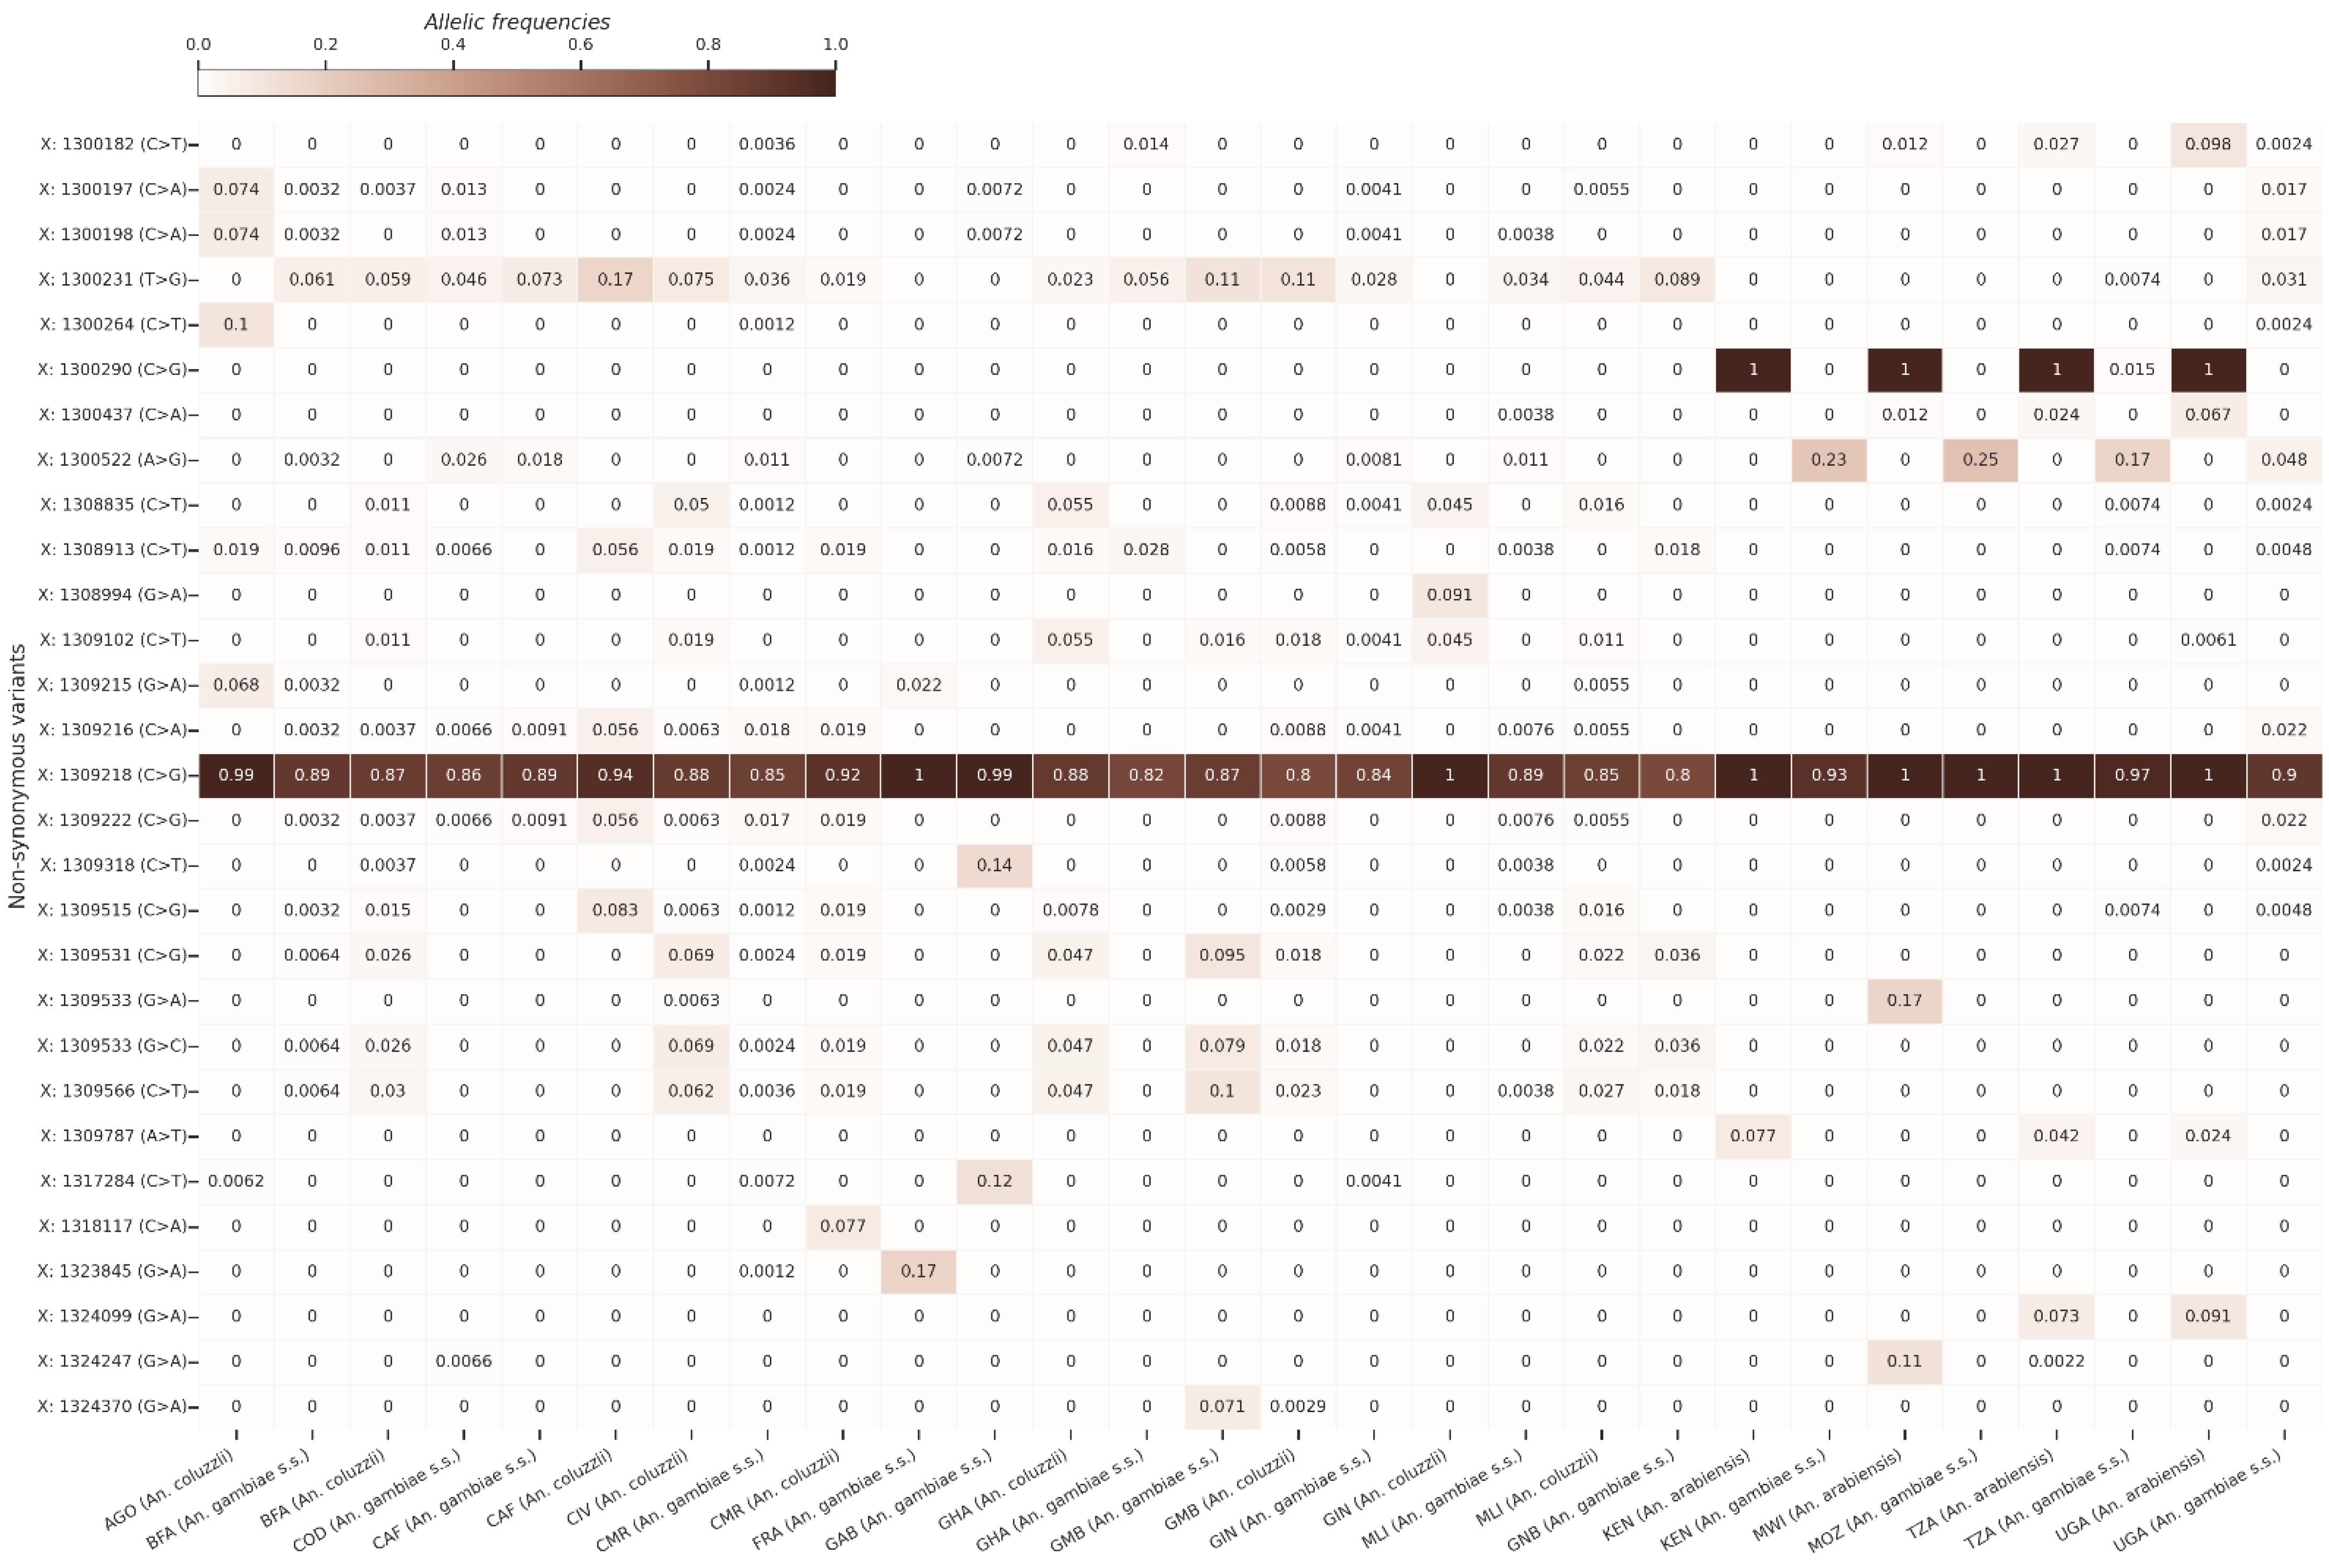
3.2. Non-Synonymous SNPs’ Variation

Overall, 1071 non-synonymous SNPs were identified, with allelic frequencies ranging from 0 to 1 within the three species of the An. gambiae complex (Tables S1 and S2). Figure 1 shows the allelic frequencies of the non-synonymous SNPs with maximum allelic frequencies that are greater than 5% in at least one population. Overall, the allelic frequencies of the non-synonymous SNPs were low, except for two SNPs at positions X:1309218 (C>G) and X:1300290 (C>G), identified at high frequencies in the zinc-finger A and zinc-finger B protein domains, respectively. The SNP at position X:1309218 (C>G) was identified in all the An. gambiae complex populations at high allelic frequencies greater than 0.8. However, the SNP at the position X:1300290 (C>G) mutation was only identified in An. arabiensis (freq = 1) populations from East Africa. This mutation was also found at low frequency (~0.015) in the An. gambiae s.s. population from Tanzania. However, no An. gambiae complex population from West or Central Africa has shown this mutation. Its absence in An. arabiensis populations from West and Central Africa could be due to the sample size, which is low (Table 1).
Analysis of the major SNPs’ (allelic frequencies > 5%) variation has shown variable heterozygosity rates within these SNPs between the An. gambiae population. Heterozygosity rates were low and ranged from −0.0313 to 0.0076 (Figure 2), indicating a deviation from the Hardy–Weinberg law at some loci. Indeed, the SNP at position X:1300290 (C>G) showed a very low heterozygosity, indicating that it is fully fixed in the An. arabiensis population of East Africa (allelic freq = 1) and is weakly found in the two other An. gambiae complex populations. On the other hand, the SNP at position X:1309218 (C>G) has also shown variable heterozygosity, with an excess of heterozygotes in the West African populations (An. gambiae and An. coluzzii) and a deficit in the Central and East African An. gambiae populations. Due to the fixation of the SNP at position X:1309218 (C>G) in the East African An. arabiensis, no deviation from the Hardy–Weinberg law was observed at this position. These results are in conformity with the distribution of the allele frequencies that showed the fixation of some non-synonymous SNPs in the populations and a deviation from the Hardy–Weinberg law at some loci.
Figure 3 shows the linkage disequilibrium between the major non-synonymous SNPs (max freq > 0.05) and the corresponding allelic frequencies of each SNPs in the whole population. As linkage disequilibrium is the non-random association of alleles at different loci, the mutation at position X:1309218 was strongly associated with the other non-synonymous mutations, exhibiting a perfect linkage disequilibrium with them. This pattern of linkage disequilibrium between the SNP at position X:1309218 and the other SNPs is correlated with the high allelic frequencies in the populations. Overall, genetic variation analysis of the fru gene showed a low nucleotide diversity, a negative Tajima’s D, and a strong linkage disequilibrium, as well as a fixation of a SNP at position X:1309218 (C>G) within all the population.

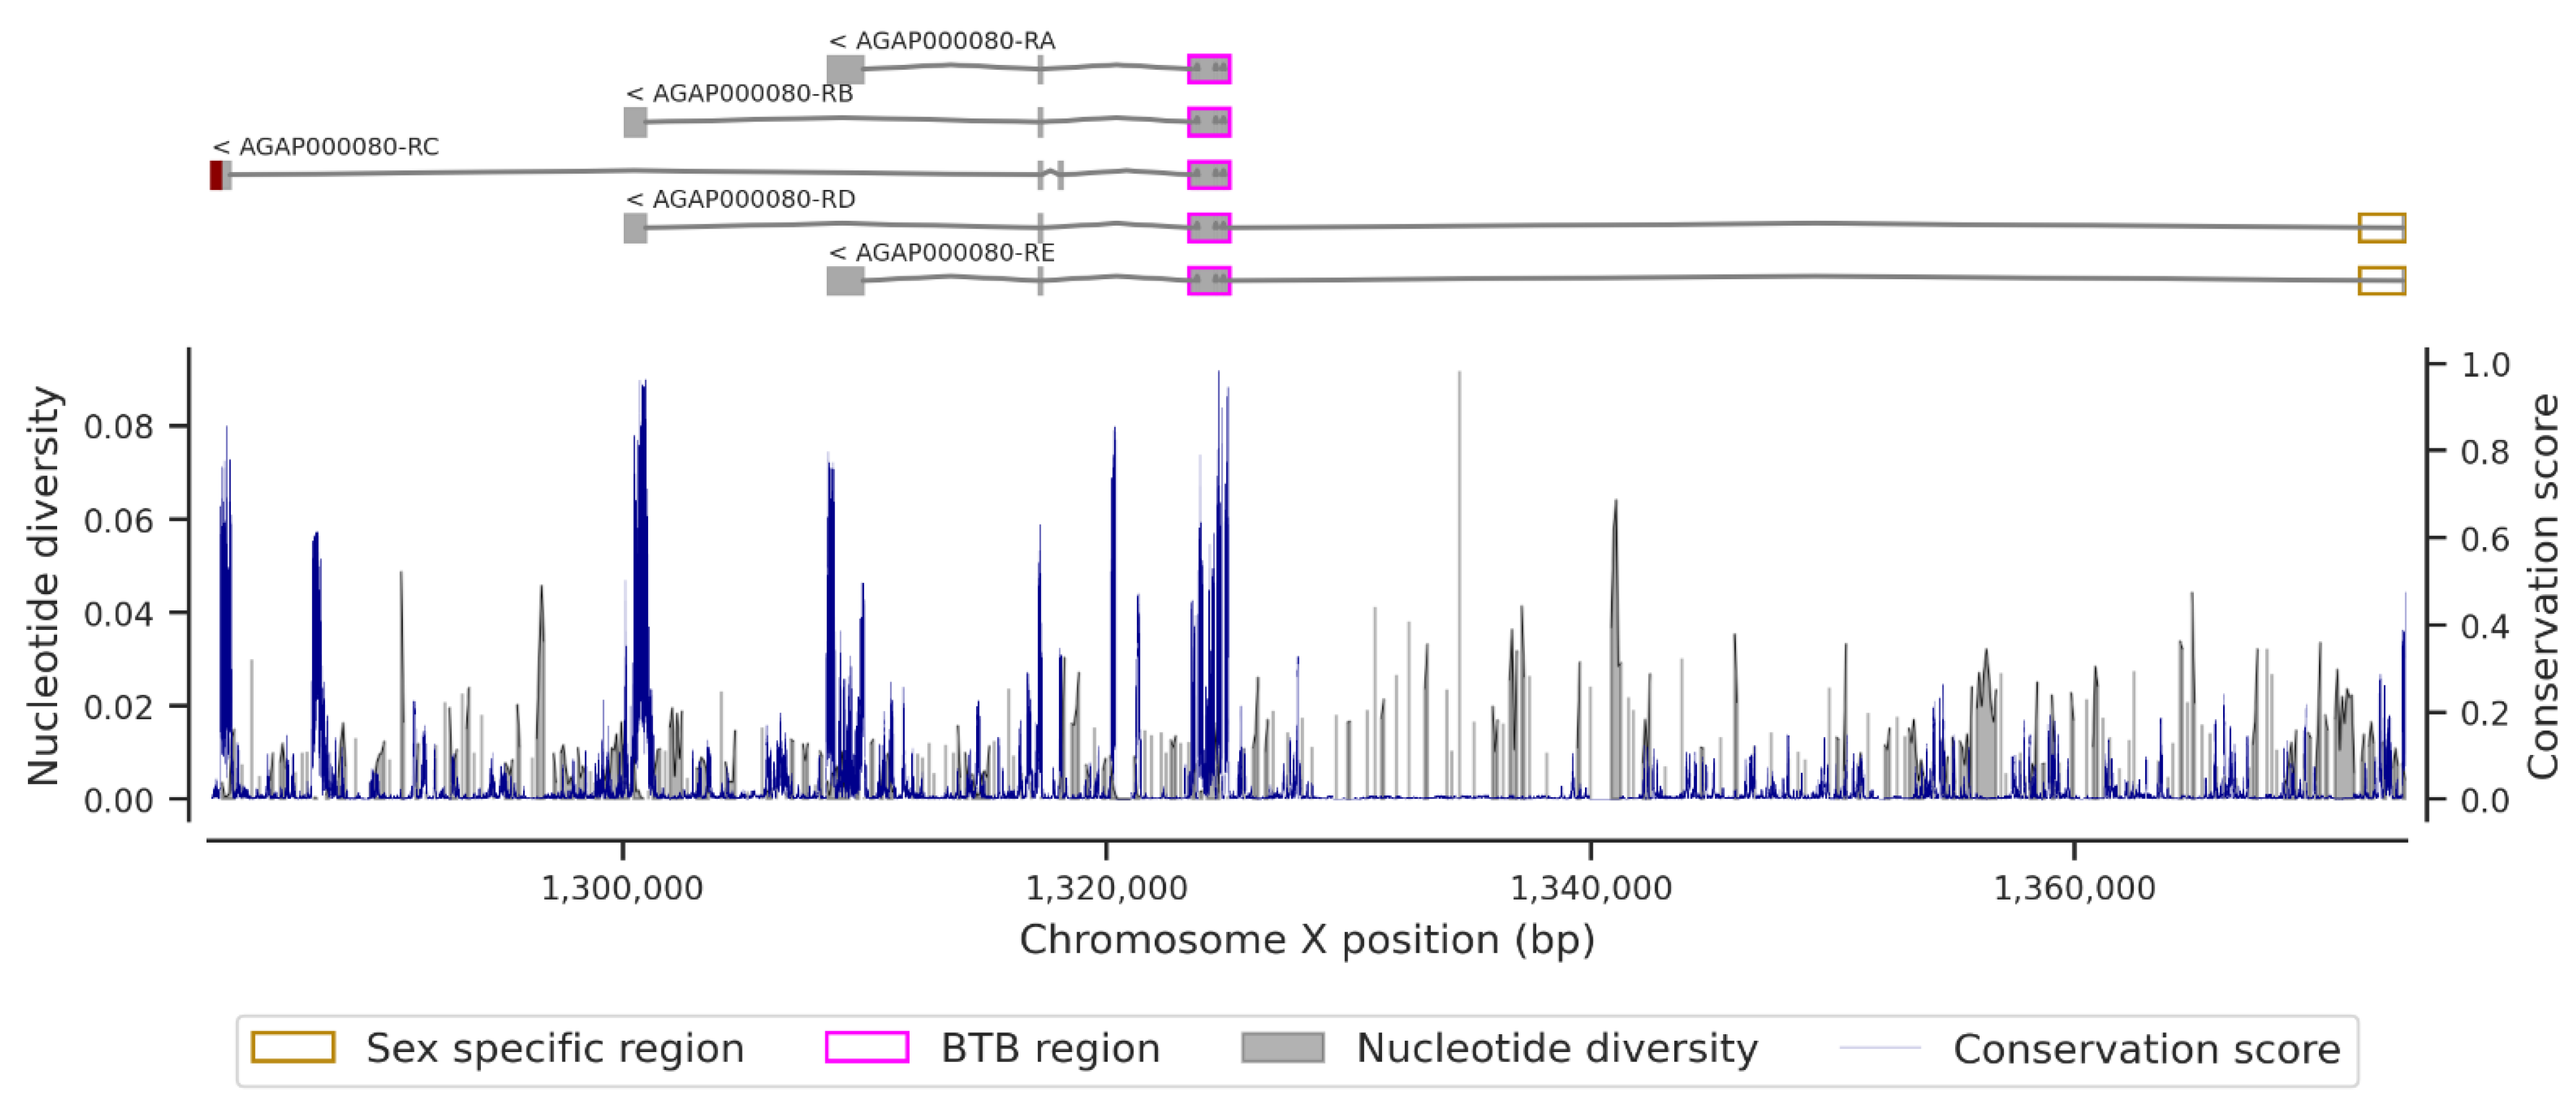
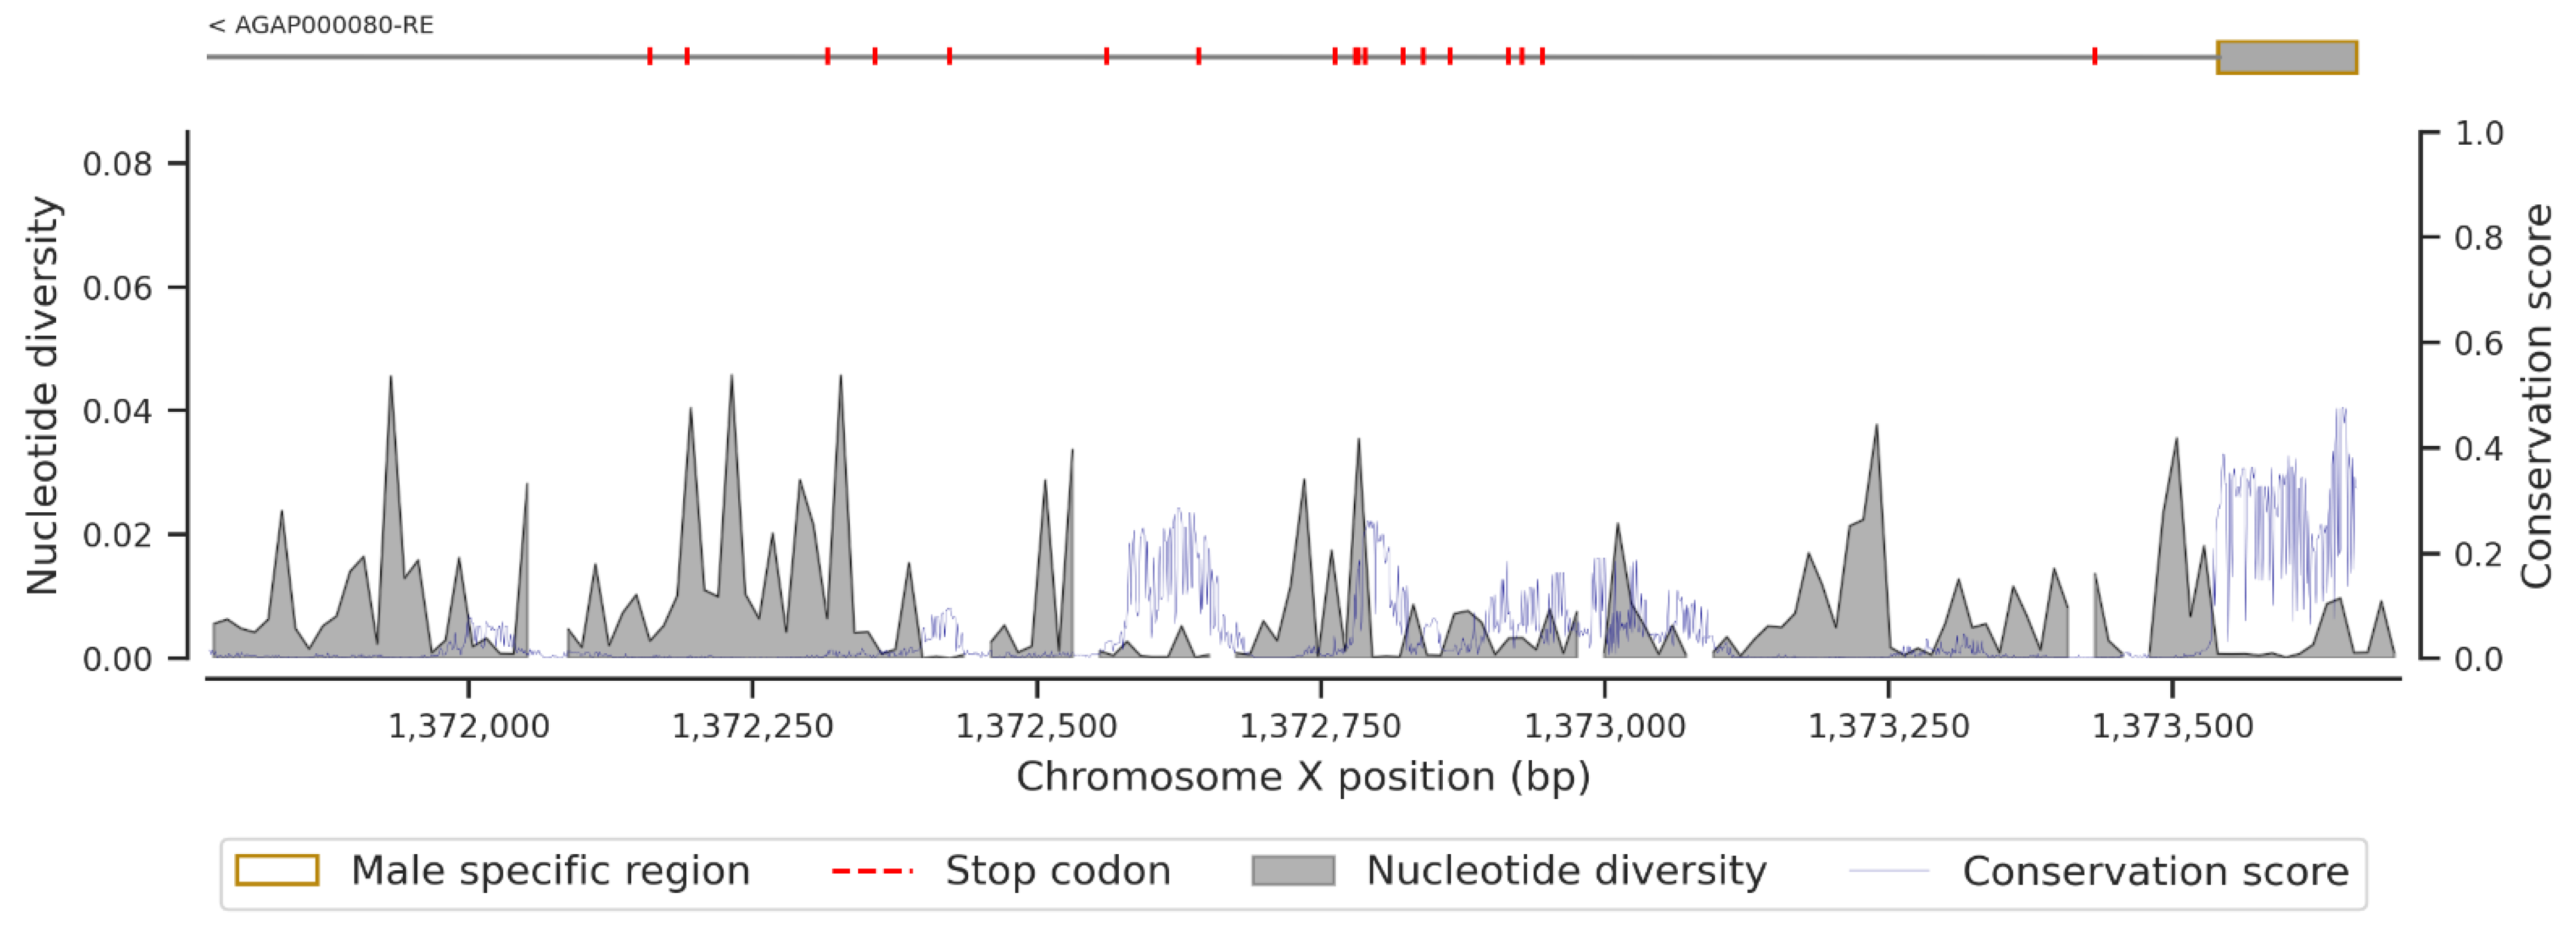
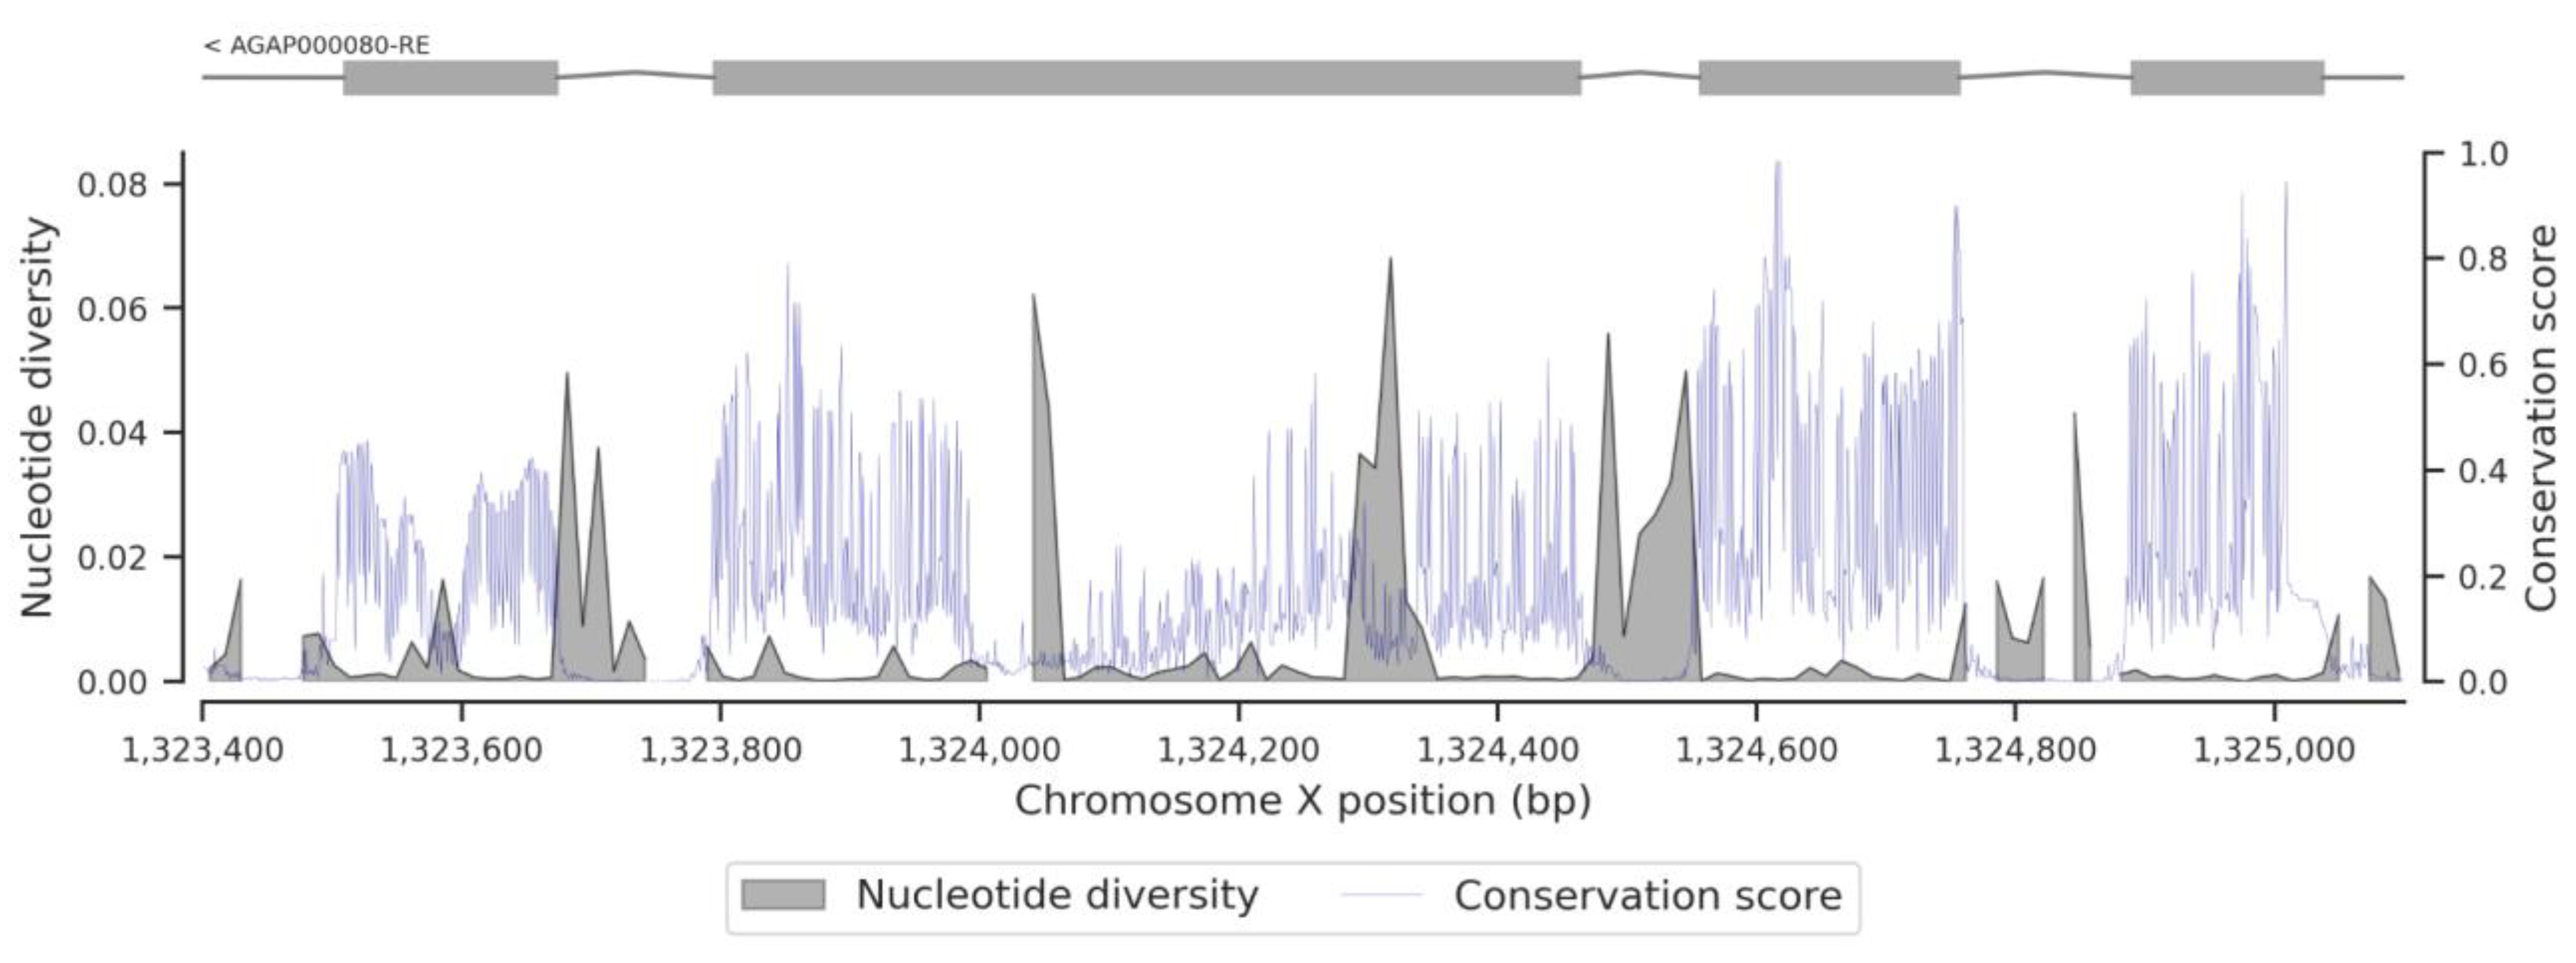
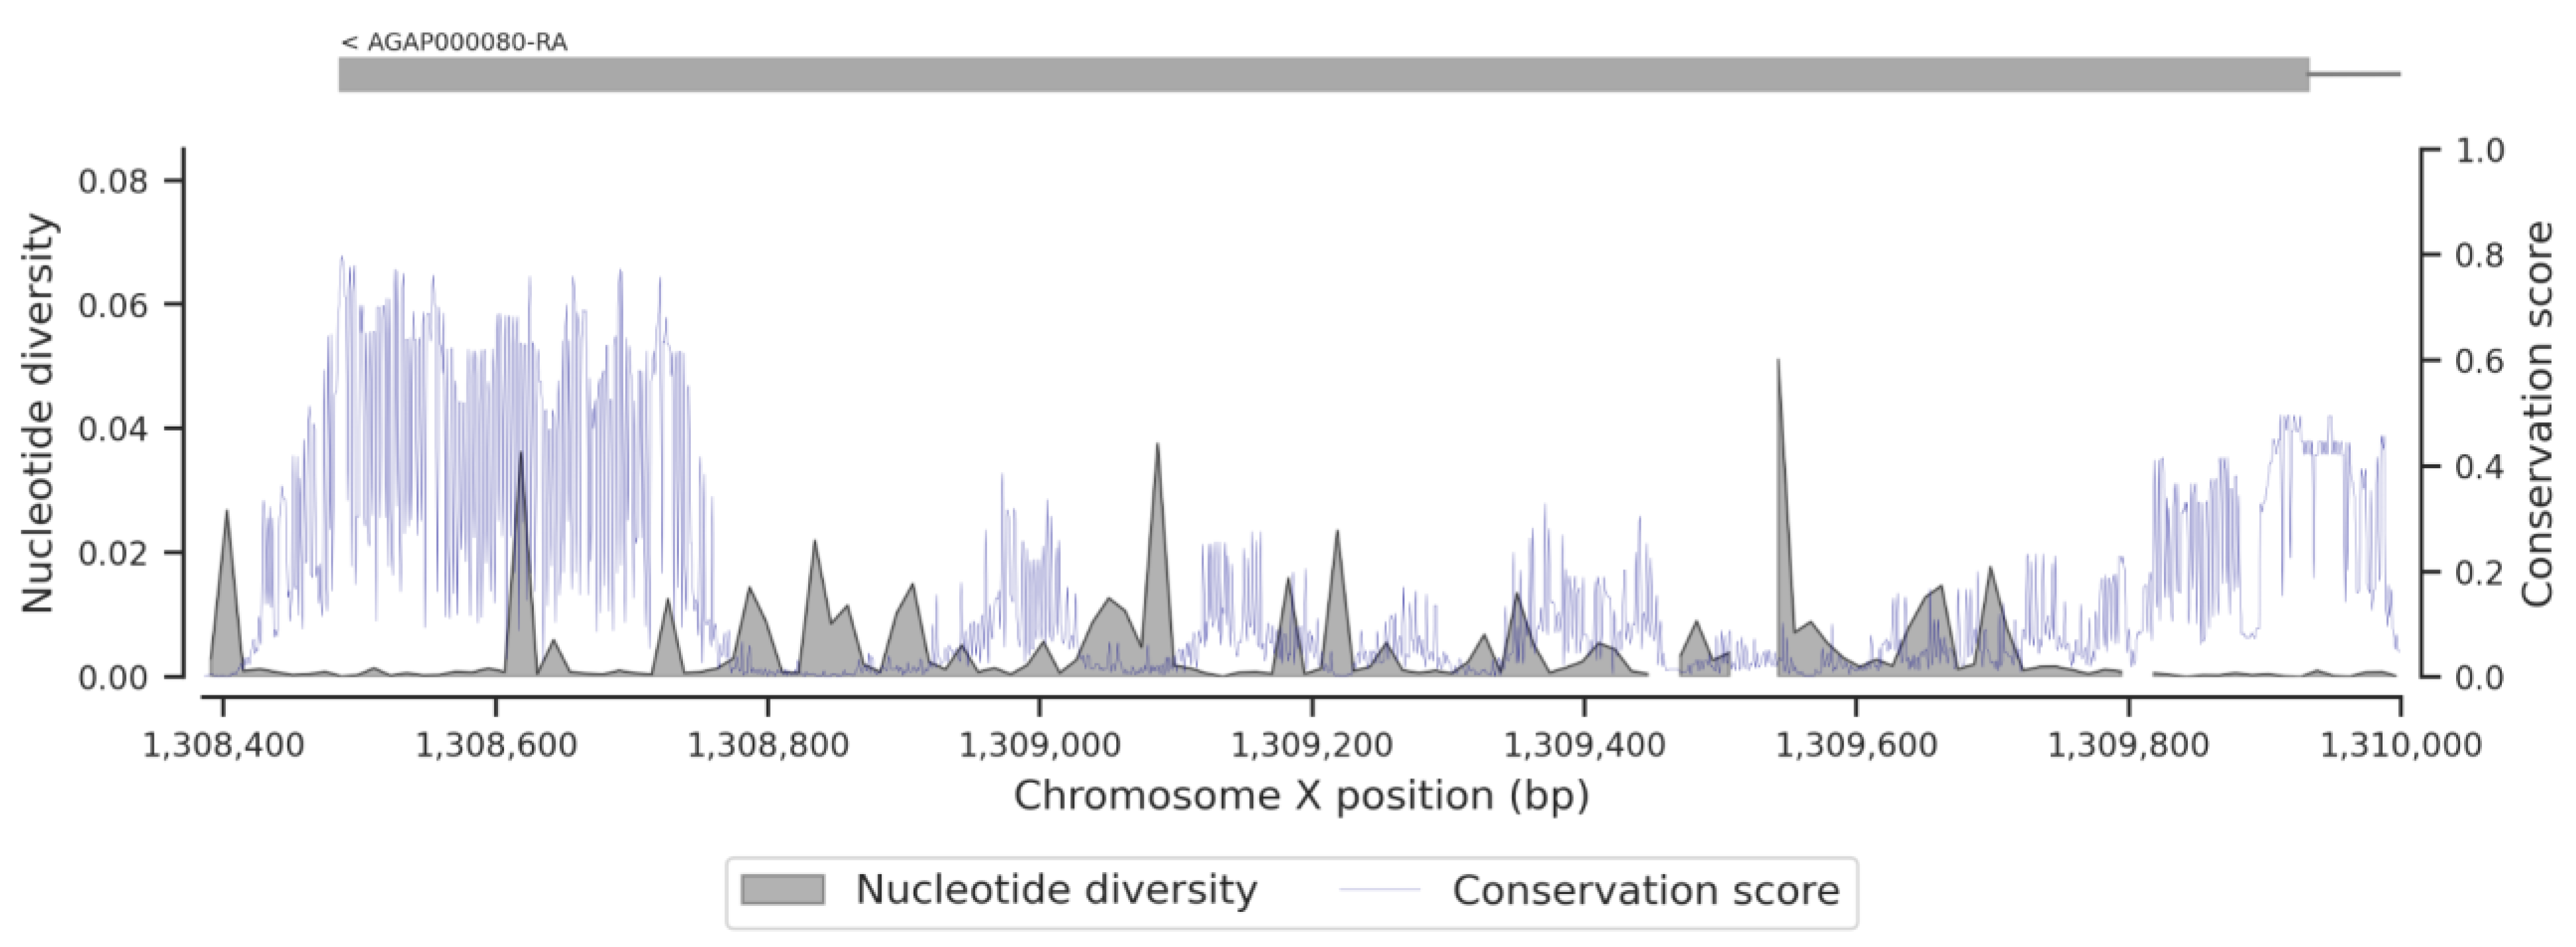
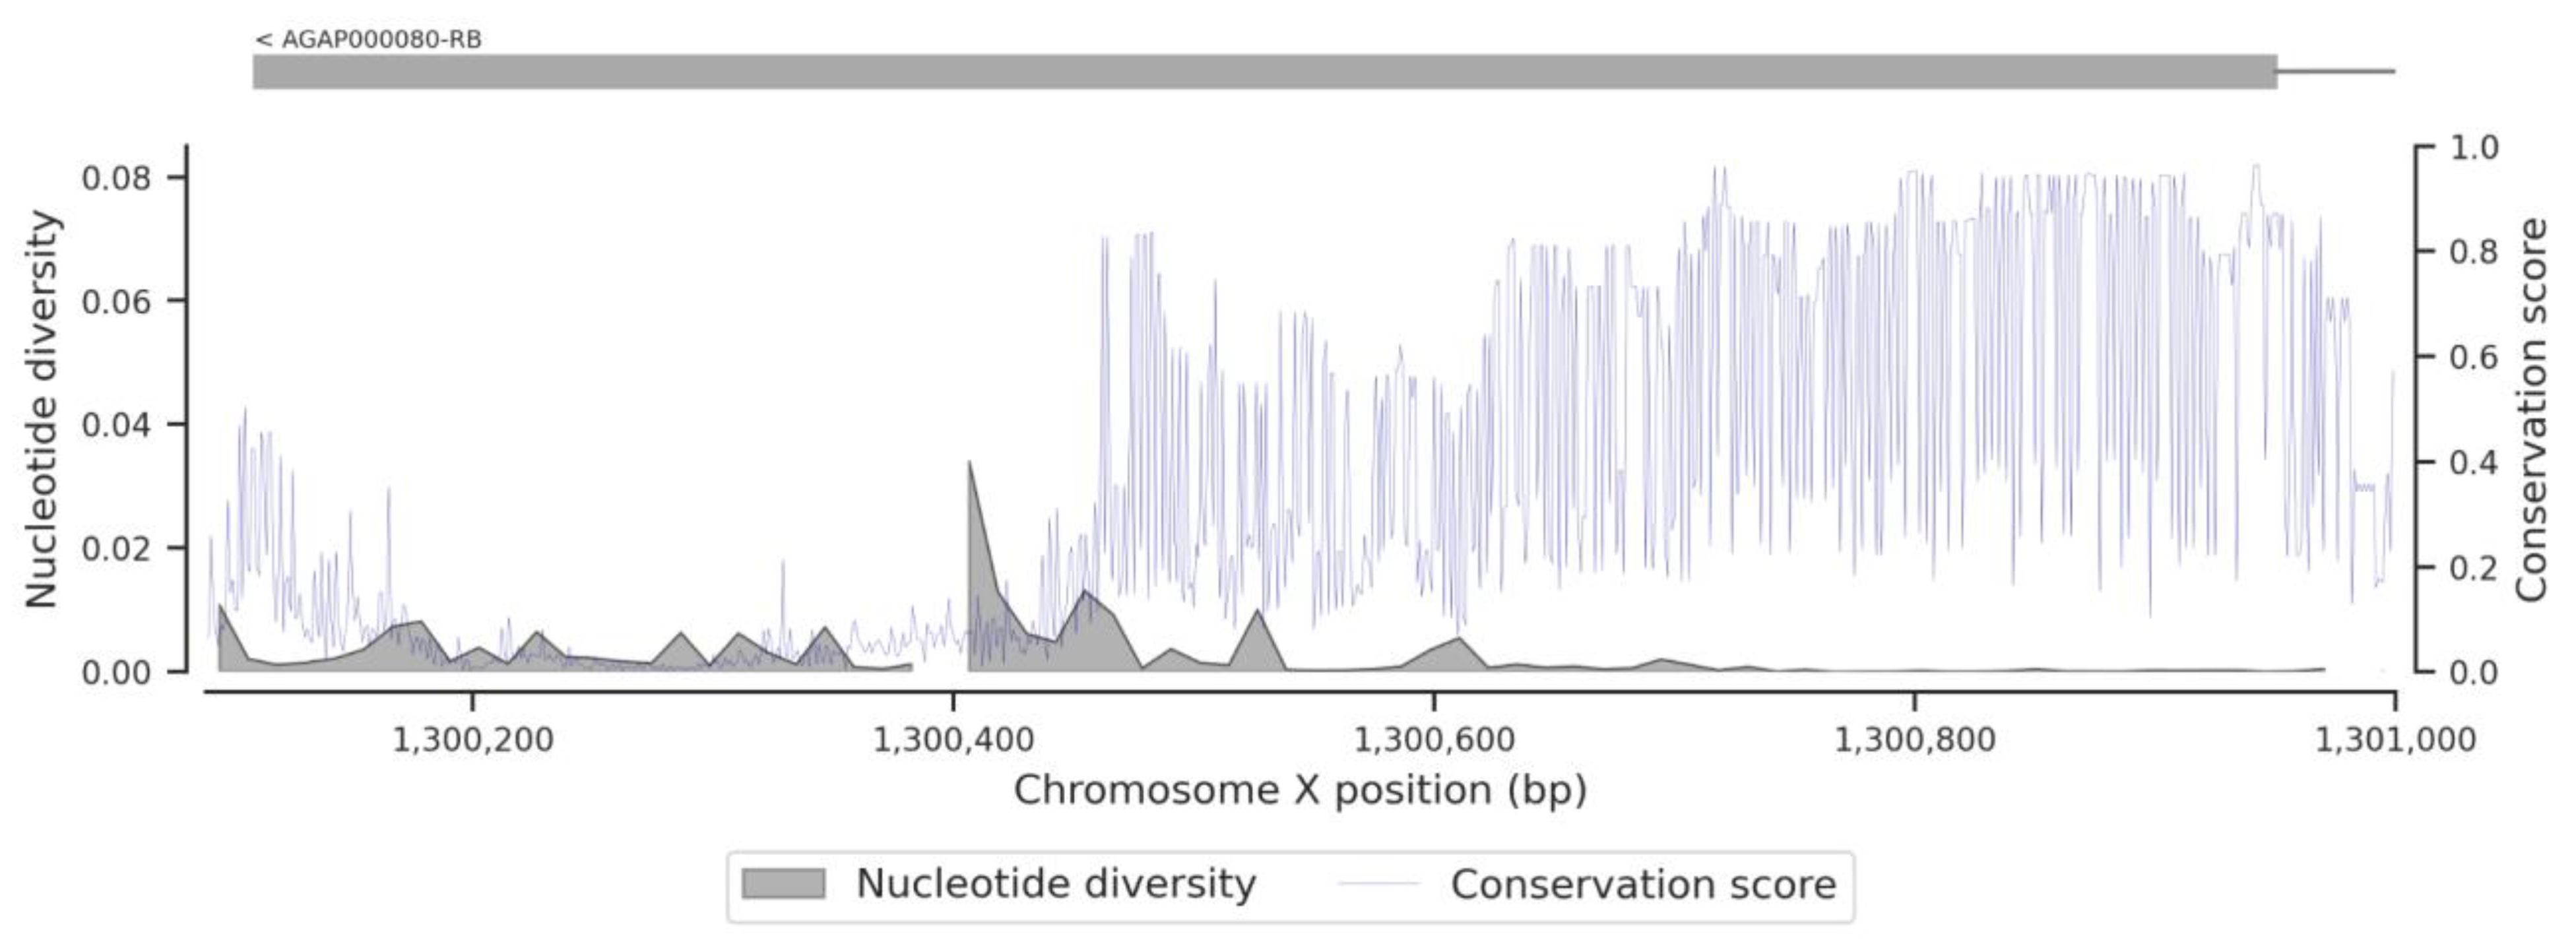
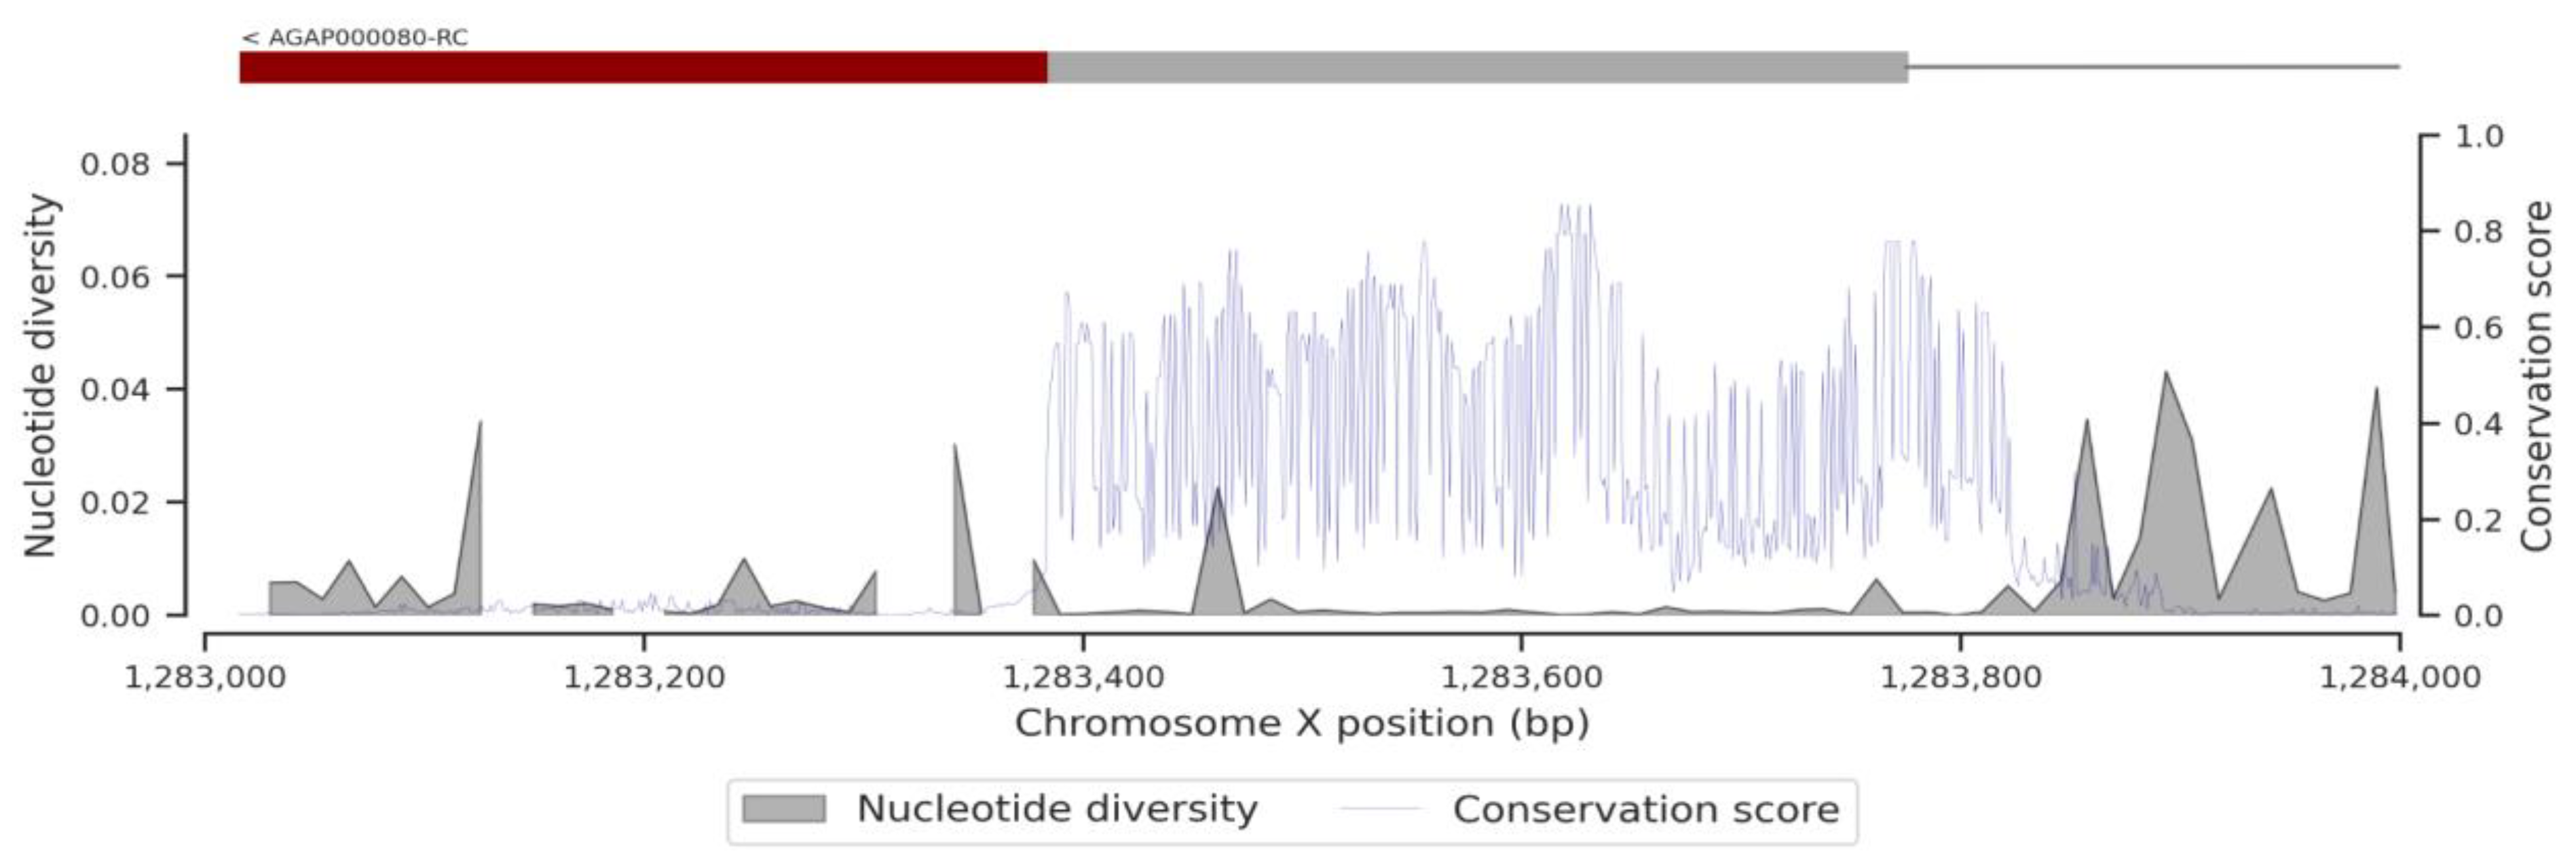
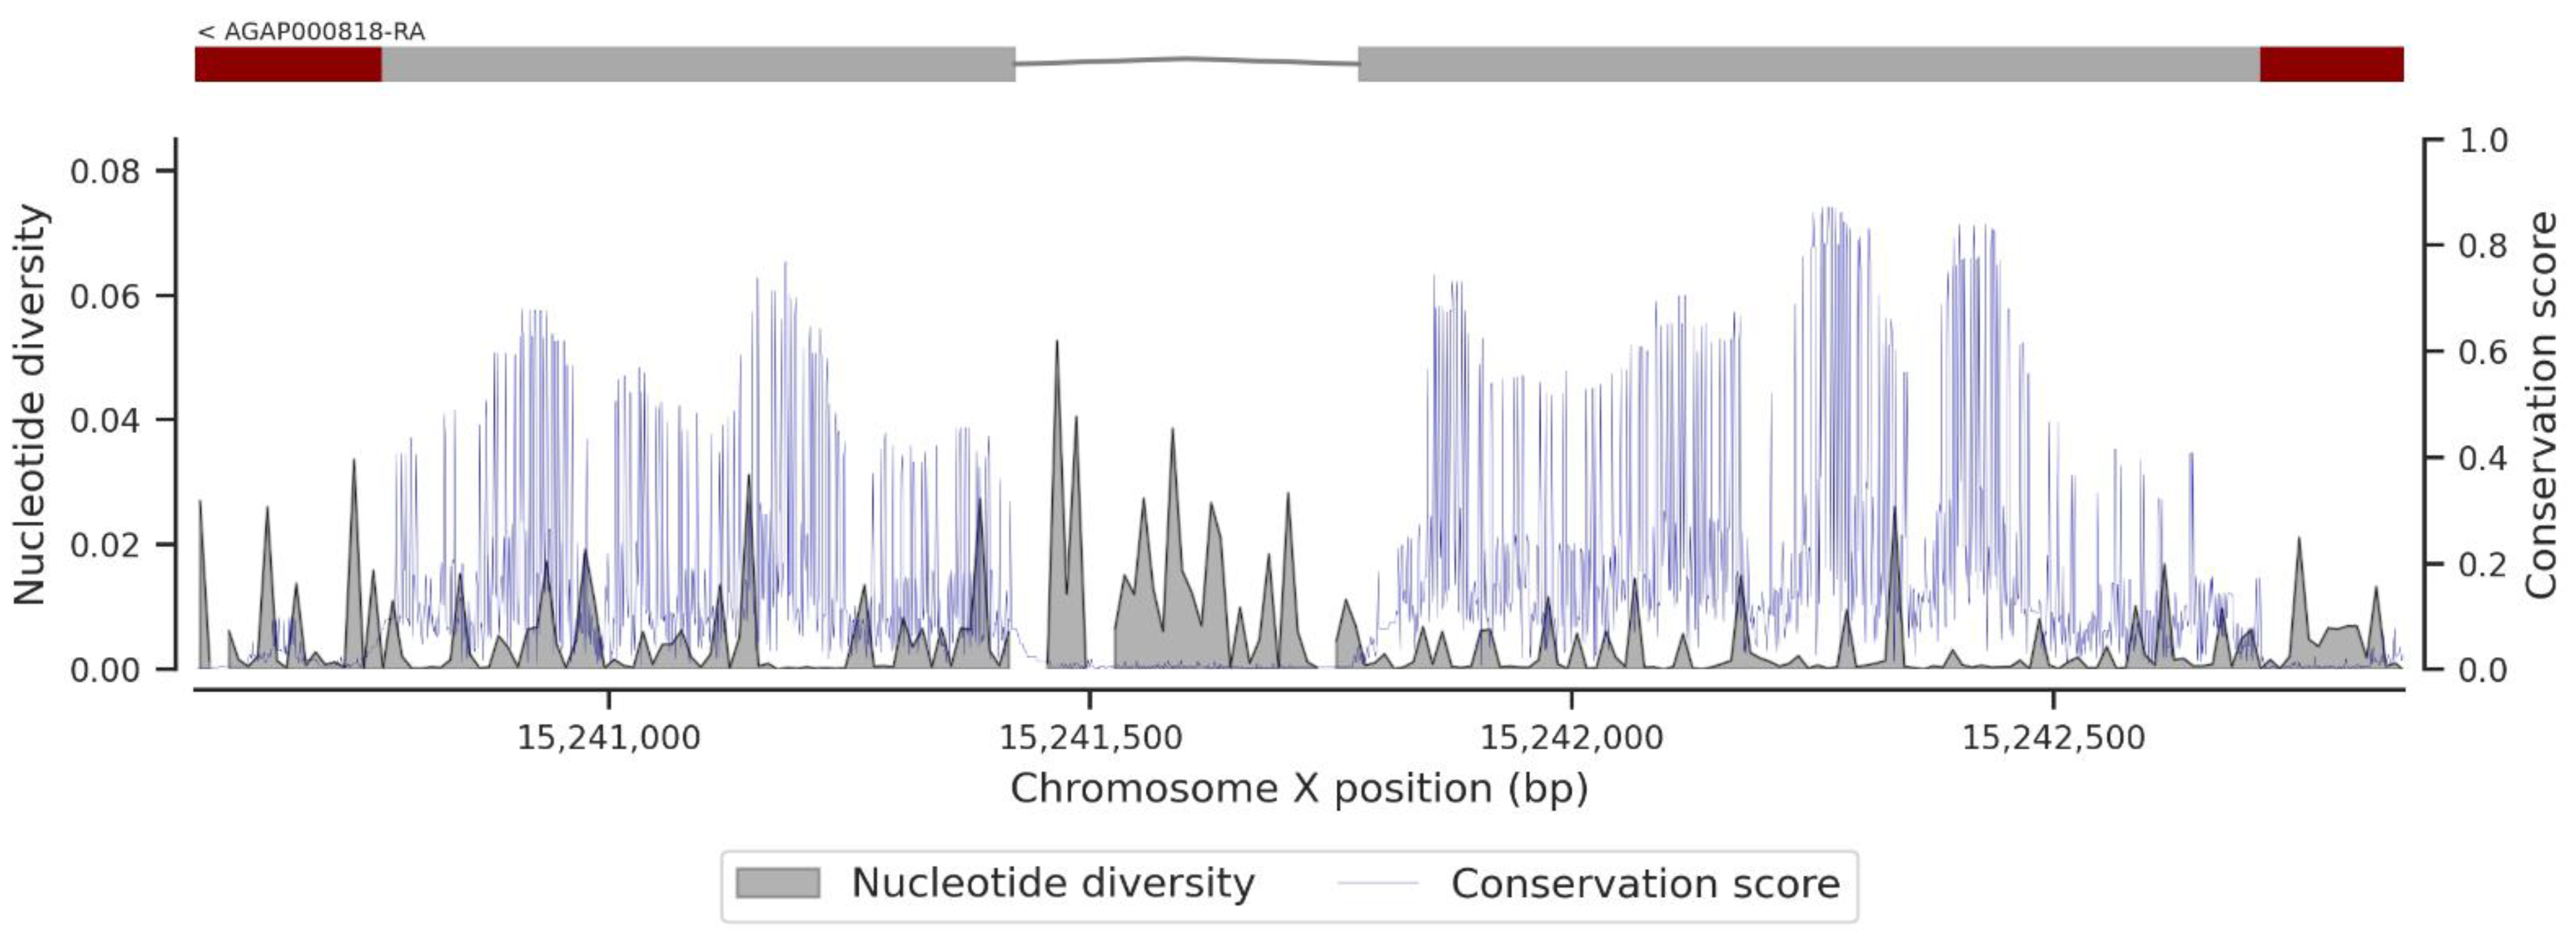
3.3. Conservation Score of the fru Gene

Figure 4 shows the conservation score or the evolution rate of the fru gene (Table S3) and the nucleotide diversity within the fru gene. In fact, the analyses have shown a high variable of conservation score throughout the fru gene, with maximum values in the exonic regions compared to the intronic regions. The median conservation score was 0.00403. High conservation scores (Cs min = 0.00076; Cs median = 0.148; Cs max = 0.983) were recorded in the exonic regions, and these data correlated with the low nucleotide diversity in these genomic regions (Figure 4, Figure A6, Figure A7, Figure A8 and Figure A9). The same pattern of conservation was observed in the exonic regions of Cyp9k1 (Cs min = 0.00019; Cs median = 0.101; Cs max = 0.871), a cytochrome P450 gene under strong selective pressure, shown to be involved in pyrethroid resistance [42] (Figure A10).
Furthermore, the female-specific region of the fru gene spans the region X:1371771-1373662 and contains stop codons (Figure 5) that stop the mRNA translation during protein synthesis from rendering the fru gene non-functional in females. These stop codons are responsible for the early termination of mRNA translation, which makes the female FRU isoform non-functional. The female-specific region includes a short exon (~122 bp) at its beginning and spanning region X:1373540-1373662 (Figure 5) on the X chromosome corresponding to the male-specific region. This exon is translated into protein and makes the gene functional in males. In the male-specific region, the conservation score was relatively high (Cs min = 0.0316; Cs median = 0.321; Cs max = 0.475) and, conversely, a low nucleotide diversity was noted in this region. These results showed a high conservation score of the genomic region common to both male and female transcripts compared to the non-common region, which exhibited a relatively low conservation score (Cs min = 0; Cs median = 0.006; Cs max = 0.286) and high nucleotide diversity at some locations. The BTB (broad complex, tramtrack, and bric-à-brac) domain is responsible for protein–protein interaction participating in a wide range of cellular functions in the organism. This domain, primarily identified in the fruit fly [43], is also found in the An. gambiae FRU protein, and its genomic region spans from X:1323509 to X:1325039. It is common in the male and female transcripts and has four exons encoding the BTB domain. The conservation scores (Cs min = 0.004; Cs median = 0.169; Cs max = 0.983) computed in the exons of the BTB region were relatively high compared to those of the intronic regions (Figure A6). Conversely, the nucleotide diversity remains high in the intronic regions and in some windows of exon 3. Seeing the pattern of the conservation score, the coding regions are highly conserved compared to the non-coding regions, as shown by previous studies [8,9].

4. Discussion

The genetic control of vectors has instigated a major interest in the study of the genetic mechanisms involved in the sexual determination and differentiation for the control of a pest insect’s population, particularly the disease vectors. Thus, the fru and dsx genes are potential targets for controlling sexual behavior and the differentiation of malaria vectors, respectively. However, the success of a genome editing construct targeting these genes in An. gambiae s.l. requires perfect insights into the genetic polymorphism of the target regions in wild populations, in order to avoid resistance to the spread of the construct. Our study analyzed the distribution and the abundance of SNPs within the fru gene in 18 populations of the An. gambiae complex in Africa.
The SNPs’ distribution across the fru gene was variable, and almost all the SNPs were identified in intronic regions. The average SNPs’ density (two SNPs per five bp) was low compared to those previously found in the whole genome of An. gambiae s.l. [44]. Indeed, according to the first published An. gambiae s.l. genome data, chromosomes 2 and 3 exhibited high SNPs’ density compared to the X chromosome [45]. In addition, the intronic regions showed a high level of polymorphism compared to the exons, and only 9.60% of SNPs variants including two non-synonymous SNPs with high frequencies, X:1309218 C>G (G669A) and X:1300290 C>G (G651A), were identified within the exons. These two SNPs, although their effect is moderate, may have an impact on the structure of the resulting protein. Both SNPs cause the change of C>G at positions X:1309218 and X:1300290, leading to amino acids’ change from glycine to alanine at positions 651 (G651A) and 669 (G669A), respectively. The SNPs identified in the non-coding regions do not directly affect the protein sequence but may have some effects on the regulation of transcription and the gene activity. Indeed, the spliceosome elements interact with specific sites on the intron and exon terminals to ensure efficient and specific splicing [46,47]. Thus, a high density of SNPs in these regions can lead to the non-recognition of the interaction sites, resulting in a dysfunction of the regulation process of the gene expression.
Our results also showed a signal of population expansion causing an excess of low-frequency SNPs, low nucleotide diversity, and negative Tajima’s D in all populations. Although previous studies have shown a signal of positive selection in insecticide-resistance genes [48,49], the Garud H12 [36] was low in the fru region, suggesting that all the genetic variation found in the fru region is probably caused by evolutionary processes other than positive selection. The rapid demographic changes can also cause an excess of rare variants in a given genomic region [50], as shown in our study, but additional population genomic studies would be needed to clarify that. Considering the SNP X:1300290 (C>G) (Figure 1), only identified at a high frequency in An. arabiensis populations from East Africa, the role of evolutionary processes in the maintenance of certain advantageous SNPs at a high frequency in the populations of the An. gambiae complex is very clear. The same SNP was identified at a low frequency in An. gambiae s.l populations (freq = 0.015 (sample size = 68)) in Tanzania. The existence of a possible introgression process between An. gambiae s.s. and An. arabiensis, two subspecies of the An. gambiae complex, is the subject of considerable debate in the scientific community. A simulation study has demonstrated the occurrence of a possible gene flow between An. gambiae s.s and An. arabiensis, which still remains to be confirmed in wild populations [51]. The low frequency of SNP X:1300290 (C>G) in the two other populations could have two possible explanations: either as a purifying selection against this mutation in An. gambiae s.s. and An. coluzzii or as a possible gene flow between An. gambiae s.s. and An. arabiensis, as predicted by previous studies [51,52]. However, further studies are still needed to confirm or contradict these hypotheses.
The genomic organization of the fru gene has been extensively studied in several Diptera species, and the results of these studies have shown a strong conservation of the specific domains of the fru gene, notably the BTB and the zinc-finger A, B, and C domains between the An. gambiae s.l, D. melanogaster, and Ae. aegypti species [8,9]. In our study, the conservation score corresponding to the evolution rate of the fru gene was variable, and the exonic regions seemed to be more conserved compared to introns. Although the algorithm only analyzes nucleotide sequences, the distribution of the conservation score alongside the fru gene follows the same conservation pattern highlighted by previous analyses, with a high level of conservation (>70%) in the coding regions of the BTB and the zinc-finger A, B, and C domains of the FRU protein. However, a comparative analysis of sex-specific protein domains has revealed a low conservation of these regions between the Drosophila, Ae. aegypti, and An. gambiae species, which could be due to the alternative splicing process that still remains specific in each of these Dipteran species [8]. The conservation score of the male-specific genomic region of the fru gene was moderate (>30%), indicating a low level of conservation of this region between Anopheles species and other Dipteran (Culex sp., Aedes sp., and Drosophila sp.). These results confirm the previous findings that showed a strong divergence between the genomes of these species [8,9].
In the purpose of vector control, the concept of using gene drive technologies to target and modify a given genomic region in the vector genome in order to disrupt progeny and reduce vector density is recurrent [19]. Although successful modifications have been performed in the An. gambiae and Ae. aegypti genomes, the development of resistance in the target site could strongly affect the long-term spread of the constructs in nature. Indeed, the spread of a transgene in nature requires a quasi-low polymorphism in the target region [53,54]. Thus, a thorough insight into the polymorphism and the evolution rate of the target regions is essential before any genetic modification action. In our study, the density of variants and nucleotide diversity within the fru gene were low in 18 populations of An. gambiae s.l in Africa, mainly in the male sex-specific region (Figure 5), the BTB-exons 1 and 2 (Figure A6), and the zinc-finger B (Figure A8) and C (Figure A9) exons. These findings will facilitate the development of an effective gene drive construct targeting the fru gene that can rapidly spread without encountering resistance in wild populations.

Supplementary Materials

The following supporting information can be downloaded at: https://www.mdpi.com/article/10.3390/insects13111048/s1. Table S1: All variants’ allelic frequencies. pos: chromosome X position, wt_ac: wild type alleles count, alt1_ac: alternative 1 alleles count, alt2_ac: alternative 2 alleles count, alt3_ac: alternative 3 alleles count, wt_af: wild type alleles allelic frequencies, alt1_af: alternative 1 allele allelic frequencies, alt2_af: alternative 2 alleles allelic frequencies, alt3_af: alternative 3 alleles allelic frequencies. Table S2: Nonsynonymous allelic frequencies. pos: chromosome X position, wt_ac: wild type alleles count, alt1_ac: alternative 1 alleles count, alt2_ac: alternative 2 alleles count, alt3_ac: alternative 3 alleles count, wt_af: wild type alleles allelic frequencies, alt1_af: alternative 1 allele allelic frequencies, alt2_af: alternative 2 alleles allelic frequencies, alt3_af: alternative 3 alleles allelic frequencies. Table S3: Conservation score within the Fruitless gene. pos: chromosome X position, Cs: Conservation score.

Author Contributions

Conceptualization, Formal analysis, Data curation, Software, Validation, Writing—original draft, M.K. and N.K.; Investigation, Methodology, Visualization, N.T., H.K., I.M. and D.D.S.; Writing—review &editing, N.T., H.K., I.M., D.D.S., A.M.G.B., M.N. and A.D.; onceptualization, Project administration, Resources, A.M.G.B., M.N. and A.D. All authors have read and agreed to the published version of the manuscript.

Funding

This research received no external funding.

Data Availability Statement

Python 3.8.13 and R 4.1.3 codes to reproduce all the analyses in the article are available from GitHub: https://github.com/mkient/fruitless_report (accessed on 23 October 2022). The SNPs and haplotypes data are available on the homepage of MalariaGEN and can be accessed using the malariagen-data package.

Acknowledgments

The authors would like to acknowledge the Ag1000G project, the MalariaGen team at the Wellcome Sanger Institute, and their partners in Africa for the production of the An. gambiae genomic data that permitted us to conceive this study. We also acknowledge the Target Malaria project for supporting this research.

Conflicts of Interest

The authors declare there are no conflicts of interest.

Appendix A

Figure A1. Variant density (bp−1) in the genomic region of the Fruitless gene; upper figure is the genomic region of the Fruitless gene (rectangles correspond to the exonic regions, simple lines are the intronic regions, and dark-red end is the 3 prime UTR); lower figure is the variant density plot.
Insects 13 01048 g0a1
Figure A2. Median of nucleotide diversity in a window of 500 bp across the genomic region of the Fruitless gene; red points indicate the mean of the nucleotide diversity; AGO: Angola; BFA: Burkina Faso; CAF: Central African Republic; CIV: Côte d’Ivoire; CMR: Cameroon; COD: Democratic Republic of Congo; GAB: Gabon; GHA: Ghana; GIN: Guinea; GMB: Gambia; MLI: Mali; MOZ: Mozambique; MWI: Malawi; TZA: Tanzania; UGA: Uganda.
Insects 13 01048 g0a2
Figure A3. Median of Tajima’s D in a window of 500 bp across the genomic region of the Fruitless gene; red points indicate the mean of the Tajima’s D. Horizontal line indicates the null value of the Tajima’s D test. AGO: Angola; BFA: Burkina Faso; CAF: Central African Republic; CIV: Côte d’Ivoire; CMR: Cameroon; COD: Democratic Republic of Congo; GAB: Gabon; GHA: Ghana; GIN: Guinea; GMB: Gambia; MLI: Mali; MOZ: Mozambique; MWI: Malawi; TZA: Tanzania; UGA: Uganda.
Insects 13 01048 g0a3
Figure A4. Haplotype diversity in a window of 500 bp across the genomic region of the Fruitless gene; red points indicate the mean of the haplotype diversity. AGO: Angola; BFA: Burkina Faso; CAF: Central African Republic; CIV: Côte d’Ivoire; CMR: Cameroon; COD: Democratic Republic of Congo; GAB: Gabon; GHA: Ghana; GIN: Guinea; GMB: Gambia; MLI: Mali; MOZ: Mozambique; MWI: Malawi; TZA: Tanzania; UGA: Uganda.
Insects 13 01048 g0a4
Figure A5. H12 statistic in chromosome X (window size = 4 kb) of An. gambiae s.l population. High values of H12 in a given genomic region indicates a signal of positive selection in this genomic region within the population [36]. Magenta bands indicate the fru region (X: 1283016-1373662) and the Cyp9k1 region (X:15240572-15242864). The H12 values were low in the fru region, but higher in the Cyp9k1 region shown to be involved in the pyrethroid resistance in An. gambiae s.l populations [42]. AGO: Angola; BFA: Burkina Faso; CAF: Central African Republic; CIV: Côte d’Ivoire; CMR: Cameroon; COD: Democratic Republic of Congo; GHA: Ghana; GIN: Guinea; GMB: Gambia; MLI: Mali; MWI: Malawi; TZA: Tanzania; UGA: Uganda.
Insects 13 01048 g0a5
Figure A6. Conservation score and nucleotide diversity in a window of 12 bp within the BTB and connector region of the Fruitless gene; upper figure shows the BTB and connector region (rectangles correspond to the exonic regions, and the simple lines are the intronic regions); lower figure shows the conservation score (blue line) and the nucleotide diversity (dark fill) plot.
Insects 13 01048 g0a6
Figure A7. Conservation score and nucleotide diversity in a window of 12 bp within the zinc-finger A (ZnFA) region of the Fruitless gene; upper figure shows the ZnFA region (the rectangle corresponds to the exonic region, and the simple line is the intronic region); lower figure shows the conservation score (blue line) and the nucleotide diversity (dark fill) plot.
Insects 13 01048 g0a7
Figure A8. Conservation score and nucleotide diversity in a window of 12 bp within the zinc-finger B (ZnFB) region of the Fruitless gene; upper figure shows the ZnFB region (the rectangle corresponds to the exonic region, and the simple line is the intronic region); lower figure shows the conservation score (blue line) and the nucleotide diversity (dark fill) plot.
Insects 13 01048 g0a8
Figure A9. Conservation score and nucleotide diversity in a window of 12 bp within the zinc-finger C (ZnFC) region of the Fruitless gene; upper figure shows the ZnFC region (the rectangle corresponds to the exonic region, the dark red end is the 3 prime UTR region, and the simple line is the intronic region); lower figure shows the conservation score (blue line) and the nucleotide diversity (dark fill) plot.
Insects 13 01048 g0a9
Figure A10. Conservation score and nucleotide diversity in a window of 12 bp within the Cyp9k1 (X:15240572-15242864), a gene shown to be under selection pressure [36]; upper figure shows the genomic region of the Cyp9k1 (the rectangle corresponds to the exonic region, the dark red ends are the 3′ and 5′ UTR regions, and the simple line is the intronic region); lower figure shows the conservation score (blue line) and the nucleotide diversity (dark fill) plot. The conservation score remains high in the exonic regions compared to the intronic ones, as it is found in the fru gene.
Insects 13 01048 g0a10

References

  1. Sánchez, L. Sex-determining mechanisms in insects. Int. J. Dev. Biol. 2008, 52, 837–856. [Google Scholar] [CrossRef] [PubMed] [Green Version]
  2. Siwicki, K.K.; Kravitz, E.A. Fruitless, Doublesex and the genetics of social behavior in Drosophila melanogaster. Curr. Opin. Neurobiol. 2009, 19, 200–206. [Google Scholar] [CrossRef] [PubMed] [Green Version]
  3. Salvemini, M.; Mauro, U.; Lombardo, F.; Milano, A.; Zazzaro, V.; Arcà, B.; Polito, L.C.; Saccone, G. Genomic organization and splicing evolution of the Doublesex gene, a Drosophila regulator of sexual differentiation, in the dengue and yellow fever mosquito Aedes aegypti. BMC Evol. Biol. 2011, 11, 41. [Google Scholar] [CrossRef] [PubMed] [Green Version]
  4. Biedler, J.K.; Tu, Z. Sex determination in mosquitoes. In Advances in Insect Physiology; Elsevier: Amsterdam, The Netherlands, 2016; pp. 37–66. ISBN 0065-2806. [Google Scholar]
  5. Krzywinska, E.; Krzywinski, J. Effects of stable ectopic expression of the primary sex determination gene yob in the mosquito Anopheles gambiae. Parasites Vectors 2018, 11, 648. [Google Scholar] [CrossRef] [Green Version]
  6. Krzywinska, E.; Dennison, N.J.; Lycett, G.J.; Krzywinski, J. A maleness gene in the malaria mosquito Anopheles gambiae. Science 2016, 353, 67–69. [Google Scholar] [CrossRef] [PubMed] [Green Version]
  7. Gailey, D.A.; Taylor, B.J.; Hall, J.C. Elements of the Fruitless locus regulate development of the muscle of lawrence, a male-specific structure in the abdomen of Drosophila melanogaster adults. Development 1991, 113, 879–890. [Google Scholar] [CrossRef] [PubMed]
  8. Salvemini, M.; D’Amato, R.; Petrella, V.; Aceto, S.; Nimmo, D.; Neira, M.; Alphey, L.; Polito, L.C.; Saccone, G. The orthologue of the fruitfly sex behaviour gene Fruitless in the mosquito Aedes aegypti: Evolution of genomic organisation and alternative splicing. PLoS ONE 2013, 8, e48554. [Google Scholar] [CrossRef] [Green Version]
  9. Gailey, D.A.; Billeter, J.-C.; Liu, J.H.; Bauzon, F.; Allendorfer, J.B.; Goodwin, S.F. Functional conservation of the Fruitless male sex-determination gene across 250 myr of insect evolution. Mol. Biol. Evol. 2005, 23, 633–643. [Google Scholar] [CrossRef] [Green Version]
  10. Yamamoto, D.; Kohatsu, S. What does the Fruitless gene tell us about nature vs. nurture in the sex life of Drosophila? Fly 2017, 11, 139–147. [Google Scholar] [CrossRef] [Green Version]
  11. Carnevale, P.; Robert, V. Les anophèles: Biologie, transmission du Plasmodium et lutte antivectorielle; IRD Éditions: Marseille, France, 2009. [Google Scholar] [CrossRef]
  12. Coetzee, M. Key to the females of afrotropical Anopheles mosquitoes (Diptera: Culicidae). Malar. J. 2020, 19, 70. [Google Scholar] [CrossRef] [Green Version]
  13. Bhatt, S.; Weiss, D.J.; Cameron, E.; Bisanzio, D.; Mappin, B.; Dalrymple, U.; Battle, K.E.; Moyes, C.L.; Henry, A.; Eckhoff, P.A.; et al. The effect of malaria control on Plasmodium falciparum in Africa between 2000 and 2015. Nature 2015, 526, 207. [Google Scholar] [CrossRef] [PubMed] [Green Version]
  14. Ranson, H. Current and future prospects for preventing malaria transmission via the use of insecticides. Cold Spring Harb. Perspect. Med. 2017, 7, a026823. [Google Scholar] [CrossRef] [PubMed] [Green Version]
  15. Benelli, G.; Beier, J.C. Current vector control challenges in the fight against malaria. Acta Trop. 2017, 174, 91–96. [Google Scholar] [CrossRef] [PubMed]
  16. Coleman, M.; Hemingway, J.; Gleave, K.A.; Wiebe, A.; Gething, P.W.; Moyes, C.L. Developing global maps of insecticide resistance risk to improve vector control. Malar. J. 2017, 16, 86. [Google Scholar] [CrossRef] [PubMed] [Green Version]
  17. Sougoufara, S.; Doucouré, S.; Sembéne, P.M.B.; Harry, M.; Sokhna, C. Challenges for malaria vector control in sub-saharan africa: Resistance and behavioral adaptations in Anopheles populations. J. Vector Borne Dis. 2017, 54, 4–15. [Google Scholar] [PubMed]
  18. Bamou, R.; Mbakop, L.R.; Kopya, E.; Ndo, C.; Awono-Ambene, P.; Tchuinkam, T.; Rono, M.K.; Mwangangi, J.; Antonio-Nkondjio, C. Changes in malaria vector bionomics and transmission patterns in the equatorial forest region of Cameroon between 2000 and 2017. Parasites Vectors 2018, 11, 1–13. [Google Scholar] [CrossRef]
  19. Adelman, Z.N.; Tu, Z. Control of mosquito-borne infectious diseases: Sex and gene drive. Trends Parasitol. 2016, 32, 219–229. [Google Scholar] [CrossRef] [Green Version]
  20. Kyrou, K.; Hammond, A.M.; Galizi, R.; Kranjc, N.; Burt, A.; Beaghton, A.K.; Nolan, T.; Crisanti, A. A CRISPR–Cas9 gene drive targeting Doublesex causes complete population suppression in caged Anopheles gambiae mosquitoes. Nat. Biotechnol. 2018, 36, 1062–1066. [Google Scholar] [CrossRef] [Green Version]
  21. Hammond, A.; Galizi, R.; Kyrou, K.; Simoni, A.; Siniscalchi, C.; Katsanos, D.; Gribble, M.; Baker, D.; Marois, E.; Russell, S.; et al. A CRISPR-Cas9 gene drive system targeting female reproduction in the malaria mosquito vector Anopheles gambiae. Nat. Biotechnol. 2016, 34, 78–83. [Google Scholar] [CrossRef]
  22. Hammond, A.; Pollegioni, P.; Persampieri, T.; North, A.; Minuz, R.; Trusso, A.; Bucci, A.; Kyrou, K.; Morianou, I.; Simoni, A.; et al. Gene-drive suppression of mosquito populations in large cages as a bridge between lab and field. Nat. Commun. 2021, 12, 4589. [Google Scholar] [CrossRef]
  23. Basrur, N.S.; de Obaldia, M.E.; Morita, T.; Herre, M.; von Heynitz, R.K.; Tsitohay, Y.N.; Vosshall, L.B. Fruitless mutant male mosquitoes gain attraction to human odor. Elife 2020, 9, e63982. [Google Scholar] [CrossRef] [PubMed]
  24. Hammond, A.; Karlsson, X.; Morianou, I.; Kyrou, K.; Beaghton, A.; Gribble, M.; Kranjc, N.; Galizi, R.; Burt, A.; Crisanti, A.; et al. Regulating the expression of gene drives is key to increasing their invasive potential and the mitigation of resistance. PLOS Genet. 2021, 17, e1009321. [Google Scholar] [CrossRef] [PubMed]
  25. The Anopheles gambiae 1000 Genomes Consortium. Ag1000G Phase 3 SNP Data Release. Available online: https://www.malariagen.net/data/ag1000g-phase3-snp (accessed on 29 April 2022).
  26. MalariaGEN. Malariagen Vector Data User Guide. Available online: https://malariagen.github.io/vector-data/landing-page.html (accessed on 30 April 2022).
  27. Kluyver, T.; Ragan-Kelley, B.; Pérez, F.; Granger, B.; Bussonnier, M.; Frederic, J.; Kelley, K.; Hamrick, J.; Grout, J.; Corlay, S.; et al. Jupyter Notebooks—A publishing format for reproducible computational workflows. In Positioning and Power in Academic Publishing: Players, Agents and Agendas; IOP Press: Amsterdam, The Netherlands, 2016; pp. 87–90. [Google Scholar] [CrossRef]
  28. Miles, A.; Bot, P.; Murillo, R.; Ralph, P.; Harding, N.; Pisupati, R.; Rae, S.; Millar, T. Cggh/Scikit-Allel, Version 1.3.3; Zenodo 2021. Available online: https://zenodo.org/record/4759368#.Y3BX0-RBw2w (accessed on 5 October 2022).
  29. Miles, A. GitHub—Malariagen/Malariagen-Data-Python: A Python Package Providing Functions for Accessing and Analysing MalariaGEN Data. Available online: https://github.com/malariagen/malariagen-data-python (accessed on 6 May 2022).
  30. Rocklin, M. Dask: Parallel computation with blocked algorithms and task scheduling. In Proceedings of the 14th Python in Science Conference, Austin, TX, USA, 6–12 July 2015; pp. 126–132. [Google Scholar]
  31. McKinney, W. Data structures for statistical computing in python. In Proceedings of the 9th Python in Science Conference, Austin, TX, USA, 28–30 June 2010; pp. 56–61. [Google Scholar]
  32. Harris, C.R.; Millman, K.J.; van der Walt, S.J.; Gommers, R.; Virtanen, P.; Cournapeau, D.; Wieser, E.; Taylor, J.; Berg, S.; Smith, N.J.; et al. Array programming with numpy. Nature 2020, 585, 357–362. [Google Scholar] [CrossRef]
  33. Hunter, J.D. Matplotlib: A 2D graphics environment. Comput. Sci. Eng. 2007, 9, 90–95. [Google Scholar] [CrossRef]
  34. Waskom, M.; Botvinnik, O.; O’Kane, D.; Hobson, P.; Lukauskas, S.; Gemperline, D.C.; Augspurger, T.; Halchenko, Y.; Cole, J.B.; Warmenhoven, J.; et al. Mwaskom/Seaborn, Version 0.8.1; Zenodo 2017. Available online: https://zenodo.org/record/883859#.Y3BVeuRBw2w (accessed on 5 October 2022). [CrossRef]
  35. R Core Team. R: The R Project for Statistical Computing; Version 4.1.3; R Core Team: Vienna, Austria, 2021. [Google Scholar]
  36. Garud, N.R.; Messer, P.W.; Buzbas, E.O.; Petrov, D.A. Recent selective sweeps in North American Drosophila melanogaster show signatures of soft sweeps. PLoS Genet. 2015, 11, e1005004. [Google Scholar] [CrossRef] [Green Version]
  37. Lewontin, R.C. The interaction of selection and linkage. I. general considerations; heterotic models. Genetics 1964, 49, 49–67. [Google Scholar] [CrossRef] [PubMed]
  38. Kranjc, N.; Crisanti, A.; Nolan, T.; Bernardini, F. Anopheles gambiae genome conservation as a resource for rational gene drive target site selection. Insects 2021, 12, 97. [Google Scholar] [CrossRef]
  39. The Anopheles gambiae 1000 Genomes Consortium. Genetic diversity of the African malaria vector Anopheles gambiae. Nature 2017, 552, 96–100. [Google Scholar] [CrossRef]
  40. Nei, M.; Li, W.H. Mathematical model for studying genetic variation in terms of restriction endonucleases. Proc. Natl. Acad. Sci. USA 1979, 76, 5269–5273. [Google Scholar] [CrossRef] [Green Version]
  41. Tajima, F. Statistical method for testing the neutral mutation hypothesis by DNA polymorphism. Genetics 1989, 123, 585–595. [Google Scholar] [CrossRef]
  42. Vontas, J.; Grigoraki, L.; Morgan, J.; Tsakireli, D.; Fuseini, G.; Segura, L.; de Carvalho, J.N.; Nguema, R.; Weetman, D.; Slotman, M.A.; et al. Rapid selection of a pyrethroid metabolic enzyme Cyp9k1 by operational malaria control activities. Proc. Natl. Acad. Sci. USA 2018, 115, 4619–4624. [Google Scholar] [CrossRef] [PubMed] [Green Version]
  43. Zollman, S.; Godt, D.; Privé, G.G.; Couderc, J.L.; Laski, F.A. The BTB domain, found primarily in zinc finger proteins, defines an evolutionarily conserved family that includes several developmentally regulated genes in Drosophila. Proc. Natl. Acad. Sci. USA 1994, 91, 10717–10721. [Google Scholar] [CrossRef] [PubMed] [Green Version]
  44. The Anopheles gambiae 1000 Genomes Consortium. Genome variation and population structure among 1142 mosquitoes of the African Malaria Vector Species Anopheles gambiae and Anopheles coluzzii. Genome Res. 2020, 30, 1533–1546. [Google Scholar] [CrossRef] [PubMed]
  45. Holt, R.A.; Subramanian, G.M.; Halpern, A.; Sutton, G.G.; Charlab, R.; Nusskern, D.R.; Wincker, P.; Clark, A.G.; Ribeiro, J.C.; Wides, R.; et al. The genome sequence of the malaria mosquito Anopheles gambiae. Science 2002, 298, 129–149. [Google Scholar] [CrossRef]
  46. de Roos, A.D.G. Origins of introns based on the definition of exon modules and their conserved interfaces. Bioinformatics 2005, 21, 2–9. [Google Scholar] [CrossRef] [Green Version]
  47. Rogozin, I.B.; Carmel, L.; Csuros, M.; Koonin, E. V Origin and evolution of spliceosomal introns. Biol. Direct 2012, 7, 11. [Google Scholar] [CrossRef] [Green Version]
  48. Grau-Bové, X.; Tomlinson, S.; O’Reilly, A.O.; Harding, N.J.; Miles, A.; Kwiatkowski, D.; Donnelly, M.J.; Weetman, D. Evolution of the insecticide target rdl in African Anopheles is driven by interspecific and interkaryotypic introgression. Mol. Biol. Evol. 2020, 37, 2900–2917. [Google Scholar] [CrossRef]
  49. Clarkson, C.S.; Miles, A.; Harding, N.J.; O’Reilly, A.O.; Weetman, D.; Kwiatkowski, D.; Donnelly, M.J. The genetic architecture of target-site resistance to pyrethroid insecticides in the African malaria vectors Anopheles gambiae and Anopheles coluzzii. Mol. Ecol. 2021, 30, 5303–5317. [Google Scholar] [CrossRef]
  50. Sætre, G.-P.; Ravinet, M. Evolutionary Genetics: Concepts, Analysis, and Practice; Oxford University Press: Oxford, UK, 2019; ISBN 9780198830917. [Google Scholar]
  51. Weetman, D.; Steen, K.; Rippon, E.J.; Mawejje, H.D.; Donnelly, M.J.; Wilding, C.S. Contemporary gene flow between wild An. gambiae s.s. and An. arabiensis. Parasites Vectors 2014, 7, 345. [Google Scholar] [CrossRef] [Green Version]
  52. Neafsey, D.E.; Lawniczak, M.K.N.; Park, D.J.; Redmond, S.N.; Coulibaly, M.B.; Traoré, S.F.; Sagnon, N.; Costantini, C.; Johnson, C.; Wiegand, R.C.; et al. SNP genotyping defines complex gene-flow boundaries among African malaria vector mosquitoes. Science 2010, 330, 514–517. [Google Scholar] [CrossRef] [Green Version]
  53. Champer, J.; Liu, J.; Oh, S.Y.; Reeves, R.; Luthra, A.; Oakes, N.; Clark, A.G.; Messer, P.W. Reducing resistance allele formation in CRISPR gene drive. Proc. Natl. Acad. Sci. USA 2018, 115, 5522–5527. [Google Scholar] [CrossRef] [PubMed] [Green Version]
  54. Unckless, R.L.; Clark, A.G.; Messer, P.W. Evolution of resistance against CRISPR/Cas9 gene drive. Genetics 2017, 205, 827–841. [Google Scholar] [CrossRef] [PubMed]
Figure 1. Heat map showing the allelic frequencies of the non-synonymous mutations with maximum allelic frequencies that are > 5% in at least one population. The vertical axis of the heat map shows the non-synonymous variant positions in the X chromosome, and the horizontal axis shows the populations of An. gambiae s.l. The gradient color bar shows the distribution of the allelic frequencies. AGO: Angola; BFA: Burkina Faso; CAF: Central African Republic; CIV: Côte d’Ivoire; CMR: Cameroon; COD: Democratic Republic of Congo; FRA: Mayotte; GAB: Gabon; GHA: Ghana; GIN: Guinea; GMB: Gambia; GNB: Guinea-Bissau; MLI: Mali; MOZ: Mozambique; MWI: Malawi; TZA: Tanzania; UGA: Uganda.
Insects 13 01048 g001
Figure 2. Variation of the heterozygosity within the non-synonymous SNPs with maximum allelic frequencies that are superior to 5% in at least one population of An. gambiae complex from West, Central, and East Africa. The vertical axis shows the difference between the observed and the expected heterozygosity; the horizontal axis shows the non-synonymous SNPs positions. Positive values (Obs. het > Exp. het) mean an excess of heterozygotes at this position; negative values (Obs. het < Exp. het) mean a deficit of heterozygotes at this position; null values (Obs. het = Exp. het) mean no deviation from the Hardy–Weinberg equilibrium at this position. Obs. het.: observed heterozygosity, Exp. het.: expected heterozygosity, CAR: Central African Region, EAR: Eastern African Region, WAR: Western African Region.
Insects 13 01048 g002
Figure 3. Linkage disequilibrium between the non-synonymous SNPs with maximum allelic frequencies that are greater than 5% in at least one population; upper figure shows allelic frequencies; lower figure shows linkage disequilibrium value (−1 indicates no LD, and +1 indicates perfect LD).
Insects 13 01048 g003
Figure 4. Conservation score and nucleotide diversity in a window of 12 bp within the sex-specific region of the Fruitless gene. The upper figure shows the five transcripts of the Fruitless gene (rectangles correspond to the exonic regions, simple lines are the intronic regions, and dark-red end is the 3 prime UTR within the AGP000080-RC transcript); lower figure shows the conservation score (blue line) and the nucleotide diversity (dark fill) plot.
Insects 13 01048 g004
Figure 5. Conservation score and nucleotide diversity in a window of 12 bp within the sex-specific region of the Fruitless gene. The upper figure is the sex-specific region of the Fruitless gene (rectangle corresponds to the male-specific region, rectangle and simple line correspond to the female-specific region, and red dashes are the probable stop codon within the female-specific region); lower figure is the conservation score (blue line) and the nucleotide diversity (dark fill) plot.
Insects 13 01048 g005
Table 1. Summary of the diversity statistics based on SNPs of the Fruitless gene of Anopheles gambiae complex. Segregating sites were calculated within the whole gene. Median of π, D, θ, and H calculated in a window of 0.5 kb.
PopulationsNumber of MosquitoesSNPsns SNPsBiallelic ns SNPπDθH
AGO (An. coluzzii)81228096950.0095−1.1090.0140.845
BFA (An. arabiensis)3289220.0088−0.2560.0080.600
BFA (An. coluzzii)13583121181140.0118−2.0980.0370.915
BFA (An. gambiae s.s.)15711,0352122020.0119−2.2820.0460.904
CAF (An. coluzzii)18237216160.0108−1.4690.0180.910
CAF (An. gambiae s.s.)55530338380.0115−1.9830.0290.886
CIV (An. coluzzii)80444038370.0112−1.6350.0230.900
CMR (An. arabiensis)2283220.01570.1800.0150.833
CMR (An. coluzzii)2625919180.0104−1.4070.0170.897
CMR (An. gambiae s.s.)41617,2914303920.0115−2.3370.0590.893
COD (An. gambiae s.s.)7679551721670.0123−2.1920.0390.916
FRA (An. gambiae s.s.)2396656560.0050−1.1640.0080.618
GAB (An. gambiae s.s.)69134820190.0087−0.4580.0100.743
GHA (An. coluzzii)64428534340.0114−1.6700.0240.907
GHA (An. gambiae s.s.)36368518180.0110−1.7490.0240.900
GIN (An. coluzzii)11930550.0095−0.2580.0090.835
GIN (An. gambiae s.s.)12390831181110.0118−2.2180.0400.904
GMB (An. coluzzii)169824192910.0117−2.0190.0340.912
GMB (An. gambiae s.s.)69395237350.0111−1.5490.0220.890
GNB (An. gambiae s.s.)29337532320.0117−1.6960.0220.900
KEN (An. gambiae s.s.)28122144440.0074−1.0010.0100.732
MLI (An. arabiensis)2188000.00900.1350.0080.667
MLI (An. coluzzii)91645167670.0116−1.9700.0320.910
MLI (An. gambiae s.s.)13188881251210.0112−2.1910.0410.893
MOZ (An. gambiae s.s.)74651660.0049−0.3750.0050.494
MWI (An. arabiensis)41138115150.0084−1.2900.0140.576
TZA (An. arabiensis)225231741410.0093−1.5710.0190.584
TZA (An. gambiae s.s.)68406671700.0095−1.8380.0250.807
UGA (An. arabiensis)82154526260.0095−1.1240.0150.595
UGA (An. gambiae s.s.)20710,0831201140.0109−2.1770.0420.892
π: nucleotide diversity; D: Tajima’s D; θ: Watterson’s theta (population mutation rate); H: haplotype diversity; ns SNPs: non-synonymous single nucleotide polymorphism; AGO: Angola; BFA: Burkina Faso; CAF: Central African Republic; CIV: Côte d’Ivoire; CMR: Cameroon; COD: Democratic Republic of Congo; FRA: Mayotte; GAB: Gabon; GHA: Ghana; GIN: Guinea; GMB: Gambia; GNB: Guinea-Bissau; KEN: Kenya; MLI: Mali; MOZ: Mozambique; MWI: Malawi; TZA: Tanzania; UGA: Uganda.
Publisher’s Note: MDPI stays neutral with regard to jurisdictional claims in published maps and institutional affiliations.

