
Drosophila Lysophospholipase Gene swiss cheese Is Required for Survival and Reproduction

 ,
,  , , and
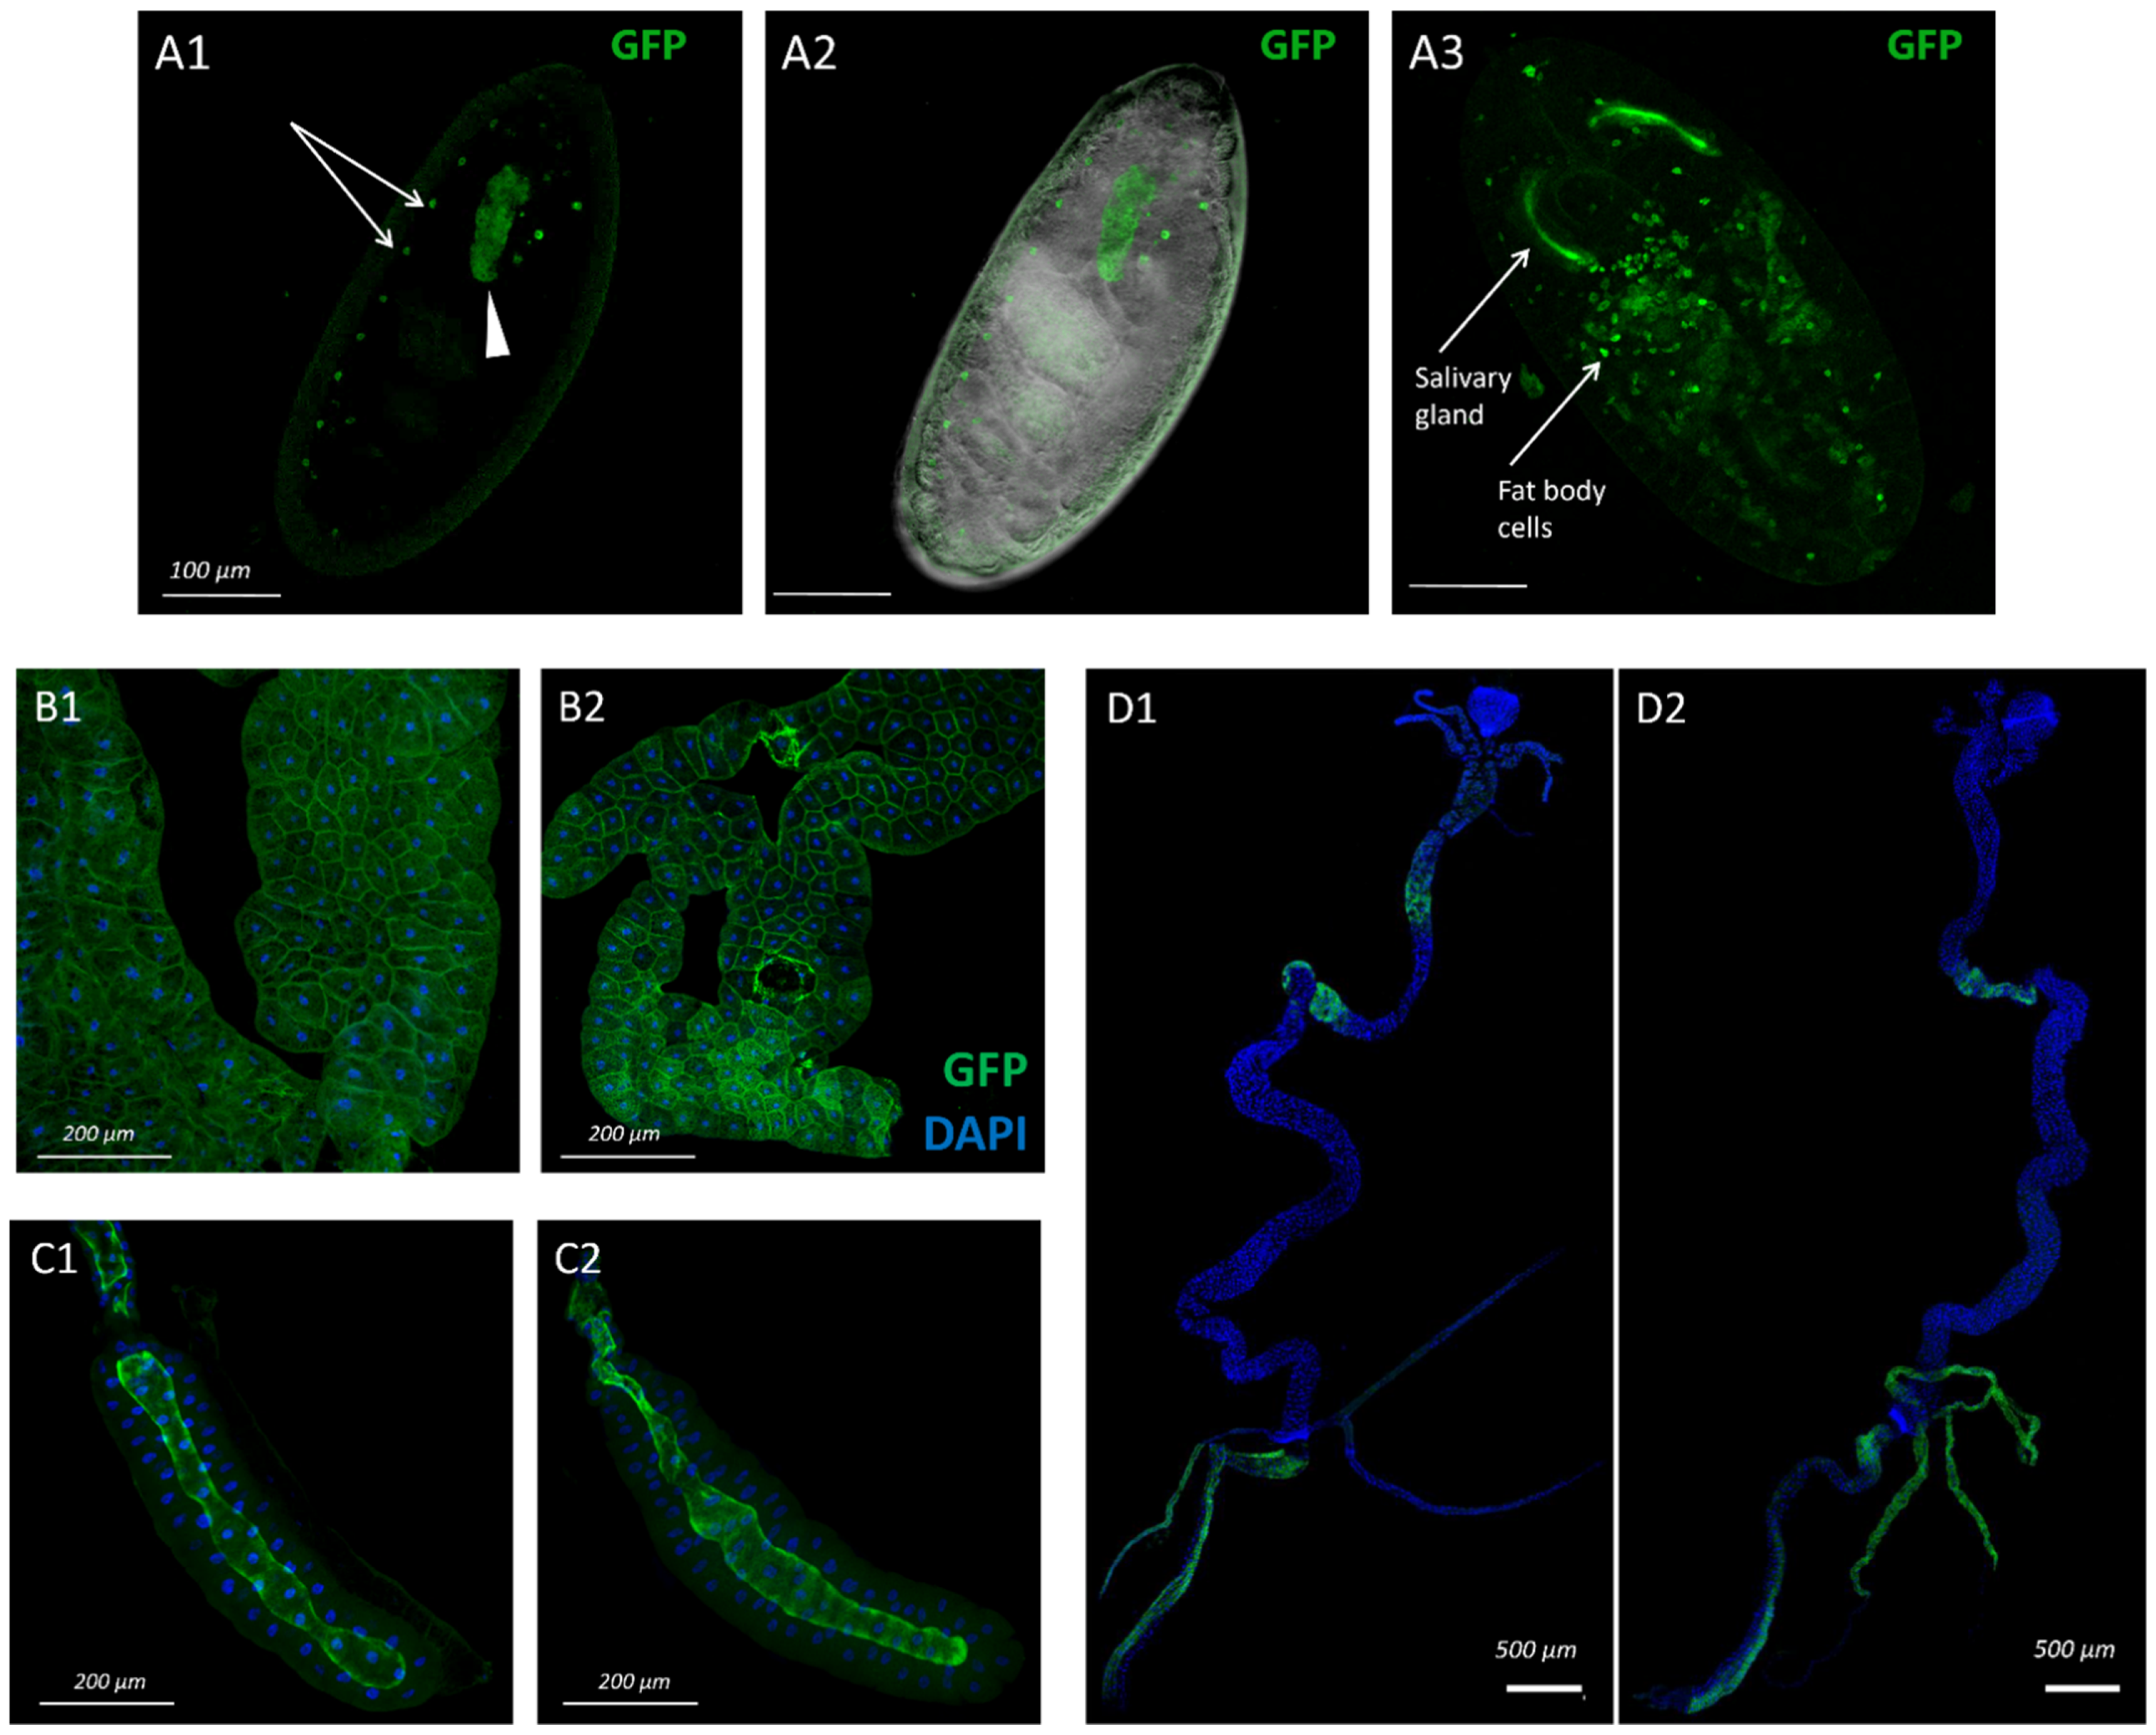
Abstract
:Simple Summary
Abstract
1. Introduction
2. Materials and Methods
2.1. Drosophila Stocks and Feeding
2.2. Dissection of Species for Confocal Microscopy
2.3. Quantitative Analysis of mRNA Level
2.4. Analysis of F1 Generation Survival
2.5. Fertility and Fecundity Analysis
2.6. Behaviour Analysis
2.7. ATP Relative Level Determination
2.8. Lipid Droplet Visualization
2.9. Oxidative Particle Measurement
2.10. Results Processing
3. Results
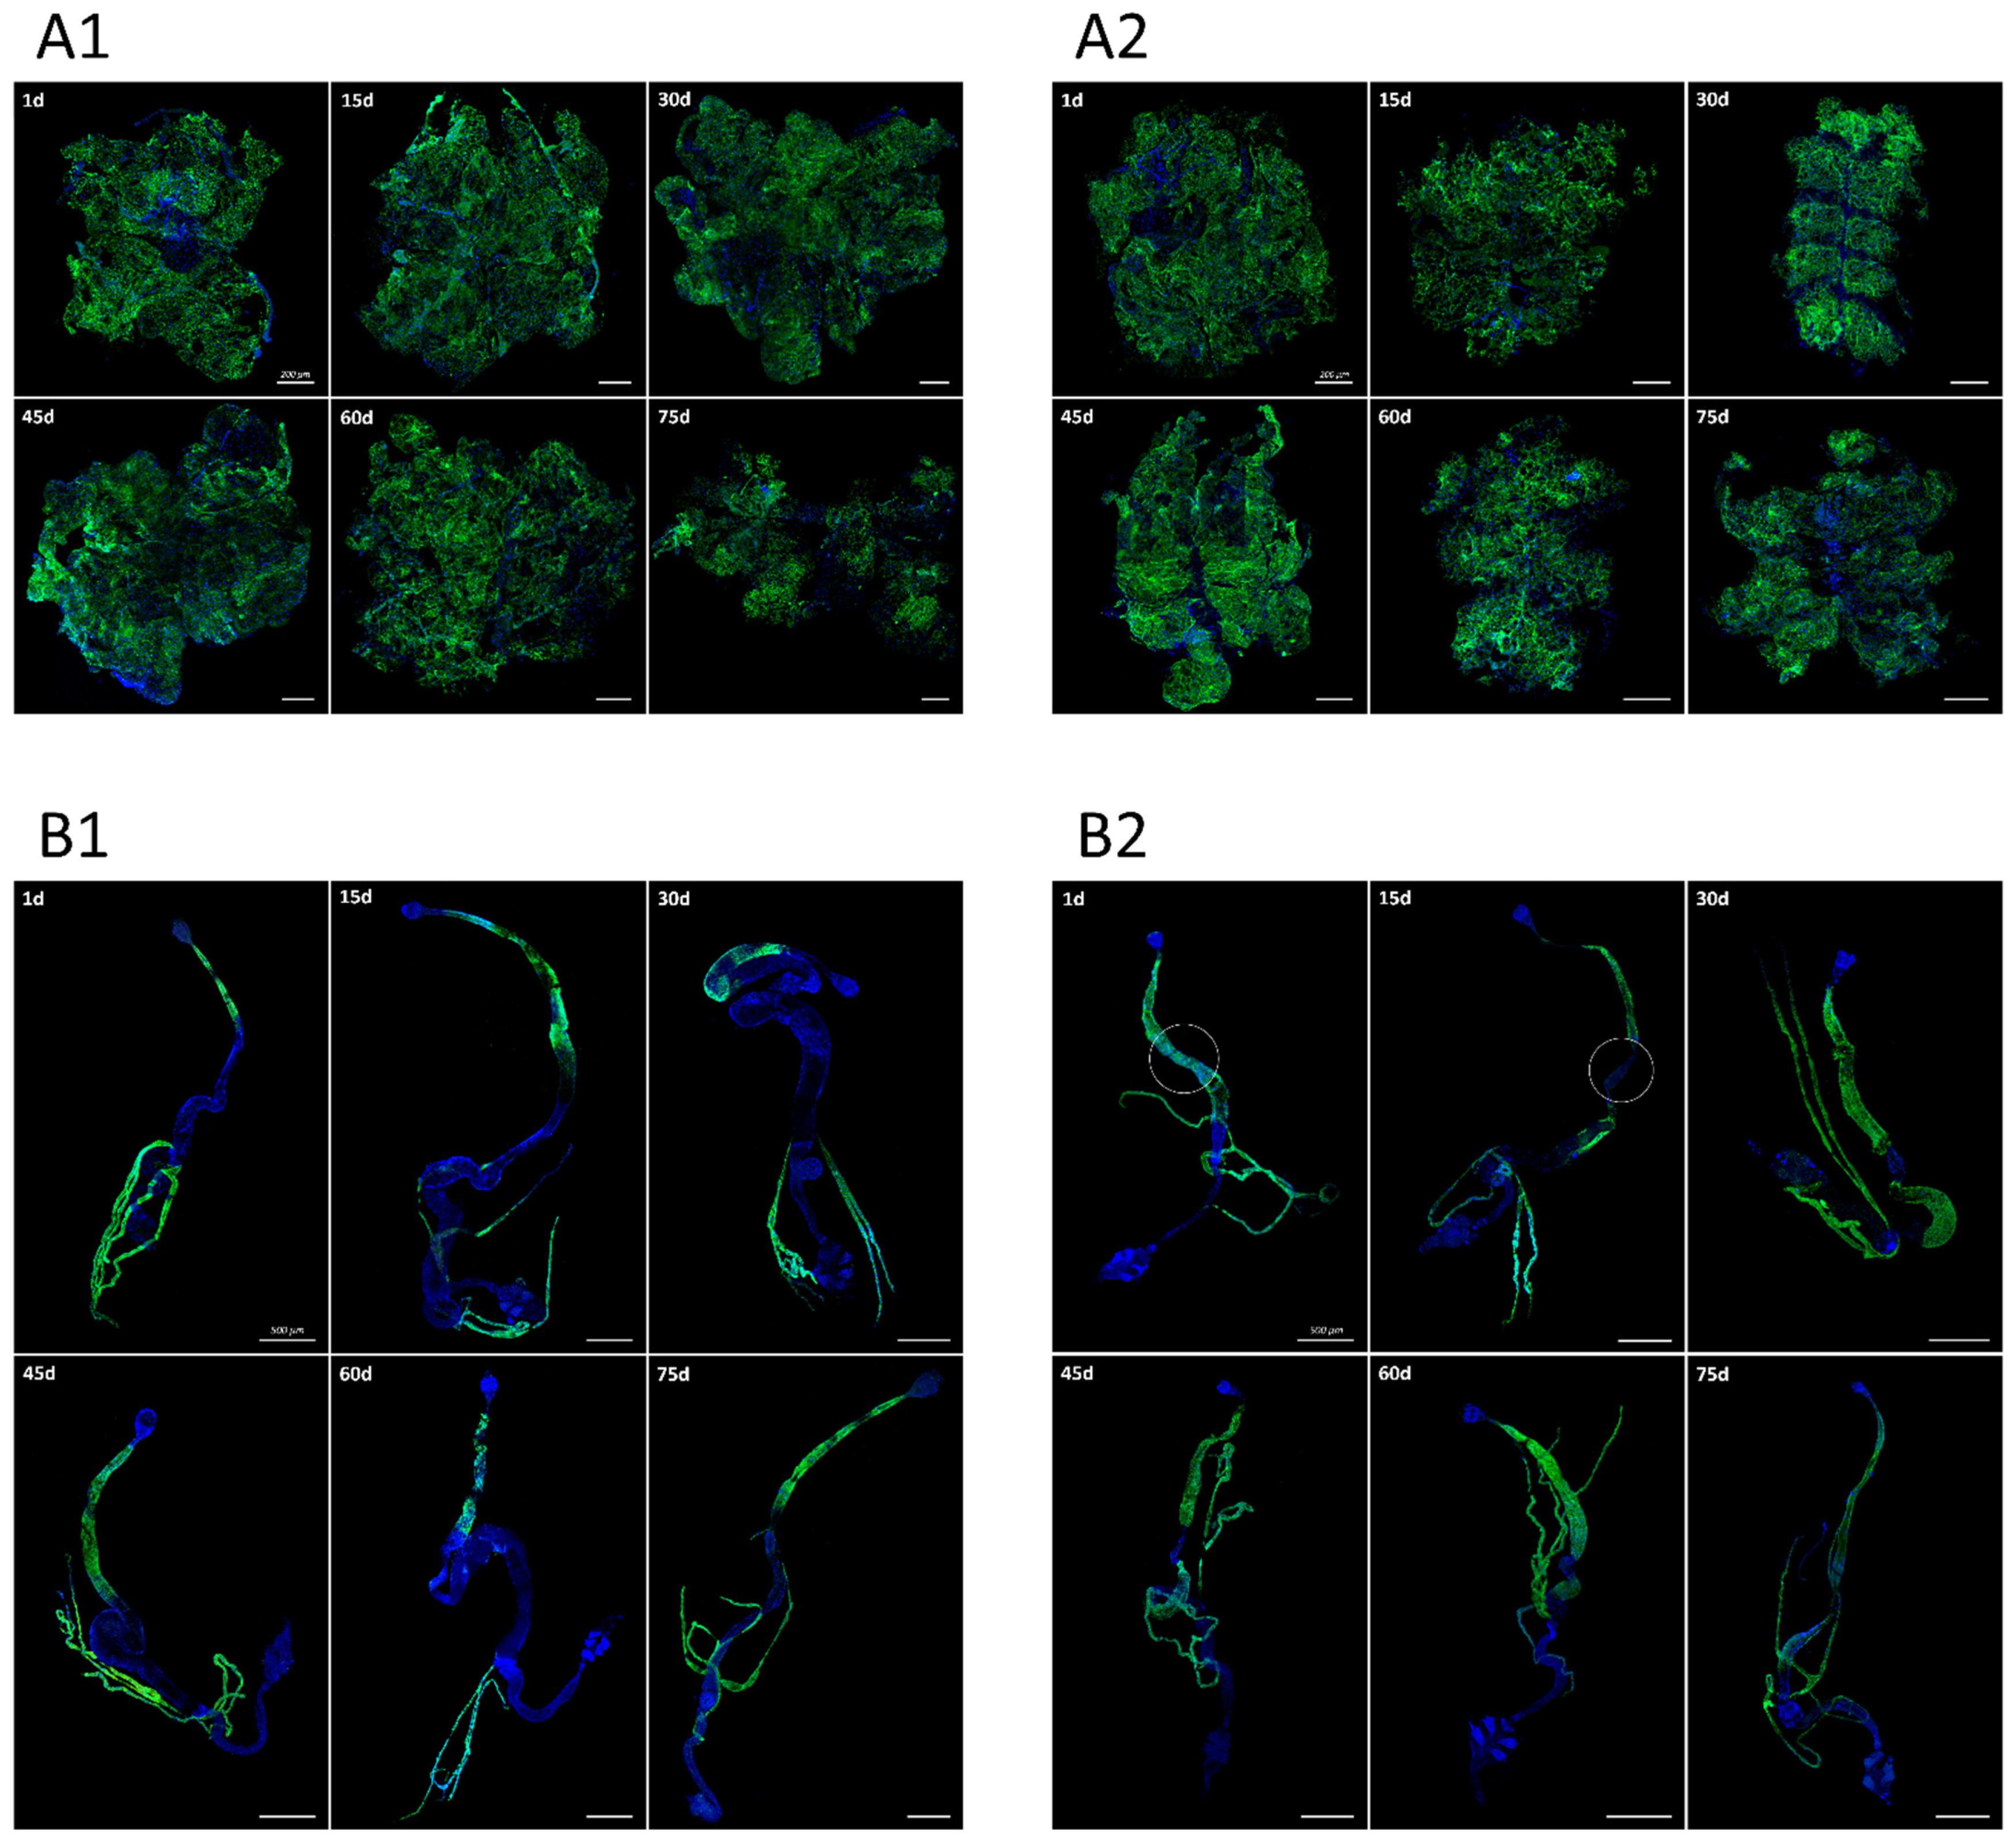
3.1. Pattern of sws Expression during Drosophila Melanogaster Ontogenesis
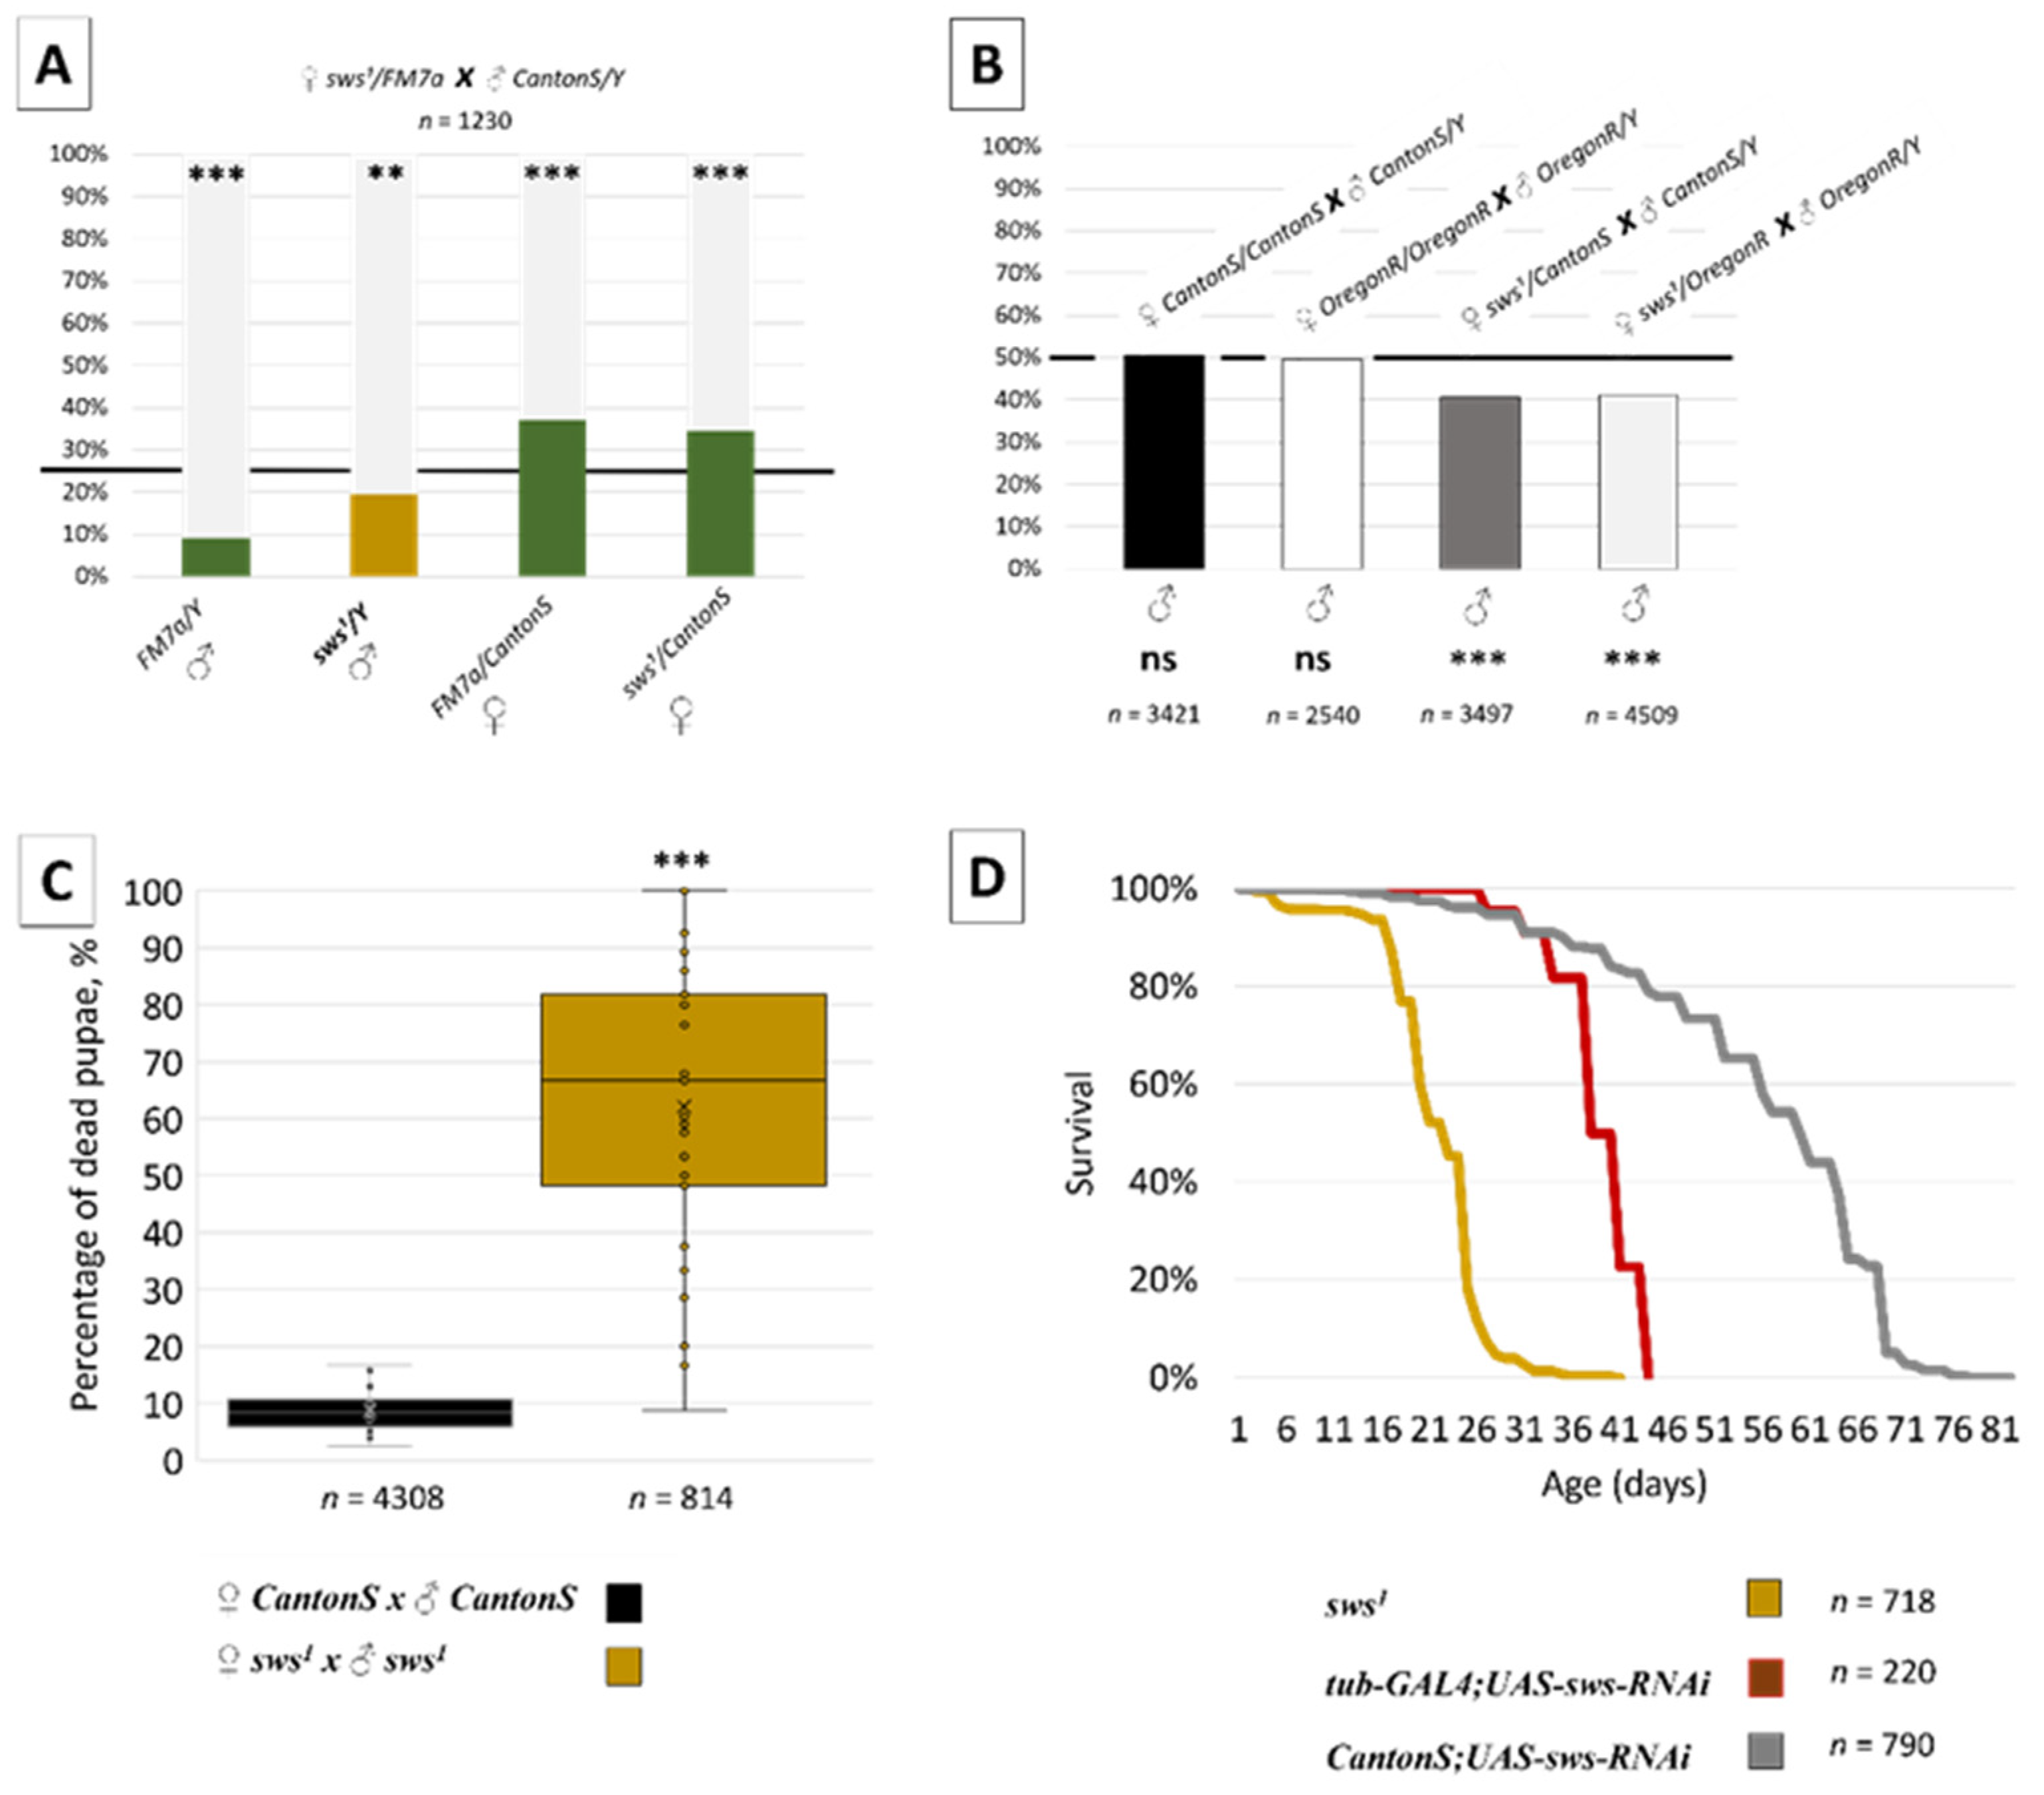
3.2. Normal sws Expression Is Required for Organism Viability
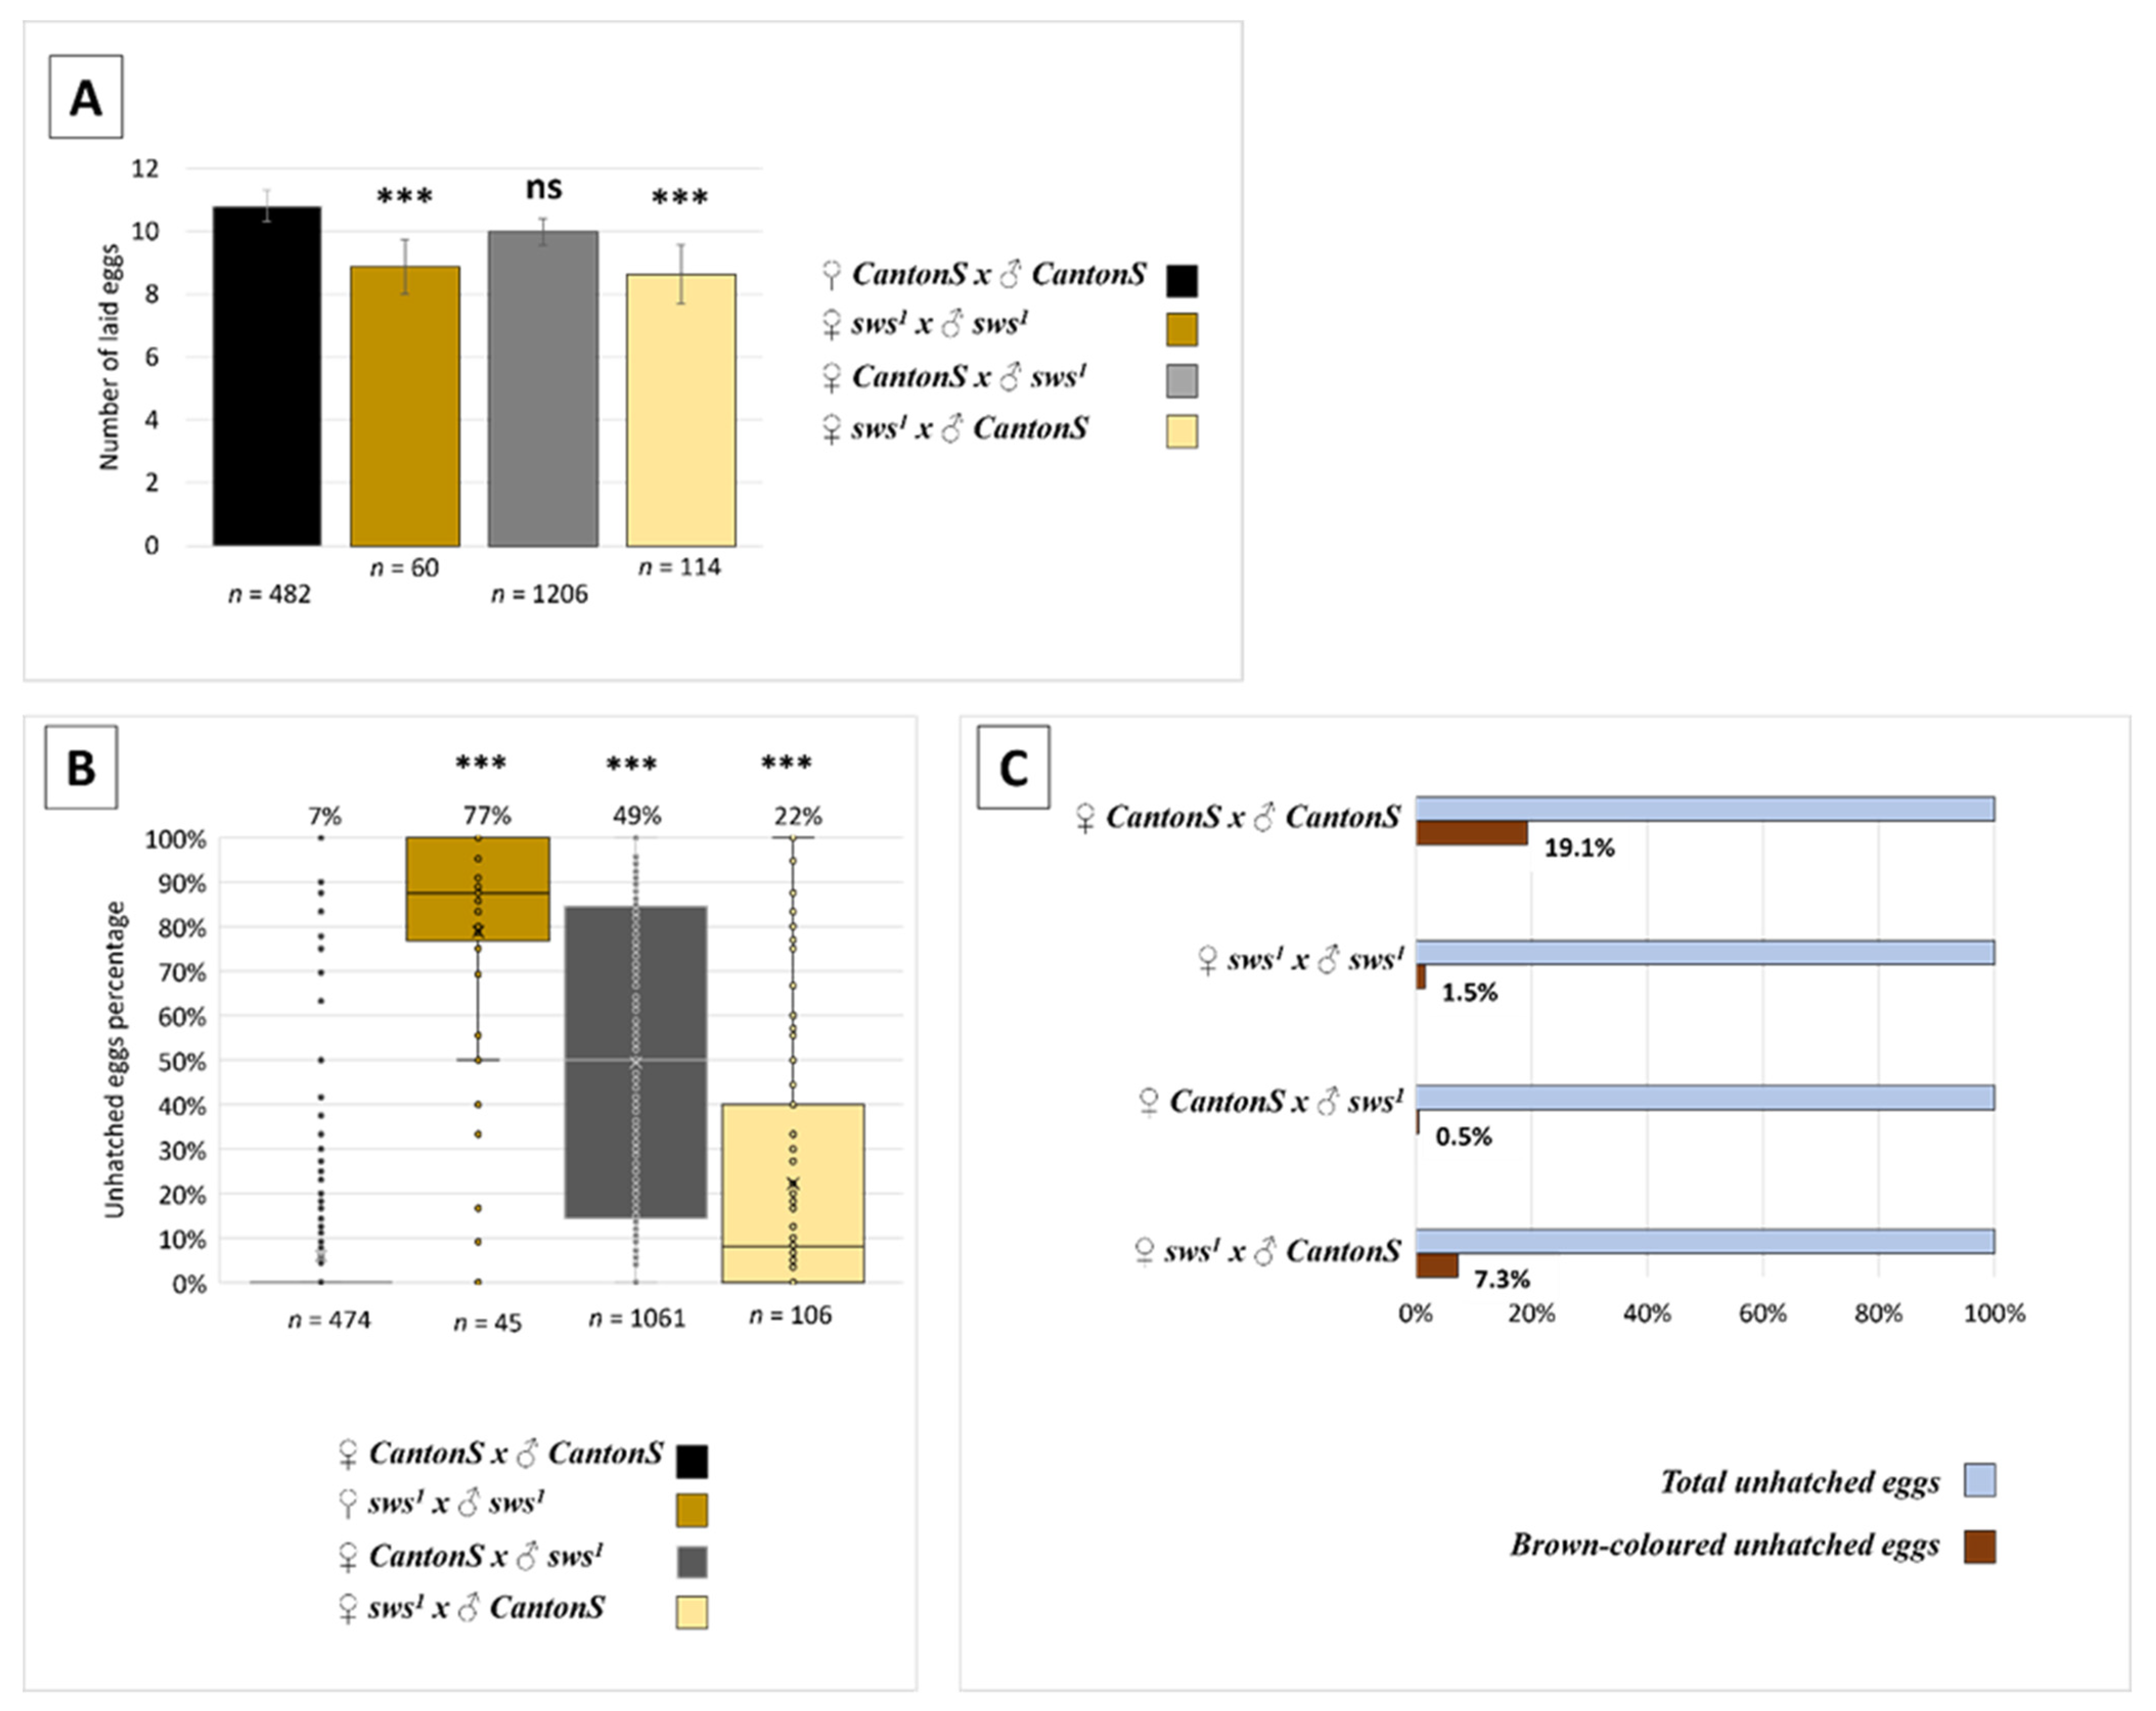
3.3. Normal sws Expression Is Required for Reproduction
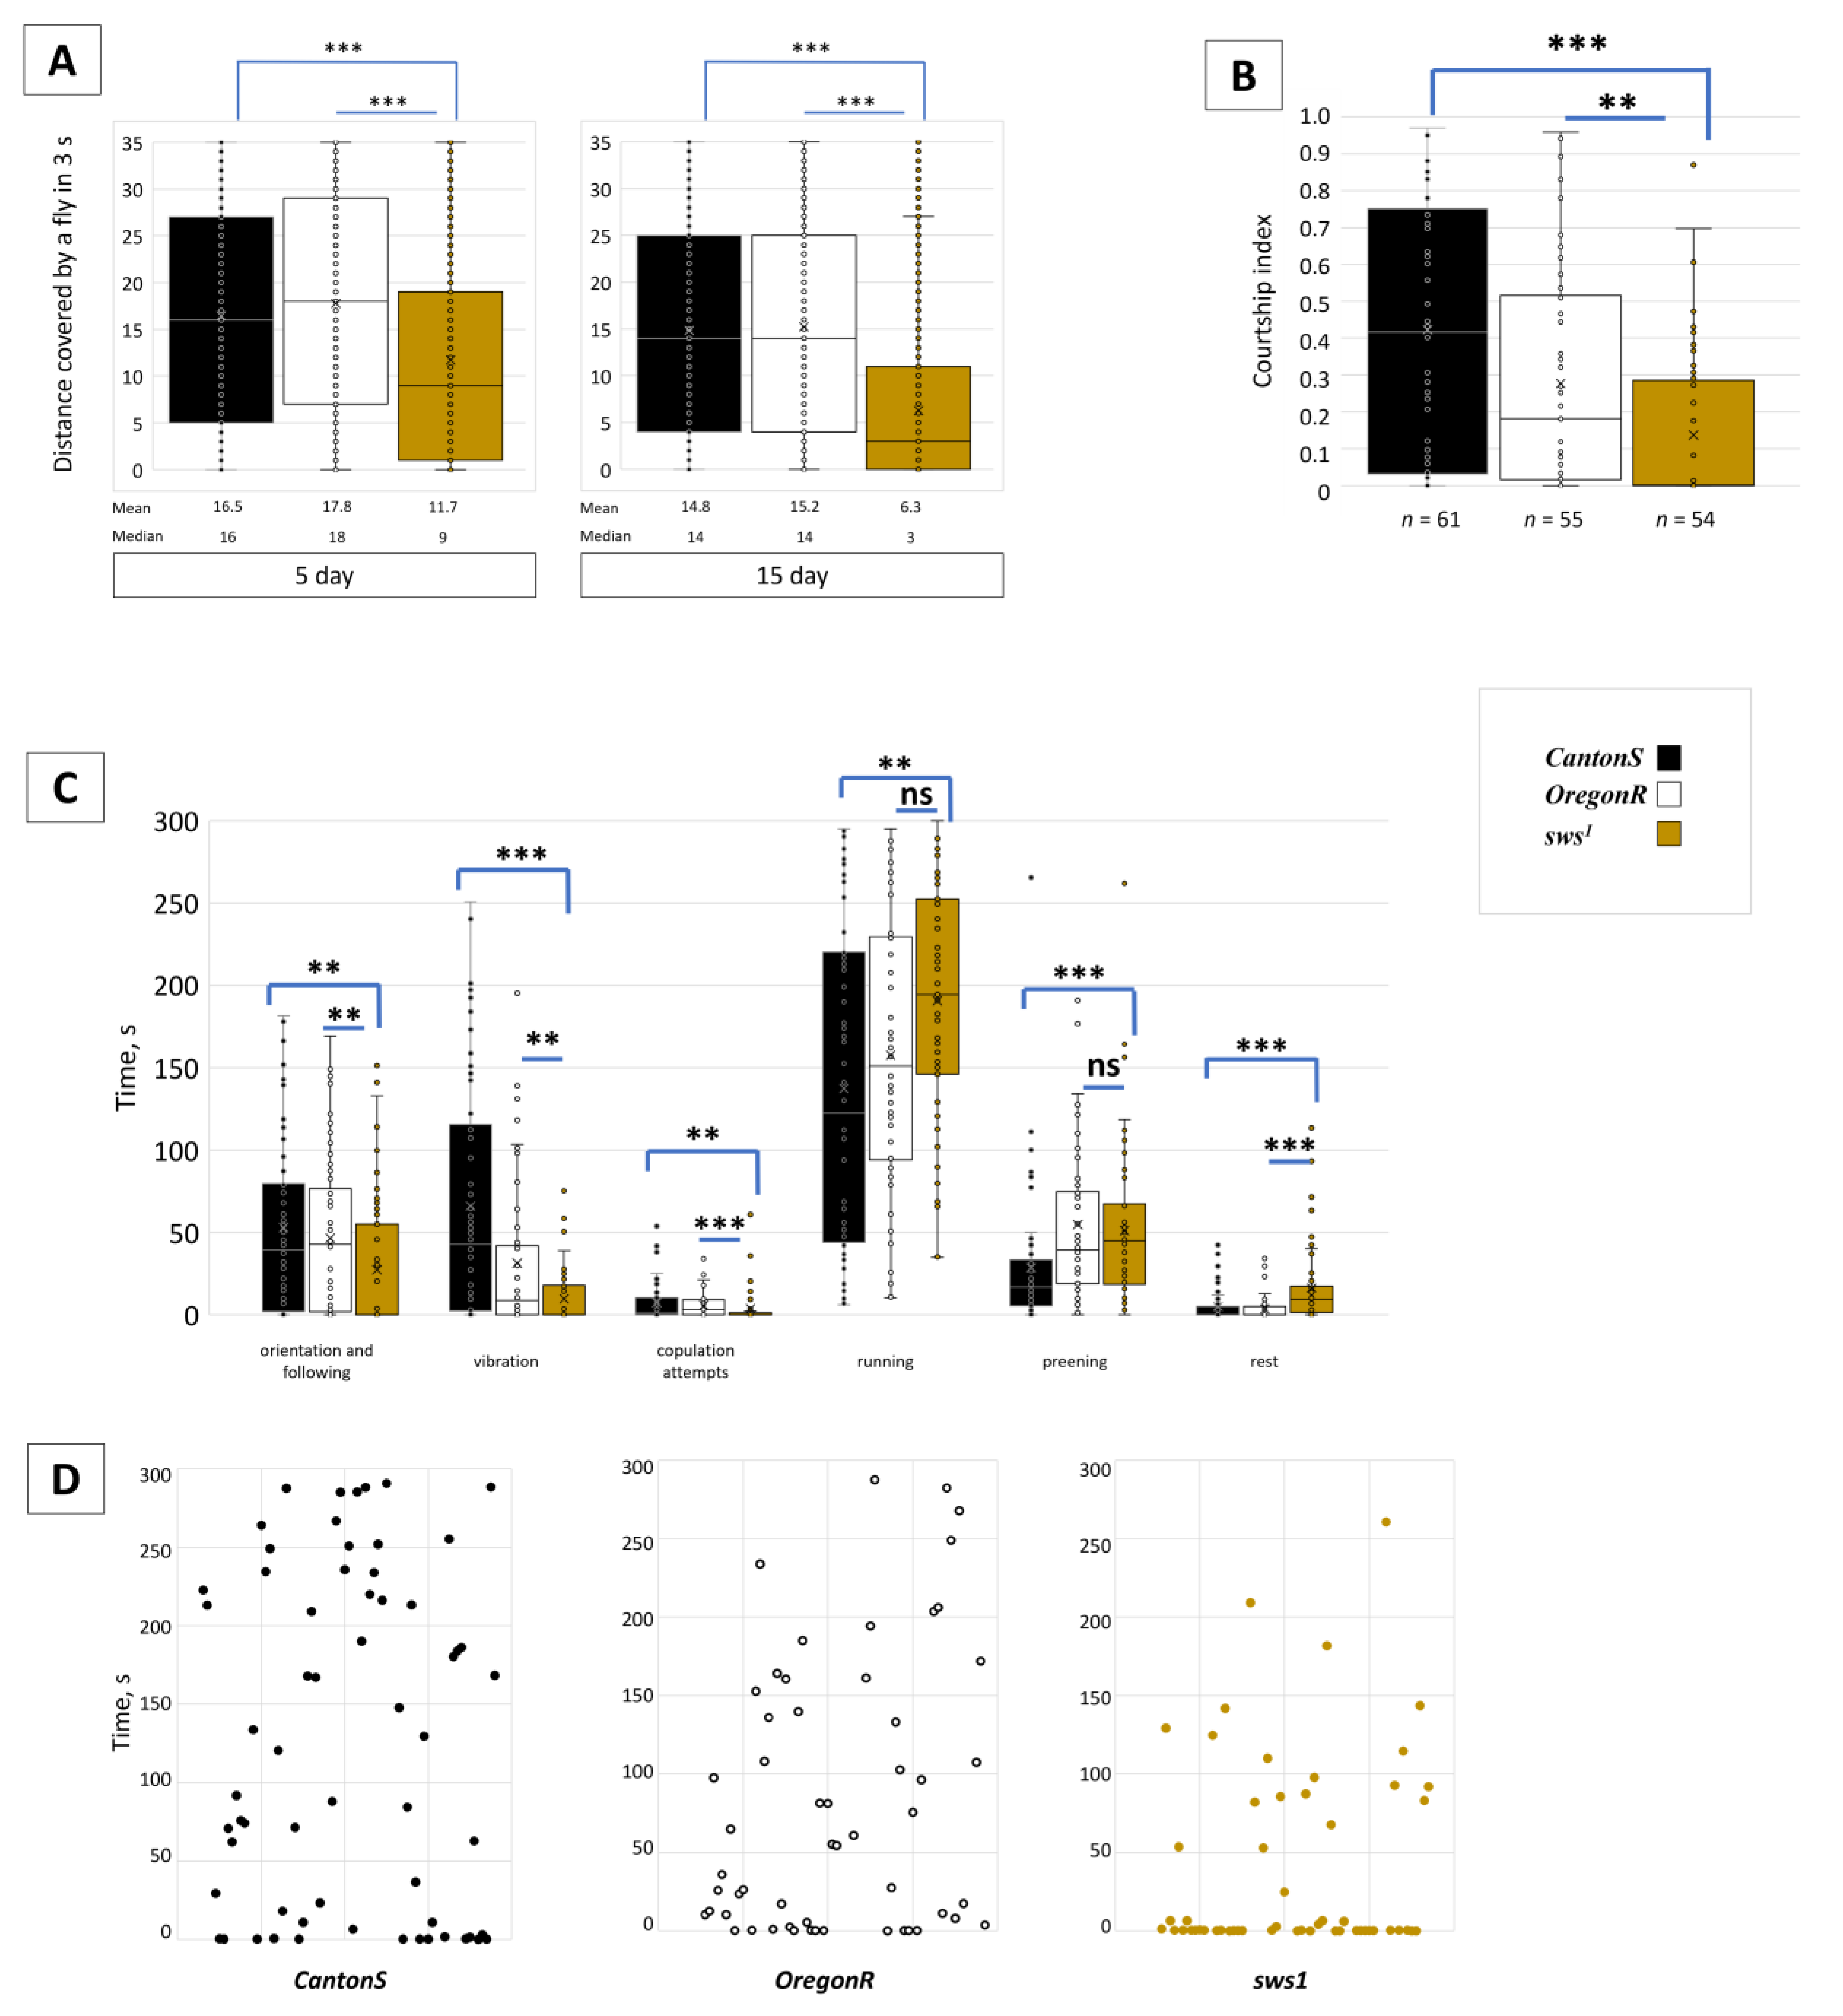
3.4. Dysfunction of sws Alters Male Behaviour
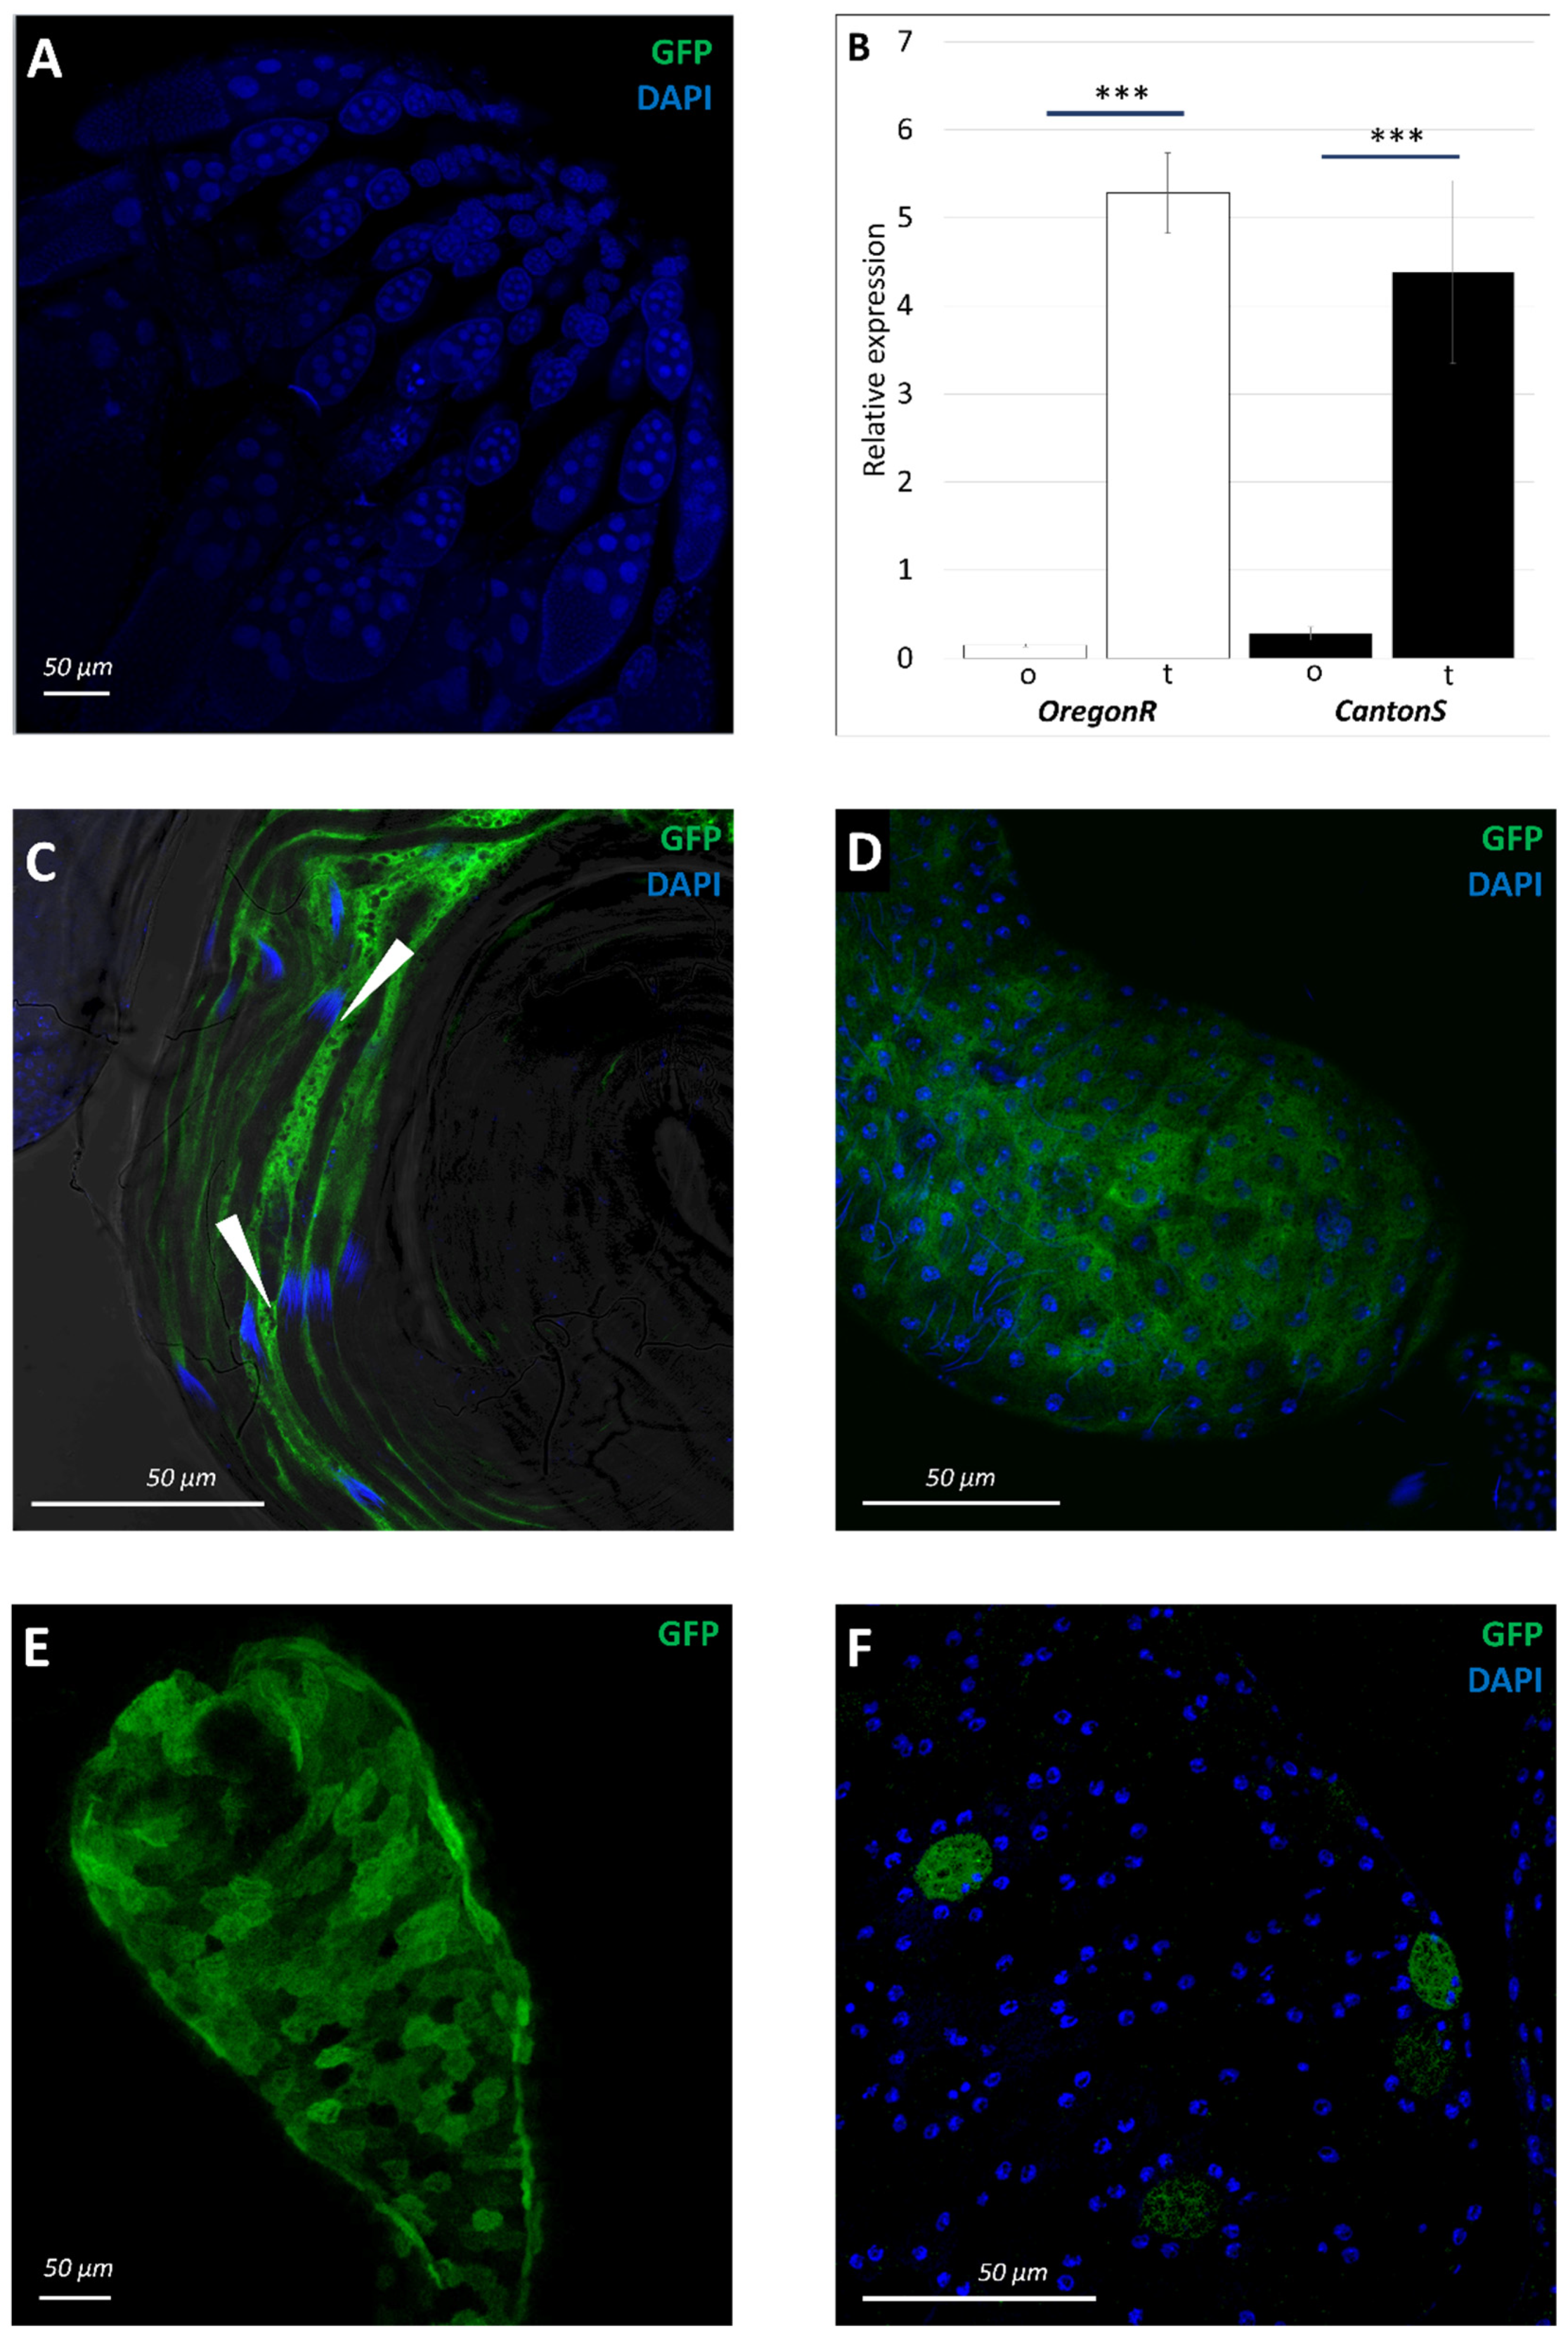
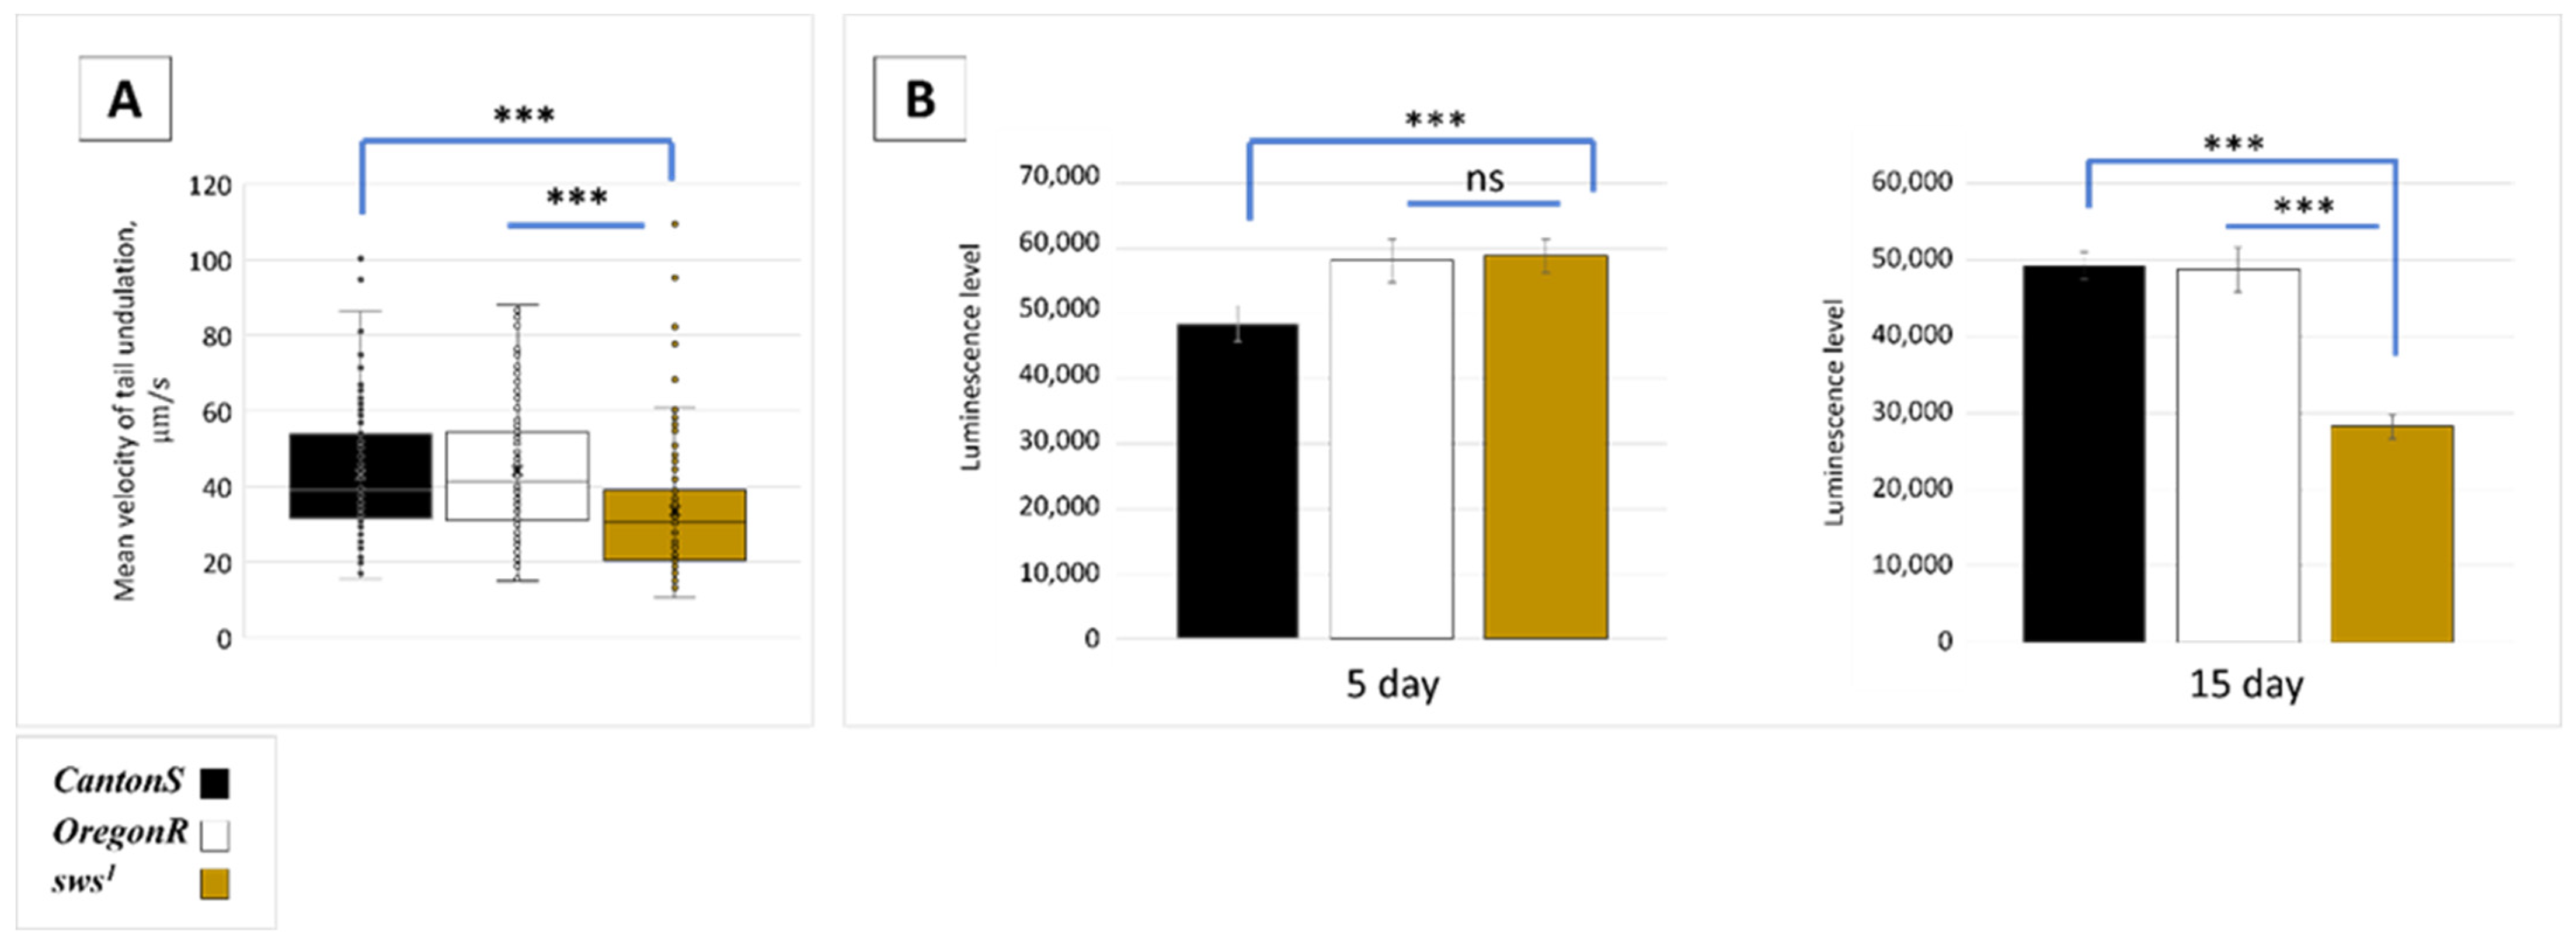
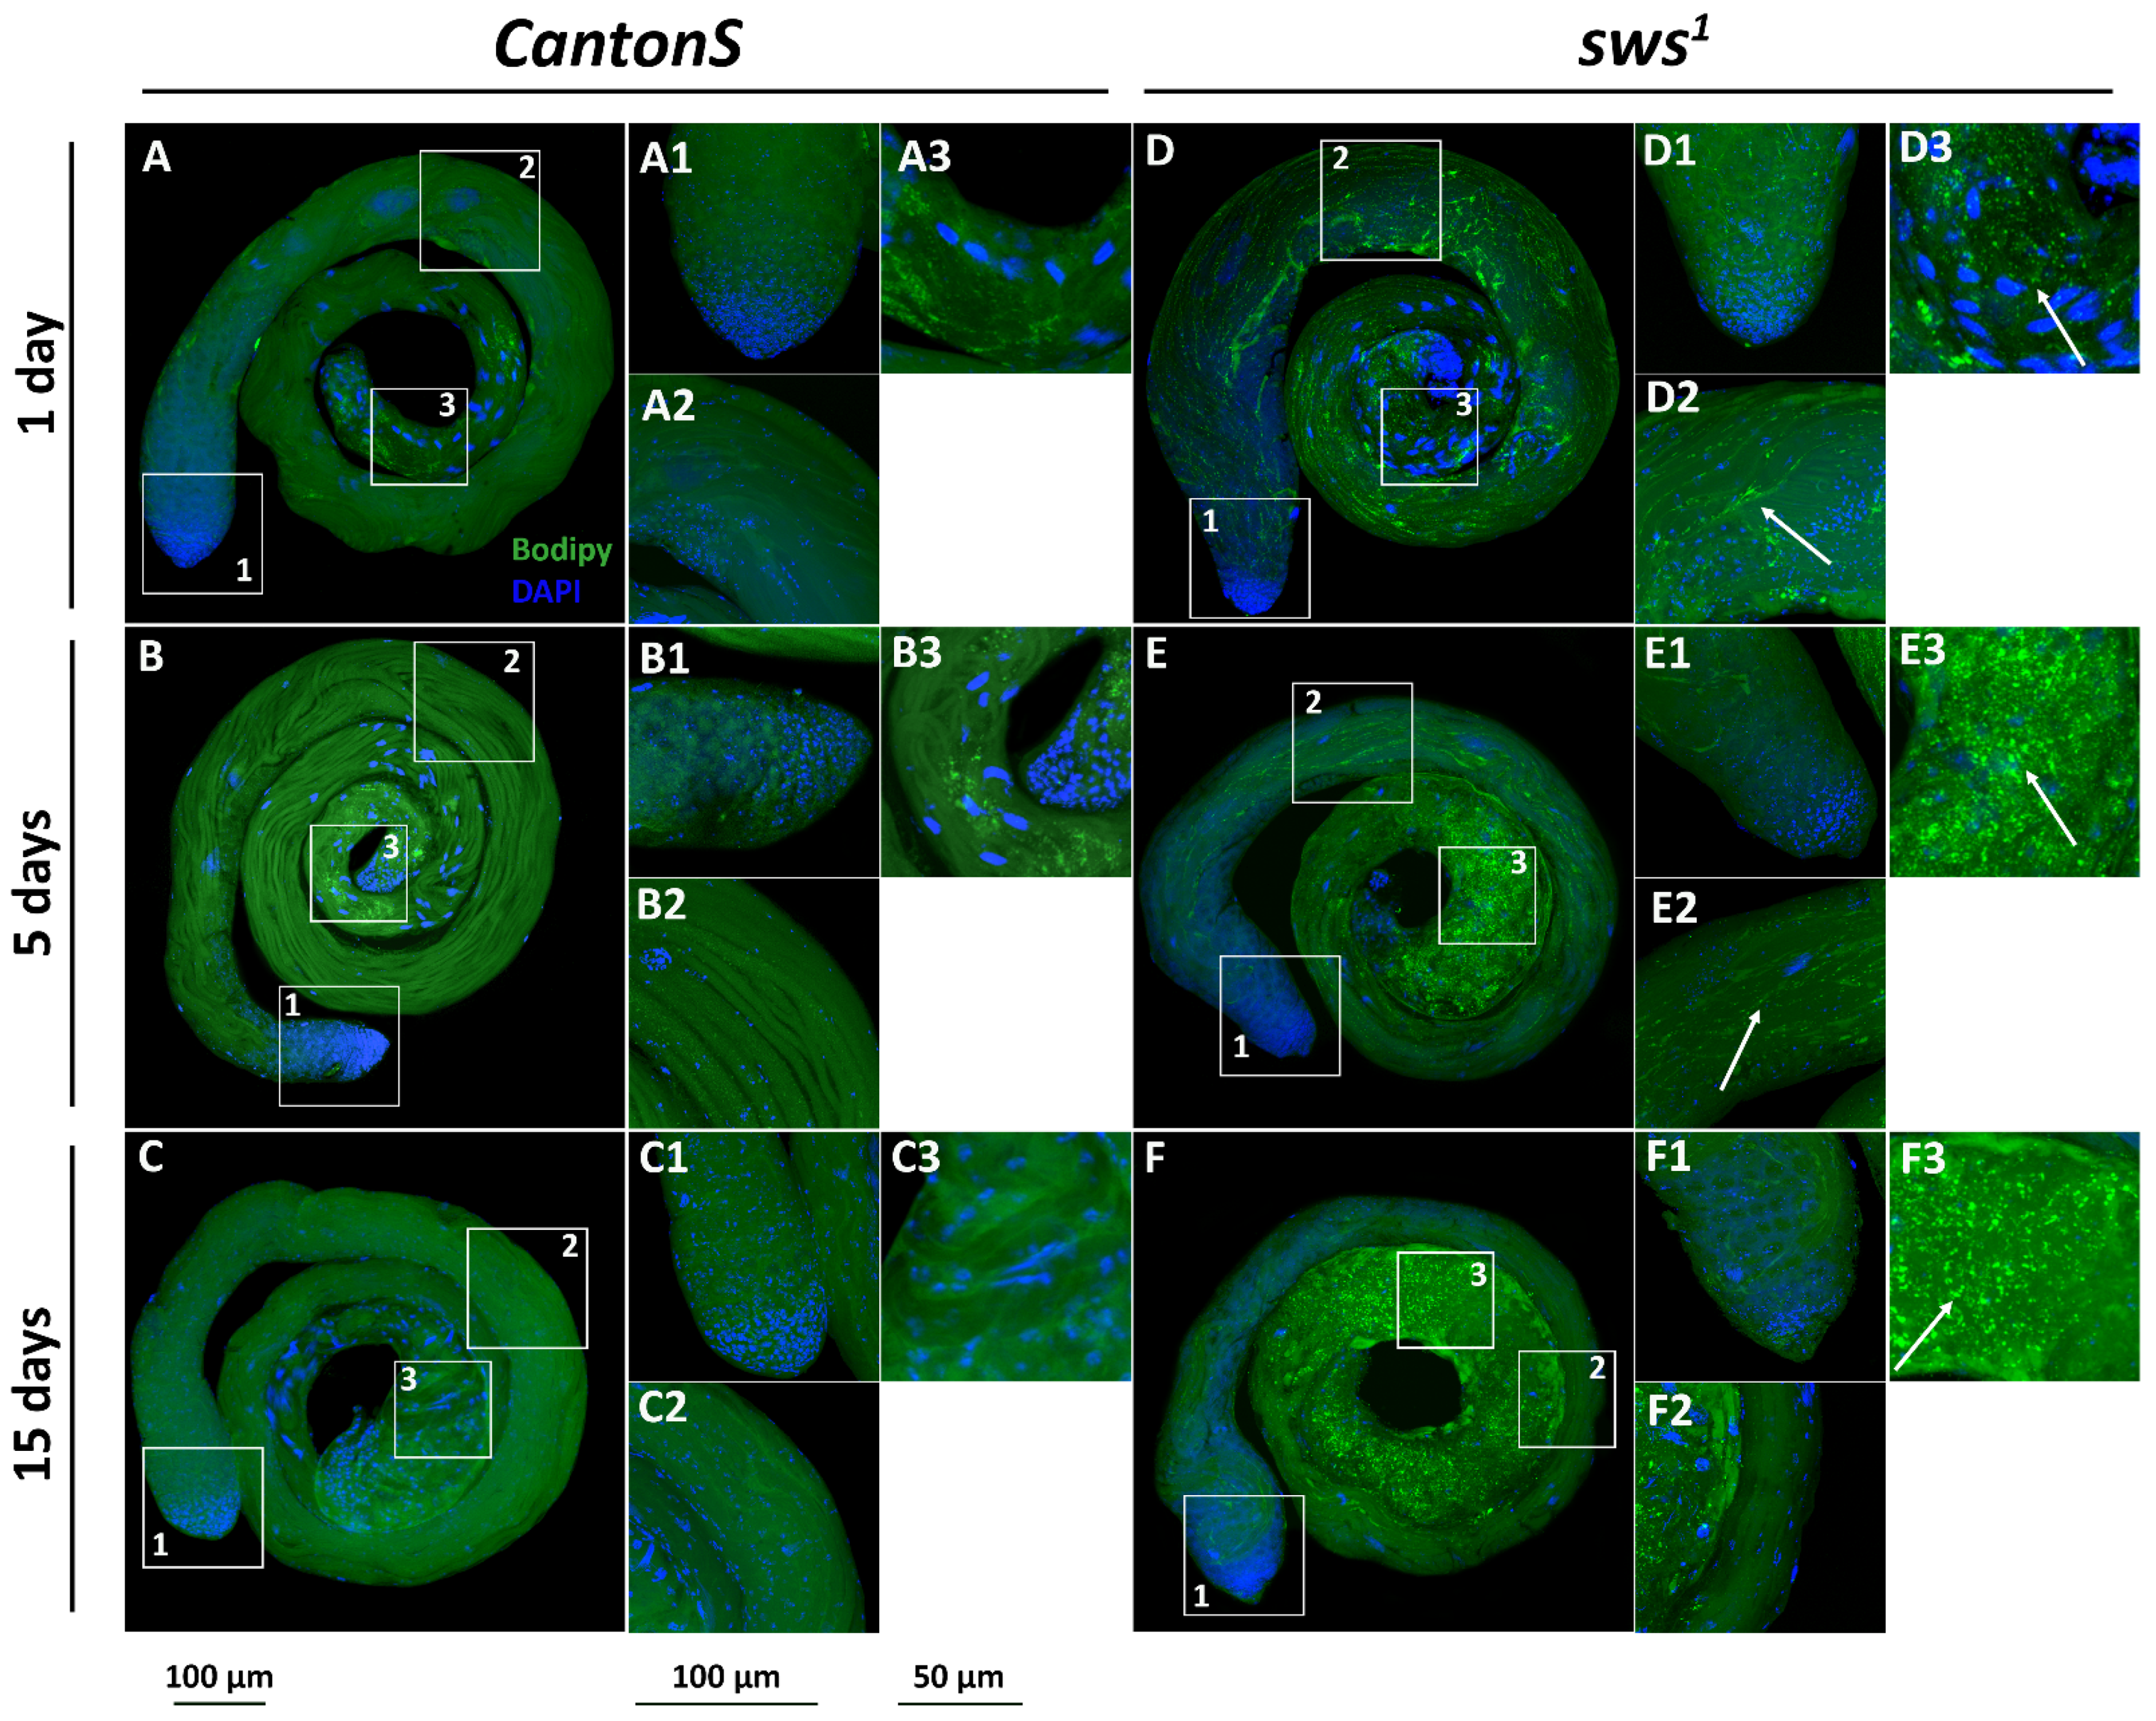
3.5. Physiological Changes in Testes of sws1 Mutant Males
4. Discussion
5. Conclusions
Supplementary Materials
Author Contributions
Funding
Institutional Review Board Statement
Informed Consent Statement
Data Availability Statement
Acknowledgments
Conflicts of Interest
References
- Lush, M.J.; Li, Y.; Read, D.J.; Willis, A.C.; Glynn, P. Neuropathy target esterase and a homologous Drosophila neurodegeneration-associated mutant protein contain a novel domain conserved from bacteria to man. Biochem. J. 1998, 332, 1–4. [Google Scholar] [CrossRef] [PubMed] [Green Version]
- Moser, M.; Stempfl, T.; Li, Y.; Glynn, P.; Büttner, R.; Kretzschmar, D. Cloning and expression of the murine sws/NTE gene. Mech. Dev. 2000, 90, 279–282. [Google Scholar] [CrossRef]
- Kienesberger, P.C.; Oberer, M.; Lass, A.; Zechner, R. Mammalian patatin domain containing proteins: A family with diverse lipolytic activities involved in multiple biological functions. J. Lipid Res. 2009, 50, S63–S68. [Google Scholar] [CrossRef] [PubMed] [Green Version]
- Van Tienhoven, M.; Atkins, J.; Li, Y.; Glynn, P. Human neuropathy target esterase catalyzes hydrolysis of membrane lipids. J. Biol. Chem. 2002, 277, 20942–20948. [Google Scholar] [CrossRef] [PubMed] [Green Version]
- Quistad, G.B.; Barlow, C.; Winrow, C.J.; Sparks, S.E.; Casida, J.E. Evidence that mouse brain neuropathy target esterase is a lysophospholipase. Proc. Natl. Acad. Sci. USA 2003, 100, 7983–7987. [Google Scholar] [CrossRef] [PubMed] [Green Version]
- Zaccheo, O.; Dinsdale, D.; Meacock, P.A.; Glynn, P. Neuropathy target esterase and its yeast homologue degrade phosphatidylcholine to glycerophosphocholine in living cells. J. Biol. Chem. 2004, 279, 24024–24033. [Google Scholar] [CrossRef] [PubMed] [Green Version]
- Read, D.J.; Li, Y.; Chao, M.V.; Cavanagh, J.B.; Glynn, P. Neuropathy target esterase is required for adult vertebrate axon maintenance. J. Neurosci. 2009, 29, 11594–11600. [Google Scholar] [CrossRef] [PubMed] [Green Version]
- Sunderhaus, E.R.; Law, A.D.; Kretzschmar, D. ER responses play a key role in Swiss Cheese/Neuropathy Target Esterase-Associated neurodegeneration. Neurobiol. Dis. 2019, 130, 104520. [Google Scholar] [CrossRef] [PubMed]
- Kretzschmar, D.; Hasan, G.; Sharma, S.; Heisenberg, M.; Benzer, S. The swiss cheese mutant causes glial hyperwrapping and brain degeneration in Drosophila. J. Neurosci. 1997, 17, 7425–7432. [Google Scholar] [CrossRef] [Green Version]
- Mühlig-Versen, M.; da Cruz, A.B.; Tschäpe, J.A.; Moser, M.; Büttner, R.; Athenstaedt, K.; Glynn, P.; Kretzschmar, D. Loss of Swiss cheese/neuropathy target esterase activity causes disruption of phosphatidylcholine homeostasis and neuronal and glial death in adult Drosophila. J. Neurosci. 2005, 25, 2865–2873. [Google Scholar] [CrossRef] [Green Version]
- Dutta, S.; Rieche, F.; Eckl, N.; Duch, C.; Kretzschmar, D. Glial expression of Swiss cheese (SWS), the Drosophila orthologue of neuropathy target esterase (NTE), is required for neuronal ensheathment and function. Dis. Model. Mech. 2016, 9, 283–294. [Google Scholar] [CrossRef] [PubMed] [Green Version]
- Ryabova, E.V.; Melentev, P.A.; Komissarov, A.E.; Surina, N.V.; Ivanova, E.A.; Matiytsiv, N.; Shcherbata, H.R.; Sarantseva, S.V. Morpho-Functional Consequences of Swiss Cheese Knockdown in Glia of Drosophila melanogaster. Cells 2021, 10, 529. [Google Scholar] [CrossRef]
- Melentev, P.A.; Ryabova, E.V.; Surina, N.V.; Zhmujdina, D.R.; Komissarov, A.E.; Ivanova, E.A.; Boltneva, N.P.; Makhaeva, G.F.; Sliusarenko, M.I.; Yatsenko, A.S.; et al. Loss of swiss cheese in Neurons Contributes to Neurodegeneration with Mitochondria Abnormalities, Reactive Oxygen Species Acceleration and Accumulation of Lipid Droplets in Drosophila Brain. Int. J. Mol. Sci. 2021, 22, 8275. [Google Scholar] [CrossRef] [PubMed]
- Sujkowski, A.; Rainier, S.; Fink, J.K.; Wessells, R.J. Delayed Induction of Human NTE (PNPLA6) Rescues Neurodegeneration and Mobility Defects of Drosophila swiss cheese (sws) Mutants. PLoS ONE 2015, 10, e0145356. [Google Scholar] [CrossRef] [Green Version]
- Sunderhaus, E.R.; Law, A.D.; Kretzschmar, D. Disease-associated PNPLA6 mutations maintain partial functions when analyzed in Drosophila. Front. Neurosci. 2019, 13, 1207. [Google Scholar] [CrossRef] [PubMed]
- Akassoglou, K.; Malester, B.; Xu, J.; Tessarollo, L.; Rosenbluth, J.; Chao, M.V. Brain-specific deletion of neuropathy target esterase/swisscheese results in neurodegeneration. Proc. Natl. Acad. Sci. USA 2004, 101, 5075–5080. [Google Scholar] [CrossRef] [PubMed] [Green Version]
- Song, Y.; Wang, M.; Mao, F.; Shao, M.; Zhao, B.; Song, Z.; Shao, C.; Gong, Y. Knockdown of Pnpla6 protein results in motor neuron defects in zebrafish. Dis. Model. Mech. 2013, 6, 404–413. [Google Scholar] [CrossRef] [Green Version]
- McFerrin, J.; Patton, B.L.; Sunderhaus, E.R.; Kretzschmar, D. NTE/PNPLA6 is expressed in mature Schwann cells and is required for glial ensheathment of Remak fibers. Glia 2017, 65, 804–816. [Google Scholar] [CrossRef] [Green Version]
- Rainier, S.; Bui, M.; Mark, E.; Thomas, D.; Tokarz, D.; Ming, L.; Delaney, C.; Richardson, R.J.; Albers, J.W.; Matsunami, N.; et al. Neuropathy target esterase gene mutations cause motor neuron disease. Am. J. Hum. Genet. 2008, 82, 780–785. [Google Scholar] [CrossRef] [PubMed] [Green Version]
- Rainier, S.; Albers, J.W.; Dyck, P.J.; Eldevik, O.P.; Wilcock, S.; Richardson, R.J.; Fink, J.K. Motor neuron disease due to neuropathy target esterase gene mutation: Clinical features of the index families. Muscle Nerve 2011, 43, 19–25. [Google Scholar] [CrossRef]
- Patsi, O.; De Beaufort, C.; Kerschen, P.; Cardillo, S.; Soehn, A.; Rautenberg, M.; Diederich, N.J. A new PNPLA6 mutation presenting as Oliver McFarlane syndrome. J. Neurol. Sci. 2018, 392, 1–2. [Google Scholar] [CrossRef] [PubMed]
- Yoon, G.; Baskin, B.; Tarnopolsky, M.; Boycott, K.M.; Geraghty, M.T.; Sell, E.; Goobie, S.; Meschino, W.; Banwell, B.; Ray, P.N. Autosomal recessive hereditary spastic paraplegia—Clinical and genetic characteristics of a well-defined cohort. Neurogenetics 2013, 14, 181–188. [Google Scholar] [CrossRef]
- Deik, A.; Johannes, B.; Rucker, J.C.; Sánchez, E.; Brodie, S.E.; Deegan, E.; Landy, K.; Kajiwara, Y.; Scelsa, S.; Saunders-Pullman, R.; et al. Compound heterozygous PNPLA6 mutations cause Boucher-Neuhäuser syndrome with late-onset ataxia. J. Neurol. 2014, 261, 2411–2423. [Google Scholar] [CrossRef] [PubMed] [Green Version]
- Synofzik, M.; Gonzalez, M.A.; Lourenco, C.M.; Coutelier, M.; Haack, T.B.; Rebelo, A.; Hannequin, D.; Strom, T.M.; Prokisch, H.; Kernstock, C.; et al. PNPLA6 mutations cause Boucher-Neuhäuser and Gordon Holmes syndromes as part of a broad neurodegenerative spectrum. Brain 2014, 137, 69–77. [Google Scholar] [CrossRef]
- Topaloglu, A.K.; Lomniczi, A.; Kretzschmar, D.; Dissen, G.A.; Kotan, L.D.; McArdle, C.A.; Koc, A.F.; Hamel, B.C.; Guclu, M.; Papatya, E.D.; et al. Loss-of-function mutations in PNPLA6 encoding neuropathy target esterase underlie pubertal failure and neurological deficits in Gordon Holmes syndrome. J. Clin. Endocrinol. Metab. 2014, 99, E2067–E2075. [Google Scholar] [CrossRef] [PubMed] [Green Version]
- Hufnagel, R.B.; Arno, G.; Hein, N.D.; Hersheson, J.; Prasad, M.; Anderson, Y.; Krueger, L.A.; Gregory, L.C.; Stoetzel, C.; Jaworek, T.J.; et al. Neuropathy target esterase impairments cause Oliver-McFarlane and Laurence-Moon syndromes. J. Med. Genet. 2015, 52, 85–94. [Google Scholar] [CrossRef]
- Tarnutzer, A.A.; Gerth-Kahlert, C.; Timmann, D.; Chang, D.I.; Harmuth, F.; Bauer, P.; Straumann, D.; Synofzik, M. Boucher-Neuhäuser syndrome: Cerebellar degeneration, chorioretinal dystrophy and hypogonadotropic hypogonadism: Two novel cases and a review of 40 cases from the literature. J. Neurol. 2015, 262, 194–202. [Google Scholar] [CrossRef] [PubMed] [Green Version]
- Langdahl, J.H.; Frederiksen, A.L.; Nguyen, N.; Brusgaard, K.; Juhl, C.B. Boucher Neuhäuser Syndrome—A rare cause of inherited hypogonadotropic hypogonadism. A case of two adult siblings with two novel mutations in PNPLA6. Eur. J. Med. Genet. 2017, 60, 105–109. [Google Scholar] [CrossRef] [PubMed]
- Wiethoff, S.; Bettencourt, C.; Paudel, R.; Madon, P.; Liu, Y.T.; Hersheson, J.; Wadia, N.; Desai, J.; Houlden, H. Pure cerebellar ataxia with homozygous mutations in the PNPLA6 gene. Cerebellum 2017, 16, 262–267. [Google Scholar] [CrossRef]
- Teive, H.A.G.; Camargo, C.H.F.; Sato, M.T.; Shiokawa, N.; Boguszewski, C.L.; Raskin, S.; Buck, C.; Seminara, S.B.; Munhoz, R.P. Different cerebellar ataxia phenotypes associated with mutations of the PNPLA6 gene in Brazilian patients with recessive ataxias. Cerebellum 2018, 17, 380–385. [Google Scholar] [CrossRef] [PubMed]
- Zheng, R.; Zhao, Y.; Wu, J.; Wang, Y.; Liu, J.L.; Zhou, Z.L.; Zhou, X.T.; Chen, D.N.; Liao, W.H.; Li, J.D. A novel PNPLA6 compound heterozygous mutation identified in a Chinese patient with Boucher-Neuhäuser syndrome. Mol. Med. Rep. 2018, 18, 261–267. [Google Scholar] [CrossRef] [PubMed]
- Salgado, P.; Carvalho, R.; Brandão, A.F.; Jorge, P.; Ramos, C.; Dias, D.; Alonso, I.; Magalhães, M. Gordon Holmes syndrome due to compound heterozygosity of two new PNPLA6 variants—A diagnostic challenge. eNeurologicalSci 2019, 14, 9–12. [Google Scholar] [CrossRef]
- O’Neil, E.; Serrano, L.; Scoles, D.; Cunningham, K.E.; Han, G.; Chiang, J.; Bennett, J.; Aleman, T.S. Detailed retinal phenotype of Boucher-Neuhäuser syndrome associated with mutations in PNPLA6 mimicking choroideremia. Ophthalmic Genet. 2019, 40, 267–275. [Google Scholar] [CrossRef]
- Doğan, M.; Eröz, R.; Öztürk, E. Chorioretinal dystrophy, hypogonadotropic hypogonadism, and cerebellar ataxia: Boucher-Neuhauser syndrome due to a homozygous (c. 3524C>G (p. Ser1175Cys)) variant in PNPLA6 gene. Ophthalmic Genet. 2021, 42, 276–282. [Google Scholar] [CrossRef] [PubMed]
- Emekli, A.S.; Samanci, B.; Şimşir, G.; Hanagasi, H.A.; Gürvit, H.; Bilgiç, B.; Başak, A.N. A novel PNPLA6 mutation in a Turkish family with intractable Holmes tremor and spastic ataxia. Neurol. Sci. 2021, 42, 1535–1539. [Google Scholar] [CrossRef]
- Wu, S.; Sun, Z.; Zhu, T.; Weleber, R.G.; Yang, P.; Wei, X.; Pennesi, M.E.; Sui, R. Novel variants in PNPLA6 causing syndromic retinal dystrophy. Exp. Eye Res. 2021, 202, 108327. [Google Scholar] [CrossRef] [PubMed]
- Liu, F.; Ji, Y.; Li, G.; Xu, C.; Sun, Y. Identification of Oliver-McFarlane syndrome caused by novel compound heterozygous variants of PNPLA6. Gene 2020, 761, 145027. [Google Scholar] [CrossRef] [PubMed]
- Lisbjerg, K.; Andersen, M.K.; Bertelsen, M.; Brost, A.G.; Buchvald, F.F.; Jensen, R.B.; Bisgaard, A.M.; Rosenberg, T.; Tümer, Z.; Kessel, L. Oliver McFarlane syndrome: Two new cases and a review of the literature. Ophthalmic Genet. 2021, 42, 467–473. [Google Scholar] [CrossRef]
- Kmoch, S.; Majewski, J.; Ramamurthy, V.; Cao, S.; Fahiminiya, S.; Ren, H.; MacDonald, I.M.; Lopez, I.; Sun, V.; Keser, V.; et al. Mutations in PNPLA6 are linked to photoreceptor degeneration and various forms of childhood blindness. Nat. Commun. 2015, 6, 5614. [Google Scholar] [CrossRef] [Green Version]
- Makuloluwa, A.K.; Dodeja, R.; Georgiou, M.; Gonzalez-Martin, J.; Hagan, R.; Madhusudhan, S.; Michaelides, M. Oliver McFarlane syndrome and choroidal neovascularisation: A case report. Ophthalmic Genet. 2020, 41, 451–456. [Google Scholar] [CrossRef] [PubMed]
- Winrow, C.J.; Hemming, M.L.; Allen, D.M.; Quistad, G.B.; Casida, J.E.; Barlow, C. Loss of neuropathy target esterase in mice links organophosphate exposure to hyperactivity. Nat. Genet. 2003, 33, 477–485. [Google Scholar] [CrossRef] [Green Version]
- Moser, M.; Li, Y.; Vaupel, K.; Kretzschmar, D.; Kluge, R.; Glynn, P.; Buettner, R. Placental failure and impaired vasculogenesis result in embryonic lethality for neuropathy target esterase-deficient mice. Mol. Cell. Biol. 2004, 24, 1667–1679. [Google Scholar] [CrossRef] [PubMed] [Green Version]
- Melentev, P.A.; Ryabova, E.V.; Sarantseva, S.V. A private history of neurogenetics: The swiss cheese gene and its orthologs. Russ. J. Genet. 2021, 57, 1115–1130. [Google Scholar] [CrossRef]
- FlyBase Gene Report: Dmel/sw. Available online: http://flybase.org/reports/FBgn0003656 (accessed on 1 September 2021).
- University of Glasgow. Fly Atlas 2. Available online: http://flyatlas.gla.ac.uk/FlyAtlas2 (accessed on 1 September 2021).
- Brand, A.H.; Perrimon, N. Targeted gene expression as a means of altering cell fates and generating dominant phenotypes. Development 1993, 118, 401–415. [Google Scholar] [CrossRef] [PubMed]
- Gargano, J.W.; Martin, I.; Bhandari, P.; Grotewiel, M.S. Rapid iterative negative geotaxis (RING): A new method for assessing age-related locomotor decline in Drosophila. Exp. Gerontol. 2005, 40, 386–395. [Google Scholar] [CrossRef]
- Kamyshev, N.G.; Iliadi, K.G.; Bragina, J.V. Drosophila conditioned courtship: Two ways of testing memory. Learn. Mem. 1999, 6, 1–20. [Google Scholar] [CrossRef]
- Ogneva, I.V.; Usik, M.A.; Burtseva, M.V.; Biryukov, N.S.; Zhdankina, Y.S.; Sychev, V.N.; Orlov, O.I. Drosophila melanogaster sperm under simulated microgravity and a hypomagnetic field: Motility and cell respiration. Int. J. Mol. Sci. 2020, 21, 5985. [Google Scholar] [CrossRef] [PubMed]
- Tennessen, J.M.; Barry, W.E.; Cox, J.; Thummel, C.S. Methods for studying metabolism in Drosophila. Methods 2014, 68, 105–115. [Google Scholar] [CrossRef] [PubMed] [Green Version]
- Bradford, M.M. A rapid and sensitive method for the quantitation of microgram quantities of protein utilizing the principle of protein-dye binding. Anal. Biochem. 1976, 72, 248–254. [Google Scholar] [CrossRef]
- Spangenburg, E.E.; Pratt, S.J.; Wohlers, L.M.; Lovering, R.M. Use of BODIPY (493/503) to visualize intramuscular lipid droplets in skeletal muscle. J. Biomed. Biotechnol. 2011, 2011, 598358. [Google Scholar] [CrossRef]
- Pérez–Severiano, F.; Santamaría, A.; Pedraza-Chaverri, J.; Medina-Campos, O.N.; Ríos, C.; Segovia, J. Increased formation of reactive oxygen species, but no changes in glutathione peroxidase activity, in striata of mice transgenic for the Huntington’s disease mutation. Neurochem. Res. 2004, 29, 729–733. [Google Scholar] [CrossRef]
- Miguel-Aliaga, I.; Jasper, H.; Lemaitre, B. Anatomy and physiology of the digestive tract of Drosophila melanogaster. Genetics 2018, 210, 357–396. [Google Scholar] [CrossRef] [PubMed] [Green Version]
- Kastner, P.; Mark, M.; Leid, M.; Gansmuller, A.; Chin, W.; Grondona, J.M.; Decimo, D.; Krezel, W.; Dierich, A.; Chambon, P. Abnormal spermatogenesis in RXR beta mutant mice. Genes Dev. 1996, 10, 80–92. [Google Scholar] [CrossRef] [PubMed] [Green Version]
- Selva, D.M.; Hirsch-Reinshagen, V.; Burgess, B.; Zhou, S.; Chan, J.; McIsaac, S.; Hayden, M.R.; Hammond, G.L.; Vogl, A.W.; Wellington, C.L. The ATP-binding cassette transporter 1 mediates lipid efflux from Sertoli cells and influences male fertility. J. Lipid Res. 2004, 45, 1040–1050. [Google Scholar] [CrossRef] [PubMed] [Green Version]
- Huyghe, S.; Schmalbruch, H.; De Gendt, K.; Verhoeven, G.; Guillou, F.; Van Veldhoven, P.P.; Baes, M. Peroxisomal multifunctional protein 2 is essential for lipid homeostasis in Sertoli cells and male fertility in mice. Endocrinology 2006, 147, 2228–2236. [Google Scholar] [CrossRef] [PubMed] [Green Version]
- Topcu-Tarladacalisir, Y.; Kanter, M.; Uzal, M.C. Role of L-carnitine in the prevention of seminiferous tubules damage induced by gamma radiation: A light and electron microscopic study. Arch. Toxicol. 2009, 83, 735–746. [Google Scholar] [CrossRef]
- Bailey, A.P.; Koster, G.; Guillermier, C.; Hirst, E.M.; MacRae, J.I.; Lechene, C.P.; Postle, A.D.; Gould, A.P. Antioxidant role for lipid droplets in a stem cell niche of Drosophila. Cell 2015, 163, 340–353. [Google Scholar] [CrossRef] [Green Version]
- Liu, L.; MacKenzie, K.R.; Putluri, N.; Maletić-Savatić, M.; Bellen, H.J. The glia-neuron lactate shuttle and elevated ROS promote lipid synthesis in neurons and lipid droplet accumulation in glia via APOE/D. Cell Metab. 2017, 26, 719–737. [Google Scholar] [CrossRef] [PubMed] [Green Version]
- Ryabova, E.; Matiytsiv, N.; Trush, O.; Mohylyak, I.; Kislik, G.; Melentev, P.; Sarantseva, S. Swiss cheese, Drosophila ortholog of hereditary spastic paraplegia gene NTE, maintains neuromuscular junction development and microtubule network. In Drosophila Melanogaster—Model for Recent Advances in Genetics and Therapeutics; Perveen, F.K., Ed.; IntechOpen: London, UK, 2018. [Google Scholar] [CrossRef] [Green Version]
- Takemori, N.; Yamamoto, M.T. Proteome mapping of the Drosophila melanogaster male reproductive system. Proteomics 2009, 9, 2484–2493. [Google Scholar] [CrossRef]
- Majewska, M.M.; Suszczynska, A.; Kotwica-Rolinska, J.; Czerwik, T.; Paterczyk, B.; Polanska, M.A.; Bernatowicz, P.; Bebas, P. Yolk proteins in the male reproductive system of the fruit fly Drosophila melanogaster: Spatial and temporal patterns of expression. Insect Biochem. Mol. Biol. 2014, 47, 23–35. [Google Scholar] [CrossRef]
- Wilson, C.; Leiblich, A.; Goberdhan, D.C.I.; Hamdy, F. The Drosophila accessory gland as a model for prostate cancer and other pathologies. Curr. Top. Dev. Biol. 2017, 121, 339–375. [Google Scholar] [CrossRef] [Green Version]
- Hopkins, B.R.; Sepil, I.; Bonham, S.; Miller, T.; Charles, P.D.; Fischer, R.; Kessler, B.M.; Wilson, C.; Wigby, S. BMP signaling inhibition in Drosophila secondary cells remodels the seminal proteome and self and rival ejaculate functions. Proc. Natl. Acad. Sci. USA 2019, 116, 24719–24728. [Google Scholar] [CrossRef] [Green Version]
- Cassar, M.; Sunderhaus, E.; Wentzell, J.S.; Kuntz, S.; Strauss, R.; Kretzschmar, D. The PKA-C3 catalytic subunit is required in two pairs of interneurons for successful mating of Drosophila. Sci. Rep. 2018, 8, 2458. [Google Scholar] [CrossRef] [Green Version]
- Bettencourt da Cruz, A.B.; Wentzell, J.; Kretzschmar, D. Swiss Cheese, a protein involved in progressive neurodegeneration, acts as a noncanonical regulatory subunit for PKA-C3. J. Neurosci. 2008, 28, 10885–10892. [Google Scholar] [CrossRef] [PubMed]
- Zoller, R.; Schulz, C. The Drosophila cyst stem cell lineage: Partners behind the scenes? Spermatogenesis 2012, 2, 145–157. [Google Scholar] [CrossRef] [PubMed] [Green Version]
- Kiger, A.A.; White-Cooper, H.; Fuller, M.T. Somatic support cells restrict germline stem cell self-renewal and promote differentiation. Nature 2000, 407, 750–754. [Google Scholar] [CrossRef]
- Tran, J.; Brenner, T.J.; DiNardo, S. Somatic control over the germline stem cell lineage during Drosophila spermatogenesis. Nature 2000, 407, 754–757. [Google Scholar] [CrossRef]
- Schulz, C.; Wood, C.G.; Jones, D.L.; Tazuke, S.I.; Fuller, M.T. Signaling from germ cells mediated by the rhomboid homolog stet organizes encapsulation by somatic support cells. Development 2002, 129, 4523–4534. [Google Scholar] [CrossRef] [PubMed]
- Hudson, A.G.; Parrott, B.B.; Qian, Y.; Schulz, C. A temporal signature of epidermal growth factor signaling regulates the differentiation of germline cells in testes of Drosophila melanogaster. PLoS ONE 2013, 8, e70678. [Google Scholar] [CrossRef] [Green Version]
- Gorga, A.; Rindone, G.M.; Regueira, M.; Pellizzari, E.H.; Camberos, M.D.C.; Cigorraga, S.B.; Riera, M.F.; Galardo, M.N.; Meroni, S.B. PPARγ activation regulates lipid droplet formation and lactate production in rat Sertoli cells. Cell Tissue Res. 2017, 369, 611–624. [Google Scholar] [CrossRef]
- Demarco, R.S.; Uyemura, B.S.; D’Alterio, C.; Jones, D.L. Mitochondrial fusion regulates lipid homeostasis and stem cell maintenance in the Drosophila testis. Nat. Cell Biol. 2019, 21, 710–720. [Google Scholar] [CrossRef]
- Wang, H.; Wang, H.; Xiong, W.; Chen, Y.; Ma, Q.; Ma, J.; Ge, Y.; Han, D. Evaluation on the phagocytosis of apoptotic spermatogenic cells by Sertoli cells in vitro through detecting lipid droplet formation by Oil Red O staining. Reproduction 2006, 132, 485–492. [Google Scholar] [CrossRef] [PubMed] [Green Version]
- Kishta, O.; Adeeko, A.; Li, D.; Luu, T.; Brawer, J.R.; Morales, C.; Hermo, L.; Robaire, B.; Hales, B.F.; Barthelemy, J.; et al. In utero exposure to tributyltin chloride differentially alters male and female fetal gonad morphology and gene expression profiles in the Sprague-Dawley rat. Reprod. Toxicol. 2007, 23, 1–11. [Google Scholar] [CrossRef] [Green Version]
- Furland, N.E.; Luquez, J.M.; Oresti, G.M.; Aveldaño, M.I. Mild testicular hyperthermia transiently increases lipid droplet accumulation and modifies sphingolipid and glycerophospholipid acyl chains in the rat testis. Lipids 2011, 46, 443–454. [Google Scholar] [CrossRef]
- Ahmed, N.; Liu, Y.; Chen, H.; Yang, P.; Waqas, Y.; Liu, T.; Gandahi, J.A.; Huang, Y.; Wang, L.; Song, X.; et al. Novel cellular evidence of lipophagy within the Sertoli cells during spermatogenesis in the turtle. Aging (Albany NY) 2017, 9, 41. [Google Scholar] [CrossRef] [Green Version]
- Regueira, M.; Gorga, A.; Rindone, G.M.; Pellizzari, E.H.; Cigorraga, S.B.; Galardo, M.N.; Riera, M.F.; Meroni, S.B. Apoptotic germ cells regulate Sertoli cell lipid storage and fatty acid oxidation. Reproduction 2018, 156, 515–525. [Google Scholar] [CrossRef] [Green Version]
- Chen, H.; Huang, Y.; Yang, P.; Shi, Y.; Ahmed, N.; Liu, T.; Bai, X.; Haseeb, A.; Chen, Q. Autophagy enhances lipid droplet development during spermiogenesis in Chinese soft-shelled turtle, Pelodiscus sinensis. Theriogenology 2020, 147, 154–165. [Google Scholar] [CrossRef]
- Bazan, N.G. Lipid signaling in neural plasticity, brain repair, and neuroprotection. Mol. Neurobiol. 2005, 32, 89–103. [Google Scholar] [CrossRef]
- Das, U.N. Essential fatty acids—A review. Curr. Pharm. Biotechnol. 2006, 7, 467–482. [Google Scholar] [CrossRef] [PubMed]
- Das, U.N. Essential fatty acids: Biochemistry, physiology and pathology. Biotechnol. J. 2006, 1, 420–439. [Google Scholar] [CrossRef]
- Chang, C.Y.; Ke, D.S.; Chen, J.Y. Essential fatty acids and human brain. Acta Neurol. Taiwan 2009, 18, 231–241. [Google Scholar]
- Paillamanque, J.; Sanchez-Tusie, A.; Carmona, E.M.; Treviño, C.L.; Sandoval, C.; Nualart, F.; Osses, N.; Reyes, J.G. Arachidonic acid triggers [Ca2+] i increases in rat round spermatids by a likely GPR activation, ERK signalling and ER/acidic compartments Ca2+ release. PLoS ONE 2017, 12, e0172128. [Google Scholar] [CrossRef] [PubMed]
- Cerolini, S.; Kelso, K.A.; Noble, R.C.; Speake, B.K.; Pizzi, F.; Cavalchini, L.G. Relationship between spermatozoan lipid composition and fertility during aging of chickens. Biol. Reprod. 1997, 57, 976–980. [Google Scholar] [CrossRef] [PubMed] [Green Version]
- Lenzi, A.; Gandini, L.; Maresca, V.; Rago, R.; Sgro, P.; Dondero, F.; Picardo, M. Fatty acid composition of spermatozoa and immature germ cells. Mol. Hum. Reprod. 2000, 6, 226–231. [Google Scholar] [CrossRef] [Green Version]
- Retterstol, K.; Haugen, T.B.; Tran, T.N.; Christophersen, B.O. Studies on the metabolism of essential fatty acids in isolated human testicular cells. Reproduction 2001, 121, 881–887. [Google Scholar] [CrossRef]
- Jung, A.; Hollmann, M.; Schäfer, M.A. The fatty acid elongase NOA is necessary for viability and has a somatic role in Drosophila sperm development. J. Cell Sci. 2007, 120, 2924–2934. [Google Scholar] [CrossRef] [Green Version]
- Szafer-Glusman, E.; Giansanti, M.G.; Nishihama, R.; Bolival, B.; Pringle, J.; Gatti, M.; Fuller, M.T. A role for very-long-chain fatty acids in furrow ingression during cytokinesis in Drosophila spermatocytes. Curr. Biol. 2008, 18, 1426–1431. [Google Scholar] [CrossRef] [Green Version]
- Roqueta-Rivera, M.; Stroud, C.K.; Haschek, W.M.; Akare, S.J.; Segre, M.; Brush, R.S.; Agbaga, M.P.; Anderson, R.E.; Hess, R.A.; Nakamura, M.T. Docosahexaenoic acid supplementation fully restores fertility and spermatogenesis in male delta-6 desaturase-null mice. J. Lipid Res. 2010, 51, 360–367. [Google Scholar] [CrossRef] [PubMed] [Green Version]
- Cattaneo, E.R.; Pellon-Maison, M.; Rabassa, M.E.; Lacunza, E.; Coleman, R.A.; Gonzalez-Baro, M.R. Glycerol-3-phosphate acyltransferase-2 is expressed in spermatic germ cells and incorporates arachidonic acid into triacylglycerols. PLoS ONE 2012, 7, e42986. [Google Scholar] [CrossRef] [Green Version]
- DelBarco-Trillo, J.; Mateo, R.; Roldan, E.R. Differences in the fatty-acid composition of rodent spermatozoa are associated to levels of sperm competition. Biol. Open 2015, 4, 466–473. [Google Scholar] [CrossRef] [PubMed] [Green Version]
- Andersen, J.M.; Rønning, P.O.; Herning, H.; Bekken, S.D.; Haugen, T.B.; Witczak, O. Fatty acid composition of spermatozoa is associated with BMI and with semen quality. Andrology 2016, 4, 857–865. [Google Scholar] [CrossRef] [PubMed] [Green Version]
- Hale, B.J.; Fernandez, R.F.; Kim, S.Q.; Diaz, V.D.; Jackson, S.N.; Liu, L.; Brenna, J.T.; Hermann, B.P.; Geyer, C.B.; Ellis, J.M. Acyl-CoA synthetase 6 enriches seminiferous tubules with the ω-3 fatty acid docosahexaenoic acid and is required for male fertility in the mouse. J. Biol. Chem. 2019, 294, 14394–14405. [Google Scholar] [CrossRef]
- Stoffel, W.; Schmidt-Soltau, I.; Binczek, E.; Thomas, A.; Thevis, M.; Wegner, I. Dietary ω3-and ω6-Polyunsaturated fatty acids reconstitute fertility of Juvenile and adult Fads2-Deficient mice. Mol. Metab. 2020, 36, 100974. [Google Scholar] [CrossRef] [PubMed]
- Bogevik, A.S.; Hayman, E.S.; Bjerke, M.T.; Dessen, J.E.; Rørvik, K.A.; Luckenbach, J.A. Phospholipid and LC-PUFA metabolism in Atlantic salmon (Salmo salar) testes during sexual maturation. PLoS ONE 2020, 15, e0233322. [Google Scholar] [CrossRef]
- Glander, H.J.; Schiller, J.; Süss, R.; Paasch, U.; Grunewald, S.; Arnhold, J. Deterioration of spermatozoal plasma membrane is associated with an increase of sperm lyso-phosphatidylcholines. Andrologia 2002, 34, 360–366. [Google Scholar] [CrossRef] [PubMed]
- Pyttel, S.; Zschörnig, K.; Nimptsch, A.; Paasch, U.; Schiller, J. Enhanced lysophosphatidylcholine and sphingomyelin contents are characteristic of spermatozoa from obese men—A MALDI mass spectrometric study. Chem. Phys. Lipids 2012, 165, 861–865. [Google Scholar] [CrossRef]
- Nimptsch, A.; Pyttel, S.; Paasch, U.; Mohr, C.; Heinrich, J.M.; Schiller, J. A MALDI MS investigation of the lysophosphatidylcholine/phosphatidylcholine ratio in human spermatozoa and erythrocytes as a useful fertility marker. Lipids 2014, 49, 287–293. [Google Scholar] [CrossRef] [PubMed]
- Law, S.H.; Chan, M.L.; Marathe, G.K.; Parveen, F.; Chen, C.H.; Ke, L.Y. An updated review of lysophosphatidylcholine metabolism in human diseases. Int. J. Mol. Sci. 2019, 20, 1149. [Google Scholar] [CrossRef] [Green Version]
- Pyttel, S.; Nimptsch, A.; Böttger, J.; Zschörnig, K.; Jakop, U.; Wegener, J.; Müller, K.; Paasch, U.; Schiller, J. Changes of murine sperm phospholipid composition during epididymal maturation determined by MALDI-TOF mass spectrometry. Theriogenology 2014, 82, 396–402. [Google Scholar] [CrossRef] [PubMed]
- Escoffier, J.; Jemel, I.; Tanemoto, A.; Taketomi, Y.; Payre, C.; Coatrieux, C.; Sato, H.; Yamamoto, K.; Masuda, S.; Pernet–Gallay, K.; et al. Group X phospholipase A 2 is released during sperm acrosome reaction and controls fertility outcome in mice. J. Clin. Investig. 2010, 120, 1415–1428. [Google Scholar] [CrossRef] [PubMed] [Green Version]
- Tan, S.T.; Ramesh, T.; Toh, X.R.; Nguyen, L.N. Emerging roles of lysophospholipids in health and disease. Prog. Lipid Res. 2020, 80, 101068. [Google Scholar] [CrossRef] [PubMed]
- Van der Veen, J.N.; Kennelly, J.P.; Wan, S.; Vance, J.E.; Vance, D.E.; Jacobs, R.L. The critical role of phosphatidylcholine and phosphatidylethanolamine metabolism in health and disease. Biochim. Biophys. Acta Biomembr. 2017, 1859, 1558–1572. [Google Scholar] [CrossRef] [PubMed]
- Melentev, P.A.; Agranovich, O.E.; Sarantseva, S.V. Human diseases associated with NTE gene. Ecol. Genet. 2020, 18, 229–242. [Google Scholar] [CrossRef]


Publisher’s Note: MDPI stays neutral with regard to jurisdictional claims in published maps and institutional affiliations. |
© 2021 by the authors. Licensee MDPI, Basel, Switzerland. This article is an open access article distributed under the terms and conditions of the Creative Commons Attribution (CC BY) license (https://creativecommons.org/licenses/by/4.0/).
Share and Cite
Melentev, P.A.; Sharapenkov, E.G.; Surina, N.V.; Ivanova, E.A.; Ryabova, E.V.; Sarantseva, S.V. Drosophila Lysophospholipase Gene swiss cheese Is Required for Survival and Reproduction. Insects 2022, 13, 14. https://doi.org/10.3390/insects13010014
Melentev PA, Sharapenkov EG, Surina NV, Ivanova EA, Ryabova EV, Sarantseva SV. Drosophila Lysophospholipase Gene swiss cheese Is Required for Survival and Reproduction. Insects. 2022; 13(1):14. https://doi.org/10.3390/insects13010014
Chicago/Turabian StyleMelentev, Pavel A., Eduard G. Sharapenkov, Nina V. Surina, Ekaterina A. Ivanova, Elena V. Ryabova, and Svetlana V. Sarantseva. 2022. "Drosophila Lysophospholipase Gene swiss cheese Is Required for Survival and Reproduction" Insects 13, no. 1: 14. https://doi.org/10.3390/insects13010014