2. Do Discriminating Doses Accurately Detect Resistance in Different Pyrethroids?
Current methods for monitoring insecticide resistance are based on classifying phenotypic resistance, which is typically measured using standardised tests, such as WHO susceptibility bioassays [
4] and CDC bottle assays [
5]. These tests expose mosquito populations (wild-collected females or those reared from collected larvae) to predefined “discriminating doses” (DDs) of an insecticide, and record mosquito knockdown and mortality at defined times postexposure. A DD is defined by WHO [
4] as “a concentration of an insecticide that, in a standard period of exposure, is used to discriminate the proportions of susceptible and resistant phenotypes in a sample of a mosquito population”. It is calculated by establishing a dose response in susceptible mosquitoes, and then calculating either “twice the lowest concentration that gave systematically 100% mortality (i.e., LC
100)” or “twice the LC
99 values” estimated from this baseline susceptibility testing. Under- or overestimation of discriminating doses could have an impact on the accurate detection of insecticide resistance in wild populations, and misclassification of lab strains.
In 2016, following increasing evidence of the limitations of discriminating dose assays [
6,
7], the WHO updated their monitoring guidance to include additional testing of resistant populations at 5× and 10× DDs to provide further information on the intensity or “strength” of phenotypic resistance [
4].
The current WHO DDs for
Anopheles for deltamethrin (0.05%) and permethrin (0.75%) were established, along with other pyrethroids, through an international multicentre study in 1998 [
8]. Some other pyrethroids, including α-cypermethrin, were not included in this original study; the α-cypermethrin recommended DD (0.05%) is tentative, and currently under validation by the WHO in a new multicentre study [
9]. The 1998 study exposed known insecticide-“susceptible” strains of
Anopheles albimanus,
Anopheles gambiae, and
Anopheles stephensi to up to five different concentrations of each insecticide using WHO tube bioassays. Mortality postexposure was then analysed using Probit regression to establish a single lethal dose for all
Anopheles species for each compound, which was doubled to give the DDs that are still recommended today.
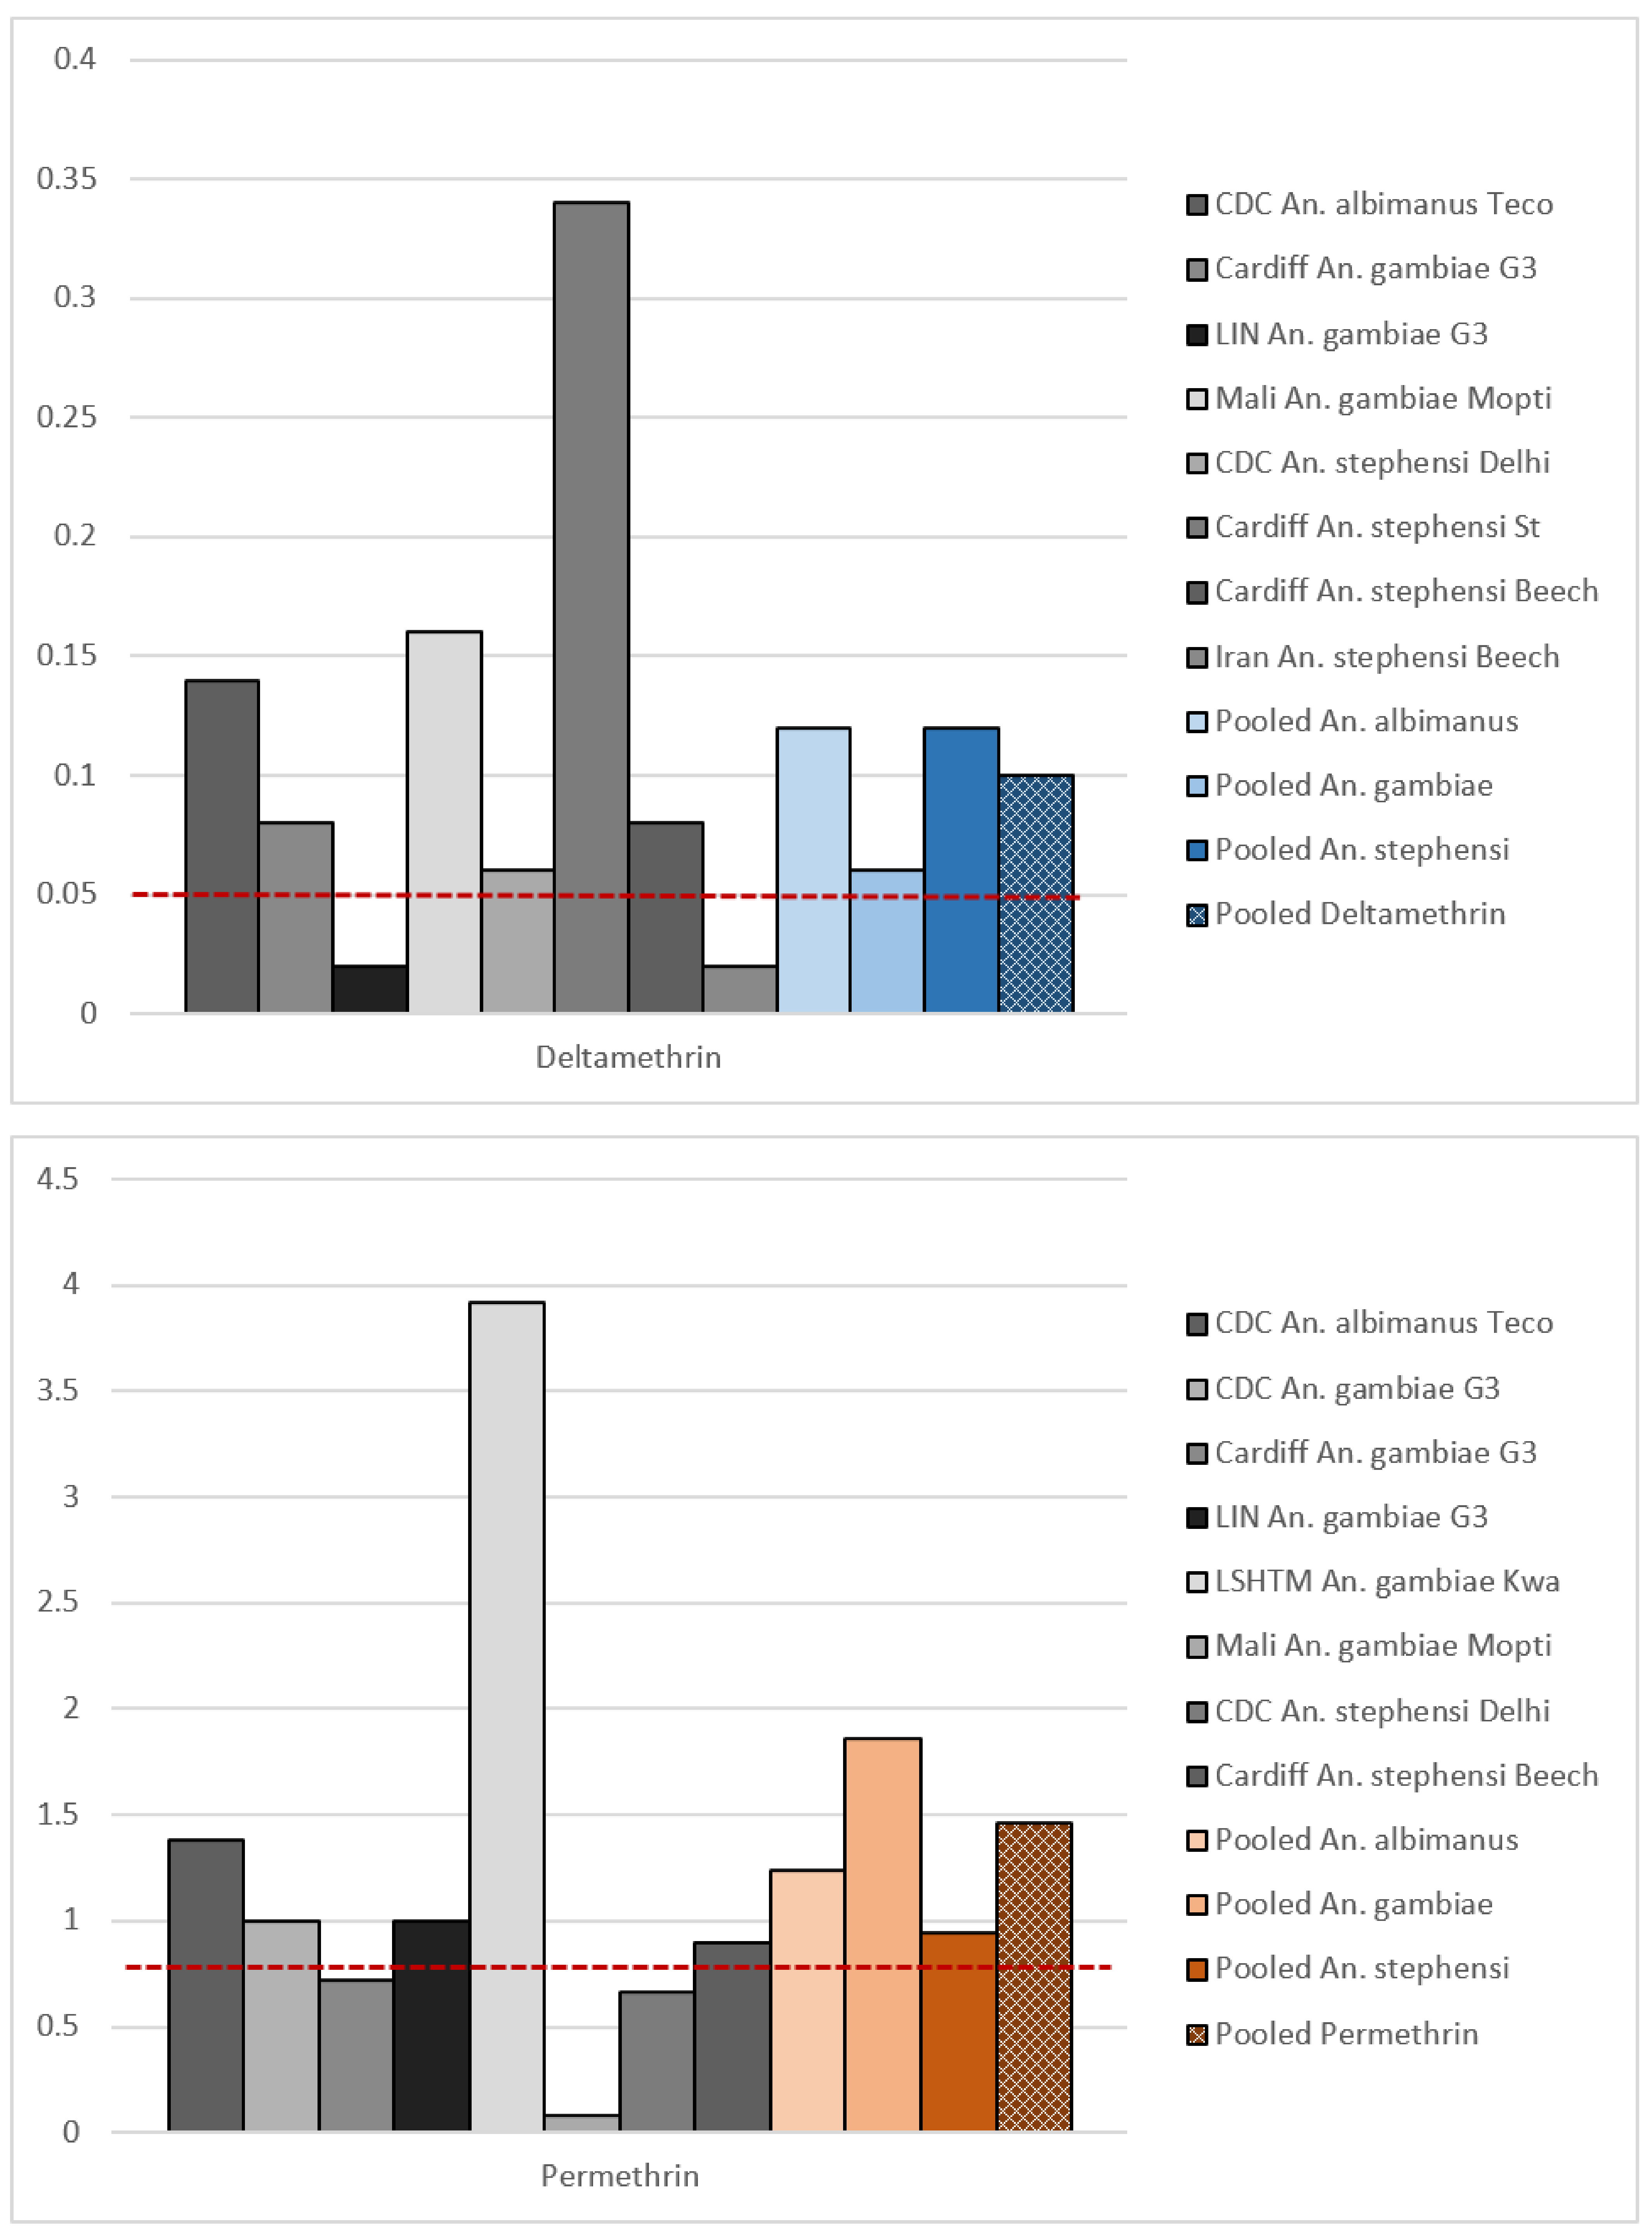
In this review, we reanalysed the publicly available data from the 1998 study to establish if the recommended DDs are suitable and comparable. Using these data, we were unable to establish the LC100 for permethrin, since in one centre some mosquitoes survived the highest concentration tested (Mali, An. gambiae, Mopti strain, 1% permethrin, 99.2% mortality). For deltamethrin, data were incomplete (0.1% deltamethrin killed 100% of the exposed mosquitoes, but not all centres tested the 0.1% concentration against all strains).
We then used Probit analysis (PoloJR program within PoloSuite, Version 2.1) to obtain LD
99 values. The DDs calculated from this when all the data were pooled were 0.1% for deltamethrin and 1.46% for permethrin (
Figure 1,
Table 1), around double the final DDs recommended by the 1998 multicentre study [
8]. The concentrations tested in the original study did not produce a full range of mortality (i.e., 0–100%), which resulted in poorly fitting dose-response curves. Poorly fitting dose-response curves were also observed when strains and species were pooled separately (
Supplementary Material, Figure S1). In several cases, our Probit analysis could not calculate the lethal concentration for individual sites/strains or estimate meaningful confidence intervals around the LC values (
Supplementary Material, Table S1). Robust dose-response relationships were not observed, and in some study sites, mortality was never below 80% in the strain tested. The original selection of DDs was thus not well supported by the data.
Most centres within the study appeared to have diverged from the common protocol in terms of sample size and replicates tested. In the original protocol, 2–3 replicates of 100 mosquitoes (200–300 mosquitoes) should have been tested per insecticide concentration. However, at some study sites,
n < 25 mosquitoes per concentration were tested. Mosquitoes were tested at 1—3 days old, whereas current guidelines state 3–5-day-old mosquitoes should be used [
4]. This may have influenced results, particularly in 1-day-olds, as their cuticles may not have hardened [
10].
In the original report, there are a lack of raw data, and it is not clear which data were used in proposing the final doses. The report states that more weight was given to studies in which mortalities were clustered around similar values; however, which analyses were weighted or the methodology for weighting was not specified. It is therefore not possible to establish why the WHO-recommended DDs differed from the ones calculated in this review. Given the unclear rationale for the DDs recommended for permethrin and deltamethrin, and that the data used to calculate them were unclear, their comparability is questionable. The DDs of these pyrethroids were not calibrated against one another, and the assay was not designed to compare compounds, but to monitor for resistance to each independently. This was a challenge when trying to draw reliable conclusions about the relative efficacy of, or resistance to, these two pyrethroids based on data collected using these DDs.
4. What Intrinsic Variability Do We See from Dose-Response Assays in the Lab?
Discriminating dose bioassays are routinely used to detect and monitor insecticide resistance in mosquito populations. When conducted in well-controlled lab settings, factors such as temperature, humidity, and mosquito rearing are standardised to minimise their effects on mosquito mortality. Examining repeated measurements taken in these settings, with as many variables as possible controlled, allowed us to investigate what intrinsic variability stemmed from the assay itself.
In this review, we collated and analysed discriminating dose data from the Liverpool Insecticide Testing Establishment (LITE) and Vector Biology Department at the Liverpool School of Tropical Medicine (LSTM). The Anopheles mosquito colonies maintained by each group are profiled at least annually using standard WHO susceptibility tests. Additionally, each group applies deltamethrin selection to resistant strains every 3–5 generations to maintain pyrethroid resistance (i.e., mosquitoes are exposed to deltamethrin using standardised procedures, and survivors are used to maintain the colony). In most instances, this selection follows the same protocol as the WHO susceptibility test (exposure to 0.05% deltamethrin for 1 h). Additionally, when testing novel or repurposed chemistries, a positive pyrethroid control is often used in experiments—overall, these studies represent a set of repeated bioassay (tube or bottle) measurements under uniform testing conditions and using the same mosquito colonies.
For each mosquito strain, the mortality data for profiling, selection, or other experiments were compiled. When colonies of a strain were held in both LITE and LSTM, these data were considered separately. For each strain/insecticide combination, summary statistics of mortality were calculated (the range, interquartile range, mean, median, variance, and standard deviation). A Welch’s
t-test was used to compare mean mosquito mortality following exposure to different pyrethroids, or the same pyrethroid in different assays. The analysis was conducted with R statistical software version 3.6.2 (12 December 2019) [
14].
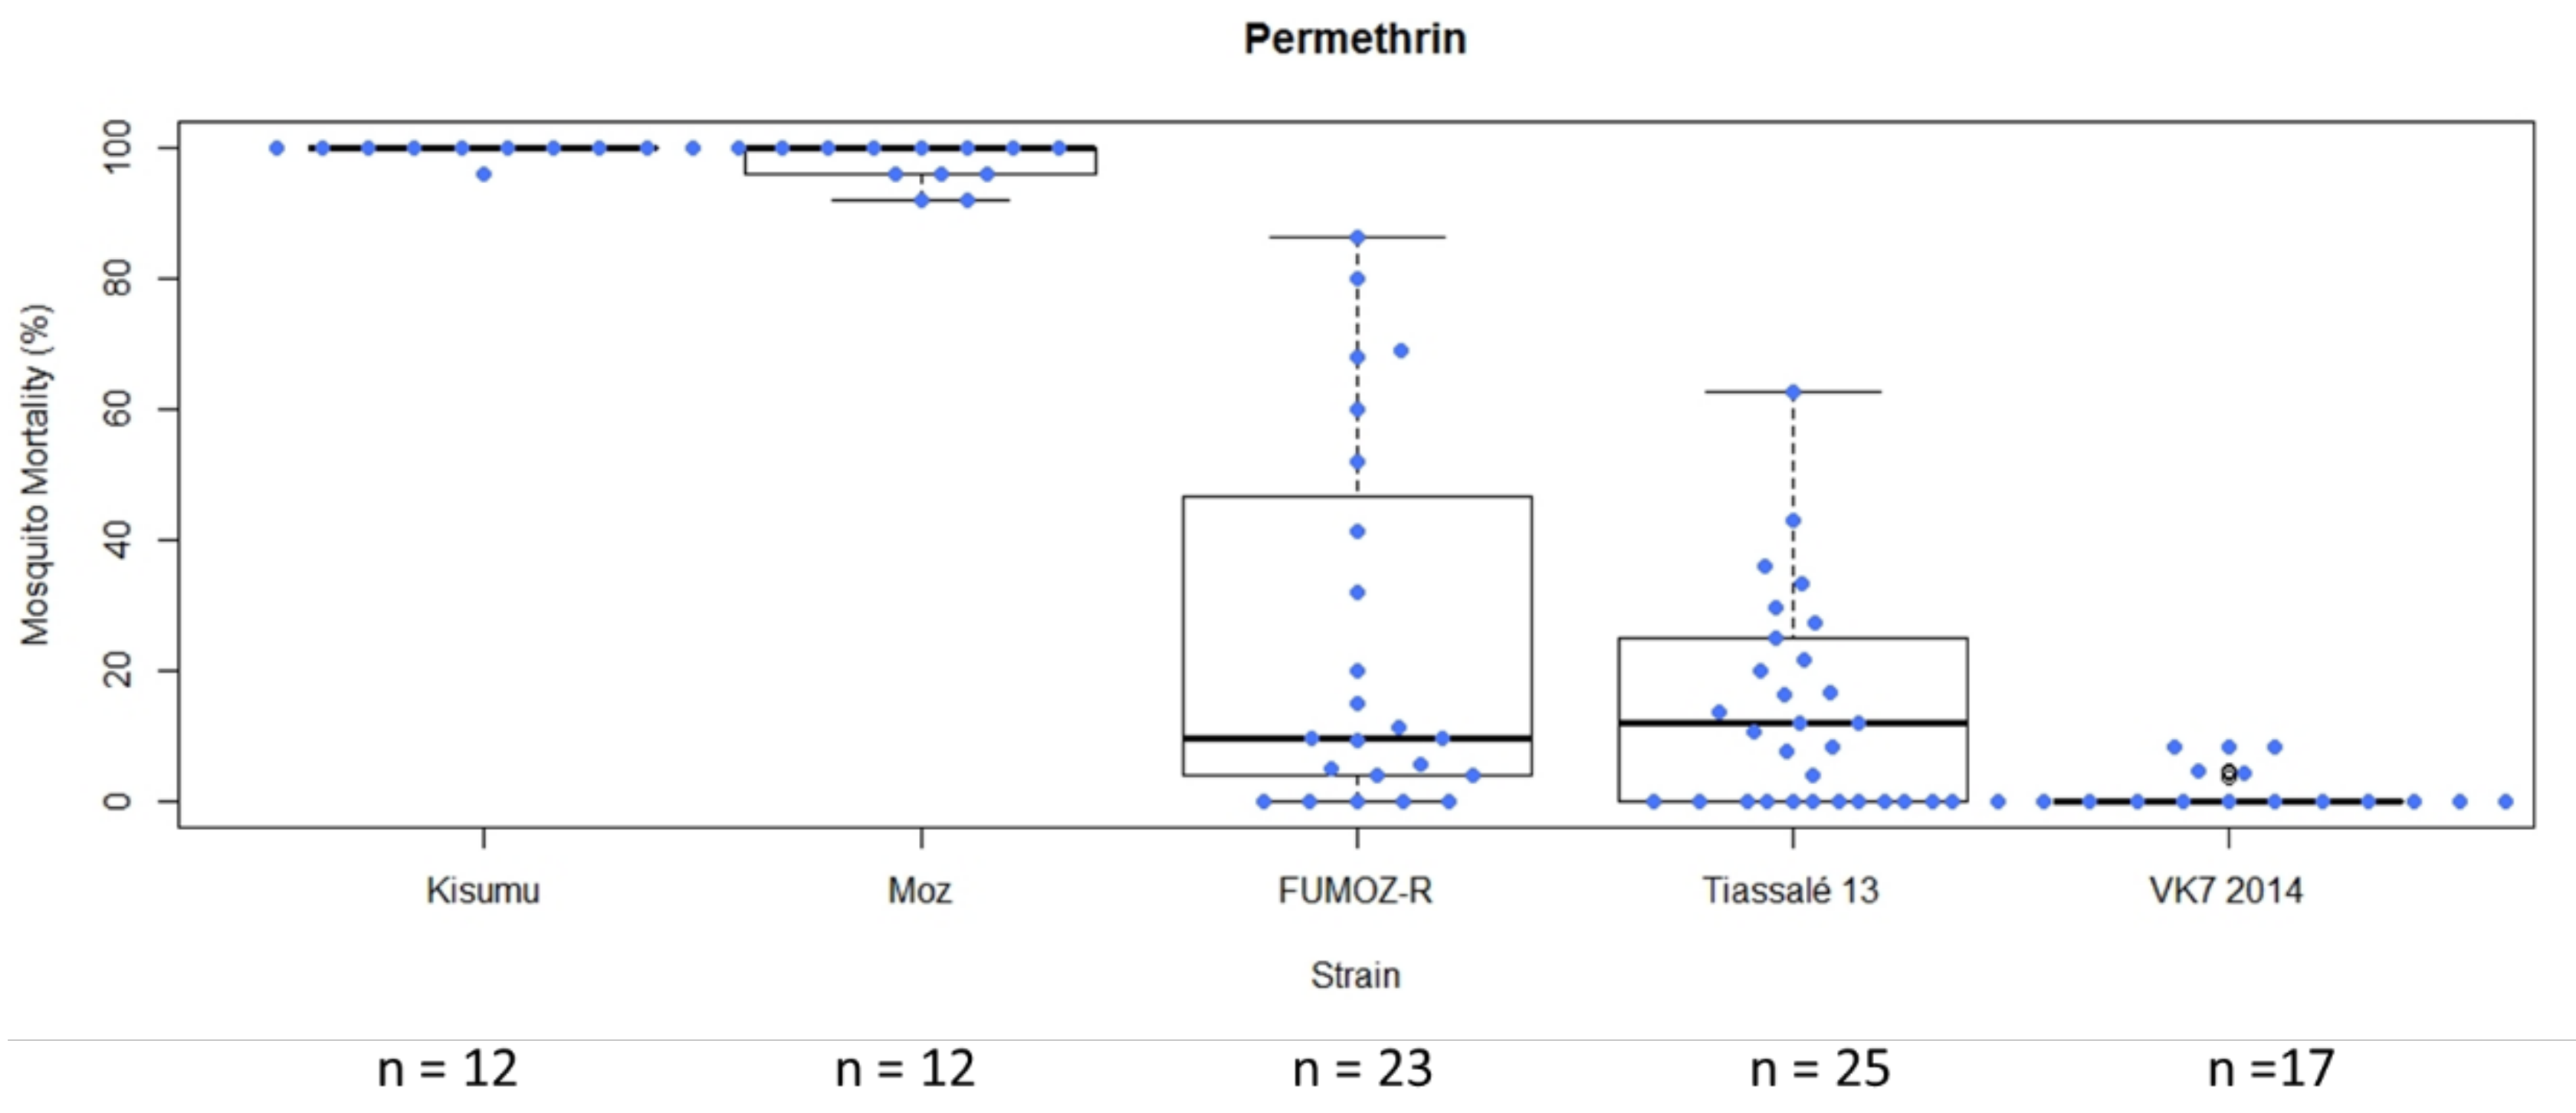
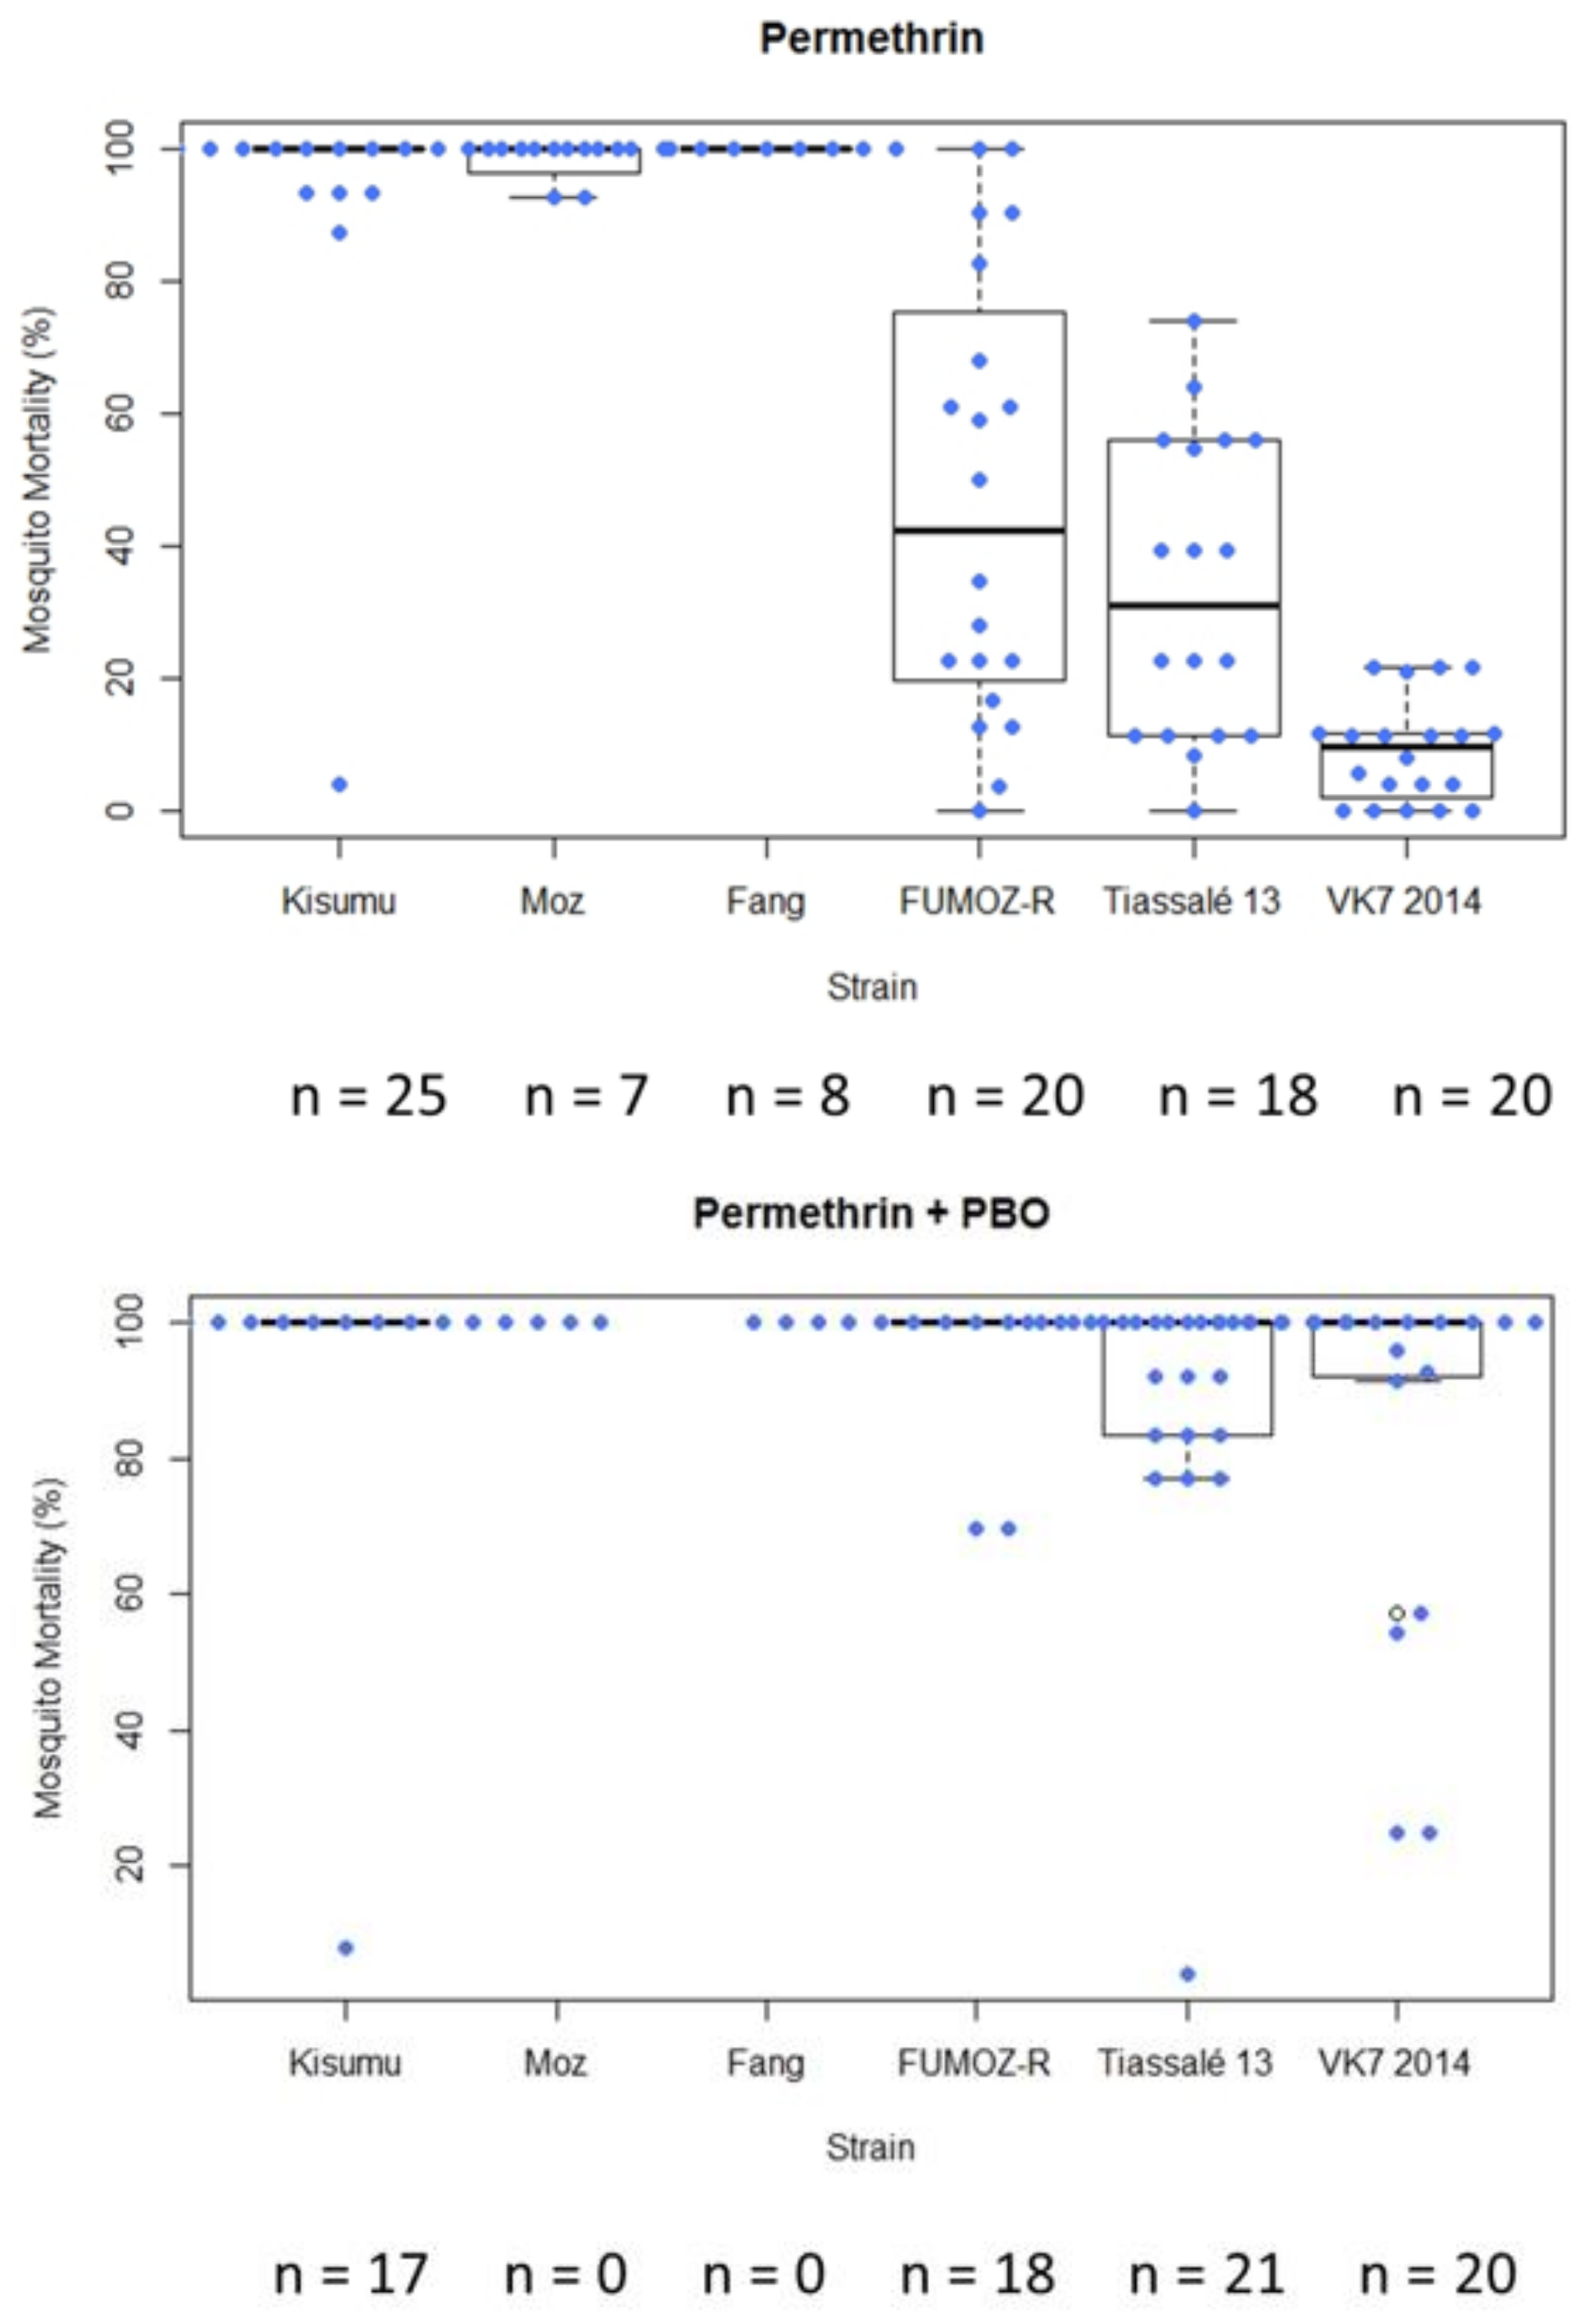
In general, following exposure of characterised lab strains in WHO tube bioassays under controlled conditions, the level of variability in mortality among test replicates exposed to a single compound was greater in moderately resistant strains (mean mortality > 15%) (
Figure 4). In this example, the standard deviation for FUMOZ-R (mean mortality 25.24%) following exposure to permethrin was 29.12, and for Tiassalé 13 (mean mortality 15.97%) it was 16.01. In instances in which insecticide/strain replicate numbers were lower (<10 replicates in some cases), variability was lower (
Supplementary Material, Table S2 and
Figure S5). Boxplots summarising mortality of all strains examined to all insecticides can be found in
Supplementary Material, Figures S6–S7.
In CDC bottle assays (with 0.00125 µg/bottle permethrin or 0.00125 µg/bottle permethrin + 400 µg/bottle piperonyl butoxide (PBO) simultaneously [
15]), greater variability in mortality was again observed in moderately resistant strains (mean mortality 15–80%) compared to highly resistant (mean mortality < 15%) or more susceptible strains (mean mortality > 80%) (
Figure 5). This was mirrored in the PBO treatments in which mortality was greatly increased in the resistant strains and the variability generally decreased (though there was still considerable heterogeneity in the more resistant strains). Further investigation is required to establish the inherent variability in PBO synergism assays, relative to DD bioassays.
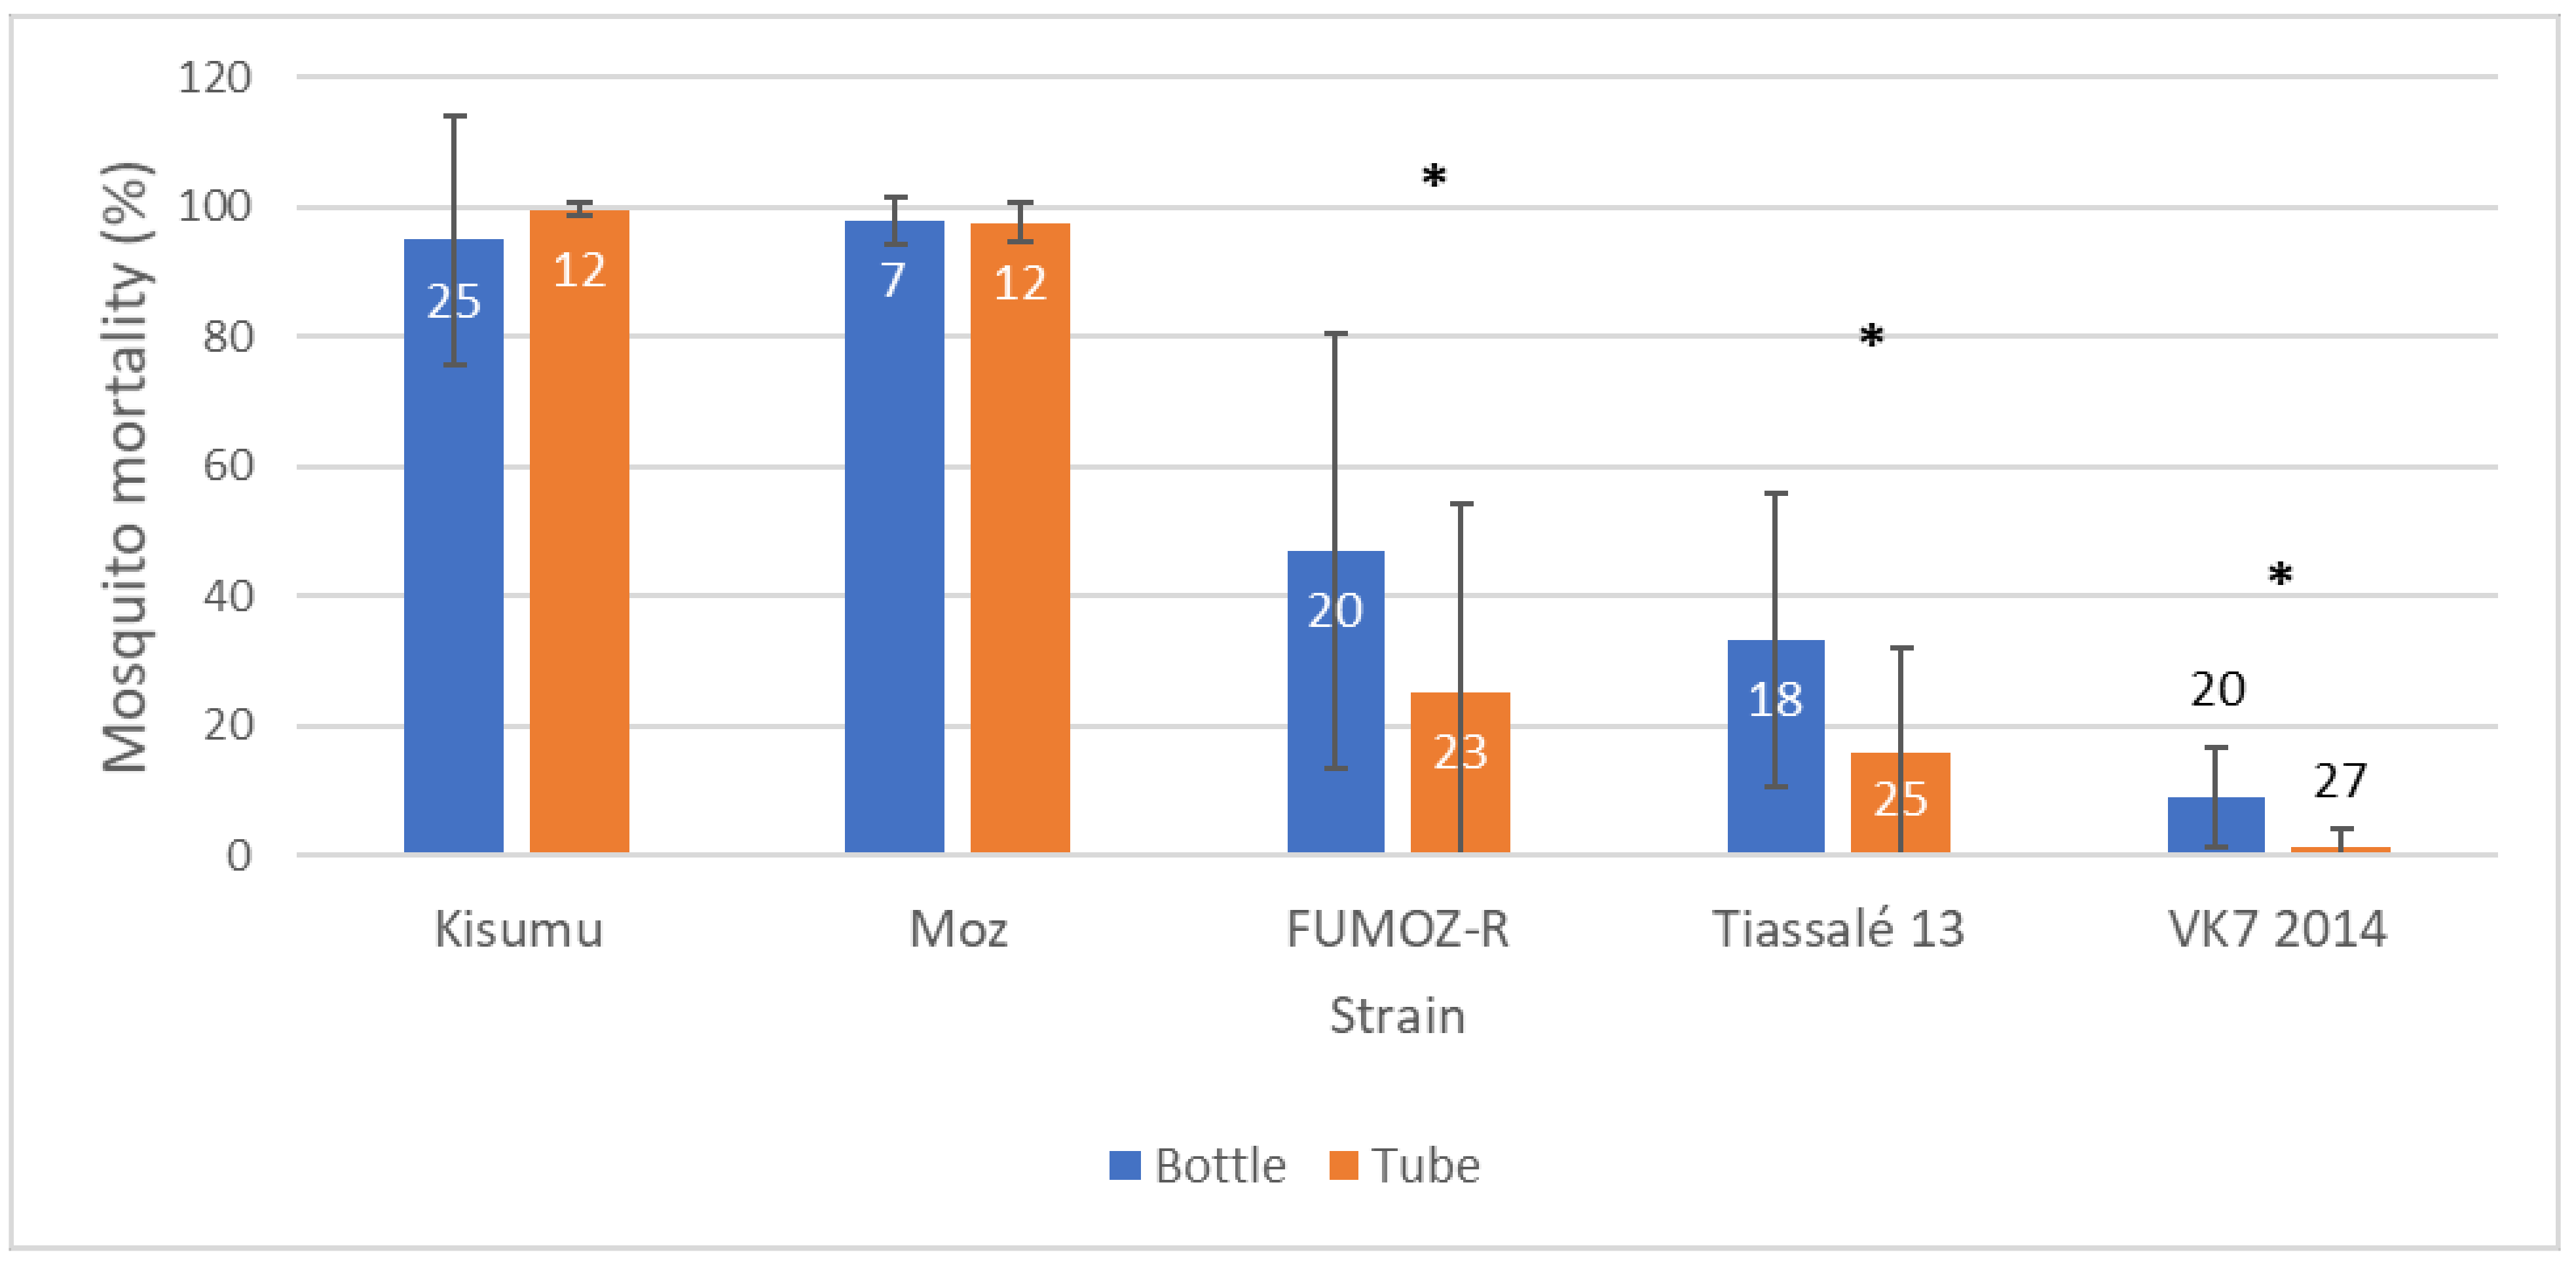
When comparing the two testing methods in resistant strains, both mean mortality and variability (standard deviation) in mortality were greater in the CDC bottle bioassay compared to the WHO tube test (in response to their respective discriminating doses), but comparable in susceptible strains (in which almost all mosquitoes died;
Figure 6). Previous studies have reported variability in comparability between WHO and CDC bioassay results [
16], suggesting reasonable interchangeability in identifying susceptible populations, but less so when substantial resistance is present [
7]. Dose-response experiments are perhaps more easily performed using bottles, but very high concentrations may prove difficult due to issues with solubility or crystallization of active ingredients [
17].
6. What Are Potential Sources of (Non-Resistance-Associated) Variability in the Discriminating Dose Bioassay?
The WHO [
4] gives precise parameters for some of the key environmental conditions that should be established when carrying out bioassays. Poor larval rearing conditions (e.g., crowding and/or low food) can have extreme effects on bioassay results [
19], but these are relatively easy to control under standard insectary conditions. Nevertheless, details of the rearing conditions employed are often scant in reports of bioassay data, and expanded descriptions would help to assess whether this may be an important source of variability. Time-of-day effects on bioassay results do not seem to be well-explored in the literature, but circadian rhythmicity of many detoxification genes suggest that mosquitoes tested at night may not show the same resistance patterns as those tested during the day [
20,
21]. This may be significant for the operational interpretation of results, considering that African
Anopheles typically bite at night. However, this is unlikely to be a major source of variability affecting bioassay data, since tests are typically performed during daytime hours. Nevertheless, reporting of testing times along with bioassay results would be a good practice to adopt more widely.
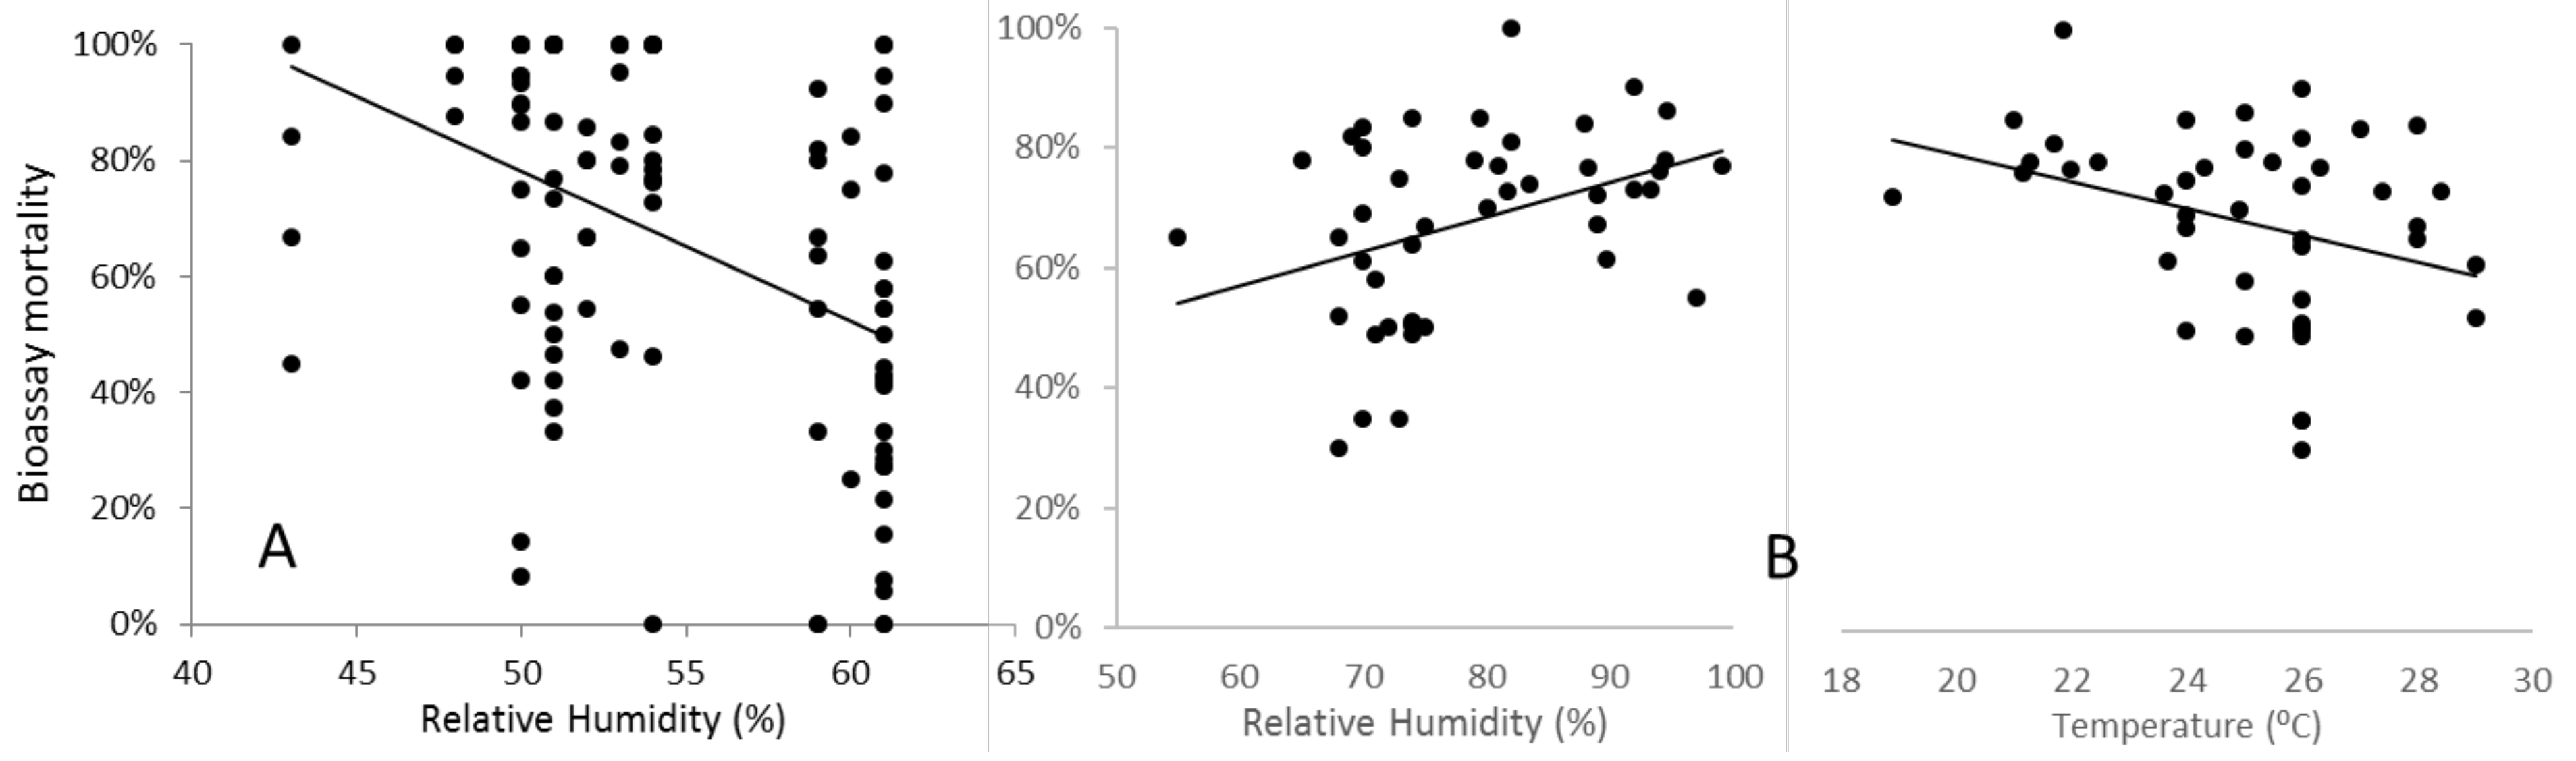
In contrast, under field conditions, WHO-specified temperature and relative humidity are often difficult to achieve and maintain, and the effects of variation can be highly significant. As part of a genomewide association study with sampling and testing conducted in a field insectary in Uganda that lacked environmental controls, Weetman et al. (2018) detected a strong and highly statistically significant decline in
An. gambiae mortality as humidity increased (
Figure 8A). In this study, temperature also varied, but did not independently account for the statistically significant variation in mortality. In the WHO-IIR (impacts of insecticide resistance multicentre trial), temporal repeatability of results from sentinel sites in Sudan was poor [
22], and a significant contributory factor may have been variability in temperature and relative humidity, which correlated strongly (
Figure 8B). As temperature and humidity decreased, mortality increased at the discriminating dose in pyrethroid bioassays with the
An. arabiensis tested. Interestingly, this was the opposite directionality to that observed in Ugandan
An. gambiae, and may reflect the differences in aridity tolerance between the species [
23]. Significant, but inconsistent, effects of temperature on bioassay mortality have also been reported among laboratory colonies of
An. stephensi [
24],
An. arabiensis, and
An. funestus [
25]. Whether or not the contrast in the direction of effects of humidity and temperature between studies reflects differential physiological adaptations of the species studied, such variability highlights the difficulty in predicting and statistically controlling for temperature and humidity effects. Indeed, these may depend quantitatively on the humidity–temperature optimum-tolerance profiles of the population tested. Nevertheless, studies should record and report these variables accurately, so that caveats can be applied when concluding datasets obtained under differing ambient conditions.
The age of mosquitoes tested is also an important consideration, and multiple studies have shown that mortality in pyrethroid bioassays performed on
An. gambiae,
An. coluzzii, and
An. arabiensis increases with mosquito age [
27,
28,
29,
30,
31]. However, this pattern may not be universally true across insecticides and resistance mechanisms. Recent work on pirimiphos-methyl-resistant
An. gambiae from Ghana, in which resistance is strongly determined by combinations of target site mutations, showed no differential trend in mortality over ages spanning 3–15 days [
32]. However, provided mosquitoes were reared in the laboratory from larvae or eggs, we are not aware of any results from bioassays that showed decreases in mortality with age. With a preference to test the least-susceptible age group in insecticide bioassays, this argues for the current approach of targeting young (but at least 2-day-old) adults.
Physiological conditions of females, not directly related to age, may play a less predictable role in variation in bioassay mortality. The effect of blood feeding has been primarily studied in laboratory strains of
An. arabiensis or
An. funestus, in which a moderate and transient reduction in permethrin and deltamethrin mortality after a single blood meal was detected [
33,
34]. These findings have recently been replicated with field-collected samples of
An. gambiae from Kenya [
31]. The proposed mechanism for this is the upregulation of a vast number of detoxification genes in response to the oxidative stress caused by the intake of blood by female mosquitoes [
35]. The magnitude of effect appeared to be dramatically greater if multiple blood meals were taken before insecticide exposure (up to 60% reduction in mortality for permethrin and deltamethrin, even in 21-day-old females) [
34]. Further studies on the same strains showed that multiple bloodmeals appeared to be linked to a sustained enhancement in the ability to defend against oxidative stress, a common toxic effect of pyrethroid exposure [
36]. Repeated sublethal prior insecticide exposures might have a similar effect, but results to date are inconclusive [
27], possibly because of the conflicting effects of priming via enzyme induction from insecticide pre-exposure, and delayed effects of sublethal exposures on mortality [
37]. In the absence of additional studies, the ubiquity and magnitude of the effects of repeated sublethal insecticide exposure, and more concerningly, repeated blood feeding, are difficult to predict, but suggest that in combination with the more estimable age effects, performing bioassays on adult females caught directly from the wild may provide highly variable or even biased results.
A common feature of most published works describing bioassay data is a relatively poor description of the sampling methodology, which is usually performed following an opportunistic plan. Generally, few details are provided to describe the range of collection sites, and often only a single GPS location is given, which can probably be assumed to represent an approximate central point for sites contained within a polygon of unknown size [
38]. For comparative studies involving bioassay data, this is problematic because: (a) chances of repeatability are lowered by lack of collection detail, and (b) samples may lack independence as biological replicates, which may introduce bias or inflate statistical power. A priori, the predicted magnitude of this effect is expected to depend on the collection method employed. If adults are collected, they may be either tested directly (noting the inherent problems with testing adults with unknown variation in physiological status and age described above) or used to obtain eggs, which may be combined and reared for adult bioassays. Collected adults would typically be assumed not to be closely related; whilst if their eggs are used, the level of relatedness in the resultant sample would be expected to be roughly proportional to the number of families combined (assuming equal contributions from each). However, for the
An. gambiae complex, the most common method of obtaining samples involves collecting larvae from larval habitats, presenting a potentially significant, but unknown, likelihood of sampling siblings. A strategy of collecting from as many local larval habitats as possible might reasonably be expected to ameliorate this problem to some extent. Yet, to our knowledge, there has been no previous study examining relatedness levels in collections made following any of the above collection strategies. As part of genomewide association studies using bioassay-based insecticide-resistance phenotypes, larval samples were collected from Yaoundé, Cameroon, and Dodowa, Ghana in 2006 [
39], and adults from Tororo, Uganda in 2008, from which offspring were obtained for bioassay testing [
23]. Further samples were obtained from recently and long-established colonies at LSTM, and all samples were genotyped using a custom Illumina array. More recent collections were made from over 50 locations (each represented by several larval habitats within a radius of a maximum of a few kilometres, and often much less) across southern Ghana in 2016. Genomes of a random sample from each collection were sequenced at low coverage [
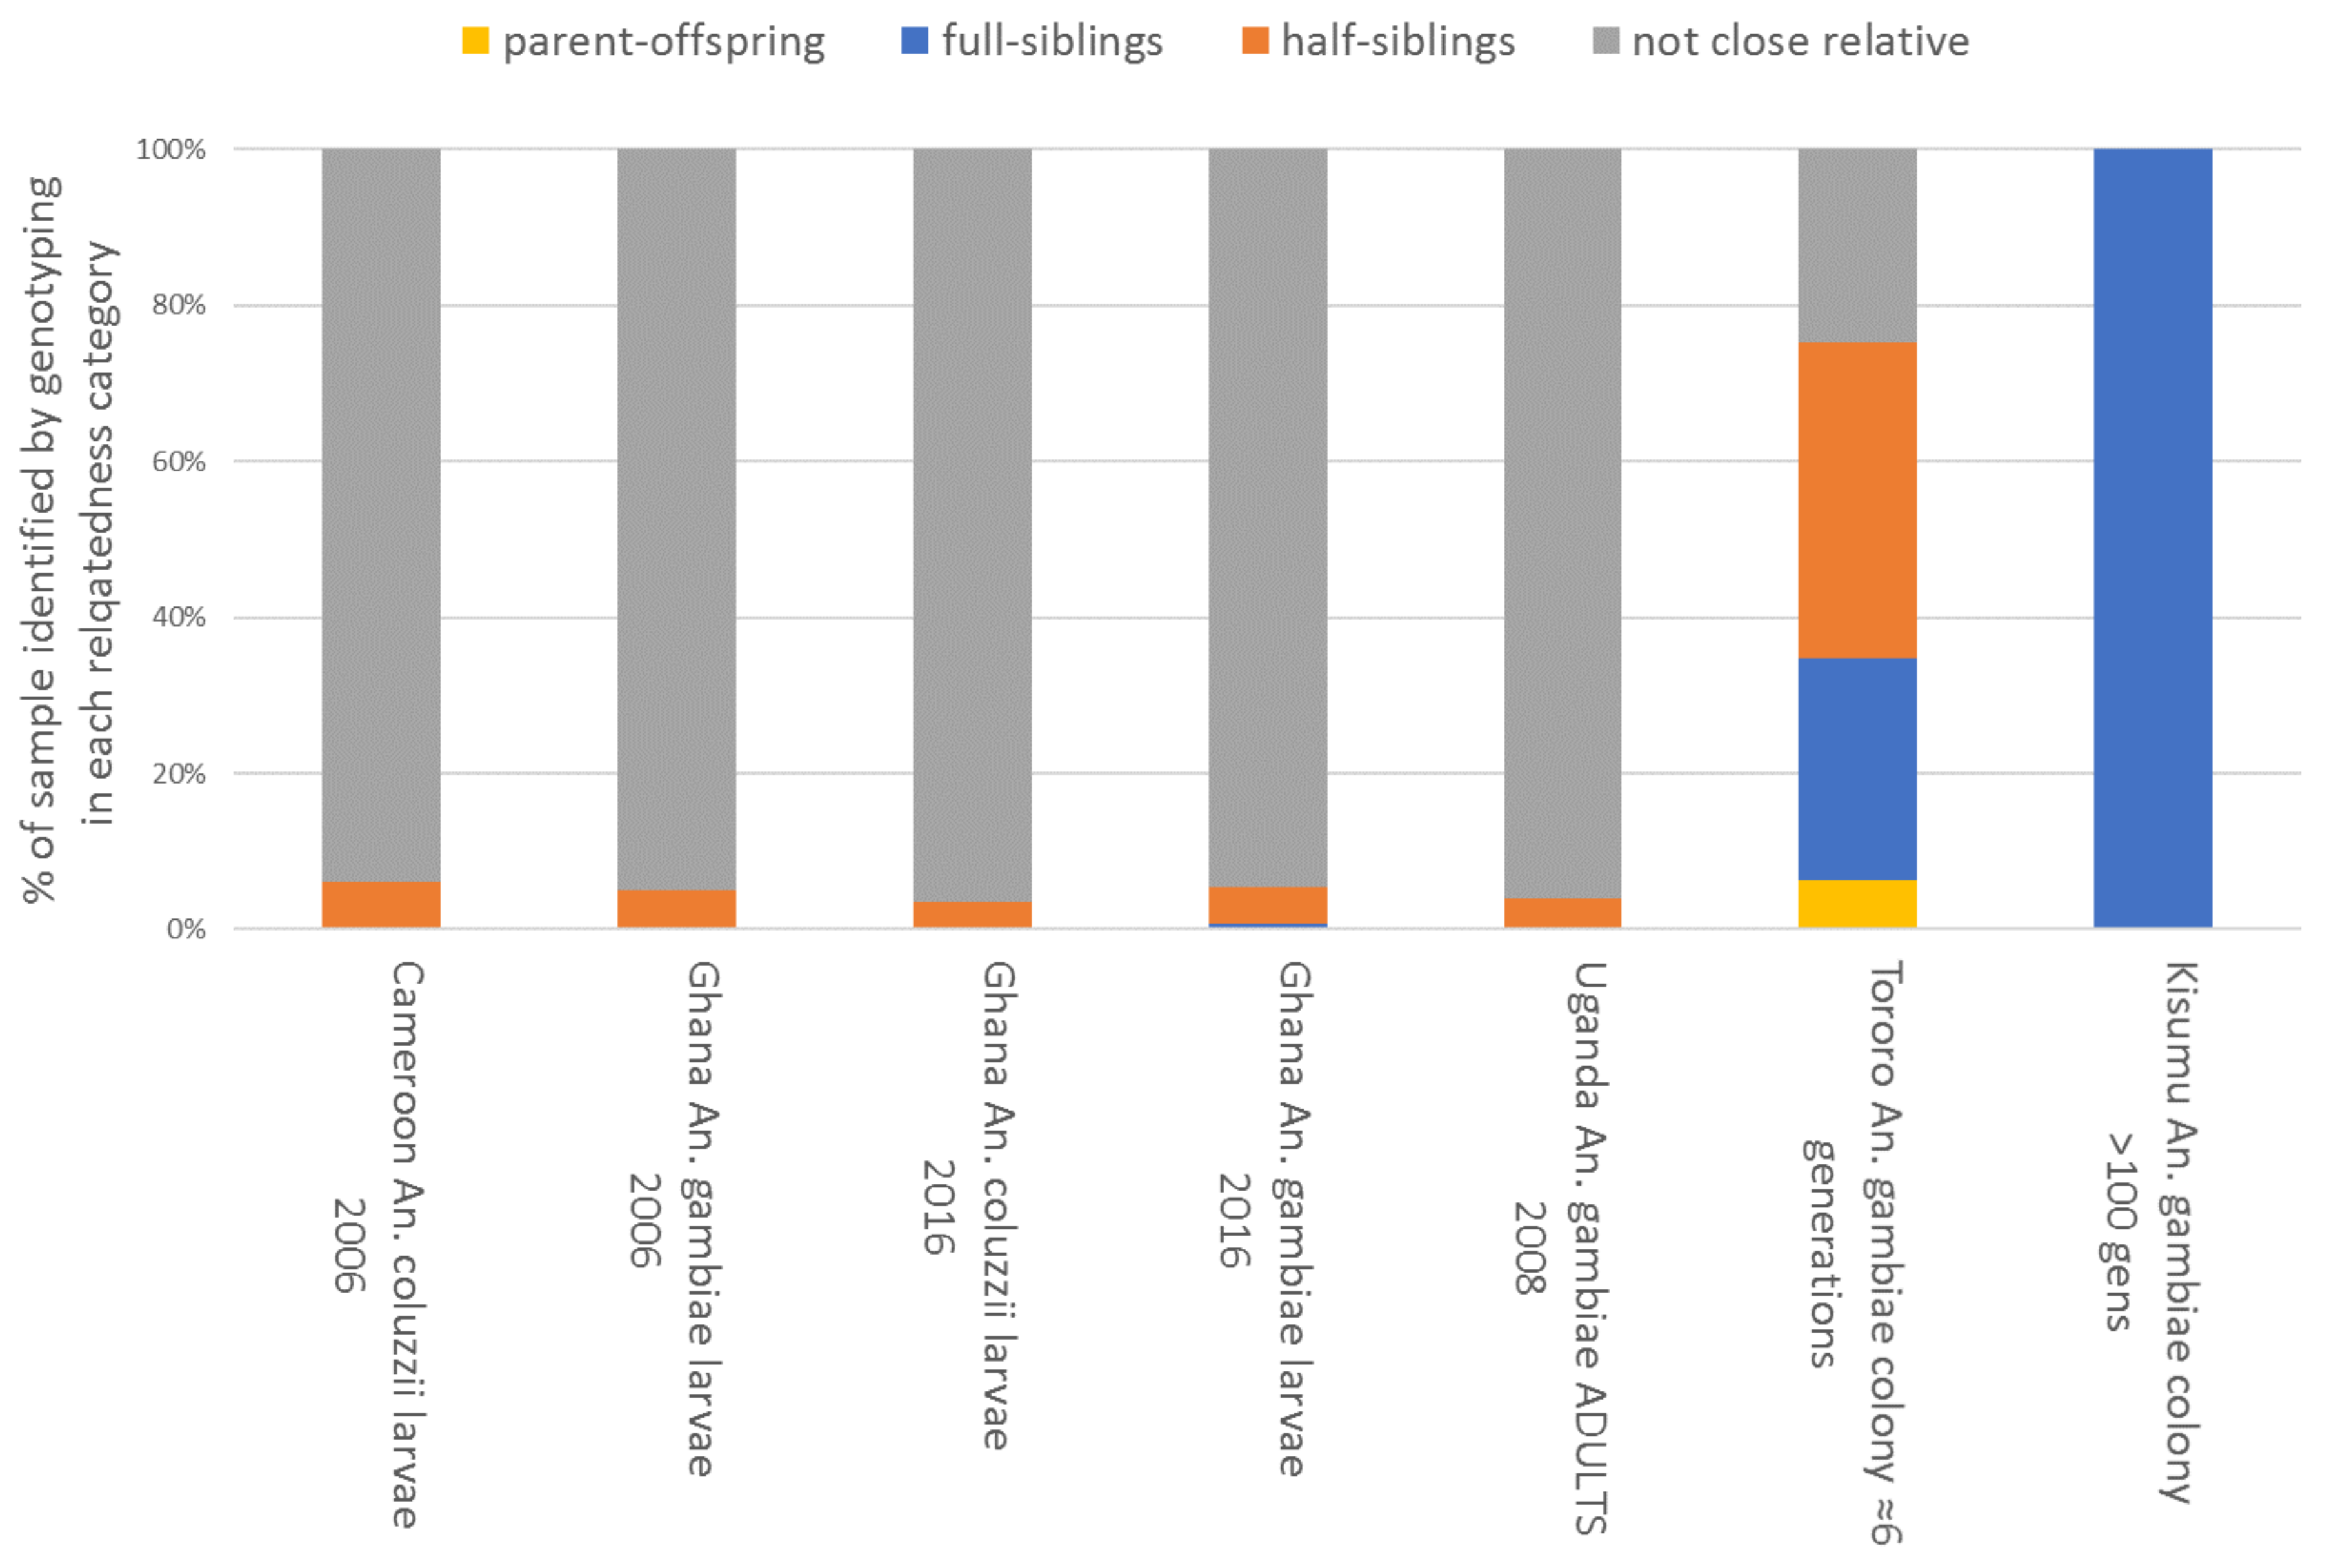
32]. In each dataset, relatedness categories among the samples were estimated (
Figure 9).
Results proved to be surprising. Larval collections in 2006 contained only approximately 5% of siblings, and those from within the same locations (i.e., sets of local larval habitats) in the 2016 collections showed a similar overall average, though occasionally sites showed much higher values (maximum = 46% related as half- or full siblings; see
Supplementary Material, Figure S8). This suggests that relatedness within larval habitats is much lower than might typically be assumed, and samples dominated by siblings are probably the exception, rather than the norm, provided efforts are made to sample as many locally accessible sites as possible. This is concordant with recent results from
An. arabiensis showing that productive larval habitats contained many larvae because they contained many families, rather than large numbers from single or few families [
42]. Relatedness among the adults collected from houses in Uganda was similar to that among the larval collections, and, as expected, all the estimates from field sampling contrasted very markedly with the majority of close relatives seen in the recently established colony, and especially the long-established Kisumu strain. Overall, these results suggested that with reasonable diligence, most larval samples of
An. gambiae might be assumed as broadly unrelated in locations where multiple larval habitats are available, providing little problem with the assumptions of independence for statistical models. When obtaining larvae is difficult, obtaining eggs from many females presents a reasonable alternative, including reporting details of the number of egg batches combined alongside data.
A final consideration in sampling is species identification. Failure to differentiate morphologically cryptic species within complexes or groups can create significant biases when comparing results among studies. When relative species composition varies in space or time, failure to identify which are being tested can lead to misinterpretation of causality if insecticide resistance differs interspecifically, which is often the case for
An. gambiae or
An. coluzzii vs. other species complex members [
43]. Multiple, cheap, and reliable molecular assays are available to identify species, and their application is crucial, though initial morphological identification to the level of species complex or group is always strongly advised [
44].
7. What Is the Evidence for the Existence of Divergent Resistance between Pyrethroids? Can Differences Seen in Molecular Studies (Section 3) Be Detected in Wild Mosquito Populations?
The WHO intensity bioassay [
4] is likely to have a lower measurement error than the WHO discriminating-dose bioassay, as each assay combines 3–6 repetitions across different insecticide intensities. A dataset was analysed that contained intensity bioassay results from the Presidents Malaria Initiative, WHO Malaria Threats database [
45], and studies collated by Moyes et al. [
38]. There were insufficient data available that directly compared different Type I and Type II pyrethroids in the same experiment. To overcome this, data were pooled at the country level to compare studies that tested permethrin and deltamethrin. This dataset consisted of 4745 individual mortality estimates from 1583 intensity bioassays across 18 countries in sub-Saharan Africa. Data from CDC bottle bioassays and WHO tube assays were analysed separately to investigate pyrethroid-specific resistance in wild mosquito populations. The analysis was restricted to the African continent due to the availability of data.
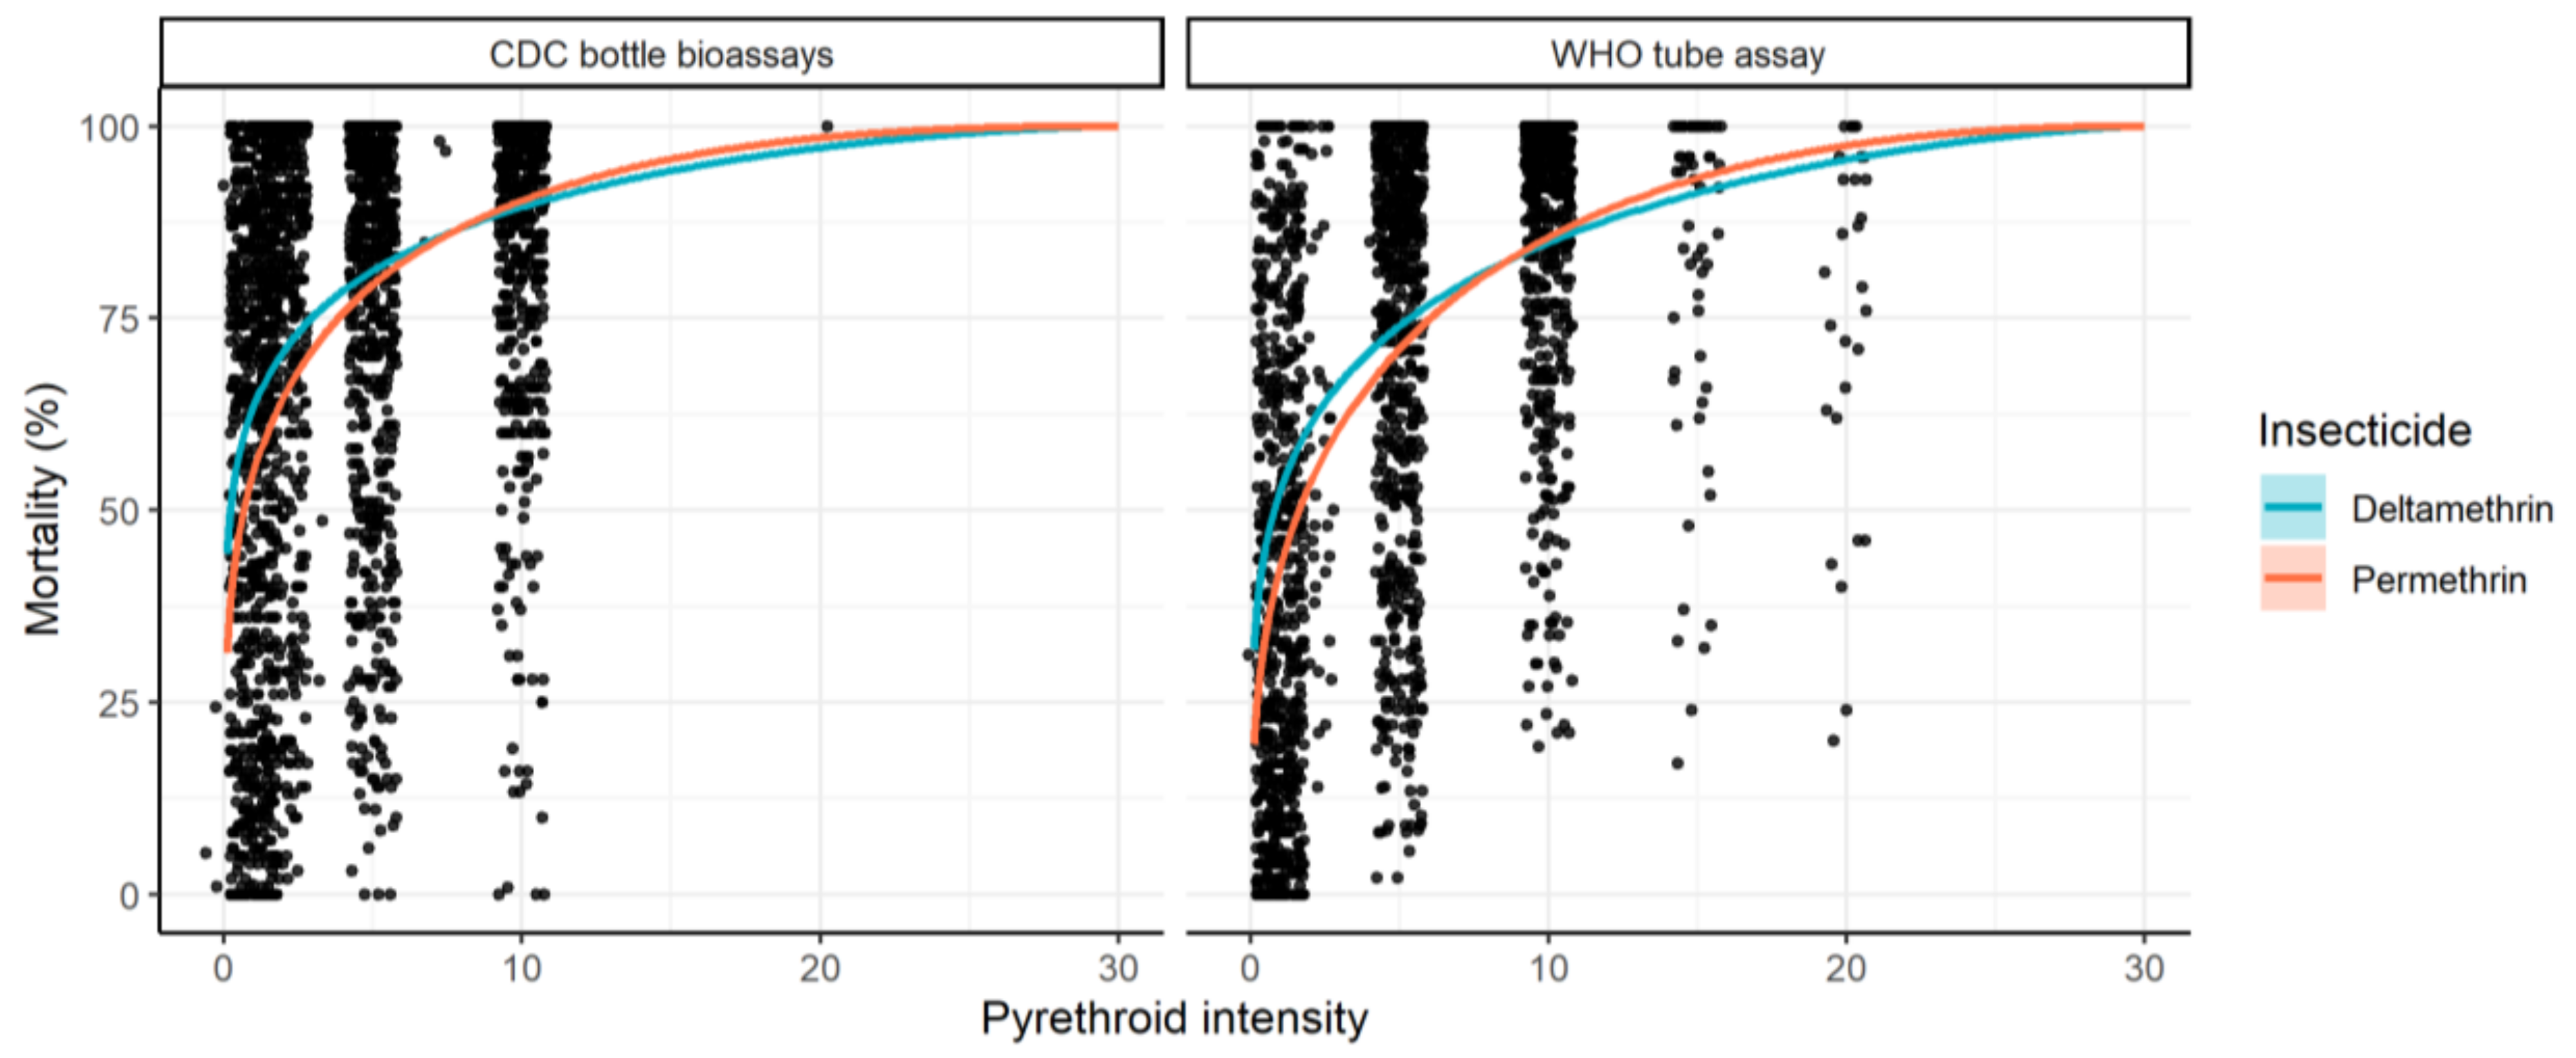
A Bayesian binomial model was developed to generate dose-response curves from raw intensity bioassay data. Separate curves were originally fit for each insecticide to the whole dataset to illustrate overall trends (
Figure 10). Separate models were then fit to each set of concentrations to estimate the individual median lethal concentration (Lc
50; i.e., the concentration at which 50% of mosquitoes tested died). Mean LC
50 estimates by country and year were calculated from individual estimates, with 95% credible intervals generated using bootstrapping methodology.
Overall, across all data the dose-response curves were similar. On average, at an exposure of up to 10× the DD, the best-fit curve indicated that mortality induced by deltamethrin was higher than that of permethrin (
Figure 10). This overall consistently shaped dose-response curve is compatible with the hypothesis that the two insecticides have different DDs. If the concentration of permethrin originally selected as “discriminating” induces a higher level of mortality than that selected for deltamethrin, then this discrepancy will be propagated across all concentrations (as they are relative to the DD at 2×, 5×, and 10×). The combined curves suggested that this is reversed when extrapolated to higher intensities, though this is likely an artefact of the shape of the curve used to describe the dose–response relationship combined with relatively few data points above 10× concentrations, though this needs to be verified.
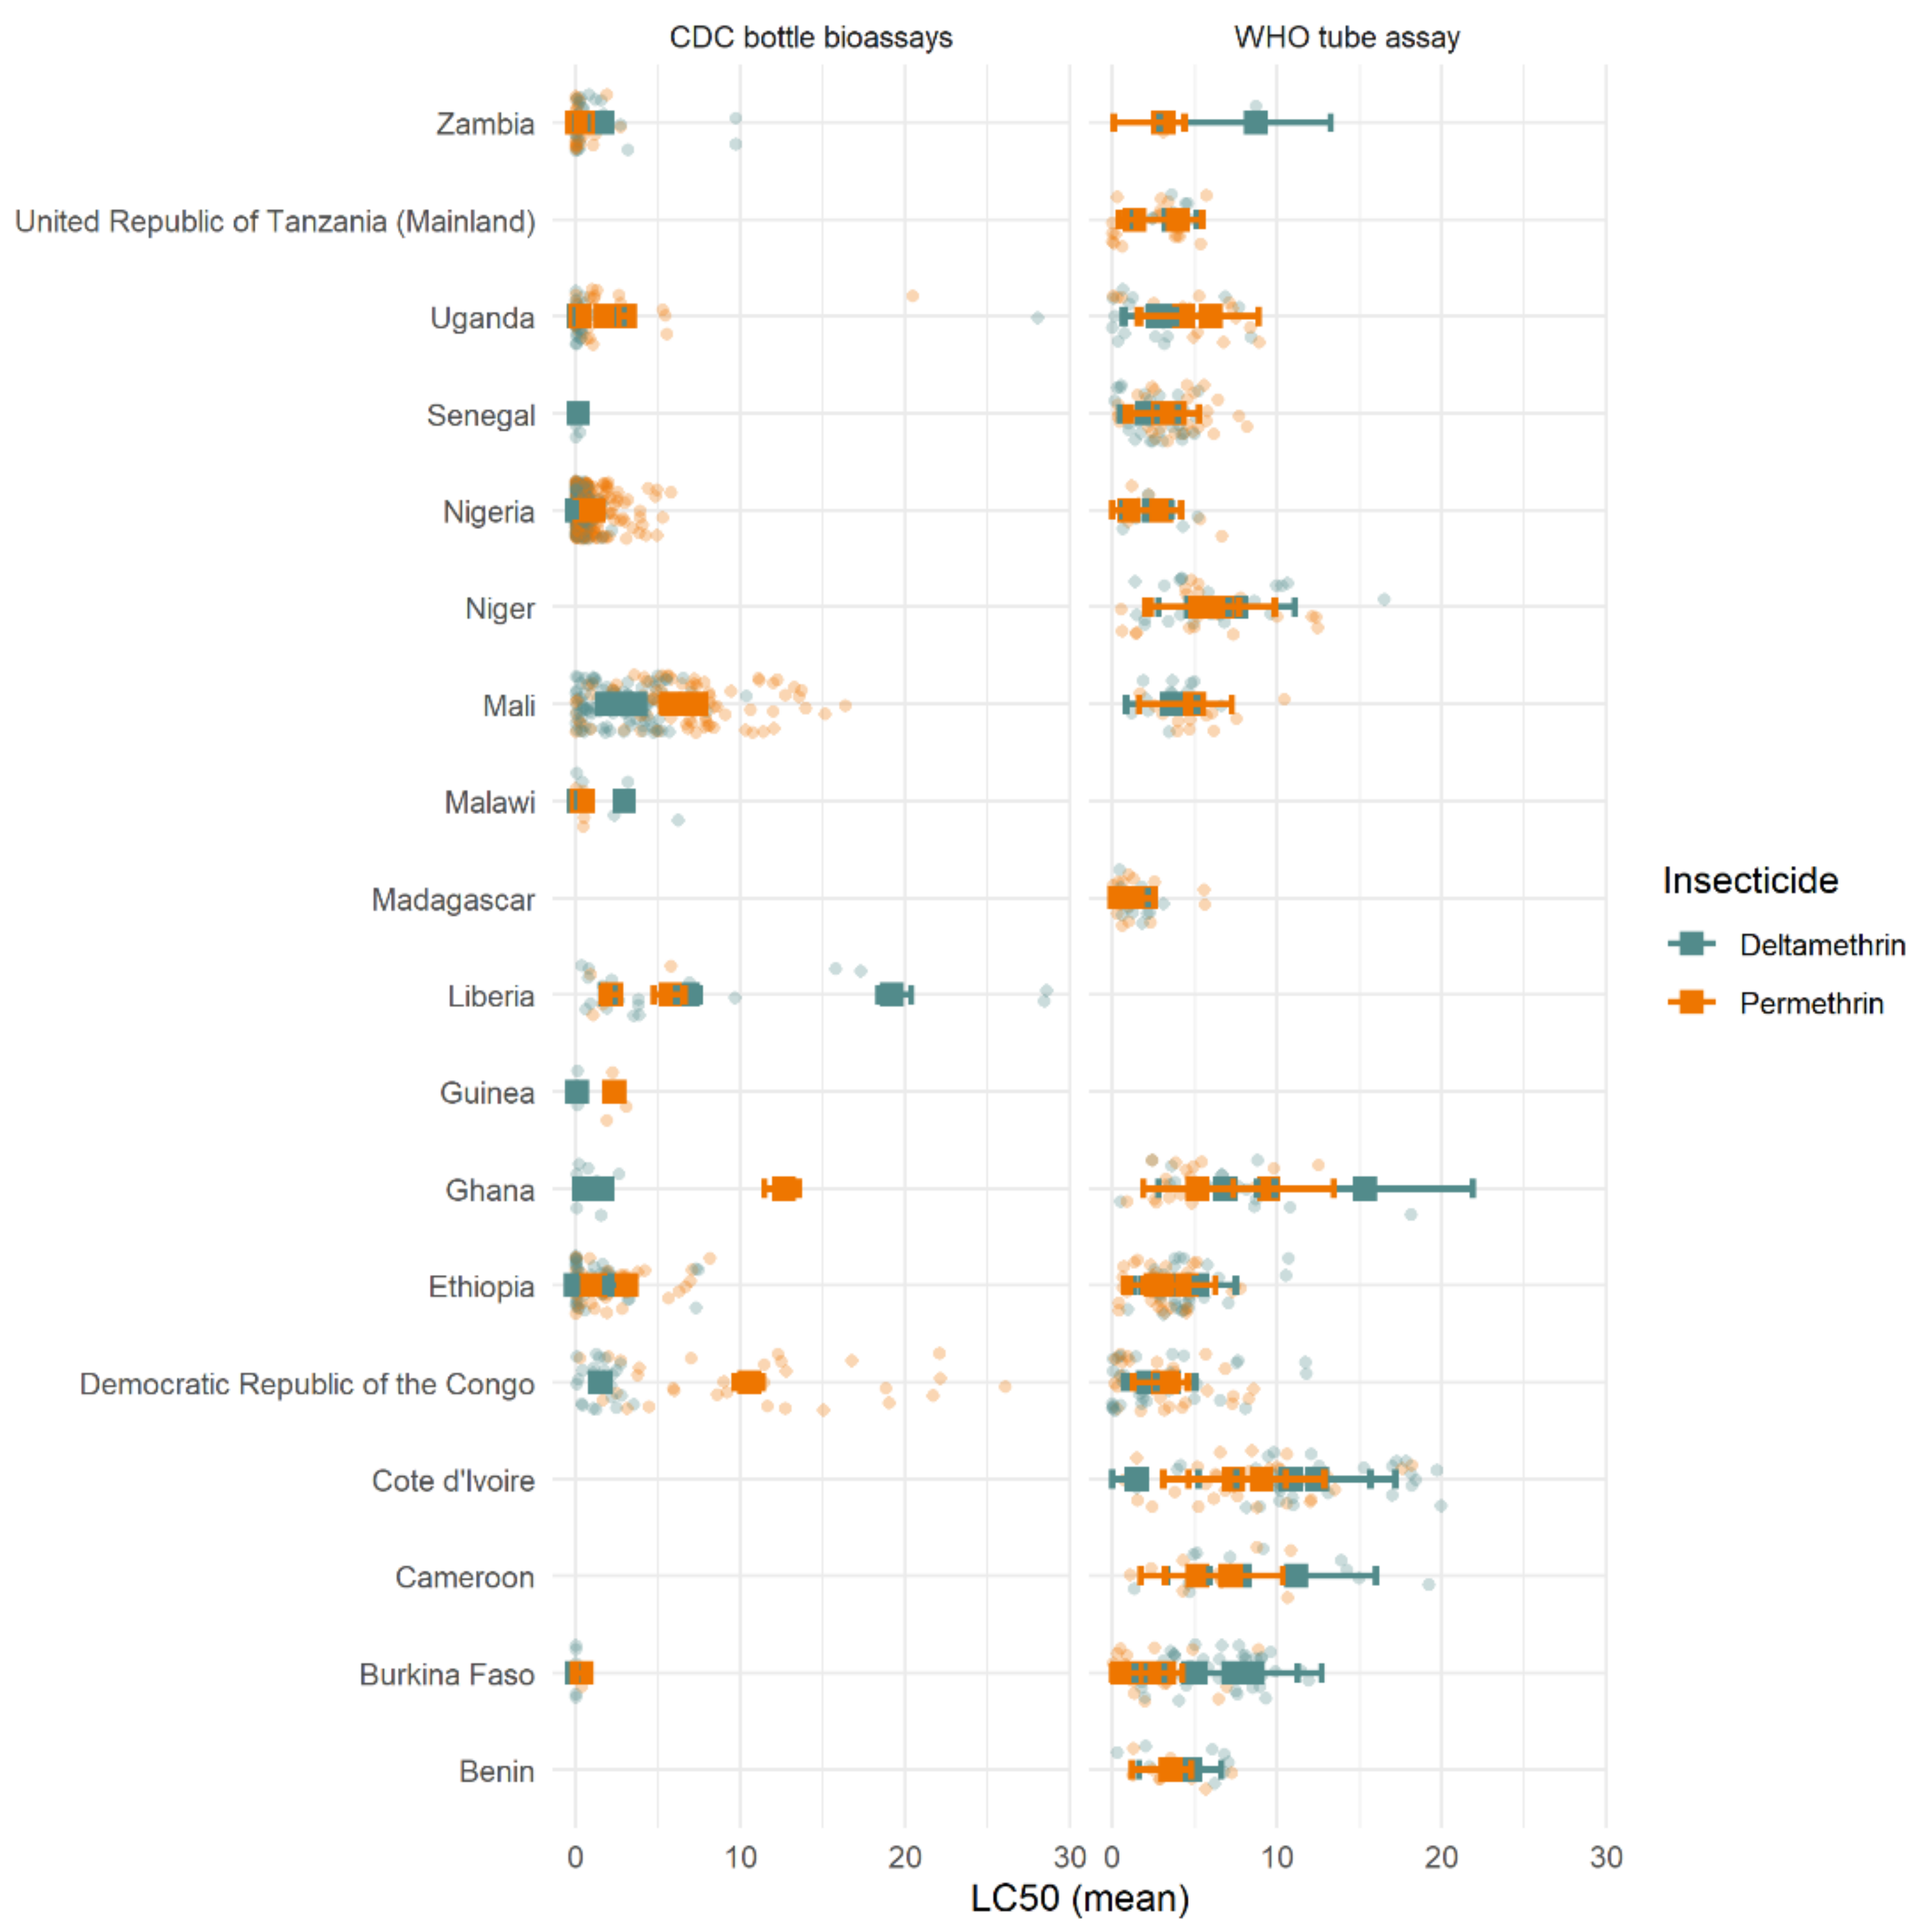
When analysing data at the country level, different trends were observed in different countries (
Figure 11). High LC
50 variability was seen in all locations, with substantially greater differences seen within-country than between countries. On average, differences between insecticides appeared marginal, with many overlapping mean LC
50 estimates across both insecticides. Lower LC
50 estimates (higher mortality) were seen for deltamethrin across most countries and assay types. There were several countries where this trend was, on average, reversed (i.e., higher LC
50 estimates for deltamethrin in Burkina Faso and Cote d’Ivoire for WHO tube assays). Nevertheless, the difference between the LC
50 estimates of the two insecticides was substantially less than the differences seen between assays of the same insecticide conducted in the same country, suggesting high variability but no clear pattern.
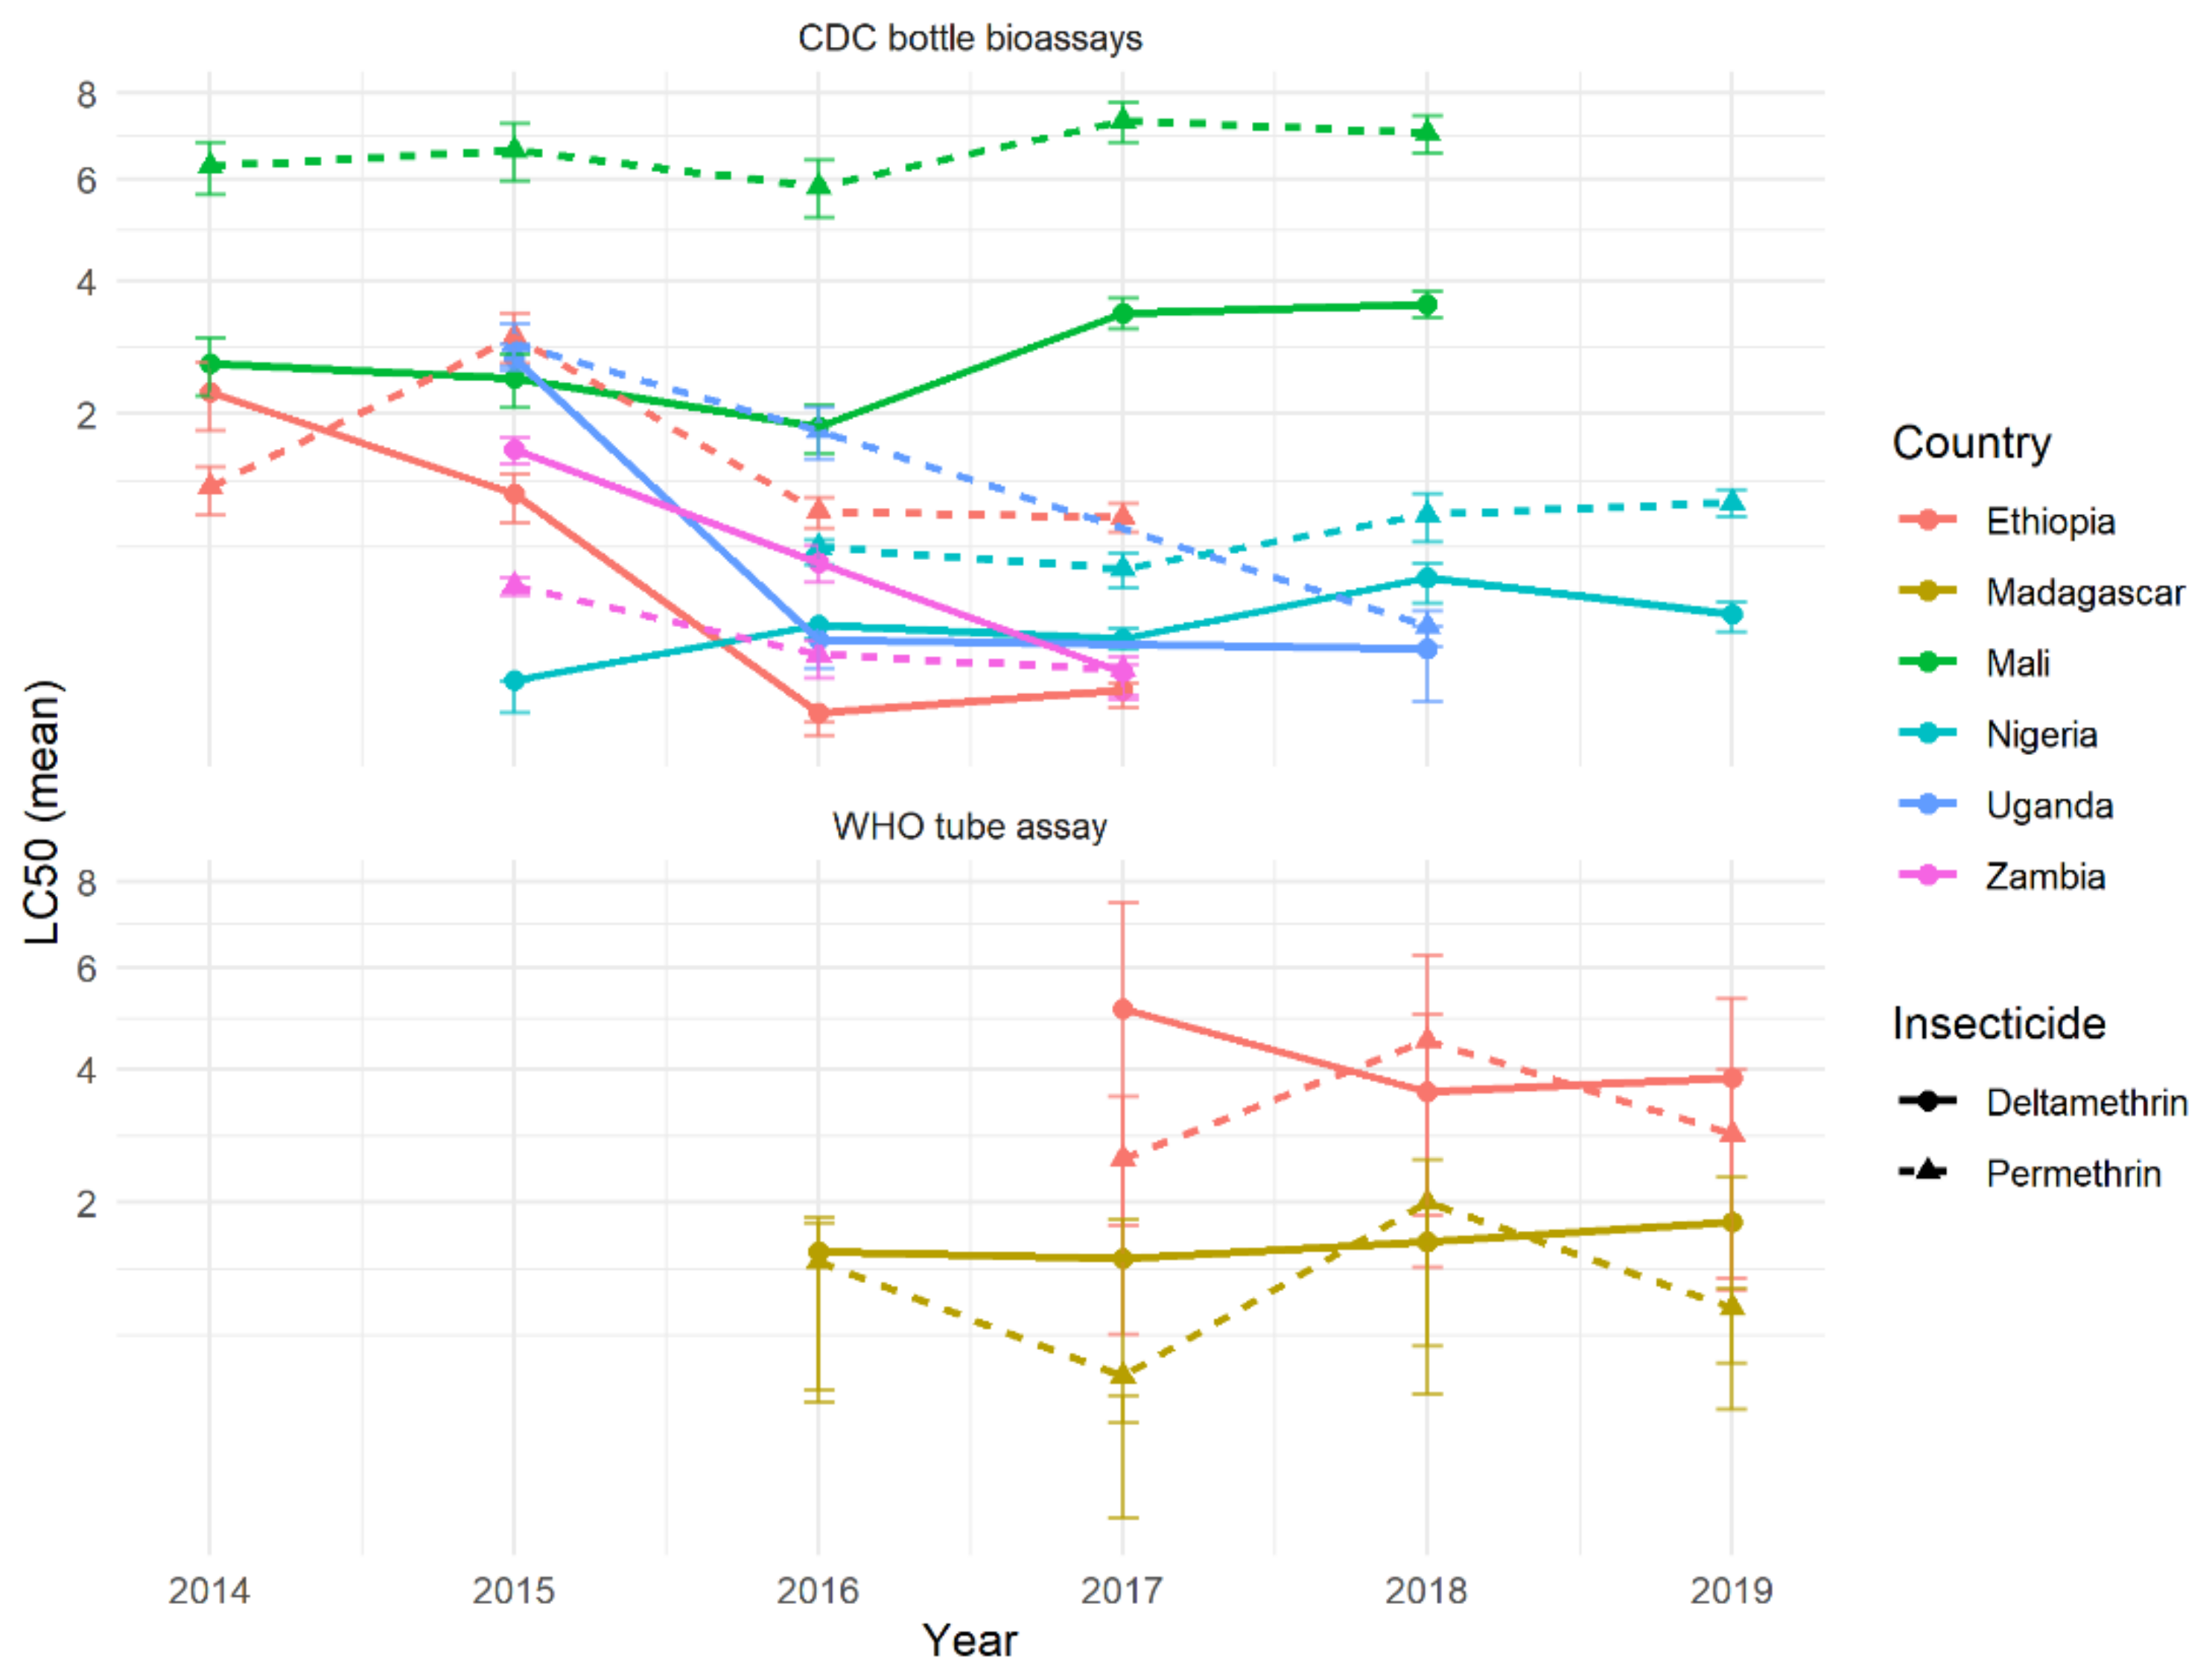
If there were differences in the suite of resistance mechanisms against Type I and Type II pyrethroids, and these mechanisms were established in populations, then it might be expected that resistance would diverge over time if selection pressures were continual. Selection is thought to be driven, at least in part, by ITN use, so this selection pressure is likely to be relatively consistent, as ITNs are typically replaced every three years. Differences in time were difficult to discern from these resistance-intensity data, as results were only available for 1–5 years. Nevertheless, the results were surprisingly consistent over the different years, with those countries showing differences between pyrethroids generally persisting (
Figure 12). On average, differences in mortality between insecticides did not increase over time, providing support for the cross-resistance hypothesis.
Importantly, the difference between insecticides was likely not substantial enough to have a meaningful public health impact. The absolute difference in mortality at the DD dose predicted by the dose-response model was relatively low, varying from 2–27% between countries with multiple years of data (data not shown). Temporal trends, when they did appear, were also relatively minor, changing on average by only a small percentage over the timeframe. Evidence from the CDC bottle assay in Mali consistently showed higher mortality after deltamethrin rather than permethrin exposure, which remained constant over multiple years (
Figure 11). However, a negligible difference was seen in the WHO tube assay from the same region (
Figure 11), so it is unclear whether this may be due to a sampling/procedural artefact or differences within the country.
Whilst intensity bioassays may help in decreasing measurement errors compared to DD bioassays, the phenotypic field data remains very noisy. Whether these differences represent true variability in the local mosquito populations or are an artefact of the assay is unclear. Overall, these data indicated there was no consistent difference in mortality between deltamethrin and permethrin.
8. Do Mosquitoes, Resistant or Susceptible, Exhibit Different Behavioural Responses to Different Pyrethroids?
Vector populations can respond to IRS or ITN selection pressure with changes in behaviour, such as shifts in time or location of biting, resting site preferences, or host preference to avoid encountering the insecticide. However, behavioural resistance may have many other less apparent forms; e.g., changes in sensitivity to repellent or irritant properties, or modified blood-feeding behaviours. Potentially, less detectable changes might be associated with highly visible secondary consequences; e.g., a thicker cuticle due to resistance could result in changes in flight behaviour. If there are differences in behavioural responses to different pyrethroids, then behavioural resistance might diverge such that resistance to one pyrethroid might be overcome by deploying a different one, or deployment choice might need to consider whether certain pyrethroids are more or less likely to drive behaviour in resistant mosquitoes that could lower an ITN’s efficacy.
The mechanisms of insecticide resistance in malaria vectors are being studied and characterised extensively at the molecular level. Yet, knowledge of behavioural change associated with resistance is relatively poor, and few studies have directly compared the behavioural response to different pyrethroids within the same study. Before the emergence of resistance, an early hut trial in The Gambia concluded that permethrin was the most repellent pyrethroid, followed by λ-cyhalothrin, deltamethrin, and lastly cypermethrin [
46]. Over a decade later, Hougard et al. [
47] tested bednets with various combinations of bifenthrin and carbosulfan against both resistant and susceptible
An. gambiae s.l., and reported no differences in entry rates between treatments or vector populations. Asidi et al. [
48] tested bednets treated with α-cypermethrin, λ-cyhalothrin, permethrin, deltamethrin, or carbosulfan against resistant
An. gambiae s.l. in Côte d’Ivoire. Here, all nets performed similarly, with none exhibiting any deterrent effects until they had been washed, after which all treatments reduced entry rates by approximately half. Cooperband and Allan [
49] found
An. quadrimaculatus spent significantly longer times resting on surfaces treated with deltamethrin than with bifenthrin or λ-cyhalothrin, but only after initial contact was made. Hughes, Foster, et al. [
50] found no evidence for deterrence in
An. gambiae s.l, but recorded lag times between first net contact and the start of blood feeding of 1 min with untreated nets, and 2.5 and 3 min for Olyset and PermaNet 2.0 nets, respectively. Other studies have described the behavioural responses of mosquitoes to pyrethroid-treated nets. However, there was great variability in the study designs, behavioural definitions, net treatments, and mosquito species reported in the literature. Studies investigated numerous diverse wild vector populations at different locations, on different dates, with very different or uncharacterised levels of resistance. Consequently, the results were highly variable, with little indication of a conclusive trend among the behavioural responses elicited by individual pyrethroids, let alone anything to distinguish behaviours unique to different insecticides within the pyrethroid class.
9. How Suitable Are Existing Resistance-Monitoring Methods for the Detection or Measurement of Behavioural Resistance?
Since the impact of any insecticide-based control method is determined ultimately by the mosquitoes’ behavioural response at or near the interface of insecticide delivery, the selection of ITNs should ideally be based on evidence derived from appropriate assays that capture the range of behaviours that influence the ITN’s performance. The discriminating-dose and resistance-intensity bioassays (whether WHO tube or CDC bottle) currently used to monitor resistance were not designed to allow for or monitor behavioural variation.
Bioassays such as the cone and tunnel tests record knockdown or mortality (and blood-feeding rate in tunnel tests) of young adult female mosquitoes following unnaturally high levels of exposure to an active ingredient under highly artificial conditions; i.e., forced, without the presence of a host, or using a non-natural animal host. Measuring the efficacy of insecticides in such an environment will not predict how the eventual insecticidal net products or residual spray preparations will perform under field conditions, hampering informed deployment decisions. Similarly, a change in behaviour in a mosquito exposed to a pyrethroid might well confound the results of such bioassays. For example, an increase in sensitivity could reduce contact times at the treated surface, resulting in lower mortality, whereas an increase in tolerance could increase the contact time and mask existing resistance.
Discriminating-dose assays (WHO tube and CDC bottle) were intended as a litmus test for the emergence of resistance in mosquito populations to evaluate fast-acting pyrethroids before the extent of resistance seen in Africa today became established. They were not designed to measure quantitative differences between mortality rates to inform product choices, and certainly not to draw any comparisons between the efficacy of different products. Their limitation is their inability to capture the full range of possible behavioural and sublethal effects—such as impacts on longevity, reproductive output, or development of Plasmodium spp. Improving, augmenting, or replacing tests as affordable, rapid, and simple as the existing WHO tests with new assays that retain those properties, as well as adding the ability to capture, distinguish, and measure a range of outcomes without ambiguity, will be a challenge.
Carrasco et al. [
51] attempted to capture all anticipated behavioural events and other potential outcomes following insecticide vector control within a framework to guide classification and investigation. A better understanding of behavioural responses, to both insecticides and specific products, and how they differ between susceptible and resistant mosquitoes should inform the deployment of the most effective products. Ideally, given the vast range of behaviours that could be impacted and might need to be quantified, resistance-monitoring efforts should focus methods to detect changes in those behaviours most likely to affect a product’s performance. To meet this need, there have been a number of advances in development of novel methodologies [
50,
52,
53,
54] to collect the essential data about the behavioural responses of
Anopheles under more operationally relevant conditions, including large-scale testing arenas [
55,
56].
10. Discussion
10.1. The Evidence for Divergent Resistance within the Pyrethroid Class
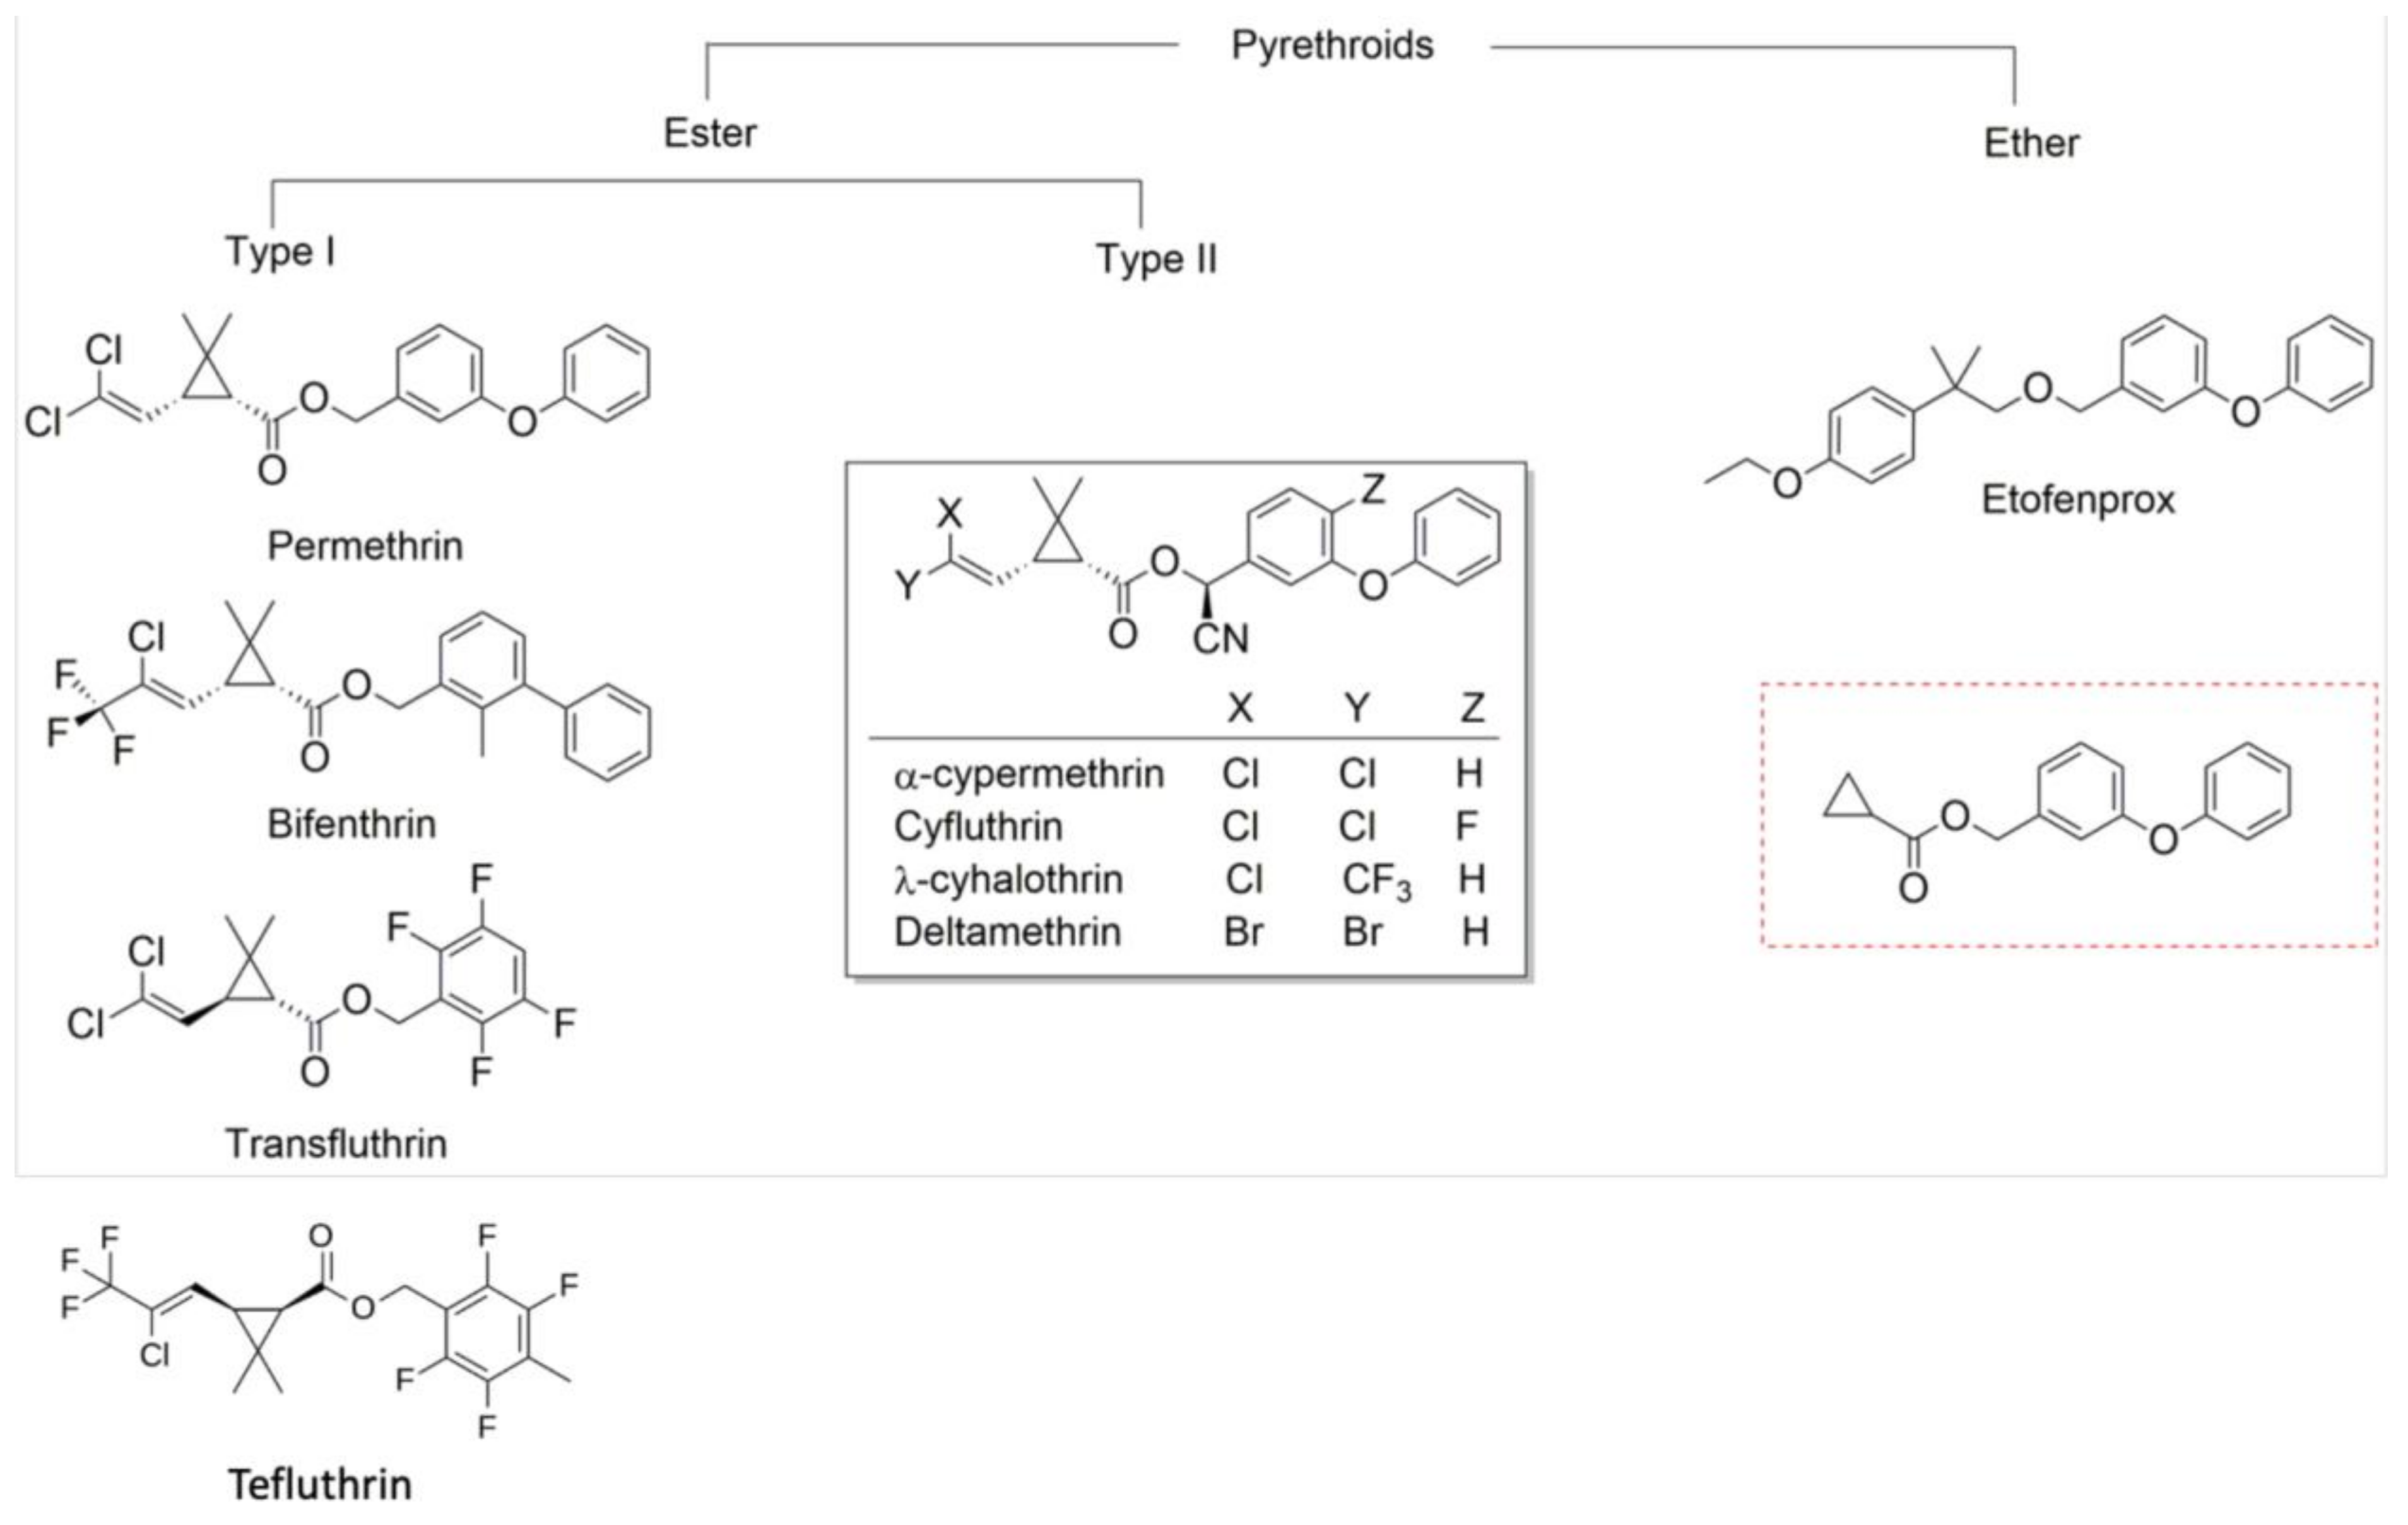
Molecular analysis of metabolic resistance, together with analysis of phenotypic resistance in mosquito populations (including analyses of intensity data, of diagnostic dose bioassay data from populations that have been tested with multiple pyrethroids, and of spatiotemporal trends), provide evidence that there is strong cross-resistance among pyrethroids, particularly between permethrin and deltamethrin. P450s SAR (structure–activity relationship) findings concluded that the more commonly used pyrethroids examined were the most vulnerable to metabolic attack (by cytochrome P450s), while bifenthrin, λ-cyhalothrin, and α-cypermethrin were less vulnerable to metabolic attack. Bioassay data from Aedes aegypti and An. sinensis suggested that bifenthrin may demonstrate relatively low cross-resistance with other more commonly used pyrethroids. Bifenthrin has not been widely used in malaria control in Africa and no discriminating dose has been defined, but its potential use in malaria vector control warrants further investigation. There is also evidence that resistance to etofenprox could diverge from resistance to the more commonly used pyrethroids; however, further investigation regarding vulnerability to metabolic attack by P450s is required.
In field populations, variability in discriminating-dose and dose-response assay mortality was high. This variability was predominantly at a fine geographical scale (i.e., assays done within 50 km of each other were highly variable), indicating that if there were a difference between Type I and II pyrethroids, it would be very local and beneath the size of the regions to which insecticidal nets are currently allocated. There was good evidence that the mortalities from exposure to deltamethrin, permethrin, α-cypermethrin, and λ-cyhalothrin were strongly correlated across An. gambiae s.l. populations. These correlations were also seen for deltamethrin, permethrin, and λ-cyhalothrin (α-cypermethrin was not tested) in the An. funestus subgroup, and in all three of the main malaria vectors within the An. gambiae complex.
10.2. The Suitability of Current Testing Methods to Monitor Insecticide Resistance and Make Vector-Control Decisions
Deployment decisions for ITNs are being guided by information arising from the discriminating-dose and resistance-intensity bioassays, but it is not clear how well differential mortality in WHO tube or CDC bottle bioassays predict how well an ITN treated with one or another pyrethroid will perform in a specific site. Bioavailability may play an important role in the relative efficacy of different ITNs, and testing for the relative performance of different nets against field populations would provide more directly relevant information for deployment decisions, alongside or in place of conventional bioassays. Given the limited products available for vector control, as well as narrow collection of available chemistries, programmes must make ITN deployment decisions based on the data that can realistically be collected. The current monitoring system for insecticide resistance is imperfect and should be adapted to make better use of the available resources, while being mindful that limited mosquito collections preclude the testing of all insecticides/products.
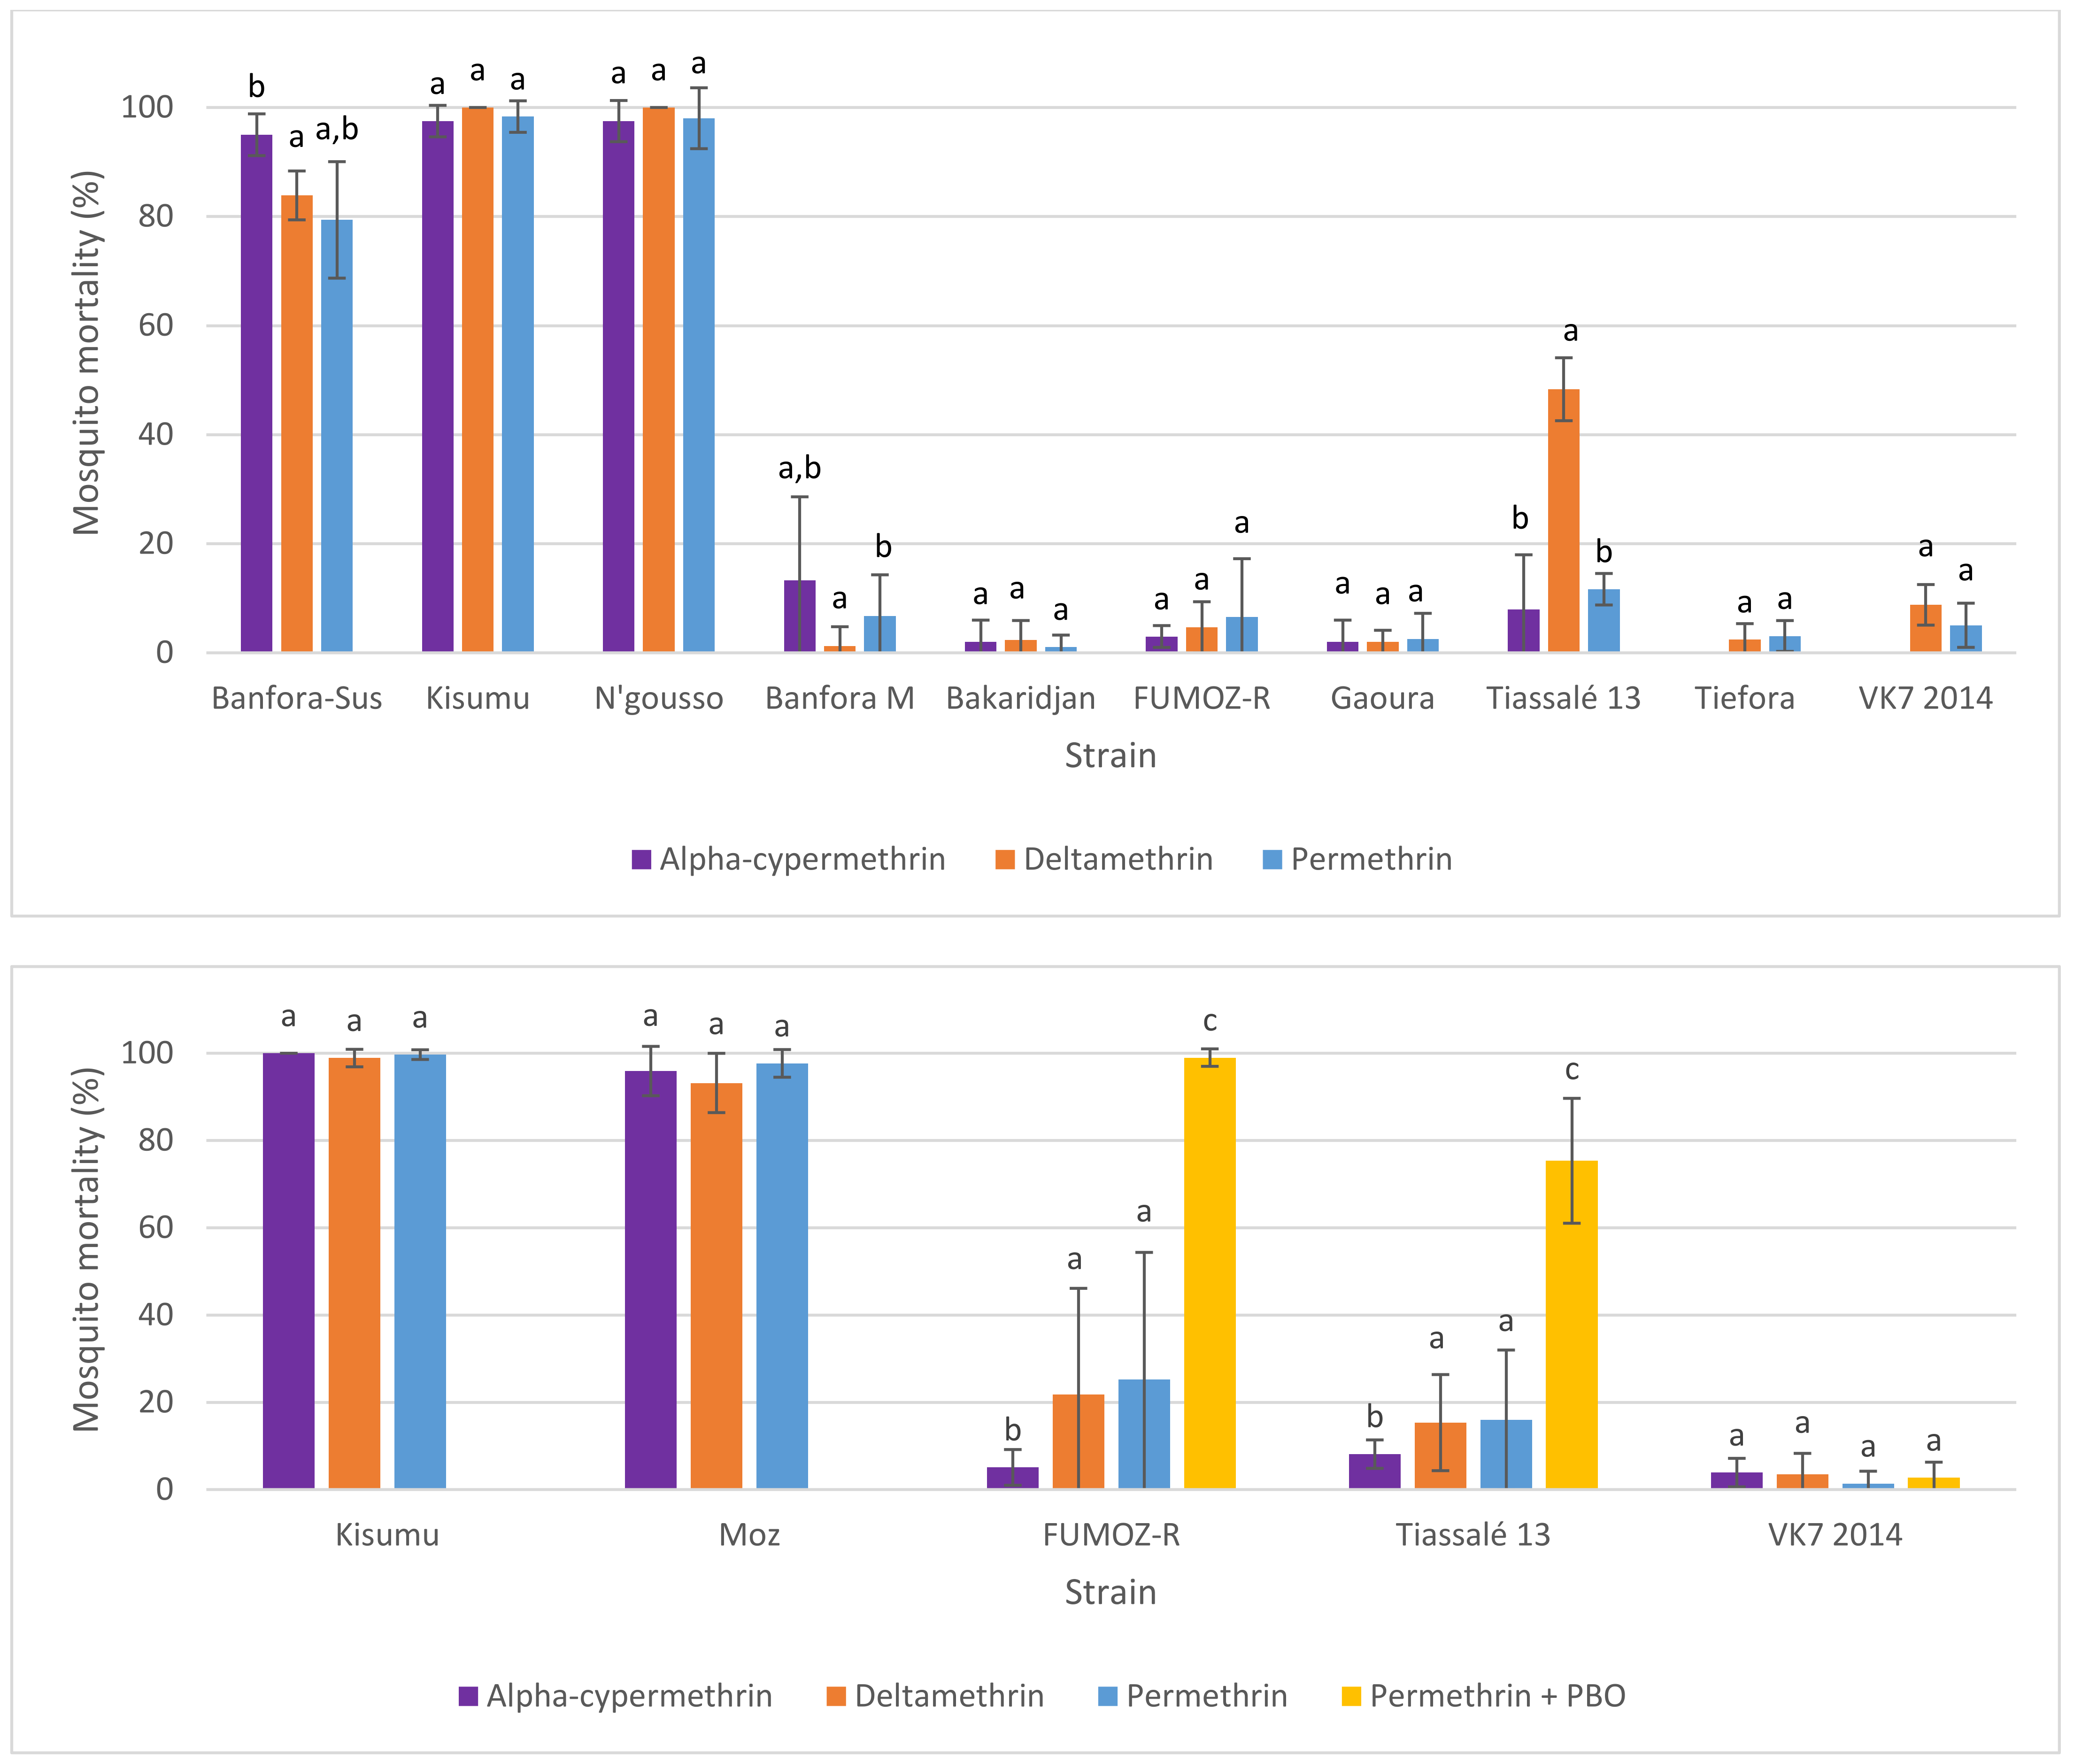
In general, following exposure of characterised lab strains in WHO tube bioassays under controlled conditions, intrastrain mortality to permethrin, deltamethrin, and α-cypermethrin were similar. However, in intermediately resistant strains, some divergence in mortality rates was observed. However, importantly, the level of variability in observations of mortality between tubes (measured using standard deviations) was also greater in these intermediately resistant strains, which reduced certainty in apparent contrasts between insecticides. Discriminating-dose assays are poor tools for quantitative analysis of resistance levels where resistance is established, producing the most variability in results in laboratory colonies and field populations where resistance was moderate and mortality was intermediate, which is likely to be the case for all or most pyrethroids in most populations of African malaria vectors. For comparisons across insecticides, intensity assays (e.g., 1×, 5×, 10×) suffered from the same problem as the discriminating doses on which they depended—an apparent lack of parity across pyrethroid insecticides. Quantitative dose-response assays, which do not depend on a discriminating doses, are recommended for robust comparisons between insecticides.
All bioassays are vulnerable to ambient conditions, including humidity and temperature, in addition to other environmental effects more easily standardized by the user. It is crucial that deviations from optimal conditions are reported, along with the improved provision of sampling details, to understand extrinsic factors that could influence bioassay results.


 ,
, 


