
Estimation of Ixodes ricinus (Acari: Ixodidae) Populations of Kaylaka Park in the Town of Pleven, Bulgaria

 ,
,  ,
,
Abstract
:Simple Summary
Abstract
1. Introduction
2. Materials and Methods
2.1. Study Sites
2.1.1. Urban Area
2.1.2. Wild Area
2.2. Tick Collection and Identification
2.3. Questing Tick Abundance
2.4. Statistical Analyses
3. Results
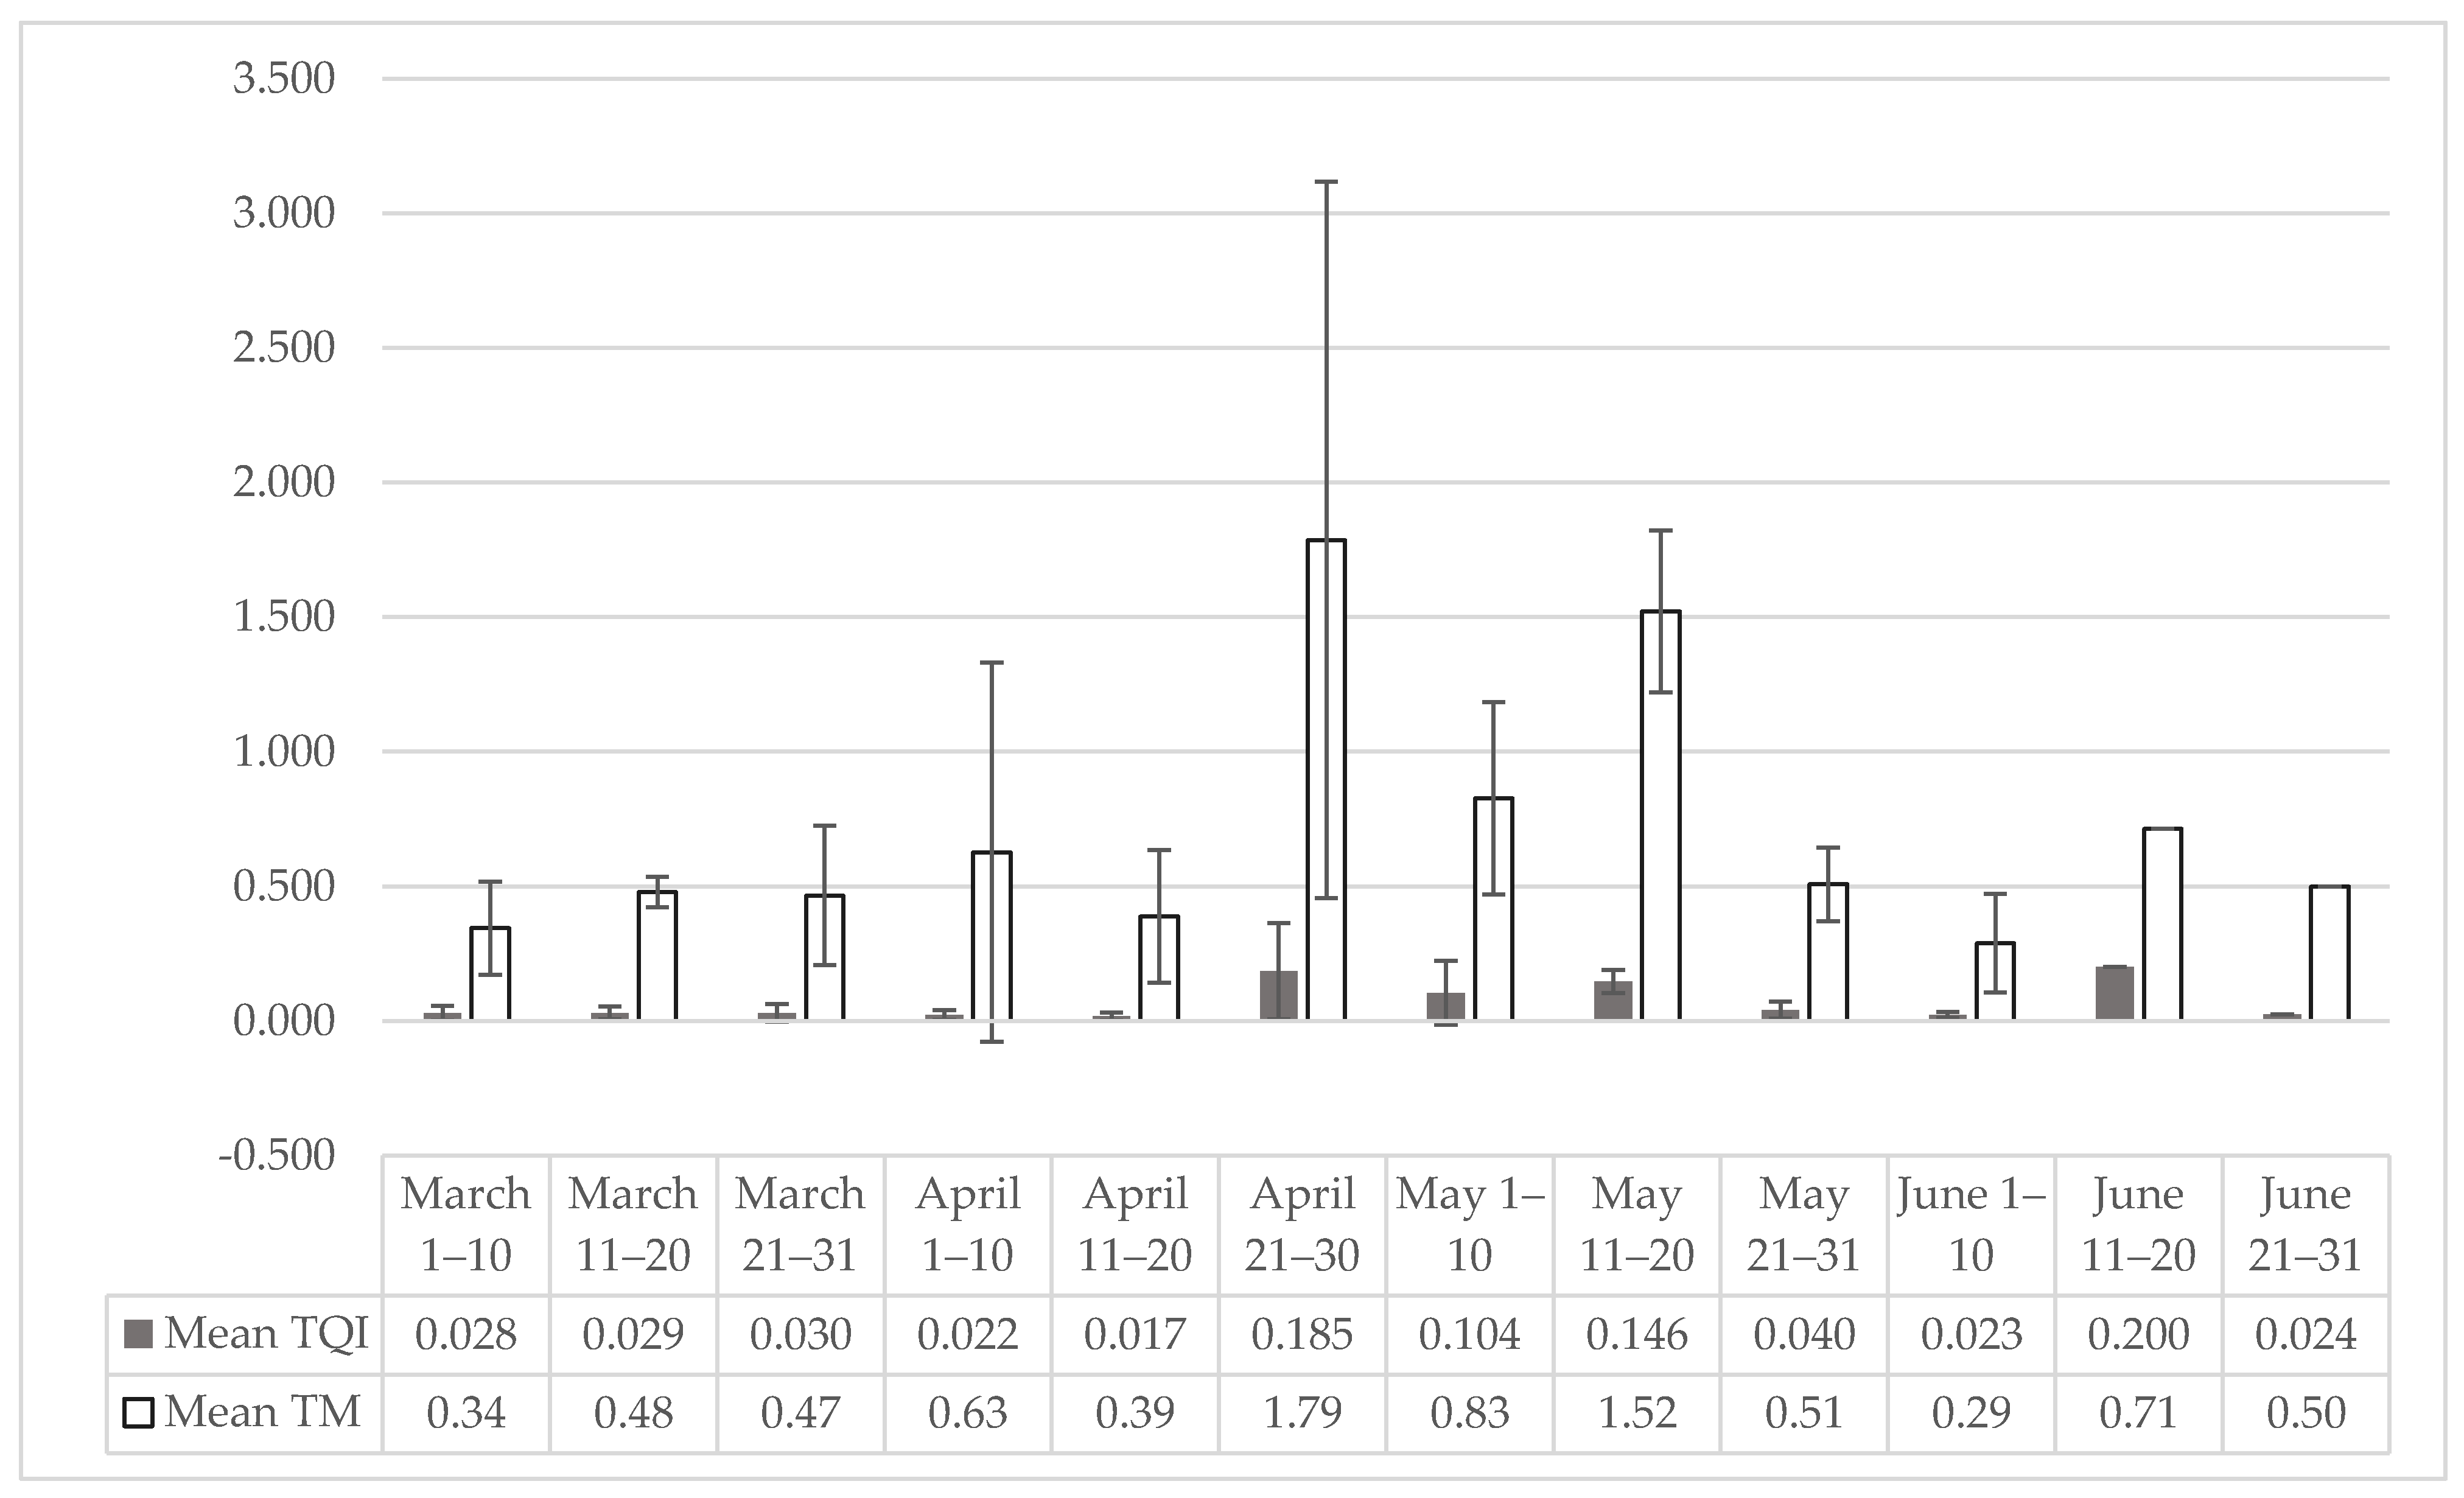
3.1. Tick Abundance

| Sampling Sites | Collected Ticks | Average Flagging Size (m2) | Average Flagging Time (minute) | I. ricinus Abundance Indices (Mean ± SD) | ||||||
|---|---|---|---|---|---|---|---|---|---|---|
| Total | Female | Male | Nymph | TQI | AQI | NQI | TM | |||
| Urbanized | 197 | 101 | 83 | 12 | 302.26 ± 706.72 | 17.35 ± 14.14 | 0.054 ± 0.089 | 0.051 ± 0.089 | 0.003 ± 0.005 | 0.579 ± 0.669 |
| U1 | 52 | 27 | 20 | 5 | 344.62 ± 299.97 | 23.4 ± 11.4 | 0.034 ± 0.028 | 0.03 ± 0.025 | 0.004 ± 0.007 | 0.335 ± 0.212 |
| U2 | 66 | 36 | 25 | 5 | 223.90 ± 106.91 | 14.6 ± 3.2 | 0.041± 0.030 | 0.037 ± 0.026 | 0.004 ± 0.006 | 0.491 ± 0.271 |
| U3 | 37 | 15 | 20 | 2 | 322.27 ± 176.39 | 17.2 ± 17.3 | 0.057 ± 0.080 | 0.056 ± 0.081 | 0.001 ± 0.002 | 0.577 ± 0.201 |
| U4 | 42 | 23 | 18 | 0 | 364.17 ± 289.17 | 14.0 ± 10.0 | 0.102 ± 0.189 | 0.102 ± 0.189 | ND | 1.08 ± 1.452 |
| Wild | 425 | 184 | 189 | 52 | 773.97 ± 736.82 | 27.5 ± 13.71 | 0.087 ± 0.097 | 0.073 ± 0.076 | 0.017 ± 0.026 | 0.971 ± 0.538 |
| W1 | 149 | 65 | 66 | 18 | 450 ± 0 | 30.7 ± 14.0 | 0.11 ± 0.068 | 0.097 ± 0.06 | 0.013 ± 0.008 | 1.516 ± 0.396 |
| W2 | 94 | 39 | 37 | 18 | 196.67 ± 148.36 | 20.3 ± 6.3 | 0.136 ± 0.128 | 0.113 ± 0.093 | 0.031 ± 0.038 | 0.865 ± 0.427 |
| W3 | 49 | 22 | 22 | 5 | 644.72 ± 354.63 | 20.3 ± 12.4 | 0.016 ± 0.017 | 0.014 ± 0.016 | 0.002 ± 0.002 | 0.608 ± 0.735 |
| W4 | 133 | 58 | 64 | 11 | 2424.87 ± 1978.76 | 48.3 ± 23.6 | 0.06 ± 0.08 | 0.048 ± 0.06 | 0.012 ± 0.019 | 0.96 ± 0.131 |
| Total | 622 | 285 | 272 | 64 | 481.98 ± 736.82 | 21.21 ± 13.71 | 0.066 ± 0.092 | 0.059 ± 0.084 | 0.008 ± 0.018 | 0.717 ± 0.641 |
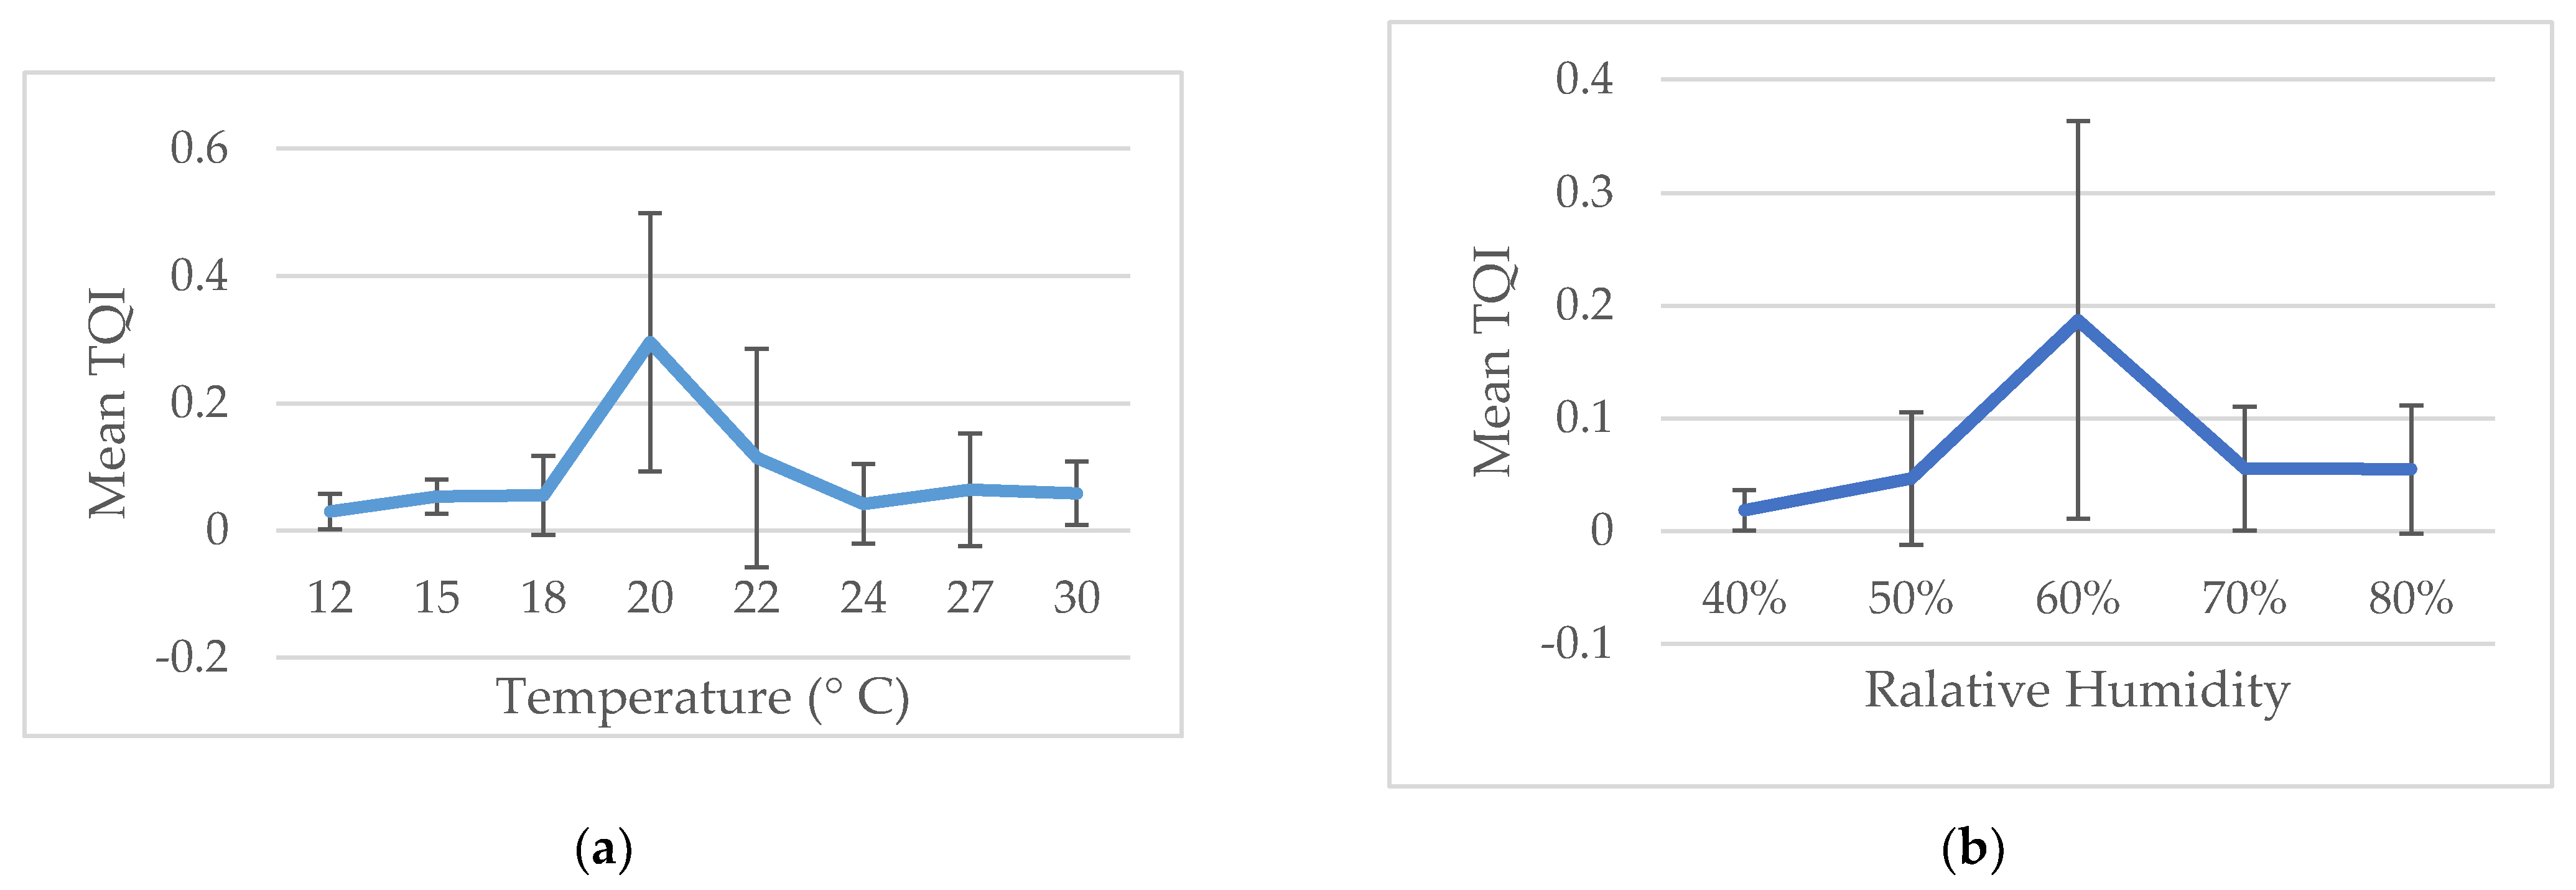
3.2. Temperature and Relative Humidity (RH)
3.3. Comparison of Questing Indices among the Urban and Wild Areas in Kaylaka Park
4. Discussion
Author Contributions
Funding
Institutional Review Board Statement
Data Availability Statement
Conflicts of Interest
References
- De la Fuente, J.; Antunes, S.; Bonnet, S.; Cabezas-Cruz, A.; Domingos, A.G.; Estrada-Pena, A.; Johnson, N.; Kocan, K.M.; Mansfield, K.L.; Nijhof, A.M.; et al. Tick-Pathogen Interactions and Vector Competence: Identification of Molecular Drivers for Tick-Borne Diseases. Front. Cell Infect. Microbiol. 2017, 7, 114. [Google Scholar] [CrossRef] [Green Version]
- Pfaffle, M.; Littwin, N.; Muders, S.V.; Petney, T.N. The ecology of tick-borne diseases. Int. J. Parasitol. 2013, 43, 1059–1077. [Google Scholar] [CrossRef]
- Pet’ko, B.; Siuda, K.; Stanko, M.; Tresová, G.; Karbowiak, G.; Fricova, J. Borrelia burgdorferi sensu lato in the Ixodes ricinus ticks in southern Poland. Ann. Agric. Environ. Med. 1997, 4, 263–269. [Google Scholar]
- Hillyard, P.D. Ticks of North-West Europe; Field Studies Council: Shrewsbury, UK, 1996. [Google Scholar]
- Knülle, W.; Rudolph, D. Humidity relationships and water balance of ticks. In Physiology of Ticks; Obenchain, F.D., Galun, R., Eds.; Pergamon Press: Oxford, UK, 1982; pp. 43–70. ISBN 0-08-024937-X. [Google Scholar]
- Herrmann, C.; Gern, L. Search for blood or water is influenced by Borrelia burgdorferi in Ixodes ricinus. Parasites Vectors 2015, 8, 6. [Google Scholar] [CrossRef] [PubMed] [Green Version]
- Lindgren, E.; Tälleklint, L.; Polfeldt, T. Impact of climatic change on the northern latitude limit and population density of the disease-transmitting European tick Ixodes ricinus. Environ. Health Perspect. 2000, 108, 119–123. [Google Scholar] [CrossRef] [PubMed]
- Sormunen, J.J.; Andersson, T.; Aspi, J.; Back, J.; Cederberg, T.; Haavisto, N.; Halonen, H.; Hanninen, J.; Inkinen, J.; Kulha, N.; et al. Monitoring of ticks and tick-borne pathogens through a nationwide research station network in Finland. Ticks Tick-Borne Dis. 2020, 11, 101449. [Google Scholar] [CrossRef] [PubMed]
- Beaujean, D.; Crutzen, R.; Kengen, C.; van Steenbergen, J.; Ruwaard, D. Increase in ticks and Lyme borreliosis, yet research into its prevention on the wane. Vector-Borne Zoonotic Dis. 2016, 16, 349–351. [Google Scholar] [CrossRef]
- Hofhuis, A.; Bennema, S.; Harms, M.; van Vliet, A.J.; Takken, W.; van den Wijngaard, C.C.; van Pelt, W. Decrease in tick bite consultations and stabilization of early Lyme borreliosis in the Netherlands in 2014 after 15 years of continuous increase. BMC Public Health 2016, 16, 425. [Google Scholar] [CrossRef] [Green Version]
- Jaenson, T.G.; Hjertqvist, M.; Bergström, T.; Lundkvist, Å. Why is tick-borne encephalitis increasing? A review of the key factors causing the increasing incidence of human TBE in Sweden. Parasites Vectors 2012, 5, 184. [Google Scholar] [CrossRef] [Green Version]
- Sajanti, E.; Virtanen, M.; Helve, O.; Kuusi, M.; Lyytikäinen, O.; Hytönen, J.; Sane, J. Lyme borreliosis in Finland, 1995–2014. Emerg. Infect. Dis. 2017, 23, 1282. [Google Scholar] [CrossRef] [Green Version]
- Vandekerckhove, O.; De Buck, E.; Van Wijngaerden, E. Lyme disease in Western Europe: An emerging problem? A systematic review. Acta Clin. Belg. 2019, 76, 244–252. [Google Scholar] [CrossRef]
- Jaenson, T.G.; Lindgren, E. The range of Ixodes ricinus and the risk of contracting Lyme borreliosis will increase northwards when the vegetation period becomes longer. Ticks Tick-Borne Dis. 2011, 2, 44–49. [Google Scholar] [CrossRef]
- Gray, J.; Dautel, H.; Estrada-Peña, A.; Kahl, O.; Lindgren, E. Effects of climate change on Ticks and Tick-borne Diseases in Europe. Interdiscip. Perspect. Infect. Dis. 2009, 2009, 593232. [Google Scholar] [CrossRef]
- Tokarevich, N.K.; Tronin, A.A.; Blinova, O.V.; Buzinov, R.V.; Boltenkov, V.P.; Yurasova, E.D.; Nurse, J. The impact of climate change on the expansion of Ixodes persulcatus habitat and the incidence of tick-borne encephalitis in the north of European Russia. Glob. Health Action 2011, 4, 8448. [Google Scholar] [CrossRef] [PubMed]
- Bugmyrin, S.; Bespyatova, L.; Korotkov, Y.S. Long-term dynamics of Ixodes persulcatus (Acari: Ixodidae) abundance in the north–west of its range (Karelia, Russia). Exp. Appl. Acarol. 2019, 77, 229–240. [Google Scholar] [CrossRef] [PubMed]
- Jaenson, T.G.; Värv, K.; Fröjdman, I.; Jääskeläinen, A.; Rundgren, K.; Versteirt, V.; Estrada-Peña, A.; Medlock, J.M.; Golovljova, I. First evidence of established populations of the taiga tick Ixodes persulcatus (Acari: Ixodidae) in Sweden. Parasites Vectors 2016, 9, 377. [Google Scholar] [CrossRef]
- Sormunen, J.J.; Penttinen, R.; Klemola, T.; Hänninen, J.; Vuorinen, I.; Laaksonen, M.; Sääksjärvi, I.E.; Ruohomäki, K.; Vesterinen, E.J. Tick-borne bacterial pathogens in southwestern Finland. Parasites Vectors 2016, 9, 168. [Google Scholar] [CrossRef] [Green Version]
- National Center of Infectious and Parasitic Diseases. Инφоpмaционeн Жypнaл. Available online: https://ncipd.org/index.php?option=com_k2&view=item&layout=item&id=134&Itemid=1163&lang=en (accessed on 31 May 2021).
- Ginsberg, H.S.; Albert, M.; Acevedo, L.; Dyer, M.C.; Arsnoe, I.M.; Tsao, J.I.; Mather, T.N.; LeBrun, R.A. Environmental Factors Affecting Survival of Immature Ixodes scapularis and Implications for Geographical Distribution of Lyme Disease: The Climate/Behavior Hypothesis. PLoS ONE 2017, 12, e0168723. [Google Scholar] [CrossRef] [PubMed]
- Hansford, K.M.; Fonville, M.; Gillingham, E.L.; Coipan, E.C.; Pietzsch, M.E.; Krawczyk, A.I.; Vaux, A.G.; Cull, B.; Sprong, H.; Medlock, J.M. Ticks and Borrelia in urban and peri-urban green space habitats in a city in southern England. Ticks Tick-Borne Dis. 2017, 8, 353–361. [Google Scholar] [CrossRef] [PubMed]
- Klemola, T.; Sormunen, J.J.; Mojzer, J.; Mäkelä, S.; Vesterinen, E.J. High tick abundance and diversity of tick-borne pathogens in a Finnish city. Urban. Ecosyst. 2019, 22, 817–826. [Google Scholar] [CrossRef] [Green Version]
- Kowalec, M.; Szewczyk, T.; Welc-Falęciak, R.; Siński, E.; Karbowiak, G.; Bajer, A. Ticks and the city-are there any differences between city parks and natural forests in terms of tick abundance and prevalence of spirochaetes? Parasites Vectors 2017, 10, 573. [Google Scholar] [CrossRef]
- Maetzel, D.; Maier, W.A.; Kampen, H. Borrelia burgdorferi infection prevalences in questing Ixodes ricinus ticks (Acari: Ixodidae) in urban and suburban Bonn, western Germany. Parasitol. Res. 2005, 95, 5–12. [Google Scholar] [CrossRef]
- Oechslin, C.P.; Heutschi, D.; Lenz, N.; Tischhauser, W.; Péter, O.; Rais, O.; Beuret, C.M.; Leib, S.L.; Bankoul, S.; Ackermann-Gäumann, R. Prevalence of tick-borne pathogens in questing Ixodes ricinus ticks in urban and suburban areas of Switzerland. Parasites Vectors 2017, 10, 558. [Google Scholar] [CrossRef] [Green Version]
- Schorn, S.; Pfister, K.; Reulen, H.; Mahling, M.; Silaghi, C. Occurrence of Babesia spp., Rickettsia spp. and Bartonella spp. in Ixodes ricinus in Bavarian public parks, Germany. Parasites Vectors 2011, 4, 135. [Google Scholar] [CrossRef] [PubMed] [Green Version]
- VanAcker, M.C.; Little, E.A.; Molaei, G.; Bajwa, W.I.; Diuk-Wasser, M.A. Enhancement of risk for lyme disease by landscape connectivity, New York, New York, USA. Emerg. Infect. Dis. 2019, 25, 1136. [Google Scholar] [CrossRef] [PubMed]
- Žákovská, A.; Vostal, K.; Martiníková, H. A longitudinal study of the prevalence of borreliae in ticks in the urban locality of Brno-Pisárky, Czech Republic. J. Vector Ecol. 2008, 33, 385–388. [Google Scholar] [CrossRef] [PubMed]
- Rizzoli, A.; Silaghi, C.; Obiegala, A.; Rudolf, I.; Hubálek, Z.; Földvári, G.; Plantard, O.; Vayssier-Taussat, M.; Bonnet, S.; Špitalská, E. Ixodes ricinus and its transmitted pathogens in urban and peri-urban areas in Europe: New hazards and relevance for public health. Front. Public Health 2014, 2, 251. [Google Scholar] [CrossRef] [PubMed]
- Blazhev, A.; Karcheva, M.; Cenova, A.; Blazheva, S.; Kostov, K. Serological Tests for Lyme Borreliosis. Gen. Med. 2018, 20, 20–24. [Google Scholar]
- Karcheva, M.; Blazhev, A.; Tsenova, A.; Atanasova, M.; Kostov, K. Retrospective seroepidemiological survey of Lyme borreliosis in Pleven region, Bulgaria. Eur. J. Public Health 2018, 28. [Google Scholar] [CrossRef]
- Angelov, V. Association “Hunting and Fishing Society-Pleven” from Its Foundation to the Present Day, 1st ed.; Borisova, G., Ed.; University Press St. Kliment Ohridski: Sofia, Bulgaria, 2019; p. 340. [Google Scholar]
- Needham, G.R.; Teel, P.D. Off-host physiological ecology of Ixodid ticks. Annu. Rev. Entomol. 1991, 36, 659–681. [Google Scholar] [CrossRef]
- Schulze, T.L.; Jordan, R.A.; Hung, R.W. Effects of selected meteorological factors on diurnal questing of Ixodes scapularis and Amblyomma americanum (Acari: Ixodidae). J. Med Entomol. 2001, 38, 318–324. [Google Scholar] [CrossRef]
- Georgieva, G.; Gecheva, G. Fauna Bulgaria 32; Beron, P., Ed.; Marin Drinov Academic Publishing House: Sofia, Bulgaria, 2013; Volume 32, p. 226. [Google Scholar]
- Filipova, N.A. Ixodid Ticks Subfamily Ixodinae; Nauka, Moscow: Leningrad, Russia, 1977; Volume 4, p. 396. [Google Scholar]
- Estrada-Peña, A.; Mihalca, A.D.; Petney, T.N. Ticks of Europe and North Africa: A Guide to Species Identification; Springer: Berlin/Heidelberg, Germany, 2018. [Google Scholar]
- Mathews-Martin, L.; Namèche, M.; Vourc’h, G.; Gasser, S.; Lebert, I.; Poux, V.; Barry, S.; Bord, S.; Jachacz, J.; Chalvet-Monfray, K.; et al. Questing tick abundance in urban and peri-urban parks in the French city of Lyon. Parasites Vectors 2020, 13, 576. [Google Scholar] [CrossRef]
- Schorn, S.; Pfister, K.; Reulen, H.; Mahling, M.; Manitz, J.; Thiel, C.; Silaghi, C. Prevalence of Anaplasma phagocytophilum in Ixodes ricinus in Bavarian public parks, Germany. Ticks Tick-Borne Dis. 2011, 2, 196–203. [Google Scholar] [CrossRef]
- Corrain, R.; Drigo, M.; Fenati, M.; Menandro, M.; Mondin, A.; Pasotto, D.; Martini, M. Study on ticks and tick-borne zoonoses in public parks in Italy. Zoonoses Public Health 2012, 59, 468–476. [Google Scholar] [CrossRef]
- Gladnishka, T.K.; Tasseva, E.I.; Christova, I.S.; Nikolov, M.A.; Lazarov, S.P. Detection of Borrelia burgdorferi sensu lato, Anaplasma phagocytophilum and spotted fever group rickettsiae in ticks from the region of Sofia, Bulgaria (Acari: Parasitiformes: Ixodidae). Eur. Arachnol. 2005, 58, 339–343. [Google Scholar]
- Medlock, J.M.; Hansford, K.M.; Bormane, A.; Derdakova, M.; Estrada-Peña, A.; George, J.-C.; Golovljova, I.; Jaenson, T.G.T.; Jensen, J.-K.; Jensen, P.M.; et al. Driving forces for changes in geographical distribution of Ixodes ricinus ticks in Europe. Parasites Vectors 2013, 6, 1. [Google Scholar] [CrossRef] [Green Version]
- Macleod, J. Ixodes ricinus in relation to its physical environment: IV. An analysis of the ecological complexes controlling distribution and activities. Parasitology 1936, 28, 295–319. [Google Scholar] [CrossRef]
- Kahl, O.; Knülle, W. Water vapour uptake from subsaturated atmospheres by engorged immature ixodid ticks. Exp. Appl. Acarol. 1988, 4, 73–83. [Google Scholar] [CrossRef] [PubMed]
- Perret, J.-L.; Rais, O.; Gern, L. Influence of Climate on the Proportion of Ixodes ricinus Nymphs and Adults Questing in a Tick Population. J. Med. Entomol. 2004, 41, 361–365. [Google Scholar] [CrossRef] [PubMed] [Green Version]
- Meteoblue Whether Close to You. Weather History Download Pleven. Available online: https://www.meteoblue.com/en/weather/week/pleven_bulgaria_728203 (accessed on 23 May 2021).
- Knulle, W.; Rudolph, D. Humidity Relationships and Water Balance of Ticks. Physiol. Ticks 1982, 43–70. [Google Scholar] [CrossRef]
- Anderson, J.F.; Magnarelli, L.A. Biology of ticks. Infect. Dis. Clin. N. Am. 2008, 22, 195–215. [Google Scholar] [CrossRef]
- Herrmann, C.; Gern, L. Survival of Ixodes ricinus (Acari: Ixodidae) under challenging conditions of temperature and humidity is influenced by Borrelia burgdorferi sensu lato infection. J. Med. Entomol. 2010, 47, 1196–1204. [Google Scholar] [CrossRef]
- Falco, R.C.; Fish, D. Potential for exposure to tick bites in recreational parks in a Lyme disease endemic area. Am. J. Public Health 1989, 79, 12–15. [Google Scholar] [CrossRef]
- Collini, M.; Albonico, F.; Rosà, R.; Tagliapietra, V.; Arnoldi, D.; Conterno, L.; Rossi, C.; Mortarino, M.; Rizzoli, A.; Hauffe, H.C. Identification of Ixodes ricinus blood meals using an automated protocol with high resolution melting analysis (HRMA) reveals the importance of domestic dogs as larval tick hosts in Italian alpine forests. Parasites Vectors 2016, 9, 638. [Google Scholar] [CrossRef] [PubMed] [Green Version]
- Diuk-Wasser, M.A.; Hoen, A.G.; Cislo, P.; Brinkerhoff, R.; Hamer, S.A.; Rowland, M.; Cortinas, R.; Vourc’h, G.; Melton, F.; Hickling, G.J. Human risk of infection with Borrelia burgdorferi, the Lyme disease agent, in eastern United States. Am. J. Trop. Med. Hyg. 2012, 86, 320–327. [Google Scholar] [CrossRef] [PubMed]
- Ostfeld, R. Lyme Disease: The Ecology of a Complex System; Oxford University Press: New York, NY, USA, 2011. [Google Scholar]
- Aguirre, A.A.; Ostfeld, R.S.; Tabor, G.M.; House, C.; Pearl, M.C. Conservation Medicine: Ecological Health in Practice; Oxford University Press: Oxford, UK, 2002. [Google Scholar]
- Gray, J.S.; Kahl, O.; Lane, R.S.; Levin, M.L.; Tsao, J.I. Diapause in ticks of the medically important Ixodes ricinus species complex. Ticks Tick-Borne Dis. 2016, 7, 992–1003. [Google Scholar] [CrossRef] [PubMed] [Green Version]
- Gray, J. The development and seasonal activity of the tick Ixodes ricinus: A vector of Lyme borreliosis. Rev. Med Vet. Entomol. 1991, 79, 323–333. [Google Scholar]


| Sampling Site | Latitude | Longitude | Altitude (m) | Size of the Sampling Site (m2) | Land Class |
|---|---|---|---|---|---|
| U1 | 43.3886736 | 24.6251901 | 154.90 | 730 | Mainly on maintained lawn areas. However, the lawn is speckled with tree stands with leaf litter and understory vegetation, and some meadow areas, where flagging was conducted. Both deciduous and coniferous trees are present, with deciduous tree stands dominating. The area contains no forests. |
| U2 | 43.3856494 | 24.6257367 | 139.66 | 530 | Parking for cars and lawns. Recreation and sports area with sycamore trees (Platanus spp.) |
| U3 | 43.3837788 | 24.6313879 | 127.38 | 440 | The zoo, restaurant, cafes, playgrounds, open lawns with deciduous trees in the periphery. The zoo breeds deer (Cervus elaphus), fallow deer (Dama dama), a large population of African pigmy goat (Capra aegagrus hircus), mouflon (Ovis gmelini), brown bear (Ursus arctos) and various birds. |
| U4 | 43.379304 | 24.623335 | 152.35 | 520 | Abandoned parachute platform, area for rock climbing, meadows, swimming pool. |
| W1 | 43.375829 | 24.625912 | 147.55 | 450 | Nature-orientated part of the park, surrounded by high limestone cliffs in the karst valley of the Touchenitsa River. More forest-like structures with higher tree density, underbrush and wild animals such as roe deer exist in this part of Kaylaka Park. The lawns are mowed much less often and, therefore, areas with longer grass and bushes exist and park visitors have to stay on the walkways. Abandoned arboretum. |
| W2 | 43.345075 | 24.652153 | 192.88 | 520 | Area around of the hut “Srebrostruy”, poorly maintained sports ground, a camping site and an adjoining car park. The area has dense mixed forest, high humidity and many animal species. |
| W3 | 43.383098 | 24.626121 | 179.98 | 460 | The area around the ancient Roman fortress Strogozia, located above the river canyon. Narrow path between deciduous trees, open lawns are not maintained. Plenty of elderberry (Sambucus nigra) and ivy (Hedera helix). It has a weak presence of domestic animals such as strays dogs, and large mammals such as roe deer often pass. |
| W4 | 43.341813 | 24.6437243 | 253.20 | 4000 | Protected forest territory “Bohotska Gora”, located southeast of the city of Pleven. Total area of 46.1 ha. The forest consists mainly of deciduous trees species such as oak (Quercus sp.), beech (Fagus sylvatica). The shrub layer includes mainly hawthorn (Crataegus sp.), smoke bush (Cotinus sp.) and rosehip (Rosa canina). Large wild mammals such as roe deer, wild boar, jackals and foxes exist. |
| Period | Area Type | 2016 | 2017 | 2018 | 2019 | 2020 | Total |
|---|---|---|---|---|---|---|---|
| 1–10 March | U | - | - | - | 7 | - | 7 |
| W | - | - | - | 4 | - | 4 | |
| 11–20 March | U | - | - | 13 | 2 | - | 15 |
| W | 12 | - | - | - | - | 12 | |
| 21–31 March | U | - | - | 23 | 15 | - | 38 |
| W | - | - | - | - | - | 0 | |
| 1–10 April | U | 25 | - | - | 1 | - | 26 |
| W | 4 | - | 39 | - | - | 43 | |
| 11–20 April | U | - | - | - | 20 | - | 20 |
| W | - | - | - | - | - | 0 | |
| 21–30 April | U | - | - | 11 | 12 | - | 23 |
| W | - | - | - | 79 | 18 | 97 | |
| 1–10 May | U | - | 15 | - | - | - | 15 |
| W | 61 | 35 | 56 | 46 | - | 198 | |
| 11–20 May | U | - | - | - | - | - | 0 |
| W | - | - | - | 17 | 52 | 69 | |
| 21–30 May | U | - | - | - | 23 | - | 23 |
| W | - | - | - | - | - | 0 | |
| 1–10 June | U | 18 | - | - | 3 | - | 21 |
| W | - | - | - | - | - | 0 | |
| 11–20 June | U | - | - | - | 5 | - | 5 |
| W | - | - | - | - | - | 0 | |
| 21–31 June | U | - | - | - | 6 | - | 6 |
| W | - | - | - | - | - | 0 | |
| Total | 120 | 50 | 142 | 240 | 70 | 622 |
| Areas | Number of Flagging Event (N) | TQI | AQI | NQI | TM |
|---|---|---|---|---|---|
| U1–U3 | NU1 = 7 NU3 = 5 | NS | NS | NS | U = 5.000 Z = −2.037 p = 0.042 |
| U1–W1 | NU1 = 7 NW1 = 3 | NS | NS | U = 2.000 Z = −1.961 p = 0.05 | U = 0.000 Z = −2.400 p = 0.016 |
| U1–W2 | NU1 = 7 NW2 = 6 | U = 7.00 Z = −2.00 p = 0.046 | U = 6.000 Z = 2.14 p = 0.032 | NS | U = 5.000 Z = −2.289 p = 0.022 |
| U1–W4 | NU1 = 7 NW4 = 3 | NS | NS | NS | U = 0.000 Z = −2.400 p = 0.016 |
| U2–W1 | NU2 = 9 NW1 = 3 | NS | NS | NS | U = 0.000 Z = −2.501 p = 0.012 |
| U2–W2 | NU2 = 9 NW2 = 6 | NS | U = 9.000 Z = −2.121 p = 0.034 | NS | NS |
| U2–W4 | NU2 = 9 NW4 = 3 | NS | NS | NS | U = 1.500 Z = −2.227 p = 0.026 |
| U3–W1 | NU3 = 5 NW1 = 3 | NS | NS | U = 0.000 Z = −2.382 p = 0.017 | U = 0.000 Z = −2.249 p = 0.024 |
| U3–W2 | NU3 = 5 NW2 = 6 | NS | NS | U = 3.000 Z = −2.298 p = 0.022 | NS |
| U3–W4 | NU3 = 5 NW4 = 3 | NS | NS | NS | U = 0.000 Z = −2.249 p = 0.024 |
| W1–W3 | NW1 = 3 NW3 = 4 | NS | NS | U = 0.000 Z = 2.141 p = 0.032 | NS |
| W2–W3 | NW2 = 6 NW3 = 4 | U = 2.000 Z = −2.132 p = 0.033 | U = 2.000 Z = −2.132 p = 0.033 | NS | NS |
Publisher’s Note: MDPI stays neutral with regard to jurisdictional claims in published maps and institutional affiliations. |
© 2021 by the authors. Licensee MDPI, Basel, Switzerland. This article is an open access article distributed under the terms and conditions of the Creative Commons Attribution (CC BY) license (https://creativecommons.org/licenses/by/4.0/).
Share and Cite
Blazhev, A.; Atanasova, M.; Kostov, K.; Doychinova, T.; Blazheva, S.; Karcheva, M. Estimation of Ixodes ricinus (Acari: Ixodidae) Populations of Kaylaka Park in the Town of Pleven, Bulgaria. Insects 2021, 12, 808. https://doi.org/10.3390/insects12090808
Blazhev A, Atanasova M, Kostov K, Doychinova T, Blazheva S, Karcheva M. Estimation of Ixodes ricinus (Acari: Ixodidae) Populations of Kaylaka Park in the Town of Pleven, Bulgaria. Insects. 2021; 12(9):808. https://doi.org/10.3390/insects12090808
Chicago/Turabian StyleBlazhev, Alexander, Milena Atanasova, Krasimir Kostov, Tsetsa Doychinova, Svetla Blazheva, and Milena Karcheva. 2021. "Estimation of Ixodes ricinus (Acari: Ixodidae) Populations of Kaylaka Park in the Town of Pleven, Bulgaria" Insects 12, no. 9: 808. https://doi.org/10.3390/insects12090808