
Diversity Patterns of Dung Beetles along a Mediterranean Elevational Gradient

 ,
,
Abstract
:Simple Summary
Abstract
1. Introduction
- (1)
- In open habitats (grasslands), dung beetle diversity should show a decline in biodiversity with increasing elevation as a consequence of increasing harsher conditions (lower temperatures and higher insulation);
- (2)
- If most of dung beetles prefer open habitats and if the disadvantages of harsher climatic conditions are overwhelmed by the advantages provided by a more favorable habitat type, dung beetle diversity in closed habitats (forests) should show an opposite pattern (i.e., biodiversity should increase with increasing elevation) because tree cover decreases with elevation.
2. Materials and Methods
2.1. Study Area
2.2. Sampling Protocol
2.3. Data Analysis
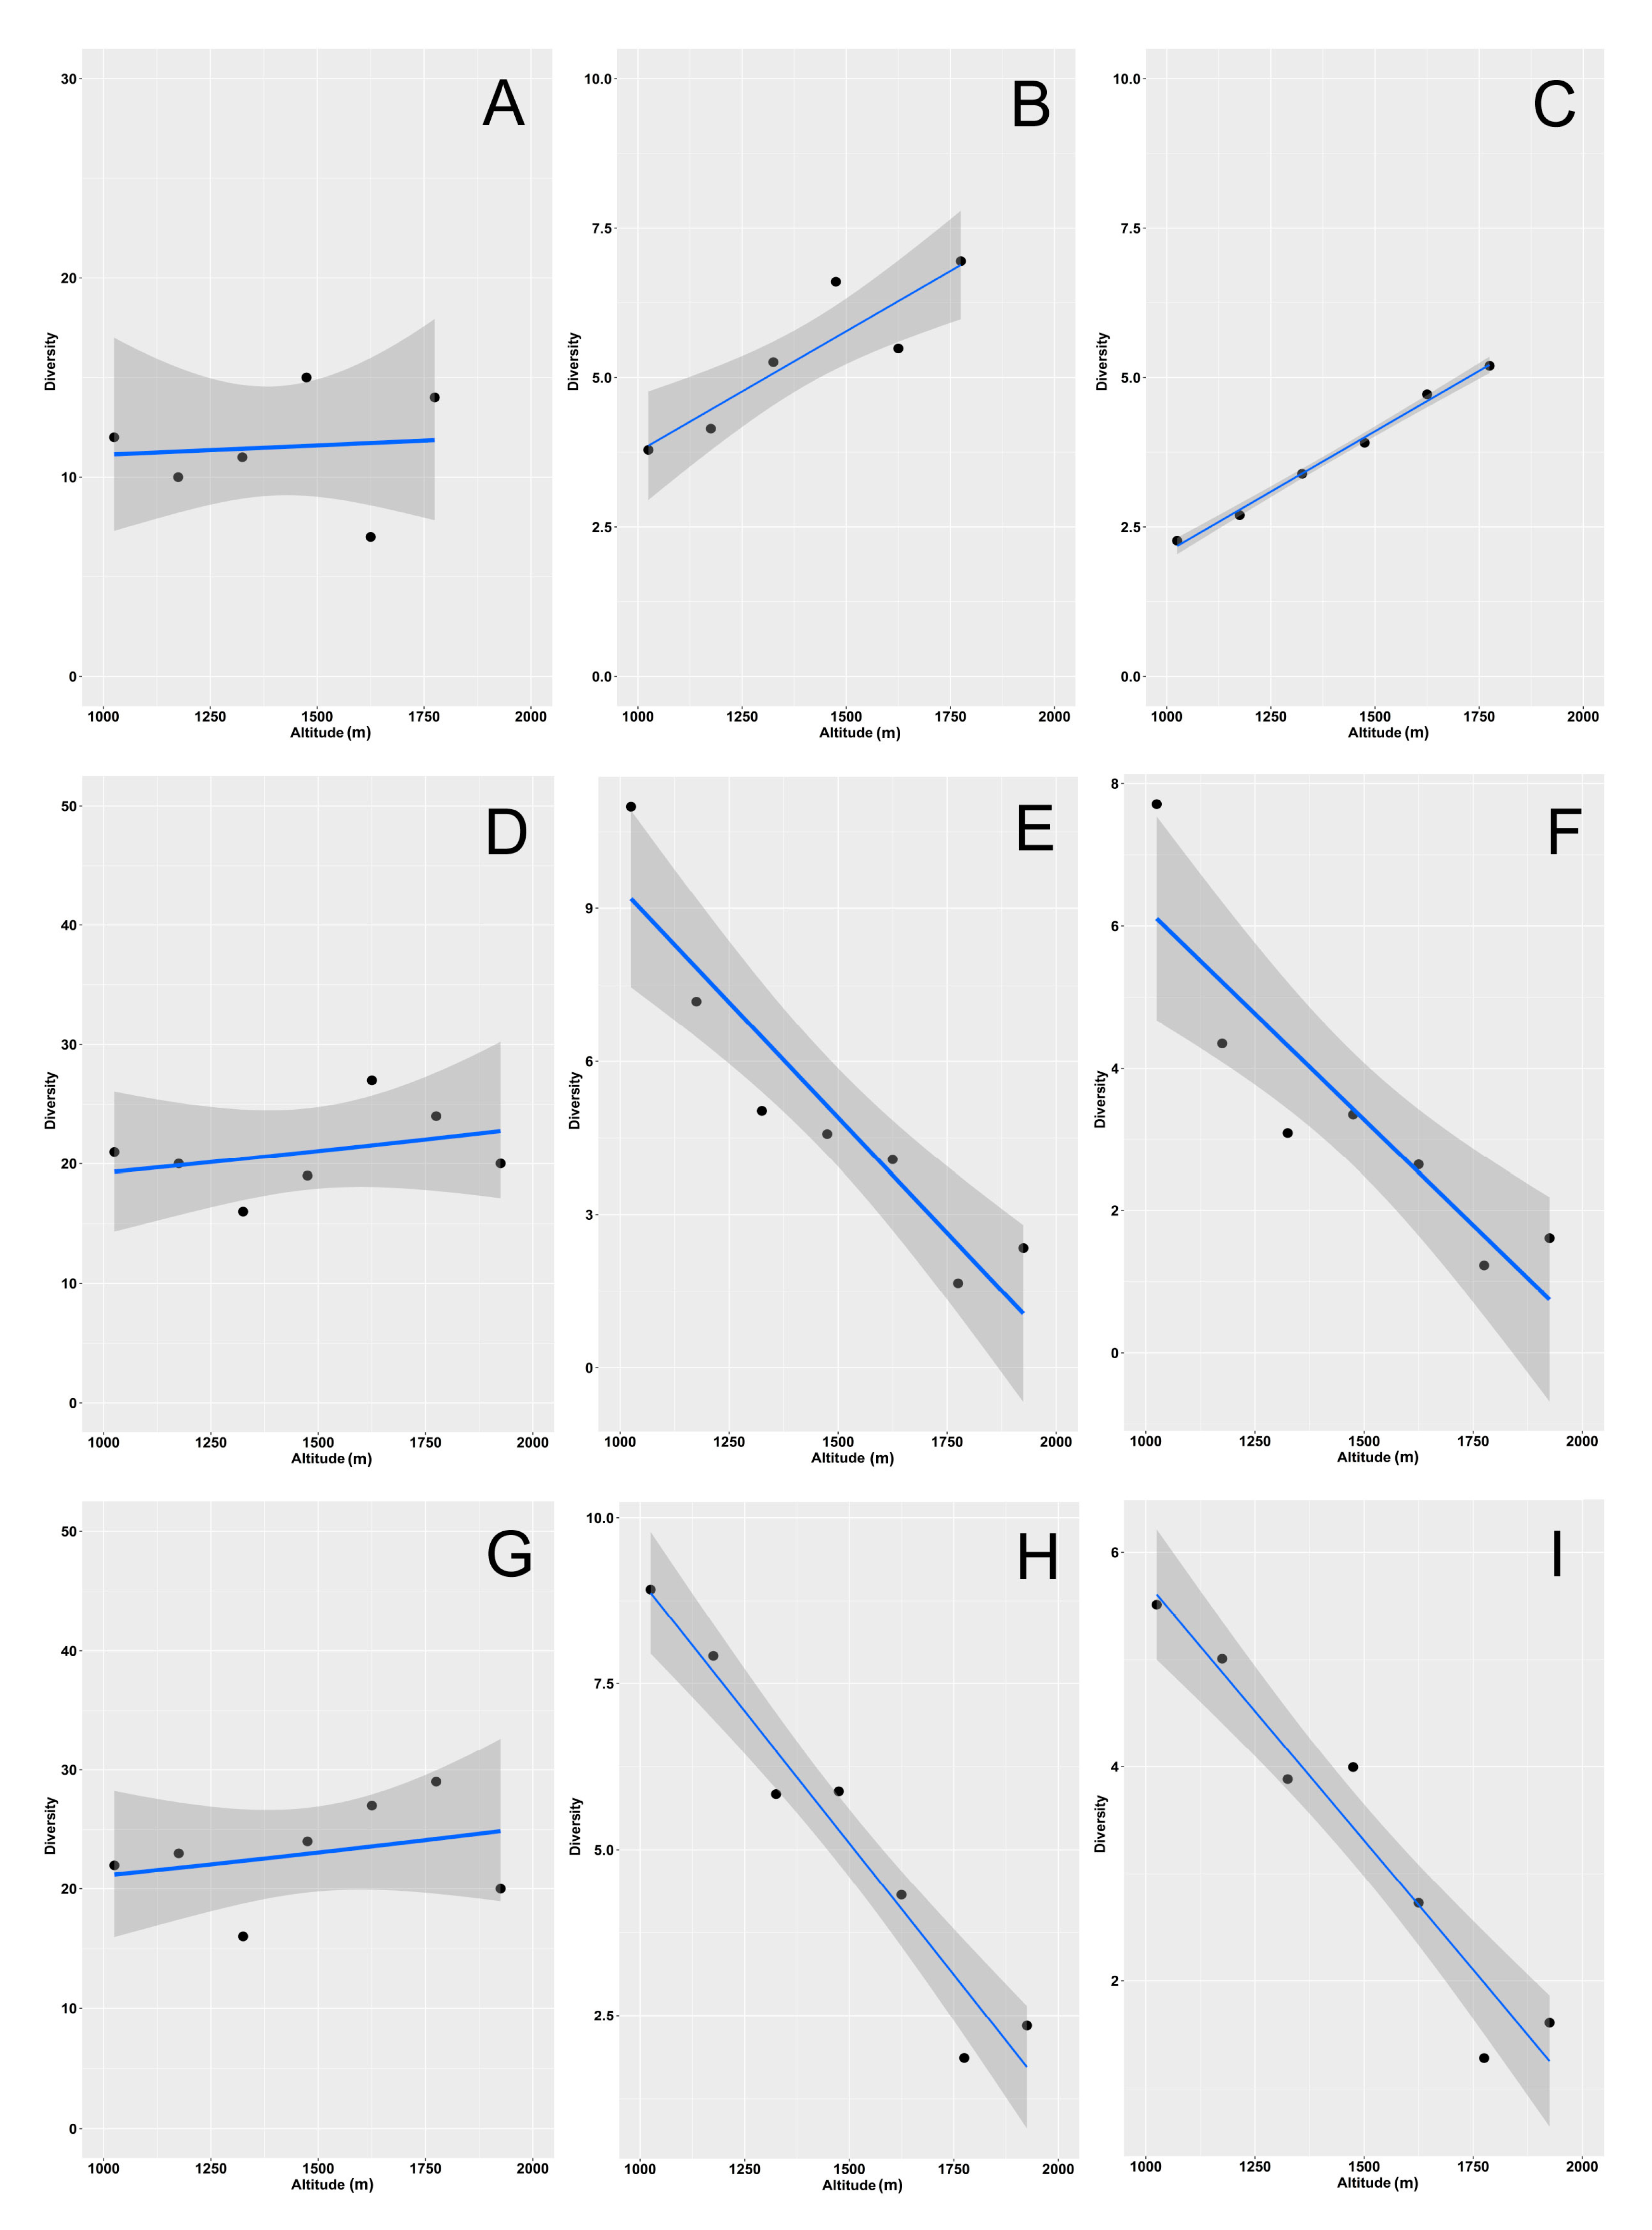
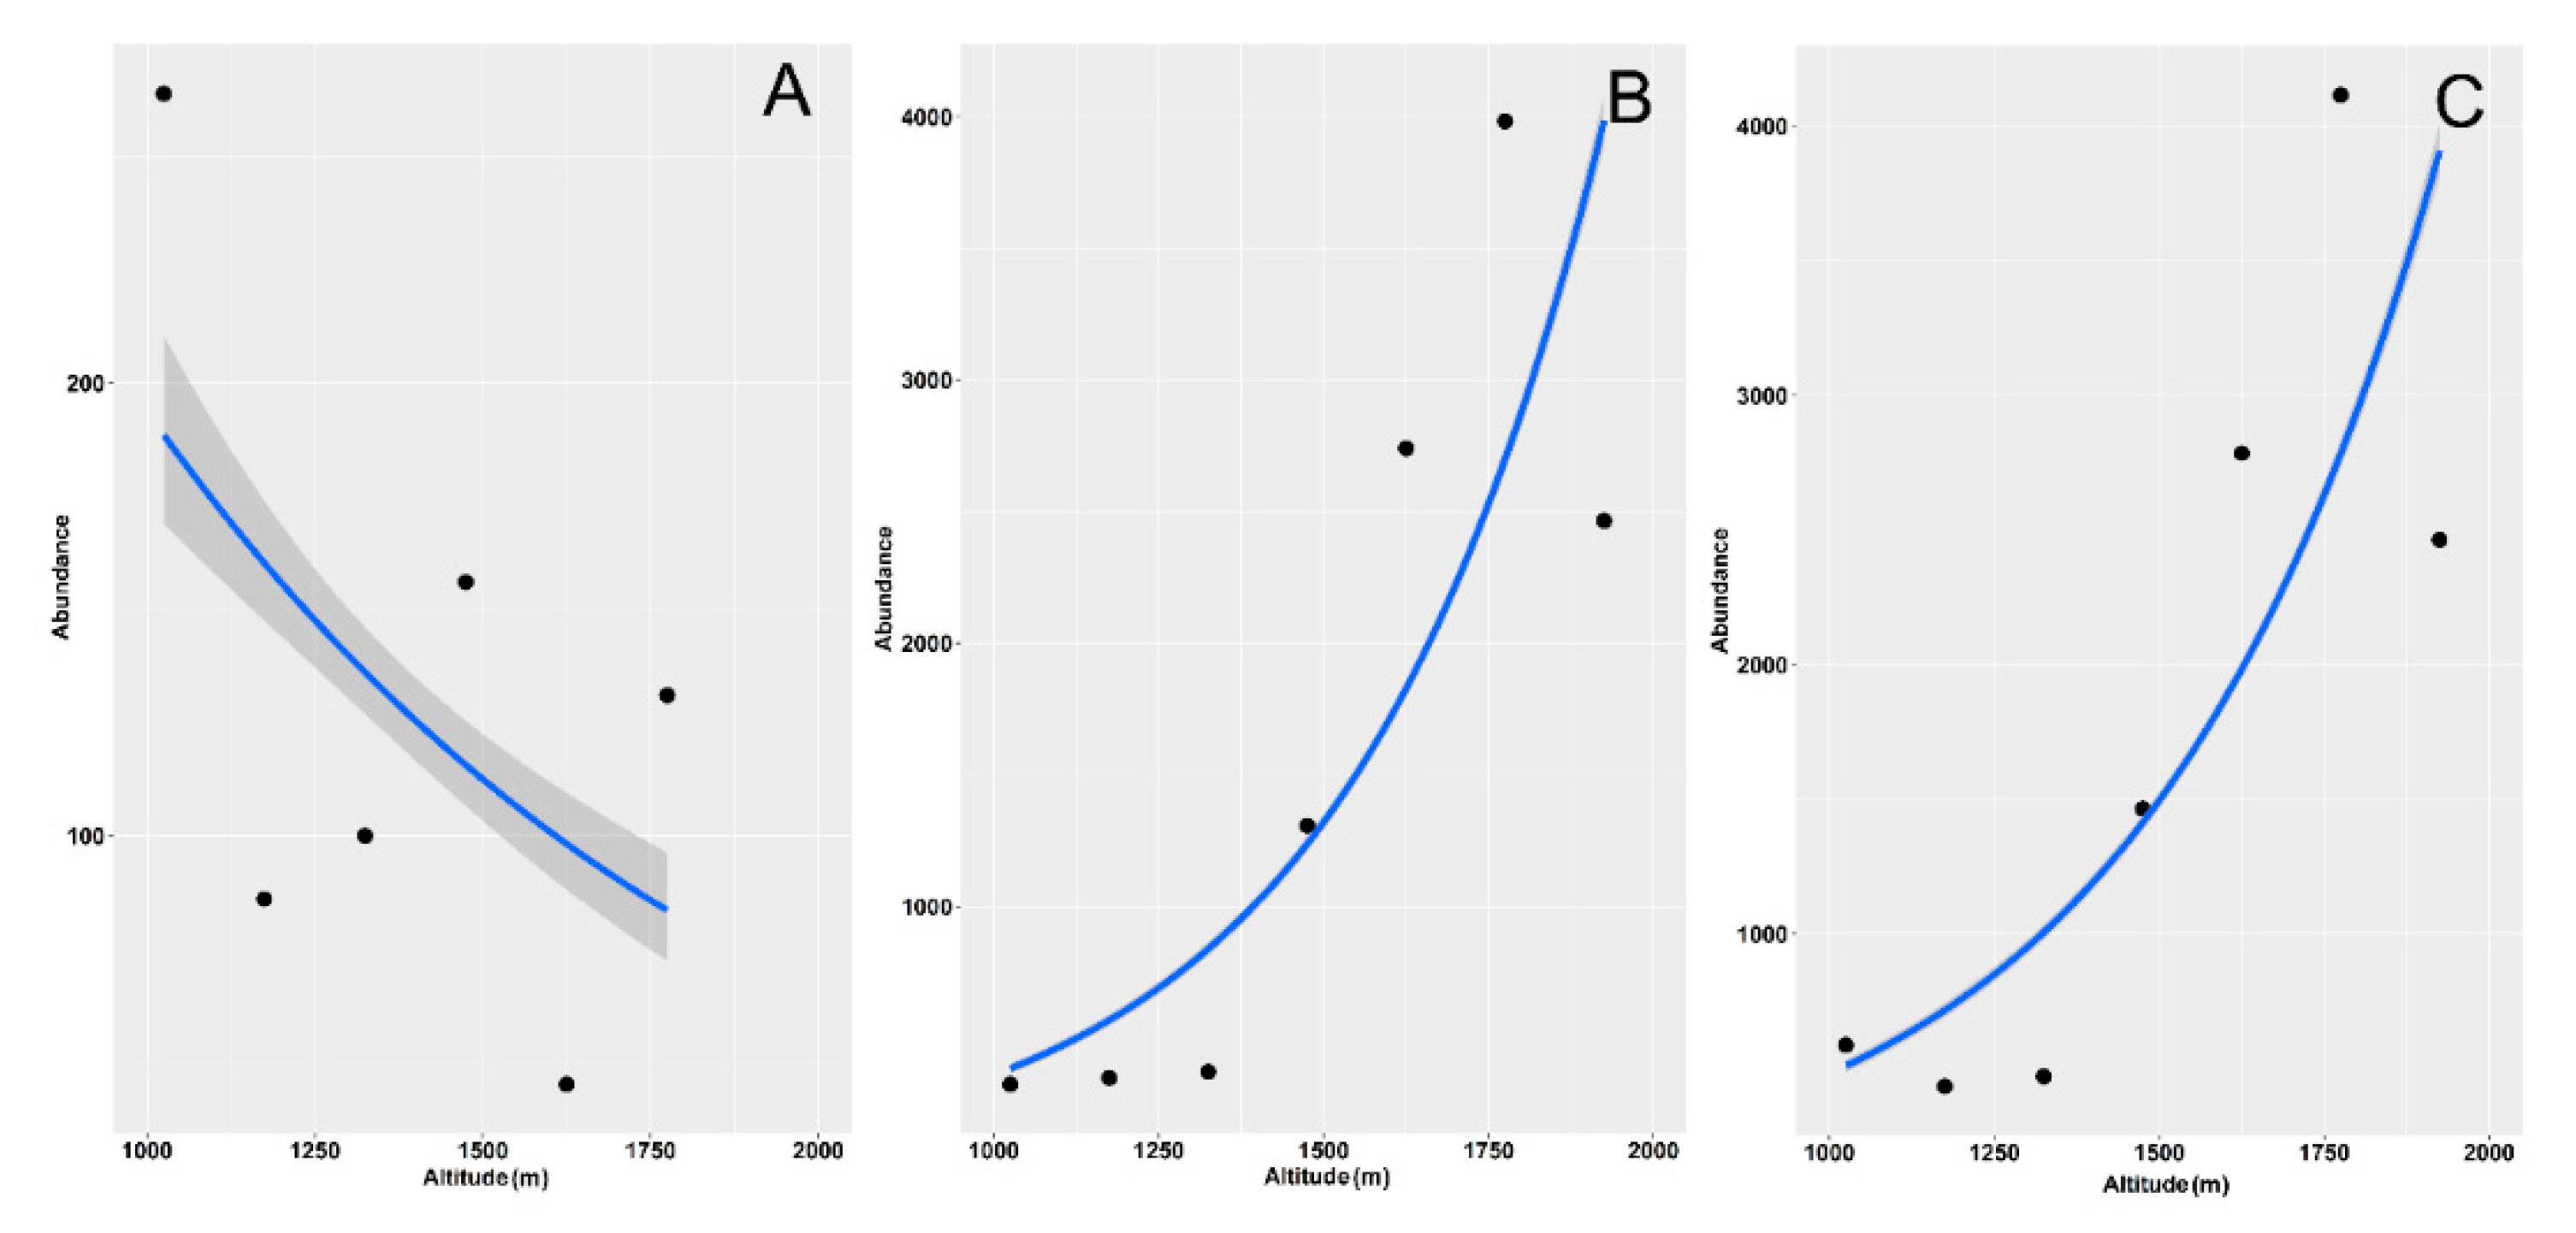
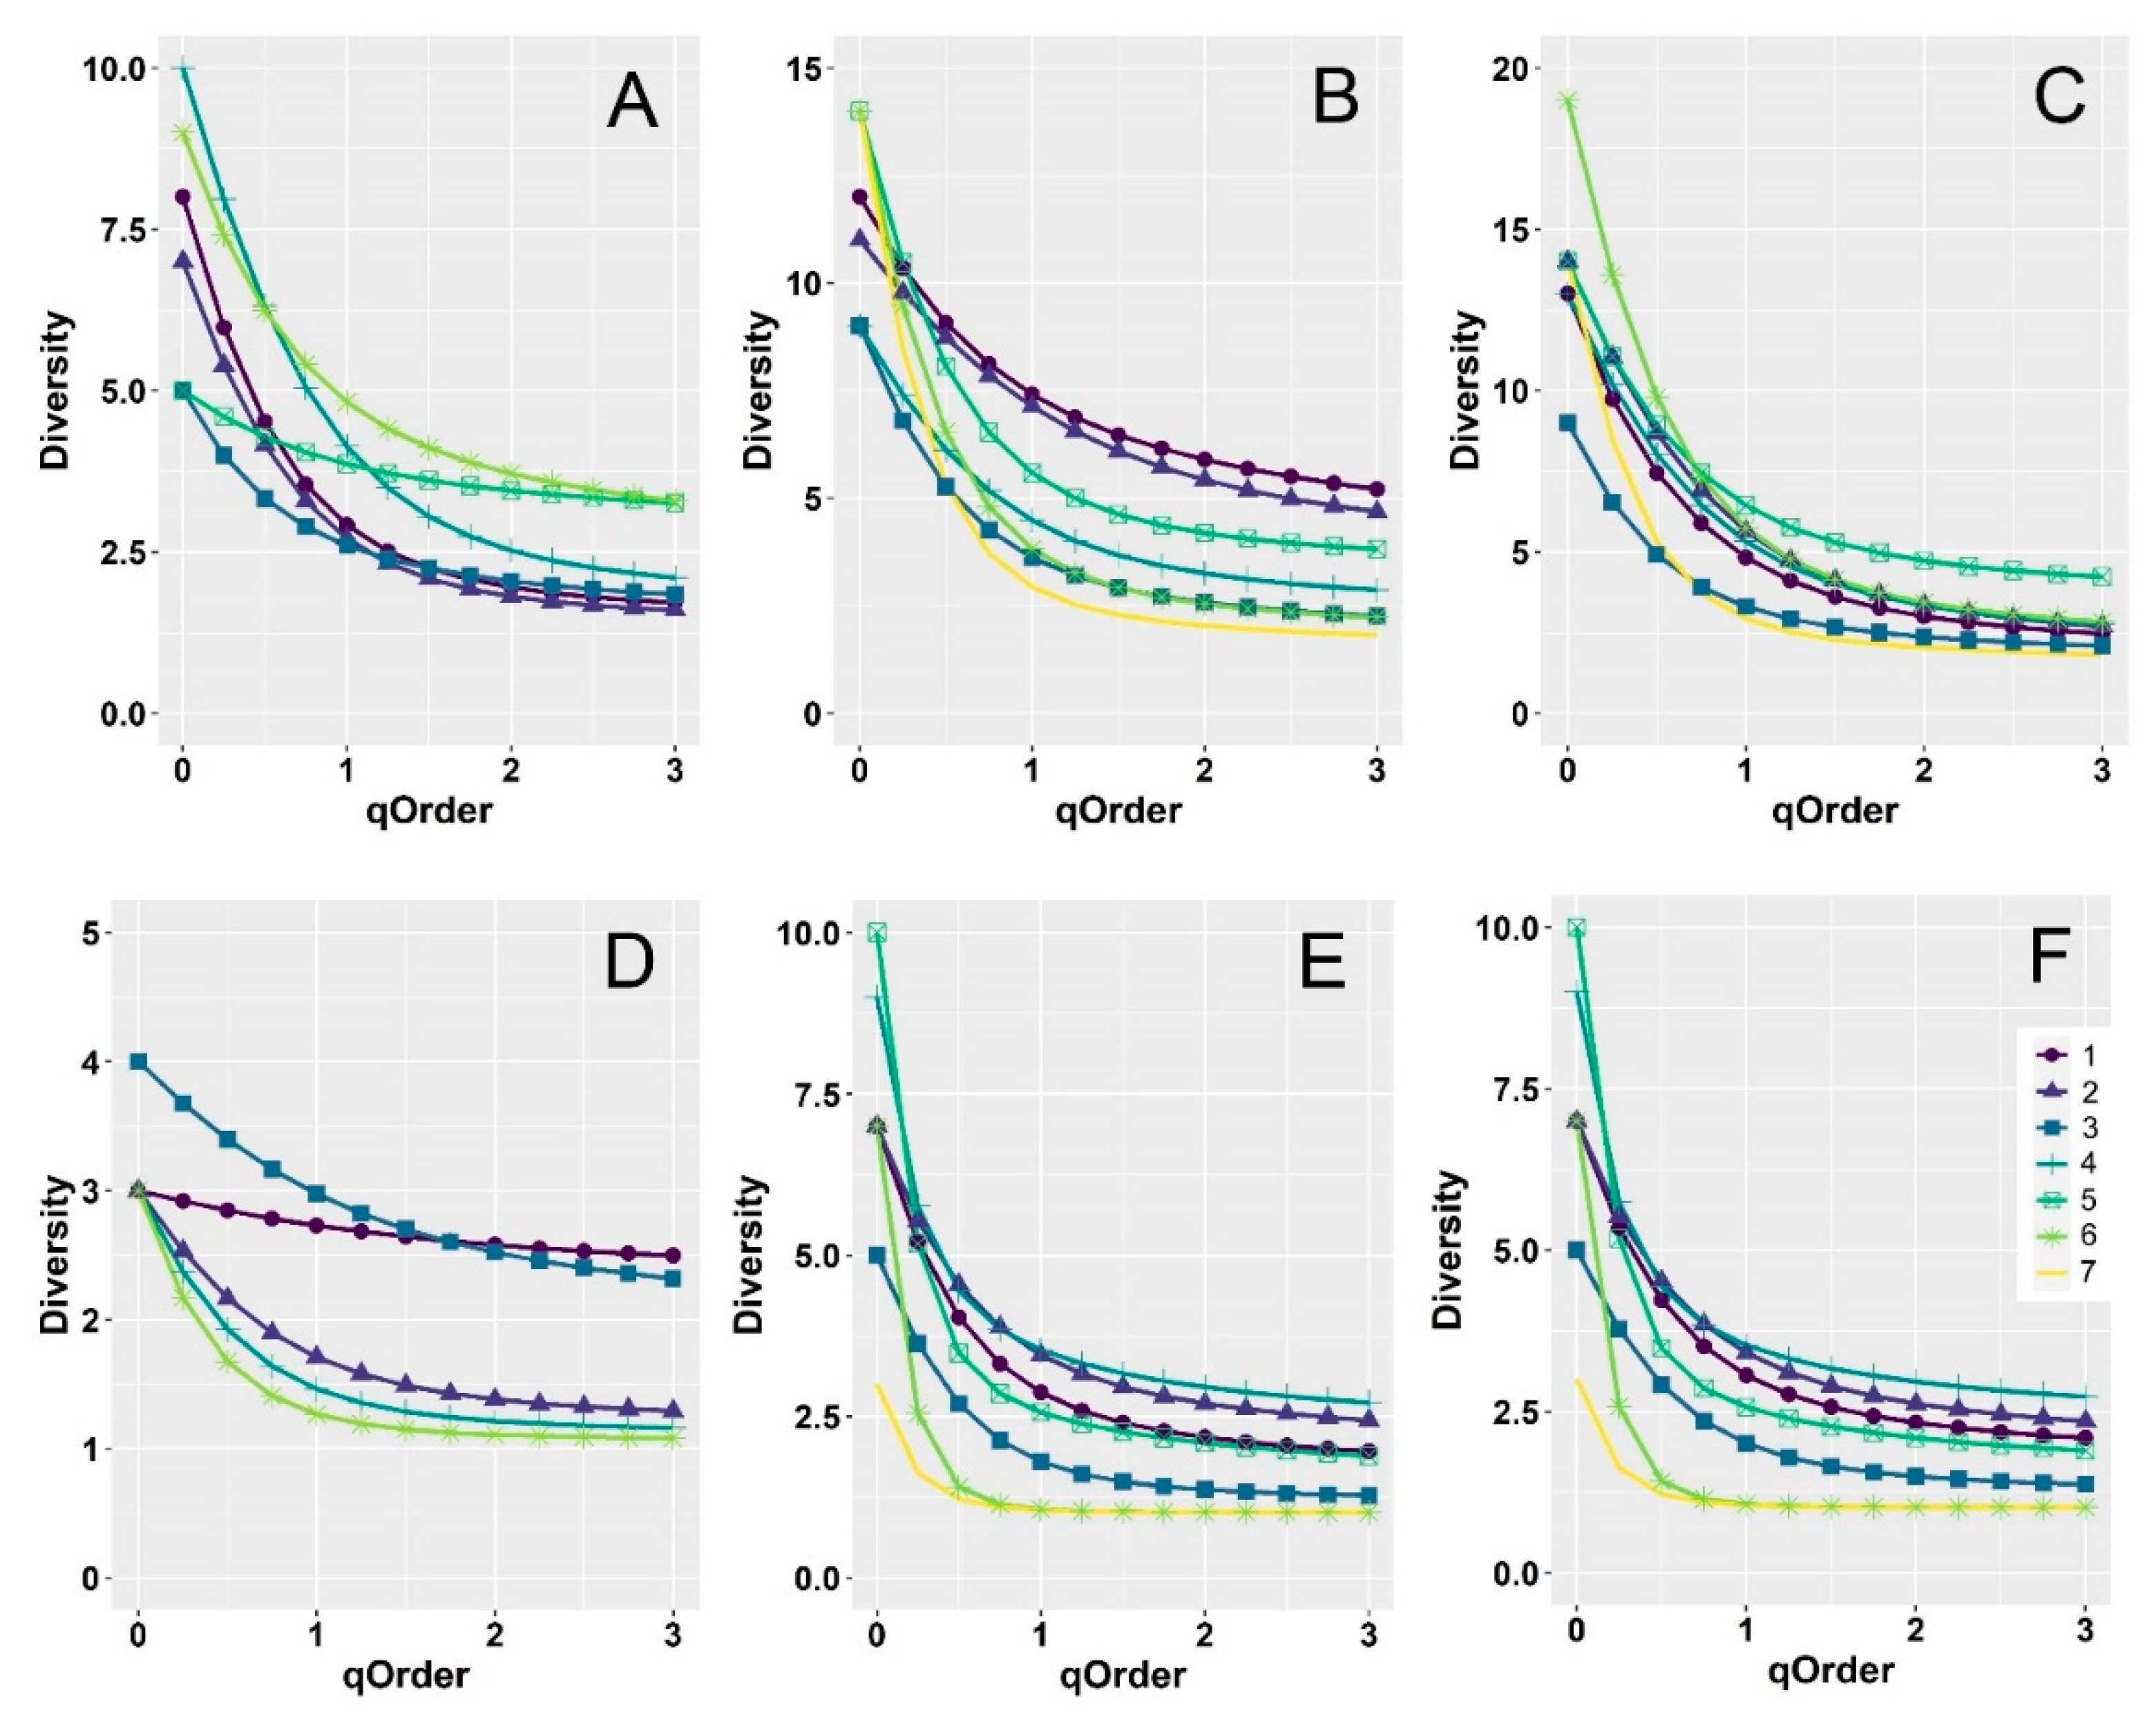
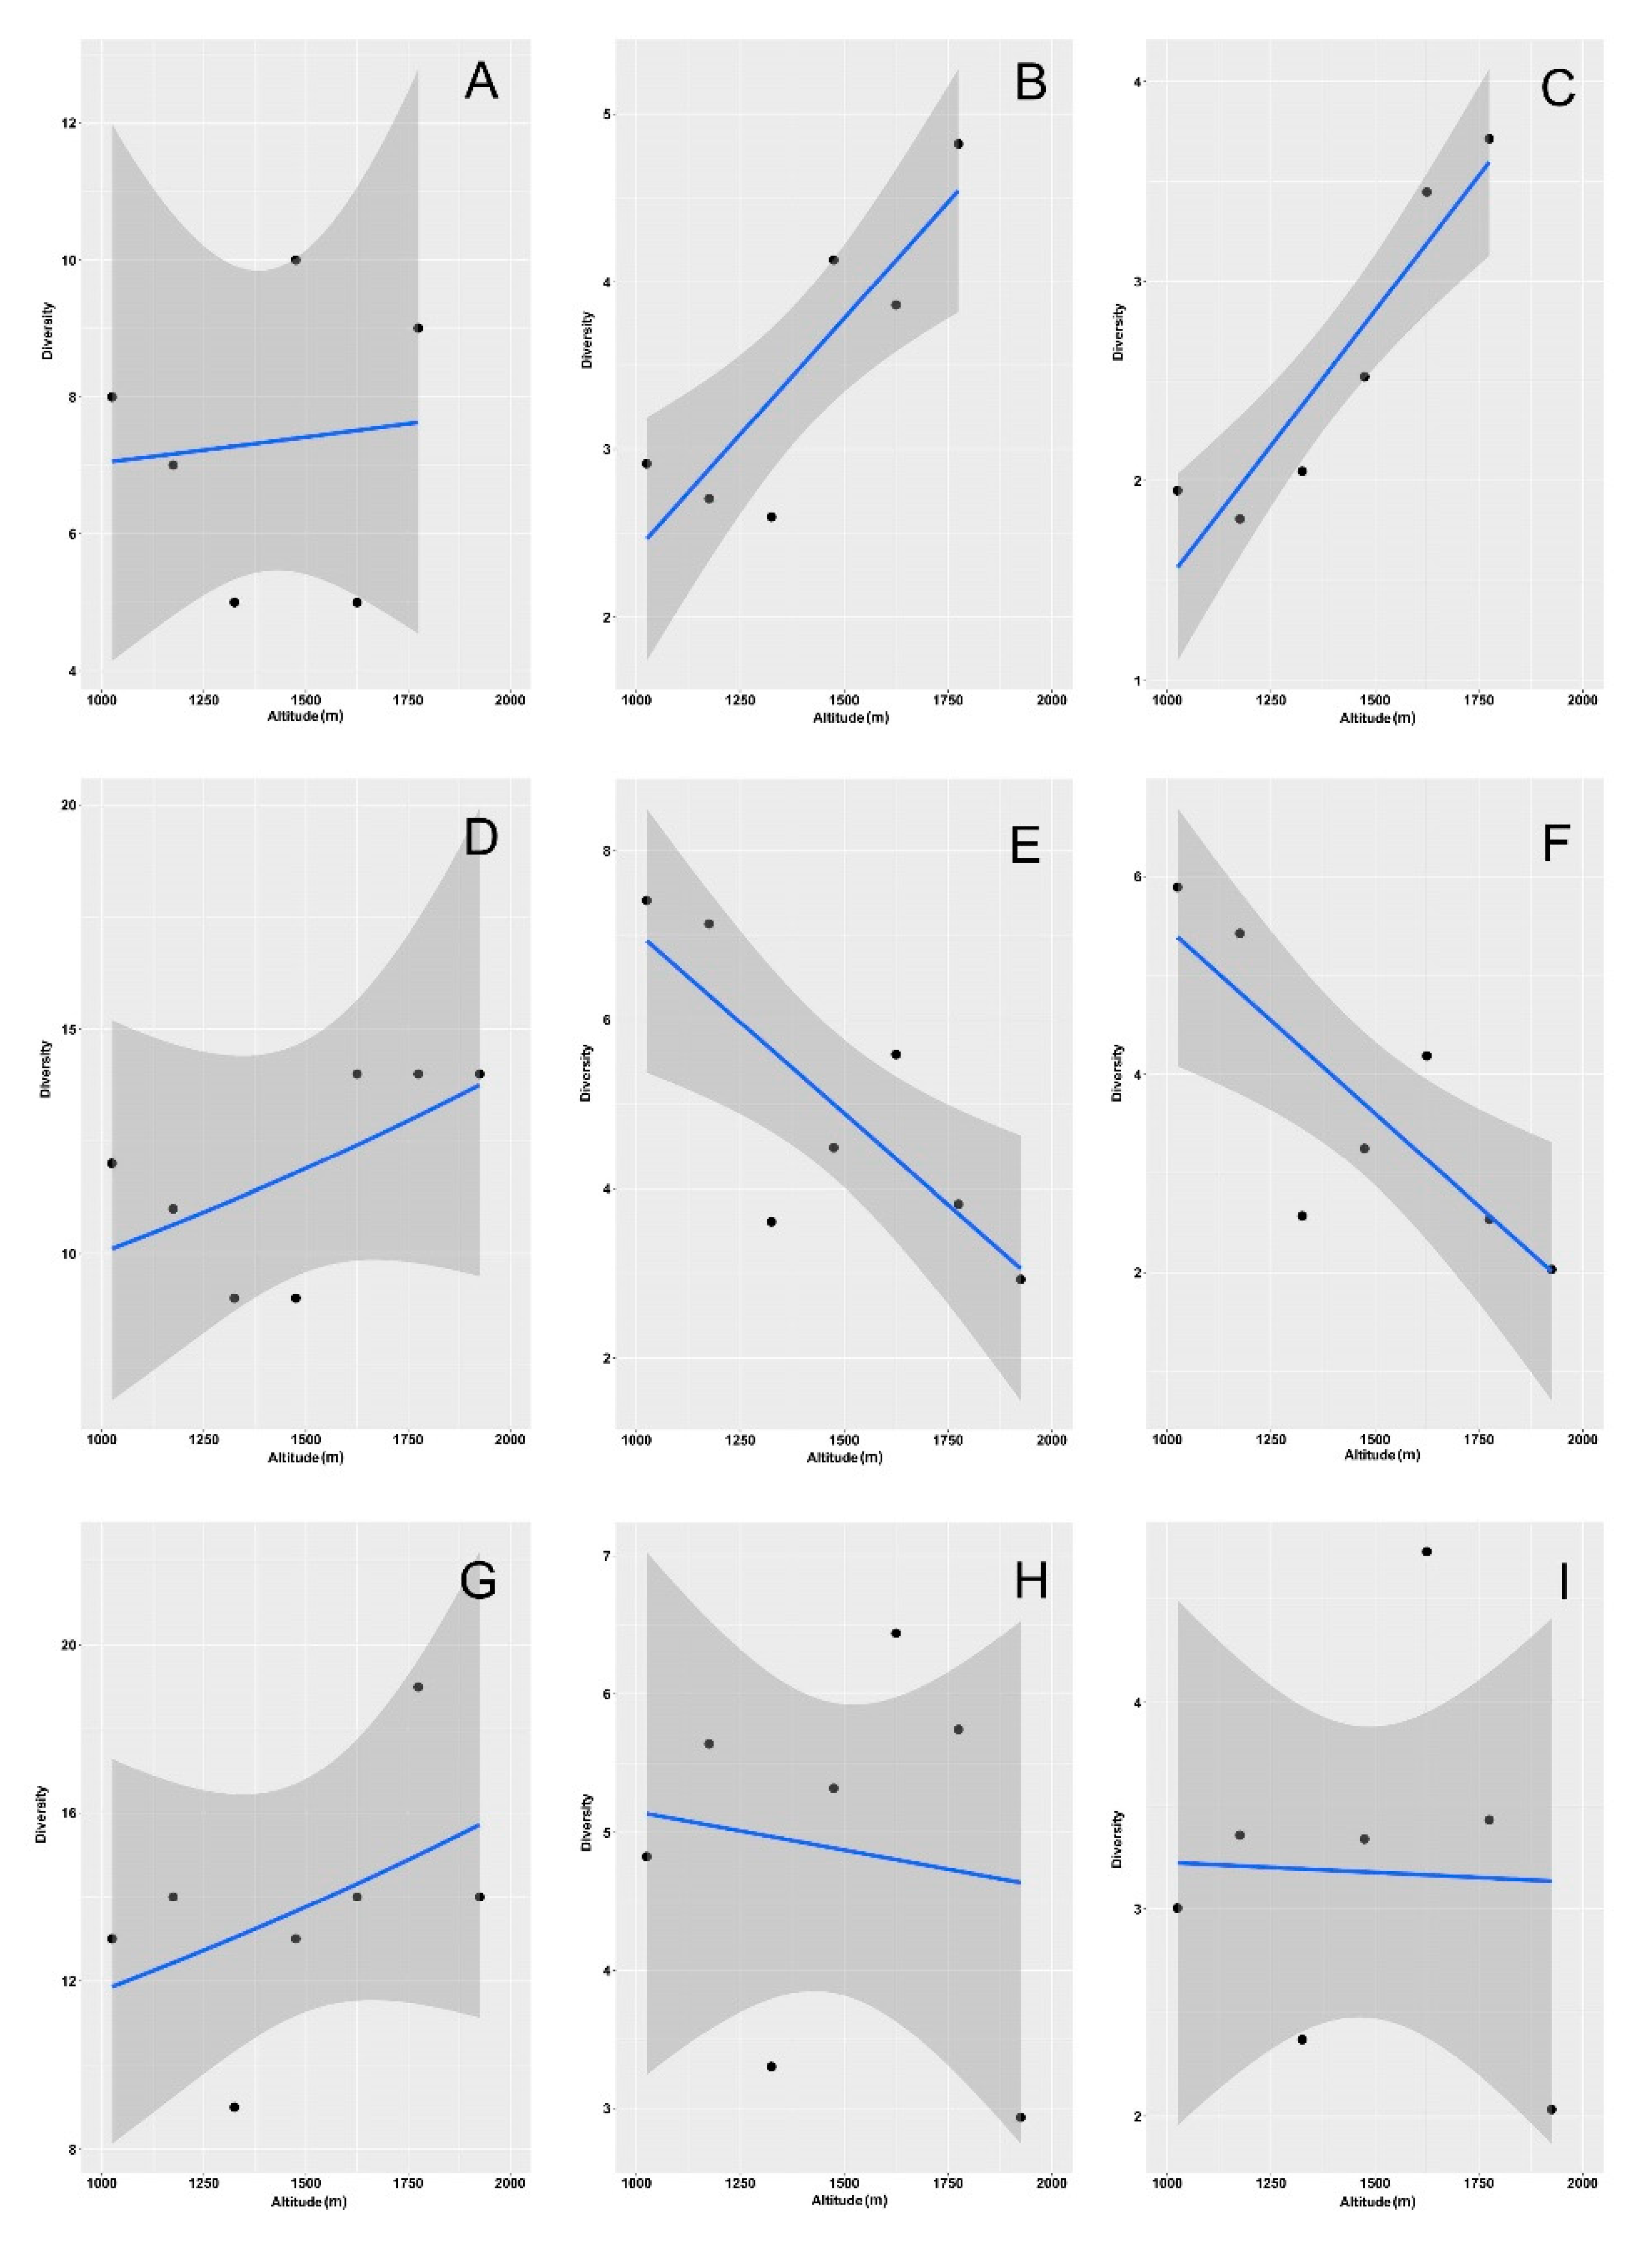
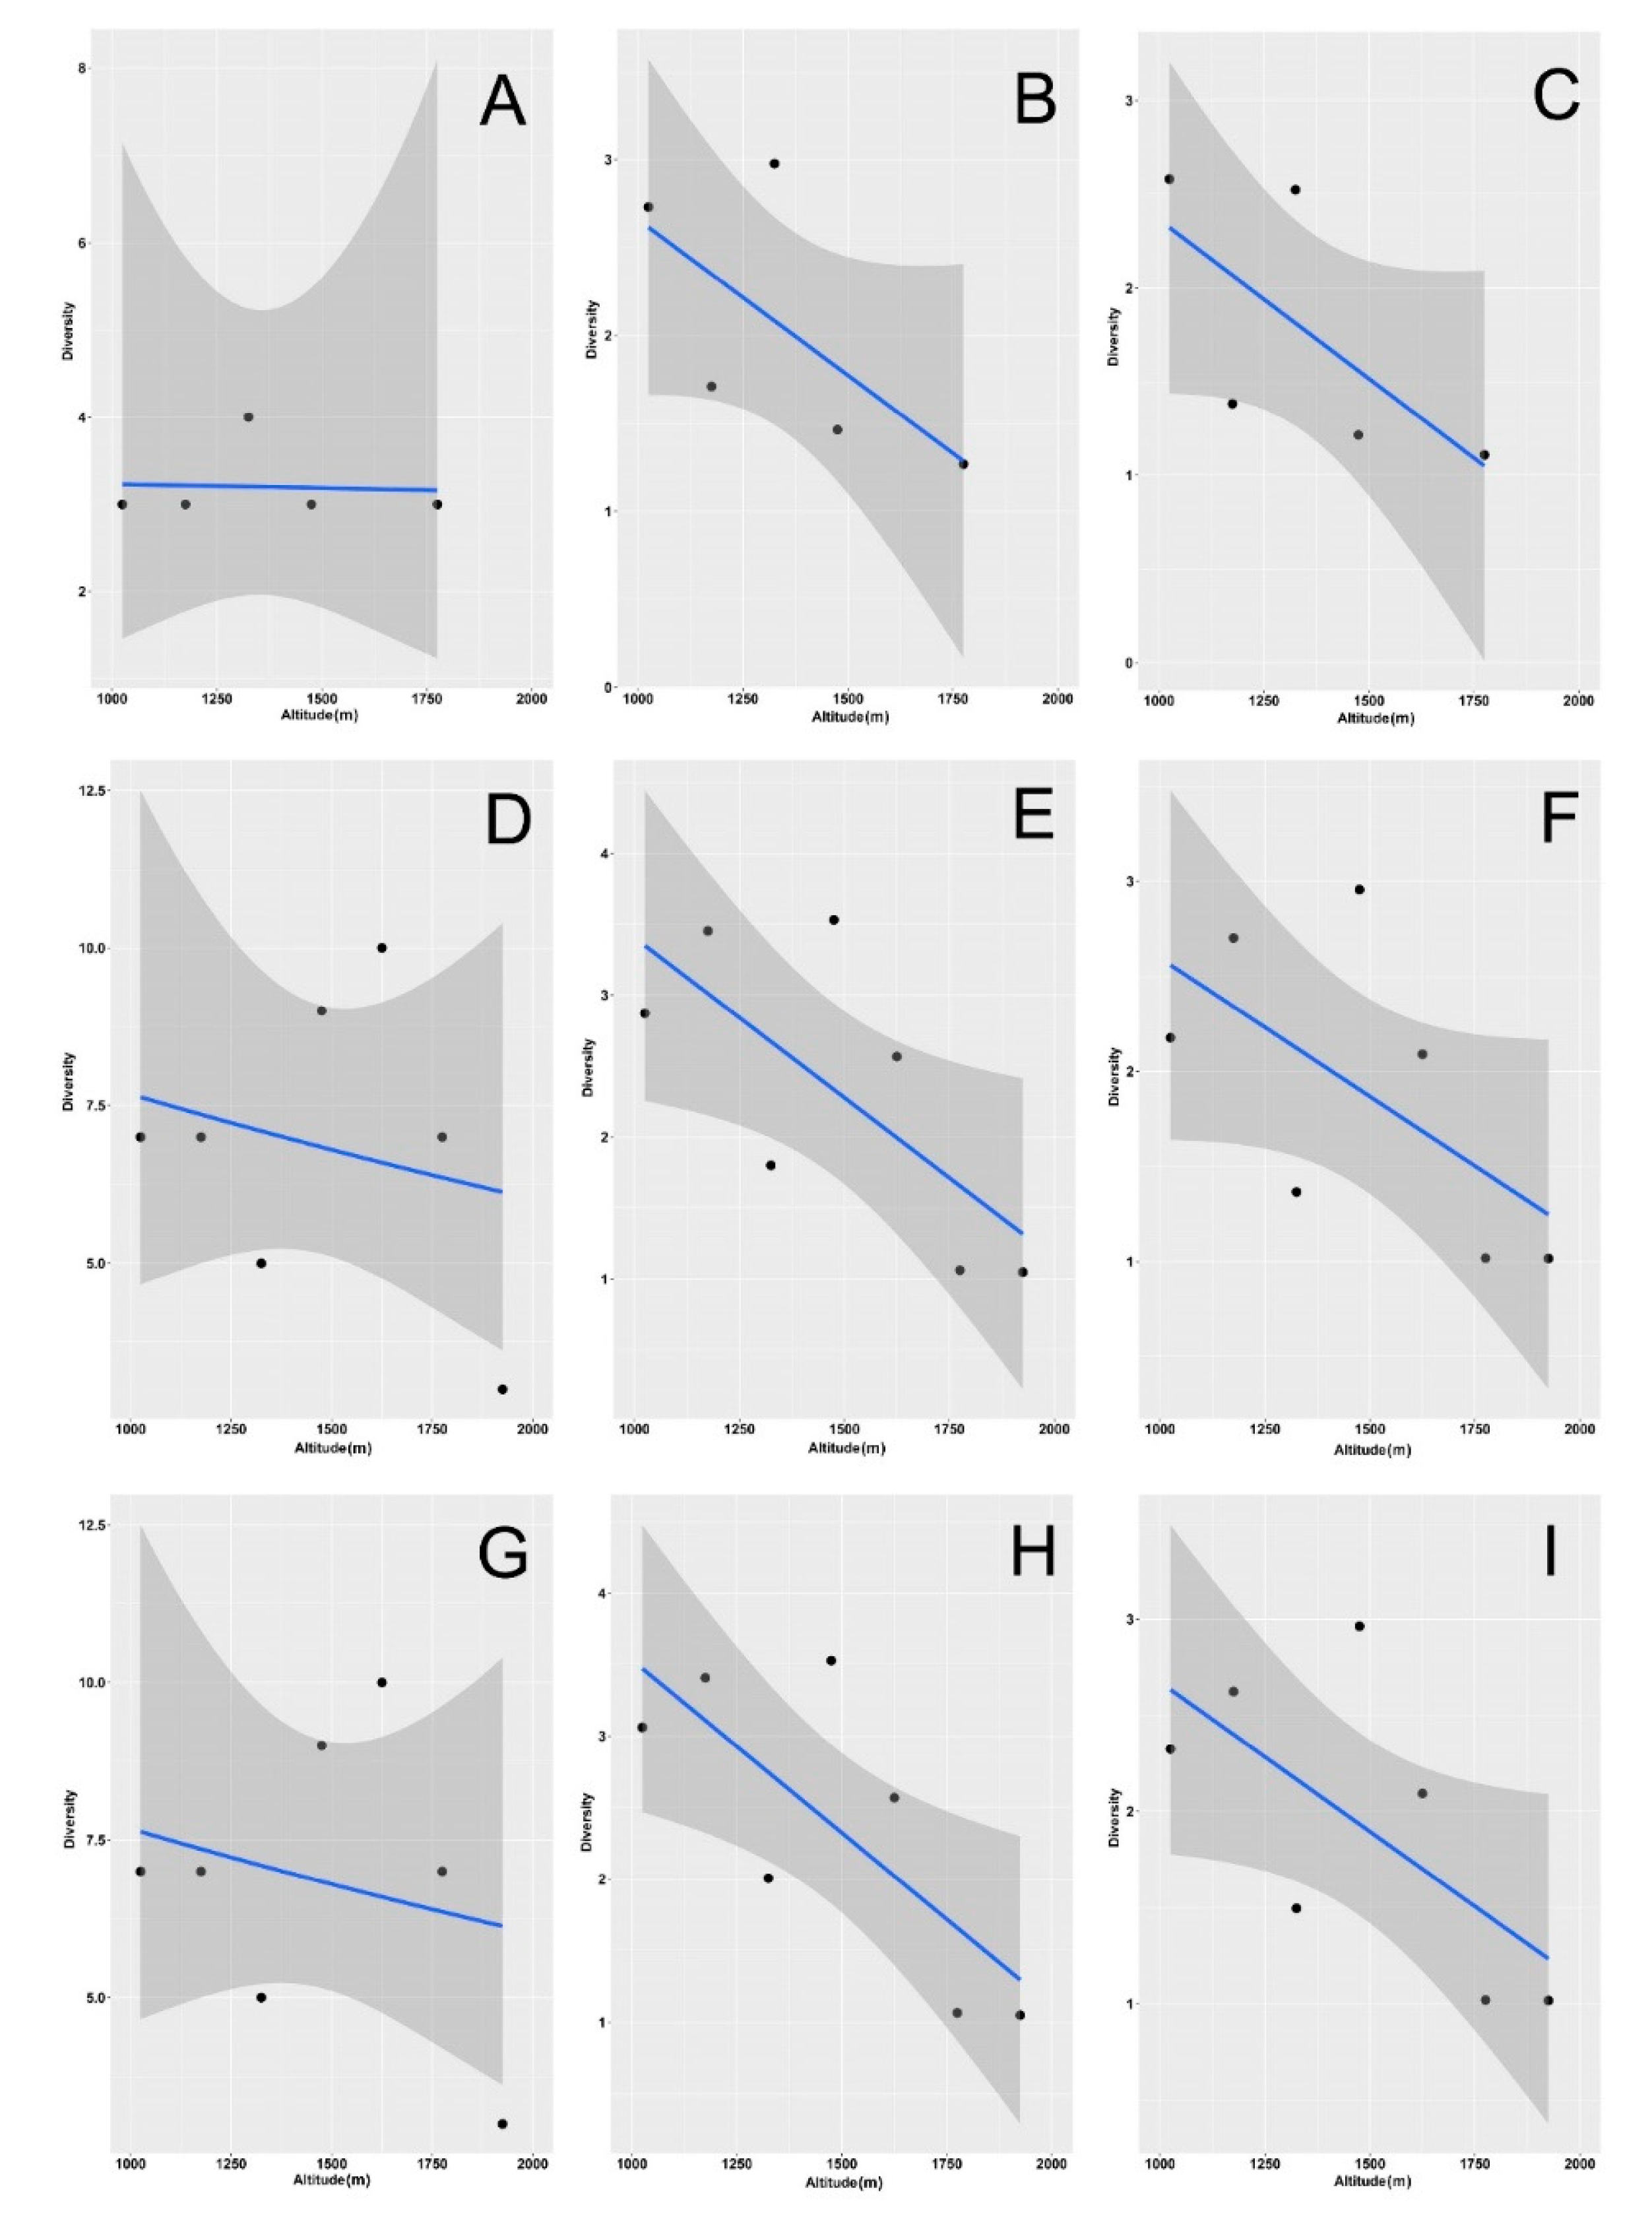
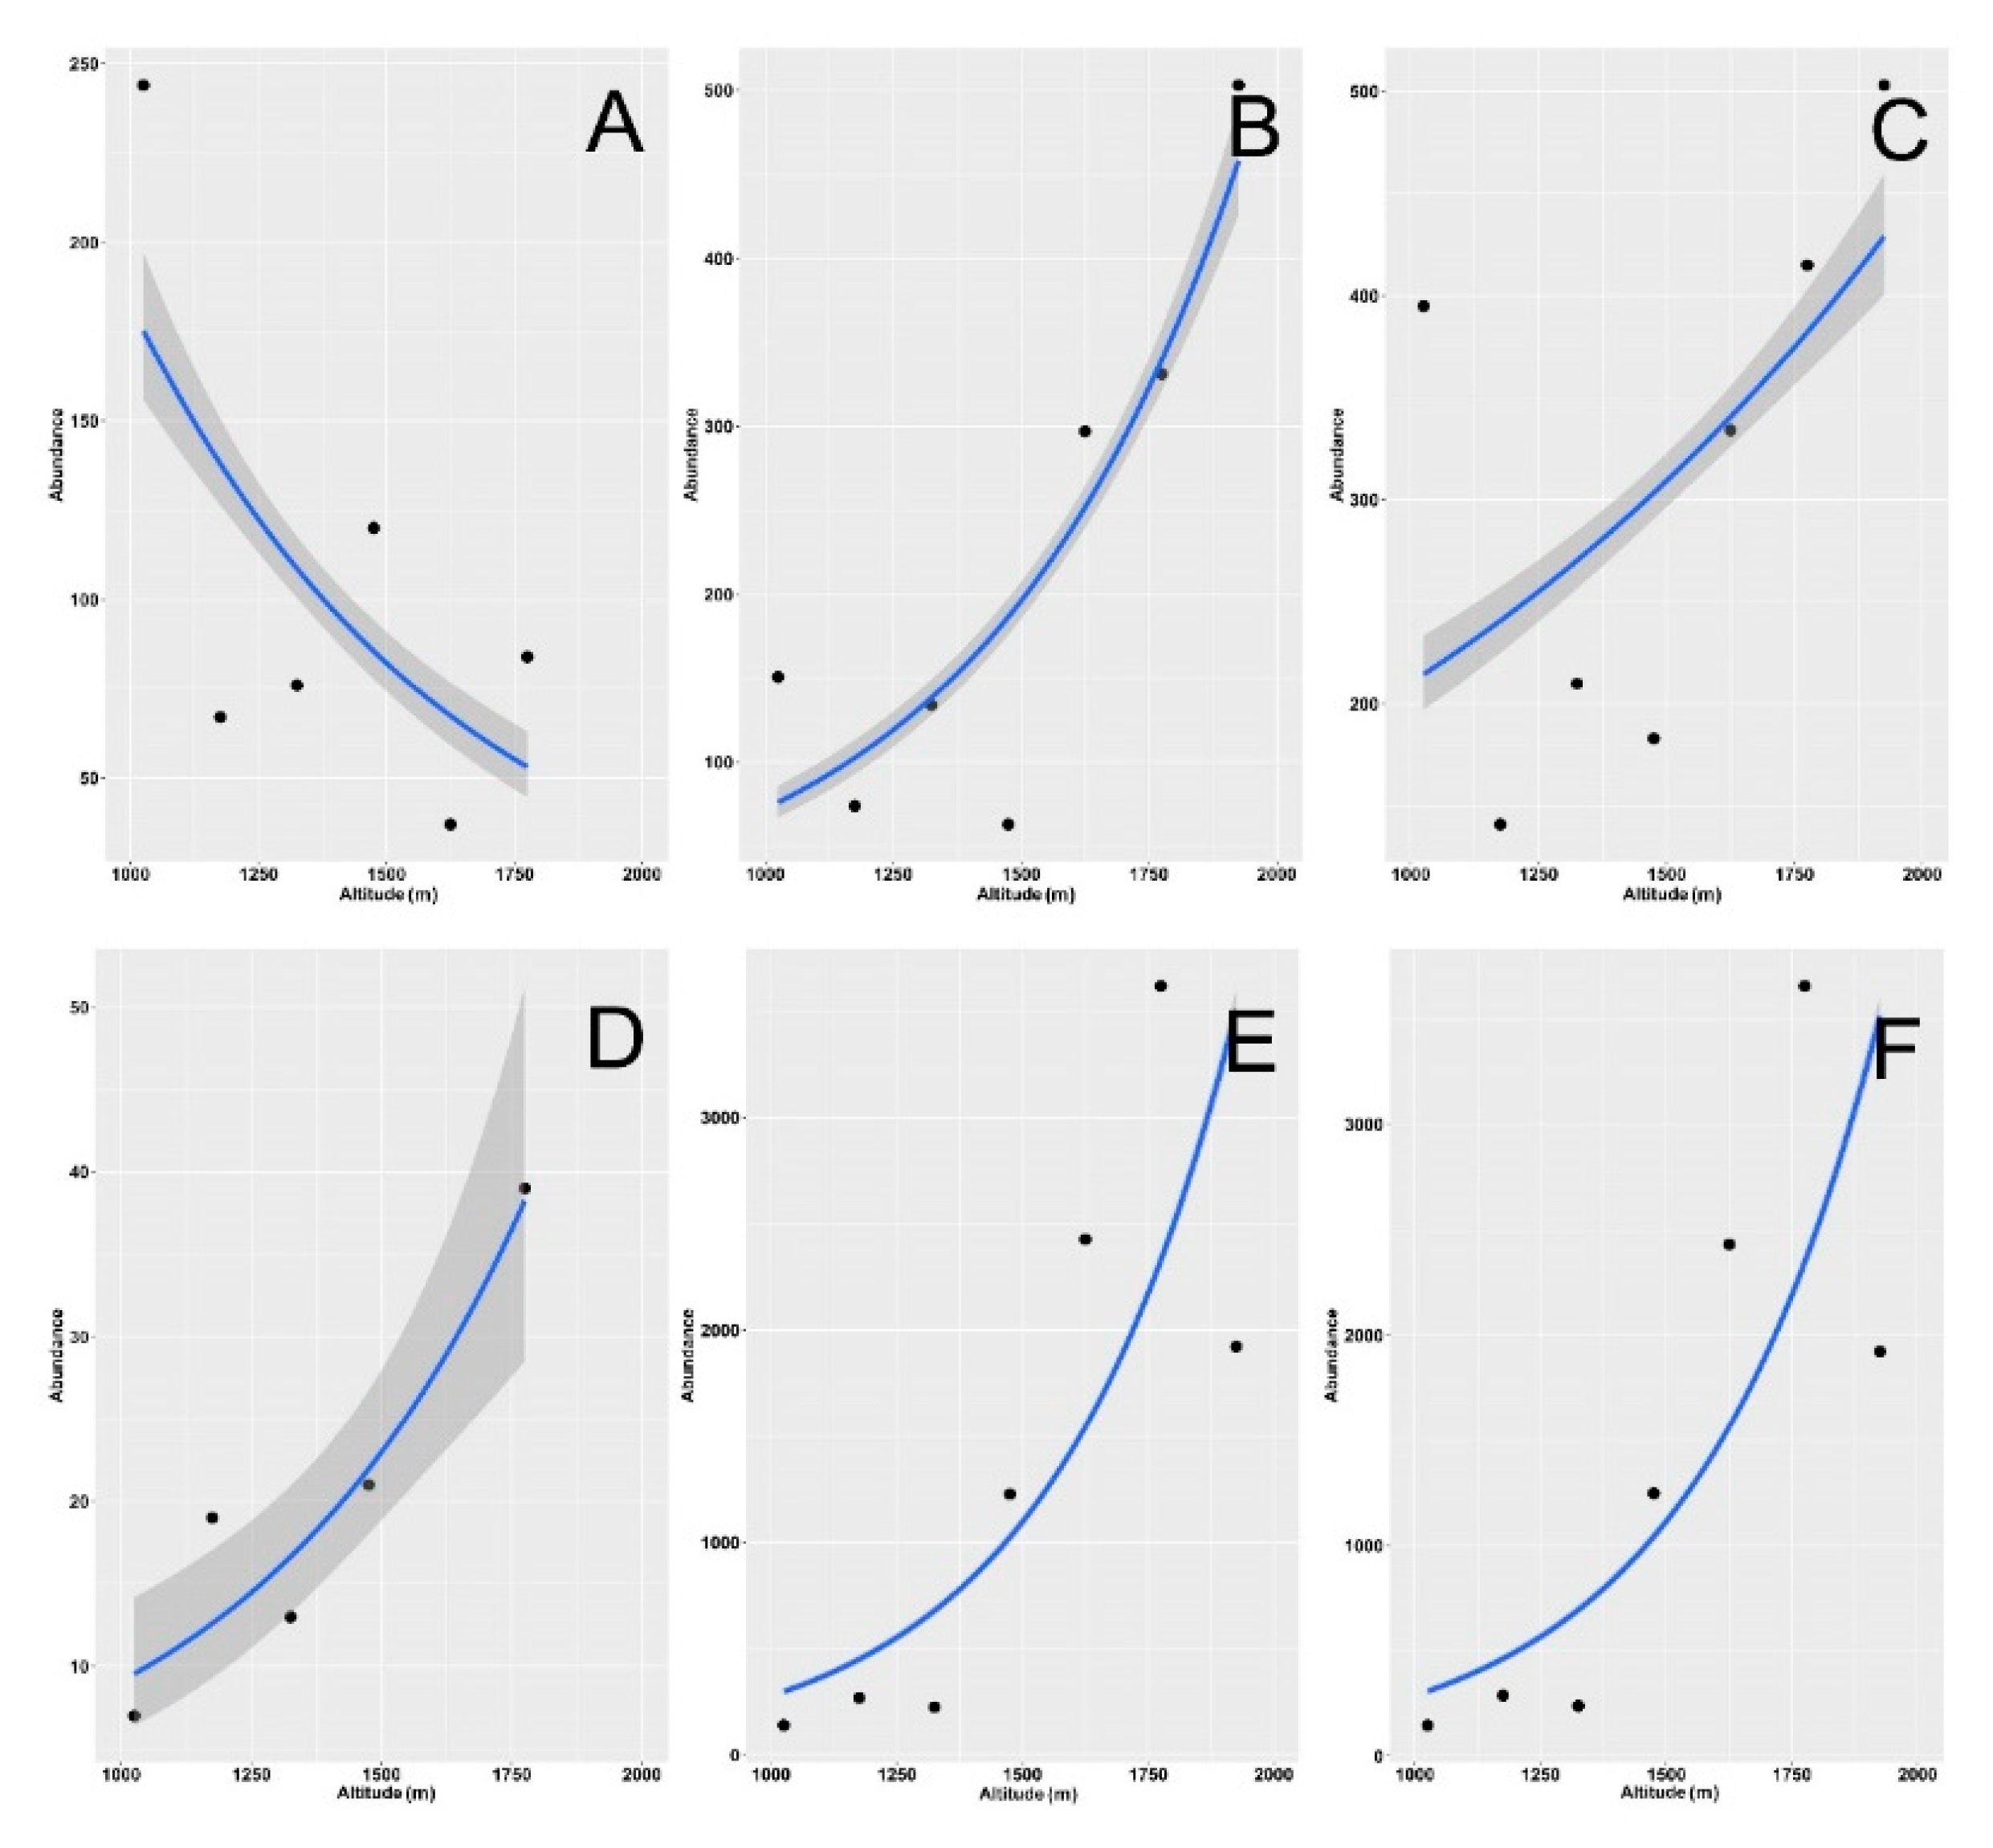
3. Results
4. Discussion
5. Conclusions
Supplementary Materials
Author Contributions
Funding
Institutional Review Board Statement
Data Availability Statement
Acknowledgments
Conflicts of Interest
References
- Peters, M.; Hemp, A.; Appelhans, T.; Behler, C.; Classen, A.; Detsch, F.; Ensslin, A.; Ferger, S.W.; Frederiksen, S.B.; Gebert, F.; et al. Predictors of elevational biodiversity gradients change from single taxa to the multi-taxa community level. Nat. Commun. 2016, 7, 13736. [Google Scholar] [CrossRef] [PubMed] [Green Version]
- Fattorini, S.; Di Biase, L.; Chiarucci, A. Recognizing and interpreting vegetational belts: New wine in the old bottles of a von Humboldt’s legacy. J. Biogeogr. 2019, 46, 1643–1651. [Google Scholar] [CrossRef]
- Di Biase, L.; Fattorini, S.; Cutini, M.; Bricca, A. The Role of Inter- and Intraspecific Variations in Grassland Plant Functional Traits along an Elevational Gradient in a Mediterranean Mountain Area. Plants 2021, 10, 359. [Google Scholar] [CrossRef]
- Kikvidze, Z.; Pugnaire, F.I.; Brooker, R.W.; Choler, P.; Lortie, C.J.; Michalet, R.; Callaway, R.M. Linking patterns and processes in alpine plant communities: A global study. Ecology 2005, 86, 1395–1400. [Google Scholar] [CrossRef] [Green Version]
- Körner, C. Alpine Plant Life: Functional Plant Ecology of High Mountain Ecosystems, 2nd ed.; Springer: Heidelberg, Germany, 1999; p. 349. [Google Scholar]
- Körner, C. The use of “altitude” in ecological research. Trends Ecol. Evol. 2007, 22, 569–574. [Google Scholar] [CrossRef]
- Körner, C. Alpine Treelines—Functional Ecology of the Global High Elevation Tree Limits, 1st ed.; Springer: Basel, Switzerland, 2012; p. 220. [Google Scholar]
- Le Roux, P.C.; McGeoch, M.A. Interaction intensity and importance along two stress gradients: Adding shape to the stress-gradient hypothesis. Oecologia 2010, 162, 733–745. [Google Scholar] [CrossRef]
- McCain, C.M.; Grytnes, J.A. Elevational gradients in species richness. In Encyclopedia of Life Sciences (eLS); John Wiley & Sons: Chichester, UK, 2010; pp. 1–10. [Google Scholar]
- Hoiss, B.; Krauss, J.; Potts, S.G.; Roberts, S.; Steffan-Dewenter, I. Altitude acts as an environmental filter on phylogenetic composition, traits and diversity in bee communities. Proc. R. Soc. Lond. 2012, 279, 4447–4456. [Google Scholar] [CrossRef] [Green Version]
- Sanders, N.J. Elevational gradients in ant species richness: Area, geometry, and Rapoport’s rule. Ecography 2002, 25, 25–32. [Google Scholar] [CrossRef]
- Sanders, N.J.; Rahbek, C. The patterns and causes of elevational diversity gradients. Ecography 2012, 35, 1–3. [Google Scholar] [CrossRef]
- Fattorini, S. Disentangling the effects of available area, mid-domain constraints, and species environmental tolerance on the altitudinal distribution of tenebrionid beetles in a Mediterranean area. Biodivers. Conserv. 2014, 23, 2545–2560. [Google Scholar] [CrossRef]
- Luo, Y.; Liu, J.; Tan, S.; Cadotte, M.W.; Xu, K.; Gao, L.; Li, D. Trait variation and functional diversity maintenance of understory herbaceous species coexisting along an elevational gradient in Yulong Mountain, Southwest China. Plant Divers. 2016, 38, 303–311. [Google Scholar] [CrossRef] [PubMed]
- Camacho, L.; Avilés, L. Decreasing predator density and activity explain declining predation of insect prey along elevational gradients. Am. Nat. 2019, 194, 334–343. [Google Scholar] [CrossRef]
- Lazarina, M.; Charalampopoulos, A.; Psaralexi, M.; Krigas, N.; Michailidou, D.E.; Kallimanis, A.S.; Sgardelis, S.P. Diversity patterns of different life forms of plants along an elevational gradient in Crete, Greece. Diversity 2019, 11, 200. [Google Scholar] [CrossRef] [Green Version]
- Fattorini, S.; Mantoni, C.; Di Biase, L.; Pace, L. Mountain biodiversity and sustainable development. In Encyclopedia of the UN Sustainable Development Goals. Life on Land; Leal Filho, W., Azul, A., Brandli, L., Özuyar, P., Wall, T., Eds.; Springer: Cham, Switzerland, 2020; pp. 1–31. [Google Scholar]
- Fattorini, S.; Mantoni, C.; Di Biase, L.; Strona, G.; Pace, L.; Biondi, M. Elevational patterns of generic diversity in the tenebrionid beetles (Coleoptera Tenebrionidae) of Latium (Central Italy). Diversity 2020, 12, 47. [Google Scholar] [CrossRef] [Green Version]
- Moradi, H.; Fattorini, S.; Oldeland, J. Influence of elevation on the species-area relationship. J. Biogeogr. 2020, 46, 304–315. [Google Scholar]
- Chao, A.; Gotelli, N.J.; Hsieh, T.C.; Sander, E.L.; Ma, K.H.; Colwell, R.K.; Ellison, A.M. Rarefaction and extrapolation with Hill numbers: A framework for sampling and estimation in species diversity studies. Ecol. Monogr. 2014, 84, 45–67. [Google Scholar] [CrossRef] [Green Version]
- Magurran, A.E. Ecological Diversity and Its Measurement; Princeton University Press: Princeton, NJ, USA, 1988; p. 192. [Google Scholar]
- Magurran, A.E. Measuring Biological Diversity; Wiley Blackwell: Oxford, UK, 2004; p. 264. [Google Scholar]
- Chao, A.; Jost, L. Coverage-based rarefaction and extrapolation: Standardizing samples by completeness rather than size. Ecology 2012, 93, 2533–2547. [Google Scholar] [CrossRef] [PubMed]
- Chiu, C.H.; Chao, A. Distance-based functional diversity measures and their decomposition: A framework based on Hill numbers. PLoS ONE 2020, 9, e100014. [Google Scholar] [CrossRef] [Green Version]
- Hanski, I. The dung insect community. In Dung Beetle Ecology; Hanski, I., Cambefort, Y., Eds.; Princeton University Press: Princeton, NJ, USA, 1991; pp. 5–21. [Google Scholar]
- Gillard, P. Coprophagous beetles in pasture ecosystems. J. Aust. Inst. Agric. Sci. 1967, 33, 30–34. [Google Scholar]
- Yokoyama, K.; Kai, H.; Koga, T.; Kawaguchi, S. Effect of dung beetle, Onthophagus lenzii H. on nitrogen transformation in cow dung and dung balls. Soil Sci. Plant Nutr. 1991, 37, 341–345. [Google Scholar] [CrossRef]
- Macqueen, A.; Beirne, B.P. Effects of cattle dung and dung beetle activity on growth of beardless wheatgrass in British Columbia. Can. J. Plant Sci. 1975, 55, 961–967. [Google Scholar] [CrossRef] [Green Version]
- Kabir, S.M.H.; Howlader, J.A.; Begum, J. Effect of dung beetle activities on the growth and yield of wheat plants. Bangladesh J. Agric. Res. 1985, 10, 49–55. [Google Scholar]
- Galbiati, C.; Bensi, C.; Conceiçaõ, C.H.C.; Florcovski, J.L.; Calafiori, M.H. Estudo comparativo entre besouros do esterco, Dichotomius analypticus (Mann, 1829) e Onthophagus gazella (F.), sobre as pastagens, em condiçoes brasileiras. Ecossistema 1995, 20, 109–118. [Google Scholar]
- Bertone, M.A. Dung Beetles (Coleoptera: Scarabaeidae and Geotrupidae) in North Carolina Pastures and Their Implications for Pasture Improvement; North Carolina State University: Raleigh, NC, USA, 2004; p. 159. Available online: https://repository.lib.ncsu.edu/bitstream/handle/1840.16/1952/etd.pdf?sequence=1&isAllowed=y (accessed on 30 May 2021).
- Bang, H.S.; Lee, J.H.; Kwon, O.S.; Na, Y.E.; Jang, Y.S.; Kim, W.H. Effects of paracoprid dung beetles (Coleoptera: Scarabaeidae) on the growth of pasture herbage and on the underlying soil. Appl. Soil Ecol. 2005, 29, 165–171. [Google Scholar] [CrossRef]
- Lastro, E. Dung Beetles (Coleoptera: Scarabaeidae and Geotrupidae) in North Carolina Pasture Ecosystem; North Carolina State University: Raleigh, NC, USA, 2006; p. 121. Available online: https://repository.lib.ncsu.edu/bitstream/handle/1840.16/1498/etd.pdf?sequence=1&isAllowed=y (accessed on 30 May 2021).
- Yamada, D.; Imura, O.; Shi, K.; Shibuya, T. Effect of tunneler dung beetles on cattle dung decomposition, soil nutrients and herbage growth. Graesslia 2007, 53, 121–129. [Google Scholar] [CrossRef]
- Andresen, E.; Feer, F. The role of dung beetles as secondary seed dispersers and their effect on plant regeneration in tropical rainforests. In Seed Fate: Predation, Dispersal and Seedling Establishment; Forget, P.-M., Lambert, J.E., Hulme, P.E., Vander Wall, S.B., Eds.; CAB International: Wallingford, UK, 2005; pp. 331–349. [Google Scholar]
- Bishop, A.L.; McKenzie, H.J.; Spohr, L.J.; Barchia, I.M. Interactions between dung beetles (Coleoptera: Scarabaeidae) and the arbovirus vector Culicoides brevitarsis Kieffer (Diptera: Ceratopogonidae). Aust. J. Entomol. 2005, 44, 89–96. [Google Scholar] [CrossRef]
- Hanski, I.; Krikken, J. Dung beetles in tropical forest in Southeast Asia. In Dung Beetle Ecology; Hanski, I., Cambefort, Y., Eds.; Princeton University Press: Princeton, NJ, USA, 1991; pp. 179–197. [Google Scholar]
- Davis, A.L.V. Compositional differences between dung beetle (Coleoptera: Scarabaeidae s. str.) assemblages in winter and summer rainfall climates. Afric. Entomol. 1994, 2, 45–51. [Google Scholar]
- Davis, A.J.; Huijbregts, H.; Krikken, J. The role of local and regional processes in shaping dung beetle communities in tropical forest plantations in Borneo. Glob. Ecol. Biogeogr. 2000, 9, 281–292. [Google Scholar] [CrossRef]
- Feinsinger, P. Designing Field Studies for Biodiversity Conservation; The Nature Conservancy and Island Press: Washington, DC, USA, 2001. [Google Scholar]
- de Andrade, R.B.D.; Barlow, J.; Louzada, J.; Vaz-de-Mello, F.Z.; Souza, M.; Silveira, J.M.; Cochrane, M.A. Quantifying responses of dung beetles to fire disturbance in tropical forests: The importance of trapping method and seasonality. PLoS ONE 2011, 6, e26208. [Google Scholar]
- Gardner, T.A.; Hernández, M.I.; Barlow, J.; Peres, C.A. Understanding the biodiversity consequences of habitat change: The value of secondary and plantation forests for neotropical dung beetles. J. Appl. Ecol. 2008, 45, 883–893. [Google Scholar] [CrossRef]
- Nichols, E.S.; Gardner, T.A. Dung beetles as a candidate study taxon in applied biodiversity conservation research. In Ecology and Evolution of Dung Beetles; Simmons, L.W., Ridsdill-Smith, T.J., Eds.; Blackwell Publishing: Oxford, UK, 2011; pp. 267–291. [Google Scholar]
- Lumaret, J.P.; Stiernet, N. Montane dung beetles. In Dung Beetle Ecology; Hanski, I., Cambefort, Y., Eds.; Princeton University Press: Princeton, NJ, USA, 1991; pp. 242–254. [Google Scholar]
- Lumaret, J.P.; Stiernet, N. Biogeography of dung beetle communities in the western and central Alps (Coleoptera, Scarabaeoidea). Biogeographia 1992, 16, 425–436. [Google Scholar]
- Jay-Robert, P.; Lobo, J.M.; Lumaret, J.P. Altitudinal turnover and species richness variation in European montane dung beetle assemblages. Arct. Antarct. Alp. Res. 1997, 29, 196–205. [Google Scholar] [CrossRef]
- Avila, J.M.; Pascual, F. Contribución al conocimiento de los escarabeidos coprófagos (Coleoptera, Scarabaeoidea) de Sierra Nevada: III. Distribución altitudinal y temporal. Boll. Mus. Reg. Sci. Nat. Torino 1988, 6, 217–240. [Google Scholar]
- Lobo, J.M.; Halffter, G. Biogeographical and ecological factors affecting the altitudinal variation of mountainous communities of coprophagous beetles (Coleoptera: Scarabaeoidea): A comparative study. Ann. Entomol. Soc. Am. 2000, 93, 115–126. [Google Scholar] [CrossRef]
- Errouissi, F.; Jay-Robert, P.; Lumaret, J.P.; Piau, O. Composition and structure of dung beetle (Coleoptera: Aphodiidae, Geotrupidae, Scarabaeidae) assemblages in mountain grasslands of the Southern Alps. Ann. Entomol. Soc. Am. 2004, 97, 701–709. [Google Scholar] [CrossRef]
- Escobar, F.; Halffter, G.; Arellano, L. From forest to pasture: An evaluation of the influence of environment and biogeography on the structure of beetle (Scarabaeinae) assemblages along three altitudinal gradients in the Neotropical region. Ecography 2007, 30, 193–208. [Google Scholar] [CrossRef]
- Herzog, S.K.; Hamel-Leigue, A.C.; Larsen, T.H.; Mann, D.J.; Soria-Auza, R.W.; Gill, B.D.; Edmonds, W.D.; Spector, S. Elevational distribution and conservation biogeography of Phanaeine dung beetles (Coleoptera: Scarabaeinae) in Bolivia. PLoS ONE 2013, 8, e64963. [Google Scholar] [CrossRef] [Green Version]
- Nunes, C.A.; Braga, R.F.; Figueira, J.E.C.; Neves, F.D.S.; Fernandes, G.W. Dung beetles along a tropical altitudinal gradient: Environmental filtering on taxonomic and functional diversity. PLoS ONE 2016, 11, e0157442. [Google Scholar] [CrossRef]
- Şenyüz, Y.; Lobo, J.M.; Dindar, K. Altitudinal gradient in species richness and composition of dung beetles (Coleoptera: Scarabaeidae) in an eastern Euro-Mediterranean locality: Functional, seasonal and habitat influences. Eur. J. Entomol. 2019, 116, 309–319. [Google Scholar] [CrossRef]
- Stanbrook, R.; Wheater, C.P.; Harris, W.E.; Jones, M. Habitat type and altitude work in tandem to drive the community structure of dung beetles in Afromontane forest. J. Insect Conserv. 2021, 25, 159–173. [Google Scholar] [CrossRef]
- Lobo, J.M.; Guéorguiev, B.; Chehlarov, E. Convergences and divergences between two European mountain dung beetle assemblages (Coleoptera, Scarabaeoidea). Anim. Biodivers. Conserv. 2007, 30.1, 83–96. [Google Scholar]
- Menéndez, R.; Gutiérrez, D. Altitudinal effects on habitat selection of dung beetles (Scarabaeoidea Aphodiidae) in the northern Iberian peninsula. Ecography 1996, 19, 313–317. [Google Scholar] [CrossRef]
- Romero-Alcaraz, E.; Ávila, J.M. Effect of elevation and type of habitat on the abundance and diversity of Scarabaeoid dung beetle (Scarabaeoidea) assemblages in a Mediterranean area from Southern Iberian Peninsula. Zool. Stud. 2000, 39, 351–359. [Google Scholar]
- Martín-Piera, F.; Veiga, C.M.; Lobo, J.M. Ecology and biogeography of dung-beetle communities (Coleoptera, Scarabaeoidea) in an Iberian mountain range. J. Biogeogr. 1992, 19, 677–691. [Google Scholar] [CrossRef]
- Hanski, I. The community of coprophagous beetles (Coleoptera. Scarabaeidae and Hydrophilidae) in northern Europe. Ann. Zool. Fenn. 1980, 46, 57–73. [Google Scholar]
- Baz, A. Selección de macrohábitat por algunas especies y análisis de una comunidad de escarabeidos coprófagos (Coleoptera) del macizo de Ayllón (Sistema Central, España). Ann. Soc. Entomol. Fr. 1988, 24, 203–210. [Google Scholar]
- Lumaret, J.P.; Kirk, A.A. South temperate dung beetles. In Dung Beetle Ecology; Hanski, I., Cambefort, Y., Eds.; Princeton University Press: Oxford, UK, 1991; pp. 97–115. [Google Scholar]
- Palusci, E.; Mantoni, C.; Strona, G.; Fattorini, S. Wildfire does not affect dung beetle diversity of high-altitude Mediterranean habitats. Int. J. Wildland Fire 2021, 30, 636–642. [Google Scholar]
- European Commission. Council Directive 92/43/EEC of 21 May 1992 on the Conservation of Natural Habitats and of Wild Fauna and Flora. 1992. Available online: http://eur-lex.europa.eu/legal-content/EN/TXT/?uri=CELEX:31992L0043 (accessed on 30 May 2021).
- European Commission. Interpretation Manual of European Union Habitats; Eur 27; European Commission, DG Environment: Strasbourg, France, 2007; p. 142. Available online: http://ec.europa.eu/environment/nature/legislation/habitatsdirective/docs/2007_07_im.pdf (accessed on 30 May 2021).
- Lobo, J.M.; Martín–Piera, F.; Veiga, C.M. Las trampas pitfall con cebo, sus posibilidades en el estudio de las comunidades coprófagas de Scarabaeidae (Col.). I. Características determinantes de su capacidad de captura. Rev. Ecol. Biol. Sol. 1988, 25, 77–100. [Google Scholar]
- Labidi, I.; Errouissi, F.; Nouira, S. Spatial and temporal variation in species composition, diversity, and structure of Mediterranean dung beetle assemblages (Coleoptera: Scarabaeidae) across a bioclimatic gradient. Environ. Entomol. 2012, 41, 785–801. [Google Scholar] [CrossRef]
- Louzada, J.; Lima, A.P.; Matavelli, R.; Zambaldi, L.; Barlow, J. Community structure of dung beetles in Amazonian savannas: Role of fire disturbance, vegetation and landscape structure. Landsc. Ecol. 2010, 25, 631–641. [Google Scholar] [CrossRef]
- Feer, F. Variations in dung beetles assemblages (Coleoptera: Scarabaeidae) within two rain forest habitats in French Guiana. Rev. Biol. Trop. 2013, 61, 753–768. [Google Scholar] [CrossRef] [PubMed] [Green Version]
- Ballerio, A.; Rey, A.; Uliana, M.; Rastelli, M.; Rastelli, S.; Romano, M.; Colacurcio, L. Coleotteri Scarabeoidei d’Italia. Available online: http://www.societaentomologicaitaliana.it/Coleotteri%20Scarabeoidea%20d’Italia%202014/index.htm (accessed on 30 May 2021).
- Chao, A.; Ma, K.H.; Hsieh, T.C.; Chiu, C.H. SpadeR: Species-Richness Prediction and Diversity Estimation with R; Version 0.1.1; 2016; Available online: https://CRAN.R-project.org/package=SpadeR (accessed on 30 May 2021).
- Hsieh, T.C.; Ma, K.H.; Chao, A. iNEXT: iNterpolation and EXTrapolation for Species Diversity; R Package Version 2.0.20; 2020; Available online: https://cran.r-project.org/web/packages/iNEXT/index.html (accessed on 30 May 2021).
- Wickham, H. ggplot2: Elegant Graphics for Data Analysis, 2nd ed.; Springer: New York, NY, USA, 2016; p. 260. [Google Scholar]
- R Core Team. R: A Language and Environment for Statistical Computing; R Foundation for Statistical Computing: Vienna, Austria, 2021; Available online: https://www.R-project.org/ (accessed on 30 May 2021).
- Zhang, D. rsq: R-Squared and Related Measures; R Package Version 2.2; 2021; Available online: https://CRAN.R-project.org/package=rsq (accessed on 30 May 2021).
- Carpaneto, G.M.; Piattella, E.; Valerio, L. Insecta Coleoptera Scarabeoidea. In Checklist and Distribution of the Italian Fauna. 10,000 Terrestrial and Inland Water Species; Ruffo, S., Stoch, F., Eds.; Memorie del Museo Civico di Storia Naturale di Verona: Verona, Italy, 2006; Volume 17, pp. 193–196. [Google Scholar]
- Finn, J.A.; Gittings, T. A review of competition in north temperate dung beetle communities. Ecol. Entomol. 2003, 28, 1–13. [Google Scholar] [CrossRef]
- Halffter, G.; Edmonds, W.D. The Nesting Behaviour of Dung Beetles (Scarabaeinae): An Ecological and Evolutive Approach; Instituto de Ecologìa: México City, México, 1982; 176p. [Google Scholar]
- Tonelli, M. Some considerations on the terminology applied to dung beetle functional groups. Ecol. Entomol. 2021, 46, 772–776. [Google Scholar] [CrossRef]
- Hanski, I.; Cambefort, Y. Competition in dung beetles. In Dung Beetle Ecology; Hanski, I., Cambefort, Y., Eds.; Princeton University Press: Oxford, UK, 1991; pp. 305–329. [Google Scholar]
- Carpaneto, G.M.; Piattella, E. Competizione interspecifica e andamento stagionale di una comunità coprofaga in un’area verde urbana di Roma (Coleoptera, Scarabaeoidea). Boll. Ass. Romana Entomol. 1990, 44, 67–79. [Google Scholar]
- Barbero, E.; Palestrini, C.; Rolando, A. Le comunità di Scarabaeoidea della Val Sangone: Considerazioni ecologiche e zoogeografiche. Biogeographia 1992, 16, 437–449. [Google Scholar] [CrossRef]
- Kadiri, N.; Lobo, J.M.; Lumaret, J.-P. Conséquences de l’interaction entre préférences pour l’habitat et quantité de ressources trophiques sur les communautés d’insectes coprophages (Coleoptera: Scarabaeoidea). Acta Oecol. 1997, 18, 107–119. [Google Scholar] [CrossRef]


| Taxonomy | Individuals in Woodlands | Individuals in Grasslands | Total Number of Collected Individuals |
|---|---|---|---|
| Geotrupidae | |||
| Geotrupes spiniger Marsham, 1802 | 17 | 26 | 43 |
| Sericotrupes niger (Marsham, 1802) | 34 | 107 | 141 |
| Trypocopris vernalis (Linnaeus, 1758) | 0 | 21 | 21 |
| Aphodiidae | |||
| Acrossus depressus (Kugelann, 1792) | 1 | 0 | 1 |
| Acrossus rufipes (Linnaeus, 1758) | 40 | 11 | 51 |
| Amidorus obscurus (Fabricius, 1792) | 1 | 4 | 5 |
| Amidorus thermicola (Sturm, 1800) | 0 | 3 | 3 |
| Aphodius coniugatus (Panzer, 1795) | 0 | 13 | 13 |
| Aphodius fimetarius (Linnaeus, 1758) | 0 | 48 | 48 |
| Bodiloides ictericus(Laicharting, 1781) | 0 | 1 | 1 |
| Bodilopsis rufa (Moll, 1782) | 48 | 673 | 721 |
| Chilothorax conspurcatus (Linnaeus, 1758) | 0 | 1 | 1 |
| Chilothorax paykulli (Bedel, 1907) | 0 | 1 | 1 |
| Colobopterus erraticus (Linnaeus, 1758) | 0 | 35 | 35 |
| Coprimorphus scrutator (Herbst, 1789) | 0 | 1 | 1 |
| Esymus pusillus pusillus (Herbst, 1789) | 17 | 10 | 27 |
| Euheptaulacus carinatus (Germar, 1824) | 3 | 300 | 303 |
| Labarrus lividus (Olivier, 1789) | 0 | 15 | 15 |
| Limarus zenkeri (Germar, 1813) | 255 | 141 | 396 |
| Melinopterus consputus (Creutzer, 1799) | 1 | 3 | 4 |
| Melinopterus prodromus (Brahm, 1790) | 0 | 2 | 2 |
| Nimbus contaminatus (Herbst, 1783) | 0 | 93 | 93 |
| Nimbus johnsoni (Baraud, 1976) | 179 | 55 | 234 |
| Nimbus obliteratus (Panzer, 1823) | 21 | 24 | 45 |
| Otophorus haemorrhoidalis (Linnaeus, 1758) | 0 | 1 | 1 |
| Phalacronotus biguttatus (Germar, 1824) | 0 | 1 | 1 |
| Planolinoides borealis (Gyllenhal, 1827) | 1 | 0 | 1 |
| Planolinus fasciatus (Olivier, 1789) | 58 | 62 | 120 |
| Sigorus porcus (Fabricius, 1792) | 3 | 54 | 57 |
| Trichonotulus scrofa (Fabricius, 1787) | 0 | 1 | 1 |
| Scarabaeidae | |||
| Copris umbilicatus Abeille de Perrin, 1901 | 0 | 2 | 2 |
| Euoniticellus fulvus (Goeze, 1777) | 0 | 5 | 5 |
| Euonthophagus gibbosus (Scriba, 1790) | 0 | 4 | 4 |
| Onthophagus coenobita (Herbst, 1783) | 3 | 40 | 43 |
| Onthophagus fracticornis (Preyssler, 1790) | 41 | 7483 | 7524 |
| Onthophagus illyricus (Scopoli, 1763) | 0 | 7 | 7 |
| Onthophagus joannae Goljan, 1953 | 10 | 980 | 990 |
| Onthophagus lemur (Fabricius, 1781) | 0 | 32 | 32 |
| Onthophagus taurus (Schreber, 1759) | 1 | 6 | 7 |
| Onthophagus vacca (Linnaeus, 1767) | 0 | 1 | 1 |
| Onthophagus verticicornis (Laicharting, 1781) | 47 | 1065 | 1112 |
| Sisyphus schaefferi (Linnaeus, 1758) | 1 | 210 | 211 |
| Total | 731 | 11,388 | 12,324 |
| Woodlands | Grasslands | Habitats Merged | ||||||||||
|---|---|---|---|---|---|---|---|---|---|---|---|---|
| Estimate | SE | p | R2 | Estimate | SE | p | R2 | Estimate | SE | p | R2 | |
| (A) Empirical diversity values | ||||||||||||
| Richness | 0.0001 | 0.0005 | 0.8601 | 0.0082 | 0.0002 | 0.0003 | 0.5095 | 0.1219 | 0.0002 | 0.0003 | 0.5030 | 0.0900 |
| Shannon | 0.0040 | 0.0010 | 0.0167 | 0.7965 | −0.0090 | 0.0016 | 0.0027 | 0.8591 | −0.0079 | 0.0009 | 0.0003 | 0.9438 |
| Simpson | 0.0040 | 0.0002 | <0.0001 | 0.9942 | −0.0059 | 0.0014 | 0.0070 | 0.7945 | −0.0048 | 0.0006 | 0.0004 | 0.9346 |
| (B) Rarefied/interpolated diversity values | ||||||||||||
| Richness | 0.0002 | 0.0005 | 0.7624 | 0.0491 | −0.0012 | 0.0004 | 0.0038 | 0.9321 | −0.0005 | 0.0003 | 0.0828 | 0.5295 |
| Shannon | 0.0041 | 0.0007 | 0.0052 | 0.8852 | −0.0082 | 0.0015 | 0.0025 | 0.8625 | −0.0081 | 0.0009 | 0.0002 | 0.9464 |
| Simpson | 0.0041 | 0.0003 | 0.0002 | 0.9756 | −0.0056 | 0.0012 | 0.0063 | 0.8036 | −0.0049 | 0.0006 | 0.0004 | 0.9358 |
| (C) Asymptotic diversity values | ||||||||||||
| Richness | 0.0005 | 0.0004 | 0.2103 | 0.1207 | 0.0007 | 0.0002 | 0.0020 | 0.8071 | 0.0004 | 0.0002 | 0.0420 | 0.1734 |
| Shannon | 0.0046 | 0.0011 | 0.0135 | 0.8167 | −0.0094 | 0.0017 | 0.0026 | 0.8598 | −0.0082 | 0.0009 | 0.0003 | 0.9440 |
| Simpson | 0.0044 | 0.0003 | 0.0002 | 0.9777 | −0.0061 | 0.0014 | 0.0074 | 0.7907 | −0.0049 | 0.0006 | 0.0004 | 0.9359 |
| (D) Abundance | −0.0011 | 0.0001 | <0.0001 | 0.2821 | 0.0026 | <0.0001 | <0.0001 | 0.7431 | 0.0023 | <0.0001 | <0.0001 | 0.7174 |
| Woodlands | Grasslands | Habitats Merged | ||||||||||
|---|---|---|---|---|---|---|---|---|---|---|---|---|
| Estimate | SE | p | R2 | Estimate | SE | p | R2 | Estimate | SE | p | R2 | |
| (A) Empirical diversity values | ||||||||||||
| Richness | 0.0001 | 0.0006 | 0.8599 | 0.0105 | 0.0003 | 0.0004 | 0.3514 | 0.3269 | 0.0003 | 0.0003 | 0.3590 | 0.2248 |
| Shannon | 0.0028 | 0.0008 | 0.0272 | 0.7432 | −0.0043 | 0.0015 | 0.0332 | 0.6294 | −0.0006 | 0.0018 | 0.7690 | 0.0189 |
| Simpson | 0.0027 | 0.0005 | 0.0067 | 0.8693 | −0.0037 | 0.0012 | 0.0287 | 0.6494 | −0.0001 | 0.0012 | 0.9380 | 0.0013 |
| (B) Rarefied/interpolated diversity values | ||||||||||||
| Richness | 0.0002 | 0.0006 | 0.7041 | 0.066 | −0.0004 | 0.0004 | 0.3030 | 0.5069 | <0.0001 | 0.0003 | 0.9590 | 0.0007 |
| Shannon | 0.0029 | 0.0007 | 0.0147 | 0.8091 | −0.0044 | 0.0014 | 0.0250 | 0.6668 | −0.0007 | 0.0018 | 0.7043 | 0.0313 |
| Simpson | 0.0028 | 0.0006 | 0.0080 | 0.8573 | −0.0037 | 0.0012 | 0.0267 | 0.6584 | −0.0001 | 0.0012 | 0.9261 | 0.0019 |
| (C) Asymptotic diversity values | ||||||||||||
| Richness | 0.0004 | 0.0006 | 0.4566 | 0.0972 | 0.0010 | 0.0003 | 0.0022 | 0.7536 | 0.0007 | 0.0003 | 0.0102 | 0.3756 |
| Shannon | 0.0031 | 0.0009 | 0.0214 | 0.7711 | −0.0047 | 0.0016 | 0.0286 | 0.6497 | −0.0007 | 0.0019 | 0.7347 | 0.0250 |
| Simpson | 0.0029 | 0.0006 | 0.0082 | 0.8560 | −0.0040 | 0.0013 | 0.0265 | 0.6594 | −0.0001 | 0.0012 | 0.9290 | 0.0018 |
| (D) Abundance | −0.0016 | 0.0002 | <0.0001 | 0.4444 | 0.0020 | 0.0001 | <0.0001 | 0.7263 | 0.0008 | 0.0001 | <0.0001 | 0.3090 |
| Woodlands | Grasslands | Habitats Merged | ||||||||||
|---|---|---|---|---|---|---|---|---|---|---|---|---|
| Estimate | SE | p | R2 | Estimate | SE | p | R2 | Estimate | SE | p | R2 | |
| (A) Empirical diversity values | ||||||||||||
| Richness | <−0.0001 | 0.0010 | 0.9770 | 0.0036 | −0.0002 | 0.0005 | 0.6136 | 0.0492 | −0.0002 | 0.0005 | 0.6136 | 0.0492 |
| Shannon | −0.0018 | 0.0012 | 0.2242 | 0.4373 | −0.0023 | 0.0010 | 0.0807 | 0.4881 | −0.0024 | 0.0009 | 0.0510 | 0.5660 |
| Simpson | −0.0017 | 0.0011 | 0.2138 | 0.4519 | −0.0015 | 0.0009 | 0.1539 | 0.3607 | −0.0016 | 0.0008 | 0.1121 | 0.4259 |
| (B) Rarefied/interpolated diversity values | ||||||||||||
| Richness | −0.0011 | 0.0012 | 0.3685 | 0.3867 | −0.0008 | 0.0009 | 0.3205 | 0.6141 | −0.0005 | 0.0006 | 0.4046 | 0.0716 |
| Shannon | −0.0022 | 0.0013 | 0.1841 | 0.4962 | −0.0011 | 0.0008 | 0.2327 | 0.2693 | −0.0009 | 0.0015 | 0.5661 | 0.0701 |
| Simpson | −0.0021 | 0.0012 | 0.1852 | 0.4945 | −0.0008 | 0.0007 | 0.2925 | 0.2167 | −0.0005 | 0.0011 | 0.6475 | 0.0451 |
| (C) Asymptotic diversity values | ||||||||||||
| Richness | <−0.0001 | 0.0010 | 0.9770 | 0.0036 | −0.0002 | 0.0004 | 0.6912 | 0.0145 | −0.0001 | 0.0004 | 0.8411 | 0.0036 |
| Shannon | −0.0022 | 0.0015 | 0.2436 | 0.4111 | −0.0023 | 0.0010 | 0.0721 | 0.5083 | −0.0025 | 0.0009 | 0.0465 | 0.5805 |
| Simpson | −0.0026 | 0.0016 | 0.1884 | 0.4890 | −0.0015 | 0.0009 | 0.1490 | 0.3670 | −0.0016 | 0.0008 | 0.1081 | 0.4331 |
| (D) Abundance | 0.0019 | 0.0004 | <0.0001 | 0.8419 | 0.0027 | <0.0001 | <0.0001 | 0.6838 | 0.0027 | <0.0001 | <0.0001 | 0.6825 |
Publisher’s Note: MDPI stays neutral with regard to jurisdictional claims in published maps and institutional affiliations. |
© 2021 by the authors. Licensee MDPI, Basel, Switzerland. This article is an open access article distributed under the terms and conditions of the Creative Commons Attribution (CC BY) license (https://creativecommons.org/licenses/by/4.0/).
Share and Cite
Mantoni, C.; Tsafack, N.; Palusci, E.; Di Pietro, S.; Fattorini, S. Diversity Patterns of Dung Beetles along a Mediterranean Elevational Gradient. Insects 2021, 12, 781. https://doi.org/10.3390/insects12090781
Mantoni C, Tsafack N, Palusci E, Di Pietro S, Fattorini S. Diversity Patterns of Dung Beetles along a Mediterranean Elevational Gradient. Insects. 2021; 12(9):781. https://doi.org/10.3390/insects12090781
Chicago/Turabian StyleMantoni, Cristina, Noelline Tsafack, Ettore Palusci, Stefano Di Pietro, and Simone Fattorini. 2021. "Diversity Patterns of Dung Beetles along a Mediterranean Elevational Gradient" Insects 12, no. 9: 781. https://doi.org/10.3390/insects12090781