
Landscape and Local Drivers Affecting Flying Insects along Fennel Crops (Foeniculum vulgare, Apiaceae) and Implications for Its Yield

 ,
,  , ,
, , 
Abstract
:Simple Summary
Abstract
1. Introduction
2. Materials and Methods
2.1. Study Area and Plant Species
2.2. Experimental Field Design
2.3. Insect Sampling
2.4. Landscape Composition and Configuration, and Local Management Practices
2.5. Essential Oil Yield
2.6. Data Analysis
3. Results
3.1. Impact of Landscape Composition and Configuration and Local Management Practices on Flower-Visiting Insects
3.2. Insect Impact on Fennel Yield
4. Discussion
4.1. Flower Visitor Community of Fennel Crops
4.2. Impact of Landscape Composition and Configuration on Fennel Flower-Visiting Insects
4.3. Impact of Local Management Practices on Flower-Visiting Insects
4.4. Insect Impact on Fennel Yield
5. Conclusions
Author Contributions
Funding
Institutional Review Board Statement
Data Availability Statement
Acknowledgments
Conflicts of Interest
Appendix A

Appendix B

| Parcel ID | Irrigation (L/ha) | Insecticides (L/ha) | Herbicides (L/ha) | Fungicides (L/ha) | Fertilizer (Kg/ha) | Parcel Size (ha) |
|---|---|---|---|---|---|---|
| “FNO2” | 3,000,000 | 0 | 3.500 | 1.500 | 300 | 9.200 |
| “FNO3” | 0 | 0.200 | 2.000 | 0.500 | 550 | 2.480 |
| “FNO5” | 0 | 0 | 3.500 | 0.000 | 40 | 2.820 |
| “FNO6” | 3,200,000 | 0.125 | 2.800 | 1.000 | 400 | 5.890 |
| “FNO8” | 1,050,000 | 0.100 | 2.625 | 1.000 | 500 | 9.220 |
| “FNO9” | 2,100,000 | 0 | 2.800 | 1.500 | 280 | 4.860 |
| “FNO15” | 600,000 | 0 | 1.500 | 0.500 | 240 | 1.390 |
| “FNO16” | 600,000 | 0 | 1.500 | 0.500 | 240 | 2.540 |
| “FNO17” | 0 | 0 | 2.800 | 0 | 100 | 1.100 |
| “FNO18” | 0 | 0.125 | 2.800 | 1.500 | 450 | 1.760 |
Appendix C
| Insect Family | N |
|---|---|
| Hymenoptera | 839 |
| Apidae | 493 |
| Halictidae | 111 |
| Vespidae | 64 |
| Sphecidae | 54 |
| Andrenidae | 38 |
| Pompilidae | 17 |
| Colletidae | 12 |
| Sapigydae | 10 |
| Megachilidae | 8 |
| Ichneumonidae | 7 |
| Scoliidae | 7 |
| Undetermined | 6 |
| Formicidae | 5 |
| Chysididae | 3 |
| Tenthredinidae | 2 |
| Drynidae | 1 |
| Evaniidae | 1 |
| Coleoptera | 613 |
| Meloidae | 281 |
| Mordellidae | 225 |
| Buprestidae | 36 |
| Cetoniidae | 19 |
| Melyridae | 19 |
| Cerambycidae | 12 |
| Oedemeridae | 12 |
| Cleridae | 5 |
| Coccinellidae | 3 |
| Chrysomelidae | 1 |
| Diptera | 462 |
| Sarcophagidae | 190 |
| Anthomyiidae | 93 |
| Bombyliidae | 64 |
| Tachinidae | 54 |
| Syrphidae | 34 |
| Conopidae | 17 |
| Stratyomyidae | 7 |
| Therevidae | 2 |
| Bibionidae | 1 |
| Lepidoptera | 14 |
| Undetermined | 8 |
| Nymphalidae | 3 |
| Zygaenidae | 3 |
Appendix D. Path-Analysis Setting Details and Discussion
Appendix D.1. Impact of Landscape Composition and Configuration on Flower-Visiting Insects
| (Int) | SNH Dist. | IJI | % SNH | Pesticide | Parcel Size | df | logLik | AICc | Δ | Weight |
|---|---|---|---|---|---|---|---|---|---|---|
| 3.953 | - | 0.532 | - | - | - | 4 | −138.459 | 286.500 | 0.000 | 0.254 |
| 3.954 | - | 0.636 | 0.166 | - | - | 5 | −137.312 | 287.100 | 0.610 | 0.181 |
| 3.954 | −0.122 | 0.581 | - | - | - | 5 | −137.621 | 287.700 | 1.220 | 0.133 |
| 3.953 | - | 0.515 | - | 0.082 | - | 5 | −138.019 | 288.500 | 2.020 | 0.089 |
| … | … | … | … | … | … | … | … | … | … | … |
| 3.955 | - | - | - | - | - | 3 | −147.459 | 301.800 | 15.320 | 0.000 |
| (Int) | SNH Dist. | IJI | % SNH | Pesticide | Parcel Size | df | logLik | AICc | Δ | Weight |
|---|---|---|---|---|---|---|---|---|---|---|
| 2.434 | −0.178 | 0.242 | - | - | 4 | −74.169 | 157.900 | 0.000 | 0.265 | |
| 2.430 | −0.155 | 0.220 | - | 0.077 | - | 5 | −73.165 | 158.800 | 0.890 | 0.170 |
| 2.431 | −0.194 | 0.197 | - | - | 0.074 | 5 | −73.664 | 159.800 | 1.890 | 0.103 |
| 2.433 | −0.165 | 0.265 | 0.046 | - | - | 5 | −76.959 | 160.400 | 2.480 | 0.077 |
| … | … | … | … | … | … | … | … | … | … | … |
| 2.438 | - | - | - | - | - | 2 | −80.264 | 165.0 | 7.03 | 0.008 |
Appendix D.2. Insect Impact on Fennel Yield
| (Int) | Abundance | Family Richness | df | logLik | AICc | Δ | Weight | |
|---|---|---|---|---|---|---|---|---|
| 3 | −1.772 × 1000 | - | 0.152 | 4 | −39.286 | 88.200 | 0.000 | 0.897 |
| 1 | −5.551 × 10⁻¹⁷ | - | - | 3 | −42.850 | 92.600 | 4.450 | 0.097 |
| 4 | −1.909 × 1000 | −0.005772 | 0.194 | 5 | −43.006 | 98.500 | 10.340 | 0.005 |
| 2 | −4.402 × 10⁻¹ | 0.006850 | - | 4 | −46.115 | 101.800 | 13.660 | 0.001 |
References
- Klein, A.M.; Vaissière, B.E.; Cane, J.H.; Steffan-Dewenter, I.; Cunningham, S.A.; Kremen, C.; Tscharntke, T. Importance of pollinators in changing landscapes for world crops. Proc. R. Soc. B Biol. Sci. 2007, 274, 303–313. [Google Scholar] [CrossRef] [PubMed] [Green Version]
- Smith, M.R.; Singh, G.M.; Mozaffarian, D.; Myers, S.S. Effects of decreases of animal pollinators on human nutrition and global health: A modelling analysis. Lancet 2015, 386, 1964–1972. [Google Scholar] [CrossRef]
- Potts, S.G.; Imperatriz-Fonseca, V.; Ngo, H.T.; Aizen, M.A.; Biesmeijer, J.C.; Breeze, T.D.; Dicks, L.V.; Garibaldi, L.A.; Hill, R.; Settele, J.; et al. Safeguarding pollinators and their values to human well-being. Nature 2016, 540, 220–229. [Google Scholar] [CrossRef] [PubMed]
- Greenleaf, S.S.; Kremen, C. Wild bee species increase tomato production and respond differently to surrounding land use in Northern California. Biol. Conserv. 2006, 133, 81–87. [Google Scholar] [CrossRef]
- Bartomeus, I.; Potts, S.G.; Steffan-Dewenter, I.; Vaissière, B.E.; Woyciechowski, M.; Krewenka, K.M.; Tscheulin, T.; Roberts, S.P.M.; Szentgyörgyi, H.; Westphal, C.; et al. Contribution of insect pollinators to crop yield and quality varies with agricultural intensification. PeerJ 2014, 2, e328. [Google Scholar] [CrossRef] [Green Version]
- Geslin, B.; Aizen, M.A.; Garcia, N.; Pereira, A.J.; Vaissière, B.E.; Garibaldi, L.A. The impact of honey bee colony quality on crop yield and farmers’ profit in apples and pears. Agric. Ecosyst. Environ. 2017, 248, 153–161. [Google Scholar] [CrossRef]
- Bommarco, R.; Marini, L.; Vaissière, B.E. Insect pollination enhances seed yield, quality, and market value in oilseed rape. Oecologia 2012, 169, 1025–1032. [Google Scholar] [CrossRef]
- Lautenbach, S.; Seppelt, R.; Liebscher, J.; Dormann, C.F. Spatial and temporal trends of global pollination benefit. PLoS ONE 2012, 7, e35954. [Google Scholar] [CrossRef] [Green Version]
- IPBES. The Assessment report of the Intergovernmental Science-Policy Platform on Biodiversity and Ecosystem Services on Pollinators, Pollination and Food Production; Potts, S.G., Imperatriz-Fonseca, V.L., Ngo, H.T., Eds.; Secretariat of the Intergovernmental Science-Policy Platform on Biodiversity and Ecosystem Services: Bonn, Germany, 2016; 552p. [Google Scholar] [CrossRef]
- Terzić, S.; Miklič, V.; Čanak, P. Review of 40 years of research carried out in Serbia on sunflower pollination. Oilseeds Fats Crops Lipîds 2017, 24, 7. [Google Scholar] [CrossRef] [Green Version]
- Ouvrard, P.; Jacquemart, A.L. Review of methods to investigate pollinator dependency in oilseed rape (Brassica napus). Field Crops Res. 2019, 231, 18–29. [Google Scholar] [CrossRef]
- Nazem, V.; Sabzalian, M.R.; Saeidi, G.; Rahimmalek, M. Essential oil yield and composition and secondary metabolites in self- and open-pollinated populations of mint (Mentha spp.). Ind. Crops Prod. 2019, 130, 332–340. [Google Scholar] [CrossRef]
- Salami, M.; Rahimmalek, M.; Ehtemam, M.H.; Sabzalian, M.R. Variation in bioactive compounds and anatomical characteristics of different fennel (Foeniculum vulgare Mill) populations as affected by self-pollination. J. Appl. Bot. Food Qual. 2016, 48, 38–48. [Google Scholar] [CrossRef]
- Chaudhary, O.P. Diversity, foraging behaviour of floral visitors and pollination ecology of fennel (Foeniculum vulgare Mill.). J. Spices Aromat. Crops 2006, 15, 34–41. [Google Scholar]
- Shilpa, P.; Sowmya, K.; Srikanth, C. Pollinator diversity and foraging activity on fennel, Foeniculum vulgare Mill. and African marigold, Tagetus minuta L. Pest. Manag. Hortic. Ecosyst. 2014, 20, 236–239. [Google Scholar]
- Bharti, V.; Ahlawat, D.S.; Sharma, S.K.; Singh, N.V.; Jitender, J.; Singh, N. Diversity, abundance and pollination efficiency of insect pollinators of fennel (Foeniculum vulgare Miller) and effect of abiotic factors on insect pollinator activity. J. Appl. Nat. Sci. 2015, 7, 786–793. [Google Scholar] [CrossRef] [Green Version]
- Meena, N.K.; Singh, B.; Kant, K.; Meena, R.D.; Solanki, R.K. Role of insect pollinators in pollination of seed spices-A review. Int. J. Seed Spices 2015, 5, 1–17. [Google Scholar]
- Meena, N.K.; Lal, G.; Meena, R.D.; Harisha, C.B.; Meena, S.R. Diversity of floral visitors and foraging behaviour and abundance of major pollinatorson fennel under semi-arid condition of Rajasthan. Int. J. Trop. Agric. 2016, 34, 1891–1898. [Google Scholar]
- Kumar, M.; Rai, C.P. Pollinator diversity and foraging behaviour of insect visitors on fennel (Foeniculum vulgare L.) bloom. JEZS 2020, 8, 2545–2548. [Google Scholar]
- Ricciardelli D’Albore, G.C. Les insectes pollinisateurs de quelques ombellifères d’intérêt agricole et condiementaire (Angelica Archangelica L., Carum Carvi L., Petroselinum crispum A.W. Hill, Apium Graveolens L., Pimpinella anisum L., Daucus carota L., Foeniculum Vulgare miller V. Apidologie 1986, 17, 107–124. [Google Scholar] [CrossRef] [Green Version]
- Skaldina, O. Insects associated with sweet fennel: Beneficial visitors attracted by a generalist plant. Arthropod. Plant. Interact. 2020, 14, 399–407. [Google Scholar] [CrossRef] [Green Version]
- Hendrickx, F.; Maelfait, J.P.; Van Wingerden, W.; Schweiger, O.; Speelmans, M.; Aviron, S.; Augenstein, I.; Billeter, R.; Bailey, D.; Bukacek, R.; et al. How landscape structure, land-use intensity and habitat diversity affect components of total arthropod diversity in agricultural landscapes. J. Appl. Ecol. 2007, 44, 340–351. [Google Scholar] [CrossRef]
- Kremen, C.; Williams, N.M.; Aizen, M.A.; Gemmill-Herren, B.; LeBuhn, G.; Minckley, R.; Packer, L.; Potts, S.G.; Roulston, T.; Steffan-Dewenter, I.; et al. Pollination and other ecosystem services produced by mobile organisms: A conceptual framework for the effects of land-use change. Ecol. Lett. 2007, 10, 299–314. [Google Scholar] [CrossRef] [PubMed]
- Steckel, J.; Westphal, C.; Peters, M.K.; Bellach, M.; Rothenwoehrer, C.; Erasmi, S.; Scherber, C.; Tscharntke, T.; Steffan-Dewenter, I. Landscape composition and configuration differently affect trap-nesting bees, wasps and their antagonists. Biol. Conserv. 2014, 172, 56–64. [Google Scholar] [CrossRef]
- Du Clos, B.; Drummond, F.A.; Loftin, C.S. Noncrop Habitat Use by Wild Bees (Hymenoptera: Apoidea) in a Mixed-Use Agricultural Landscape. Environ. Entomol. 2020, 49, 502–515. [Google Scholar] [CrossRef] [PubMed]
- Fahrig, L.; Baudry, J.; Brotons, L.; Burel, F.G.; Crist, T.O.; Fuller, R.J.; Sirami, C.; Siriwardena, G.M.; Martin, J.L. Functional landscape heterogeneity and animal biodiversity in agricultural landscapes. Ecol. Lett. 2011, 14, 101–112. [Google Scholar] [CrossRef] [PubMed]
- Senapathi, D.; Goddard, M.A.; Kunin, W.E.; Baldock, K.C.R. Landscape impacts on pollinator communities in temperate systems: Evidence and knowledge gaps. Funct. Ecol. 2017, 31, 26–37. [Google Scholar] [CrossRef] [Green Version]
- Kennedy, C.M.; Lonsdorf, E.; Neel, M.C.; Williams, N.M.; Ricketts, T.H.; Winfree, R.; Bommarco, R.; Brittain, C.; Burley, A.L.; Cariveau, D.; et al. A global quantitative synthesis of local and landscape effects on wild bee pollinators in agroecosystems. Ecol. Lett. 2013, 16, 584–599. [Google Scholar] [CrossRef]
- Beduschi, T.; Kormann, U.G.; Tscharntke, T.; Scherber, C. Spatial community turnover of pollinators is relaxed by semi-natural habitats, but not by mass-flowering crops in agricultural landscapes. Biol. Conserv. 2018, 221, 59–66. [Google Scholar] [CrossRef]
- Ricketts, T.H.; Regetz, J.; Steffan-Dewenter, I.; Cunningham, S.A.; Kremen, C.; Bogdanski, A.; Gemmill-Herren, B.; Greenleaf, S.S.; Klein, A.M.; Mayfield, M.M.; et al. Landscape effects on crop pollination services: Are there general patterns? Ecol. Lett. 2008, 11, 499–515. [Google Scholar] [CrossRef]
- Geslin, B.; Oddie, M.; Folschweiller, M.; Legras, G.; Seymour, C.L.; van Veen, F.J.F.; Thébault, E. Spatiotemporal changes in flying insect abundance and their functional diversity as a function of distance to natural habitats in a mass flowering crop. Agric. Ecosyst. Environ. 2016, 229, 21–29. [Google Scholar] [CrossRef] [Green Version]
- Carvalheiro, L.G.; Seymour, C.L.; Veldtman, R.; Nicolson, S.W. Pollination services decline with distance from natural habitat even in biodiversity-rich areas. J. Appl. Ecol. 2010, 47, 810–820. [Google Scholar] [CrossRef]
- Garibaldi, L.A.; Steffan-Dewenter, I.; Kremen, C.; Morales, J.M.; Bommarco, R.; Cunningham, S.A.; Carvalheiro, L.G.; Chacoff, N.P.; Dudenhöffer, J.H.; Greenleaf, S.S.; et al. Stability of pollination services decreases with isolation from natural areas despite honey bee visits. Ecol. Lett. 2011, 14, 1062–1072. [Google Scholar] [CrossRef] [PubMed]
- Garibaldi, L.A.; Carvalheiro, L.G.; Vaissière, B.E.; Gemmill-Herren, B.; Hipolito, J.; Freitas, B.M.; Ngo, H.T.; Azzu, N.; Sàez, A.; Aström, J.; et al. Mutually beneficial pollinaor diversity and crop yield outcomes in small and large farms. Science 2016, 351, 388–391. [Google Scholar] [CrossRef] [PubMed] [Green Version]
- Hass, A.L.; Kormann, U.G.; Tscharntke, T.; Clough, Y.; Baillod, A.B.; Sirami, C.; Fahrig, L.; Martin, J.L.; Baudry, J.; Bertrand, C.; et al. Landscape configurational heterogeneity by small-scale agriculture, not crop diversity, maintains pollinators and plant reproduction in western Europe. Proc. R. Soc. B Biol. Sci. 2018, 285, 20172242. [Google Scholar] [CrossRef]
- Brittain, C.; Potts, S.G. The potential impacts of insecticides on the life-history traits of bees and the consequences for pollination. Basic Appl. Ecol. 2011, 12, 321–331. [Google Scholar] [CrossRef]
- Le Féon, V.; Schermann-Legionnet, A.; Delettre, Y.; Aviron, S.; Billeter, R.; Bugter, R.; Hendrickx, F.; Burel, F. Intensification of agriculture, landscape composition and wild bee communities: A large scale study in four European countries. Agric. Ecosyst. Environ. 2010, 137, 143–150. [Google Scholar] [CrossRef]
- Vanbergen, A.J.; Garratt, M.P.; Vanbergen, A.J.; Baude, M.; Biesmeijer, J.C.; Britton, N.F.; Brown, M.J.F.; Brown, M.; Bryden, J.; Budge, G.E.; et al. Threats to an ecosystem service: Pressures on pollinators. Front. Ecol. Environ. 2013, 11, 251–259. [Google Scholar] [CrossRef] [Green Version]
- Westphal, C.; Bommarco, R.; Carré, G.; Lamborn, E.; Petanidou, T.; Potts, S.G.; Roberts, S.P.M.; Tscheulin, T.; Vaissière, B.E.; Woyciechowski, M.; et al. Measuring Bee Diversity in Different European Habitats and Biogeographical Regions. Ecol. Monogr. 2008, 78, 653–671. [Google Scholar] [CrossRef] [Green Version]
- Greenleaf, S.S.; Williams, N.M.; Winfree, R.; Kremen, C. Bee foraging ranges and their relationship to body size. Oecologia 2007, 153, 589–596. [Google Scholar] [CrossRef]
- Zurbuchen, A.; Landert, L.; Klaiber, J.; Müller, A.; Hein, S.; Dorn, S. Maximum foraging ranges in solitary bees: Only few individuals have the capability to cover long foraging distances. Biol. Conserv. 2010, 143, 669–676. [Google Scholar] [CrossRef]
- Bommarco, R.; Biesmeijer, J.C.; Meyer, B.; Potts, S.G.; Pöyry, J.; Roberts, S.P.M.; Steffan-Dewenter, I.; Ockinger, E. Dispersal capacity and diet breadth modify the response of wild bees to habitat loss. Proc. R. Soc. B Biol. Sci. 2010, 277, 2075–2082. [Google Scholar] [CrossRef] [Green Version]
- Dainese, M.; Martin, E.A.; Aizen, M.A.; Albrecht, M.; Bartomeus, I.; Bommarco, R.; Carvalheiro, L.G.; Chaplin-Kramer, R.; Gagic, V.; Garibaldi, L.A.; et al. A global synthesis reveals biodiversity-mediated benefits for crop production. Sci. Adv. 2019, 5, eaax0121. [Google Scholar] [CrossRef] [PubMed] [Green Version]
- McGarigal, K.; Cushman, S.A.; Ene, E. FRAGSTATS v4: Spa-Tial Pattern Analysis Program for Categorical and Continuous Maps. Computer Software Program Produced by the Authors at the University of Massachusetts, Amherst. 2012. Available online: http://www.umass.edu/landeco/research/frag-stats/fragstats.html (accessed on 1 March 2021).
- Lausch, A.; Herzog, F. Applicability of landscape metrics for the monitoring of landscape change: Issues of scale, resolution and interpretability. Ecol. Indic. 2002, 2, 3–15. [Google Scholar] [CrossRef]
- Lefcheck, J.S. piecewiseSEM: Piecewise structural equation modelling in r for ecology, evolution, and systematics. Methods Ecol. Evol. 2016, 7, 573–579. [Google Scholar] [CrossRef]
- R Core Team. R: A Language and Environment for Statistical Computing; R Foundation for Statistical Computing: Vienna, Austria, 2020; Available online: https://www.R-project.org/ (accessed on 1 March 2021).
- Shipley, B. Confirmatory path analysis in a generalized multilevel context. Ecology 2009, 90, 363–368. [Google Scholar] [CrossRef] [PubMed]
- Shipley, B. The AIC model selection method applied to path analytic models compared using a d-separation test. Ecology 2013, 94, 560–564. [Google Scholar] [CrossRef]
- Ogilvie, J.E.; Griffin, S.R.; Gezon, Z.J.; Inouye, B.D.; Underwood, N.; Inouye, D.W.; Irwin, R.E. Interannual bumble bee abundance is driven by indirect climate effects on floral resource phenology. Ecol. Lett. 2017, 20, 1507–1515. [Google Scholar] [CrossRef] [PubMed]
- Steffan-Dewenter, I.; Münzenberg, U.; Büger, C.; Thies, C.; Tscharntke, T. Scale-Dependent Effects of Landscape Context on Three Pollinator Guilds. Ecology 2002, 83, 1421–1432. [Google Scholar] [CrossRef]
- Öckinger, E.; Smith, H.G. Semi-natural grasslands as population sources for pollinating insects in agricultural landscapes. J. Appl. Ecol. 2007, 44, 50–59. [Google Scholar] [CrossRef]
- Proesmans, W.; Bonte, D.; Smagghe, G.; Meeus, I.; Decocq, G.; Spicher, F.; Kolb, A.; Lemke, I.; Diekmann, M.; Bruun, H.H.; et al. Small forest patches as pollinator habitat: Oases in an agricultural desert? Landsc. Ecol. 2019, 34, 487–501. [Google Scholar] [CrossRef] [Green Version]
- Holland, J.M.; Douma, J.C.; Crowley, L.; James, L.; Kor, L.; Stevenson, D.R.W.; Smith, B.M. Semi-natural habitats support biological control, pollination and soil conservation in Europe. A review. Agron. Sustain. Dev. 2017, 37. [Google Scholar] [CrossRef] [Green Version]
- Raderschall, C.A.; Bommarco, R.; Lindström, S.A.M.; Lundin, O. Landscape crop diversity and semi-natural habitat affect crop pollinators, pollination benefit and yield. Agric. Ecosyst. Environ. 2021, 306. [Google Scholar] [CrossRef]
- Carré, G.; Roche, P.; Chifflet, R.; Morison, N.; Bommarco, R.; Harrison-Cripps, J.; Krewenka, K.; Potts, S.G.; Roberts, S.P.M.; Rodet, G.; et al. Landscape context and habitat type as drivers of bee diversity in European annual crops. Agric. Ecosyst. Environ. 2009, 133, 40–47. [Google Scholar] [CrossRef]
- Bartual, A.M.; Sutter, L.; Bocci, G.; Moonen, A.C.; Cresswell, J.; Entling, M.; Giffard, B.; Jacot, K.; Jeanneret, P.; Holland, J.; et al. The potential of different semi-natural habitats to sustain pollinators and natural enemies in European agricultural landscapes. Agric. Ecosyst. Environ. 2019, 279, 43–52. [Google Scholar] [CrossRef]
- Holzschuh, A.; Dainese, M.; González-Varo, J.P.; Mudri-Stojnić, S.; Riedinger, V.; Rundlöf, M.; Scheper, J.; Wickens, J.B.; Wickens, V.J.; Bommarco, R.; et al. Mass-flowering crops dilute pollinator abundance in agricultural landscapes across Europe. Ecol. Lett. 2016, 19, 1228–1236. [Google Scholar] [CrossRef]
- Bailey, S.; Requier, F.; Nusillard, B.; Roberts, S.P.M.; Potts, S.G.; Bouget, C. Distance from forest edge affects bee pollinators in oilseed rape fields. Ecol. Evol. 2014, 4, 370–380. [Google Scholar] [CrossRef]
- Nayak, G.K.; Roberts, S.P.M.; Garratt, M.; Breeze, T.D.; Tscheulin, T.; Harrison-Cripps, J.; Vogiatzakis, I.N.; Stirpe, M.T.; Potts, S.G. Interactive effect of floral abundance and semi-natural habitats on pollinators in field beans (Vicia faba). Agric. Ecosyst. Environ. 2015, 199, 58–66. [Google Scholar] [CrossRef]
- Ernoult, A.; Vialatte, A.; Butet, A.; Michel, N.; Rantier, Y.; Jambon, O.; Burel, F. Grassy strips in their landscape context, their role as new habitat for biodiversity. Agric. Ecosyst. Environ. 2013, 166, 15–27. [Google Scholar] [CrossRef]
- Liivamägi, A. Variation in the Habitat Requirements of Pollinating Insects in Semi-Natural Meadows. Master’s Thesis, Michigan State University, East Lansing, MI, USA, 2014. [Google Scholar]
- Van Geert, A.; Van Rossum, F.; Triest, L. Do linear landscape elements in farmland act as biological corridors for pollen dispersal? J. Ecol. 2010, 98, 178–187. [Google Scholar] [CrossRef]
- Geslin, B.; Gachet, S.; Deschamps-cottin, M.; Flacher, F.; Ignace, B.; Knoploch, C.; Meineri, E.; Robles, C.; Schurr, L.; Le Féon, V. Bee hotels host a high abundance of exotic bees in an urban context. Acta Oecol. 2020, 105, 103556. [Google Scholar] [CrossRef]
- Connelly, H.; Poveda, K.; Loeb, G. Agriculture, Ecosystems and Environment Landscape simplification decreases wild bee pollination services to strawberry. Agric. Ecosyst. Environ. 2015, 211, 51–56. [Google Scholar] [CrossRef]
- Sihag, R.C. Effect of pesticides and bee pollination on seed yield of some crops in India. J. Apic. Res. 1988, 27, 49–54. [Google Scholar] [CrossRef]
- Garibaldi, L.A.; Steffan-Dewenter, I.; Winfree, R.; Aizen, M.A.; Bommarco, R.; Cunningham, S.A.; Kremen, C.; Carvalheiro, L.G.; Harder, L.D.; Afik, O.; et al. Wild pollinators enhance fruit set of crops regardless of honey bee abundance. Science 2013, 340, 1608–1611. [Google Scholar] [CrossRef] [PubMed]
- Woodcock, B.A.; Garratt, M.P.D.; Powney, G.D.; Shaw, R.F.; Osborne, J.L.; Soroka, J.; Lindström, S.A.M.; Stanley, D.; Ouvrard, P.; Edwards, M.E.; et al. Meta-analysis reveals that pollinator functional diversity and abundance enhance crop pollination and yield. Nat. Commun. 2019, 10, 1481. [Google Scholar] [CrossRef] [Green Version]
- Senapathi, D.; Fründ, J.; Albrecht, M.; Garratt, M.P.D.; Kleijn, D.; Brian, J.; Potts, S.G.; An, J.; Anderson, G.; Baensch, S.; et al. Diversity increases temporal stability in global crop pollinator communities. Proc. R. Soc. B 2021, 288, 1–20. [Google Scholar] [CrossRef] [PubMed]
- Mallinger, R.E.; Gratton, C. Species richness of wild bees, but not the use of managed honeybees, increases fruit set of a pollinator-dependent crop. J. Appl. Ecol. 2015, 52, 323–330. [Google Scholar] [CrossRef]
- Frund, J.; Dormann, C.F.; Holzschuh, A.; Tscharntke, T. Bee diversity effects on pollination depend on functional complementarity and niche shifts. Ecology 2013, 94, 2042–2054. [Google Scholar] [CrossRef] [Green Version]
- Gagic, V.; Bartomeus, I.; Jonsson, T.; Taylor, A.; Winqvist, C.; Fischer, C.; Slade, E.M.; Steffan-Dewenter, I.; Emmerson, M.; Potts, S.G.; et al. Functional identity and diversity of animals predict ecosystem functioning better than species-based indices. Proc. R. Soc. B Biol. Sci. 2015, 282, 20142620. [Google Scholar] [CrossRef] [Green Version]
- Hoehn, P.; Tscharntke, T.; Tylianakis, J.M.; Steffan-dewenter, I. Functional group diversity of bee pollinators increases crop yield. Proc. R. Soc. B Biol. Sci. 2008, 275, 2283–2291. [Google Scholar] [CrossRef] [Green Version]
- Blitzer, E.J.; Gibbs, J.; Park, M.G.; Danforth, B.N. Pollination services for apple are dependent on diverse wild bee communities. Agric. Ecosyst. Environ. 2016, 221, 1–7. [Google Scholar] [CrossRef] [Green Version]
- Niemirski, R.; Zych, M. Fly pollination of dichogamous Angelica sylvestris (Apiaceae): How (functionally) specialized can a (morphologically) generalized plant be? Plant. Syst. Evol. 2011, 294, 147–158. [Google Scholar] [CrossRef] [Green Version]
- Hermansen, T.D.; Britton, D.R.; Ayre, D.J.; Minchinton, T.E. Identifying the real pollinators? Exotic honeybees are the dominant flower visitors and only effective pollinators of Avicennia marina in Australian temperate mangroves. Estuaries Coasts 2014, 37, 621–635. [Google Scholar] [CrossRef]
- Logan, M. Biostatistical Design and Analysis Using R: A Practical Guide; John Wiley & Sons Ltd.: Chichester, UK, 2010; ISBN 9781444319620. [Google Scholar]
- Muratet, A.; Fontaine, B. Contrasting impacts of pesticides on butterflies and bumblebees in private gardens in France. Biol. Conserv. 2015, 182, 148–154. [Google Scholar] [CrossRef]
- Cresswell, J.E.; Osborne, J.L. The effect of patch size and separation on bumblebee foraging in oilseed rape: Implications for gene flow. J. Appl. Ecol. 2004, 41, 539–546. [Google Scholar] [CrossRef]
- Xie, Z.; Wang, J.; Pan, D.; An, J. Landscape-modified concentration effect and waylaying effect of bees and their consequences on pollination of mass-flowering plants in agricultural ecosystems. Agric. Ecosyst. Environ. 2019, 280, 24–34. [Google Scholar] [CrossRef]
- Wenninger, A.; Kim, T.N.; Spiesman, B.J.; Gratton, C. Contrasting foraging patterns: Testing resource-concentration and dilution effects with pollinators and seed predators. Insects 2016, 7, 23. [Google Scholar] [CrossRef] [PubMed] [Green Version]
- Essenberg, C.J. Scale-dependent shifts in the species composition of flower visitors with changing floral density. Oecologia 2013, 171, 187–196. [Google Scholar] [CrossRef] [PubMed]


| Response | Predictor | Estimate | Std. Error | DF | Crit. Value | p. Value |
|---|---|---|---|---|---|---|
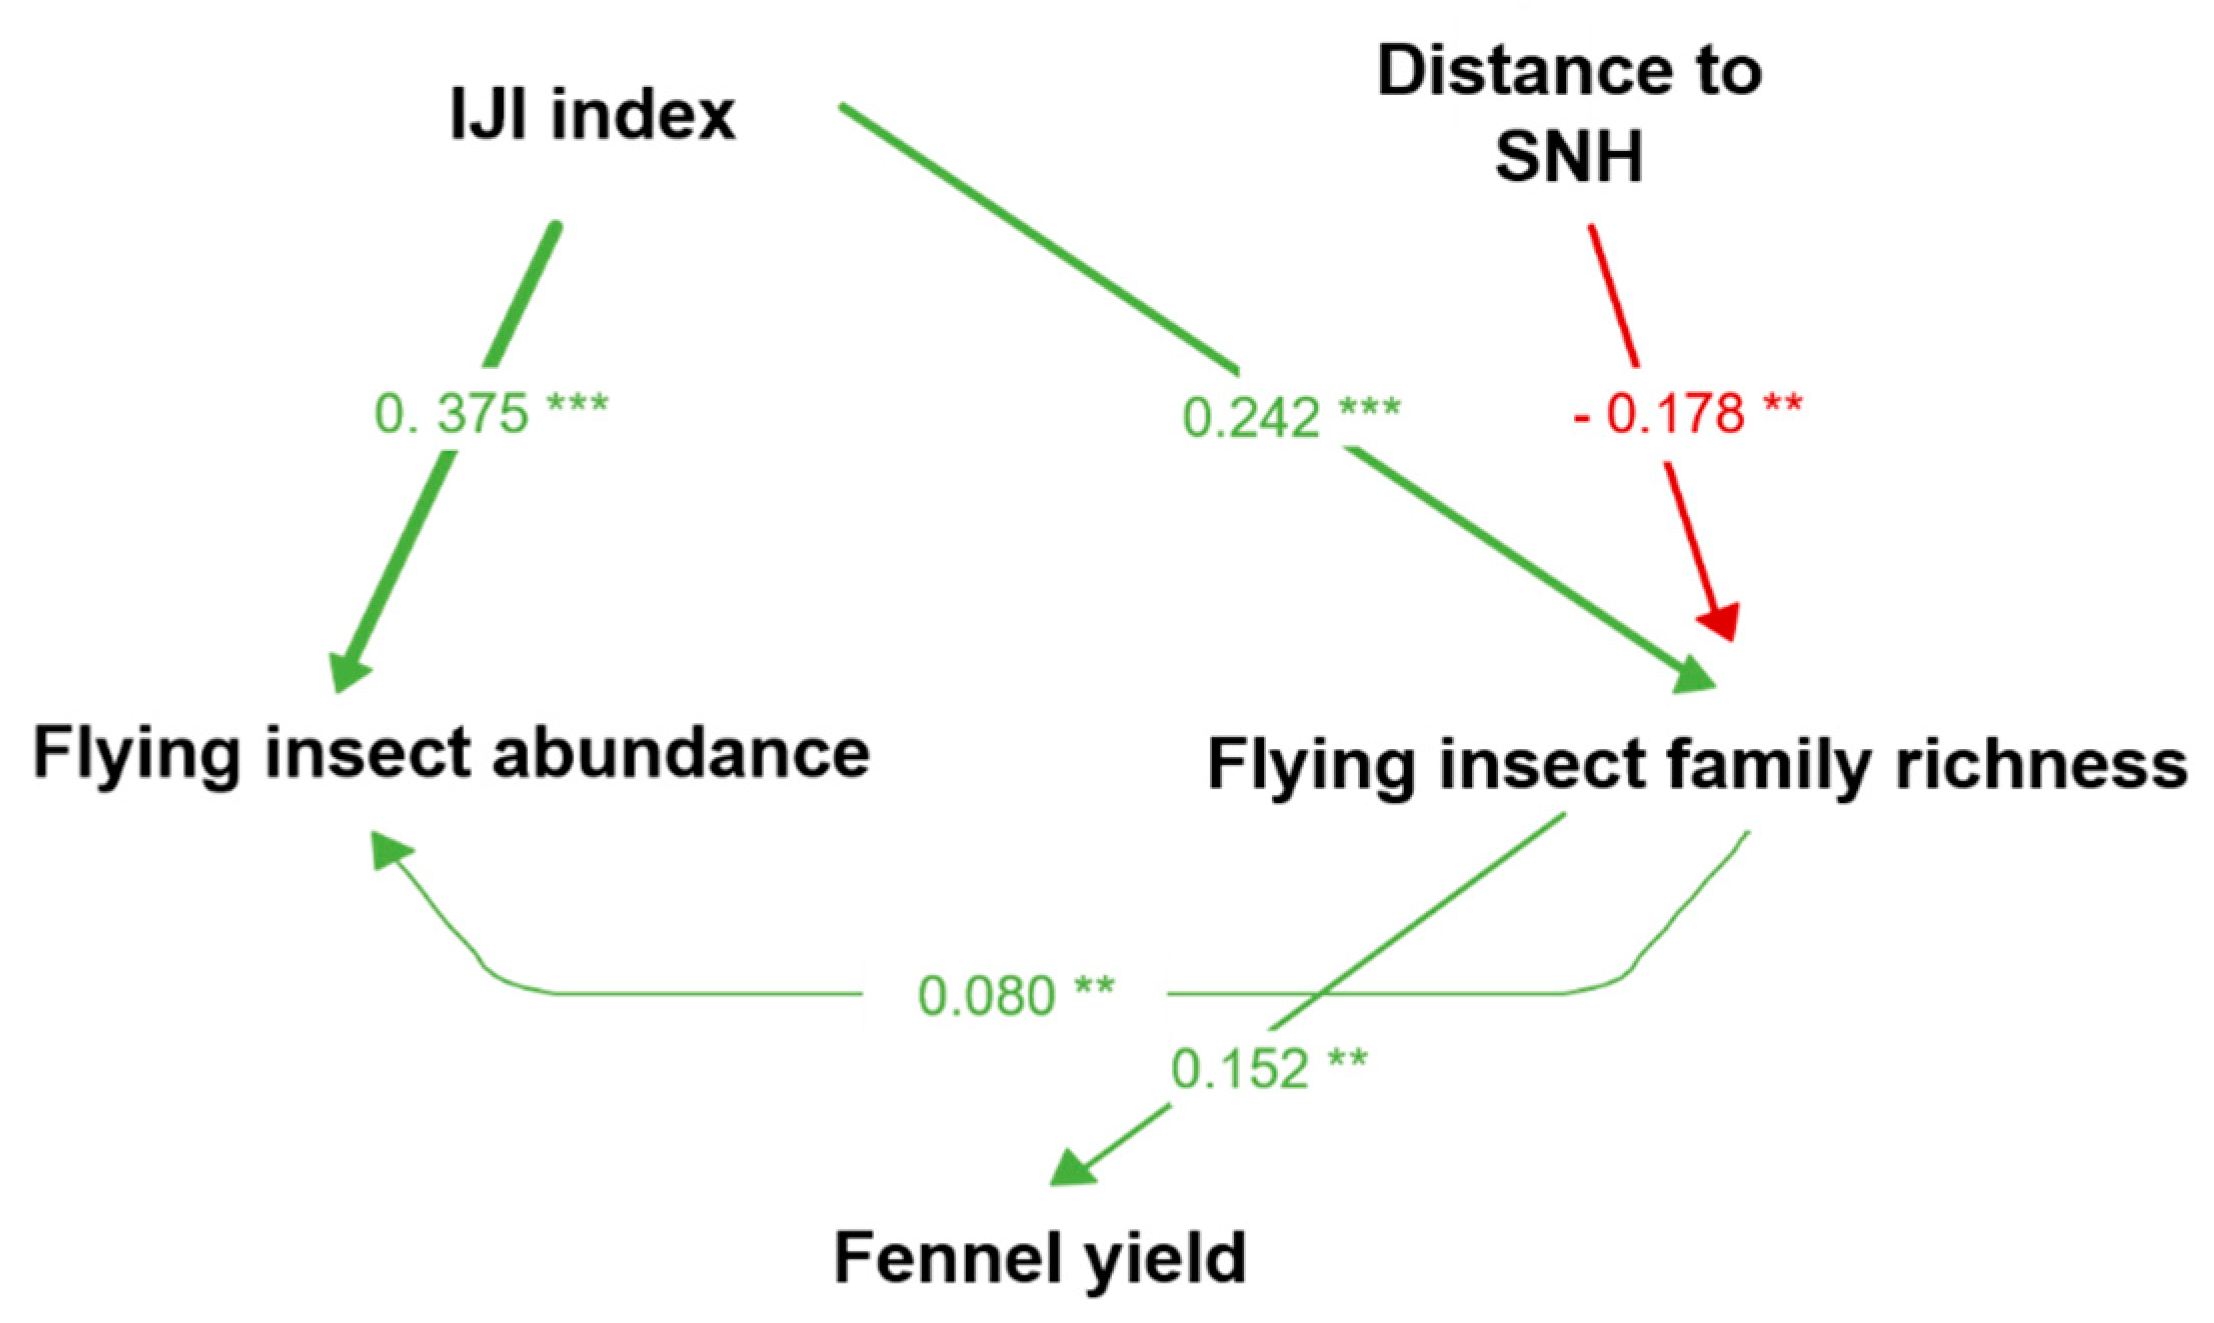
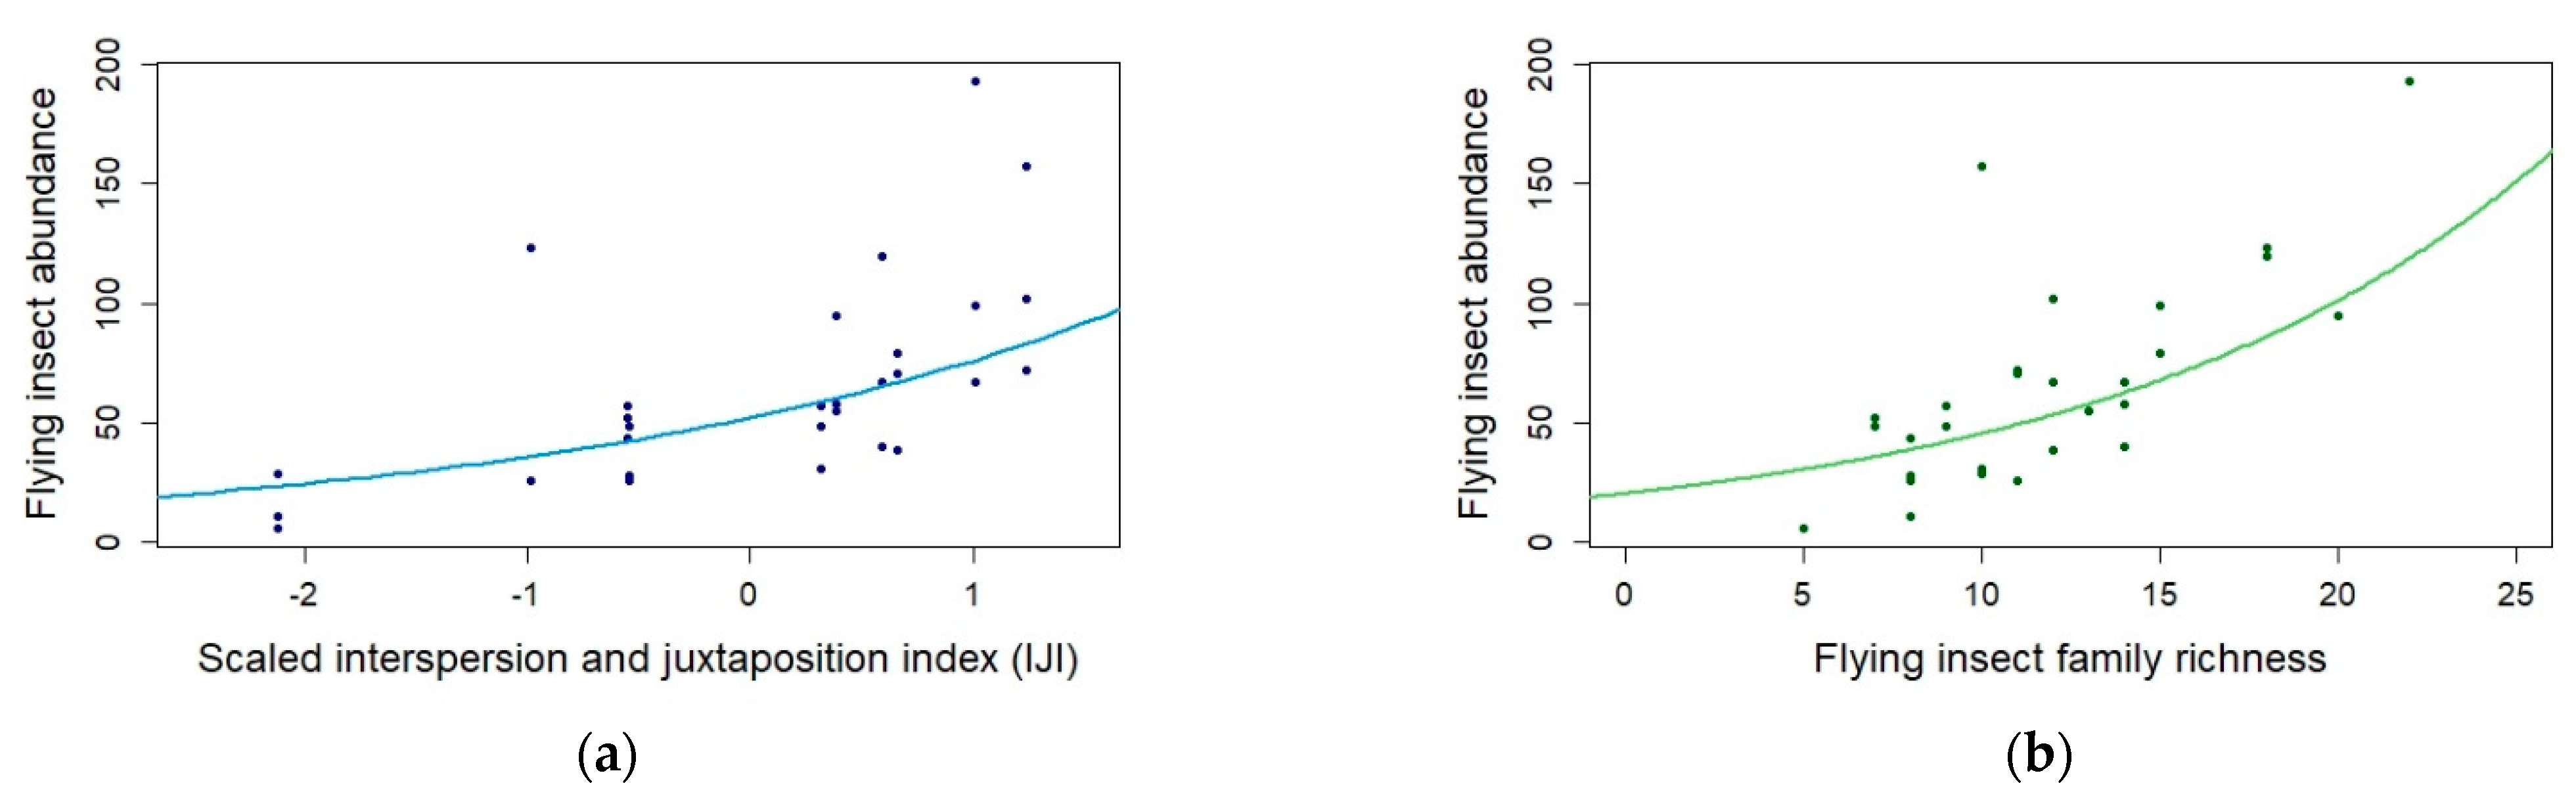
| Insect abundance | IJI | 0.375 | 0.089 | 30.000 | 4.193 | <0.0001 *** |
| Insect abundance | Insect family richness | 0.080 | 0.024 | 30.000 | 3.278 | 0.001 ** |
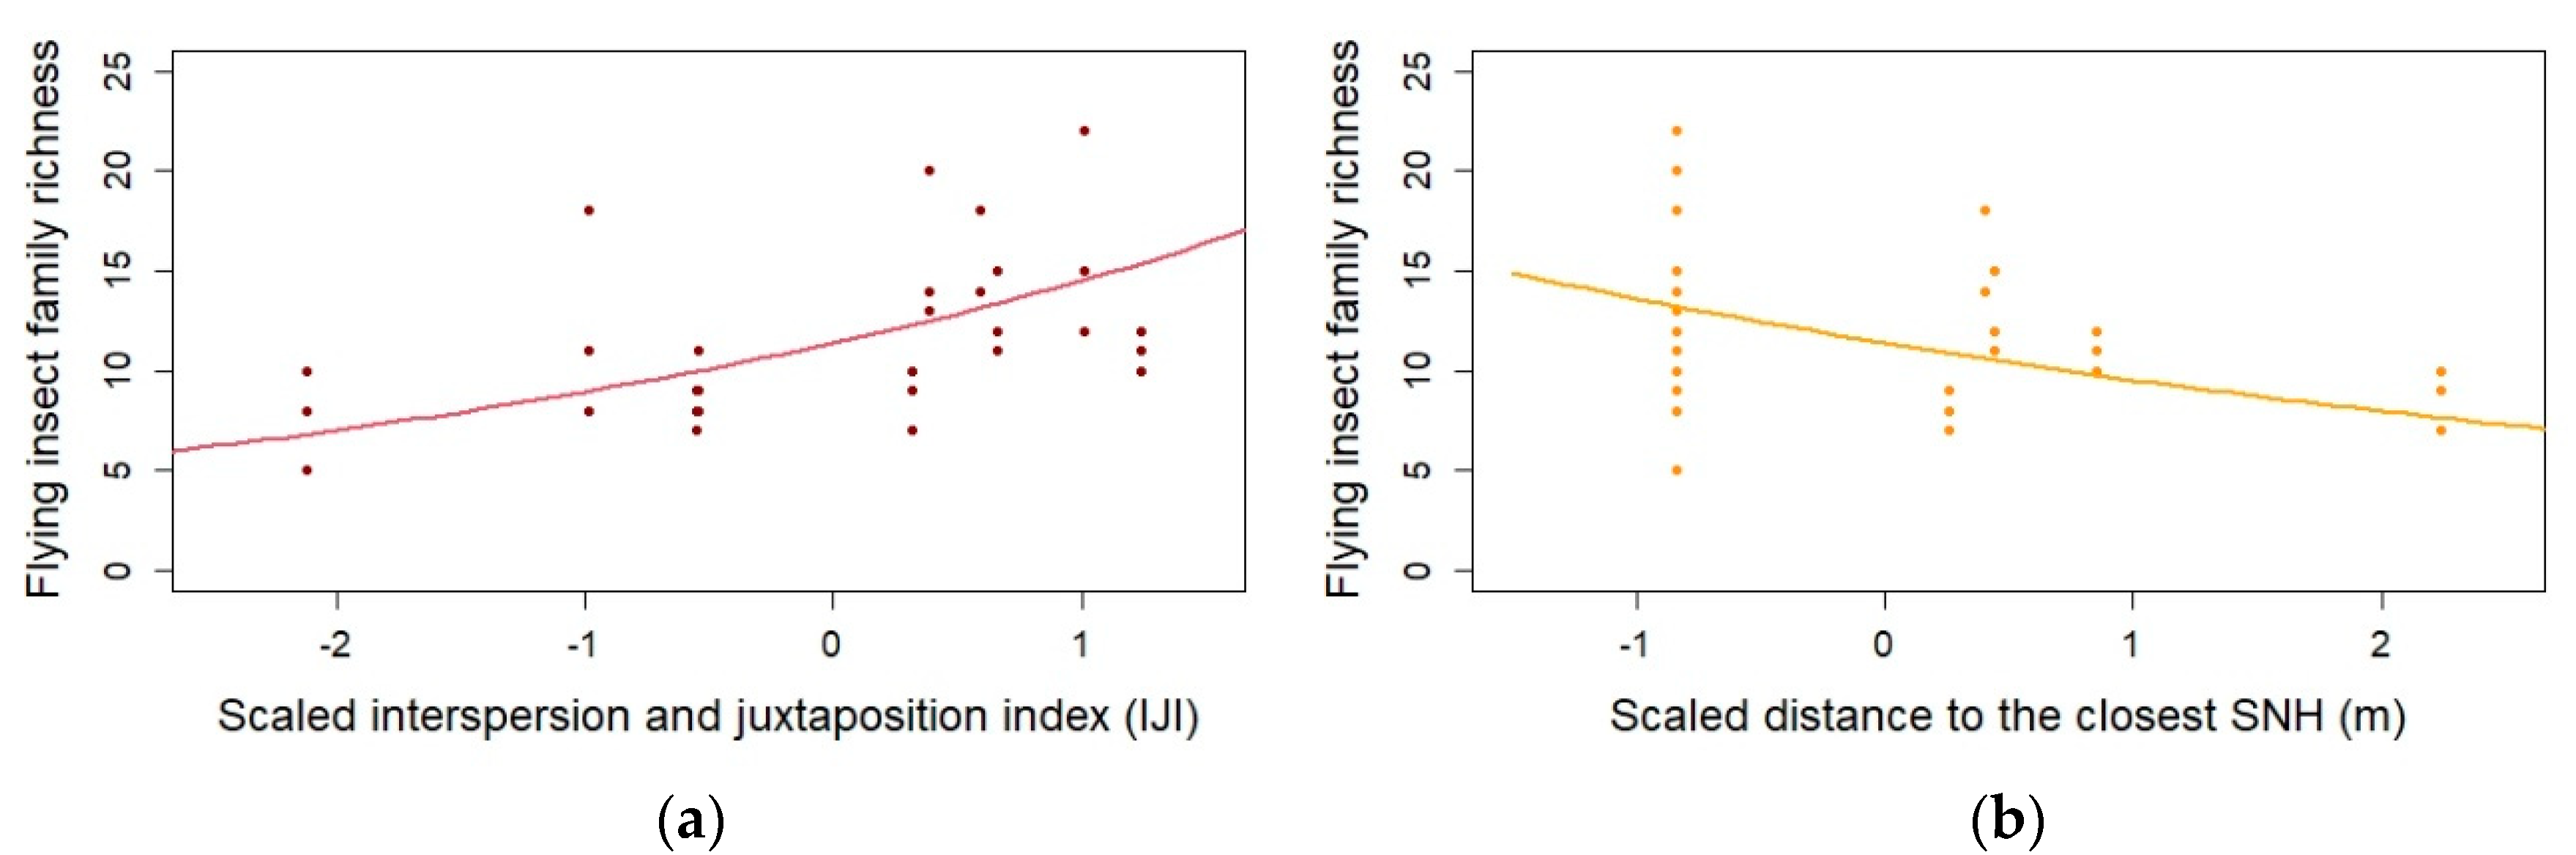
| Insect family richness | IJI | 0.242 | 0.062 | 30.000 | 3.902 | <0.0001 *** |
| Insect family richness | Distance to SNH | −0.178 | 0.062 | 30.000 | −2.853 | 0.004 ** |
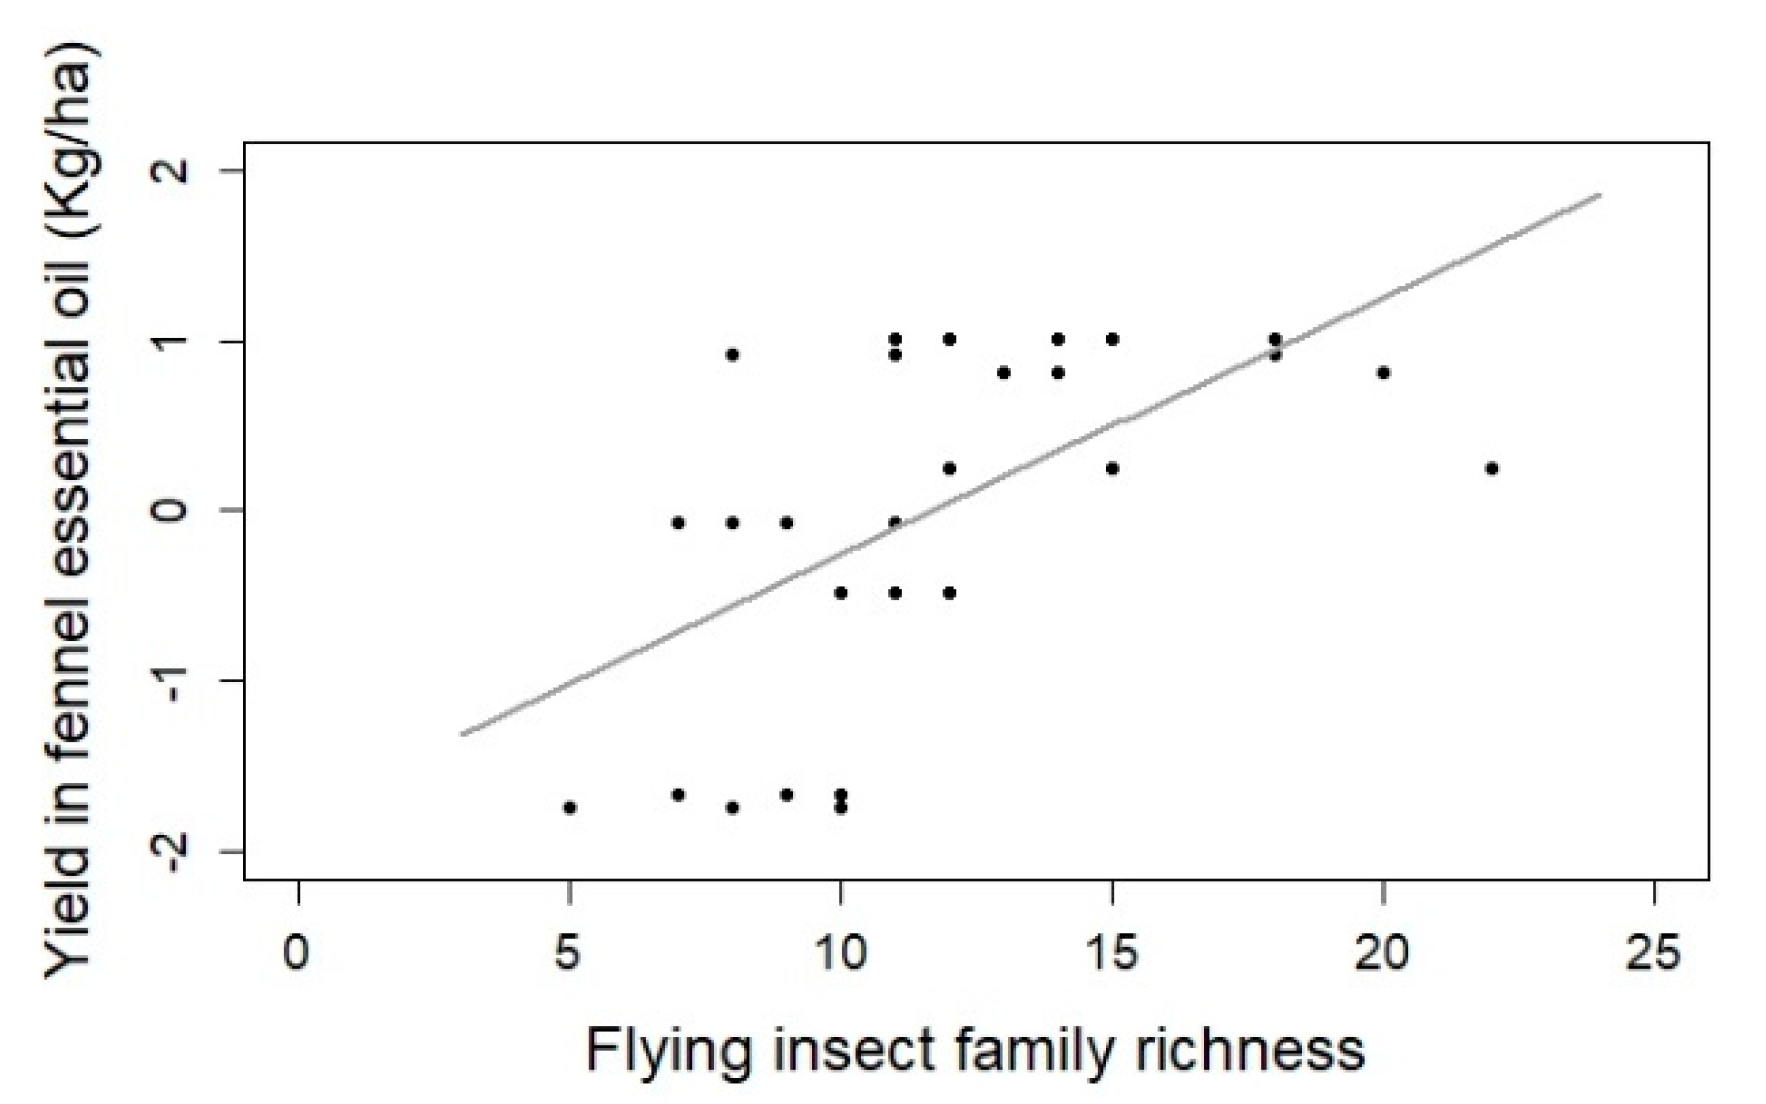
| Fennel yield | Insect family richness | 0.152 | 0.039 | 26.556 | 12.024 | 0.002 ** |
Publisher’s Note: MDPI stays neutral with regard to jurisdictional claims in published maps and institutional affiliations. |
© 2021 by the authors. Licensee MDPI, Basel, Switzerland. This article is an open access article distributed under the terms and conditions of the Creative Commons Attribution (CC BY) license (https://creativecommons.org/licenses/by/4.0/).
Share and Cite
Schurr, L.; Geslin, B.; Affre, L.; Gachet, S.; Delobeau, M.; Brugger, M.; Bourdon, S.; Masotti, V. Landscape and Local Drivers Affecting Flying Insects along Fennel Crops (Foeniculum vulgare, Apiaceae) and Implications for Its Yield. Insects 2021, 12, 404. https://doi.org/10.3390/insects12050404
Schurr L, Geslin B, Affre L, Gachet S, Delobeau M, Brugger M, Bourdon S, Masotti V. Landscape and Local Drivers Affecting Flying Insects along Fennel Crops (Foeniculum vulgare, Apiaceae) and Implications for Its Yield. Insects. 2021; 12(5):404. https://doi.org/10.3390/insects12050404
Chicago/Turabian StyleSchurr, Lucie, Benoît Geslin, Laurence Affre, Sophie Gachet, Marion Delobeau, Magdalena Brugger, Sarah Bourdon, and Véronique Masotti. 2021. "Landscape and Local Drivers Affecting Flying Insects along Fennel Crops (Foeniculum vulgare, Apiaceae) and Implications for Its Yield" Insects 12, no. 5: 404. https://doi.org/10.3390/insects12050404