Minimal Thermal Requirements for Development and Activity of Stored Product and Food Industry Pests (Acari, Coleoptera, Lepidoptera, Psocoptera, Diptera and Blattodea): A Review


Abstract
:
1. Introduction
2. Minimum Thermal Requirements—Terminology, Concepts and Sources of Variability
2.1. Temperature Constants, Thresholds and Chill Coma Terminology and Concepts
2.1.1. Lower Development Threshold (LDT), Lower Theoretical Temperature Threshold, and Lower Population Threshold (LPT)
2.1.2. Cold Hardiness, Chill Coma, Critical Thermal Minimum and Cctivity Thresholds (Flying, Walking Respiration)
2.2. Inter- and Intra-Species Sources of Variability for Thermal Constants
2.2.1. Taxon, Species, Strains, Individuals and Thermal Adaptation
2.2.2. “Rate Isomorphy” and Identical LDTs in Developmental Stages of a Species
2.2.3. Thermal Acclimation
2.2.4. Environmental Factors (Humidity, Moisture, and Food Quality)
2.2.5. Models
2.2.6. Experimental Design and Errors
3. Importance of Low Temperatures for Stored Product Pest Detection and Control
3.1. Predictive Phenological or Forensic Models (Degree-Day/DD/ = Accumulated Degree Aays/ADD/)
3.2. Safe Commodity/Finished Food Storage and Production at Low Temperature
3.3. Control (Long-Term Exposure)
3.4. Pest Risk and Invasion Modelling
3.5. Efficacy of Fumigants and Modified Atmospheres and Low Temperature
3.6. Activity-Based Detection and Monitoring (Traps/Acoustic Methods)
4. Lower Development and Population Thresholds in Various Taxa
4.1. Minimal Thermal Requirements for Development of Mites (Acari)
4.2. Minimal Thermal Requirements for Development of Beetles (Coleoptera)
4.3. Minimal Thermal Requirements for Development of Moths (Lepidoptera)
4.4. Minimal Thermal Requirements for Development of Psocids (Psocoptera)
4.5. Minimal Thermal Requirements for Development of Cockroaches (Blattodea) and Flies (Diptera)
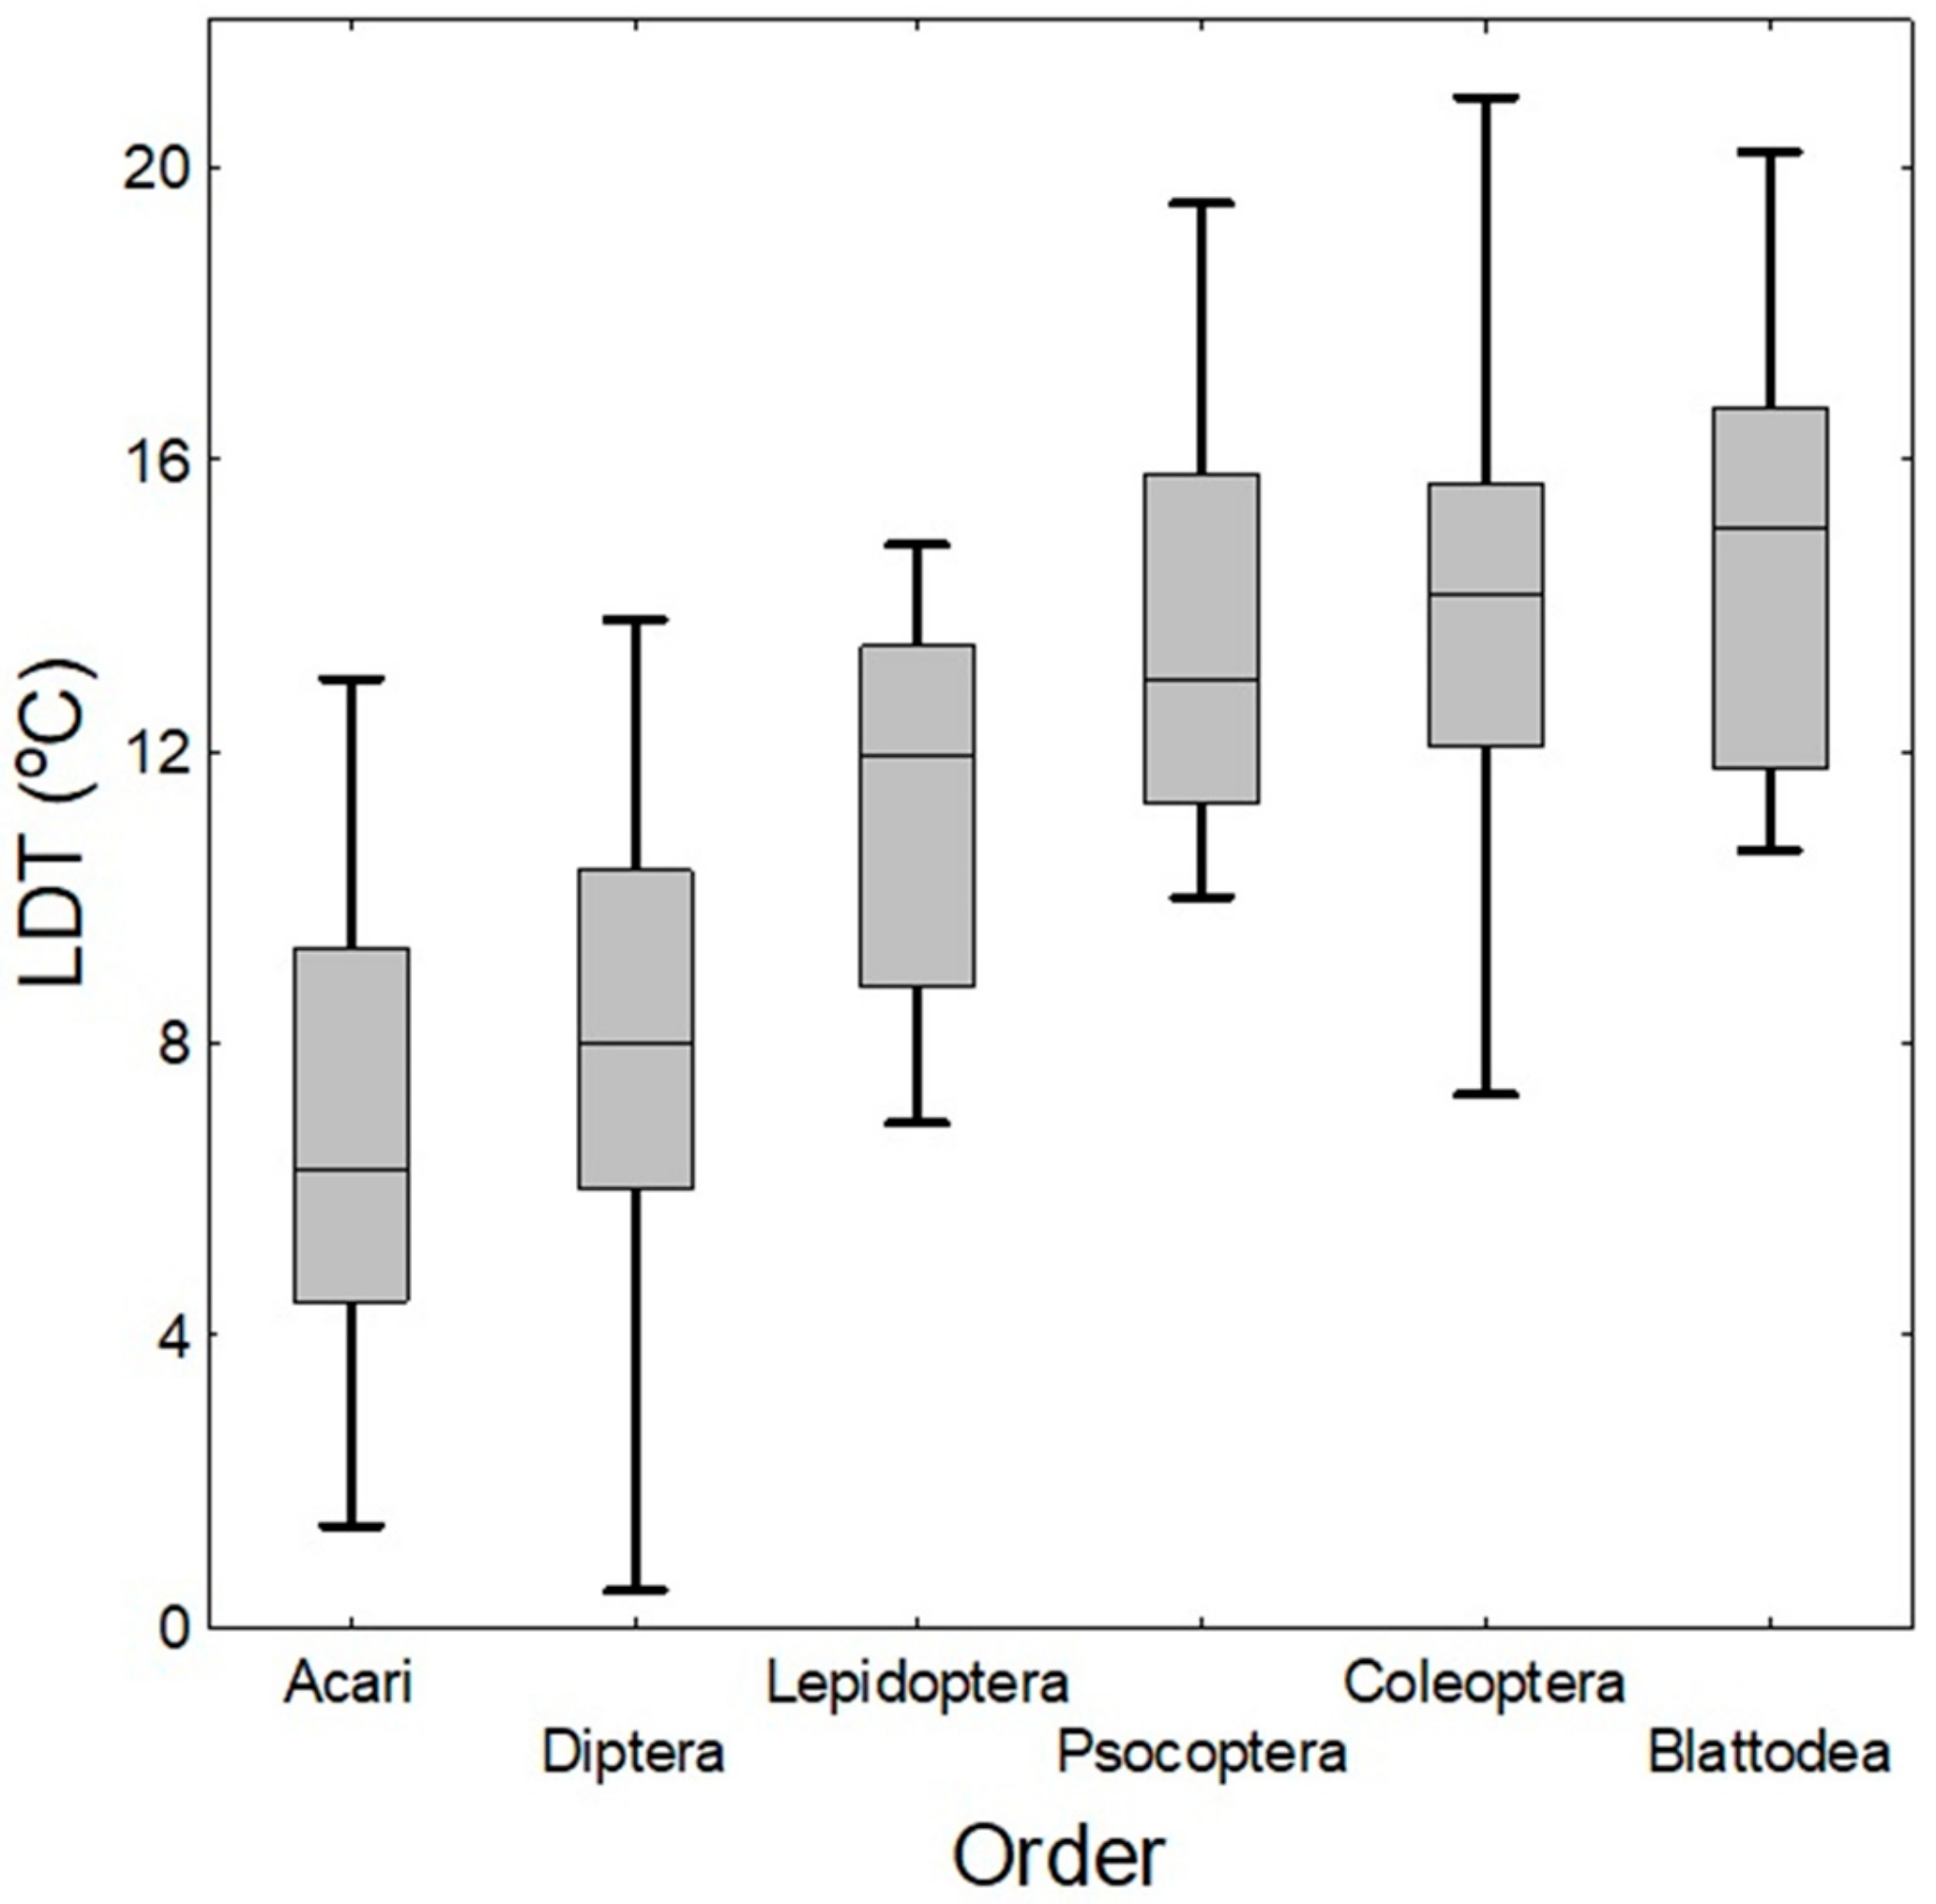
4.6. Comparison of LDTs of Taxa and Temperature Exclusion Function
5. Lower Activity Thresholds (Flight, Locomotion, Sound Production, Respiration) and Their Relation to LDTs
5.1. Lower Acoustic Detection Thresholds (LAT)
5.2. Lower Respiratory Thresholds (LRT)
5.3. Lower Flying Thresholds (LFT) and Lower Trap Capture Thresholds for Flying Pests (LTCT-FP)
5.4. Lower Walking Threshold (LWT) and Lower Trap Capture Threshold for Walking Pests (LTCT-WP)
5.5. Comparison of Relative Positions of Activity and Development Thresholds on a Temperature Scale
6. Conclusions and Suggestions for Future Research
Author Contributions
Funding
Acknowledgments
Conflicts of Interest
References
- Hagstrum, D.W.; Subramanyam, B. Stored-Product Insect Resource; AACC International: Saint Paul, MN, USA, 2009; p. 509. [Google Scholar]
- Stejskal, V.; Aulicky, R.; Kucerova, Z. Pest control strategies and damage potential of seed-infesting pests in the Czech stores—A review. Plant Protect. Sci. 2014, 50, 165–173. [Google Scholar] [CrossRef]
- Stejskal, V.; Hubert, J.; Aulicky, R.; Kucerova, Z. Overview of present and past and pest-associated risks in stored food and feed products: European perspective. J. Stored Prod. Res. 2015, 64, 122–132. [Google Scholar] [CrossRef]
- Sinha, R.N.; Wallace, H.A. Ecology of insect-induced hot spots in stored grain in western Canada. Res. Popul. Ecol. 1966, 8, 107–132. [Google Scholar]
- Mani, S.; Muir, W.E.; Jayas, D.S.; White, N.D.G. Computer modelling of insect-induced hot spots in stored wheat. Can. Biosyst. Eng. 2001, 43, 4–7. [Google Scholar]
- Dixon, A.F.; Honek, A.; Keil, P.; Kotela, M.A.A.; Sizling, A.L.; Jarosik, V. Relationship between the minimum and maximum temperature thresholds for development in insects. Funct. Ecol. 2009, 23, 257–264. [Google Scholar] [CrossRef]
- Rebaudo, F.; Rabhi, V.B. Modeling temperature—Dependent development rate and phenology in insects: Review of major developments, challenges, and future directions. Entomol. Exp. Appl. 2018, 166, 607–617. [Google Scholar] [CrossRef]
- Mellanby, K. Low temperature and insect activity. Proc. R. Soc. Lond. B Biol. Sci. 1939, 127, 473–487. [Google Scholar]
- Nakakita, H.; Ikenaga, H. Action of low temperature on physiology of Sitophilus zeamais Motschulsky and Sitophilus oryzae (L.) (Coleoptera: Curculionidae) in rice storage. J. Stored Prod. Res. 1997, 33, 31–38. [Google Scholar] [CrossRef]
- Bentley, E.W.; Gunn, D.L.; Ewer, D.W. The biology and behaviour of Ptinus tectus Boie. (Coleoptera, Ptinidae), a pest of stored products: I. The daily rhythm of locomotory activity, especially in relation to light and temperature. J. Exp. Biol. 1941, 18, 182–195. [Google Scholar]
- Honek, A. Geographical variation in thermal requirements for insect development. Eur. J. Entomol. 1996, 93, 303–312. [Google Scholar]
- Dendy, A.; Elkington, H.D. Report on the vitality and rate of multiplication of certain grain insects under various conditions of temperature and moisture. Rep. Grain Pests Gomm. Roy. Soc. 1920, 7, 1–52. [Google Scholar]
- Back, E.A.; Cotton, R. Relative resistance of the rice weevil Sitophilus oryzae L. and the granary weevil S. granarius L. to high and low temperatures. J. Agric. Res. 1924, 28, 1043–1044. [Google Scholar]
- Beckett, S.J. Insect and mite control by manipulating temperature and moisture before and during chemical-free storage. J. Stored Prod. Res. 2011, 47, 284–292. [Google Scholar] [CrossRef]
- Kohshima, S. A novel cold-tolerant insect found in a Himalayan glacier. Nature 1984, 310, 225–227. [Google Scholar] [CrossRef]
- Hazell, S.P.; Groutides, C.; Neve, B.P.; Blackburn, T.M.; Bale, J.S. A comparison of low temperature tolerance traits between closely related aphids from the tropics, temperate zone, and Arctic. J. Insect Physiol. 2010, 56, 115–122. [Google Scholar] [CrossRef] [PubMed]
- Wakefield, M.E. Storage arthropod pest detection-current status and future directions. In Proceedings of the 9th International Working Conference on Stored Product Protection, Sao Paulo, Brazil, 15–18 October 2006; Lorini, I., Bacaltchuk, B., Beckel, H., Eds.; Brazilian Post Harvest Association: Campinas, Brazil, 2006; pp. 371–384. [Google Scholar]
- Jian, F.; Fields, P.G.; Hargreaves, K.; Jayas, D.S.; White, N.D. Chill-coma and minimum movement temperatures of stored-product beetles in stored wheat. J. Econ. Entomol. 2015, 108, 2471–2478. [Google Scholar] [CrossRef]
- Beckett, S.J.; Fields, P.G.; Subramanyam, B.H. Disinfestation of stored products and associated structures using heat. In Heat Treatments for Post Harvest Pest Control: Theory and Practice; Tang, J., Mitcham, E., Wang, S., Lurie, S., Eds.; CABI: Wallingford, Oxfordshire, UK, 2007; pp. 182–237. [Google Scholar]
- Mason, L.J.; Strait, C.A. Stored Product Integrated Pest Management with Extreme Temperatures. In Temperature Sensitivity in Insects and Application in Integrated Pest Management; Hallman, G.J., Denlinger, D.L., Eds.; Westview Press: Boulder, CO, USA, 1998; pp. 141–177. [Google Scholar]
- Fields, P.G. The control of stored-product insects and mites with extreme temperatures. J. Stored Prod. Res. 1992, 28, 89–118. [Google Scholar] [CrossRef]
- Kiritani, K. The low development threshold temperature and the thermal constant in insects, mites and nematodes in Japan. Misc. Publ. Natl. Inst. Agro Environ. Sci. 1997, 21, 1–72. [Google Scholar]
- Honek, A.; Kocourek, F. Temperature and development time in insects: A general relationship between thermal constants. Zool. Jb. Syst. 1990, 117, 401–439. [Google Scholar]
- Jarosik, V.; Honek, A.; Magarey, R.D.; Skuhrovec, J. Developmental database for phenology models: Related insect and mite species have similar thermal requirements. J. Econ. Entomol. 2011, 104, 1870–1876. [Google Scholar] [CrossRef]
- Imura, O. Thermal requirements for development of stored-product insects. Tribolium Inf. Bull. 1990, 30, 58–68. [Google Scholar]
- Howe, R.W. A summary of estimates of optimal and minimal conditions for population increase of some stored products insects. J. Stored Prod. Res. 1965, 1, 177–184. [Google Scholar] [CrossRef]
- Hagstrum, D.W.; Subramanyan, S. Fundamentals of Stored—Product Entomology; AACC International: St. Paul, MN, USA, 2006; p. 323. [Google Scholar]
- Andreadis, S.S.; Athanassiou, C.G. A review of insect cold hardiness and its potential in stored product insect control. Crop Prot. 2017, 91, 93–99. [Google Scholar] [CrossRef]
- Kiritani, K. The low development threshold temperature and the thermal constant in insects and mites in Japan. Bull. Natl. Inst. Agro Environ. Sci. 2012, 31, 1–74. [Google Scholar]
- Stacey, D.A.; Fellows, M.D.E. Temperature and the development rates of thrips: Evidence for a constraint on local adaptation? Eur. J. Entomol. 2002, 99, 399–404. [Google Scholar] [CrossRef] [Green Version]
- De Reaumur, R.A.F. Observations du thermomètre faites à Paris pendant l’année 1735, comparées avec celles qui ont été faites sous la ligne, à l’Isle de France, à Alger et quelques unes de nos iles de l’Amérique. Mémoires l’Académie R. Sci. 1735, 545–576. [Google Scholar]
- Honek, A.; Kocourek, F. Thermal requirements for development of aphidophagous Coccinellidae (Coleoptera), Chrysopidae, Hemerobiidae (Neuroptera), and Syrphidae (Diptera): Some general trends. Oecologia 1988, 76, 455–460. [Google Scholar] [CrossRef]
- Sinha, R.N. Climate and potential range of distribution of stored-product mites in Japan. J. Econ. Entomol. 1968, 61, 70–75. [Google Scholar] [CrossRef]
- Navarro, S.; Noyes, R. The Mechanics and Physics of Modern Grain Aeration Management; CRC Press: Boca Raton, FL, USA, 2002; p. 647. [Google Scholar]
- Evans, D.E. The survival of immature grain beetles at low temperatures. J. Stored Prod. Res. 1987, 23, 79–83. [Google Scholar] [CrossRef]
- MacMillan, H.A.; Sinclair, B.J. Mechanisms underlying insect chill-coma. J. Insect Physiol. 2011, 57, 12–20. [Google Scholar] [CrossRef]
- Coombs, M.R.; Bale, J.S. Thermal thresholds of the predatory mite Balaustium hernandezi. Physiol. Entomol. 2014, 39, 120–126. [Google Scholar] [CrossRef]
- Cowles, R.B.; Bogert, C.M. A preliminary study of the thermal requirements of desert reptiles. Iguana 1944, 83, 53. [Google Scholar]
- Allen, J.L.; Clusella-Trullas, S.; Chown, S.L. The effects of acclimation and rates of temperature change on critical thermal limits in Tenebrio molitor (Tenebrionidae) and Cyrtobagous salviniae (Curculionidae). J. Insect Physiol. 2012, 58, 669–678. [Google Scholar] [CrossRef] [PubMed]
- Wakefield, M.E.; Cogan, P.M. Laboratory evaluation of traps for the detection of beetle pests in bulk grain. J. Stored Prod. Res. 2007, 43, 546–549. [Google Scholar] [CrossRef]
- Stejskal, V. The influence of food and shelter on the efficacy of a commercial sticky trap in Tribolium castaneum (Coleoptera: Tenebrionidae). J. Stored Prod. Res. 1995, 31, 229–233. [Google Scholar] [CrossRef]
- Aulicky, R.; Stejskal, V.; Kucerova, Z.; Trematerra, P. Trapping of internal and external feeding stored grain beetle pests with two types of pitfall traps: A two-year field study. Plant Protect. Sci. 2016, 52, 45–53. [Google Scholar] [CrossRef]
- Cox, P.D.; Dolder, H.S. A simple flight chamber to determine flight activity in small insects. J. Stored Prod. Res. 1995, 31, 311–316. [Google Scholar] [CrossRef]
- Cox, P.D.; Wakefield, M.E.; Jacob, T.A. The effects of temperature on flight initiation in a range of moths, beetles and parasitoids associated with stored products. J. Stored Prod. Res. 2007, 43, 111–117. [Google Scholar] [CrossRef]
- Throne, J.E.; Cline, L.D. Seasonal flight activity and seasonal abundance of selected stored-product Coleoptera around grain storages in South Carolina. J. Agric. Entomol. 1994, 11, 321–338. [Google Scholar]
- Aspaly, G.; Stejskal, V.; Pekar, S.; Hubert, J. Temperature-dependent population growth of three species of stored product mites (Acari: Acaridida). Exp. Appl. Acarol. 2007, 42, 37–46. [Google Scholar] [CrossRef]
- Trudgill, D.L. Why do tropical poikilothermic organisms tend to have higher threshold temperature for development than temperate ones? Funct. Ecol. 1995, 9, 136–137. [Google Scholar]
- Yurk, B.P.; Powell, J.A. Modeling the effects of developmental variation on insect phenology. Bull. Math. Biol. 2010, 72, 1334–1360. [Google Scholar] [CrossRef] [PubMed]
- Campbell, A.; Frazer, B.D.; Gilbert, N.G.A.P.; Gutierrez, A.P.; Mackauer, M. Temperature requirements of some aphids and their parasites. J. Appl. Ecol. 1974, 11, 431–438. [Google Scholar] [CrossRef]
- Umeya, K. Threshold temperature and thermal constants for development of the diamond-back moth, Plutella xylostella L., with reference to local differences. Jpn. J. Appl. Entomol. Zool. 1973, 17, 19–24. [Google Scholar] [CrossRef]
- Lamb, R.J.; MacKay, P.A.; Gerber, G.H. Are development and growth of pea aphids, Acyrthosiphon pisum, in North America adapted to local temperatures? Oecologia 1987, 72, 170–177. [Google Scholar] [CrossRef]
- Bergant, K.; Trdan, S. How reliable are thermal constants for insect development when estimated from laboratory experiments? Entomol. Exp. Appl. 2006, 120, 251–256. [Google Scholar] [CrossRef]
- Subramanyam, B.; Hagstrum, D.W. Predicting development times of six stored-product moth species (Lepidoptera: Pyralidae) in relation to temperature, relative humidity, and diet. Eur. J. Entomol. 1993, 90, 51–64. [Google Scholar]
- Honek, A. The relationship between thermal constants for insect development: A verification. Acta Soc. Zool. Bohem. 1996, 60, 115–152. [Google Scholar]
- Jarosik, V.; Honek, A.; Dixon, A.F. Developmental rate isomorphy in insects and mites. Am. Nat. 2002, 160, 497–510. [Google Scholar] [CrossRef]
- David, M.H.; Mills, R.B.; White, G.D. Effects of low temperature acclimation on developmental stages of stored-product insects. Environ. Entomol. 1977, 6, 181–184. [Google Scholar] [CrossRef]
- Evans, D.E. The influence of relative humidity and thermal acclimation on the survival of adult grain beetles in cooled grain. J. Stored Prod. Res. 1983, 19, 173–180. [Google Scholar] [CrossRef]
- Hubert, J.; Pekar, S.; Nesvorna, M.; Sustr, V. Temperature preference and respiration of acaridid mites. J. Econ. Entomol. 2010, 103, 2249–2257. [Google Scholar] [CrossRef]
- Evans, D.E. Further studies on acclimatization to low temperatures in the grain weevils Sitophilus oryzae (L.) and Sitophilus granarius (L.). Aust. J. Ecol. 1980, 5, 371–378. [Google Scholar] [CrossRef]
- Honek, A.; Jarosik, V.; Martinkova, Z.; Novak, I. Food induced variation of thermal constants of development and growth of Autographa gamma (Lepidoptera: Noctuidae) larvae. Eur. J. Entomol. 2002, 99, 241–252. [Google Scholar] [CrossRef]
- Hagstrum, D.W.; Milliken, G.A. Quantitative analysis of temperature, moisture, and diet factors affecting insect development. Ann. Entomol. Soc. Am. 1988, 81, 539–546. [Google Scholar] [CrossRef]
- Subramanyam, B.H.; Hagstrum, D.W. Quantitative analysis of temperature, relative humidity, and diet influencing development of the larger grain borer, Prostephanus truncatus (Horn)(Coleoptera: Bostrichidae). Int. J. Pest Manag. 1991, 37, 195–202. [Google Scholar] [CrossRef]
- Shi, P.J.; Reddy, G.V.; Chen, L.; Ge, F. Comparison of thermal performance equations in describing temperature-dependent developmental rates of insects: (I) empirical models. Ann. Entomol. Soc. Am. 2016, 109, 211–215. [Google Scholar] [CrossRef]
- Ikemoto, T.; Takai, K. A new linearized formula for the law of total effective temperature and the evaluation of line-fitting methods with both variables subject to error. Environ. Entomol. 2000, 29, 671–682. [Google Scholar] [CrossRef]
- Davidson, J. On the relationship between temperature and rate of development of insects at constant temperatures. J. Anim. Ecol. 1944, 13, 26–38. [Google Scholar] [CrossRef]
- Logan, J.A.; Wollkind, D.J.; Hoyt, S.C.; Tanigoshi, L.K. An analytic model for description of temperature dependent rate phenomena in arthropods. Environ. Entomol. 1976, 5, 1133–1140. [Google Scholar] [CrossRef]
- Lactin, D.J.; Holliday, N.J.; Johnson, D.L.; Craigen, R. Improved rate model of temperature-dependent development by arthropods. Environ. Entomol. 1995, 24, 68–75. [Google Scholar] [CrossRef]
- Briere, J.F.; Pracros, P.; Le Roux, A.Y.; Pierre, J.S. A novel rate model of temperature-dependent development for arthropods. Environ. Entomol. 1999, 28, 22–29. [Google Scholar] [CrossRef]
- Wang, Y.; Yang, L.; Zhang, Y.; Tao, L.; Wang, J. Development of Musca domestica at constant temperatures and the first case report of its application for estimating the minimum postmortem interval. Forensic Sci. Int. 2018, 285, 172–180. [Google Scholar] [CrossRef]
- Defilippo, F.; Pinna, M.; Calzolari, M.; Dottori, M.; Bonilauri, P. Stored-product forensic entomology: Study of development of Plodia interpunctella (Lepidoptera: Pyralidae) and use of data in determining time intervals of food infestation. In Proceedings of the 14th Meeting European Association for Forensic Entomology, Treviso, Italy, 7–10 June 2017; Vanin, S., Bourguignon, L., Charabidze, D., Whitaker, A., Aubernon, C., De Carvalho Moretti, T., Pasquerault, T., Amendt, J., Brown, K., Campobasso, C., Eds.; EAFA: Düsseldorf, Germany, 2017; p. 40. [Google Scholar]
- Burges, H.D.; Burrell, N.J. Cooling bulk grain in the British climate to control storage insects and to improve keeping quality. J. Sci. Food Agric. 1964, 15, 32–50. [Google Scholar] [CrossRef]
- Armitage, D.M.; Stables, L.M. Effects of aeration on established insect infestations in bins of wheat. Prot. Ecol. 1984, 6, 63–73. [Google Scholar]
- Arthur, F.H.; Takahashi, K.; Hoernemann, C.K.; Soto, N. Potential for autumn aeration of stored rough rice and the potential number of generations of Sitophilus zeamais Motschulsky in milled rice in Japan. J. Stored Prod. Res. 2003, 39, 471–487. [Google Scholar] [CrossRef]
- Trematerra, P.; Fleurat-Lessard, F. Food industry practices affecting pest management. Stewart Postharvest Rev. 2015, 11, 1–7. [Google Scholar]
- Mansbridge, G.H. A note on the resistance to prolonged cold of some insect pests of stored products. In Proceedings of the Royal Entomological Society of London. Series A, General Entomology; Blackwell Publishing Ltd.: Oxford, UK, 1936; Volume 11, pp. 83–86. [Google Scholar]
- Renault, D.; Salin, C.; Vannier, G.; Vernon, P. Survival and chill-coma in the adult lesser mealworm, Alphitobius diaperinus (Coleoptera: Tenebrionidae), exposed to low temperatures. J. Therm. Biol. 1999, 24, 229–236. [Google Scholar] [CrossRef]
- Ni, W.L.; Li, Z.H.; Chen, H.J.; Wan, F.H.; Qu, W.W.; Zhang, Z.; Kriticos, D.J. Including climate change in pest risk assessment: The peach fruit fly, Bactrocera zonata (Diptera: Tephritidae). Bull. Entomol. Res. 2012, 102, 173–183. [Google Scholar] [CrossRef]
- Jarosik, V.; Kenis, M.; Honek, A.; Skuhrovec, J.; Pysek, P. Invasive insects differ from non-invasive in their thermal requirements. PLoS ONE 2015, 10, e0131072. [Google Scholar] [CrossRef]
- Bond, E.J. Manual of Fumigation for Insect Control; FAO Plant Production and Protection Paper 54; Food and Agriculture Organization of the United Nations: Rome, Italy, 1984. [Google Scholar]
- Aulicky, R.; Stejskal, V.; Frydova, B.; Athanassiou, C.G. Susceptibility of two strains of the confused flour beetle (Coleoptera: Tenebrionidae) following phosphine structural mill fumigation: Effects of concentration, temperature, and flour deposits. J. Econ. Entomol. 2015, 108, 2823–2830. [Google Scholar] [CrossRef]
- Navarro, S. The use of modified and controlled atmospheres for the disinfestation of stored products. J. Pest Sci. 2012, 85, 301–322. [Google Scholar] [CrossRef]
- Boardman, L.; Sorensen, J.G.; Johnson, S.A.; Terblanche, J.S. Interactions between controlled atmospheres and low temperature tolerance: A review of biochemical mechanisms. Front. Physiol. 2011, 2, 92. [Google Scholar] [CrossRef]
- Cotton, R.T. The relation of respiratory metabolism of insects to their susceptibility to fumigants. J. Econ. Entomol. 1932, 25, 1088–1103. [Google Scholar] [CrossRef]
- Hagstrum, D.W.; Flinn, P.W.; Subramanyam, B. Predicting insect density from probe trap catch in farm-stored wheat. J. Stored Prod. Res. 1998, 34, 251–262. [Google Scholar] [CrossRef]
- Fleurat-Lessard, F.; Tomasini, B.; Kostine, L.; Fuzeau, B. Acoustic detection and automatic identification of insect stages activity in grain bulks by noise spectra processing through classification algorithms. In Proceedings of the 9th International Working Conference on Stored Product Protection, Sao Paulo, Brazil, 15–18 October 2006; Lorini, I., Bacaltchuk, B., Beckel, H., Eds.; Brazilian Post Harvest Association: Campinas, Brazil, 2006; pp. 476–486. [Google Scholar]
- Hagstrum, D.W.; Flinn, P.W. Comparison of acoustical detection of several species of stored-grain beetles (Coleoptera: Curculionidae, Tenebrionidae, Bostrichidae, Cucujidae) over a range of temperatures. J. Econ. Entomol. 1993, 86, 1271–1278. [Google Scholar] [CrossRef]
- Mankin, R.W.; Shuman, D.; Weaver, D.K. Thermal treatments to increase acoustic detectability of Sitophilus oryzae (Coleoptera: Curculionidae) in stored grain. J. Econ. Entomol. 1999, 92, 453–462. [Google Scholar] [CrossRef]
- Sanchez-Ramos, I.; Alvarez-Alfageme, F.; Castanera, P. Development and survival of the cheese mites, Acarus farris and Tyrophagus neiswanderi (Acari: Acaridae), at constant temperatures and 90% relative humidity. J. Stored Prod. Res. 2007, 43, 64–72. [Google Scholar] [CrossRef]
- Collins, D.A. A review on the factors affecting mite growth in stored grain commodities. Exp. Appl. Acarol. 2012, 56, 191–208. [Google Scholar] [CrossRef]
- Solomon, M.E. Ecology of the flour mite, Acarus siro L. (= Tyraglyphus farinae DeG.). Ann. Appl. Biol. 1962, 50, 178–184. [Google Scholar] [CrossRef]
- Xia, B.; Luo, D.; Zou, Z.; Zhu, Z. Effect of temperature on the life cycle of Aleuroglyphus ovatus (Acari: Acaridae) at four constant temperatures. J. Stored Prod. Res. 2009, 45, 190–194. [Google Scholar] [CrossRef]
- Okamoto, M. The effects of various temperatures on the life cycle of Carpoglyphus lactis. Jpn. J. Sanit. Zool. 1986, 37, 221–227. [Google Scholar] [CrossRef]
- Guldali, B.; Cobanoglu, S. Investigation on the life table parameters and development threshold of Carpoglyphus lactis (L.) (Acari: Carpoglyphidae) at different temperatures and relative humidities. Turk. Entomol. Derg. 2010, 34, 53–65, (In Turkish with English abstract). [Google Scholar]
- Palyvos, N.E.; Emmanouel, N.G. Temperature-dependent development of the predatory mite Cheyletus malaccensis (Acari: Cheyletidae). Exp. Appl. Acarol. 2009, 47, 147–158. [Google Scholar] [CrossRef]
- Maurer, V.; Baumgärtner, J. Temperature influence on life table statistics of the chicken mite Dermanyssus gallinae (Acari: Dermanyssidae). Exp. Appl. Acarol. 1992, 15, 27–40. [Google Scholar] [CrossRef] [PubMed]
- Biddulph, P.; Crowther, D.; Leung, B.; Wilkinson, T.; Hart, B.; Oreszczyn, T.; Pretlove, S.; Ridley, I.; Ucci, M. Predicting the population dynamics of the house dust mite Dermatophagoides pteronyssinus (Acari: Pyroglyphidae) in response to a constant hygrothermal environment using a model of the mite life cycle. Exp. Appl. Acarol. 2007, 41, 61–86. [Google Scholar] [CrossRef]
- Fan, Q.H.; Chen, Y.; Wang, Z.Y. Acaridia (Acari: Astigmatina) of China: A review of research progress. Zoosymposia 2010, 4, 225–259. [Google Scholar]
- Kheradmand, K.; Kamali, K.; Fathipour, Y.; Goltapeh, E.M. Development, life table and thermal requirement of Tyrophagus putrescentiae (Astigmata: Acaridae) on mushrooms. J. Stored Prod. Res. 2007, 43, 276–281. [Google Scholar] [CrossRef]
- Li, C.; Li, Z. Influence of temperature on development and reproduction of experimental populations of Araecerus fasciculatus (Coleoptera: Anthribidae). Acta Entomol. Sin. 2009, 52, 1385–1389. [Google Scholar]
- James, D.G.; Vogele, B. Development and survivorship of Carpophilus hemipterus (L.), Carpophilus mutilatus Erichson and Carpophilus humeralis (F.)(Coleoptera: Nitidulidae) over a range of constant temperatures. Aust. J. Entomol. 2000, 39, 180–184. [Google Scholar] [CrossRef]
- Subramanyam, B.H.; Hagstrum, D.W.; Harein, P.K. Upper and lower temperature thresholds for development of six stored-product beetles. In Proceedings of the Fifth International Working Conference on Stored Product Protection, Bordeaux, France, 9–14 September 1990; Fleurat-Lessard, F., Ducom, P., Eds.; Imprimerie du Médoc: Bordeaux, France, 1990; pp. 2029–2037. [Google Scholar]
- Strang, T.J.K. A review of published temperatures for the control of pest insects in museums. Collect. Forum 1992, 8, 41–67. [Google Scholar]
- Imai, T.; Miyamoto, Y. The developmental parameters of the minute brown scavenger beetle Dienerella argus (Coleoptera: Latridiidae). Appl. Entomol. Zool. 2019, 54, 75–78. [Google Scholar] [CrossRef]
- Halstead, D.G.H. Some observations on the biology of Lophocateres pusillus (Klug) (Coleoptera: Trogositidae). J. Stored Prod. Res. 1968, 4, 197–202. [Google Scholar] [CrossRef]
- Omar, Y.M.; Darwish, Y.A.; Hassan, R.E.; Mahmoud, M.A. Threshold temperature and heat unit requirements for the development of the granary weevil, Sitophilus granarius (L.). Arch. Phytopathol. Plant Protect. 2014, 47, 555–563. [Google Scholar] [CrossRef]
- Beckett, S.J. Protecting and disinfesting stored products by drying and cooling, and disinfesting stored products during handling by mechanical treatments. In Proceedings of the 10th International Working Conference on Stored Product Protection, Estoril, Portugal, 27 June–2 July 2010; Carvalho, M.O., Fields, P.G., Adler, C.S., Arthur, F.H., Athanassiou, C.G., Campbell, J.F., Fleurat-Lessard, F., Flinn, P.W., Hodges, R.J., Isikber, A.A., et al., Eds.; Julius Kühn-Institut: Berlin, Germany, 2010; pp. 219–228. [Google Scholar]
- Partida, G.J.; Strong, R.G. Comparative studies on the biologies of six species of Trogoderma: T. variabile. Ann. Entomol. Soc. Am. 1975, 68, 115–125. [Google Scholar] [CrossRef]
- Trematerra, P.; Lucchi, A. Nemapogon granellus (L.) pest on corks of wine bottles stored for aging. In Proceedings of the 11th International Working Conference on Stored Product Protection, Chiang Mai, Thailand, 24–28 November 2014; Arthur, F.H., Kengkanpanich, R., Chayaprasert, W., Suthisut, D., Eds.; knoell: Mannheim, Germany; pp. 885–893. [Google Scholar]
- Sporleder, M.; Kroschel, J.; Quispe, M.R.G.; Lagnaoui, A. A temperature-based simulation model for the potato tuberworm, Phthorimaea operculella Zeller (Lepidoptera; Gelechiidae). Environ. Entomol. 2004, 33, 477–486. [Google Scholar] [CrossRef]
- Shang, X.; Yang, M.; Zhang, C.; Cai, L.; Feng, Y.; Qiu, T. Effects of temperature on the growth and development of Pyralis farinalis (Lepidoptera: Pyralidae), one insect used for producing insect tea in China. Acta Entomol. Sin. 2013, 56, 671–679. [Google Scholar]
- Rees, D.P.; Walker, A.J. The effect of temperature and relative humidity on population growth of three Liposcelis species (Psocoptera: Liposcelidae) infesting stored products in tropical countries. Bull. Entomol. Res. 1990, 80, 353–358. [Google Scholar] [CrossRef]
- Jiang, H.B.; Liu, J.C.; Wang, Z.Y.; Wang, J.J. Temperature-dependent development and reproduction of a novel stored product psocid, Liposcelis badia (Psocoptera: Liposcelididae). Environ. Entomol. 2008, 37, 1105–1112. [Google Scholar] [CrossRef]
- Wang, J.J.; Tsai, J.H.; Zhao, Z.M.; Li, L.S. Development and reproduction of the psocid Liposcelis bostrychophila (Psocoptera: Liposcelididae) as a function of temperature. Ann. Entomol. Soc. Am. 2000, 93, 261–270. [Google Scholar] [CrossRef]
- Wang, J.J.; Zhao, Z.M.; Li, L.S. An ecological study on the laboratory population of psocid, Liposcelis bostrychophila Badonnel (Psocoptera: Liposcelididae). Acta Entomol. Sin. 1999, 42, 277–283. [Google Scholar]
- Tang, P.A.; Wang, J.J.; He, Y.; Jiang, H.B.; Wang, Z.Y. Development, survival, and reproduction of the psocid Liposcelis decolor (Psocoptera: Liposcelididae) at constant temperatures. Ann. Entomol. Soc. Am. 2008, 101, 1017–1025. [Google Scholar] [CrossRef]
- Wang, J.J.; Zhao, Z.; Li, L. Studies on bionomics of Liposcelis entomophila (Psocoptera: Liposcelididae) infesting stored products. Acta Entomol. Sin. 1998, 5, 149–158. [Google Scholar]
- Dong, P.; Wang, J.J.; Jia, F.X.; Hu, F. Development and reproduction of the psocid Liposcelis tricolor (Psocoptera: Liposcelididae) as a function of temperature. Ann. Entomol. Soc. Am. 2007, 100, 228–235. [Google Scholar] [CrossRef]
- Wang, J.J.; Ren, Y.; Wei, X.Q.; Dou, W. Development, survival, and reproduction of the psocid Liposcelis paeta (Psocoptera: Liposcelididae) as a function of temperature. J. Econ. Entomol. 2009, 102, 1705–1713. [Google Scholar] [CrossRef] [PubMed]
- Hassan, M.W.; Dou, W.; Chen, L.; Jiang, H.B.; Wang, J.J. Development, survival, and reproduction of the psocid Liposcelis yunnaniensis (Psocoptera: Liposcelididae) at constant temperatures. J. Econ. Entomol. 2011, 104, 1436–1444. [Google Scholar] [CrossRef]
- Wu, H.; Hu, X.P.; Appel, A.G. Temperature-dependent development and thermal sensitivity of Blaptica dubia (Blattodea: Blaberidae). J. Econ. Entomol. 2016, 110, 546–551. [Google Scholar] [CrossRef]
- Stejskal, V.; Lukas, J.; Aulicky, R. Lower development threshold and thermal constant in the German cockroach, Blattella germanica (L.) (Blattodea: Blattellidae). Plant Protect. Sci. 2003, 39, 35–38. [Google Scholar]
- Xu, Y.; Chen, S.; Yang, Y.; Zhang, W. Development-temperature relationship and temperature dependent parameters of German cockroach, Blattella germanica L. Arthropods 2017, 6, 78–85. [Google Scholar]
- Guo, K.; Zhang, D.C.; Duan, Z.S.; Shao, W.Z.; Liu, S.; Qiao, H.L.; Xu, C.Q.; Chen, J. Threshold temperature and effective accumulative temperature of Periplaneta Americana. China J. Chin. Mater. Med. 2018, 43, 4217–4219. [Google Scholar]
- Stejskal, V.; Lukas, J.; Aulicky, R. Temperature-dependent development and mortality of Australian cockroach, Periplaneta australasiae (Fabricius) (Blattodea: Blattidae). Plant Protect. Sci. 2004, 40, 11–15. [Google Scholar] [CrossRef]
- Donovan, S.E.; Hall, M.J.R.; Turner, B.D.; Moncrieff, C.B. Larval growth rates of the blowfly, Calliphora vicina, over a range of temperatures. Med. Vet. Entomol. 2006, 20, 106–114. [Google Scholar] [CrossRef]
- Higley, L.G.; Haskell, N.H. Insect Development and Forensic Entomology. In Forensic Entomology: The Utility of Arthropods in Legal Investigations; Byrd, J.H., Castner, J.L., Eds.; CRC Press: Boca Racon, FL, USA, 2001; pp. 287–302. [Google Scholar]
- Richards, C.S.; Paterson, I.D.; Villet, M.H. Estimating the age of immature Chrysomya albiceps (Diptera: Calliphoridae), correcting for temperature and geographical latitude. Int. J. Legal Med. 2008, 122, 271–279. [Google Scholar] [CrossRef]
- Tochen, S.; Dalton, D.T.; Wiman, N.; Hamm, C.; Shearer, P.W.; Walton, V.M. Temperature-related development and population parameters for Drosophila suzukii (Diptera: Drosophilidae) on cherry and blueberry. Environ. Entomol. 2014, 43, 501–510. [Google Scholar] [CrossRef]
- Kotze, Z.; Villet, M.H.; Weldon, C.W. Effect of temperature on development of the blowfly, Lucilia cuprina (Wiedemann) (Diptera: Calliphoridae). Int. J. Legal Med. 2015, 129, 1155–1162. [Google Scholar] [CrossRef]
- Mascarini, L.M.; Prado, A.P.D. Thermal constant of an experimental population of Muscina stabulans (Fallén 1817) (Diptera: Muscidae) in the laboratory. Mem. Inst. Oswaldo Cruz 2002, 97, 281–283. [Google Scholar] [CrossRef]
- Lefebvre, F.; Pasquerault, T. Temperature-dependent development of Ophyra aenescens (Wiedemann, 1830) and Ophyra capensis (Wiedemann, 1818) (Diptera, Muscidae). Forensic Sci. Int. 2004, 139, 75–79. [Google Scholar] [CrossRef]
- Russo, A.; Cocuzza, G.E.; Vasta, M.C.; Simola, M.; Virone, G. Life fertility tables of Piophila casei L. (Diptera: Piophilidae) reared at five different temperatures. Environ. Entomol. 2006, 35, 194–200. [Google Scholar] [CrossRef]
- Nabity, P.D.; Higley, L.G.; Heng-Moss, T.M. Effects of temperature on development of Phormia regina (Diptera: Calliphoridae) and use of developmental data in determining time intervals in forensic entomology. J. Med. Entomol. 2006, 43, 1276–1286. [Google Scholar] [CrossRef]
- Grassberger, M.; Reiter, C. Effect of temperature on development of the forensically important holarctic blow fly Protophormia terraenovae (Robineau-Desvoidy) (Diptera: Calliphoridae). Forensic Sci. Int. 2002, 128, 177–182. [Google Scholar] [CrossRef]
- Biever, K.D.; Mulla, M.S. Effects of temperature on the developmental stages of Psychoda alternata (Diptera-Psychodidae). Mosq. News 1966, 26, 416–419. [Google Scholar]
- Grassberger, M.; Reiter, C. Effect of temperature on development of Liopygia (= Sarcophaga) argyrostoma (Robineau-Desvoidy) (Diptera: Sarcophagidae) and its forensic implications. J. Forensic Sci. 2002, 47, 1332–1336. [Google Scholar] [CrossRef]
- Villet, M.H.; MacKenzie, B.; Muller, W.J. Larval development of the carrion-breeding flesh fly, Sarcophaga (Liosarcophaga) tibialis Macquart (Diptera: Sarcophagidae), at constant temperatures. Afr. Entomol. 2006, 14, 357–366. [Google Scholar]
- Jian, F.; Jayas, D.S. Detecting and responding to resource and stimulus during the movements of Cryptolestes ferrugineus adults. Food Bioprocess Tech. 2009, 2, 45–56. [Google Scholar] [CrossRef]
- Granovsky, T.A.; Mills, R.B. Feeding and mortality of Sitophilus granarius (L.) adults during simulated winter farm bin temperatures. Environ. Entomol. 1982, 11, 324–326. [Google Scholar] [CrossRef]
- Chaudhry, H.S.; Kapoor, R.P.D. Studies on the respiratory metabolism of the Red Flour Beetle. J. Econ. Entomol. 1967, 60, 1334–1336. [Google Scholar] [CrossRef]
- Emekci, M.; Navarro, S.; Donahaye, E.; Rindner, M.; Azrieli, A. Respiration of Rhyzopertha dominica (F.) at reduced oxygen concentrations. J. Stored Prod. Res. 2004, 40, 27–38. [Google Scholar] [CrossRef]
- Hanec, W.; Dolinski, M.G.; Loschiavo, S.R. The quantitative relationship between temperature and locomotion and respiration was studied with the rusty grain beetle, C. ferrugineus. Manit. Entomol. 1975, 9, 29–34. [Google Scholar]
- Edwards, D.K. Effects of acclimatization and sex on respiration and thermal resistance in Tribolium (Coleoptera: Tenebrionidae). Can. J. Zool. 1958, 36, 363–382. [Google Scholar] [CrossRef]
- Wright, E.J.; Morton, R. Daily flight activity of Trogoderma variabile (Coleoptera: Dermestidae) and Rhyzopertha dominica (Coleoptera: Bostrichidae). J. Stored Prod. Res. 1995, 31, 177–184. [Google Scholar] [CrossRef]
- Fardisi, M.; Mason, L.J. Influence of temperature, gender, age, and mating status on cigarette beetle (Lasioderma serricorne (F.)) (Coleoptera: Anobiidae) flight initiation. J. Stored Prod. Res. 2013, 52, 93–99. [Google Scholar] [CrossRef]
- Giles, P.H. Observations in Kenya on the flight activity of stored products insects, particularly Sitophilus zeamais Motsch. J. Stored Prod. Res. 1969, 4, 317–329. [Google Scholar] [CrossRef]
- Sinclair, E.R.; Haddrell, R.L. Flight of stored products beetles over a grain farming area in southern Queensland. Aust. J. Entomol. 1985, 24, 9–15. [Google Scholar] [CrossRef]
- Williams, R.N.; Floyd, E.H. Flight habits of the maize weevil, Sitophilus zeamais. J. Econ. Entomol. 1970, 63, 1585–1588. [Google Scholar] [CrossRef]
- Taylor, T.A. On the flight activity of Sitophilus zeamais Motsch. (Coleoptera, Curculionidae) and some other grain-infesting beetles in the field and a store. J. Stored Prod. Res. 1971, 6, 295–306. [Google Scholar] [CrossRef]
- Throne, J.E.; Cline, L.D. Seasonal flight activity of the maize weevil, Sitophilus zeamais Motschulsky (Coleoptera: Curculionidae), and the rice weevil, S. oryzae (L.), in South Carolina. J. Agric. Entomol. 1989, 6, 183–192. [Google Scholar]
- McKay, T.; White, A.L.; Starkus, L.A.; Arthur, F.H.; Campbell, J.F. Seasonal patterns of stored-product insects at a rice mill. J. Econ. Entomol. 2017, 110, 1366–1376. [Google Scholar] [CrossRef]
- Campbell, T.L.M. Thermal biology of the lesser grain borer Rhyzopertha dominica (F.)(Bostrichidae) and the warehouse pirate bug Xylocoris flavipes (Reuter) (Anthocoridae). Ph.D. Thesis, Montana State University-Bozeman, College of Agriculture, Bozeman, MT, USA, 2002. [Google Scholar]
- Jian, F. Influences of stored product insect movements on integrated pest management decisions. Insects 2019, 10, 100. [Google Scholar] [CrossRef]
- Ernst, S.A.; Mutchmor, J.A. Dispersal of three species of grain beetles as a function of thermal acclimation, temperature, and larval size. J. Stored Prod. Res. 1969, 5, 407–412. [Google Scholar] [CrossRef]
- Barlow, C.A.; Kerr, W.D. Locomotory responses to temperature in the grain weevil, Sitophilus granarius (L.)(Coleoptera: Curculionidae). Can. J. Zool. 1969, 47, 217–224. [Google Scholar] [CrossRef]


| Species | LDT (°C) | Model, r.h. (%) | Reference | LPT (°C) | Reference |
|---|---|---|---|---|---|
| Acarus farris | 1.4 | NL, 90 | [88] | ||
| A. siro | 3.75 | n.a., 70–90 | [46] | 5.0 | [46] |
| 2.5 | n.a. | [89] | 10.2 | [46] | |
| 5.0 | n.a. | [90] | 7.0 | [26] | |
| Aleuroglyphus ovatus | 10.2 | [46] | |||
| 13.3 | [91] | ||||
| 22.0 | [33] | ||||
| Carpoglyphus lactis | 5.0–10.0 | n.a., 100 | [92] | 15.0 | [33] |
| 4.9–7.55 | L, 65–80 | [93] | |||
| Cheyletus eruditus | 12.0 | [33] | |||
| C. malaccensis | 11.6–12.0 | NL, 80 | [94] | ||
| Dermanyssus gallinae | 4.8–5.7 | NL, 65–75 | [95] | ||
| Dermatophagoides pteronyssinus | 13.0 | L, n.a. | [96] | ||
| Glycyphagus destructor | 10.0–15.0 | [33] | |||
| Lepidoglyphus destructor | 3.0 | n.a. | [89] | ||
| Rhizoglyphus echinopus | 5.7 | L, n.a. | [22] | 6.0–10.0 | [33] |
| R. robini | 10.01 | n.a. | [97] | ||
| Tyrophagus neiswanderi | 5.2 | NL, 90 | [88] | ||
| T. putrescentiae | 5.0 | L, n.a. | [24] | 10.4 | [46] |
| 11.2 | n.a., 98–100 | [46] | 10.2 | [46] | |
| 7.0–10.0 | n.a. | [89] | 9.0–10.0 | [33] | |
| 8.74 | L, 70 | [98] | |||
| 9.1–10.4 | L, n.a. | [29] | |||
| T. similis | 7.0 | L, n.a. | [29] |
| Species | LDT (°C) | Model, r.h. (%) | Reference | LPT (°C) | Reference |
|---|---|---|---|---|---|
| Acanthoscelides obtectus | 11.7 | L, 90 | [25] | 17.0 | [26] |
| 11.1 | L, n.a. | [22] | |||
| Ahasverus advena | 14.1 | L, n.a. | [22] | ||
| Alphitobius diaperinus | 17.3 | L, n.a. | [22] | ||
| 15.0–17.0 | n.a. | [76] | |||
| Anthrenus verbasci | 9.6–11.3 | L, n.a. | [22] | ||
| Araecerus fasciculatus | 10.55 | L, n.a. | [99] | ||
| Callosobruchus analis | 16.6 | L, 70 | [25] | 22.0 | [26] |
| 16.0–16.4 | L, n.a. | [22] | |||
| C. chinensis | 10.1–10.6 | L, ca. 75 | [25] | 19.0 | [26] |
| 11.3–13.5 | L, n.a. | [22] | |||
| 13.9 | L, n.a. | [24] | |||
| C. maculatus | 14.9 | L, 70 | [25] | 22.0 | [26] |
| 14.1–18.0 | L, n.a. | [22] | |||
| 12.98–15.0 | L, n.a. | [24] | |||
| C. rhodesianus | 13.7 | L, 70 | [25] | ||
| 11.2–15.5 | L, n.a. | [22] | |||
| 13.2 | L, n.a. | [24] | |||
| Carpophilus hemipterus | 8.6 | L, 75 | [22,25] | 19.0 | [26] |
| 7.2–14.61 | L, n.a. | [24] | |||
| 14.6 | L, >60 | [100] | |||
| Cryptolestes capensis | 11.1 | L, 90 | [22,25] | 18.0 | [26] |
| C. ferrugineus | 15.7 | L, 70 | [22,25] | 20.0 | [14] |
| 15.5 | NL, n.a. | [101] | 23.0 | [26] | |
| C. pussilloides | 11.8 | L, 90 | [25] | 18.0 | [26] |
| 10.6 | L, n.a. | [22] | |||
| 11.0–13.0 | L, 70–90 | [14] | |||
| C. pusillus | 14.6–14.7 | L, 70–90 | [22,25] | 14.0 | [14] |
| 14.6–14.9 | L, n.a. | [24] | 22.0 | [26] | |
| 14.2 | NL, n.a. | [101] | |||
| C. turcicus | 14.7 | L, 90 | [25] | 21.0 | [26] |
| 10.2 | L, n.a. | [22] | |||
| 15.0 | L, 90 | [14] | |||
| C. ugandae | 14.2 | L, 90 | [22,25] | 20.0 | [26] |
| Dermestes frischii | 15.2 | L, 70 | [22,25] | 22.0 | [26] |
| D. haemorrhoidalis | 13.2 | L, n.a. | [24] | ||
| D. lardarius | 15.0 | n.a. | [102] | ||
| D. maculatus | 15.0 | L, n.a. | [101] | 20.0 | [26] |
| Dienerella argus | 9.1–10.7 | L, 75 | [103] | ||
| Gibbium psylloides | 11.8 | L, 70 | [22,25] | 20.0 | [26] |
| Gnatocerus cornutus | 16.0 | [26] | |||
| G. maxillosus | 13.3–16.1 | L, n.a. | [24] | ||
| Lasioderma serricorne | 16.2 | L, 70 | [25] | 18.0 | [14] |
| 15.7 | L, 70 | [22] | 22.0 | [26] | |
| Latheticus oryzae | 19.8–20.6 | L, 75 | [22,25] | 26.0 | [26] |
| 20.6–22.8 | L, n.a. | [24] | |||
| Lophocateres pusillus | >15.0, <17.5 | n.a., 70 | [104] | ||
| Mezium affine | 11.2 | L, 70 | [22,25] | 22.0 | [26] |
| Necrobia rufipes | 22.0 | [26] | |||
| Niptus hololeucus | 10.0 | [26] | |||
| Oryzaephilus mercator | 16.6 | L, 70 | [25] | 20.0 | [26] |
| 16.7 | L, n.a. | [22] | |||
| O. surinamensis | 15.3 | L, n.a. | [22] | 19.0 | [14] |
| 8.8 | NL, n.a. | [101] | 21.0 | [26] | |
| Palorus ratzeburgii | 16.1 | L, 70 | [22,25] | ||
| 15.4 | L, n.a. | [24] | |||
| P. subdepressus | 15.6 | L, 70 | [24,25] | ||
| 12.1 | L, n.a. | [22] | |||
| Prostephanus truncatus | 15.1–16.2 | L, 70 | [22,25] | ||
| 15.16–16.2 | L, 70-90 | [24] | |||
| Ptinus tectus | 7.1–7.5 | L, 70 | [22,25] | 10.0 | [26] |
| P. fur | 10.0 | [26] | |||
| Rhyzopertha dominica | 17.5 | L, 70 | [22,25] | 18.0 | [14] |
| 15.1 | L, n.a. | [24] | 23.0 | [26] | |
| 13.2 | NL, n.a. | [101] | |||
| Sitophilus granarius | 10.5 | L, 70 | [22,25] | 15.0 | [26] |
| 9.97 | L, 70 | [105] | |||
| S. oryzae | 13.5 | L, 76 | [25] | 15.0 | [14] |
| 12.2–13.9 | L, n.a. | [22] | 17.0 | [26] | |
| 11.2–15.0 | L, n.a. | [24] | |||
| S. zeamais | 14.4 | L, 76 | [25] | 14.0 | [14] |
| 11.3–15.1 | L, n.a. | [22] | |||
| 13.2–13.3 | L, n.a. | [24] | |||
| Stegobium paniceum | 13.2–14.5 | L, 70 | [25] | 17.0 | [26] |
| 12.1–13.9 | L, n.a. | [22] | |||
| 14.0 | L, 70 | [14] | |||
| Tipnus unicolor | 12.0 | [26] | |||
| Tribolium castaneum | 17.8 | L, 70 | [25] | 20.0 | [14] |
| 17.8–19.0 | L, n.a. | [22,24] | 22.0 | [26] | |
| 17.6 | NL, n.a. | [101] | |||
| T. confusum | 16.7 | L, 70 | [25] | 21.0 | [26] |
| 15.7–16.7 | L, n.a. | [22] | |||
| 15.0–18.8 | L, n.a. | [24] | |||
| 18.3 | NL, n.a. | [101] | |||
| T. destructor | 12.6 | L, ca. 75 | [25] | ||
| 15.0 | L, n.a. | [22] | |||
| T. madens | 17.4 | L, 70 | [22,25] | ||
| Trogoderma anthrenoides | 15.5–18.4 | L, n.a. | [22] | ||
| 18.4–18.5 | L, n.a. | [24] | |||
| T. glabrum | 10.2–10.8 | L, n.a. | [22] | ||
| 8.2–10.8 | L, n.a. | [24] | |||
| T. granarium | 13.3–13.9 | L, 73 | [22,25] | 20.0 | [106] |
| 13.5 | L, n.a. | [14] | 24.0 | [26] | |
| 19.0–20.8 | L, n.a. | [24] | |||
| T. inclusum | 15.4 | L, n.a. | [22] | ||
| 11.4–12.4 | L, n.a. | [24] | |||
| T. variabile | 12.2–15.5 | L, n.a. | [22,24] | ||
| 21.1 | n.a., 30–70 | [107] | |||
| T. versicolor | 17.1 | L, 73 | [22,24,25] | ||
| 17.0 | L, n.a. | [14] | |||
| Typhaea stercorea | 14.5 | L, 80 | [22,25] | ||
| 14.9 | L, 80 | [24] | |||
| Zabrotes subfasciatus | 15.0 | L, 70 | [24,25] | 22.0 | [26] |
| 14.3–15.0 | L, n.a. | [22] |
| Species | LDT (°C) | Model, r.h. (%) | Reference | LPT (°C) | Reference |
|---|---|---|---|---|---|
| Apomyelois ceratoniae | 10.6 | L, 70 | [22,25] | ||
| Cadra calidella | 15.3 | L, 70 | [22,25] | 14.0 | [26] |
| 11.95 | NL, 70 | [53] | |||
| 19.2–21.4 | L, n.a. | [24] | |||
| 9.8–10.5 | L, n.a. | [24] * | |||
| C. cautella | 12.6 | L, 70 | [22,25] | 17.0 | [26] |
| 11.52 | NL, 60–90 | [53] | |||
| 12.2–14.07 | L, 60–85 | [24] | |||
| C. figuliella | 12.4 | L, 70 | [22,25] | ||
| 12.33 | NL, 70 | [53] | |||
| 10.4 | L, 70 | [24] | |||
| Corcyra cephalonica | 14.9 | L, 70 | [22,25] | 18.0 | [26] |
| 14.75 | NL, 70 | [53] | |||
| 13.5 | L, 70 | [24] | |||
| Endrosis sarcitrella | 8.5 | L, 90 | [22,25] | ||
| Ephestia elutella | 10.8 | L, 70 | [22,25] | 10.0 | [106] |
| 11.3–13.1 | L, n.a. | [24] | 10.0 | [26] | |
| E. kuehniella | 7.5 | L, 70 | [22,25] | 10.0 | [26] |
| 8 | n.a. | [102] | 12.0 | [106] | |
| 9.54 | NL, 60–90 | [53] | |||
| 7.3–10.9 | L, n.a. | [24] | |||
| Hofmannophila pseudospretella | 6.9 | L, 90 | [22,25] | ||
| Nemapogon granella | 7.0 | n.a., 65–95 | [108] | ||
| Phthorimaea operculella | 11.0–13.5 | L, >60 | [109] | ||
| Plodia interpunctella | 12.1 | L, 70 | [25] | ||
| 15.35 | NL, 60–90 | [53] | 18.0 | [26] | |
| 10.6–18 | L, n.a. | [24] | |||
| 15.6–17.0 | L, 60 | [70] | |||
| Pyralis farinalis | 14.82 | L, n.a. | [110] | ||
| Sitotroga cerealella | 16.0 | [26] | |||
| Tinea translucens | 10.0–15.0 | L, n.a. | [29] | ||
| Tineola bisselliella | 9.0 | n.a. | [102] | ||
| Species | LDT (°C) | Model, r.h. (%) | Reference | LPT (°C) | Reference |
|---|---|---|---|---|---|
| Liposcelis badia | 10.0 | NL, 75–80 | [112] | ||
| L. bostrychophila | 8.17–9.16 | L, n.a. | [24] | ||
| 15.5 | NL, 75–80 | [113] | |||
| 13.45 | n.a. | [114] | |||
| L. decolor | 13.0 | NL, 75–80 | [115] | ||
| L. entomophila | 15.24–16.6 | L, n.a. | [24] | 18.0–21.0 | [111] |
| 15.7 | NL, 75 | [116] | |||
| L. tricolor | 11.3 | NL, 75–80 | [117] | ||
| L. paeta | 18.1–20.9 | NL, 70–80 | [118] | 15.0–18.0 | [111] |
| L. yunnaniensis | 14.77 | NL, 75–80 | [119] |
| Species | LDT (°C) | Model, r.h. (%) | Reference |
|---|---|---|---|
| Blaptica dubia | 7.02–16.48 | L, >50 | [120] |
| Blattella germanica | 15.9 | L, n.a. | [22] |
| 16.2 | L, 75 | [121] | |
| 13.7–18.5 | NL, 74–76 | [122] | |
| Periplaneta americana | 13.6 | L, n.a. | [22] |
| 15.8 | n.a. | [123] | |
| P. australasiae | 13 | L, n.a. | [22] |
| 17.1 | L, 75 | [124] | |
| P. brunnea | 20.2 | L, n.a. | [22] |
| P. fuliginosa | 16.7 | L, n.a. | [22] |
| P. japonica | 9.1–12.2 | L, n.a. | [22] |
| Species | LDT (°C) | Model, r.h. (%) | Reference |
|---|---|---|---|
| Calliphora vicina | 1.0 | L, >40 | [125] |
| C. vomitoria | 6.0 | n.a. | [126] |
| Chrysomya albiceps | 10.21–15.39 | L, n.a. | [127] |
| Drosophila melanogaster | 8.2–13.1 | L, n.a. | [24] |
| D. suzukii | 7.2 | L, 60–70 | [128] |
| 8.8 | n.a. | [29] | |
| Fannia canicularis | 0.5 | L, n.a. | [24] |
| F. femoralis | 4.9 | L, n.a. | [24] |
| Hydrotaea aenescens | 12.8 | n.a. | [29] |
| Lucilia cuprina | 8.2 | L, n.a. | [24] |
| 12.02 | L, n.a. | [129] | |
| Megaselia abdita | 6.0 | n.a. | [126] |
| Musca domestica | 11.0–11.4 | L, n.a. | [24] |
| 12.42 | L, 75 | [69] | |
| Muscina stabulans | 4.4–7.8 | L, n.a. | [130] |
| Ophyra aenescens | 8.9 | L, 75–95 | [131] |
| O. capensis | 13.8 | L, 75–95 | [131] |
| Piophila casei | 9.0 | n.a. | [132] |
| Phormia regina | 12.2–14.0 | L, 50–70 | [133] |
| Protophormia terraenovae | 9.8 | L, 60 | [134] |
| Psychoda alternata | 7.2 | n.a. | [135] |
| Sarcophaga argyrostoma | 7.2 | L, 60 | [136] |
| S. bullata | 12 | L, n.a. | [24] |
| S. tibialis | 5.2 | L, n.a. | [137] |
| Species | LDT | LRT |
|---|---|---|
| A. siro | 2.5 | 2.3 |
| L. destructor | 3.0 | 2.9 |
| T. putrescentiae | 5.0 | 0.8 |
| Species | LFT (°C) | Reference | LWT (°C) | Reference | LTCT-WP (°C) | Reference |
|---|---|---|---|---|---|---|
| Ahasverus advena | 17.5 | [44] | 7.5 | [17] | ||
| Alphitobius diaperinus | 6.0 | [76] | ||||
| Cryptolestes ferrugineus | 22.5 | [43] | 5.0 | [17] | 6.3–8.9 | [18] |
| 4.0–8.0 | [18] | |||||
| Ephestia elutella | 15.0 | [44] | ||||
| E. kuehniella | 12.5 | [44] | ||||
| Lasioderma serricorne | 22.5 | [145] | ||||
| Oryzaephilus surinamensis | 2.5 | [17] | ||||
| Plodia interpunctella | 15.0 | [44] | ||||
| Rhyzopertha dominica | 20.0 | [44] | 7.5 | [17] | ||
| 16.0 | [144] | 7.1 | [152] | |||
| Sitophilus granarius | 2.5 | [17] | ||||
| S. oryzae | 27.5 | [44] | 5.0 | [17] | 9.5 | [18] |
| 22.0 | [153] | 9.0 | [18] | |||
| S. zeamais | 9.0 | [18] | 10.9 | [18] | ||
| Tineola bisselliella | 13.0 | [102] | ||||
| Tribolium castaneum | 25.0 | [44] | 10.0 | [17] | [18] | |
| 8.0-8.5 | [18] | 9.3–10.2 | [18] | |||
| Trogoderma granarium | 6.5-10.0 | [102] | ||||
| T. variabile | 12.0–16.0 | [144] | ||||
| Typhaea stercorea | 17.5 | [44] |
© 2019 by the authors. Licensee MDPI, Basel, Switzerland. This article is an open access article distributed under the terms and conditions of the Creative Commons Attribution (CC BY) license (http://creativecommons.org/licenses/by/4.0/).
Share and Cite
Stejskal, V.; Vendl, T.; Li, Z.; Aulicky, R. Minimal Thermal Requirements for Development and Activity of Stored Product and Food Industry Pests (Acari, Coleoptera, Lepidoptera, Psocoptera, Diptera and Blattodea): A Review. Insects 2019, 10, 149. https://doi.org/10.3390/insects10050149
Stejskal V, Vendl T, Li Z, Aulicky R. Minimal Thermal Requirements for Development and Activity of Stored Product and Food Industry Pests (Acari, Coleoptera, Lepidoptera, Psocoptera, Diptera and Blattodea): A Review. Insects. 2019; 10(5):149. https://doi.org/10.3390/insects10050149
Chicago/Turabian StyleStejskal, Vaclav, Tomas Vendl, Zhihong Li, and Radek Aulicky. 2019. "Minimal Thermal Requirements for Development and Activity of Stored Product and Food Industry Pests (Acari, Coleoptera, Lepidoptera, Psocoptera, Diptera and Blattodea): A Review" Insects 10, no. 5: 149. https://doi.org/10.3390/insects10050149