Article

UV-Visible Spectrophotometer for Distinguishing Oxidation Time of Engine Oil

by
Torrey Holland
1,
Ali Mazin Abdul-Munaim
2,
Christopher Mandrell
1,
Robinson Karunanithy
1,
Dennis G. Watson
3 and
Poopalasingam Sivakumar
1,*
1
Department of Physics, Southern Illinois University Carbondale, Carbondale, IL 62901, USA
2
Department of Agricultural Machines and Equipment, College of Agricultural Engineering Sciences, University of Baghdad, Baghdad 10071, Iraq
3
School of Agricultural Sciences, Southern Illinois University Carbondale, Carbondale, IL 62901, USA
*
Author to whom correspondence should be addressed.
Lubricants 2021, 9(4), 37; https://doi.org/10.3390/lubricants9040037
Submission received: 1 March 2021 / Revised: 28 March 2021 / Accepted: 31 March 2021 / Published: 3 April 2021
(This article belongs to the Special Issue Automotive Tribology II)

Abstract

:
Samples of gasoline engine oil (SAE 5W20) that had been exposed to various oxidation times were inspected with a UV-Visible (UV-Vis) spectrophotometer to select the best wavelengths and wavelength ranges for distinguishing oxidation times. Engine oil samples were subjected to different thermal oxidation periods of 0, 24, 48, 72, 96, 120, and 144 hours, resulting in a range of total base number (TBN) levels. Each wavelength (190.5 – 849.5 nm) and selected wavelength ranges were evaluated to determine the wavelength or wavelength ranges that could best distinguish among all oxidation times. The best wavelengths and wavelength ranges were analyzed with linear regression to determine the best wavelength or range to predict oxidation time.

1. Introduction

Engine manufacturers have tended to extend the interval between engine oil changes. Improved engine oil additive packages and, in some cases, additional engine oil capacity have allowed this extension of operating time between oil changes.
In the absence of system failures that lead to other contaminants, oxidation is the primary process that degrades [1] and shortens engine oil life [2]. Oxygen and heat accelerate oxidation [3]; oxygen-free radicals interact with hydrocarbons breaking down hydrocarbon molecules and form acidic compounds [1,4,5,6] that cause corrosion and deposits on metal surfaces.
A small amount of oil can make it past the intake valve stem seals and enter the combustion chamber, but most oil that enters the combustion chamber tends to bypass the rings on the pistons [7,8]. The set of metallic rings on the pistons are intended to prevent gases from leaking out of the combustion chamber into the crankcase, transfer heat from the pistons into the cylinder walls which are typically cooled by a liquid cooling system, reduce friction between the pistons and cylinders by maintaining a liquid film of oil between them, and prevent oil from entering the combustion chamber. This last requirement is probably the main culprit behind oil entering the combustion chamber [9,10,11]. A small amount of oil may be left on the cylinder walls in normal driving as the engine decelerates, creating a negative pressure in the combustion chamber that draws oil into it. However, this may worsen as piston rings and cylinders become worn or damaged, and blow-by gasses can push some of this oil back into the crankcase [7]. With modern automobile manufacturers seeking to improve fuel economy, engine operating temperatures have increased [12,13], piston ring tensions have decreased, and engines, including their oil sumps, have been reduced in size. This has led to an increased exposure time per unit of oil with blow-by gases leading to oil oxidation [13].
Engine oil may consist of up to 30% (v/v) of additives added to the base oil stock [14]. Antioxidants and detergents within these additives hinder the oxidation and slow the acidifying of the oil. The antioxidants retard the oxidation by reacting with free radicals, forming stable molecules to avoid hydrocarbon breakdown [15]. A secondary defense against oxidation is provided by the added detergents that neutralize acidic compounds [16]. An increase in oil viscosity [6] arises after consuming these antioxidants and detergents, leading to sludge formation [4], vastly degrading the oil’s use as an adequate lubricant.
A Digital Twin for Friction Prediction in Dynamic Rubber Applications with Surface Textures.
An indicator of useful engine oil life is the total base number (TBN), a measure of the reserve alkalinity in units of mg KOH/g [17]. This indicates the detergent content and the ability to neutralize acidic compounds [5]. When the TBN reaches 50% of fresh engine oil, it would be rejected as a viable engine lubricant [18].
Various sensors have been proposed for measurements of antioxidants, alkalinity, acidity, water contamination [2,6,19,20,21,22,23,24,25,26,27,28,29]. These include viscosity sensors [19], mass sensors [21], cyclic voltammetry [23], carbon nanotube sensors [25], and photoacoustic detection [28]. Other methods have included Fourier-transform infrared (FT-IR) spectroscopy [1,30,31,32,33,34,35], to determine oxidation [30,31,36] and water contamination [33,34,37], and terahertz time-domain spectroscopy [38,39].
While several regions in the infrared spectrum have been identified as related to engine oil oxidation, far fewer UV-Vis studies have been found to address the issue of oil oxidation, with many of those focusing on oxidized vegetable oils or biodiesel [40,41,42,43]. UV-Vis has also been previously evaluated as an alternative to human eye assessment of the color index of transformer oil [44] as it ages due to oxidation and as a means to quantify soot in engine oil [45]. However, a study by Chevron used a liquid chromatography system coupled with a UV-Vis detector to differentiate between base stock oils used in engine lubricants and correlated those base oils with their analysis of oxidation stability that was found by measuring the time taken to react with a given amount of oxygen in the presence of an oxidation accelerator and an inhibitor [46].
The purpose of this study was to evaluate a relatively new and easy-to-use UV-Vis spectrophotometer to distinguish engine oil oxidation periods. An established norm in oxidation analysis is the use of infrared spectroscopy that can yield a plethora of detailed information about oxidation, nitration, additive depletion, and water/coolant infiltration. However, recent research using FT-IR analysis on real-world oil degradation under usual driving conditions indicated that most degradation overtime was due to oxidation [47]. Suppose a relatively inexpensive, easy-to-use method that requires only a 1 𝜇L sample can yield relatively easy to interpret oxidation results that are comparable to those obtained by FT-IR analysis. In that case, spectral analyses of oil degradation could become more ubiquitous. This could save engines from excessive wear and reduce unnecessary oil changes.

2. Materials and Methods

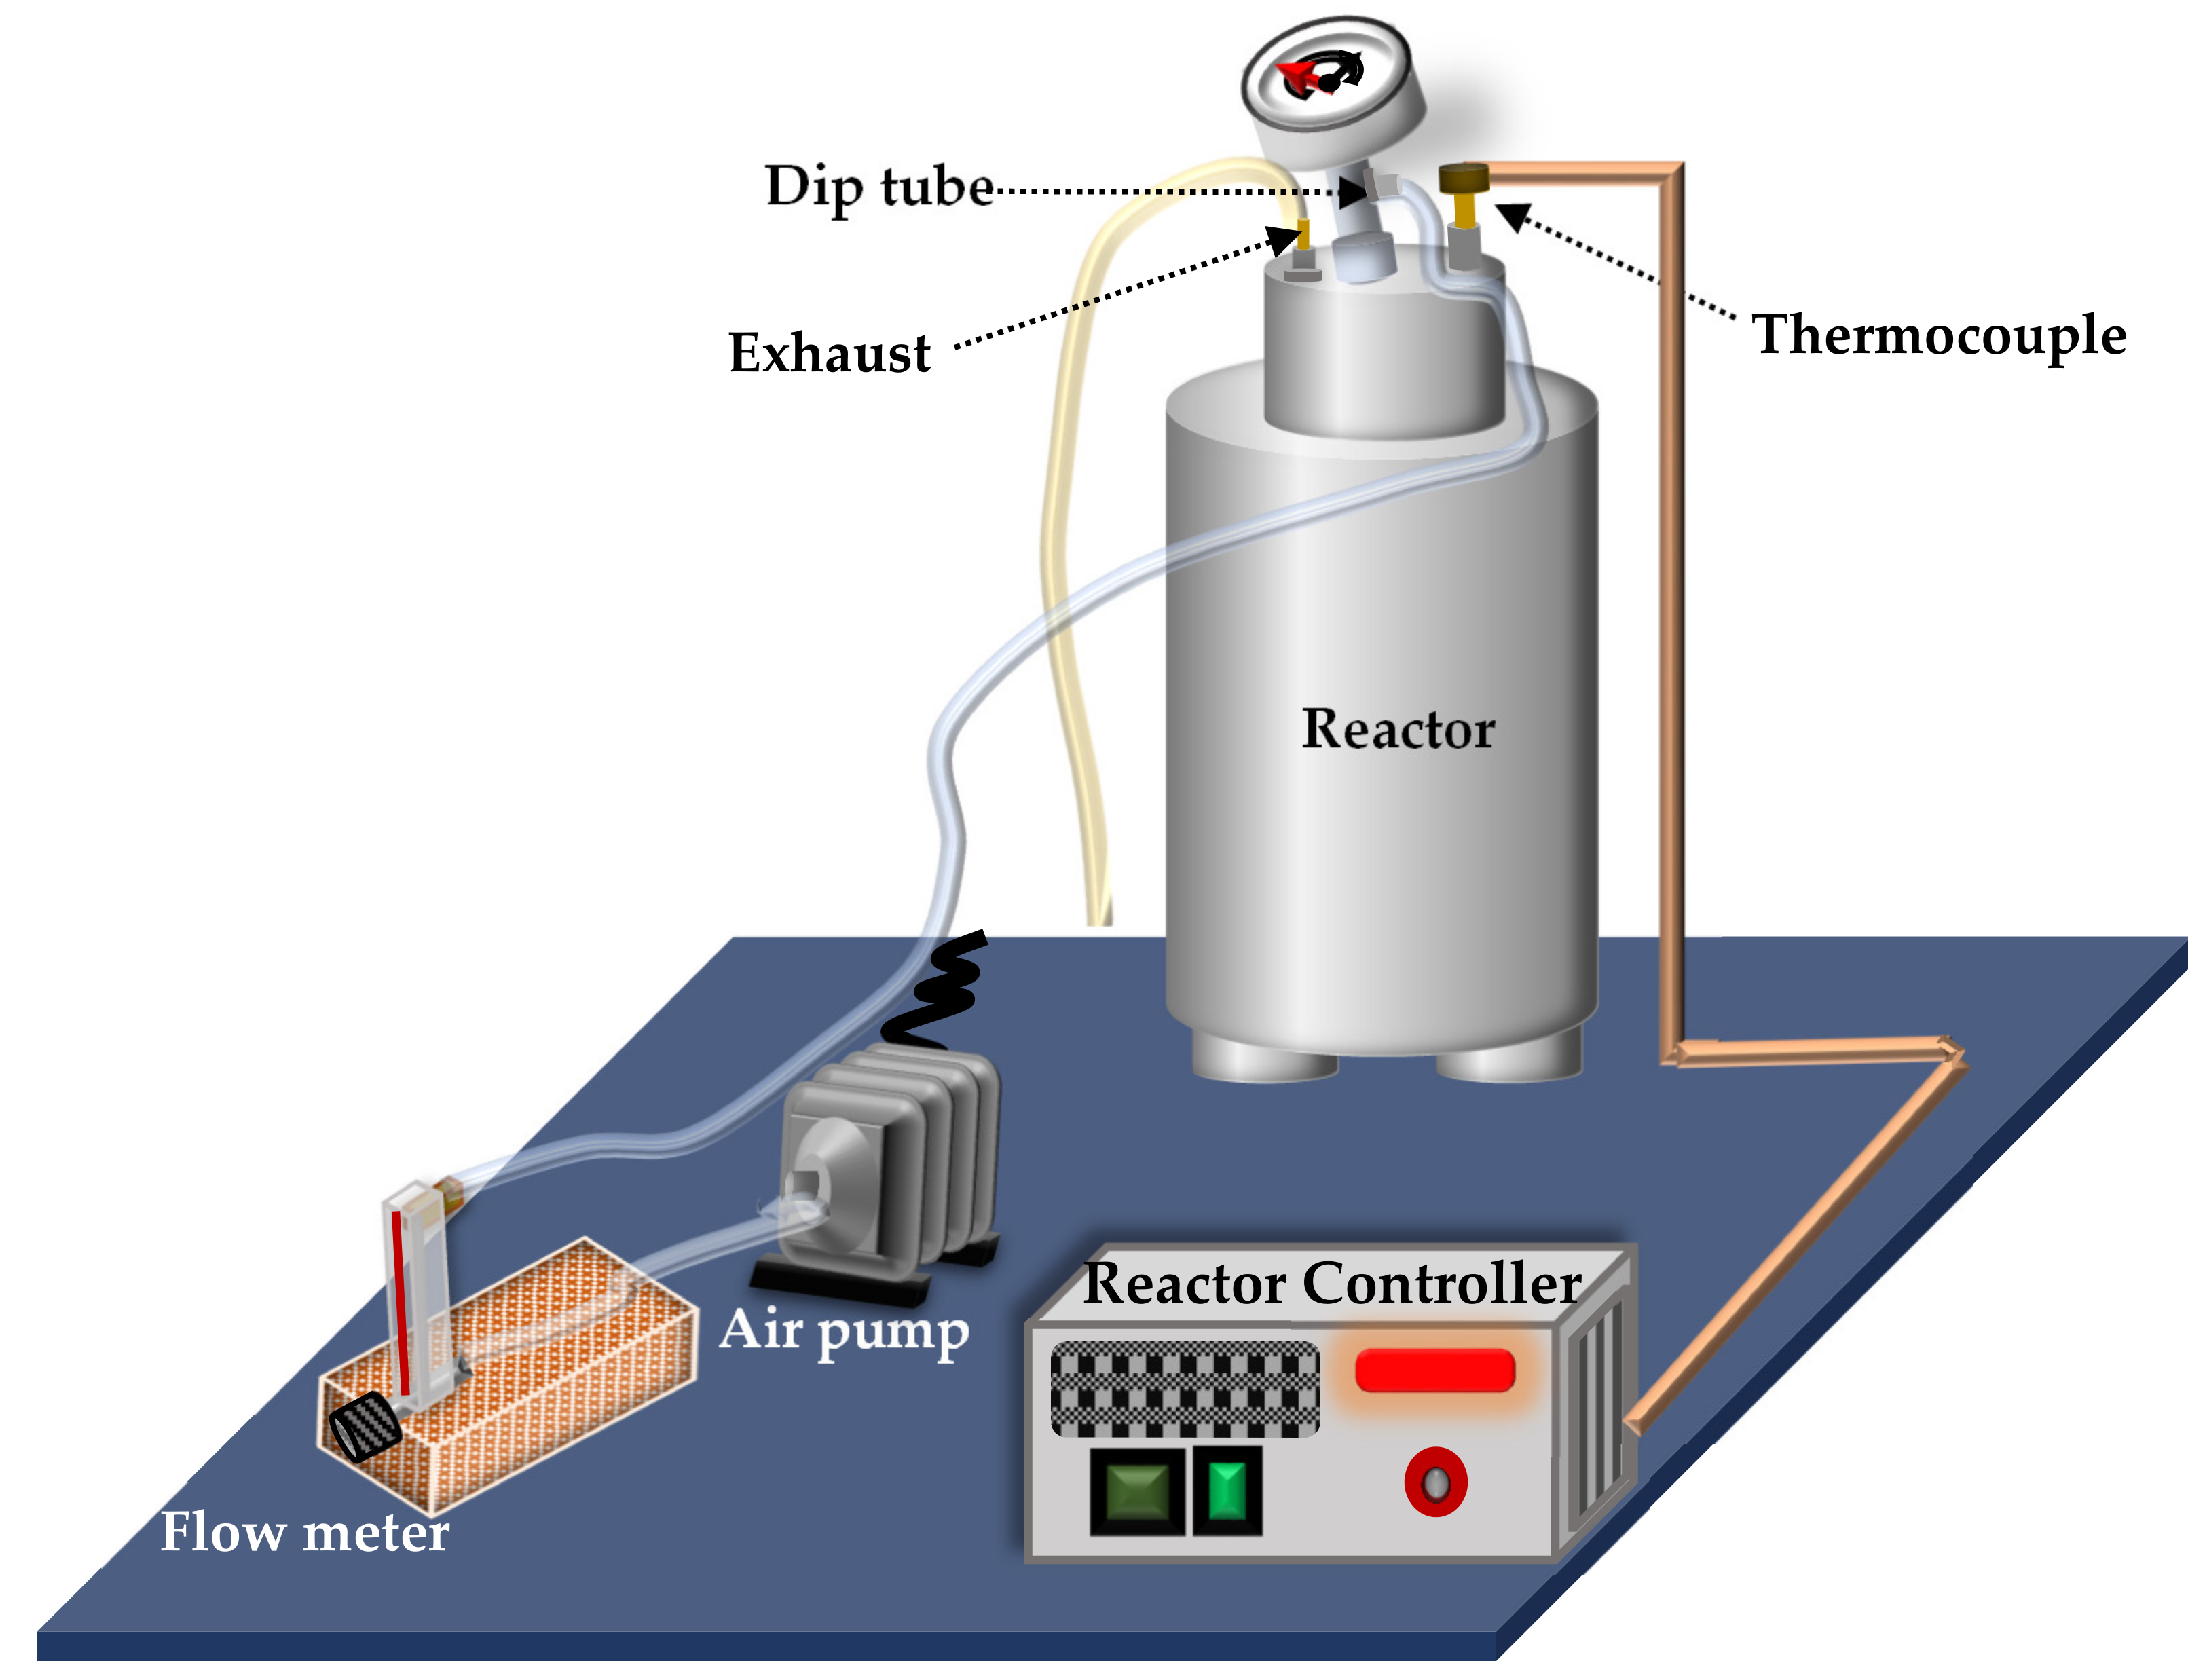
2.1. Thermal Oxidation

Gasoline engine oil (4.73 L; Pennzoil, Houston, TX, USA, API SN, SAE 5W-20) was purchased at a local retailer in Carbondale, IL, USA. All oil samples in this study originated from this single container. This oil grade was selected due to its common use in gasoline automotive engines.
In the previous publication Ref [36], the sample preparation and experimental setup were described in detail. A reactor (model 4838, Parr Instrument Company, Moline, IL, USA; Figure 1) was used to oxidize oil samples thermally [33]. The reactor featured a 1200 mL stainless steel cylinder with a bolt-on cylinder head. The cylinder head had a thermocouple well, exhaust opening, and input opening with a dip tube. The included temperature controller was used to control oil temperature in the cylinder to 180 °C [48,49,50]. Fresh oil (500 mL) was poured into the cylinder, and the cylinder head was attached. Heating was initiated and monitored. At 150 °C, an electromagnetic air pump (AC0-002,Yuting, Zhoushan, Zhejiang, China) was initiated to supply 1 L/min of regulated (FL-2013 acrylic flow meter, Omega Engineering, Norwalk, CT, USA) airflow through the input opening dip tube to the bottom of the oil cylinder. The air traveled through the oil and was vented through the exhaust opening at the top of the cylinder. Over 1–1.5 hours, the oil temperature increased to 180 °C and was controlled at that level ±1 °C for the duration of the desired oxidation period. Six fresh oil samples were each thermally oxidized for a different period of 24, 48, 72, 96, 120, and 144 h. The 0-hour sample was fresh engine oil. A 100 mL portion of each oxidized sample plus a fresh oil sample was sent to a commercial oil analysis lab (Blackstone Laboratories, Fort Wayne, IN, USA) for viscosity measurements at 40 °C and TBN, who use ASTM standards modified for production. Eight mL of each sample was separated for UV-Vis analysis.

2.2. UV-Vis Analysis

A UV-Vis spectrophotometer (NanoDrop OneC, Thermo Scientific, Wilmington, DE, USA) with a wavelength range of 190-850 nm was selected for this study. The NanoDrop spectrometer is typically used for very rapid microvolume absorbance measurements of proteins, DNA, RNA, etc. in the ultraviolet and visible light spectrum. The accompanying user interface is specifically designed for ease of use with these applications. However, the custom setting allowed for absorbance measurements for other applications, and a resolution of 0.5 nanometers was used in this experiment. The pedestals were initially cleaned, and a 1 μ L droplet of distilled water was pipetted onto the spectrophotometer’s lower pedestal, the upper arm closed, and the system would take a light intensity reference measurement of the “blank” sample within about a minute. This was then wiped away with an extra low-lint optical disposable wipe, and a 1 μ L oil drop would be placed on the pedestal, the upper arm closed, and the measurement of the oil sample taken within about a minute. The lower pedestal and upper arm pedestal were cleaned with acetone on an extra low-lint wipe, immediately followed by a cleaning with 1–2 μ L of distilled water, which was wiped away to remove any residual acetone. The process was then repeated with a distilled water blank, blank removal, testing of the sample, and cleaning for a total of at least twelve individual sample replications of each oxidation level (0, 24, 48, 72, 96, 120, and 144 h).
The blank and the testing sample need to create a liquid column, through surface tension, in the gap between the two pedestals through which light can pass. Distilled water was chosen as the blank sample since it does not share strong, common bonds with fresh or oxidized oil. The intensity spectrum of distilled water is roughly equivalent to that of the intensity of the lamp alone. With the similarities between the lamp and distilled water intensities, it can be seen through the absorbance equation:
Absorbance =   log Intensity   of   Sample Intensity   of   Blank
The oil spectra are well preserved and are not limited to displaying the mere differences between fresh oil and oxidized oil. This allows for fresh oil with zero hours of oxidation to be included in the overall oil trend.

2.3. Data Preprocessing and Analysis

Prior to statistical analysis, the baseline of each whole spectrum was adjusted to minimize the effects of baseline shifting between UV-Vis measurements. The graphs were very well behaved and relatively consistent within oxidation groups. The extent of data preprocessing before performing ANOVA calculations was minimal and consisted of shifting the entire graph of each spectrum such that its minimum value (typically above 800 nm) was not less than zero and dropping the very first and very last data points.
The twelve UV-Vis absorbance measurements of each sample were submitted to analysis of variance (ANOVA; α = 0.05) by wavelength. Mean separation tests of Tukey’s highly significant difference (HSD) and Fisher’s least significant difference (LSD) were used to determine differences among oxidation times. Wavelengths and wavelength ranges with significant differences among each oxidation time were selected based on Tukey and Fisher results. For all ranges, ASTM E2412-10 [51] was followed by using the integrated area of wavelength ranges.

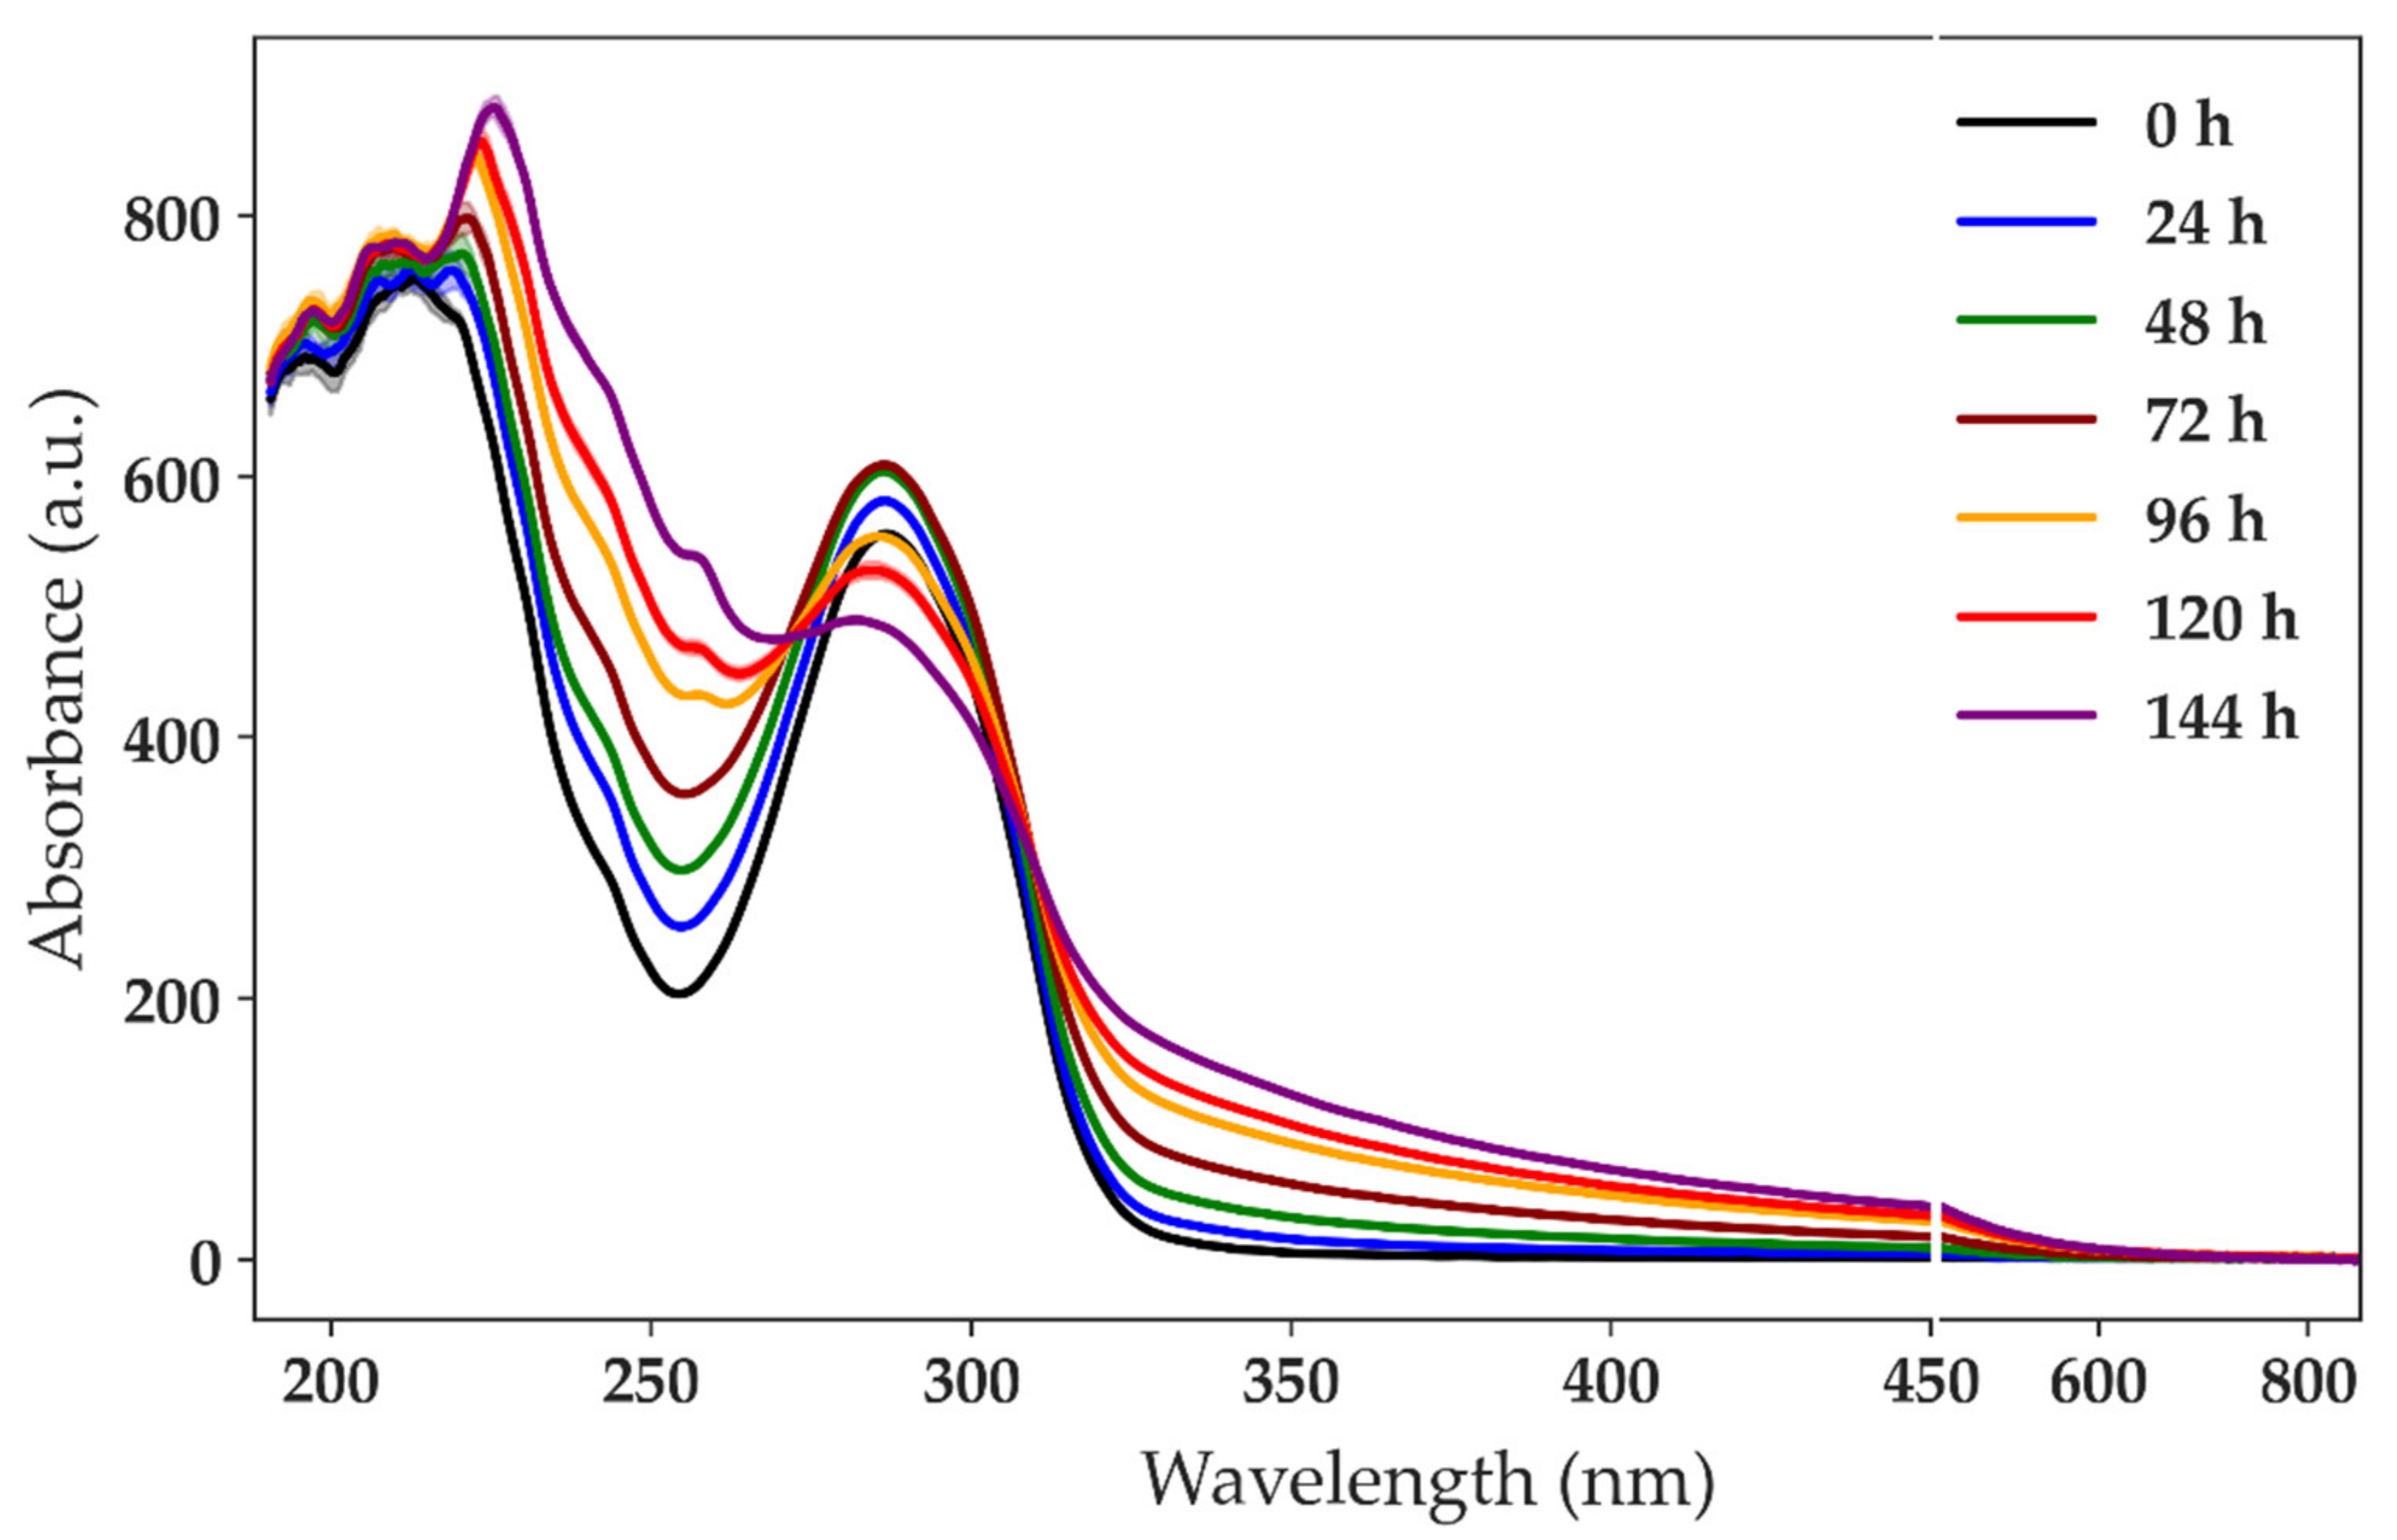
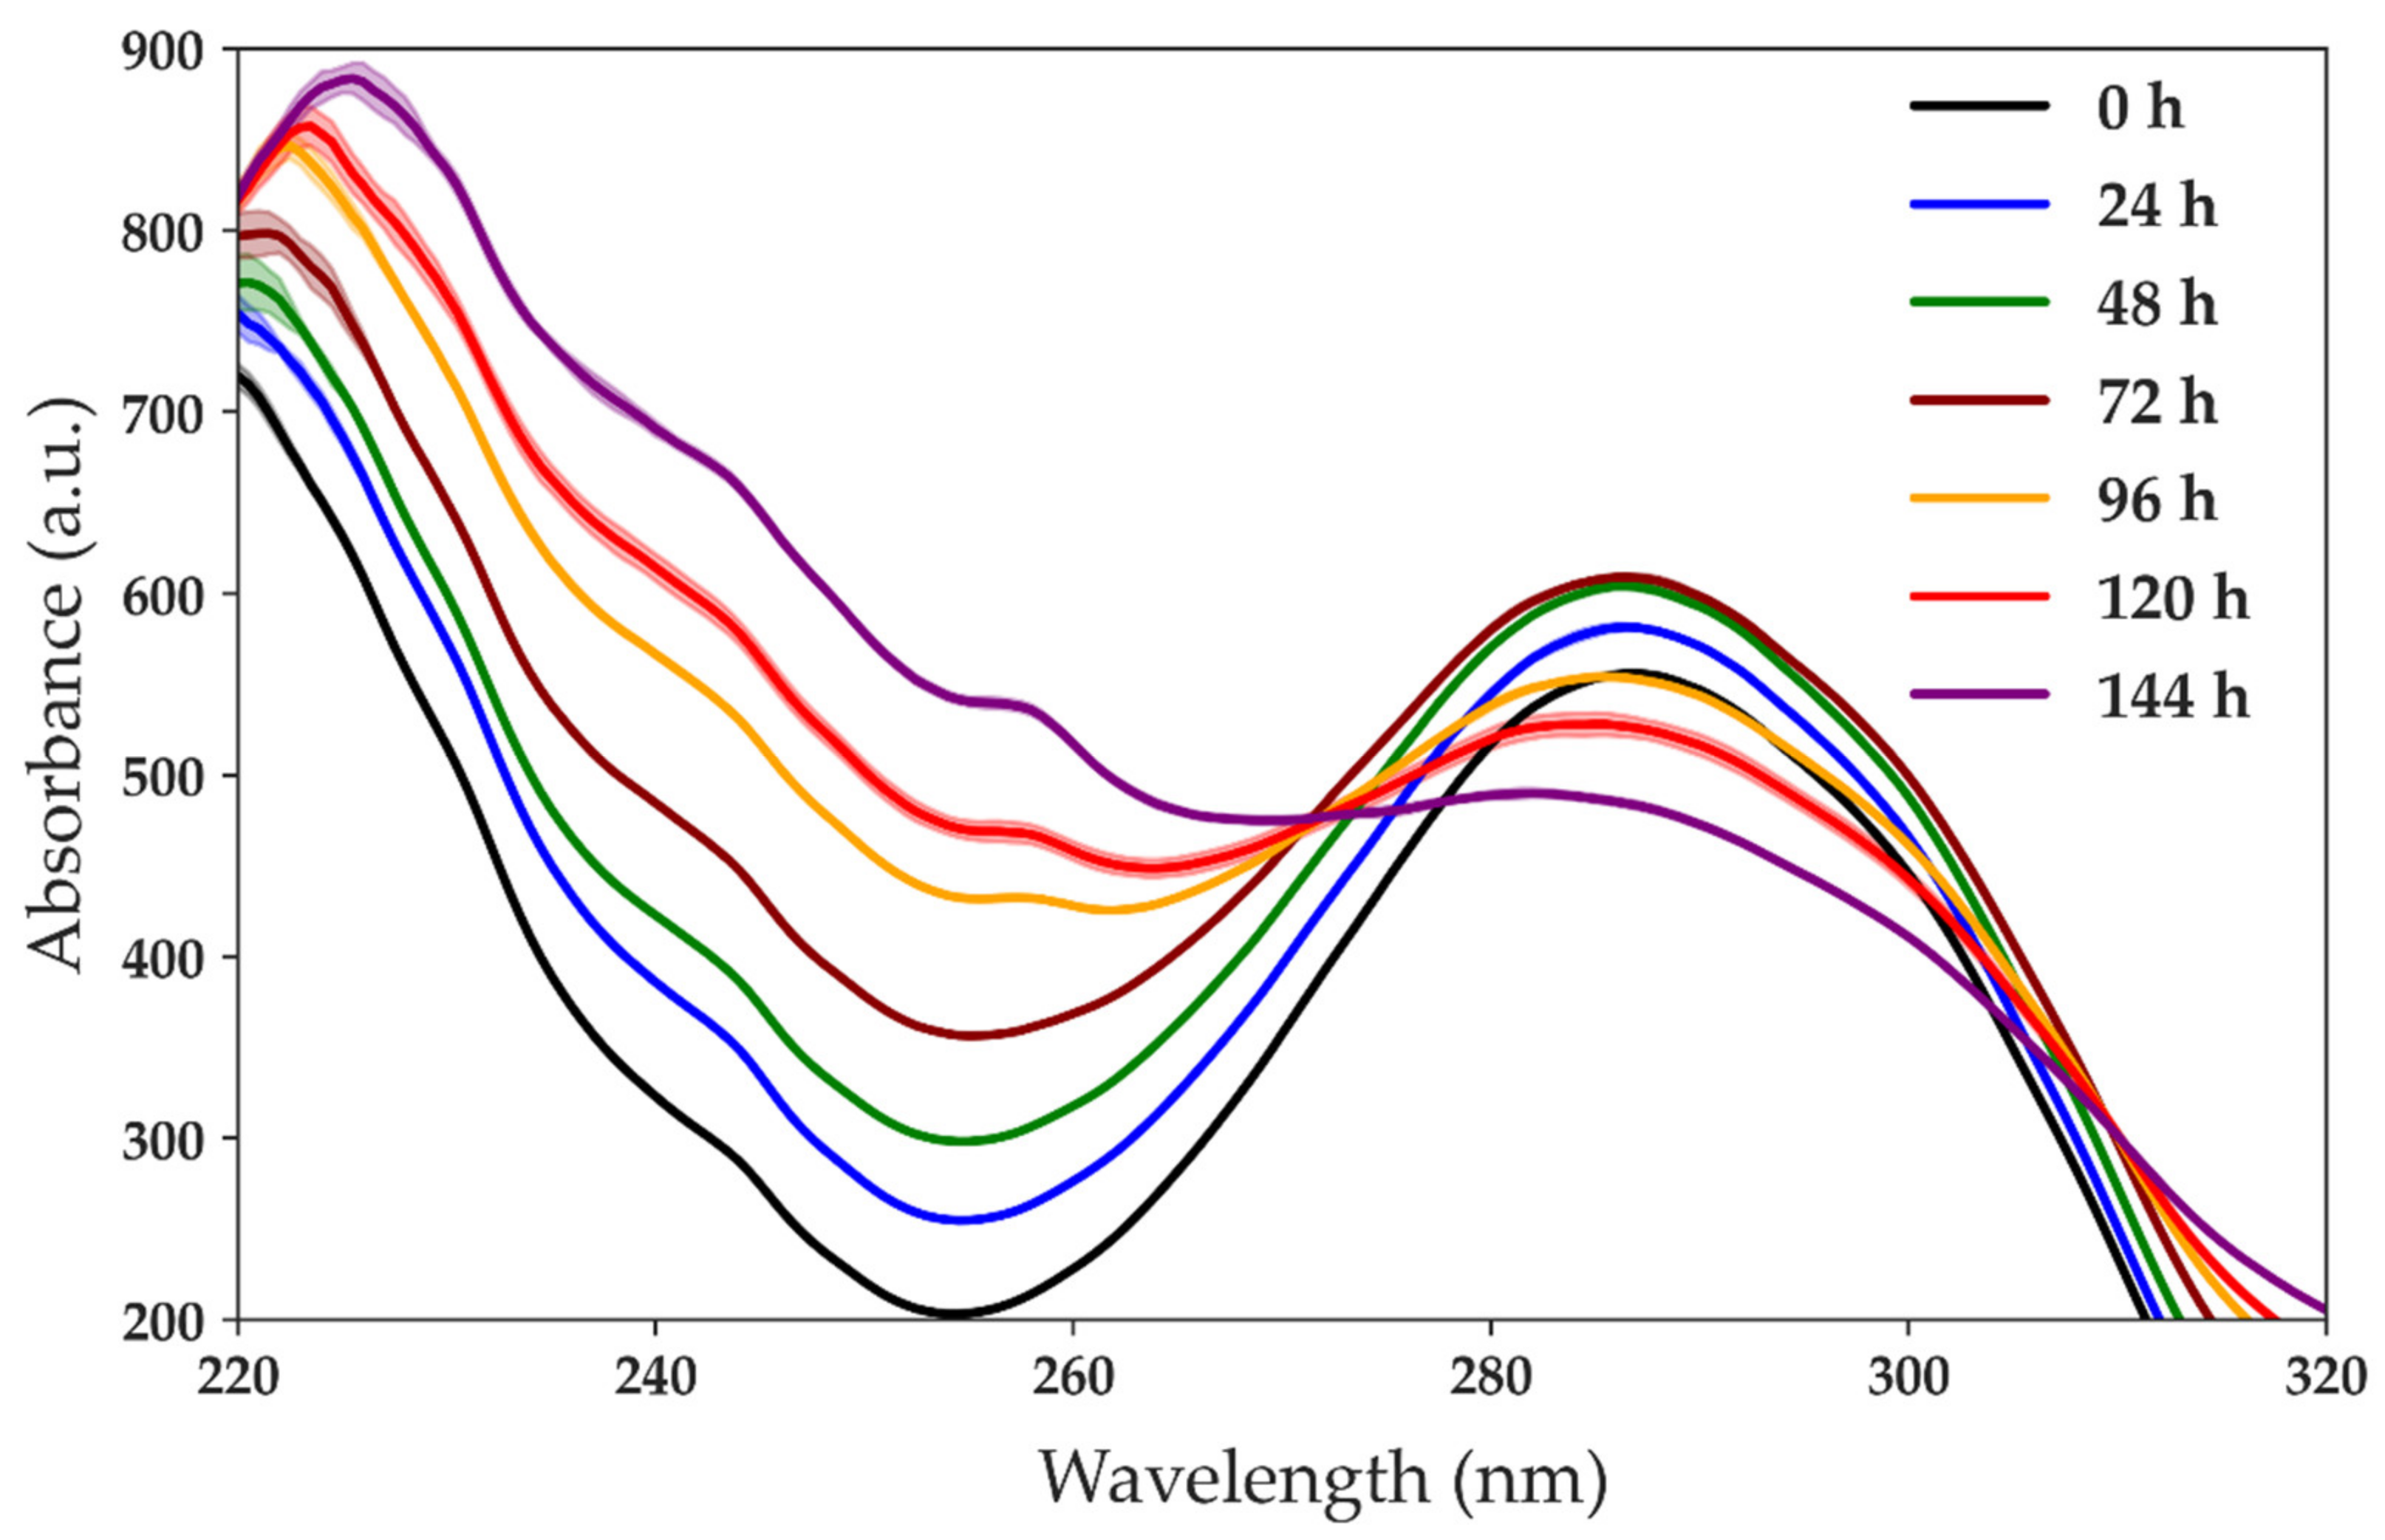
3. Results and Discussion

Results of the TBN and kinematic viscosity analysis by a commercial lab are summarized in Table 1. TBN decreased with oxidation time, indicating the antioxidant additives were being depleted. TBN of fresh oil was 7.2 and reduced to 1.8 after 144 h. After 120 h, the engine oil had reached the rejection level of 50% reduction in TBN [18]. The thermal oxidation process successfully generated oil samples with increasing levels of oxidation corresponding to the oxidation time.

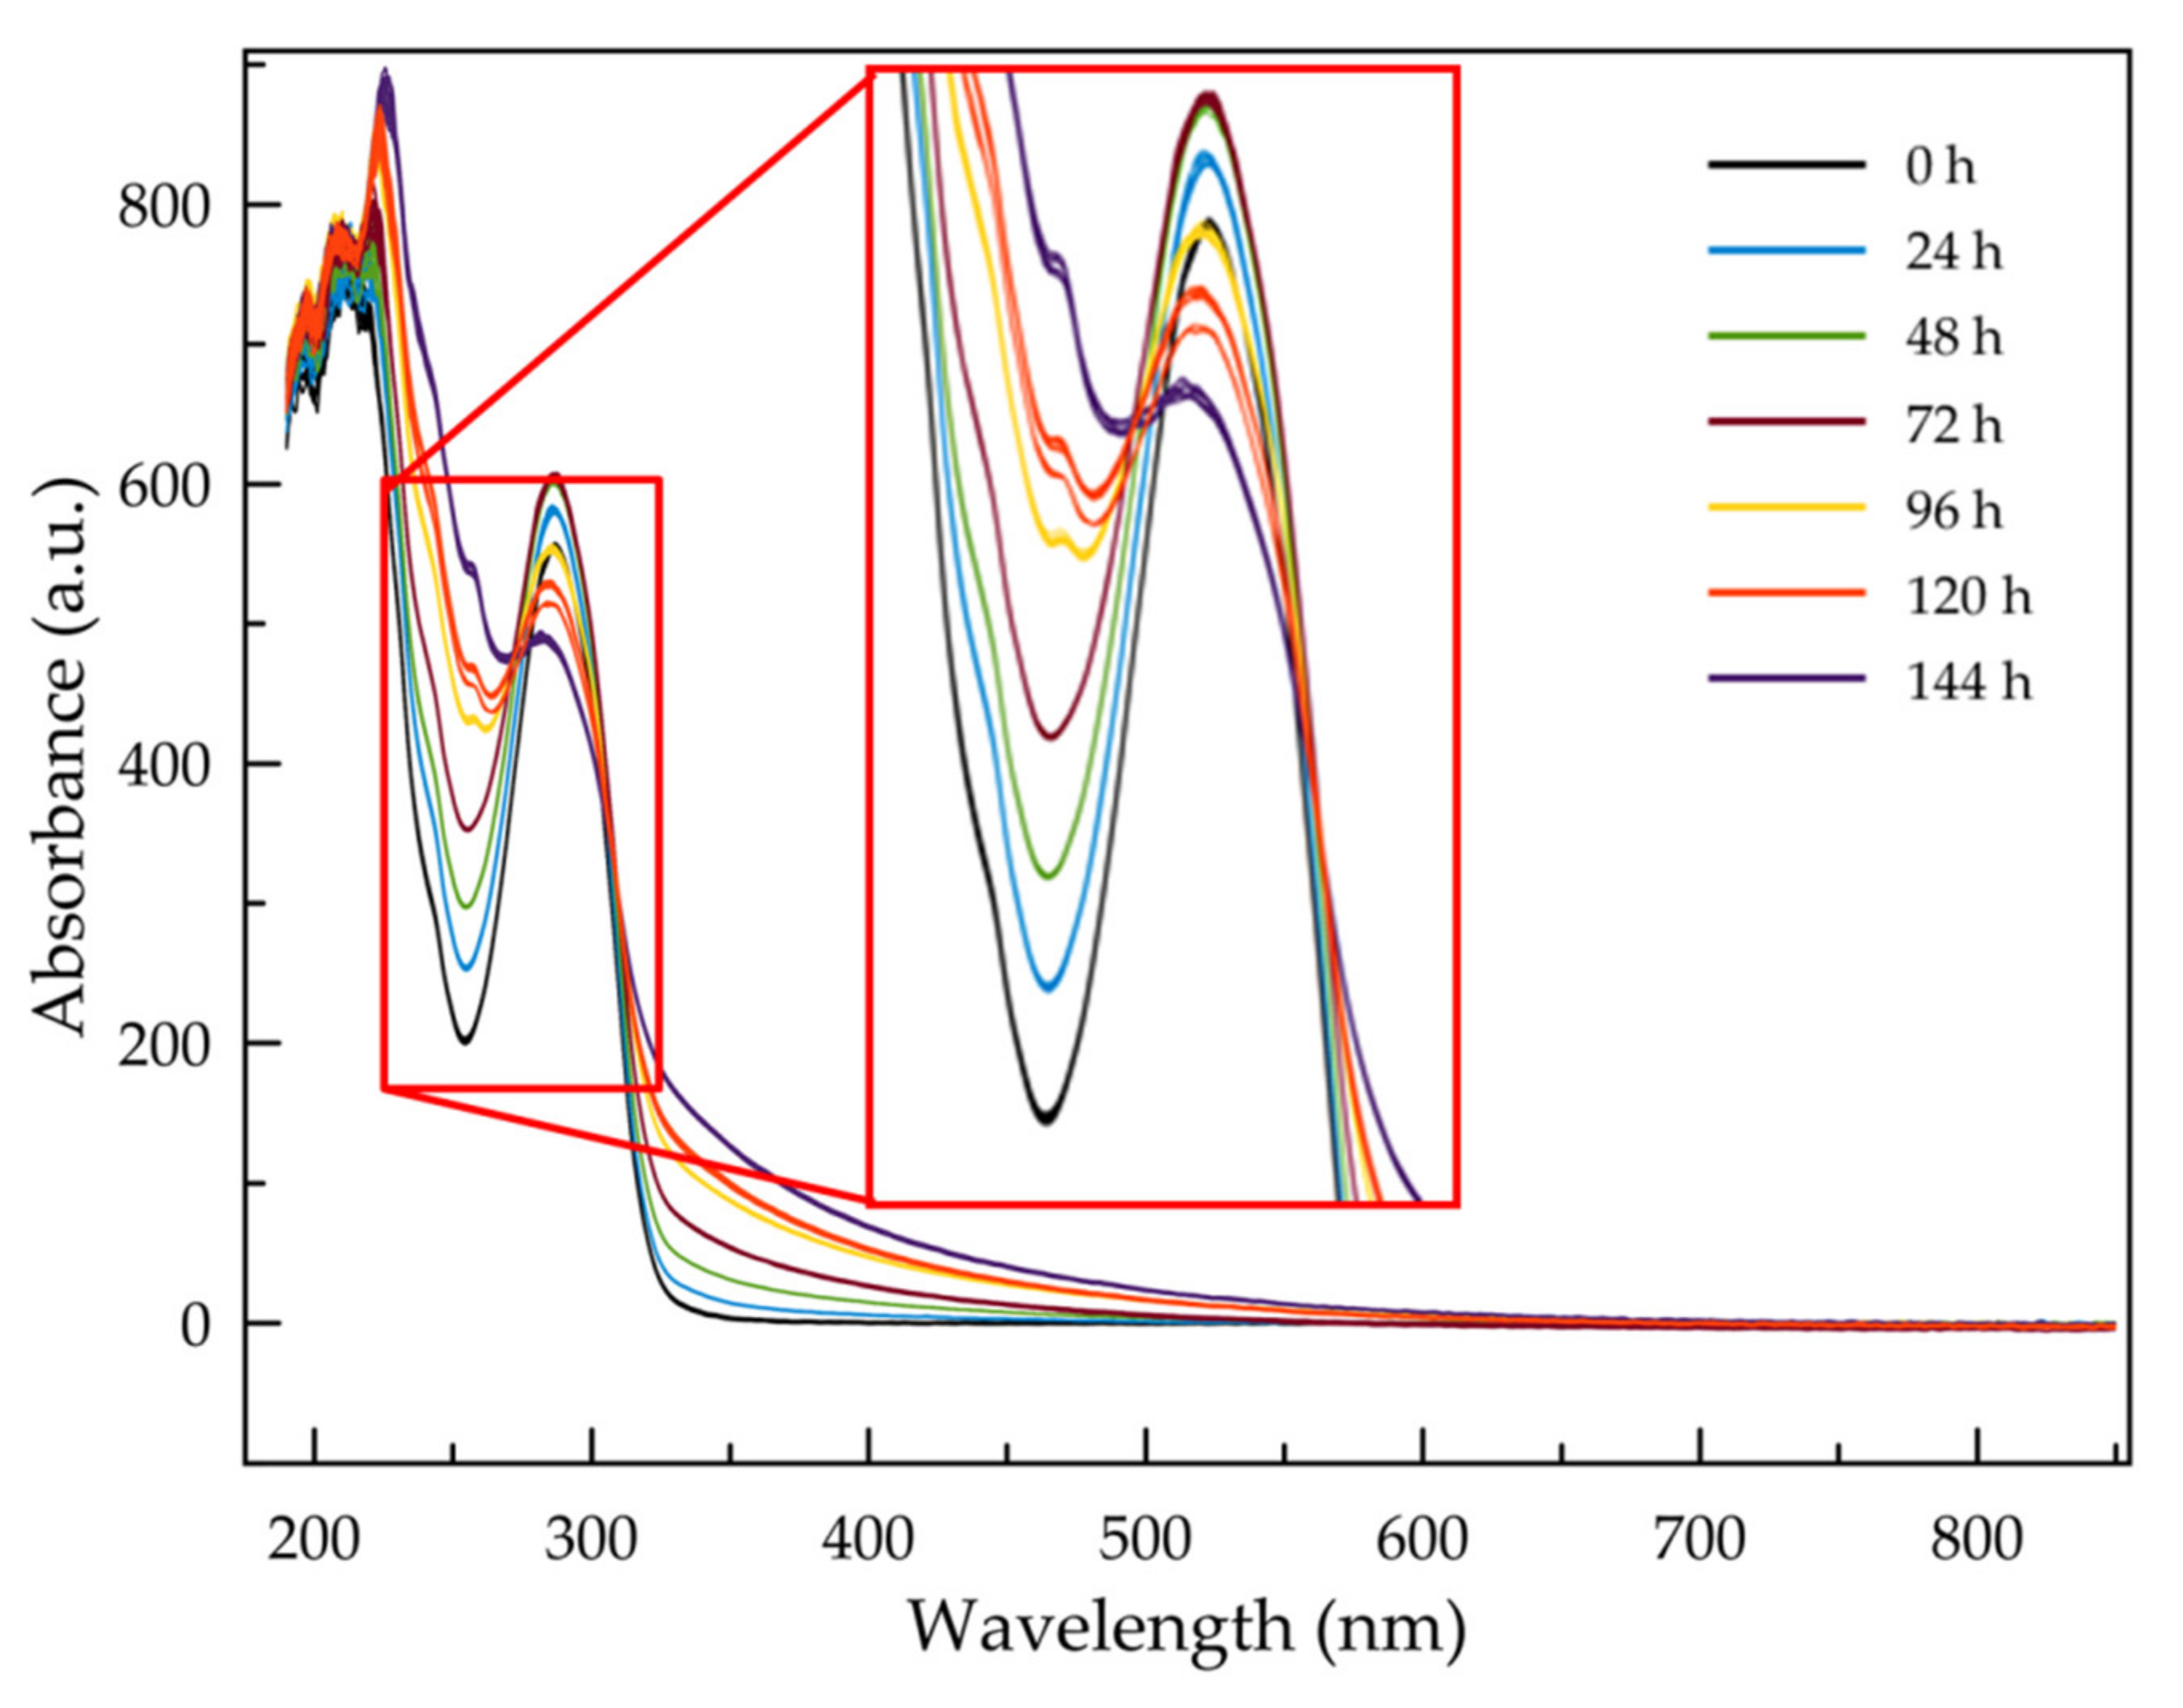
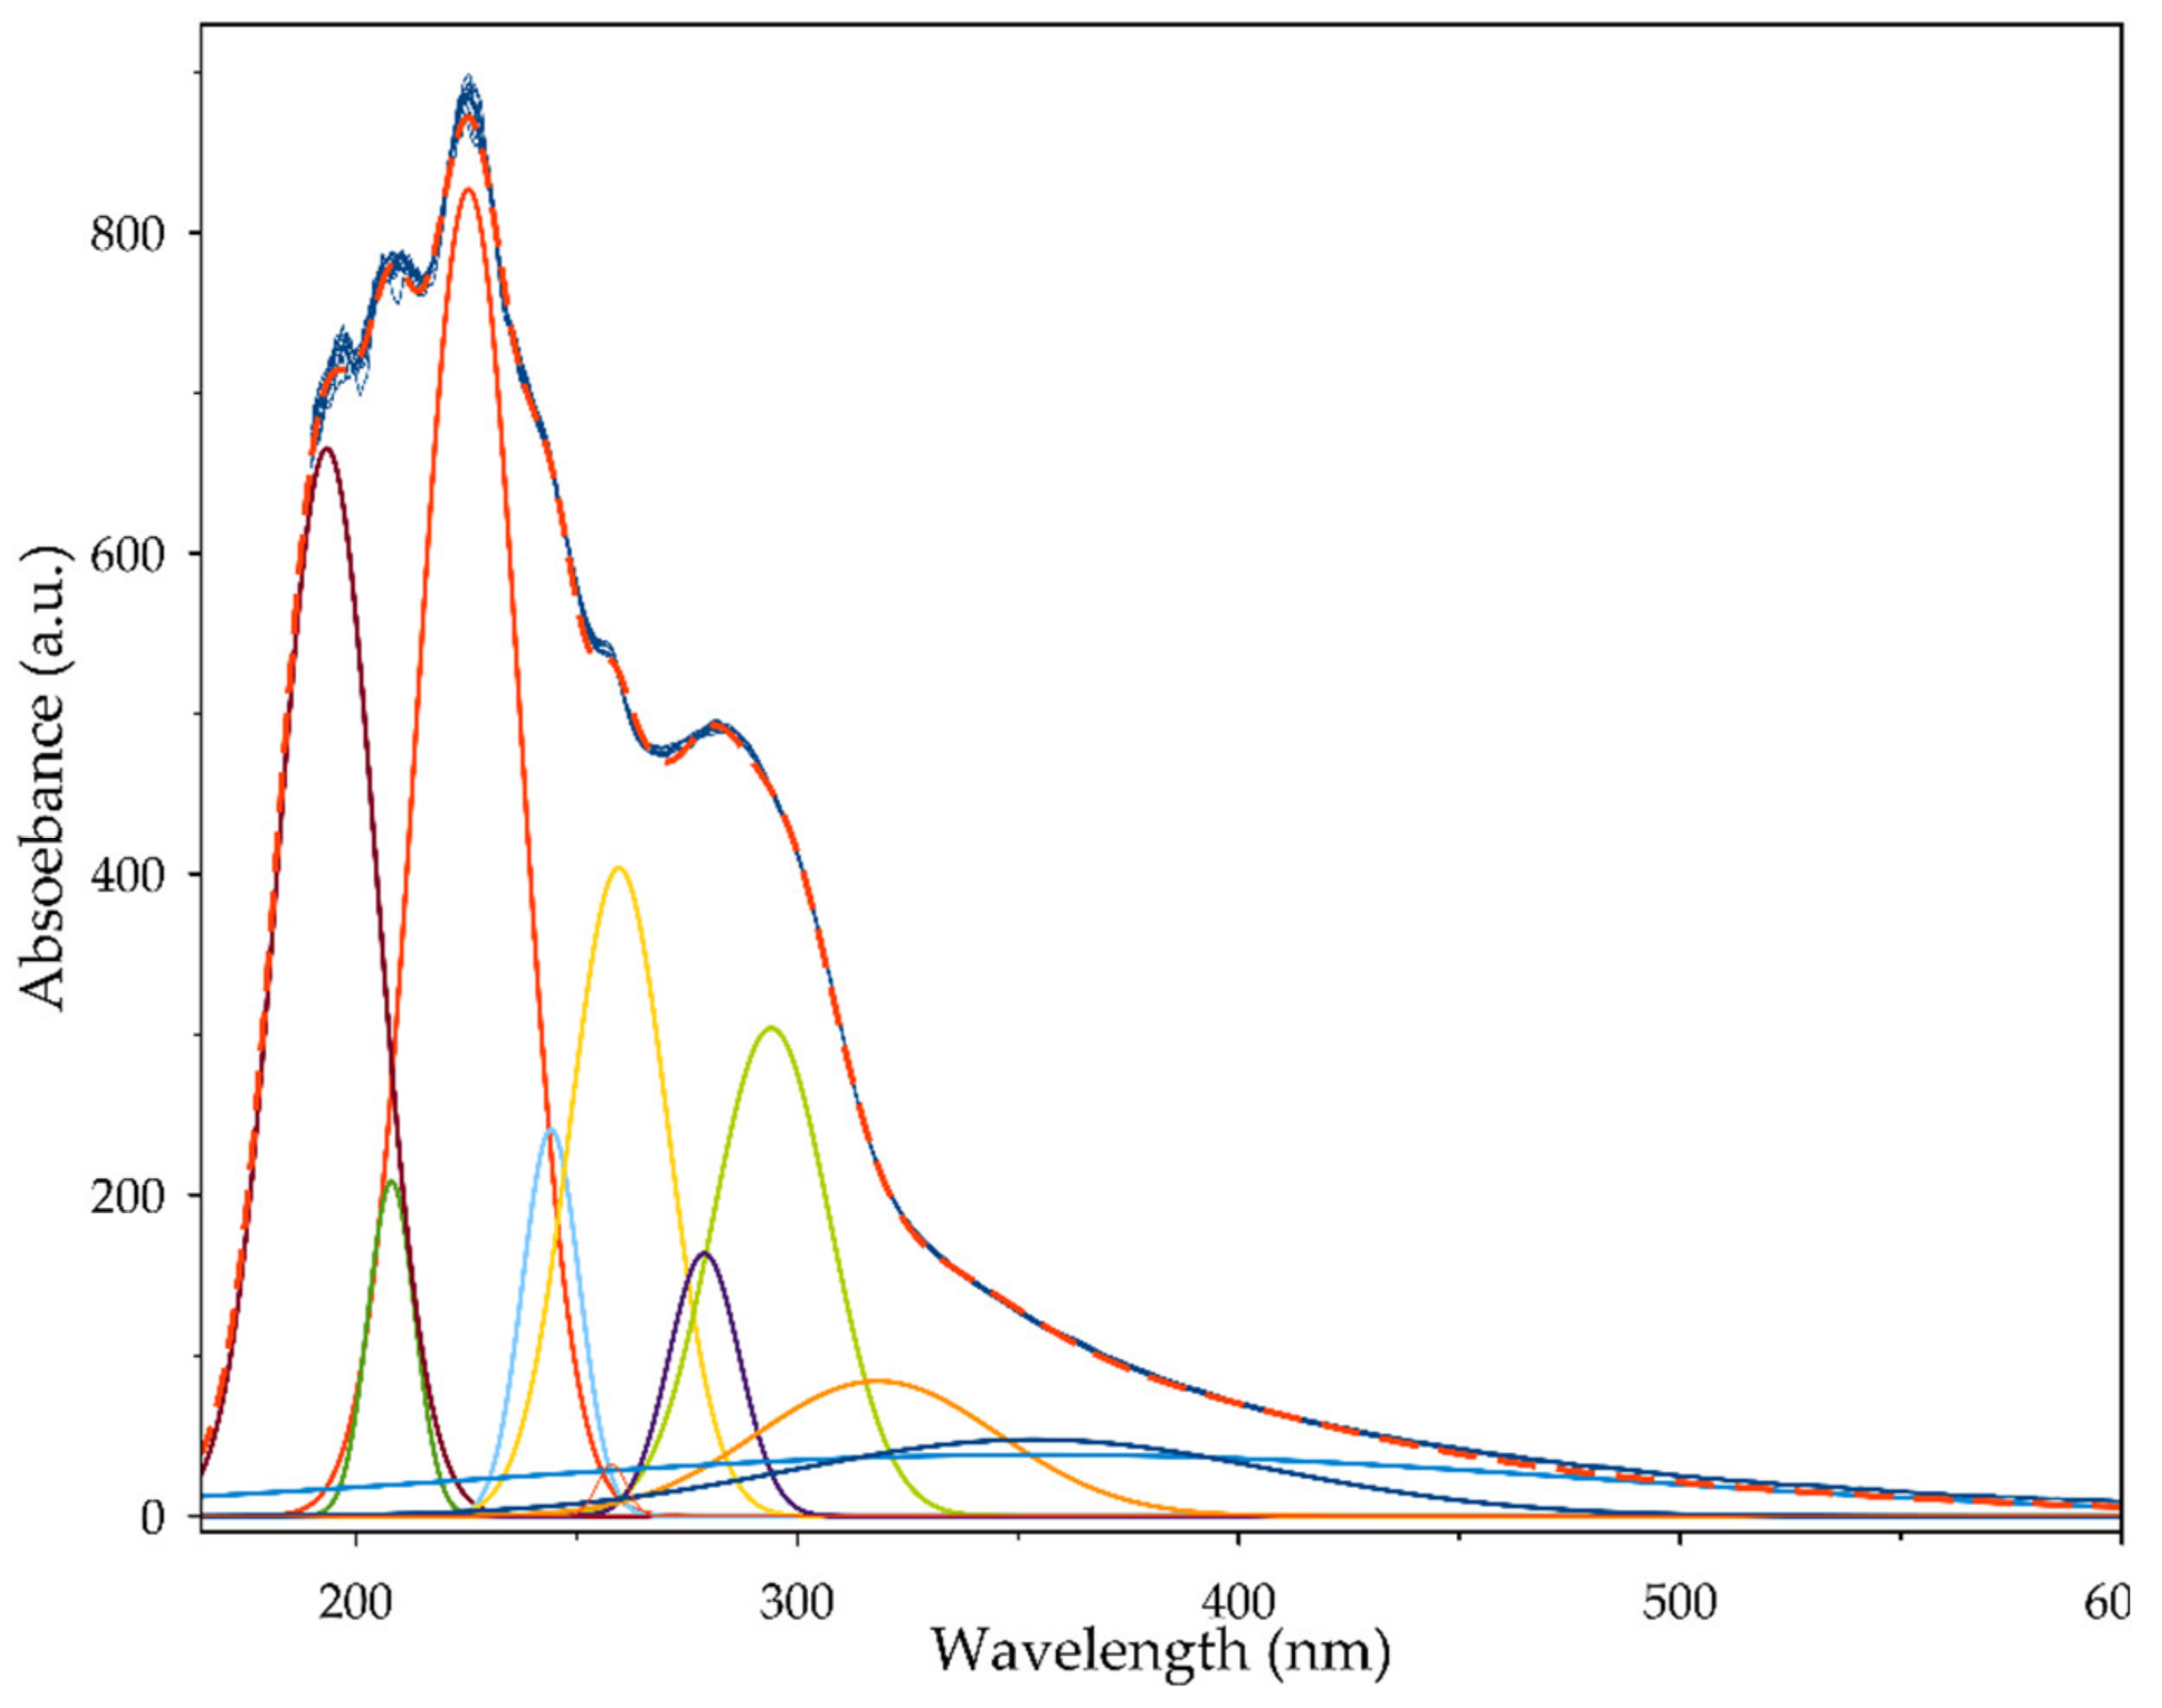
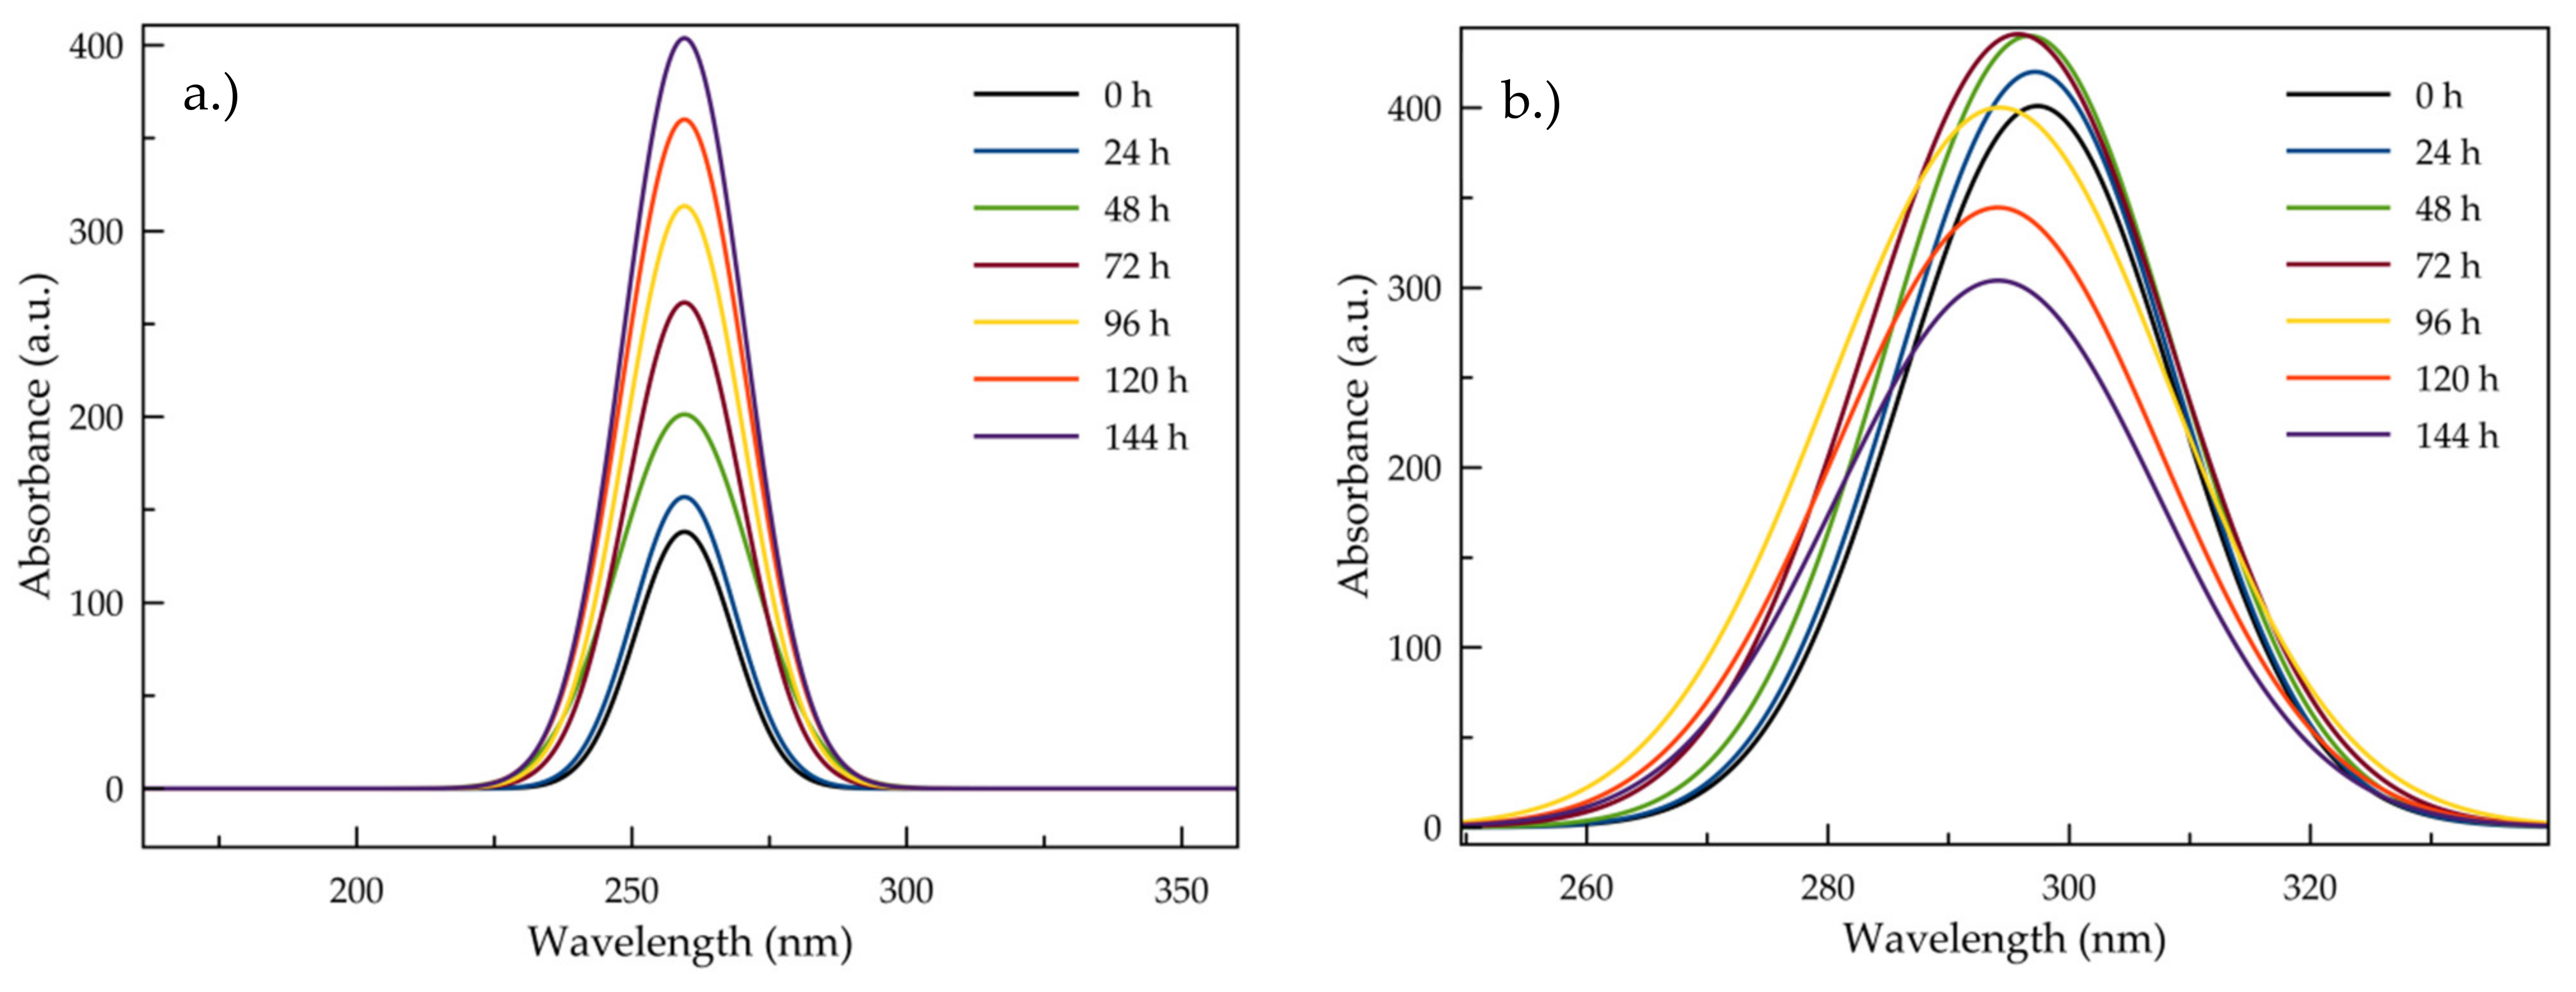
3.1. Selection of Wavelengths and Wavelength Ranges

The UV-Vis system reported absorption for each wavelength from 190.5–849.5 nm in 0.5 nm increments for 1319 wavelengths. The mean absorbance for each oxidation time was depicted in Figure 2. Absorbance curves among the oxidation times are most distinct in the ultraviolet range, with distinctiveness disappearing in the green range at about 540 nm. There were highly significant differences (F(6,77), p < 0.01) among the seven thermal oxidation times at each of the wavelengths. However, many of these wavelengths resulted in only part of the oxidation times being significantly different from the others. Based on Tukey’s HSD, each of the oxidation times was significantly different from all the others in the ranges of 223–270 nm, 311–506.5 nm, and 509–511 nm. As expected, more wavelength ranges had each oxidation time significantly different from all the others based on Fisher’s LSD with ranges of 222.5–270 nm, 310.5–514.5 nm, 515.5–519 nm, 520.5 nm, 531.5–534 nm, and 539.5 nm.
Figure 3 provides a better view of the 220–310 nm range. The 95% confidence interval bands above and below the mean also indicate the ranges previously mentioned in which all oxidation times were significantly different from each other. Up to about 270 nm, the longer oxidation times had higher absorbance values, but, starting at about 270 nm, a partial inversion occurs with the three most extended oxidation times. This inversion was reminiscent of the complete inversion that occurred in the range of 1030–1047 cm−1 wavebands (correlated with known additives of antioxidants and sulfonate detergents) when using Fourier Transform-Infrared (FT-IR) spectroscopy on the same samples as shown in Figure 4 [36].

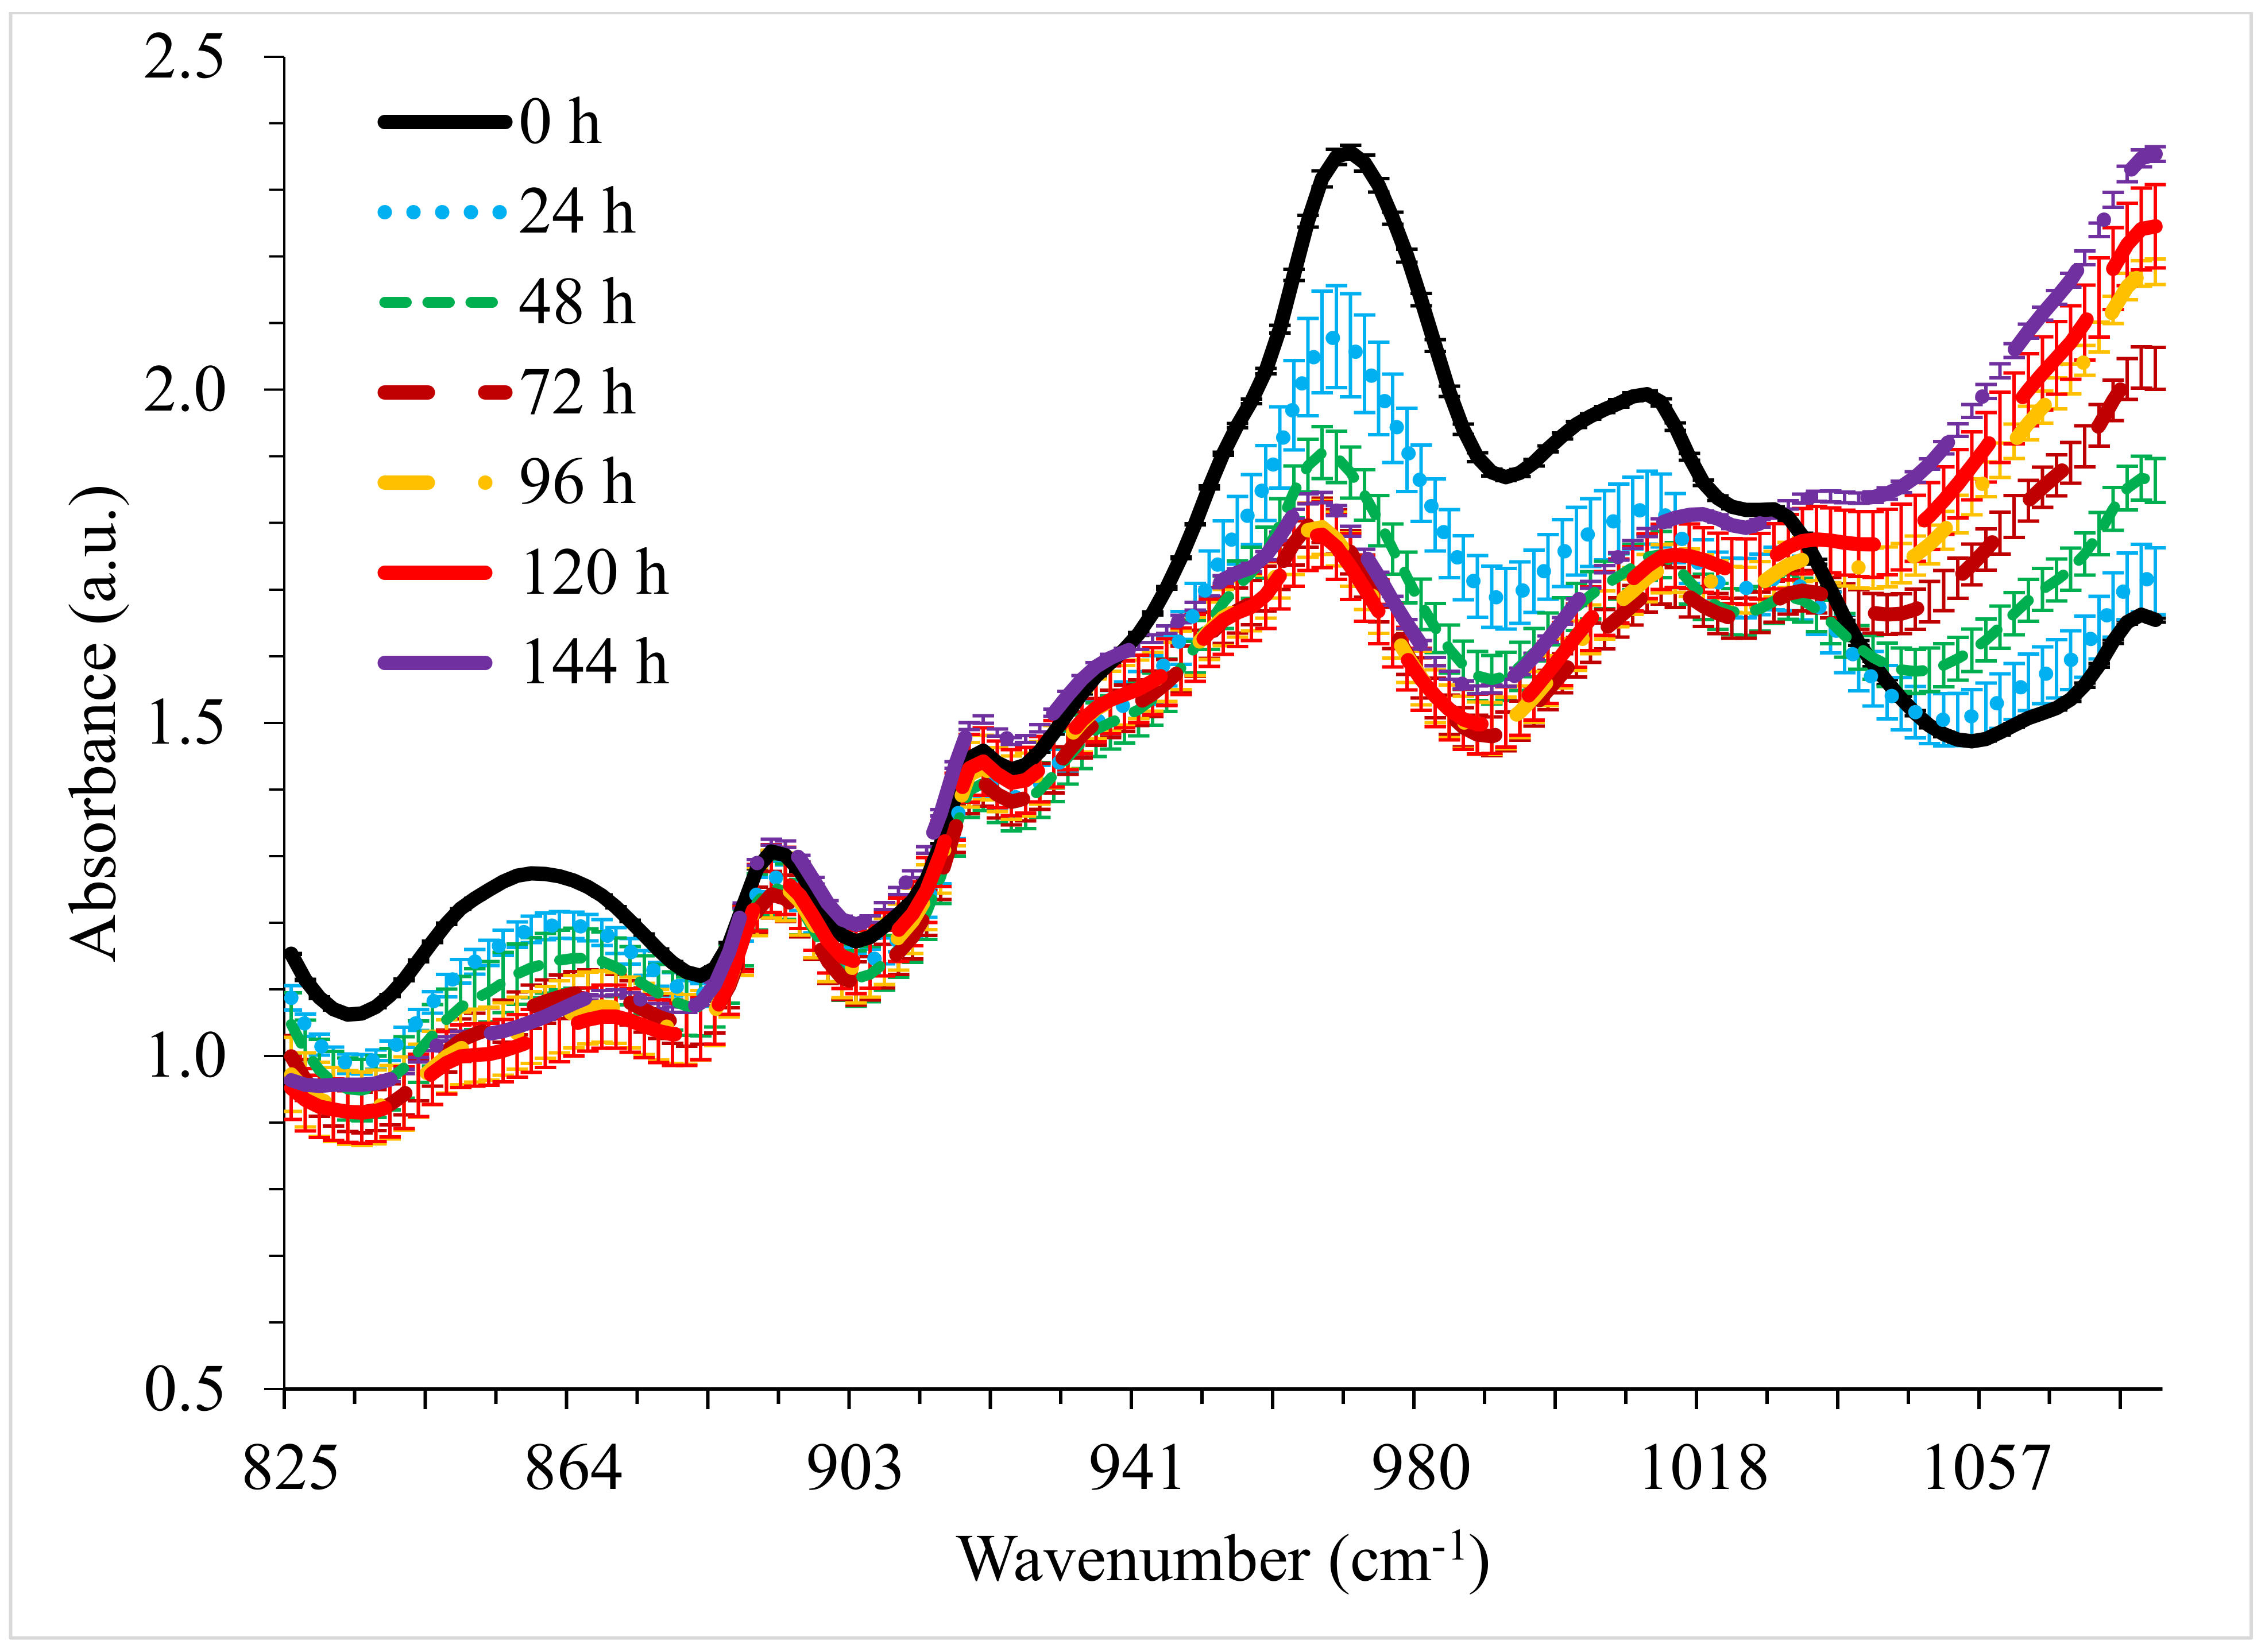
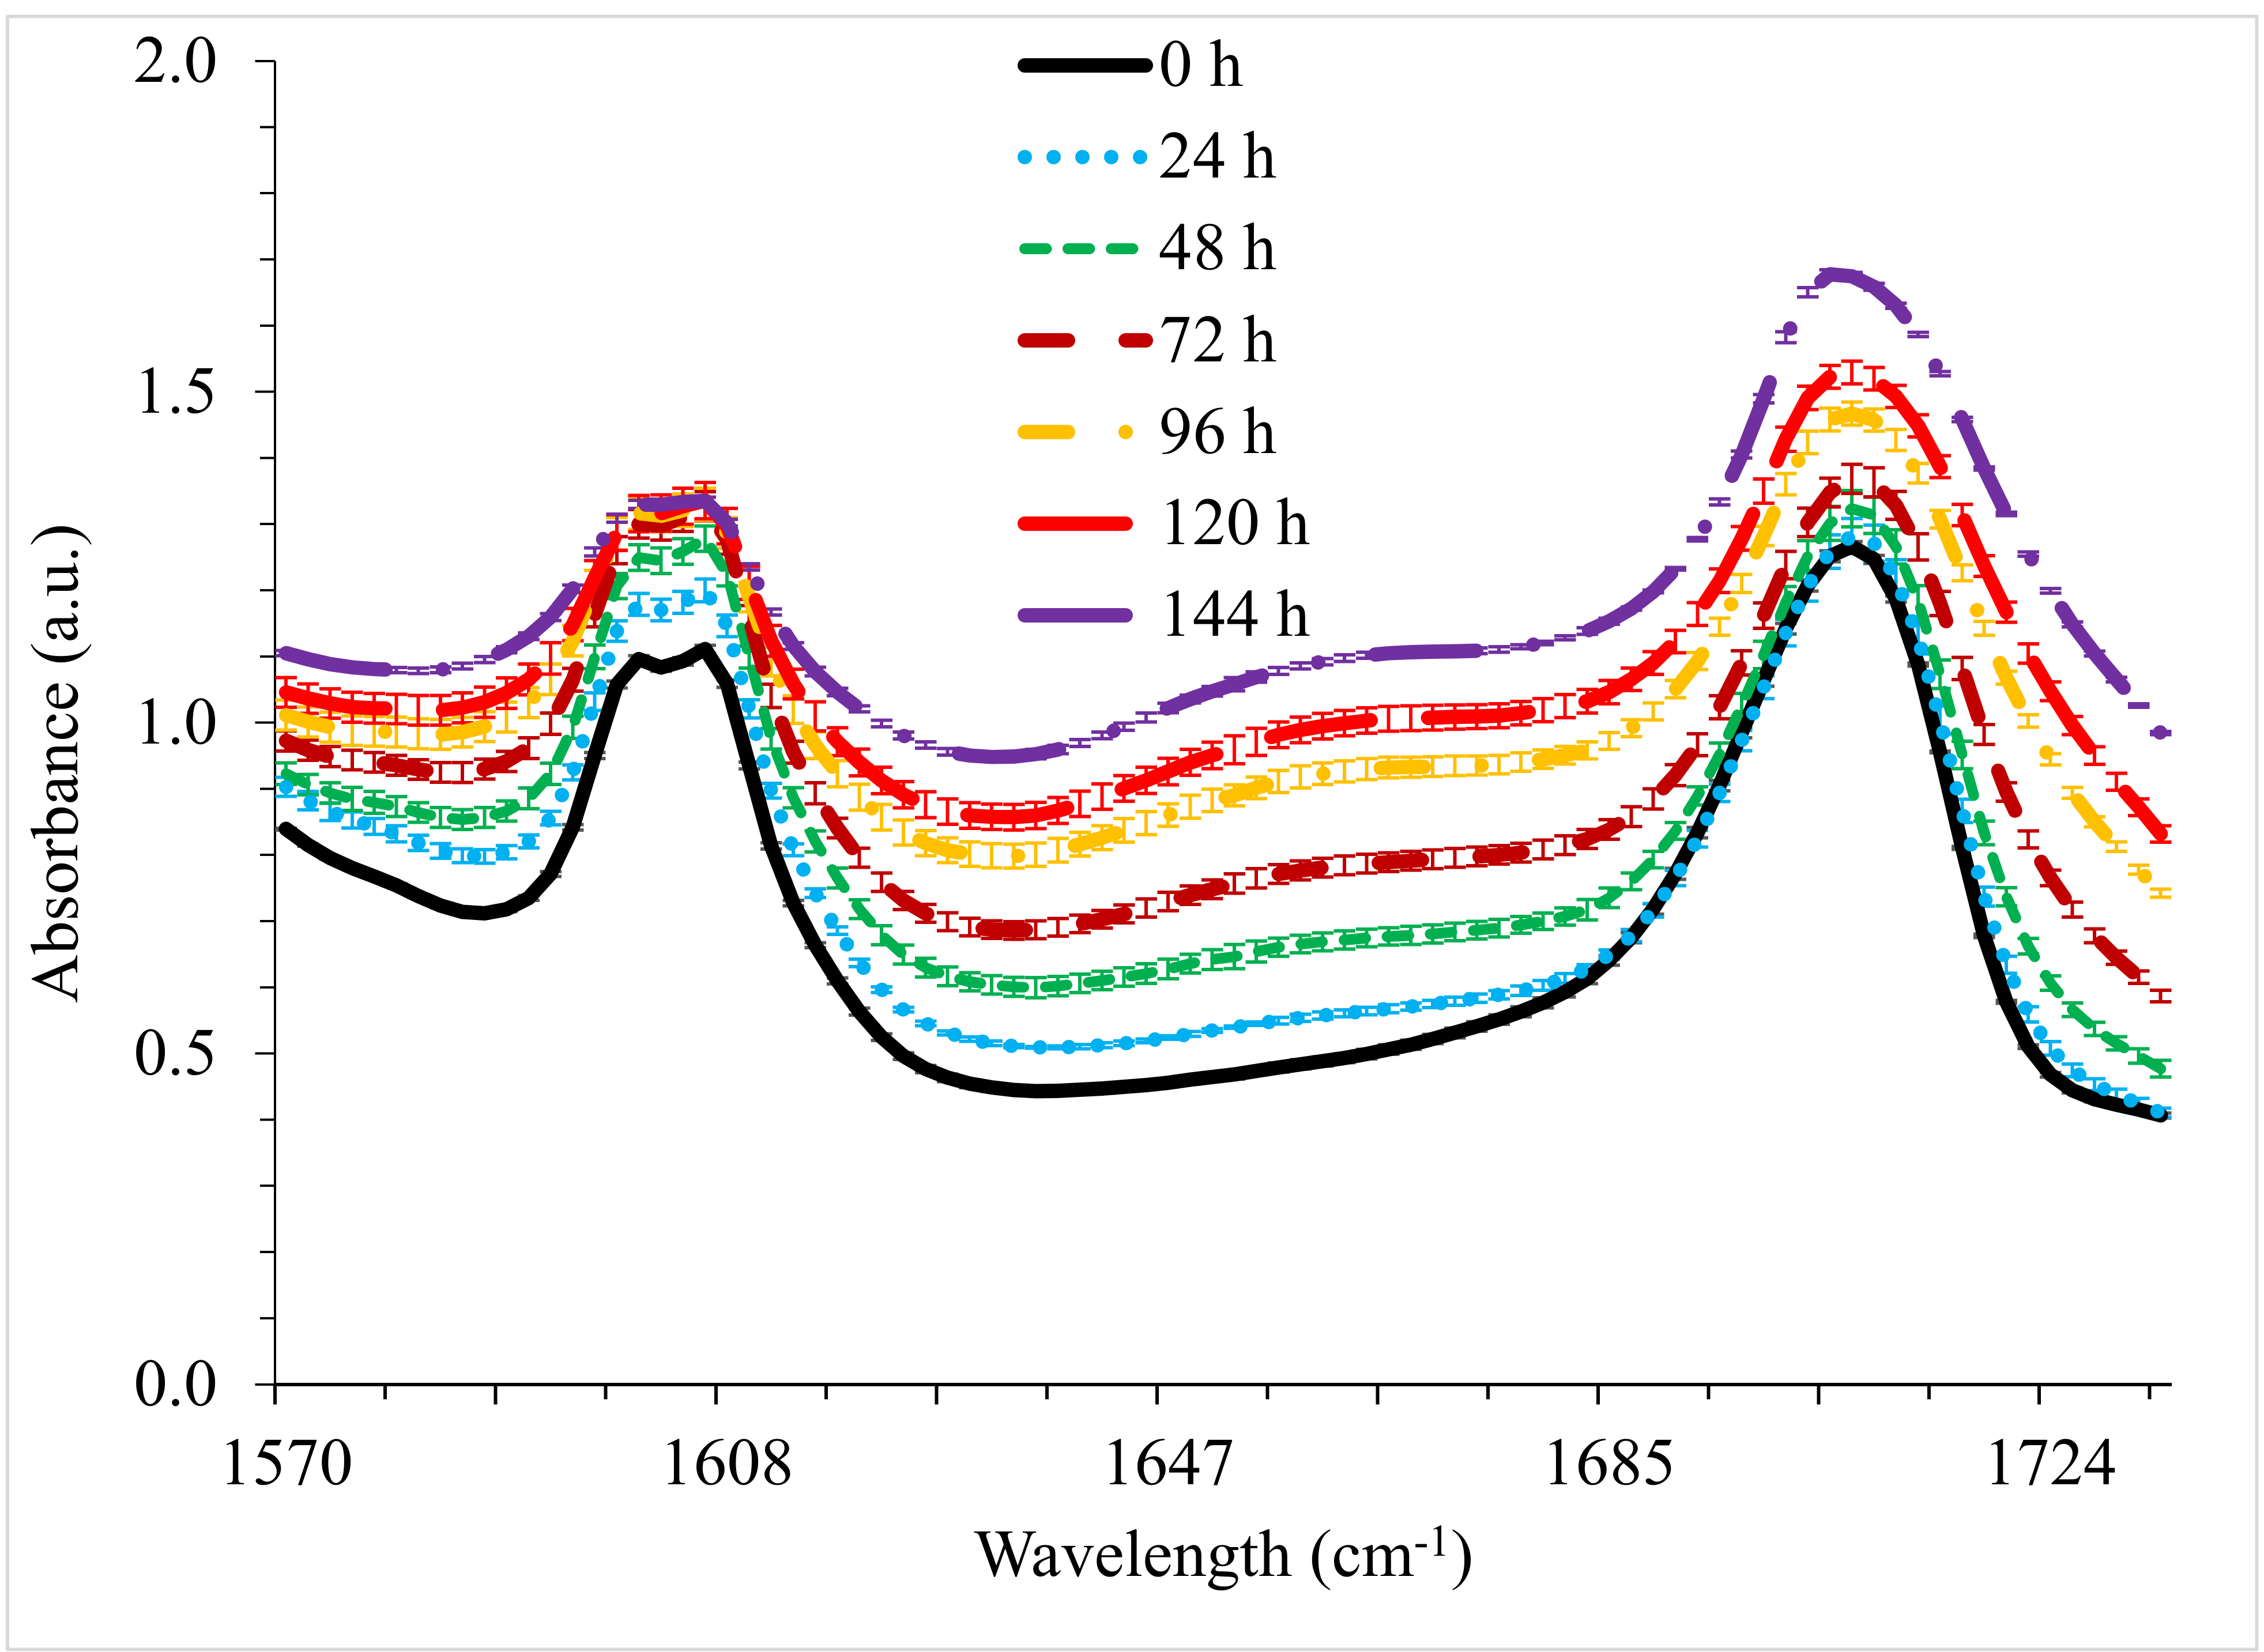
3.2. Comparison with Infrared Spectra

Some studies have looked at using the 400–1100 nm range with Ultraviolet-Visible-Near Infrared (UV-Vis-NIR) spectroscopy to study oil properties [52,53]. One such study attempted to measure insoluble compounds created with double conjugate bonds due to the oxidation process and obtained an r2 value as high as 0.876 [52]. Interestingly, a study using a low-cost IR sensor operating in the range of 800–1100 nm demonstrated that the device could match oxidation degradation with an R2 value as high as 0.8459 and had an R2 value of 0.9139 when comparing their device to a commercially available UV-Vis-NIR spectrometer over a similar range [54]. Others have classified oxidation in the Mid-IR, approaching the NIR, with wavenumbers from 3600–3700 cm−1 associated with antioxidant depletion [47]. Studies of engine oil oxidation using mid-infrared (Mid-IR) spectra have commonly looked at the carbonyl region of the spectrum (1670 cm−1 to 1800 cm−1). Some studies particularly look at the wavenumber 1710 cm−1 in that region for identifying increases in oxidation as more carbonyl compounds form in the oil, such as carboxylic acids [55,56]. One study in particular compared a low-cost IR sensor to a commercial-grade FT-IR spectrometer to measure the oxidation at ~1710 cm−1 and got an R2 value of 0.9866 when comparing the results of the two instruments [56].
In a previous FT-IR study of the same samples used in this study, the absorbance of wavenumbers in the ranges of 1061–1234 and 1570–1734 cm−1 showed excellent separation of all oxidation times [36].
Absorbance for wavenumbers in the range of 1570–1734 cm−1 were charted as shown in Figure 5. This region includes nitration, olefinic absorption, carbonyl compounds, and oxidation [36,48,49,51,57,58].
Absorbance generally increased with oxidation time across this entire region, and three ranges (1572–1593, 1612–1682, and 1711–1730 cm−1) met the criteria for significant differences among all oxidations times. Similar to Figure 4, the relative peaks centered near 1605 and 1705 cm−1 wavenumbers were excluded from the ranges with significant differences among all oxidation times. The 1612–1682 cm−1 region between peaks is of particular interest due to the clear separation of 95% confidence interval bars (see Figure 5).
All twelve replications within each set of oxidation times were remarkably similar to one another over most of the pertinent regions of interest, as shown in Figure 6; an exception to this was that of the noise encountered at the lower limit of the instrument. In Figure 6, a magnified region shows one area of slight variability in the data for the 120 h of oxidation.
The average spectra were Gaussian fitted over the active regions, shown in Figure 7. Figure 8a showing a comparison of the Gaussian curves centered on ~260 nm, and Figure 8b shows a comparison of the Gaussian curves.
Clear separations in all the oxidation levels, along with an increase in amplitude with an increase in oxidation time, are present in the Gaussian curves centered on approximately 260 nm, as shown in Figure 8a. This region in the ultraviolet spectrum is common with aromatic rings, common to lubricating base oils and antioxidant additives [59]. In Figure 8b, the beginning of the inversion is evidenced in the same pattern shown in the actual spectra. However, it is clear that there is a blue shift in the spectra with increasing oxidation rates, which should be attributed in part to the n– π * transition from a decrease in the oxidized samples’ pH is also evident in the TBN of Table 1. As oxidation times increased, multiple conjugated bonds could be broken down, leading to a blue shift in the spectra and a decrease in the absorbance seen in the top three oxidation times.

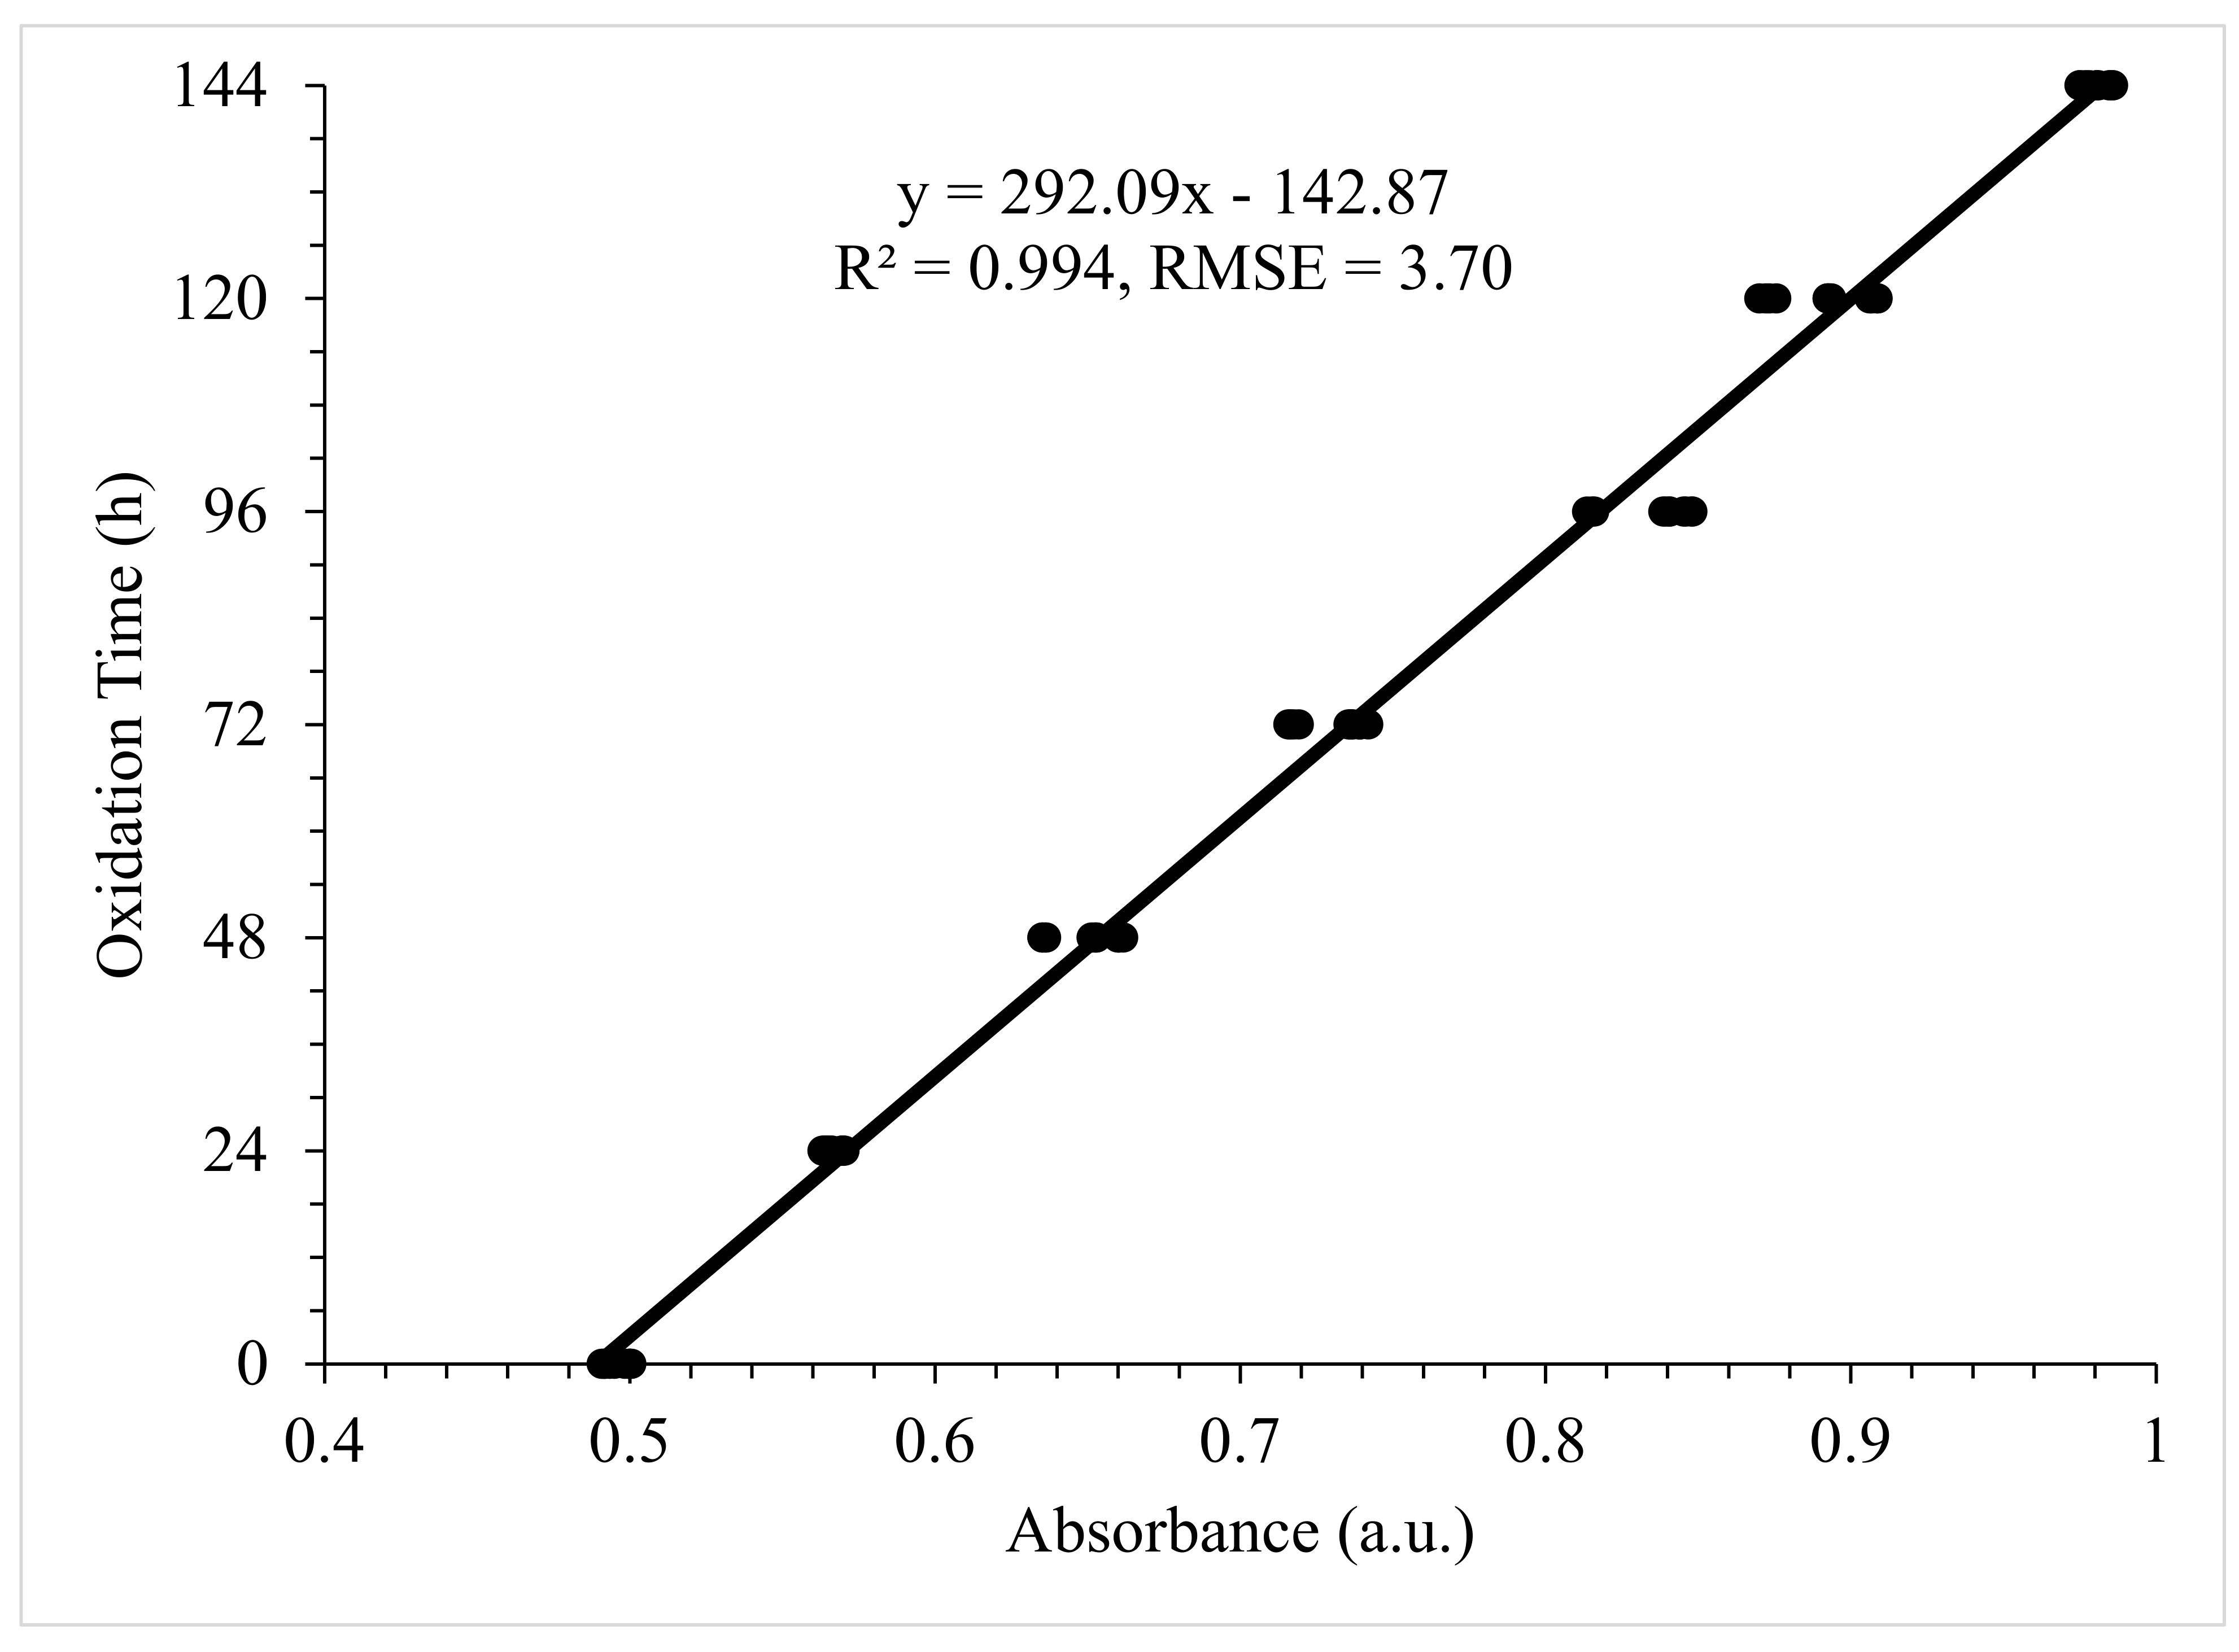
3.3. Predicting Oxidation Time

In the previous FT-IR study, linear regression was applied to each of the selected individual wavenumbers to predict oxidation time based on absorbance. Each of the models was a strong fit with R2 > 0.95. The best model was at wavenumber 1624 cm−1 with R2 = 0.994 and RMSE = 3.70 [39]. RMSE units were hours between oxidation times.
The wavelength ranges with significant differences (per Tukey) among each oxidation time in this UV-Vis study also produced strong models with R2 > 0.95. Wavelength ranges of 259.5–261 nm, 259.5–261.5 nm, 259–262 nm, and 260–261.5 nm around the best single wavelength (260.5 nm) were also evaluated. Of all the wavelength ranges, 260–261.5 nm produced the best model with the highest R2 of 0.9966 with the lowest RMSE of 2.84 (Figure 9). While all of the models were considered very strong, the wavelengths with the best linear models were in the UV-C region.

4. Conclusions

Infrared spectroscopy yields very useful information regarding oil degradation due to oxidation, nitration, additive depletion, and water/coolant infiltration. Since oxidation has been indicated as the leading cause of routine oil degradation, it would be ideal for conducting oxidation measurement inexpensively, easily, and quickly with a clear interpretation of comparable results to typical FT-IR analyses. This could lead to a reduction in excessive engine wear and a reduction of unnecessary oil changes.
Based on this study’s results, correlated with similar findings of a previous FT-IR study on the same oil samples, the use of UV-Vis spectrometry could be employed to distinguish between oxidation levels. Due to the inversion occurring after 270 nm, the distinction would become more complicated with bands in the 270–310 nm region. However, a very distinct separation appears within 245–265 nm, with absorbance directly corresponding to an increase in oxidation time. The narrow range of 260–261.5 nm yielded an R2 value of 0.9966 with a RMSE of 2.84. By comparison, the best model from the previous FT-IR study on the same samples had an R2 value of 0.994 with an RMSE of 3.7.
Due to the relatively low cost, small footprint, lack of sample preparation, quick spectral acquisitions of repeated measurements, and the minuscule sample needed (1   μ L) to perform tests on the oxidized samples, it could be conceivable that a micro-volume UV-Vis spectrophotometer might be employed more ubiquitously to conduct regular oxidation tests, perhaps even with in-situ monitoring. Additional studies should be conducted to determine the ability to reliably delineate among samples with closer oxidized values and determine the detection limits. Nevertheless, the results are very promising, especially considering the similarity of results between the FT-IR spectrometer and the UV-Vis micro-volume spectrometer.

Author Contributions

Conceptualization, T.H., A.M.A.-M., D.G.W. and P.S.; formal analysis, T.H., C.M., R.K., A.M.A.-M., P.S., and D.G.W.; investigation, T.H., P.S. and D.G.W.; methodology, T.H., A.M.A.-M., and P.S.; resources, P.S.; supervision, P.S. and D.G.W.; writing—original draft, T.H., A.M.A.-M., P.S. and D.G.W.; writing—review & editing, T.H., R.K., C.M., A.M.A.-M., P.S., and D.G.W. All authors have read and agreed to the published version of the manuscript.

Funding

This research received no external funding.

Conflicts of Interest

The authors declare no conflict of interest.

References

  1. Macián, V.; Tormos, B.; Gómez, Y.A.; Salavert, J.M. Proposal of an FTIR Methodology to Monitor Oxidation Level in Used Engine Oils: Effects of Thermal Degradation and Fuel Dilution. Tribol. Trans. 2012, 55, 872–882. [Google Scholar] [CrossRef]
  2. Soleimani, M.; Sophocleous, M.; Glanc, M.; Atkinson, J.; Wang, L.; Wood, R.; Taylor, R. Engine oil acidity detection using solid state ion selective electrodes. Tribol. Int. 2013, 65, 48–56. [Google Scholar] [CrossRef] [Green Version]
  3. Faure, D.; Hipeaux, J.C.; Guevellou, Y.; Legros, A. Oxidation stability of gasoline engine lubricants: Effect of base-oil chemistry in laboratory and engine tests. Tribotest 1999, 5, 337–360. [Google Scholar] [CrossRef]
  4. Lansdown, A.R. Lubrication and Lubricant Selection: A Practical Guide, 3rd ed.; New York, NY, USA, 2004. [Google Scholar]
  5. Aikawa, K.; Maruyama, M. Development of an Oil Deterioration Monitoring System by Estimating Base Number. SAE Tech. Pap. Ser. 2007, 116, 1057–1063. [Google Scholar] [CrossRef]
  6. Soleimani, M.; Sophocleous, M.; Wang, L.; Atkinson, J.; Hosier, I.L.; Vaughan, A.S.; Taylor, R.I.; Wood, R.J. Base oil oxidation detection using novel chemical sensors and impedance spectroscopy measurements. Sensors Actuators B: Chem. 2014, 199, 247–258. [Google Scholar] [CrossRef] [Green Version]
  7. Fitch, J. Understanding How Engines Consume Oil; Machinery Lubircation, NORIA. Available online: https://www.machinerylubrication.com/Read/30384/engines-consume-oil (accessed on 27 March 2021).
  8. Carney, D. The Truth Behind Carbon Buildup; Team Valvoline. Available online: https://team.valvoline.com/diy/truth-behind-carbon-buildup (accessed on 27 March 2021).
  9. Tung, S.C.; McMillan, M.L. Automotive tribology overview of current advances and challenges for the future. Tribol. Int. 2004, 37, 517–536. [Google Scholar] [CrossRef]
  10. Khayal, O.M.E.S. ESSENTIALS OF VEHICLE TRIBOLOGY. 2019. [Google Scholar] [CrossRef]
  11. Zavos, A.; Nikolakopoulos, P.; Pantelis, G. Tribology of Piston Rings: From the Design to Applications.; TriboUK, Loughborough University: Loughborough, UK, 2015; Available online: https://www.researchgate.net/publication/273457250_Tribology_of_Piston_Rings_From_the_Design_to_Applications (accessed on 27 March 2021).
  12. Alverson, F.C.; Balfe, S.L.; Skrobul, A.P.; Matulewicz, W.; Dean, S.W. Accelerated Oxidation and Corrosion Testing of Engine Coolants Using a Rotary Pressure Vessel Oxidation Test. J. ASTM Int. 2007, 4, 100366. [Google Scholar] [CrossRef]
  13. Coultas, D.R. The Role of NOx in Engine Lubricant Oxidation. SAE Technical Paper Series 2020, 2, 3009–3016. [Google Scholar] [CrossRef]
  14. Amat, S.; Braham, Z.; Le Dréau, Y.; Kister, J.; Dupuy, N. Simulated aging of lubricant oils by chemometric treatment of infrared spectra: Potential antioxidant properties of sulfur structures. Talanta 2013, 107, 219–224. [Google Scholar] [CrossRef]
  15. Canter, N. Use of Antioxidants in Automotive Lubricants - ProQuest. Tribol. Lubr. Technolgy. 2008, 64, 12–19. [Google Scholar]
  16. Basu, A.; Berndorfer, A.; Buelna, C.; Campbell, J.; Ismail, K.; Lin, Y.; Rodriguez, L.; Wang, S.S. “Smart Sensing” of Oil Degradation and Oil Level Measurements in Gasoline Engines.; SAE Transactions 2000; pp. 2000-01–1366, doi.org/10.4271/2000-01-1366. SAE Transactions 2000, 857–863. [Google Scholar]
  17. D02 Committee Standard Test Method for Base Number of Petroleum Products by Potentiometric Perchloric Acid Titration. ASTM Int. 2015.
  18. Hu, T.; Teng, H.; Luo, X.; Chen, B. Impact of Fuel Injection on Dilution of Engine Crankcase Oil for Turbocharged Gasoline Direct-Injection Engines. SAE Int. J. Engines 2015, 8, 1107–1116. [Google Scholar] [CrossRef]
  19. Agoston, A.; Ötsch, C.; Jakoby, B. Viscosity sensors for engine oil condition monitoring—Application and interpretation of results. Sensors Actuators A: Phys. 2005, 121, 327–332. [Google Scholar] [CrossRef]
  20. Cheek, G.T.; Mowery, R. Determination of antioxidants in lubricating oils using ultramicroelectrodes. Anal. Chem. 1989, 61, 1467–1469. [Google Scholar] [CrossRef]
  21. Dickert, F.L.; Forth, P.; Lieberzeit, P.A.; Voigt, G. Quality control of automotive engine oils with mass-sensitive chemical sensors - QCMs and molecularly imprinted polymers. Anal. Bioanal. Chem. 2000, 366, 802–806. [Google Scholar] [CrossRef]
  22. Duchowski, J.K.; Mannebach, H. A Novel Approach to Predictive Maintenance: A Portable, Multi-Component MEMS Sensor for On-Line Monitoring of Fluid Condition in Hydraulic and Lubricating Systems. Tribol. Trans. 2006, 49, 545–553. [Google Scholar] [CrossRef]
  23. Kauffman, R.E. Development of a Remaining Useful Life of a Lubricant Evaluation Technique. III: Cyclic Voltammetric Methods. Lubir. Eng. 1989, 45, 709–716. [Google Scholar]
  24. Lieberzeit, P.; Glanznig, G.; Leidl, A.; Voigt, N.; Dickert, F. Nanostructured polymers for detecting chemical changes during engine oil degradation. IEEE Sens. J. 2006, 6, 529–535. [Google Scholar] [CrossRef]
  25. Moon, S.-I.; Paek, K.-K.; Lee, Y.-H.; Kim, J.-K.; Kim, S.-W.; Ju, B.-K. Multiwall Carbon Nanotube Sensor for Monitoring Engine Oil Degradation. Electrochem. Solid-State Lett. 2006, 9, H78. [Google Scholar] [CrossRef]
  26. Price, R.J.; Clarke, L.J. Chemical sensing of amine antioxidants in turbine lubricants. Analyst 1991, 116, 1121–1123. [Google Scholar] [CrossRef]
  27. Frassa, K.A.; Siegfriedt, R.K.; Houston, C.A. Modern Analytical Techniques to Establish Realistic Crankcase Drains. SAE Tech. Pap. Ser. 1965, 1, 650139. [Google Scholar] [CrossRef]
  28. Foster, N.; Amonette, J.; Autrey, T.; Ho, J. Detection of trace levels of water in oil by photoacoustic spectroscopy. Sensors Actuators B Chem. 2001, 77, 620–624. [Google Scholar] [CrossRef]
  29. Borin, A.; Poppi, R.J. Application of mid infrared spectroscopy and iPLS for the quantification of contaminants in lubricating oil. Vib. Spectrosc. 2005, 37, 27–32. [Google Scholar] [CrossRef]
  30. Ahmad, I.; Ullah, J.; Ishaq, M.; Khan, H.; Gul, K.; Siddiqui, S.; Ahmad, W. Monitoring of oxidation behavior in mineral base oil additized with biomass derived antioxidants using FT-IR spectroscopy. RSC Adv. 2015, 5, 101089–101100. [Google Scholar] [CrossRef]
  31. Guan, L.; Feng, X.; Xiong, G.; Xie, J. Application of dielectric spectroscopy for engine lubricating oil degradation monitoring. Sens. Actuators A Phys. 2011, 168, 22–29. [Google Scholar] [CrossRef]
  32. Rahimi, B.; Semnani, A.; Nezamzadeh-Ejhieh, A.; Langeroodi, H.S.; Davood, M.H. Monitoring of the Physical and Chemical Properties of a Gasoline Engine Oil during Its Usage. J. Anal. Methods Chem. 2012, 2012, 1–8. [Google Scholar] [CrossRef] [PubMed] [Green Version]
  33. Van De Voort, F.R.; Sedman, J.; Cocciardi, R.A.; Pinchuk, D. FTIR Condition Monitoring of In-Service Lubricants: Ongoing Developments and Future Perspectives. Tribol. Trans. 2006, 49, 410–418. [Google Scholar] [CrossRef]
  34. Holland, T.; Abdul-Munaim, A.M.; Watson, D.G.; Sivakumar, P. Importance of Emulsification in Calibrating Infrared Spectroscopes for Analyzing Water Contamination in Used or In-Service Engine Oil. Lubricants 2018, 6, 35. [Google Scholar] [CrossRef] [Green Version]
  35. Guide to Measuring Oil Chemistry: Nitration, Oxidation, and Sulfation, Spectro Scientific, White Paper. Available online: https://www.spectrosci.com/resource-center/lubrication-analysis/literature/e-guides/guide-to-measuring-oxidation-nitration-and-sulfation-in-oil/ (accessed on 2 April 2021).
  36. Abdul-Munaim, A.M.; Holland, T.; Sivakumar, P.; Watson, D.G. Absorption Wavebands for Discriminating Oxidation Time of Engine Oil as Detected by FT-IR Spectroscopy. Lubricants 2019, 7, 24. [Google Scholar] [CrossRef] [Green Version]
  37. Holland, T.; Abdul-Munaim, A.M.; Watson, D.G.; Sivakumar, P. Influence of Sample Mixing Techniques on Engine Oil Contamination Analysis by Infrared Spectroscopy. Lubricants 2019, 7, 4. [Google Scholar] [CrossRef] [Green Version]
  38. Aller, M.M.; Abdul-Munaim, A.M.; Watson, D.G.; Preu, S. Error Sources and Distinctness of Materials Parameters Obtained by THz-Time Domain Spectroscopy Using an Example of Oxidized Engine Oil. Sensors 2018, 18, 2087. [Google Scholar] [CrossRef] [Green Version]
  39. Abdul-Munaim, A.M.; Reuter, M.; Abdulmunem, O.M.; Balzer, J.C.; Koch, M.; Watson, D.G. Using Terahertz Time-Domain Spectroscopy to Discriminate among Water Contamination Levels in Diesel Engine Oil. Trans. ASABE 2016, 59, 795–801. [Google Scholar] [CrossRef] [Green Version]
  40. Conceição, J.N.; Marangoni, B.S.; Michels, F.S.; Oliveira, I.P.; Passos, W.E.; Trindade, M.A.; Oliveira, S.L.; Caires, A.R. Evaluation of molecular spectroscopy for predicting oxidative degradation of biodiesel and vegetable oil: Correlation analysis between acid value and UV–Vis absorbance and fluorescence. Fuel Process. Technol. 2019, 183, 1–7. [Google Scholar] [CrossRef]
  41. Ricca, M.; Foderà, V.; Vetri, V.; Buscarino, G.; Montalbano, M.; Leone, M. Oxidation Processes in Sicilian Olive Oils Investigated by a Combination of Optical and EPR Spectroscopy. J. Food Sci. 2012, 77, C1084–C1089. [Google Scholar] [CrossRef]
  42. Zhou, J.; Xiong, Y.; Gong, Y.; Liu, X. Analysis of the oxidative degradation of biodiesel blends using FTIR, UV–Vis, TGA and TD-DES methods. Fuel 2017, 202, 23–28. [Google Scholar] [CrossRef]
  43. Vasconcelos, M.D.S.; Passos, W.E.; Lescanos, C.H.; De Oliveira, I.P.; Trindade, M.A.G.; Caires, A.R.L.; Muzzi, R.M. Fluorescence Spectroscopy Applied to Monitoring Biodiesel Degradation: Correlation with Acid Value and UV Absorption Analyses. J. Anal. Methods Chem. 2018, 2018, 1–11. [Google Scholar] [CrossRef] [Green Version]
  44. Leong, Y.S.; Ker, P.J.; Jamaludin, M.Z.; Nomanbhay, S.M.; Ismail, A.; Abdullah, F.; Looe, H.M.; Lo, C.K. UV-Vis Spectroscopy: A New Approach for Assessing the Color Index of Transformer Insulating Oil. Sensors 2018, 18, 2175. [Google Scholar] [CrossRef] [Green Version]
  45. Macián, V.; Tormos, B.; Ruiz, S.; García-Barberá, A. An Alternative Procedure to Quantify Soot in Engine Oil by Ultraviolet-Visible Spectroscopy. Tribol. Trans. 2019, 62, 1063–1071. [Google Scholar] [CrossRef]
  46. Kramer, D.C.; Ziemer, J.N.; Cheng, M.T.; Fry, C.E.; Reynolds, R.N.; Lok, B.K.; Sztenderowicz, M.L.; Krug, R.R. INFLUENCE OF GROUP II & III BASE OIL COMPOSITION ON VI AND OXIDATION STABILITY; Tucson, AZ, USA, 1999. [Google Scholar]
  47. Wolak, A.; Krasodomski, W.; Zając, G. FTIR analysis and monitoring of used synthetic oils operated under similar driving conditions. Frict. 2020, 8, 995–1006. [Google Scholar] [CrossRef]
  48. Offunne, G.; Maduako, A.; Ojinnaka, C. Studies on the ageing characteristics of automotive crankcase oils. Tribol. Int. 1989, 22, 401–404. [Google Scholar] [CrossRef]
  49. Ofunne, G.; Maduako, A.; Ojinnaka, C. High temperature oxidation stability of automotive crankcase oils and their base oils. Tribol. Int. 1990, 23, 407–412. [Google Scholar] [CrossRef]
  50. Egharevba, F.; Maduako, A.U.C. Assessment of Oxidation in Automotive Crankcase Lube Oil: Effects of Metal and Water Activity. Ind. Eng. Chem. Res. 2002, 41, 3473–3481. [Google Scholar] [CrossRef]
  51. D02 Committee Standard Practice for Condition Monitoring of In-Service Lubricants by Trend Analysis Using Fourier Transform Infrared (FT-IR) Spectrometry; ASTM International: West Conshohocken, PA, USA, 2018.
  52. Villar, A.; Fernández, S.; Gorritxategi, E.; Ciria, J.I.; Fernández, L.A. Optimization of the multivariate calibration of a Vis–NIR sensor for the on-line monitoring of marine diesel engine lubricating oil by variable selection methods. Chemom. Intell. Lab. Syst. 2014, 130, 68–75. [Google Scholar] [CrossRef]
  53. Villar, A.; Gorritxategi, E.; Otaduy, D.; Ciria, J.I.; Fernandez, L.A. Chemometric methods applied to the calibration of a Vis–NIR sensor for gas engine’s condition monitoring. Anal. Chim. Acta 2011, 705, 174–181. [Google Scholar] [CrossRef] [PubMed]
  54. Shinde, H.M.; Bewoor, A.K. Evaluating petrol engine oil deterioration through oxidation and nitration parameters by low-cost IR sensor. Appl. Petrochem. Res. 2020, 10, 83–94. [Google Scholar] [CrossRef]
  55. Kovac, O.; Sikuljak, D.; Evdic, T.; Vujica, J. The Influence of Biodiesel on Engine Oil Properties When Conducting High-Temperature Engine Test. Gomabn 2015, 54, 20–31. [Google Scholar]
  56. Agoston, A.; Schneidhofer, C.; Dörr, N.; Jakoby, B. A concept of an infrared sensor system for oil condition monitoring. e i Elektrotech. Inf. Tech. 2008, 125, 71–75. [Google Scholar] [CrossRef]
  57. Nguele, R.; Al-Salim, H.S.; Sasaki, K. Degradation Mechanisms and Additive Depletion. J. Multi. Eng. Sci. Technol. 2015, 2, 6. [Google Scholar]
  58. Moehle, W.E.; Cobb, T.W.; Schneller, E.R.; Gatto, V.J. Utilizing the TEOST MHT®to Evaluate Fundamental Oxidation Processes in Low-Phosphorus Engine Oils. Tribol. Trans. 2007, 50, 96–103. [Google Scholar] [CrossRef]
  59. Soleimani, M.; Dehabadi, L.; Wilson, L.D.; Tabil, L.G. Antioxidants Classification and Applications in Lubricants. In Lubrication - Tribology, Lubricants and Additives; IntechOpen: London, UK, 2018. [Google Scholar]
Figure 1. Depiction of equipment used to oxidize fresh engine oil thermally.
Lubricants 09 00037 g001
Figure 2. Mean absorbance values from UV-Vis spectrophotometer for each oxidation time, with 95% confidence intervals of shaded bands, across the entire wavelength range of 190.5–849.5 nm. The spectra were compressed after 450 nm since it is of little interest beyond that wavelength.
Lubricants 09 00037 g002
Figure 3. Absorbance means of seven oxidation times, with 95% confidence intervals of shaded bands, across the 220–310 nm range.
Lubricants 09 00037 g003
Figure 4. Absorbance means of seven oxidation times, with 95% confidence intervals, across the 825–1080 wavenumber range [36].
Lubricants 09 00037 g004
Figure 5. Absorbance means of seven oxidation times, with 95% confidence intervals, across the 1570–1734 cm−1 wavenumber range that includes several ranges of significance among each of the oxidation times [36].
Lubricants 09 00037 g005
Figure 6. Spectra of all 12 replications of each oxidation time plotted together to demonstrate the similarity of each replication with a magnified region.
Lubricants 09 00037 g006
Figure 7. Gaussian curve fitted spectra of 144 h of oxidation. The solid lines under the dashed red line curve are the Gaussian curves, and the dashed red line is the summation of these curves, approximating the given spectra.
Lubricants 09 00037 g007
Figure 8. (a) Gaussian curves centered on ~260 nm (known for aromatic rings) for the different oxidation times. (b) Gaussian curve fitting for the different oxidation times. Error bars were deemed inconsequentially small even at 120 h.
Lubricants 09 00037 g008
Figure 9. Absorbance at 260.5 nm wavelength predicting oxidation time with a linear model.
Lubricants 09 00037 g009
Table 1. Commercial analysis of oxidized engine oil with testing lab expecting repeatability of results to be ±10%.
Oxidation Time (h)TBN (mg KOH g−1)Viscosity (mm2 s−1)
07.244.98
246.447.67
485.046.04
724.549.38
963.949.68
1203.449.25
1441.853.27
Publisher’s Note: MDPI stays neutral with regard to jurisdictional claims in published maps and institutional affiliations.

