1. Introduction
Several standards have been developed to establish grease performance and load carrying capability [
1,
2,
3,
4]. Both good [
5] and poor correlation [
6] has been reported within the different methods using similar lubricants. These have been explained by either similarities or differences between the contact geometries, configurations, and scuffing detection criteria. One such method, the four-ball tester [
1,
7] having high precision, has been widely used to manage lubricants’ batch production quality control. It has helped scientists to select additives, both conventional as well an environment friendly nanoparticle, for extreme pressure, wear prevention and antifriction grease behavior [
5,
8,
9]. Often, short duration four ball tests of 10 s or 60 s is found to be effective in determining the competing effect of additive molecules in surface deposition, tribofilm formation and protection against friction, seizure, and wear. These short duration test methods are standardized and frequently validated by D02 committee in ASTM—American Standards for Testing Materials. ASTM D2596-15 and ASTM D2783-15 are such test methods that are widely practiced by lubricant manufacturers to determine the extreme pressure (EP) behavior of greases. These standards offer vital information about seizure prevention by EP additives at a given load that is known as “weld load” [
1]. Almost every grease specification sheet carries the four ball weld load data, as it is intended to help the consumers to choose the best grease to prevent seizure of critical components under starved lubrication conditions. Therefore, weld load data is important for both the grease consumers and manufacturers, with a higher weld load indicating better capability against failure. However, this critical data could be “manipulated” within the scope of ASTM D2596-15 or D2783-15, and it can “trick” the consumers to use the lubricant that can be detrimental to critical components.
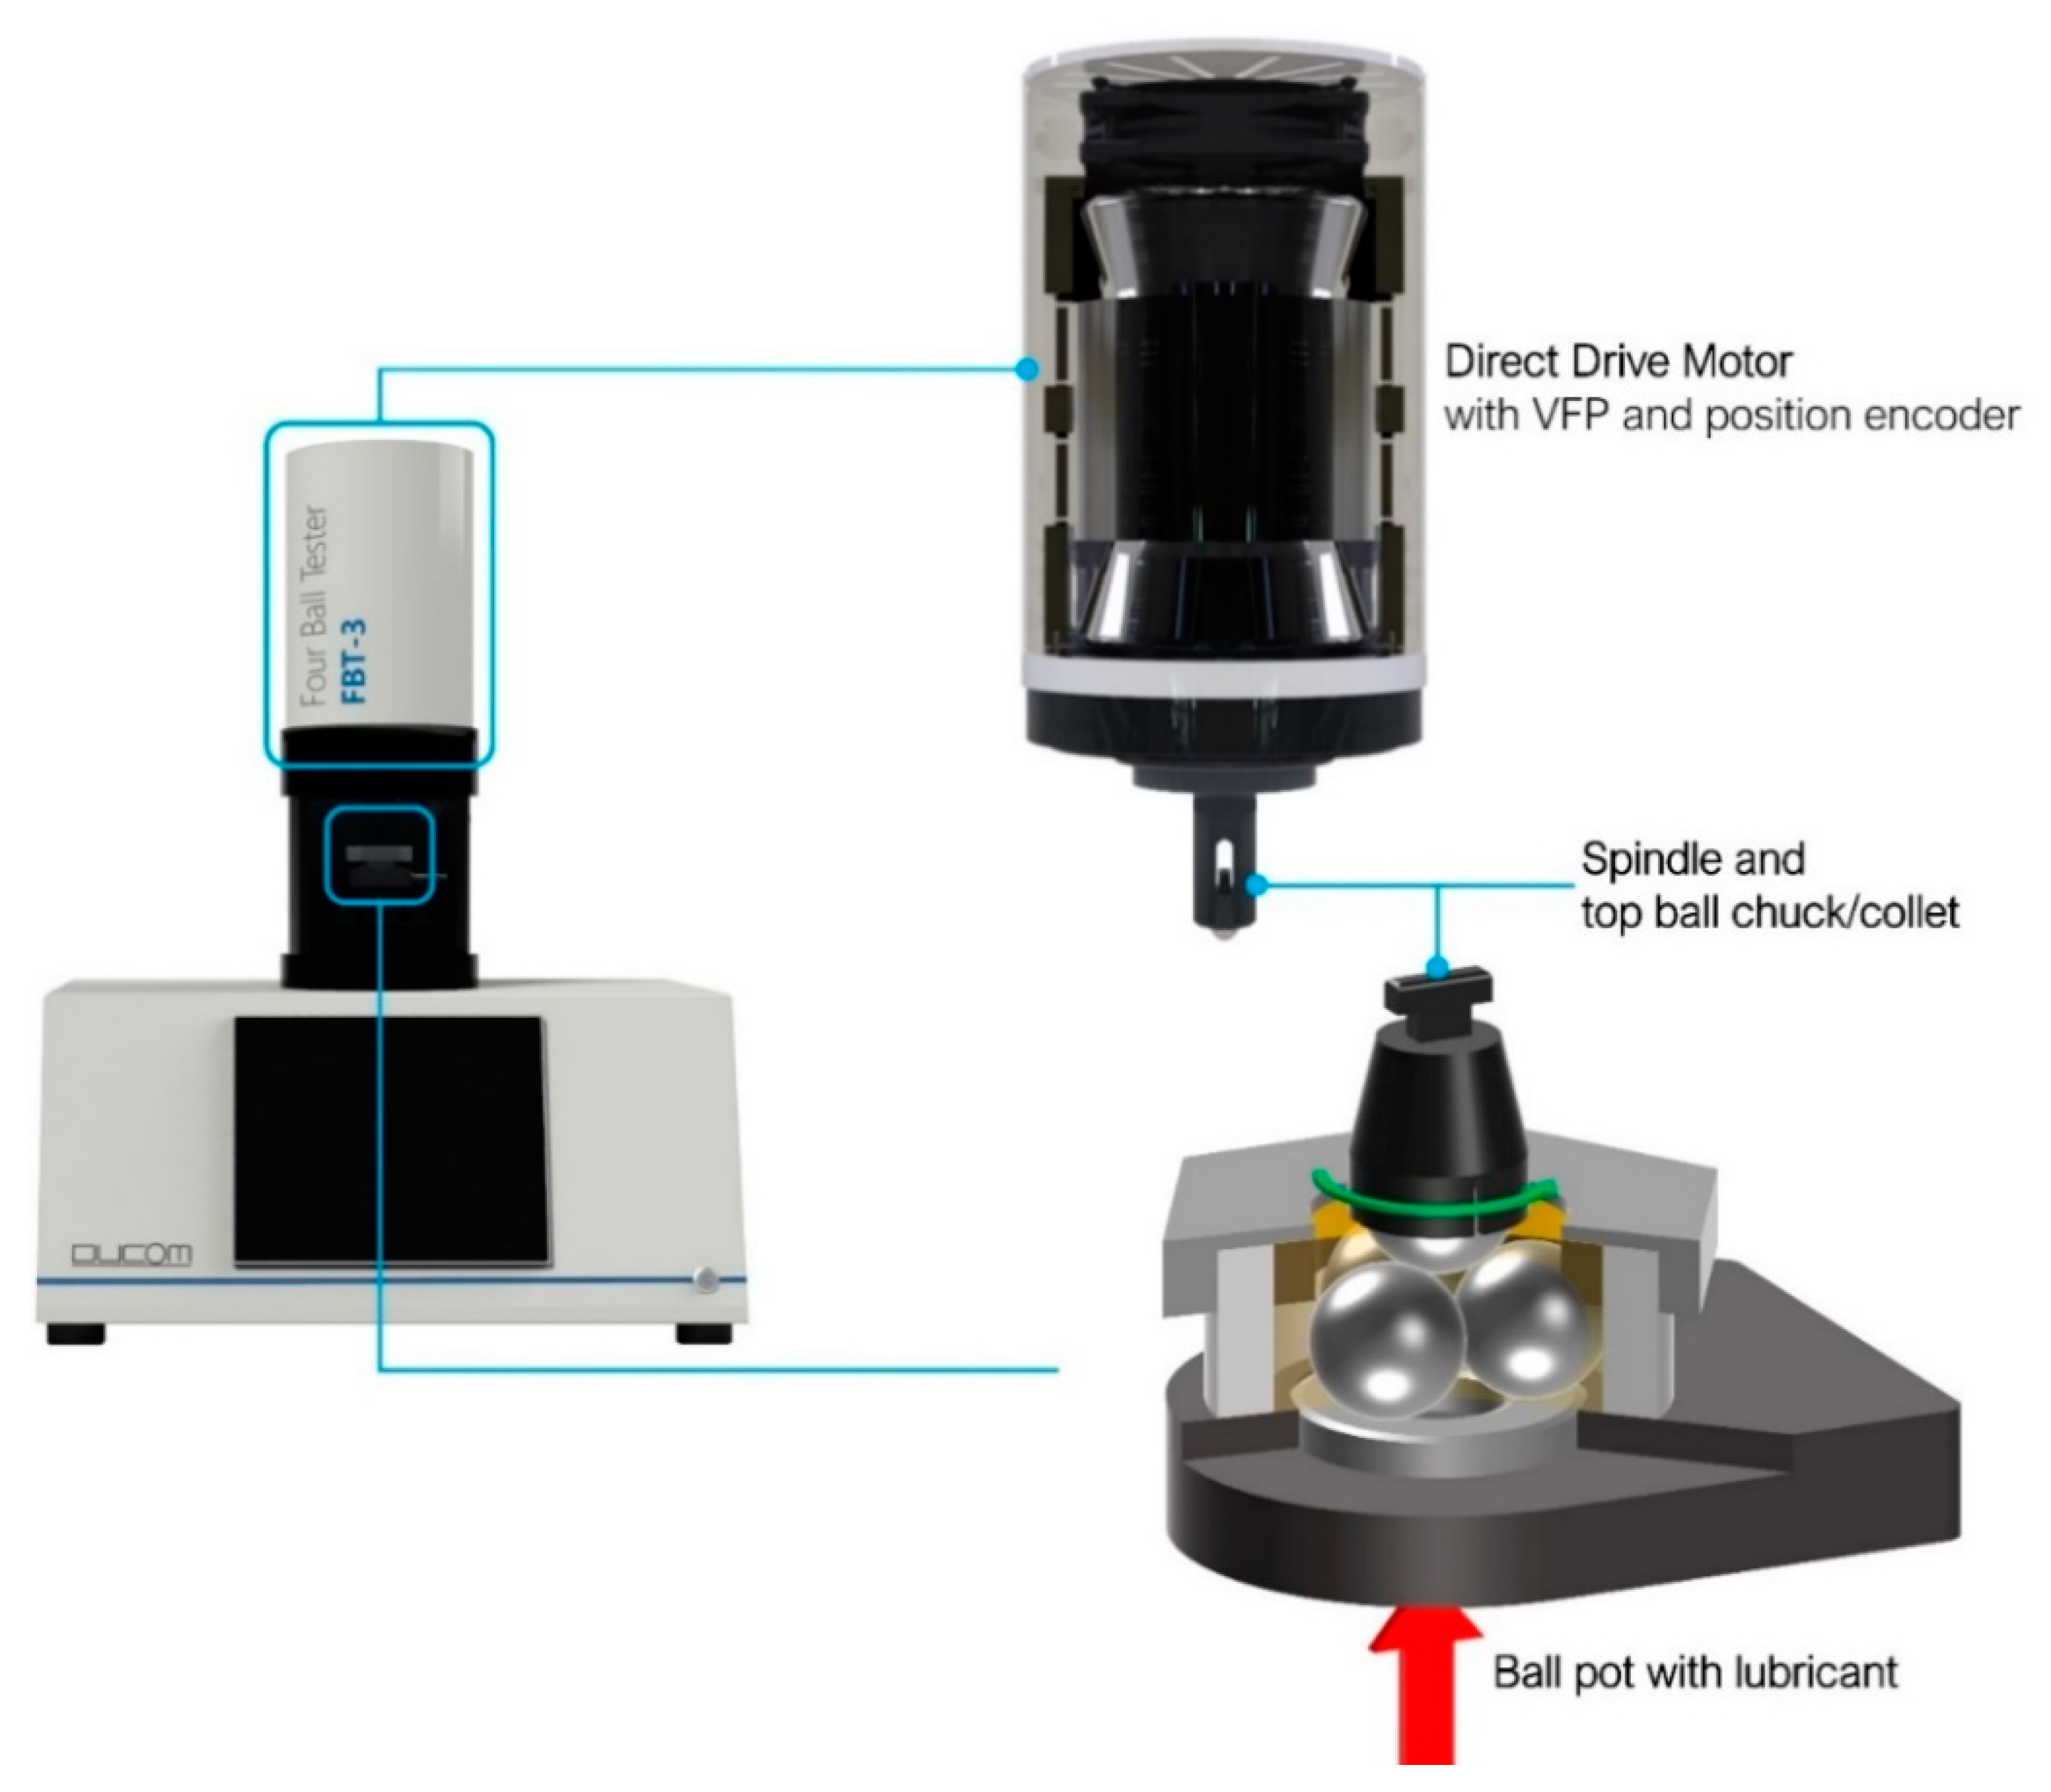
In ASTM standards like D2596 or D2783 the lubricant is compressed and sheared between the four balls (top ball and three bottom balls) for 10 s (see
Figure 1). The mean speed of the top ball is fixed at 1770 rpm. This test is repeated at every load stage from 6 kg to 800 kg or until the full seizure.
Seizure is represented by the sudden jump in the motor torque due to melting and fusion of steel balls followed by welding of four balls. To achieve higher weld load the lubricants are formulated with high performing EP additives [
5]. In contrary, the desired weld load could also be achieved by tuning the speed “ramp up time” in the four-ball tester. Speed ramp up time is the delay in time taken to reach the mean speed of 1770 rpm. Although the mean speed is described in the ASTM standards, the ramp up time is not mentioned, that could result in fictitious grease lubrication performance. There have been four ball test reports that showed effect of speed on grease wear [
10] and effect of delay in applied load on lubricant scuffing loads [
11]. However, there are no reports on the effect of ramp up time on grease seizure load or weld load.
In this study, we have developed a four-ball test method to control and measure the speed ramp up time or delay in motor speed in the four-ball tester, whose effect on weld load, friction and wear is investigated for two types of greases. And we propose mechanisms that can explain the changes in weld load and friction due to delay in reaching the mean speed.
2. Materials and Methods
2.1. Greases
Two commercial high weld load greases that can offer protection against wear, scuffing and pitting in gear drives were used in this study. These greases are labelled as grease X and grease Y. Both the greases were NLGI grade 00, they had same density of 0.92 g/cc at 20 °C, kinematic viscosity of 500 cSt at 100 °C, flash point greater than 200 °C, thermal stability of tribofilms was equal to 120 °C and FZG scuffing load stage was equal to or better than 12. There was no information about composition of extreme pressure additives used in these greases. And it is not critical for this study because we are focused on consequences of the test method on grease lubrication behavior. Moreover, we are not investigating lubrication mechanism based on the composition of greases.
2.2. Controlling the Speed Ramp Up Time and Load in a Four-Ball Tester
Computer controlled and automated four ball tester (Model–FBT3) from Ducom Instruments
TM (Groningen, The Netherlands) was used in this study (see
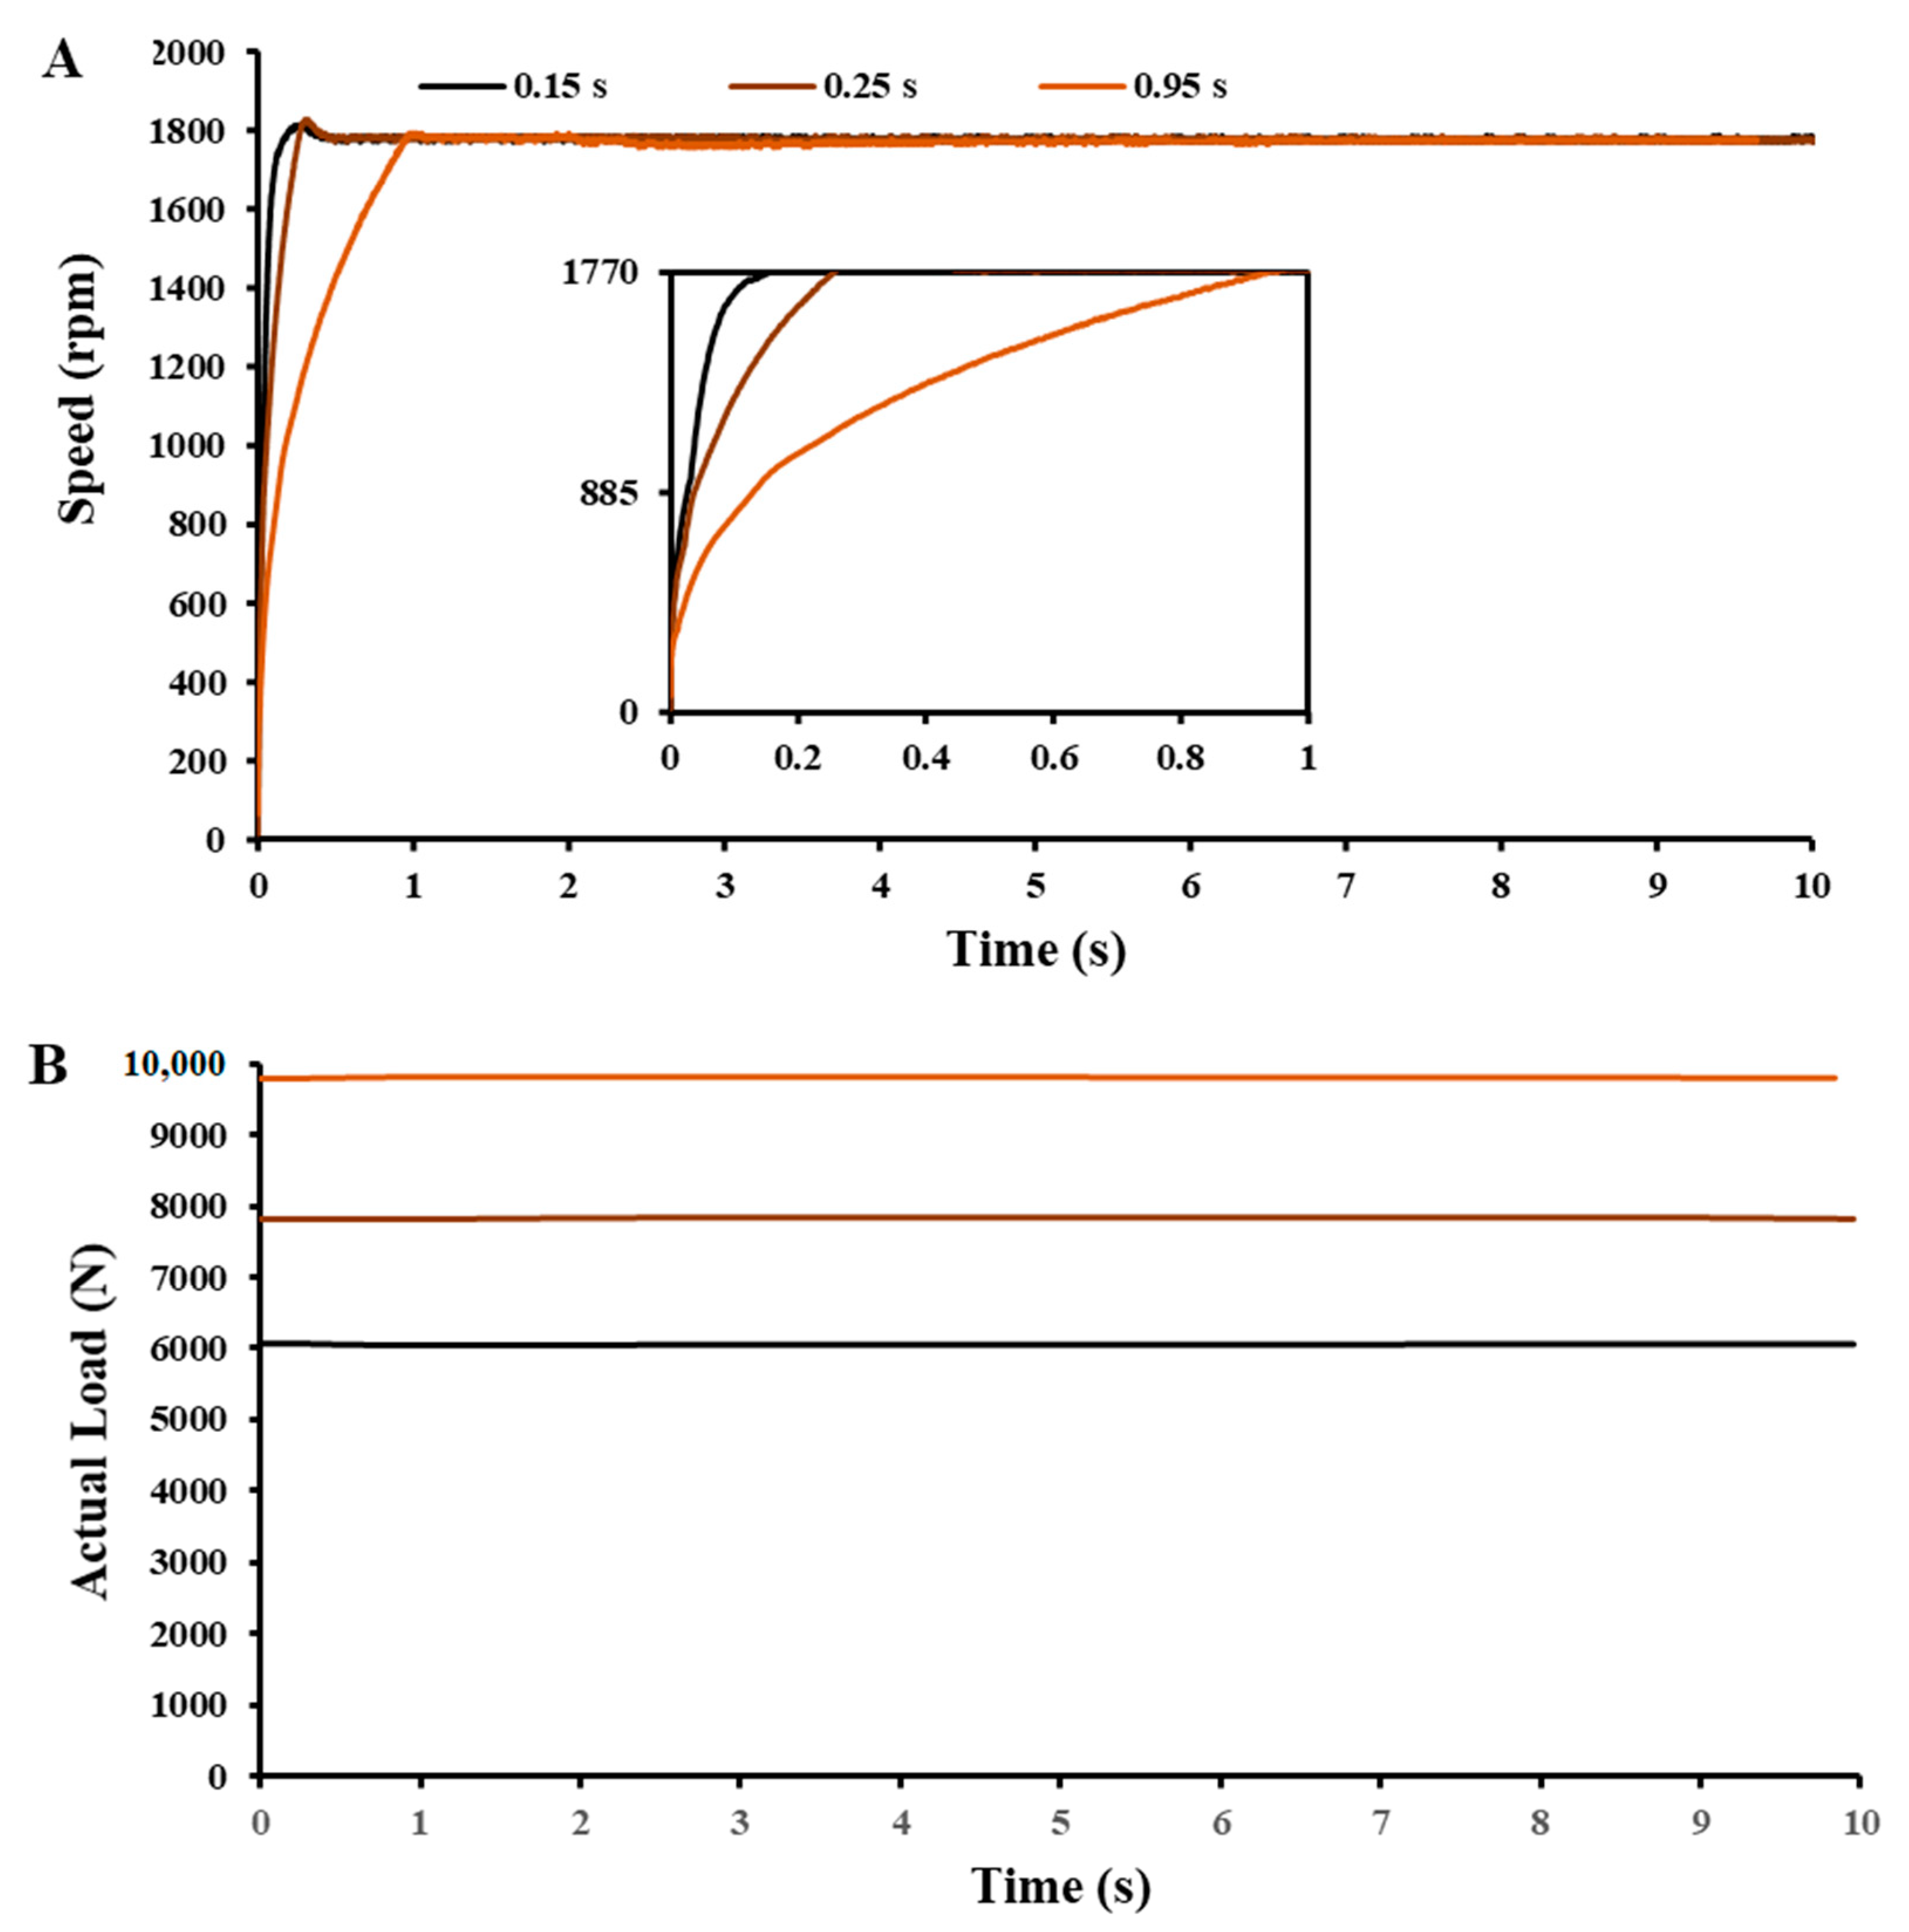
Figure 1). A variable speed direct drive motor without any belt or pulley arrangements was used to control the speed between 300 rpm to 3000 rpm. Speed ramp up time, that is time delay in motor speed to reach 1770 rpm starting from 0 rpm was controlled using the position encoders. Position encoders can precisely identify the angular position of the spindle in the motor. And they were in closed loop with the variable frequency drive system that controlled the flow of current to the motor, and the motor speed. Variable frequency drive ensures that the speed ramp up time is not affected by starting motor torque that is crucial for ASTM D2596. The direct drive motor without any gear box was compatible with peak load of 10,000 N, to sustain maximum torque at zero speed. Safety controls were used to prevent the overflow of current to the motor at the peak torque operating conditions. The labview based WinDucom software was used to set the desired speed ramp up time for each test. In this study we chose speed ramp up time 0.15 s, 0.25 s and 0.95 s, that is the time delay for motor to reach a preset mean speed of 1770 rpm (see
Figure 2A). The above time intervals were chosen considering the motor capabilities and technology used in commercial four ball testers.
The data acquisition and display system in WinDucom software allowed the user to view and store the real time changes in speed profiles.
Ducom four ball tester is equipped with an automated pneumatic loading system that can control the actual load between 100 N to 10,000 N. The standard error at 10,000 N was ±20 N or 0.2%. The test balls were preloaded to a desired load at zero rpm and the load was maintained stable during the spindle rotation for the entire test duration of 10 s and at all the different speed ramp up time (see
Figure 2B). The data acquisition and display system in WinDucom software allowed the user to view and store the real time changes in load profiles.
2.3. Pass Load and Weld Load
According to ASTM D2596, the grease is packed into the ball pot with three stationary steel balls (supplied by SKF, E-52100, with diameter of 12.7 mm, Grade 25 extra polish, hardness 65 to 66 HRC) at a temperature of 27 ± 8 °C, the top steel ball connected to the motor is brought in contact with the bottom three steel balls at a fixed load. The top steel ball rotates at a mean speed of 1770 ± 60 rpm for a test duration of 10 s. If there was no welding of the test balls, the load is increased to the next load step, using a look up chart for load steps given in the ASTM D2596.
The weld load is the load step at which the test balls local temperature reached the melting point of steel, that fused the four balls. At this point the friction torque sensor in the four-ball tester exceeds the safety value and shuts down the motor. This represents the failure by grease lubricants to prevent seizure. The load step prior to the weld load is the pass load. The pass load represents the state of the grease lubricant after incipient seizure and before the full seizure. The pass load and weld load for grease X and Y was measured at a speed ramp up time of 0.15 s, 0.25 s, and 0.95 s. There were new steel balls used for each test.
The cleaning procedures in this study followed the ASTM D2596.
2.4. Ball Mean Wear Scar Diameter and Corrected Load
At every pass load there is severe wear on the three test balls in the ball pot. The mean value of the wear scar diameter on these three test balls can be measured using a microscope to determined ball mean wear scar diameter. The corrected load is a pass load that is compensated with the wear. It is calculated by multiplying the pass load with the ratio of Hertzian contact diameter to ball mean wear scar diameter. The corrected load was determined for grease X and Y at a speed ramp up time of 0.15 s, 0.25 s, and 0.95 s.
2.5. Friction Coefficient
The friction measuring system in the four-ball tester has been extensively described in the US patent US 2017/0176319 A1. Friction torque was measured using a load cell, that was in contact with the moment arm fixed to the ball pot in the four-ball tester. Coefficient of friction was calculated from the measured friction torque and applied load as per ASTM D5183 [
12] The data acquisition and display system in WinDucom software allowed the user to view and store the real time changes in friction coefficient profiles. The average friction coefficient was calculated by determining the mean of all the friction coefficient values acquired during a pass load test for grease X or grease Y.
3. Results
3.1. Changes in Pass Load, Corrected Load, and Weld Load
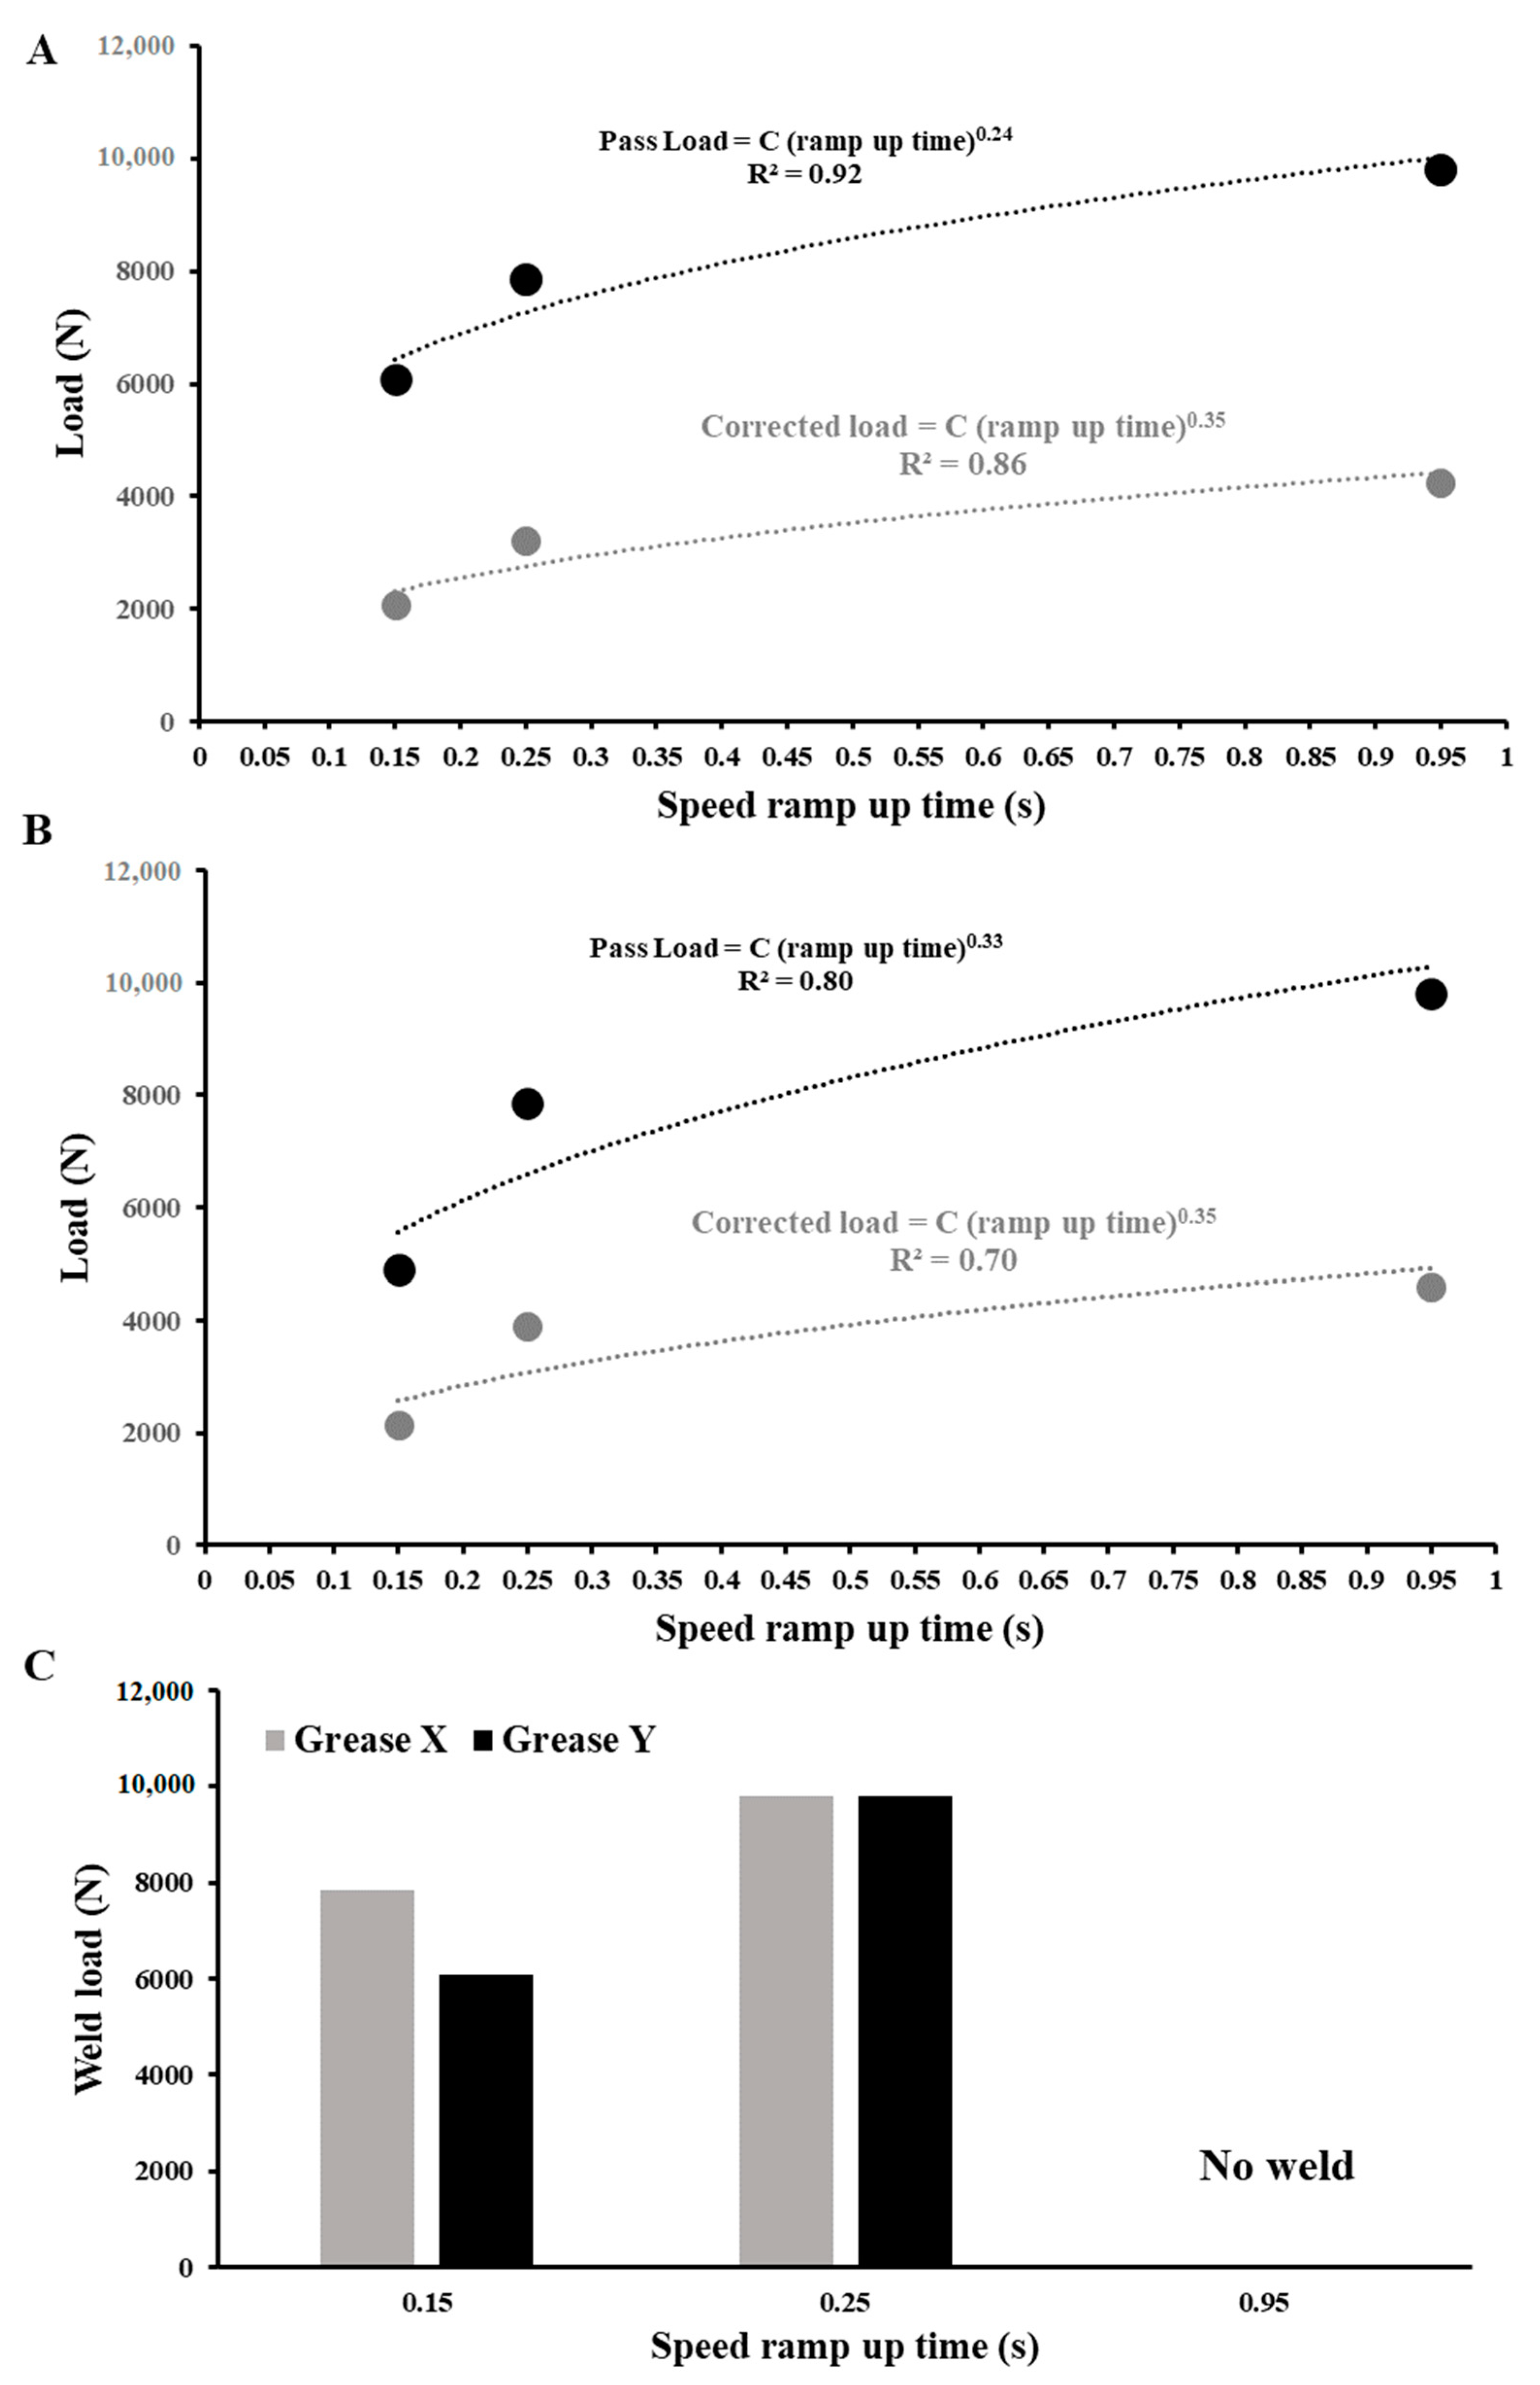
Speed ramp up time had an influence on the pass load, corrected load and weld load of grease X and Y (see
Figure 3). As shown in
Figure 3A, the pass load and corrected load increased with an increase in ramp up time, they were in power-law relationship for grease X. A similar trend was observed for grease Y however the power law relationship was weaker compared to grease X (see
Figure 3B). As shown in
Figure 3C, the weld load for grease X was 7848 N, and the grease Y had a lower weld load of 6082 N, at the ramp up time of 0.15 s. At higher ramp up time of 0.25 s, that is a tenth of second delay in motor speed, the grease X and Y had the same weld load of 9810 N. Grease X and Y had passed maximum load of 9810 N in the four-ball tester at a speed ramp up time of 0.95 s.
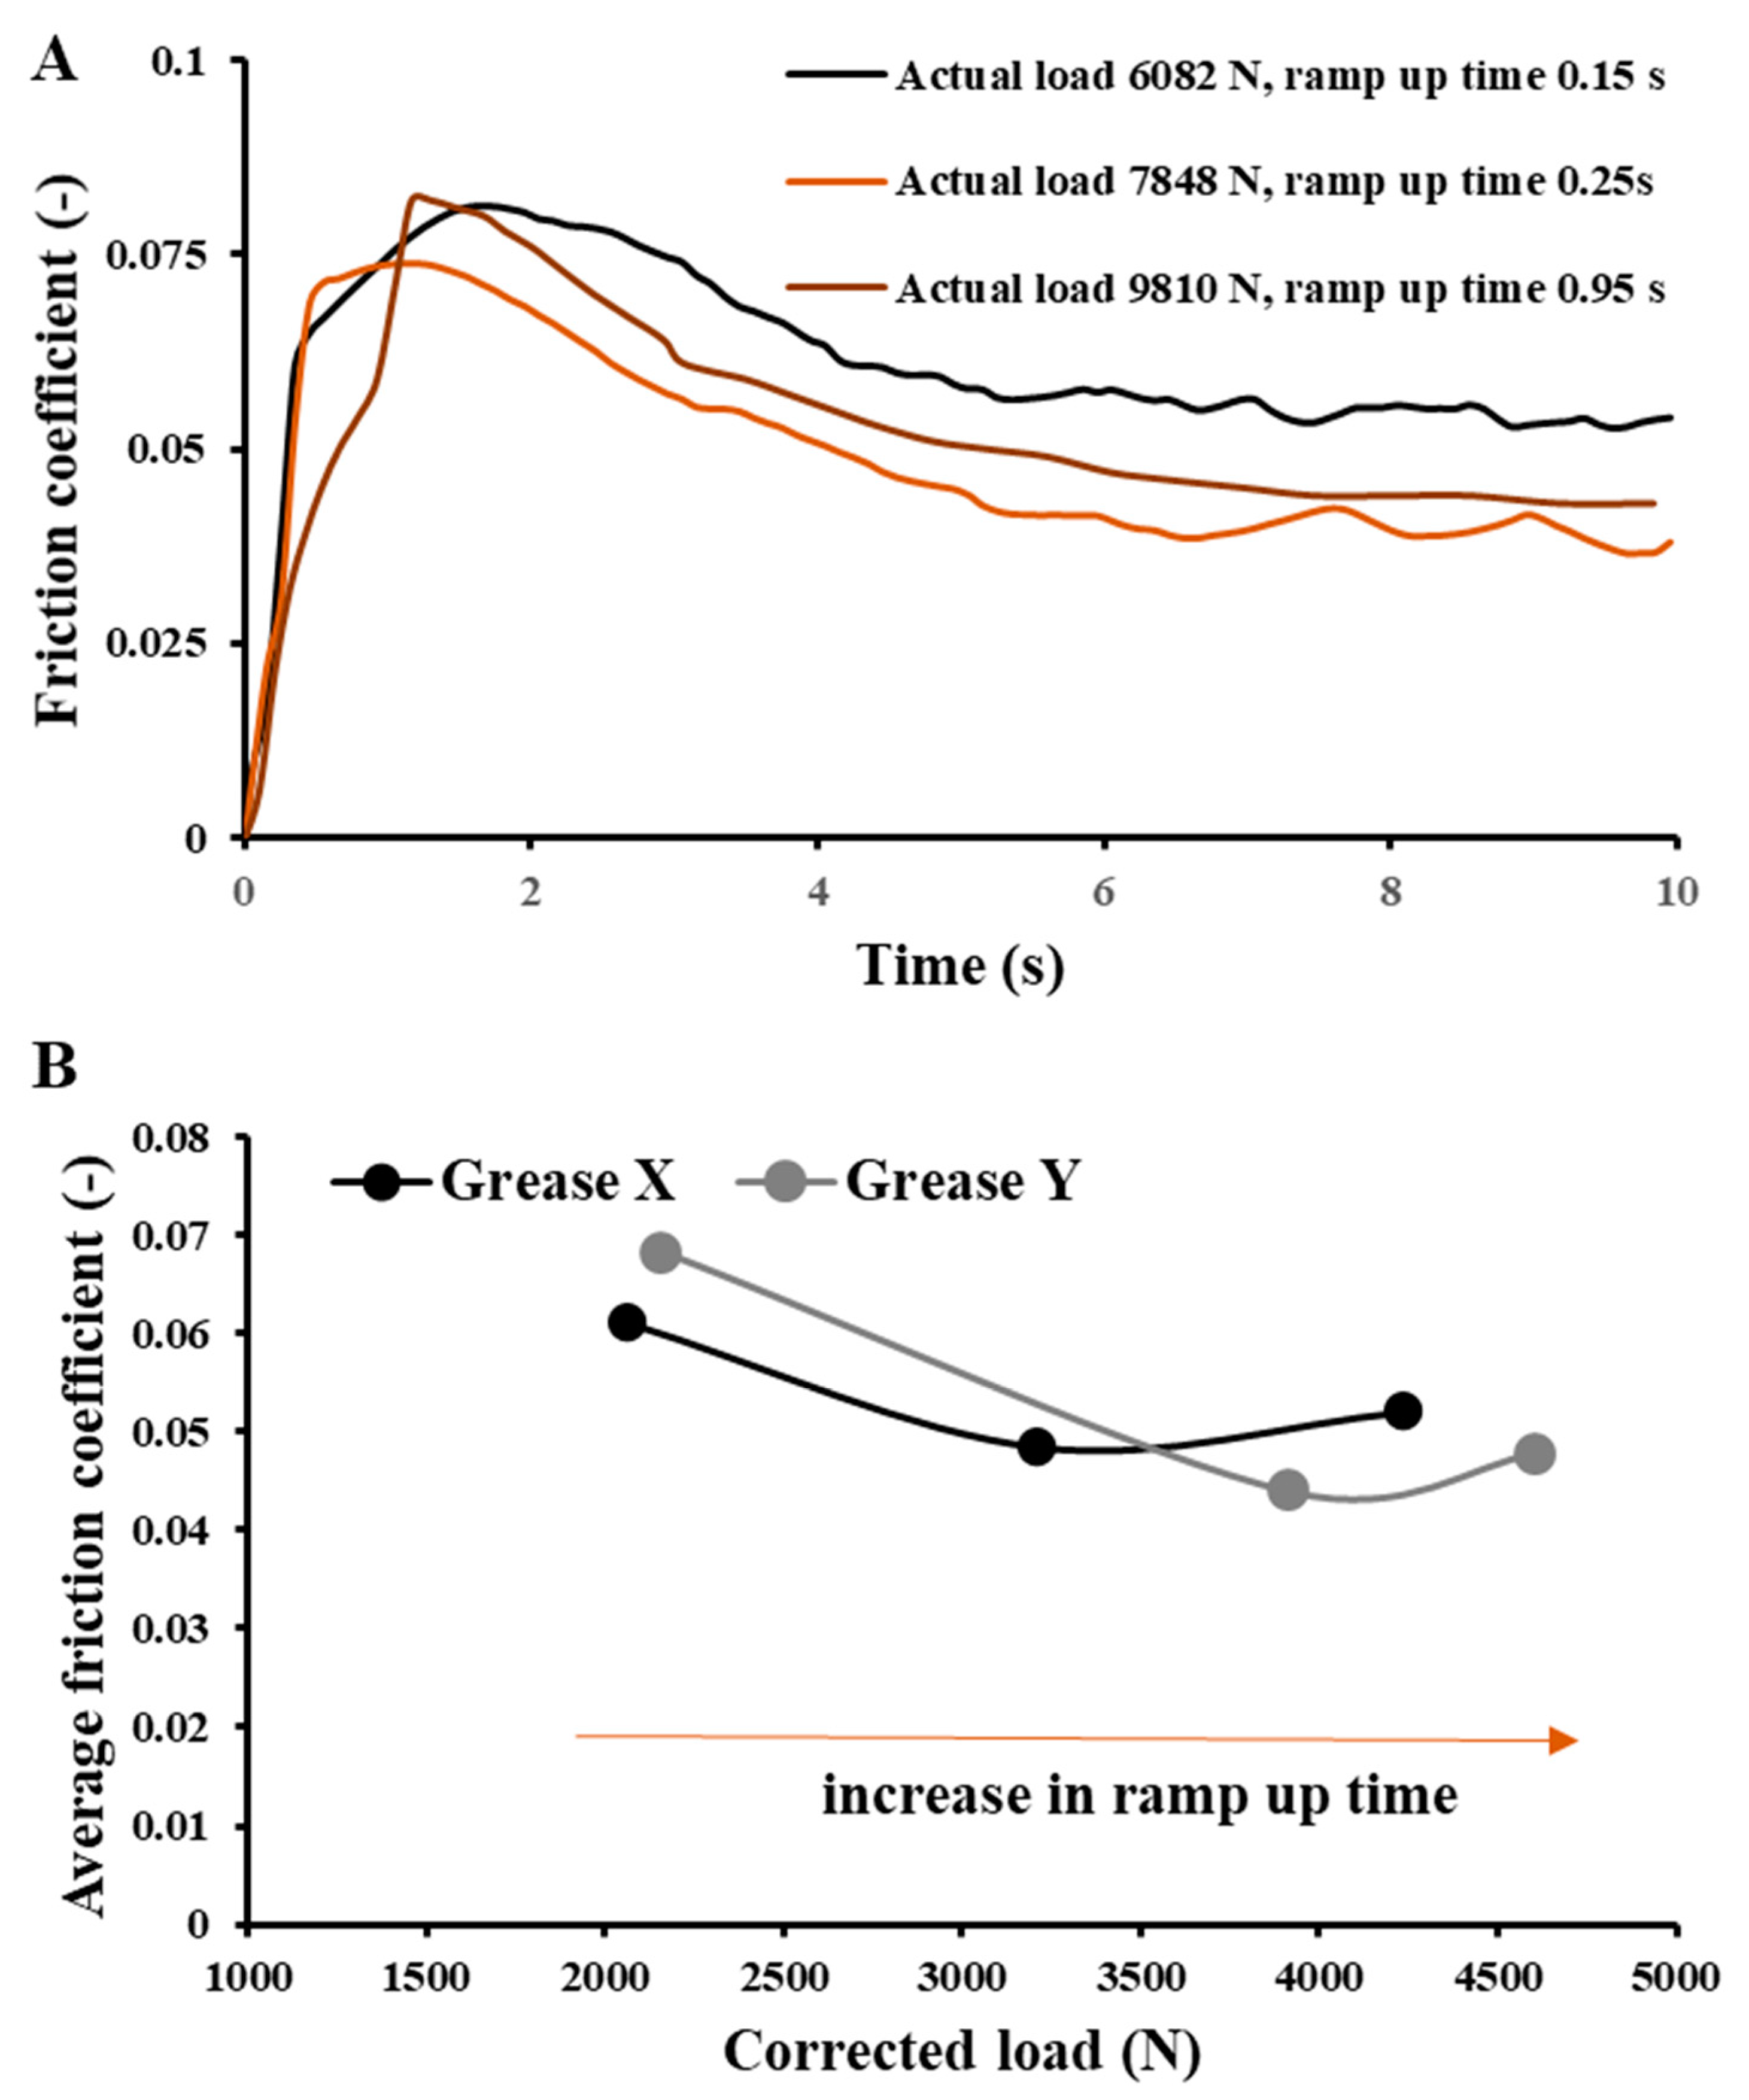
3.2. Changes in Friction Coefficient
Friction coefficient for the greases was in the range of 0.04 to 0.07, and it was affected by the changes in corrected load driven by changes in the speed ramp up time (see
Figure 4). As shown in
Figure 4A, the friction coefficient increased and then decreased before reaching a stable plateau. The average friction coefficient for grease X and Y decreased as there was an increase in corrected load, that was driven by an increase in speed ramp up time (see
Figure 4B).
4. Discussion
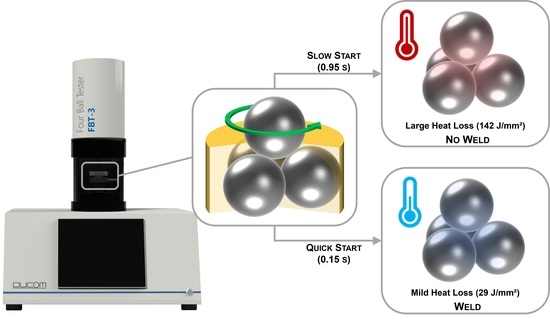
This is the first study that has experimentally shown that the grease performance as determined by weld load and friction coefficient can be influenced by the speed ramp up time or delay in motor speed—an unknown four-ball test parameter until now. It is fascinating to see that a tenth of second delay in motor attaining the mean speed of 1770 rpm, that is an increase in speed ramp up time from 0.15 s to 0.25 s, had increased the weld load and decreased the friction coefficient for both the greases. Grease weld load represents the inability of EP additives in grease to form a stress activated antiseizure tribofilms that resist sudden rise of local temperature on the steel balls. Seizure occurs when the local flash temperature, reaches the melting point of steel (approximately 1400 °C) resulting in welding of four steel balls [
13,
14]. A tenth of a second delay in attaining the mean speed means the local temperature is still below the melting point temperature of steel. Therefore, we observed an increase in weld load at higher speed ramp up time. It was possible to never reach the local melting point temperature of steel at a speed ramp up time of 0.95 s. This can be attributed to the timescale over which heat is built-up and dissipated that becomes more important than overall energy available at the contact, referred to as friction power intensity [
15]. The frictional power loss (units of J/s·mm
2) and heat dissipation rate (units of J/mm
2) differ with the dissipation rate accounting for the timescale the contact is subject to the available frictional power. The frictional power loss and dissipation rate were calculated using the available data in the four-ball tester:
- (1)
Applied load is equal to 8000 N. The actual normal contact force between all the balls is 9798 N (refer to the
Appendix A.1 and
Appendix A.2)
- (2)
Spindle rotation is equal to 1770 rpm. This translates to actual sliding speed of 0.678 m/s. (refer to the
Appendix A.1 and
Appendix A.2)
- (3)
An average friction coefficient value of 0.05 was used based on the data presented in
Figure 3A,B and the
Appendix A.5 for calculation of coefficient of friction in a four-ball tester.
- (4)
Initial Hertzian contact diameter, per contact is 0.826 mm. (Normal load of 3266 N per ball, Poisson ratio of 0.27 and elastic modulus of 205 GPa were used). Hence, the total initial contact area for all three balls is 1.61 mm2.
Frictional power loss per contact area (for all three balls) is [coefficient of friction × actual normal force × sliding velocity]/(total contact area), that results in 206 J/s·mm2.
In
Figure 2A (inset) the ramp up time to reach the maximum speed was different, which implies that the available frictional power of 206 J/s·mm
2, was dissipated at different rates for the three different speed ramp-up time.
Dissipated heat or heat flow at different ramp-up time can be calculated using the linear method (frictional power × ramp-up time) and the integral of the area within the curve depicted in
Figure 2. Please refer to
Table 1 for the heat dissipation rates. Both the methods indicate that there was a severe increase in loss of heat (5 times) as the speed ramp up time was increased from 0.15 s to 0.95 s. Thus, the available heat was not adequate for the local conditions to reach to the critical flash temperatures at higher ramp up time thereby leading to a higher weld load. Unfortunately, there are no tools to measure the local temperature rise in a four-ball tester that could have helped us to experimentally confirm this hypothesis.
Antiseizure tribofilms formed on the steel surface depends on the type of additive composition in the greases. Grease Y that had poor resistance to seizure compared with grease X had demonstrated a better behavior and it was equal to grease X. This was again triggered by a tenth of a second delay in motor speed. It was interesting to observe that performance of antiseizure tribofilms in grease Y was highly exaggerated by increasing the speed ramp up time compared to grease X. This is an evidence that the tribofilms can react differently to the speed ramp up time. Although it is interesting to investigate the physicochemical nature of these tribofilms, the focus of this paper has been limited to demonstrating the changes in lubricants performance.
Lubricity of grease as determined by friction coefficient was also exaggerated by speed ramp up time. A tenth of a second delay in motor speed had showed a tremendous improvement in grease friction. This can be attributed to an increase in corrected load. At higher load the steel surface and tribofilms are subjected to extreme pressure conditions that can decrease their surface roughness, that could have resulted in decrease in the friction [
16]. In line with this mechanism the grease Y that had higher corrected load compared to grease X also showed lower friction compared to grease X.
5. Conclusions
ASTM D2596 was developed with an understanding that seizure prevention by EP lubricants is largely affected by factors like actual load, ball diameter, sliding speed, lubricant temperature and friction that were directly accountable for changes in local temperature. Therefore, it makes sense that these parameters were well described in the standard. However, this study shows that
Antiseizure and friction performance of grease were improved without modifying the grease chemistry by using the most unknown four-ball test parameter called the speed ramp up time
Furthermore, it will be crucial to mention the speed ramp up time along with the weld load in the grease data sheet.
It is important to revise the standard to include the speed ramp up time that had a significant influence on seizure prevention by EP lubricants.
Author Contributions
Conceptualization, D.H.V.; methodology, D.H.V., D.P. and S.K.J.; software, A.D.; validation, D.H.V., D.P. and S.K.J.; formal analysis, D.H.V., D.P. and S.K.J.; investigation, D.H.V., D.P. and S.K.J.; resources, A.D.; data curation, D.H.V., D.P. and S.K.J.; writing—original draft preparation, D.H.V.; writing—review and editing, D.P.; visualization, D.H.V.; supervision, D.H.V. and D.P.; project administration, D.H.V.; funding acquisition, A.D. All authors have read and agreed to the published version of the manuscript.
Funding
This research received no external funding.
Institutional Review Board Statement
Not applicable.
Informed Consent Statement
Not applicable.
Acknowledgments
The authors would like to thank Channabasappa from Kluber Lubrication (Mysore, India) for helping us in selection of high weld load greases and Fabio Alemanno from Ducom Instruments for creating the graphical abstract.
Conflicts of Interest
The authors declare no conflict of interest.
Appendix A. Calculation of Actual Load, Sliding Speed and Coefficient of Friction in Four-Ball Tester
Appendix A.1. Calculation of Subtended Angle in Four Ball Tetrahedral Configuration via CAD Method
For calculating the contact radius of the ball interface, we must know the vertical contact angle, (θ) subtended between the top ball and the bottom three balls. Refer to the image for details. The angle is derived via 3d CAD-based assembly measurements.
Details of the steps used to arrive at the angle are illustrated in the images on the right-hand side.
Figure A1.
Illustration of four ball assembly in four-ball tester.
Figure A1.
Illustration of four ball assembly in four-ball tester.
The first image shows a typical 4-ball assembly as it manifests on a four ball testerHere all the four balls are of identical diameters and measure 12.7 mm.
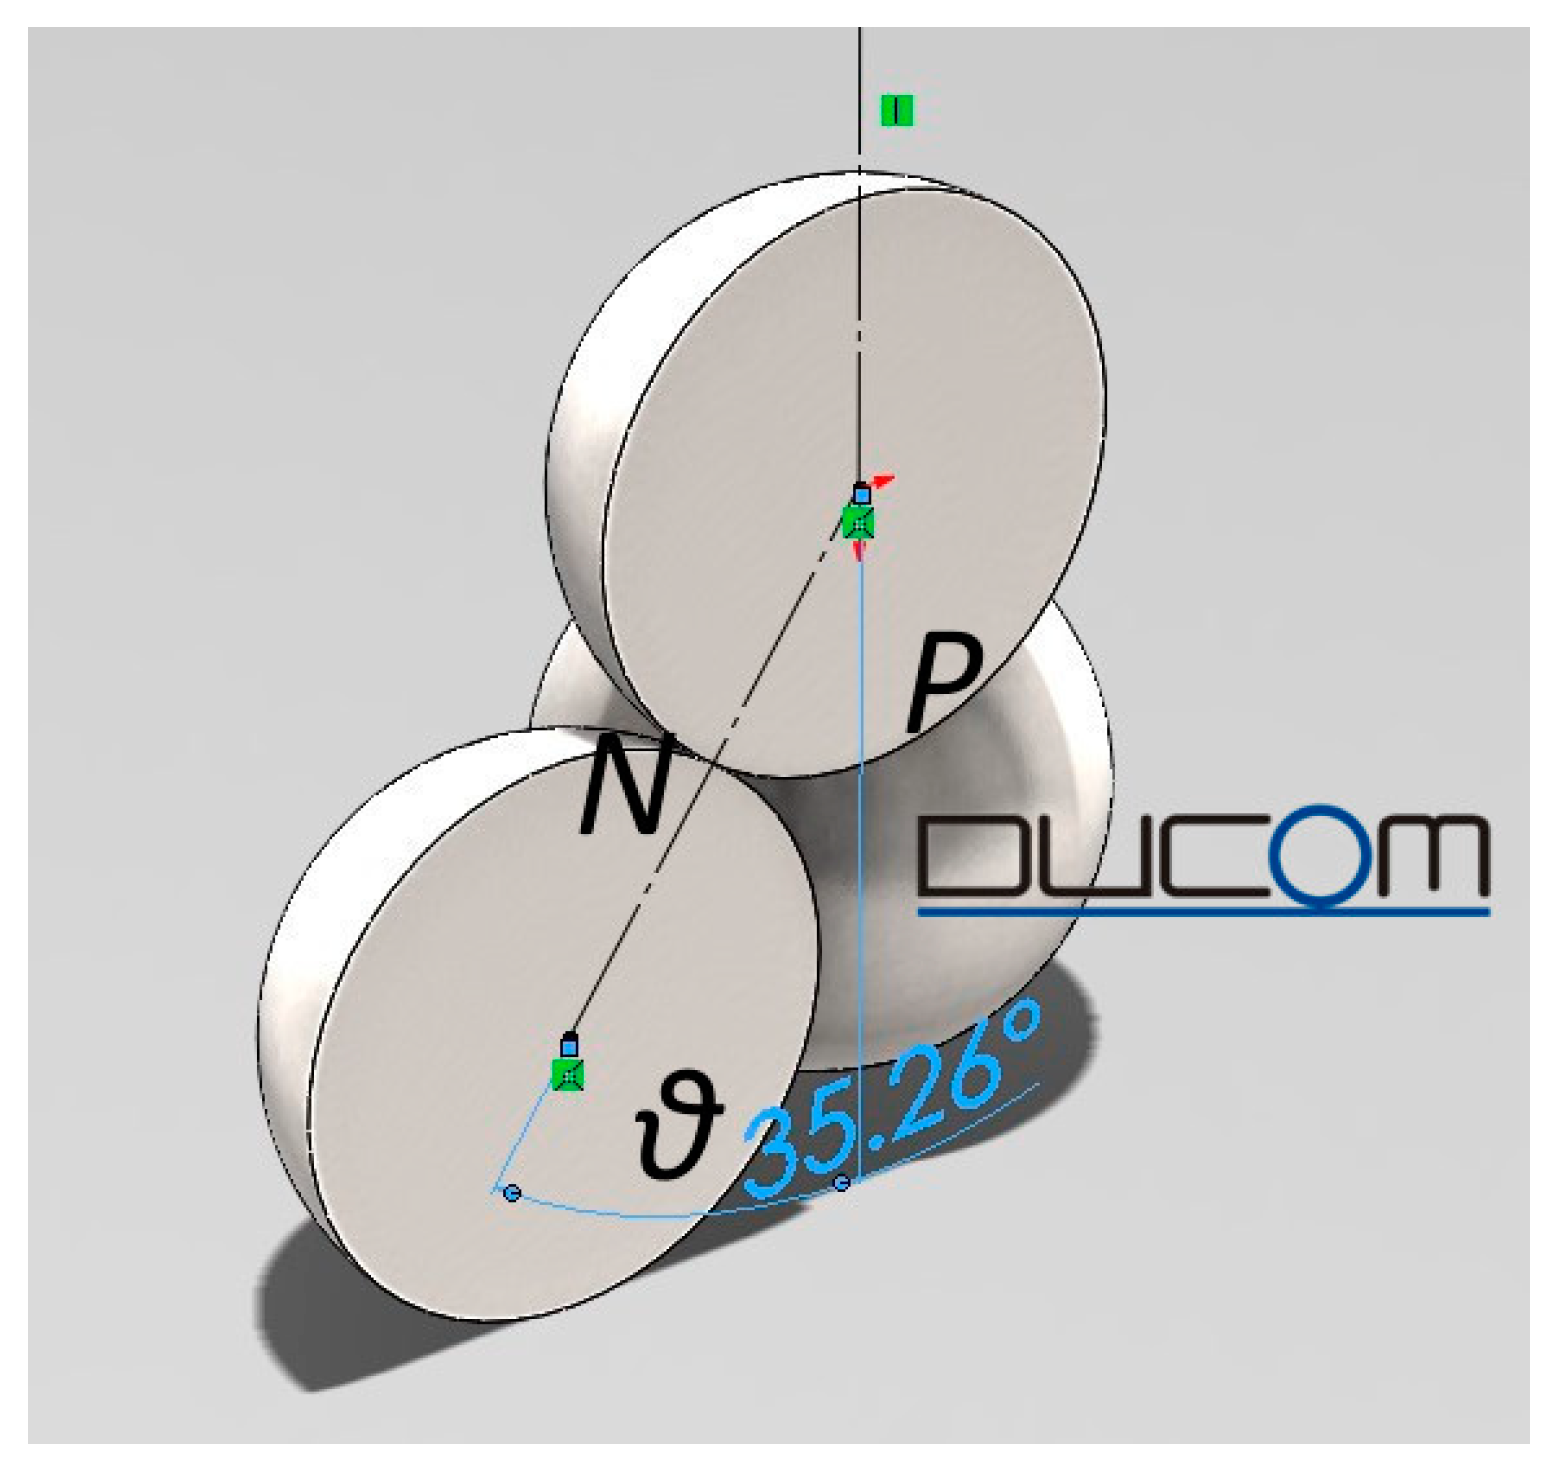
Figure A2.
Illustration of top ball in contact with the bottom balls at a fixed angle within a four-ball assembly in four-ball tester.
Figure A2.
Illustration of top ball in contact with the bottom balls at a fixed angle within a four-ball assembly in four-ball tester.
A cut section view is generated exactly with the center of two balls taken simultaneously. One being the top ball which is held in the collet and the other one is one of the balls which are locked in the ball pot.
A sketch is generated using the references created in the assembly model. The half-angle (θ) here is measured at 35.26°, which is the angle of contact with respect to the axis of rotation and the direction in which the normal load (N) is applied.
Appendix A.2. Correlating Applied Test Load, P, with the Local Normal Resultant Force, N, on the Balls
From
Section 1, we know that the vertical angle subtended at the contact points of the ball is 35.26° (
θ). Knowing this, we can correlate the test load,
P, applied to the assembly with the resultant force,
N, at the contact. The following steps are used for this:
or:
where,
is the applied load during a test.
Appendix A.3. Measurement of Frictional Torque and Local Frictional Forces, on the Ball
The frictional torque (
FT) is measured using a module which consists of a load cell and arm attached to the ball pot and displayed on controller. Using the displayed value, we calculate:
where,
f is the frictional force between the contacting balls or:
where,
= distance on contact of ball from center (in m):
Appendix A.4. Measurement of Sliding Velocity at the Initial Contact for ASTM D4172 Test
The distance between the central axis of rotation of the top ball and the point of contact between any of the bottom three balls,
r, was calculated in
Section 3.
Knowing ‘
r’, the sliding velocity at the point of contact can be calculated as:
where
v = sliding speed in m/s,
r = distance between ball contact and central axis, in m,
N = speed of rotation in RPM. For ASTM D2266,
N = 1770 RPM. From FBT tetrahedral geometry,
d = 0.00366. Hence, sliding speed
v = (2 ×
PI × 0.00366 × 1770)/60 = 0.678 m/s.
Appendix A.5. Calculation of Coefficient of Friction Using Applied Load, P, and Measured Friction Torque, FT
Moving on, the coefficient of friction—CoF (
µ) is calculated by using the formula:
where,
f is the frictional force between the contacting balls,
is the resultant load between the contacting balls.
Therefore, CoF at the ball contact can be calculated with the following formula:
References
- ASTM D2596-20, Standard Test Method for Measurement of Extreme-Pressure Properties of Lubricating Grease (Four-Ball Method); ASTM International: West Conshohocken, PA, USA, 2020.
- ASTM D2783-19, Standard Test Method for Measurement of Extreme-Pressure Properties of Lubricating Fluids (Four-Ball Method); ASTM International: West Conshohocken, PA, USA, 2019.
- ASTM D2509-20a, Standard Test Method for Measurement of Load-Carrying Capacity of Lubricating Grease (Timken Method); ASTM International: West Conshohocken, PA, USA, 2020.
- ASTM D5706-16, Standard Test Method for Determining Extreme Pressure Properties of Lubricating Greases Using a High-Frequency, Linear-Oscillation (SRV) Test Machine; ASTM International: West Conshohocken, PA, USA, 2016.
- Fish, G. Extreme Pressure Performance of Greases: Testing and Additive Solutions. GreaseTech India 2014, 4, 1–12. [Google Scholar]
- Hoehn, B.; Michaelis, K.; Doleschel, A. Limitations of Bench Testing for Gear Lubricants. In Bench Testing of Industrial Fluid Lubrication and Wear Properties Used in Machinery Applications; ASTM International: West Conshohocken, PA, USA, 2001; pp. 15–32. [Google Scholar]
- Boerlage, G.D. Four-ball Testing Apparatus for Extreme Pressure Lubricants. Engineering 1933, 136, 46–47. [Google Scholar]
- Saini, V.; Bijwe, J.; Seth, S.; Ramakumar, S.S.V. Potential exploration of nano-talc particles for enhancing the anti-wear and extreme pressure performance of oil. Tribol. Int. 2020, 151, 106452. [Google Scholar] [CrossRef]
- Kamel, O.; Ali, M. Development and manufacturing an automated lubrication machine test for nano grease. J. Mater. Res. Technol. 2020, 9, 2054–2062. [Google Scholar]
- Bagi, S.D.; Aswath, P.B. Role of MoS2 morphology on wear and friction under spectrum loading conditions. Lubr. Sci. 2015, 27, 429–449. [Google Scholar] [CrossRef]
- Gondal, A.K.; Sethuramiah, A.; Prakash, B. Studies on the tribological behaviour of two oil-soluble molybdenum compounds under reciprocating sliding conditions. Lubr. Sci. 1993, 5, 337–359. [Google Scholar] [CrossRef]
- ASTM D5183-05(2016), Standard Test Method for Determination of the Coefficient of Friction of Lubricants Using the Four-Ball Wear Test Machine; ASTM International: West Conshohocken, PA, USA, 2016.
- Blok, H. The Flash Temperature Concept. Wear 1963, 6, 483–494. [Google Scholar] [CrossRef]
- Wisniewski, M.; Szczerek, M.; Tuszynski, W. The temperatures at scuffing and seizure in a four-ball contact. Lubr. Sci. 2004, 16, 215–227. [Google Scholar] [CrossRef]
- Matveevsky, R.M. The Critical Temperature of Oil with Point and Line Contact Machines. J. Fluids Eng. 1965, 87, 754–759. [Google Scholar] [CrossRef]
- Yamaguchi, K.; Sasaki, C.; Tsuboi, R.; Sasaki, S. Effect of surface roughness on friction behaviour of steel under boundary lubrication. J. Eng. Tribol. 1996, 228, 1015–1019. [Google Scholar] [CrossRef] [Green Version]
| Publisher’s Note: MDPI stays neutral with regard to jurisdictional claims in published maps and institutional affiliations. |
© 2021 by the authors. Licensee MDPI, Basel, Switzerland. This article is an open access article distributed under the terms and conditions of the Creative Commons Attribution (CC BY) license (http://creativecommons.org/licenses/by/4.0/).


