Article

The Influence of Peripheral Components in Test Rig Creation of White Etching Cracks

1
Zeller+Gmelin GmbH & Co. KG, Schlossstraße 20, 73054 Eislingen/Fils, Germany
2
National Centre for Advanced Tribology at Southampton (nCATS), Mechanical Engineering Department, School of Engineering, Faculty of Engineering and Physical Sciences, University of Southampton, Southampton SO17 1BJ, UK
3
Technology Consultant, Sailegärten 2, 72351 Erlaheim, Germany
*
Author to whom correspondence should be addressed.
Lubricants 2024, 12(2), 45; https://doi.org/10.3390/lubricants12020045
Submission received: 28 November 2023 / Revised: 23 January 2024 / Accepted: 28 January 2024 / Published: 4 February 2024

Abstract

:
White Etching Cracks (WEC) have become a subject of extensive research in material science, chemistry and lubrication, and even operational mathematics by AI learning. Initially reported in the 1960s and considered an exotic anomaly, the failures gained importance with the global rise of wind energy power and the automotive industry. Unexpectedly high failure rates in various bearing applications have led to the need for a deeper understanding and prevention of WEC. It has come a long way from materials inspection, to parametrically studying WECs on test rigs, to the understanding that WEC is a stand-alone phenomenon and sparingly related to common failures in bearing technology. It has been commonly accepted that WEC drivers have multiple dimensions, e.g., material, contact mechanics, chemistry, and electricity. The impact of these factors on WEC failures is frequently studied using test rigs at the component level, such as the FE8 test rig. The FE8 has been utilized in numerous investigations due to its ability to replicate WEC failures without requiring artificial electricity or hydrogen charging by using specific lubricant chemistry and operating conditions. However, through intensive testing, it was observed in this study that a standard material in an FE8 rig component demonstrated a profound influence on WEC formation. This paper presents the details of the testing and analysis, aiming to investigate the mechanisms of interactions between the hose material and the low reference lubricant. The results demonstrate that the chemistry of the component material plays an important role in WEC formation. This finding may have significant impact in WEC studies, especially when the FE8 rig is used.

1. Introduction

White Etching Crack (WEC) failures have posed a significant challenge in the field of bearing technology. Although much as this topic has attracted researchers worldwide, until today, a concise understanding of this failure mode is still missing. It is reasonable to assume that even before WEC gained widespread recognition, it was a latent phenomenon present in the past, though not at the forefront of attention for many years. The first observation of “White Etching” was reported in 1966 [1]. Following a prolonged period of relative silence, a series of research activities commenced in the early 1980s and 1990s. However, during that time, researchers were not yet aware of White Etching Cracks. Prior studies primarily focused on material and surface breakdown under boundary lubrication, considering the mechanical impact in the contact and the emergence of thin-film lubrication (see, for example, [2]). Nevertheless, a very detailed study on the material response versus different scenarios of load, e.g., contact pressure and tangential slip, that showed the appearance of subsurface crack networks—although not decorated by white etching matter reaching the surface—was published in [3]. As the failures started to impact more and more upon the industry, WEC has become an important research topic in the material science community. However, the tendency to associate WEC with contact mechanics was still very strong. The change in the perception of WEC began in the midst of the 1990s by the steep increase in wind power installation, especially the generator bearings, and later the planetary stage and main bearings. Nevertheless, WEC came up at the same time as a wave in automotive applications, namely in the belt tensioner and generator bearings, but also the wheel bearings. Numerous trials were made to bring the phenomenon down to parameter test rigs, especially those reflecting the dimension used in reality. Early WEC creation under rolling contact conditions are reported by [4,5,6,7,8,9]. Years after [3], the mechanical impact on WEC was discussed by [10]. A numerical approach was published by [11]. The authors in [12,13,14,15] gave a broad overview on the status of WEC research related to wind turbine gearboxes. The search for the root cause of WEC is split in various approaches, mainly to identify parameters leading to WEC from the perspective of contact mechanics by the use of test rigs, as expressed for example in [10,11,16,17,18,19]. The specific influence of electrical current in conjunction with contact mechanics has been reported by [20,21,22].
The relationship between lubricant chemistry and WEC has been reported in numerous studies [18,19,23,24,25,26,27,28,29,30,31,32,33]. According to these studies, lubricant chemistry plays a significant role in WEC creation, and specific additives, such as zinc dithiophosphate (ZDDP), have been shown to have a particularly important influence [23,26,29]. Overbased calcium sulfonates and their combinations with ZDDP are also reported [7,26,28,29,32]. Additional combinations with ZDDP, such as sodium–calcium sulfonates, boric acid esters, and polyacrylates, are described in references [18,19,25,27]. Dicyclohexylamine’s significant impact on WEC creation, particularly in combination with ZDDP, is documented in [23,34]. Interestingly, this substance plays a crucial role in the bearing industry, notably as a corrosion inhibitor.
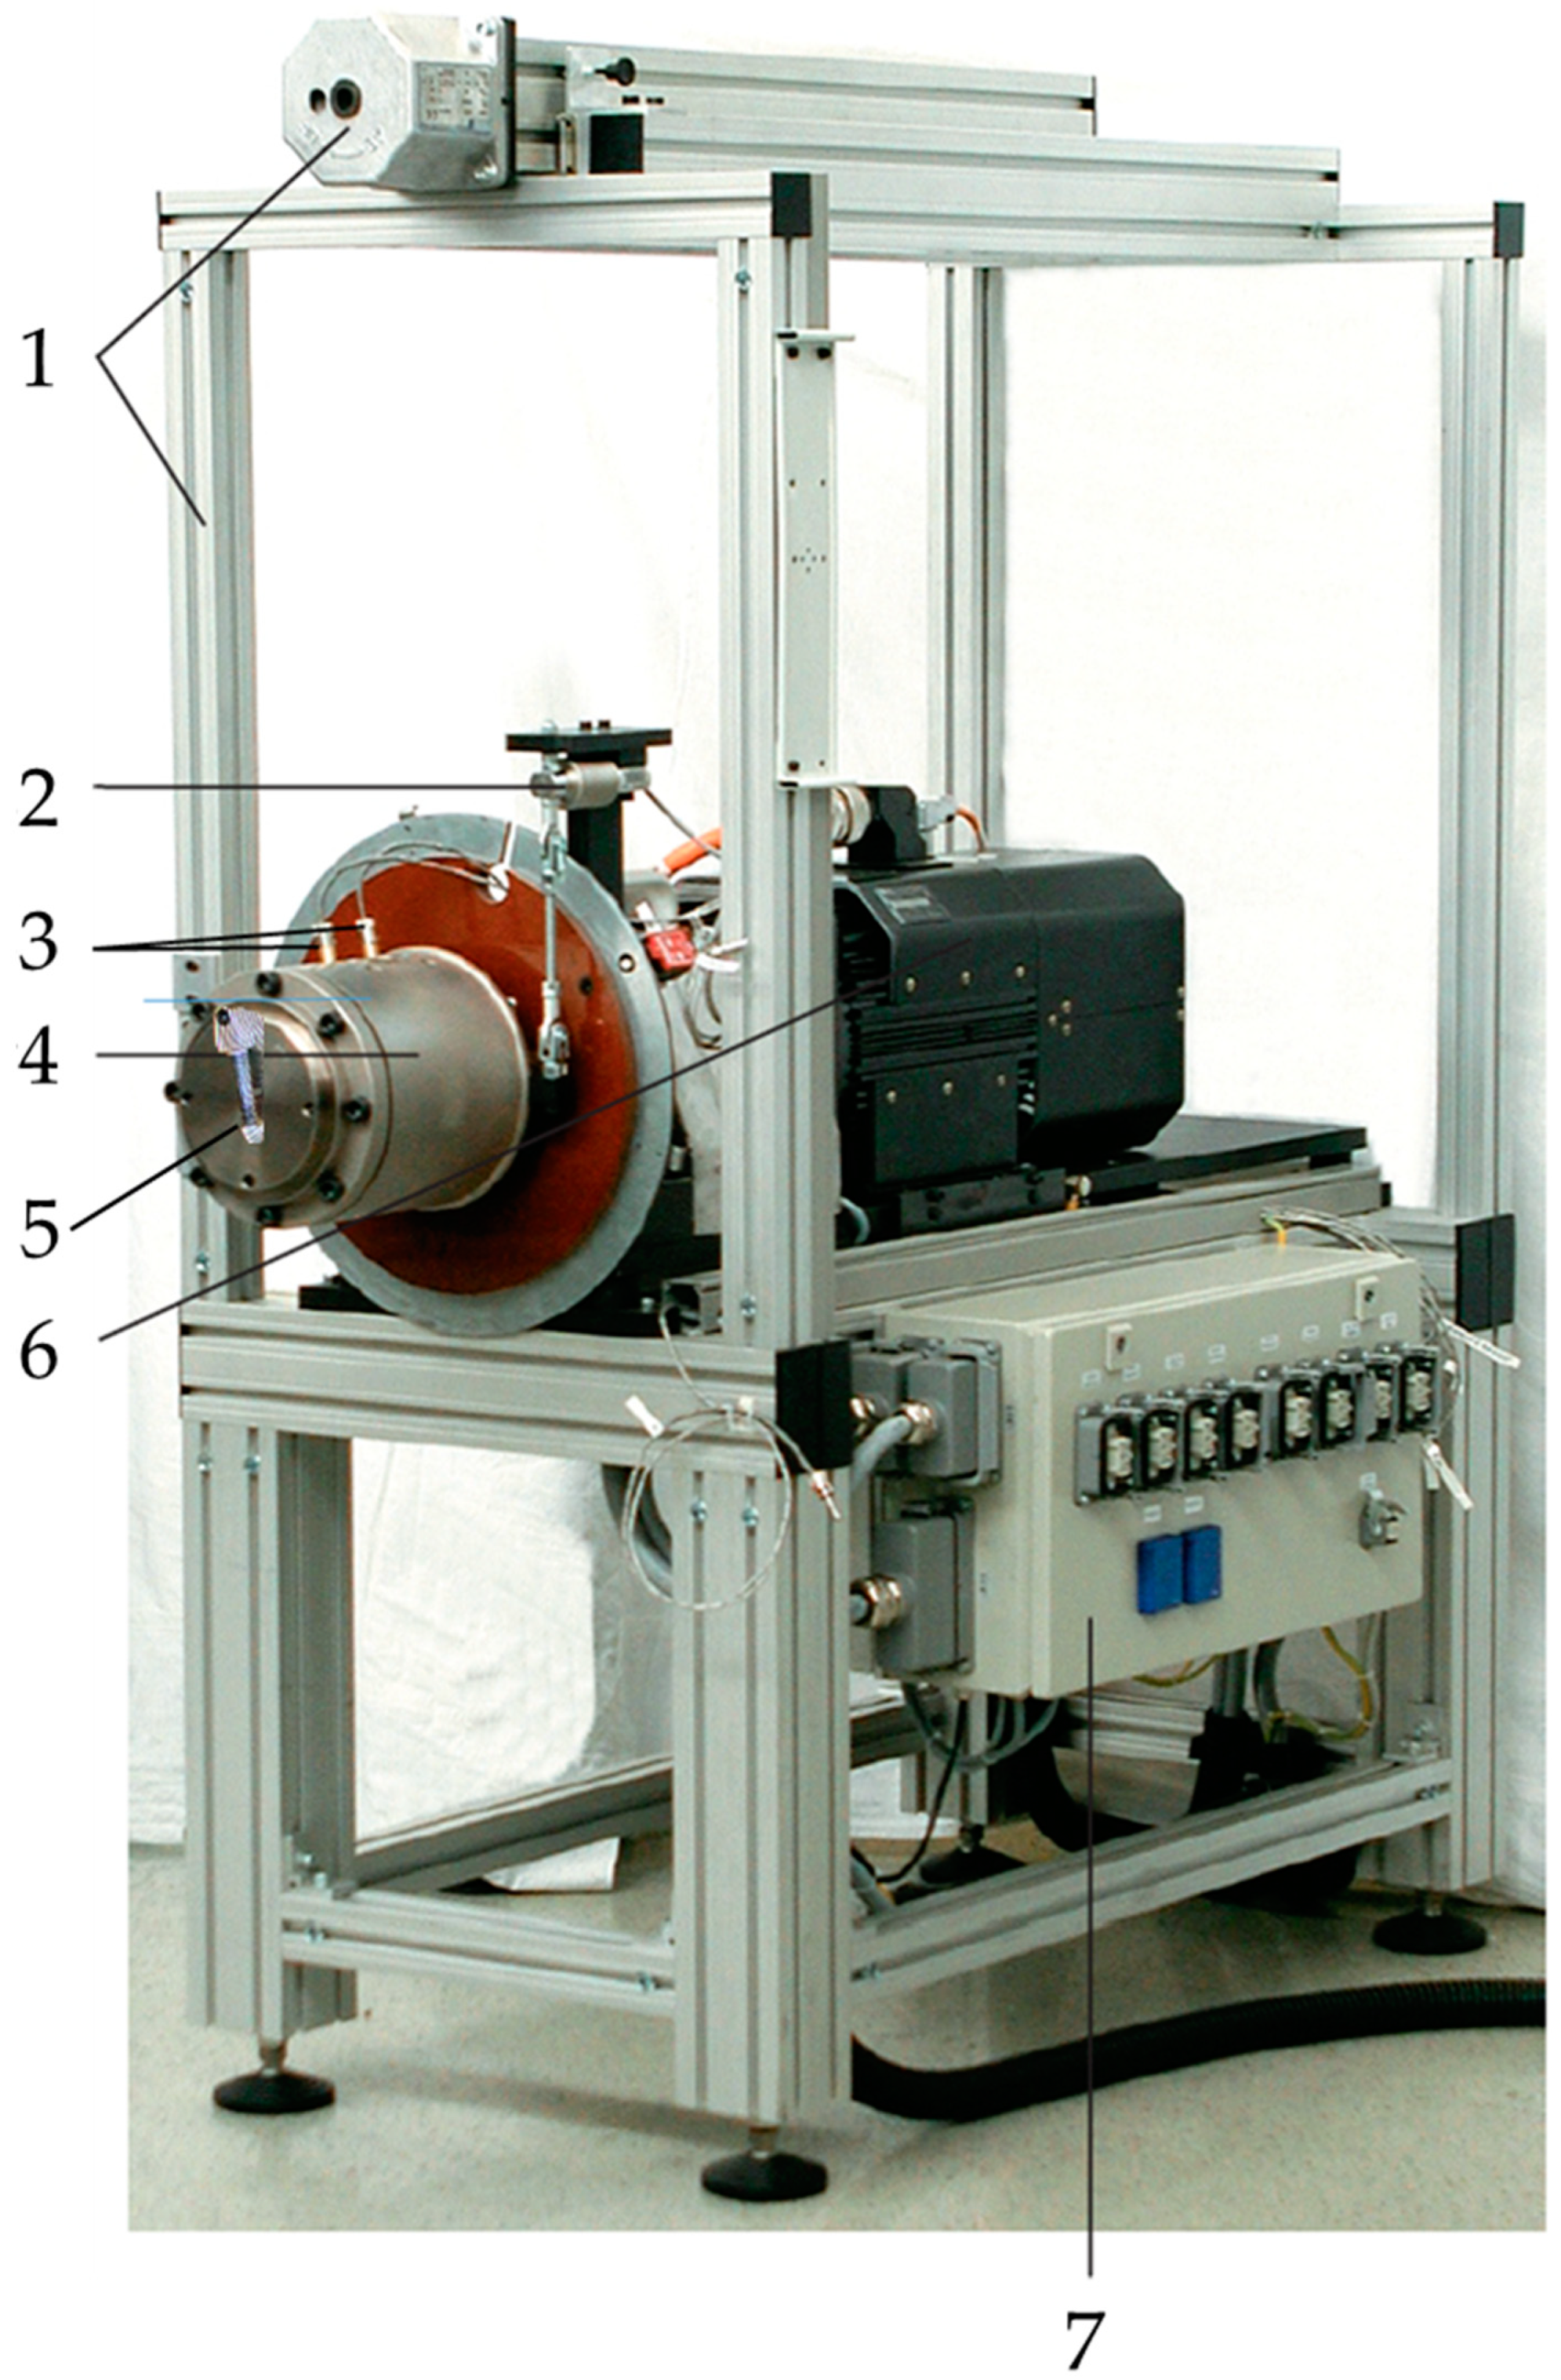
To understand the mechanism of WEC initiation and the role of chemistry in this process, we have used an FE8 test rig following the DIN 51819 standard, building on our previous work [23]. Drawing parallels with recent findings reported in [33], we analysed test specimens after testing using specific low and high reference lubricants (detailed in [23]). We intentionally focussed on identifying chemical reaction products arising under these specific FE8 test conditions. This study investigated the influence of chemistry on the WEC formation, including the role of test rig materials.

2. Materials and Methods

To investigate WEC formation, this study started with reproducing WEC bearing failures on an FE8 rig under rolling/sliding conditions and utilizing lubricants with distinct compositions. After testing, a series of surface and material analyses were carried out. The details of the methods and devices utilized for these analyses are provided in the subsequent sections of this chapter.

2.1. FE8 Test Rig

A standard FE8 test rig produced by Schaeffler Technologies AG & Co. (Herzogenaurach, Germany) has been used. A summary of WEC studies on the FE8 test rig and the conditions used therein is provided in Table A1, Appendix A. Pictures of the test rig (Figure A1) and a schematic of the test head (Figure A2) used in this study are provided in Appendix A also. In order to maintain a constant bearing temperature, a fan for the test head and a heat exchanger (SWEP International AB, type B8Hx10/1P-SC-S, volume prim (oil) = 0.17 L and sec (water) = 0.21 L) for the lubricant oil was used. The lubricant flow rate through this heat exchanger was adjusted with the aid of a pump to 130 L/h. The pump for the heat exchanger was linked to the lubricant drain outlet of the test rig’s lubricant tank. The heat exchanger backflow, in turn, was connected to the filler opening of the lubricant tank. The overall lubricant quantity was 6 kg. The heat exchanger was in operation during the running-in phase until bearing temperature has dropped below 100 °C. Each of the two test bearings was supplied with 0.12 L/min of lubricant by a pump mounted on the lubricant tank. The lubricant was fed through the connection piece on the test head without a direct connection of lubricant supply hoses and test bearings. The backflow from the lower side of the test head (Figure A1, Figure A2, Figure A3, Figure A4, Figure A5, Figure A6, Figure A7 and Figure A8) was linked to the filler opening of the lubricant tank.
The temperature of the two bearings was monitored by thermocouples installed on the stationary housing washer of the two bearings. To set the axial load, the test head was placed into a mounting press, and the desired axial load was controlled by a load cell. The used load cell had a nominal force of Fnom = 100 kN and a nominal sensitivity of Cnom = 2 mV/V. Assembly and dismantling of the test rig followed the instructions described in [35].

2.1.1. The Bearings and Their Material Properties

Cylindrical roller thrust bearings (CRTBs) with the designation 81212 (material AISI 52100) are employed for the testing supplied by Schaeffler Technologies AG & Co. (Herzogenaurach, Germany). Figure 1 shows a picture of the bearing components, containing two washers, one brass cage and 15 cylindrical rollers. The dimensions of the bearing components are outlined in Figure 1 as well. Prior to each test, bearings are carefully cleaned by flushing firstly with heptane (analytical grade), then with isopropanol (analytical grade) and finally with heptane again (0.1 L solvent used for each cleaning step) to ensure machining fluids or corrosion inhibitors are being removed from the test specimens. This cleaning procedure was ensured to be sufficient according to analysis presented in Appendix A. After each test, the test bearings are packed straight out of the test rig into a heptane flushed aluminium foil for further analysis.

2.1.2. FE8 Test Conditions

A series of FE8 tests have been conducted to investigate the influence of lubricant chemistry on WEC formation. All tests were conducted under 60 kN load (1900 MPa Hertzian Pressure) on the test bearings at 750 revolutions per minute (rpm) shaft rotating speed and 100 °C bearing temperature, similar to the tests reported in [7,25,28], and others. Based on the elastohydrodynamic theory for line contacts by Dowson and Higginson [37], the minimum oil film thickness, hmin, was calculated to be 0.046 µm. With the measured root mean square surface roughness values for the washer (0.05 µm) and the rolling element (0.07 µm), the λ-value was calculated to be 0.53, indicating a boundary lubrication condition for the FE8 tests conducted in this study. The standardized lubricant flow rate of 0.12 L/min, in accordance with [38], was employed. The tests were either terminated by exceeding a torque threshold, or by detecting a pitting by the use of an acceleration sensor (see Figure 1). The acceleration threshold has been defined based on the multiplication of a steady state noise recorded over a 24 h duration by a factor of 16. This is to ensure that pitting has occurred based on previous experiences. Furthermore, some tests were stopped after exceeding a predefined running time in order to study the different temporal stages of WEC formation.

2.2. Lubricant Properties

With reference to the findings already reported in [23], two lubricants, denoted as High Reference (HR) and Low Reference (LR), were formulated. With the given test conditions, WEC did not occur with the use of the HR lubricant, whereas it was observed when LR lubricant was employed. In order to create both lubricants, a poly-α-olefin (PAO) was used as HR, while LR was formulated by taking 2.5 wt. % zinc dithiophosphate (ZDDP) and 2.5 wt. % dicyclohexylamine (DCHA) added to 95 wt. % of PAO (Table 1). The detailed preparation procedure is described in Appendix B. The chemistry of these oil components, as well as of the formulated oils, is described below. To enhance traceability, an IR-spectrum of each substance is given in Appendix B (Figure A4, Figure A5 and Figure A6).
PAO (viscosity at 100 °C 8 mm2/s) was bought from Ineos, being registered in the EU under 500-183-1. Measured data of this base oil is referred to in Table A2, Appendix B. The ZDDP is an undiluted zinc di(2-ethylhexyl)dithiophosphate from Lanxess/Germany (EC list no. 224-235-5), brand name Additin RC 3080, and a primary ZDDP in structure. The stoichiometry was confirmed by an ICP-analysis resulting in 8.7 wt. % zinc, 7.4 wt. % phosphorus and 15.1 wt. % sulphur.

Dicyclohexylamine (DCHA)

The substance was bought from Overlack under the registration number 202-980-7. The purity is guaranteed to be >99% with a water content <0.3%.

2.3. Metallographic Sample Preparation, Etching, and LOM Analysis for WEC

After testing, the bearing surfaces were inspected, focusing on those washer areas where severe damage was observed. Cross-section analysis was used to identify microstructural alterations in the subsurface. In the case of inconclusive results, e.g., if WEC was expected but not found, a further analysis was performed taking washer(s) from a second bearing out of the same test. The procedure is detailed in Appendix C.

2.4. Infrared Surface Reflection Spectrometry

Infrared spectrometry in combination with optical reflection as non-destructively and high lateral resolution (approx. 20 µm) was used to identify the chemical residuals on the washer surfaces created during the tests. The instruments were provided by Thermo Fisher (Nicolet 6700, 64 scans), Shimadzu (AIM-900, 30 scans), and Perkin Elmer (Spotlight 400, 20 scans). Detection took place in each case with a semi-conductor detector (mercury cadmium telluride, MCT) within a measurable wave number region in between 700 cm−1 and 4000 cm−1. The test specimens taken out from the test rig were cleaned carefully with heptane, rinsing the base oil away. This procedure resulted in spectra of reaction products adhering to the surface. To identify the chemicals based on their spectra, the following literature was consulted: [39,40,41].

2.5. Time-of-Flight Secondary Ion Mass Spectrometry (TOF-SIMS)

In the first step, the tested bearing washers were cleaned by rinsing them with heptane and cutting them into samples of approx. 1 cm × 1 cm size with nitrogen cooling to avoid interfering residues of a machining lubricant. TOF-SIMS, as a highly sensitive and reproducible analytical technique, was used in order to identify the elements and residuals on the metal surfaces created by the test, well aware that the sensitivities of the signals may vary by orders of magnitude [42]. In order to overcome these challenges, comparative measurements using a virgin sample were performed. The measurements were carried out using a TOF-SIMS 5 (Iontof) with Bi+-Ion sputtering at 30 keV. The extractor voltage was set to 3000 V.

3. Results

The results section of this paper is structured into two subsections. Firstly, we present the outcomes of the test runs related to WEC formation. Secondly, we present the results of the surface analyses performed on the obtained bearing washer specimens, utilizing infrared spectrometry and TOF-SIMS.

3.1. FE8 Test Runs

A series of FE8 test runs was carried out using the LR (test tag PAO/ZDDP/DCHA-1, -2, -3), consistently leading to WEC (see Table 2 as an overview). Exemplary results of the metallographic analysis, along with a detailed description of the process, are presented in Appendix C.
Moreover, comparative test runs were carried out using PAO as the HR lubricant serving as the high reference sample, as no WEC were found within these bearings after the full test runs (test tag PAO-1, PAO-2 in Table 2).
The objective of this study was to investigate early stage WEC formations during their early operational stages based on previous research [23] that highlighted the emergence of initial WEC damage within the bearings in 24 h using this lubricant. In a prior investigation [34], the authors illustrated that pores were present within the LR-bearings in as early as 15 h. These pores were subsequently identified by [43] to be critical in terms of crack creation.
Upon conducting the initial analysis on these bearing surfaces from earlier stages, as elaborated in detail below in Section 3.2.1, an unforeseen deposition of hosing material was observed on the surfaces of the bearing washers. By changing the initially used polyamide (PA) hosing material with a silicone hose, a noticeable alteration in the chemical composition of the deposition occurred. However, even more remarkable was the result of the subsequent full test-run until bearing failure (PAO/ZDDP/DHCA-4), where no occurrence of WEC within the bearings was observed. Returning to the initially used PA-hosing reinstated the occurrence of the WEC damage (PAO/ZDDP/DHCA-6). A further transition to silicon wiring (PAO/ZDDP/DHCA-7) similarly did not lead to the WEC-failure. Another test run was conducted using a stainless steel supply hose as a reference for the surface analysis. However, no WEC was detected in these bearings, even though WEC was found in the bearings with PA hosing and shorter running times.

3.2. Bearing Washer Surface Analysis

This section is organized into four subsections. Initially, we present the unexpected finding concerning the deposition of lubricant supply hose material onto bearing washers using infrared surface reflection spectrometry. The second section outlines the results of additional analysis conducted with TOF-SIMS to substantiate these findings. In the third part, we illustrate the findings of reaction products generated during the test runs with high and low reference lubricants. Lastly, we draw a comparison between the reaction products generated under tribological conditions on the bearing washer surface and those attained under static conditions, achieved by subjecting PAO to copper, iron and zinc-powder while stored at 100 °C.

3.2.1. Infrared Surface Reflection Spectrometry I: Unexpected Deposition of Lubricant Supply Hose Material

After the test runs, the bearing washer surface was analysed by infrared surface reflection spectrometry “as received” at sites of optically visible irregularities. Spectra taken from these features of the “as received” washers from the test runs showed solely CH-stretching vibrations related to the presence of the poly-α-olefin hydrocarbon.
Cleaning of the “as received” specimen by the use of n-heptane removed the layer of poly-α-olefin and lead after the solvent evaporated to the spectra shown in Figure 2. Overlaying a spectrum of polyamide 6.6 showed a very good match. However, the peaks at 2058 cm−1 and 1077 cm−1 are distinct from Polyamide. Peaks in the region between 2200 cm−1 and 2000 cm−1 are associated with cyanides, cyanates and carbonyl complexes. A spectrum of Prussian Blue (Fe4[Fe(CN)6]3) shows a very good match for this peak.
Similar to the former procedure, surface infrared spectra were taken from the low reference bearing test using PAO/ZDDP/DCHA-8 as a lubricant. A clear similarity to the already-mentioned spectra of a polyamide was found. Additional peaks at 1578 cm−1 (designated to carboxylates as reaction products) and 1060 cm−1 (C-O,) (Figure 3) were seen. The peaks related to polyamide are found as well within spectra taken from the area at the surface that appeared discoloured (see Figure 4). It has to be acknowledged that the spectra shown here were found at local spots (decolorized), but were not uniformly spread across the surface. Various spots (basically not showing a discoloration) do not show any residuals (see Figure 5).
The origin of the PA spectra was confirmed by exchanging the PA hoses from the oil supply line by a silicone hose. While PA was identified with the use of the PA hoses, it was not found by the use of silicone hoses in the high reference case. Instead, a Si-O signal at 1200–1000 cm−1 emerged on bearing surfaces in both the high and low reference test runs.
Replacing the silicon hose with a metal-wired one, the results show neither silicon bands nor cyanides or polyamides (test tag PAO/ZDDP/DHCA-5).

3.2.2. TOF-SIMS Analysis

In addition to the IR findings, TOF SIMS (negative and positive mode) depth profiles were taken from a virgin bearing washer and a washer taken from a low reference test run with the silicone hosing (PAO/ZDDP/DHCA-4). The results of these analyses are presented in Figure 6 and Figure 7. Compared to the virgin bearings (Table 3), higher levels were observed of: Si (approx. 1800 times higher intensity), CN (approx. 1200 times higher intensity), H (approx. 280 times higher intensity) and also Cu (not present at the unused bearing). P, S, C, and O residuals refer to the additives being used.

3.2.3. Infrared Surface Reflection Spectrometry II: Investigation on Reaction Products after Test Runs under WEC-Critical Conditions

Apart from the unexpected deposition of hosing materials on the bearing washers as presented in the last two sections, a broad variety of functional groups could be identified with the aid of an IR surface reflection spectrometry. Exemplarily spectra of these reaction products are presented below; a comprehensive listing of the findings is given in Table 4.
Different carboxylate peaks came up at various spots on the surface. In addition, further peaks indicate esters and ketones as residuals (Figure 8).
A further example of a carbonyl group in a surface spectrum is displayed in Figure 9. A peak at 1795 cm−1 may be related to an anhydride ester or lactones. No further efforts were taken to identify them.
The infrared spectra of different spots on the washer surface from a bearing of the test run PAO/ZDDP/DCHA-10 were taken by a modified ATR-technique after cleaning the bearing surface with heptane. The recorded spectra indicate the occurrence of double bonds and various CN (cyanide) and CO (carbonyl) species (Figure 10).
Despite the absence of polyamide material in the lubricant hosing, several spots on the surface of the low reference bearing washer did also show signals at 3280 cm−1 (sec. amide N-H stretching vibration) and 1650 cm−1 (typical amide C=O stretch vibration) in combination with 1550 cm−1 (typical amide N-H bending vibration) (Figure 11) in the case of the low referent lubricant.

3.2.4. Evaluation of Catalytic Degradation

To determine whether the residues observed on the washer surfaces resulted solely from metal-catalysed oxidation, we conducted the following test procedure:
A sample of poly-α-olefin was stored at 100 °C with the presence of copper, iron and zinc powder. This test aimed to clarify whether the peaks detected on the washer surfaces were generated by tribological processes in combination with elevated temperature or by catalytic reactions accelerated by temperature. The concentration of all three metals was set to one per cent by mass each. Infrared spectra of the oil sample initially showed the first signs of peaks associated with carboxyl functionality after 48 h, becoming more pronounced after 6 days, with a maximum peak at 1722 cm−1. After 11 days, a new peak began to emerge at 1598 cm−1, becoming more pronounced in the spectrum taken after 42 days (Figure 12).
In addition to the peaks highlighted in Figure 12, the sample’s infrared spectrum showed a peak at 1176 cm−1 (C-O stretching) after 41 d.
An ICP-analysis of the PAO after 42 days detected dissolved concentrations of 1993 ppm zinc, 34 ppm copper, and less than 10 ppm of iron in the oil.
Table 4. Overview of functional groups on bearing washers detected by infrared spectrometry after FE8 tests with high and low reference lubricants. Evaluation of catalytic degradation displays the resulting functionalities from a static test at 100 °C with Fe, Cu, Zn contact: (x) Functional group was detected, (-) Functional group was not detected.
Functional GroupLow Reference Bearing Washers (PAO/ZDDP/DCHA)High Reference Bearing Washers (PAO)Evaluation of Catalytic Degradation (Static Test See Section 3.2.4)Remarks
Alcohols, Metalhydroxidesxx-
Amidesxx-PA-hosing
Amidesx--Without PA-hosing
Alkenesx--
Thiocyanate/Cyanatex--
Cyanide/Carbonylexx-
Anhydrid/LactonexxxStatic test after 7 days
Esterxx-
KetonexxxStatic test after 7 days
Carboxylic Acidx--
SoapsxxxStatic test after 7 days

4. Discussion

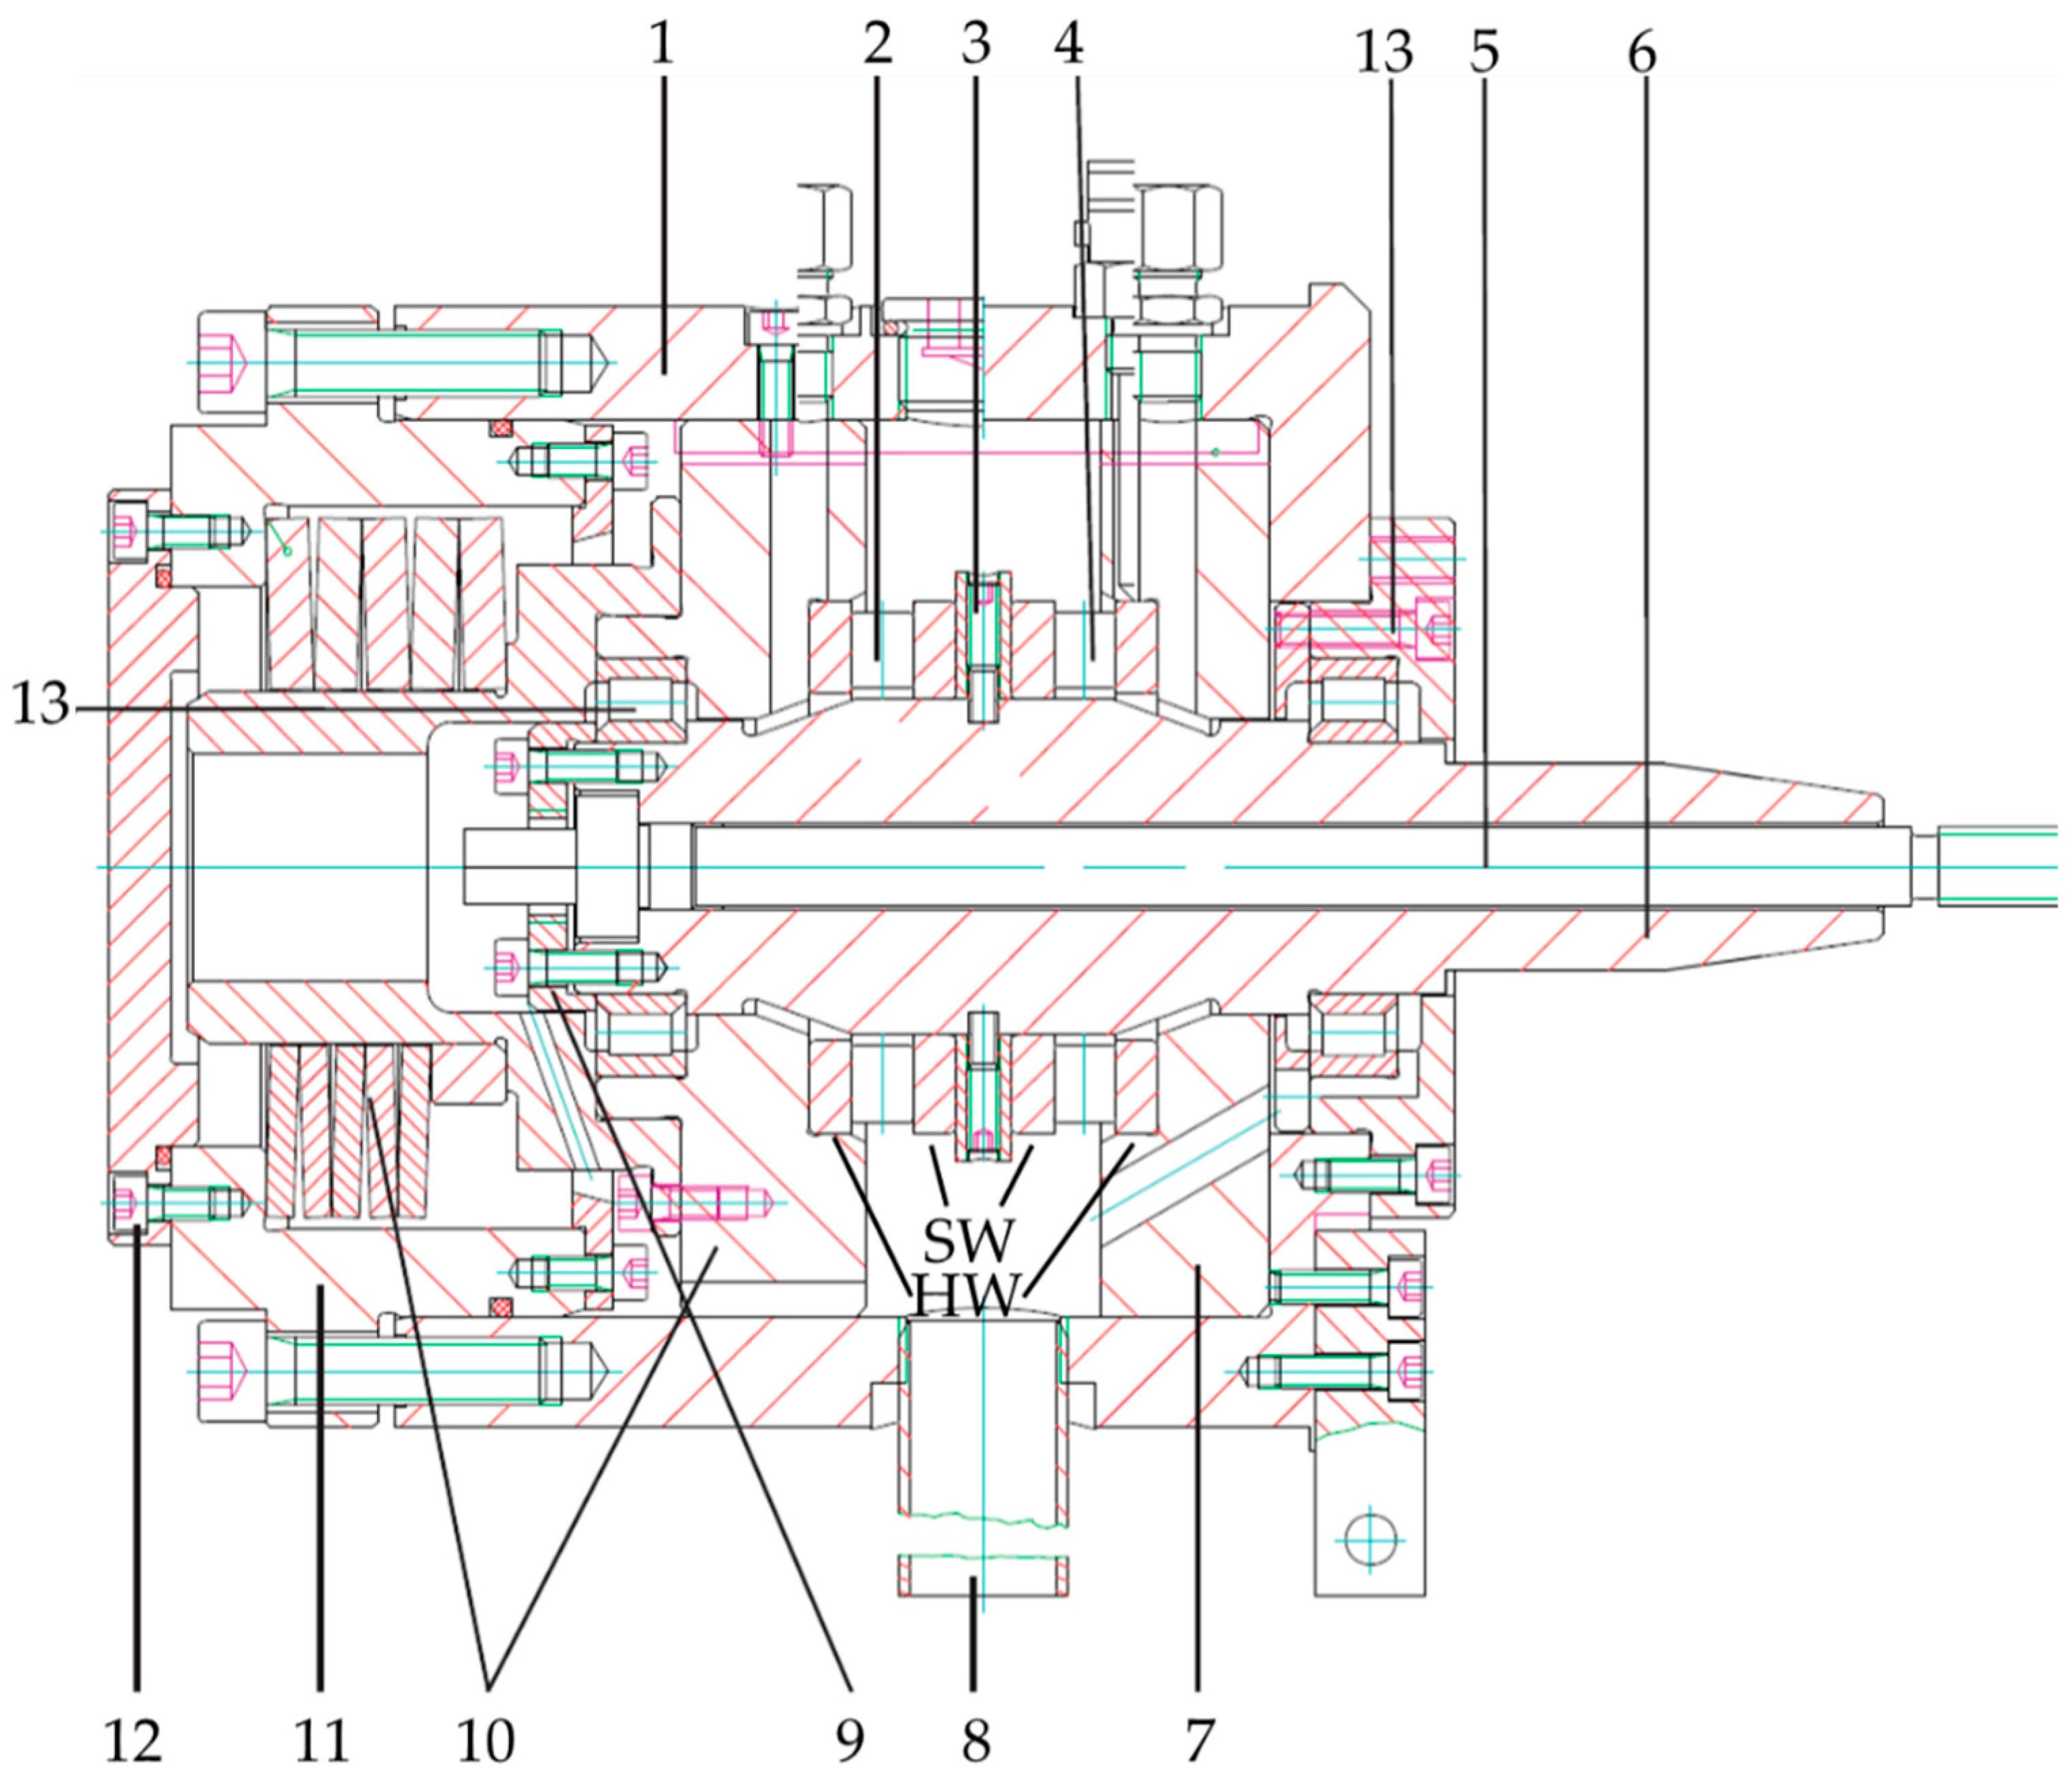
The FE8 test rig is capable to replicate the WEC damage as demonstrated by numerous studies (refer to Table A1 for an overview). The authors of this study also demonstrated that WEC creation arises by the use of a simple low reference lubricant containing the three chemicals (PAO, ZDDP, DCHA) but also two components combining simply PAO and ZDDP [23], albeit requiring an extended running time to WEC failure.
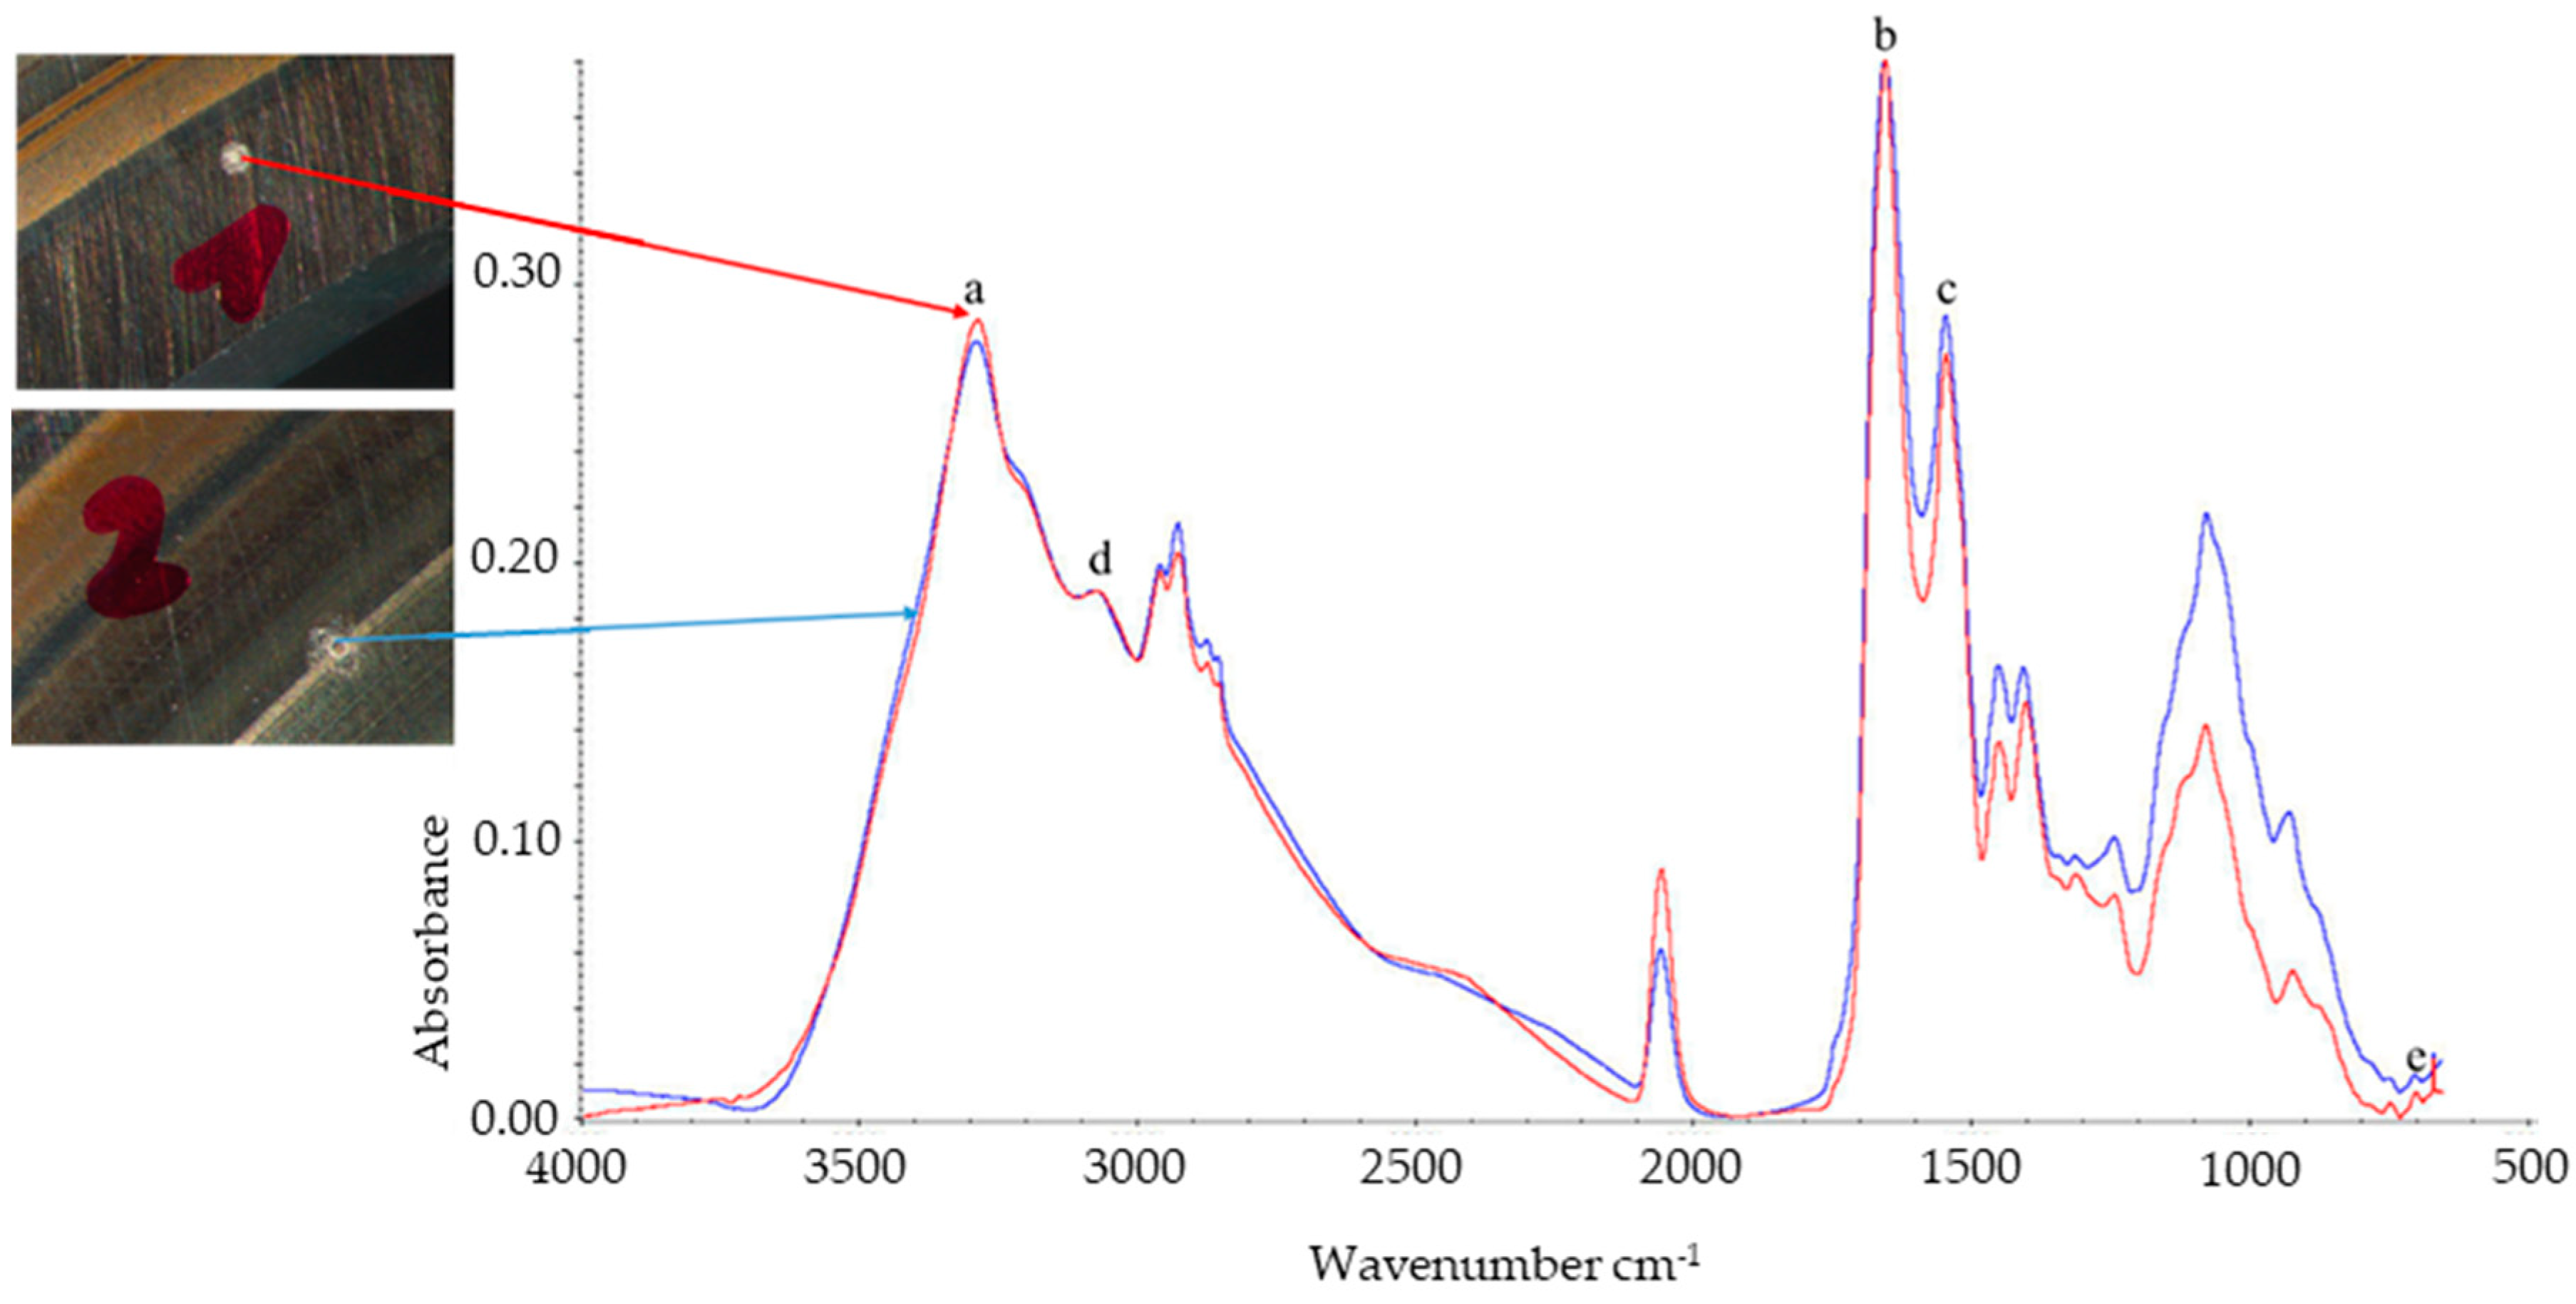
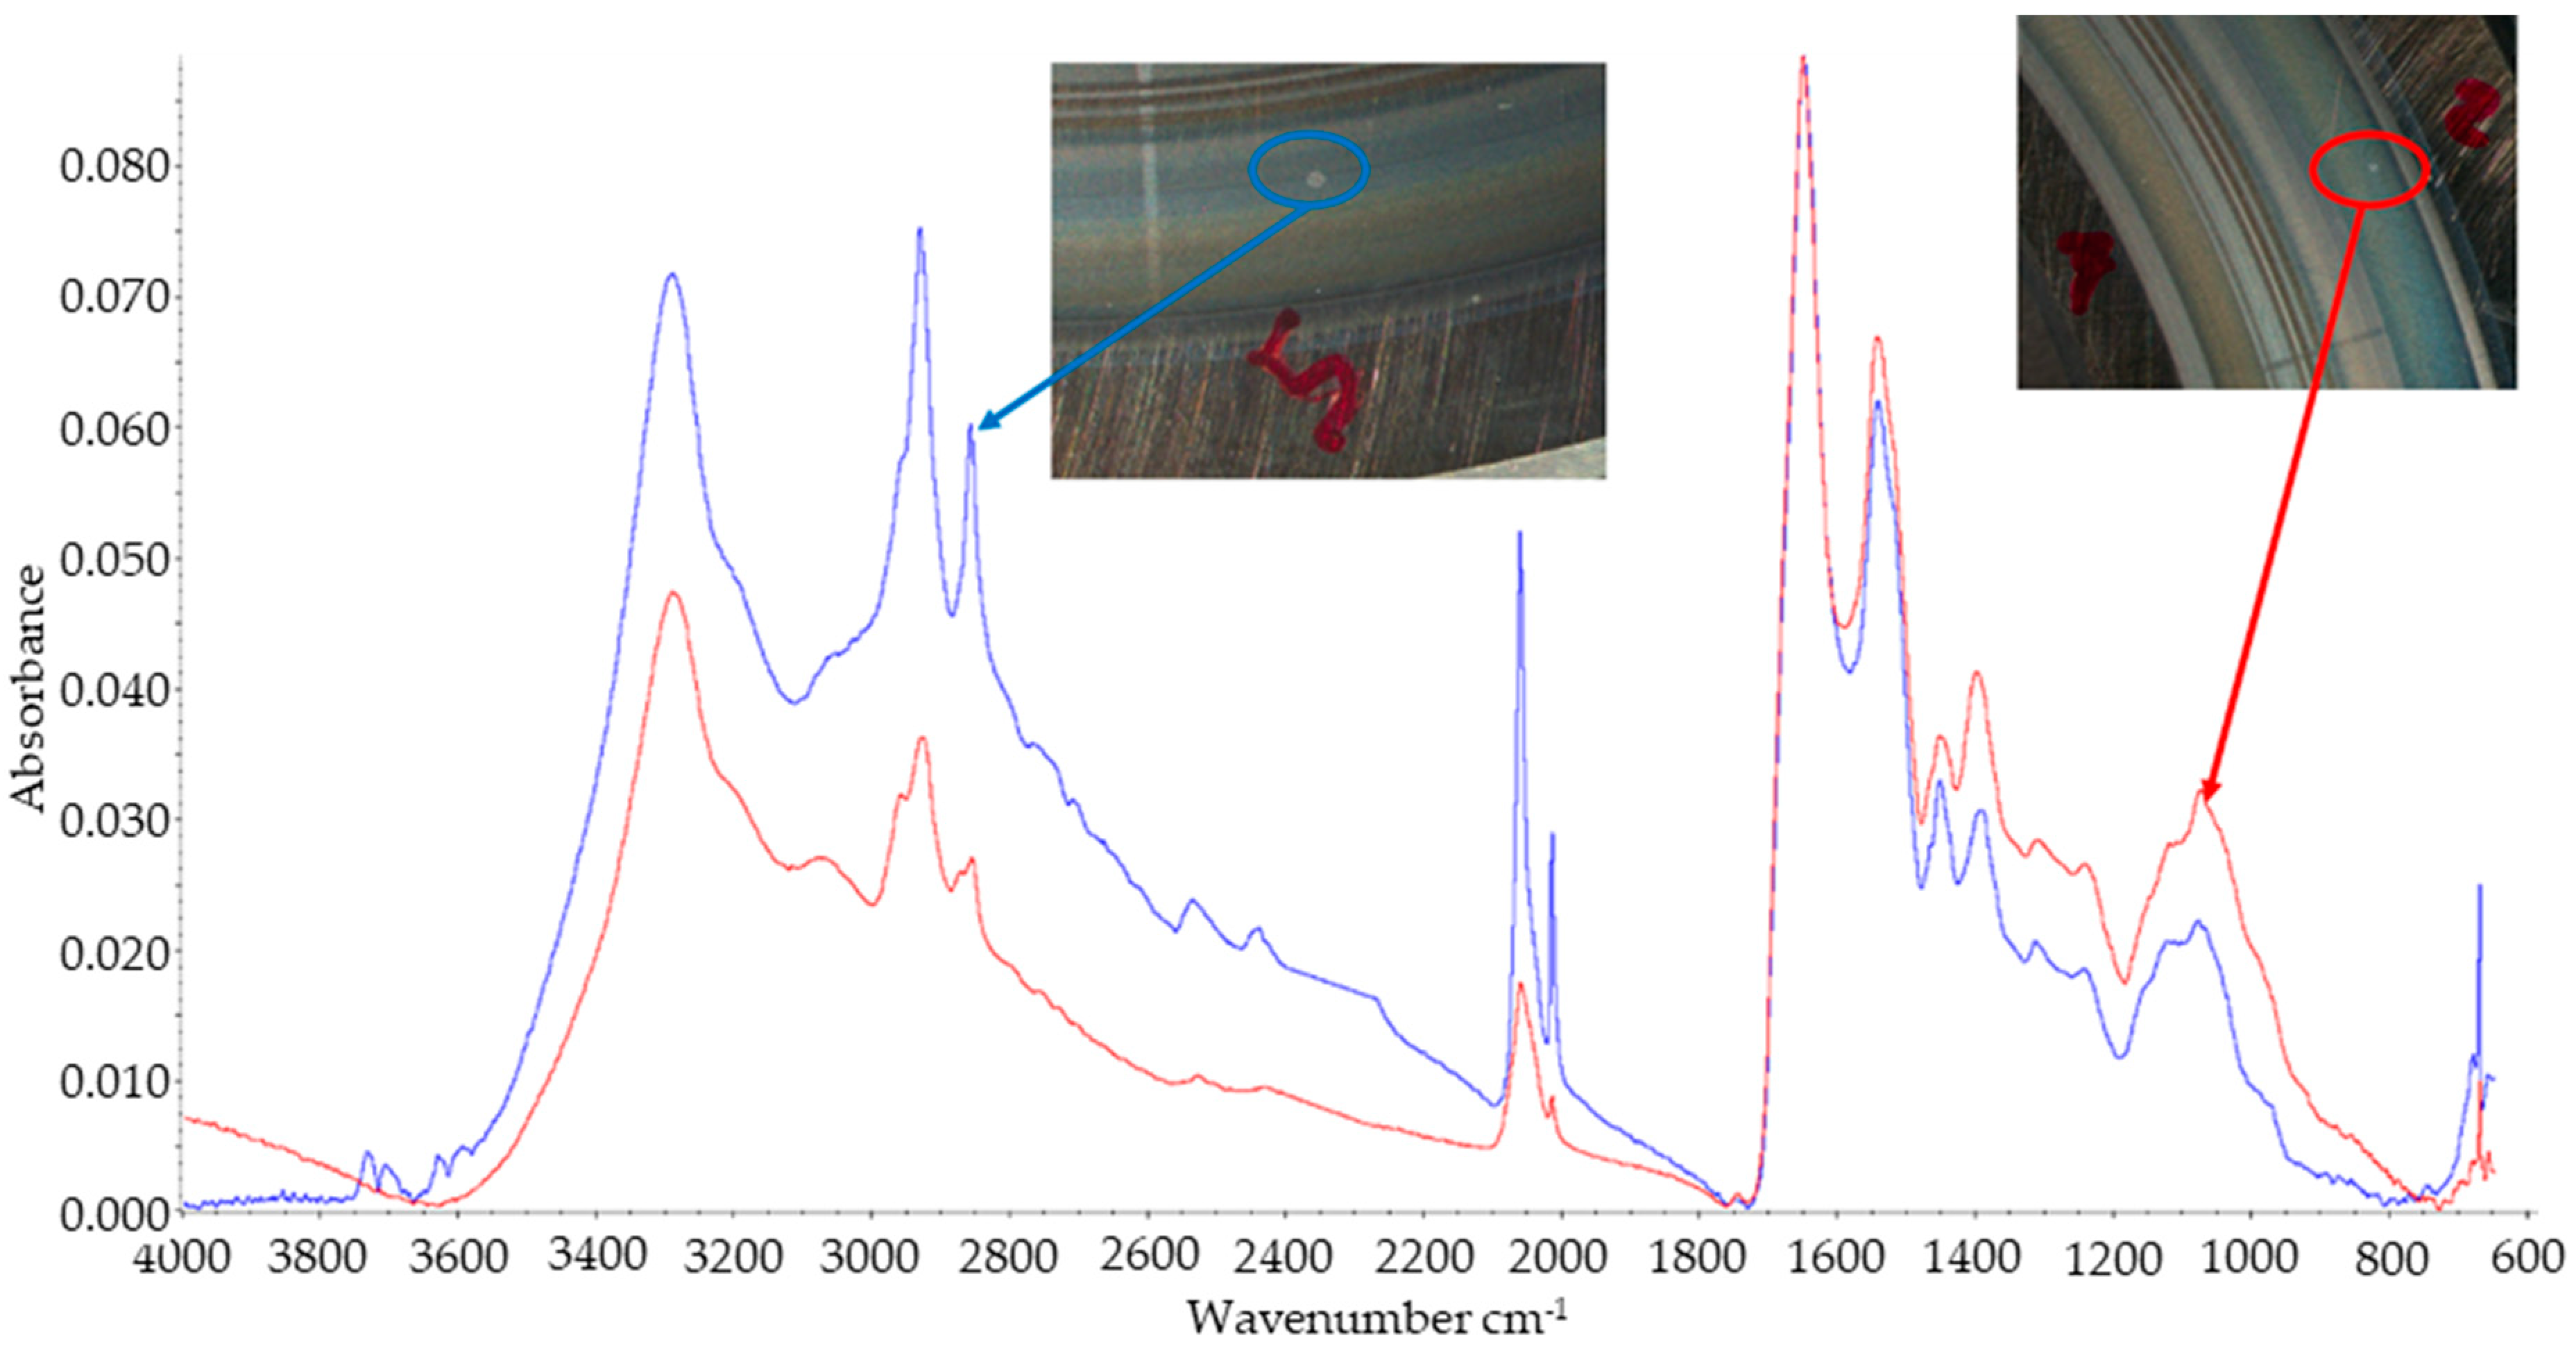
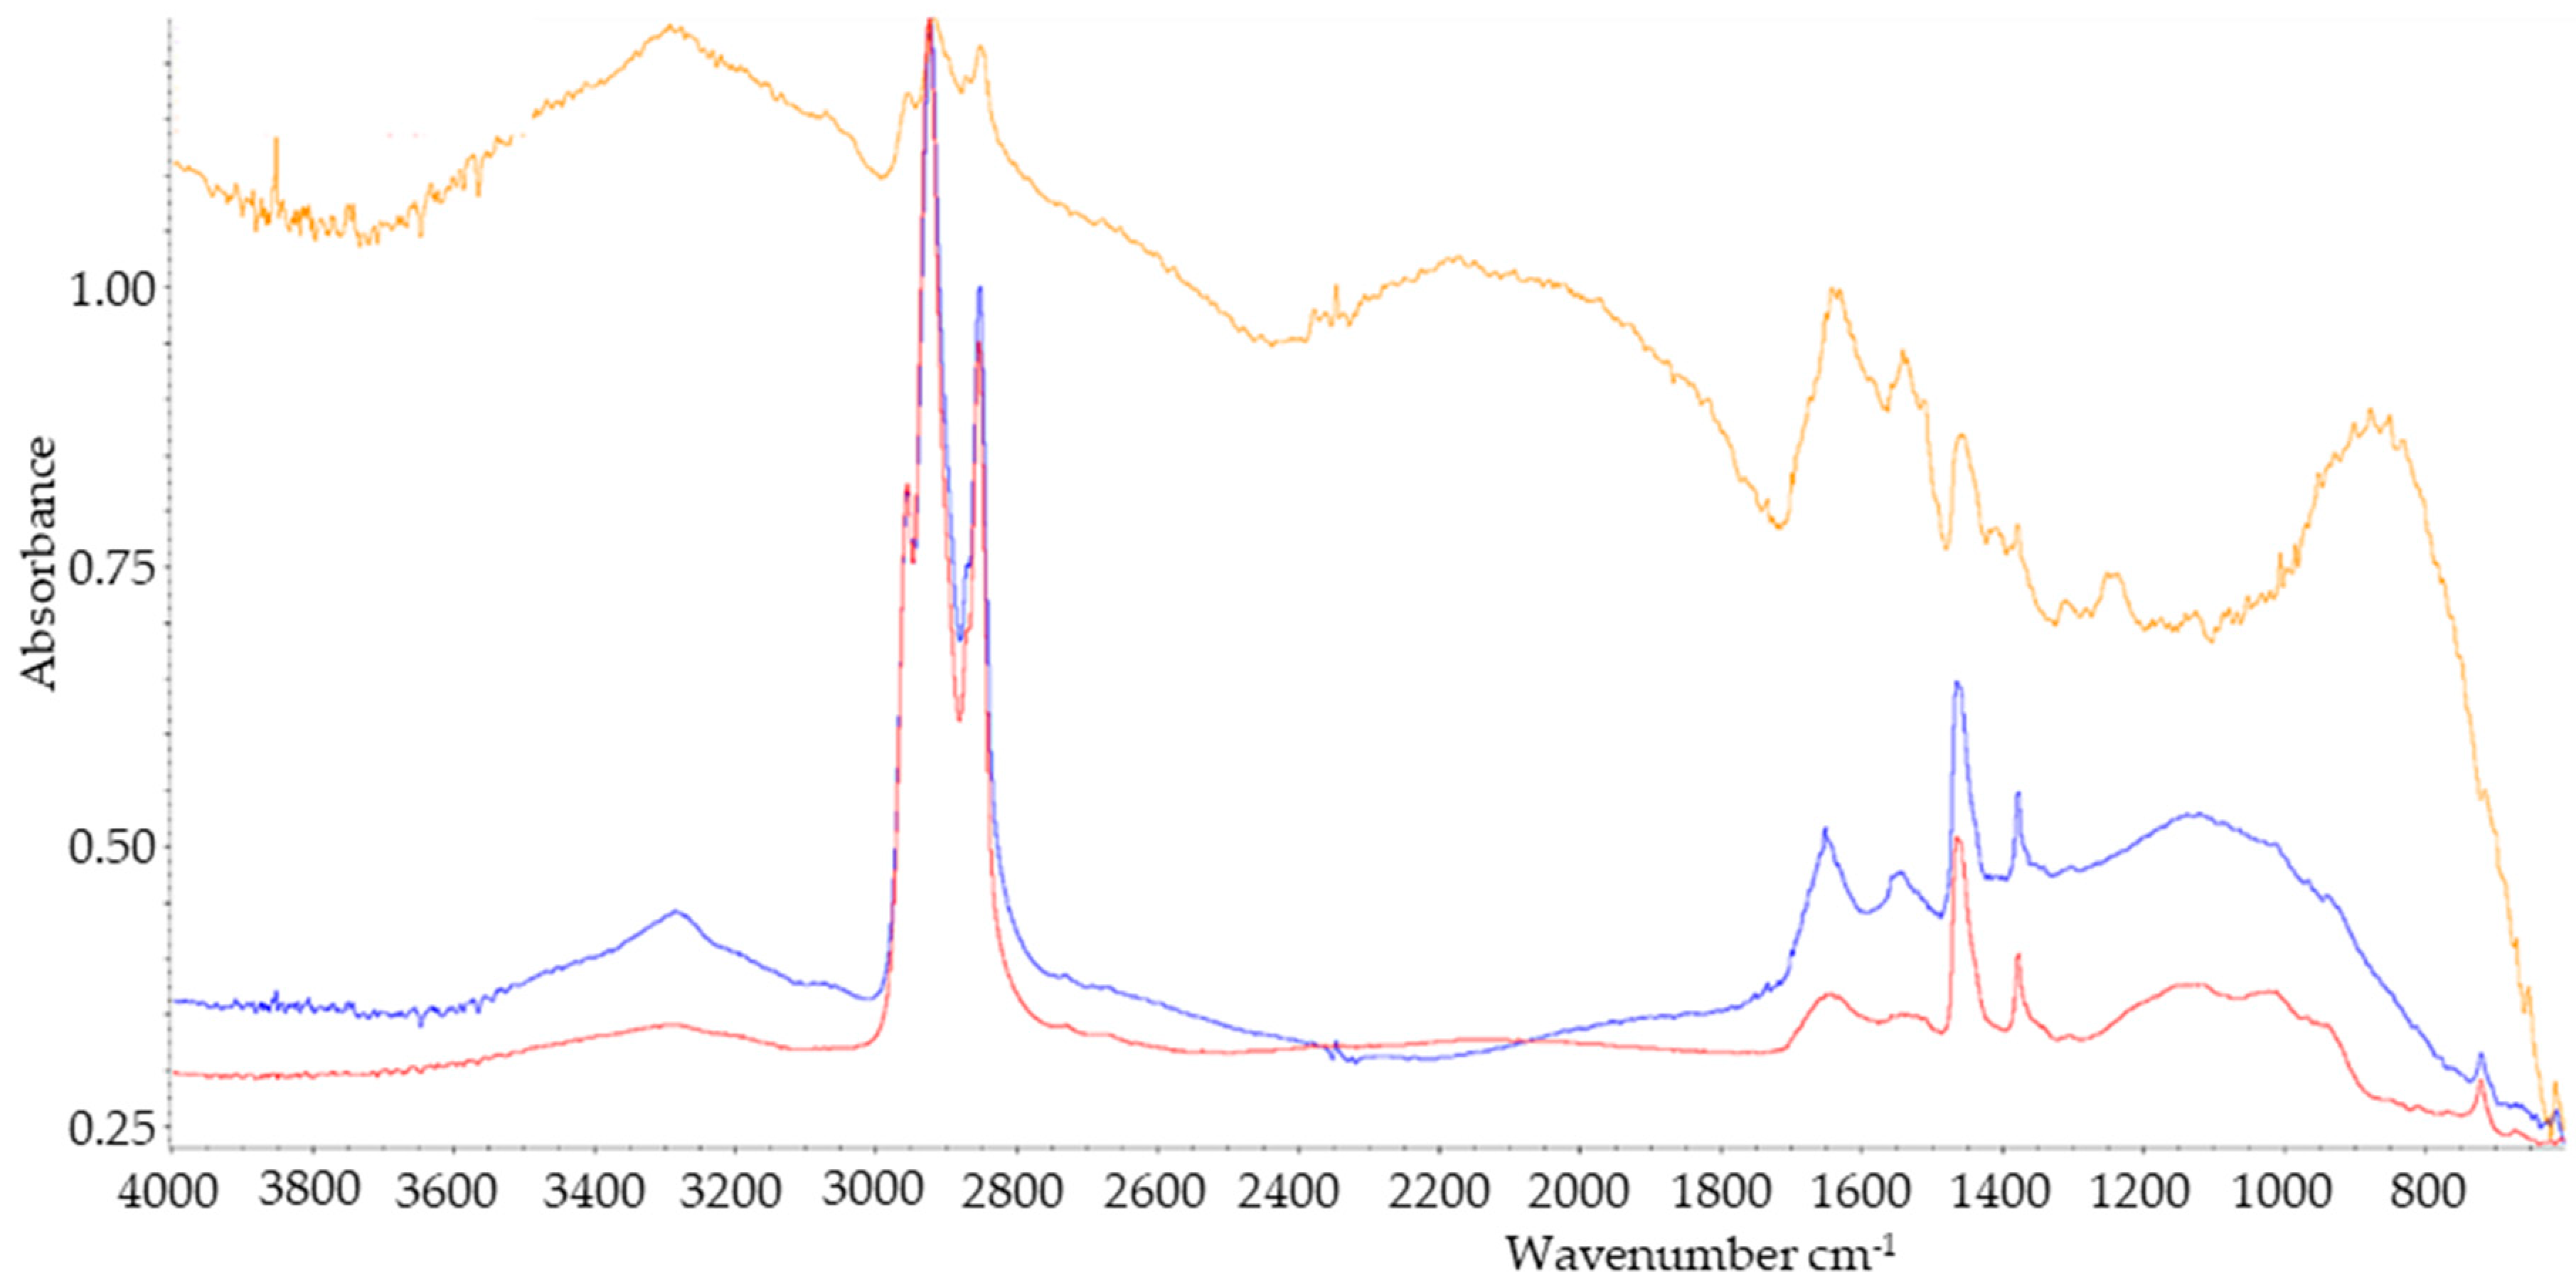
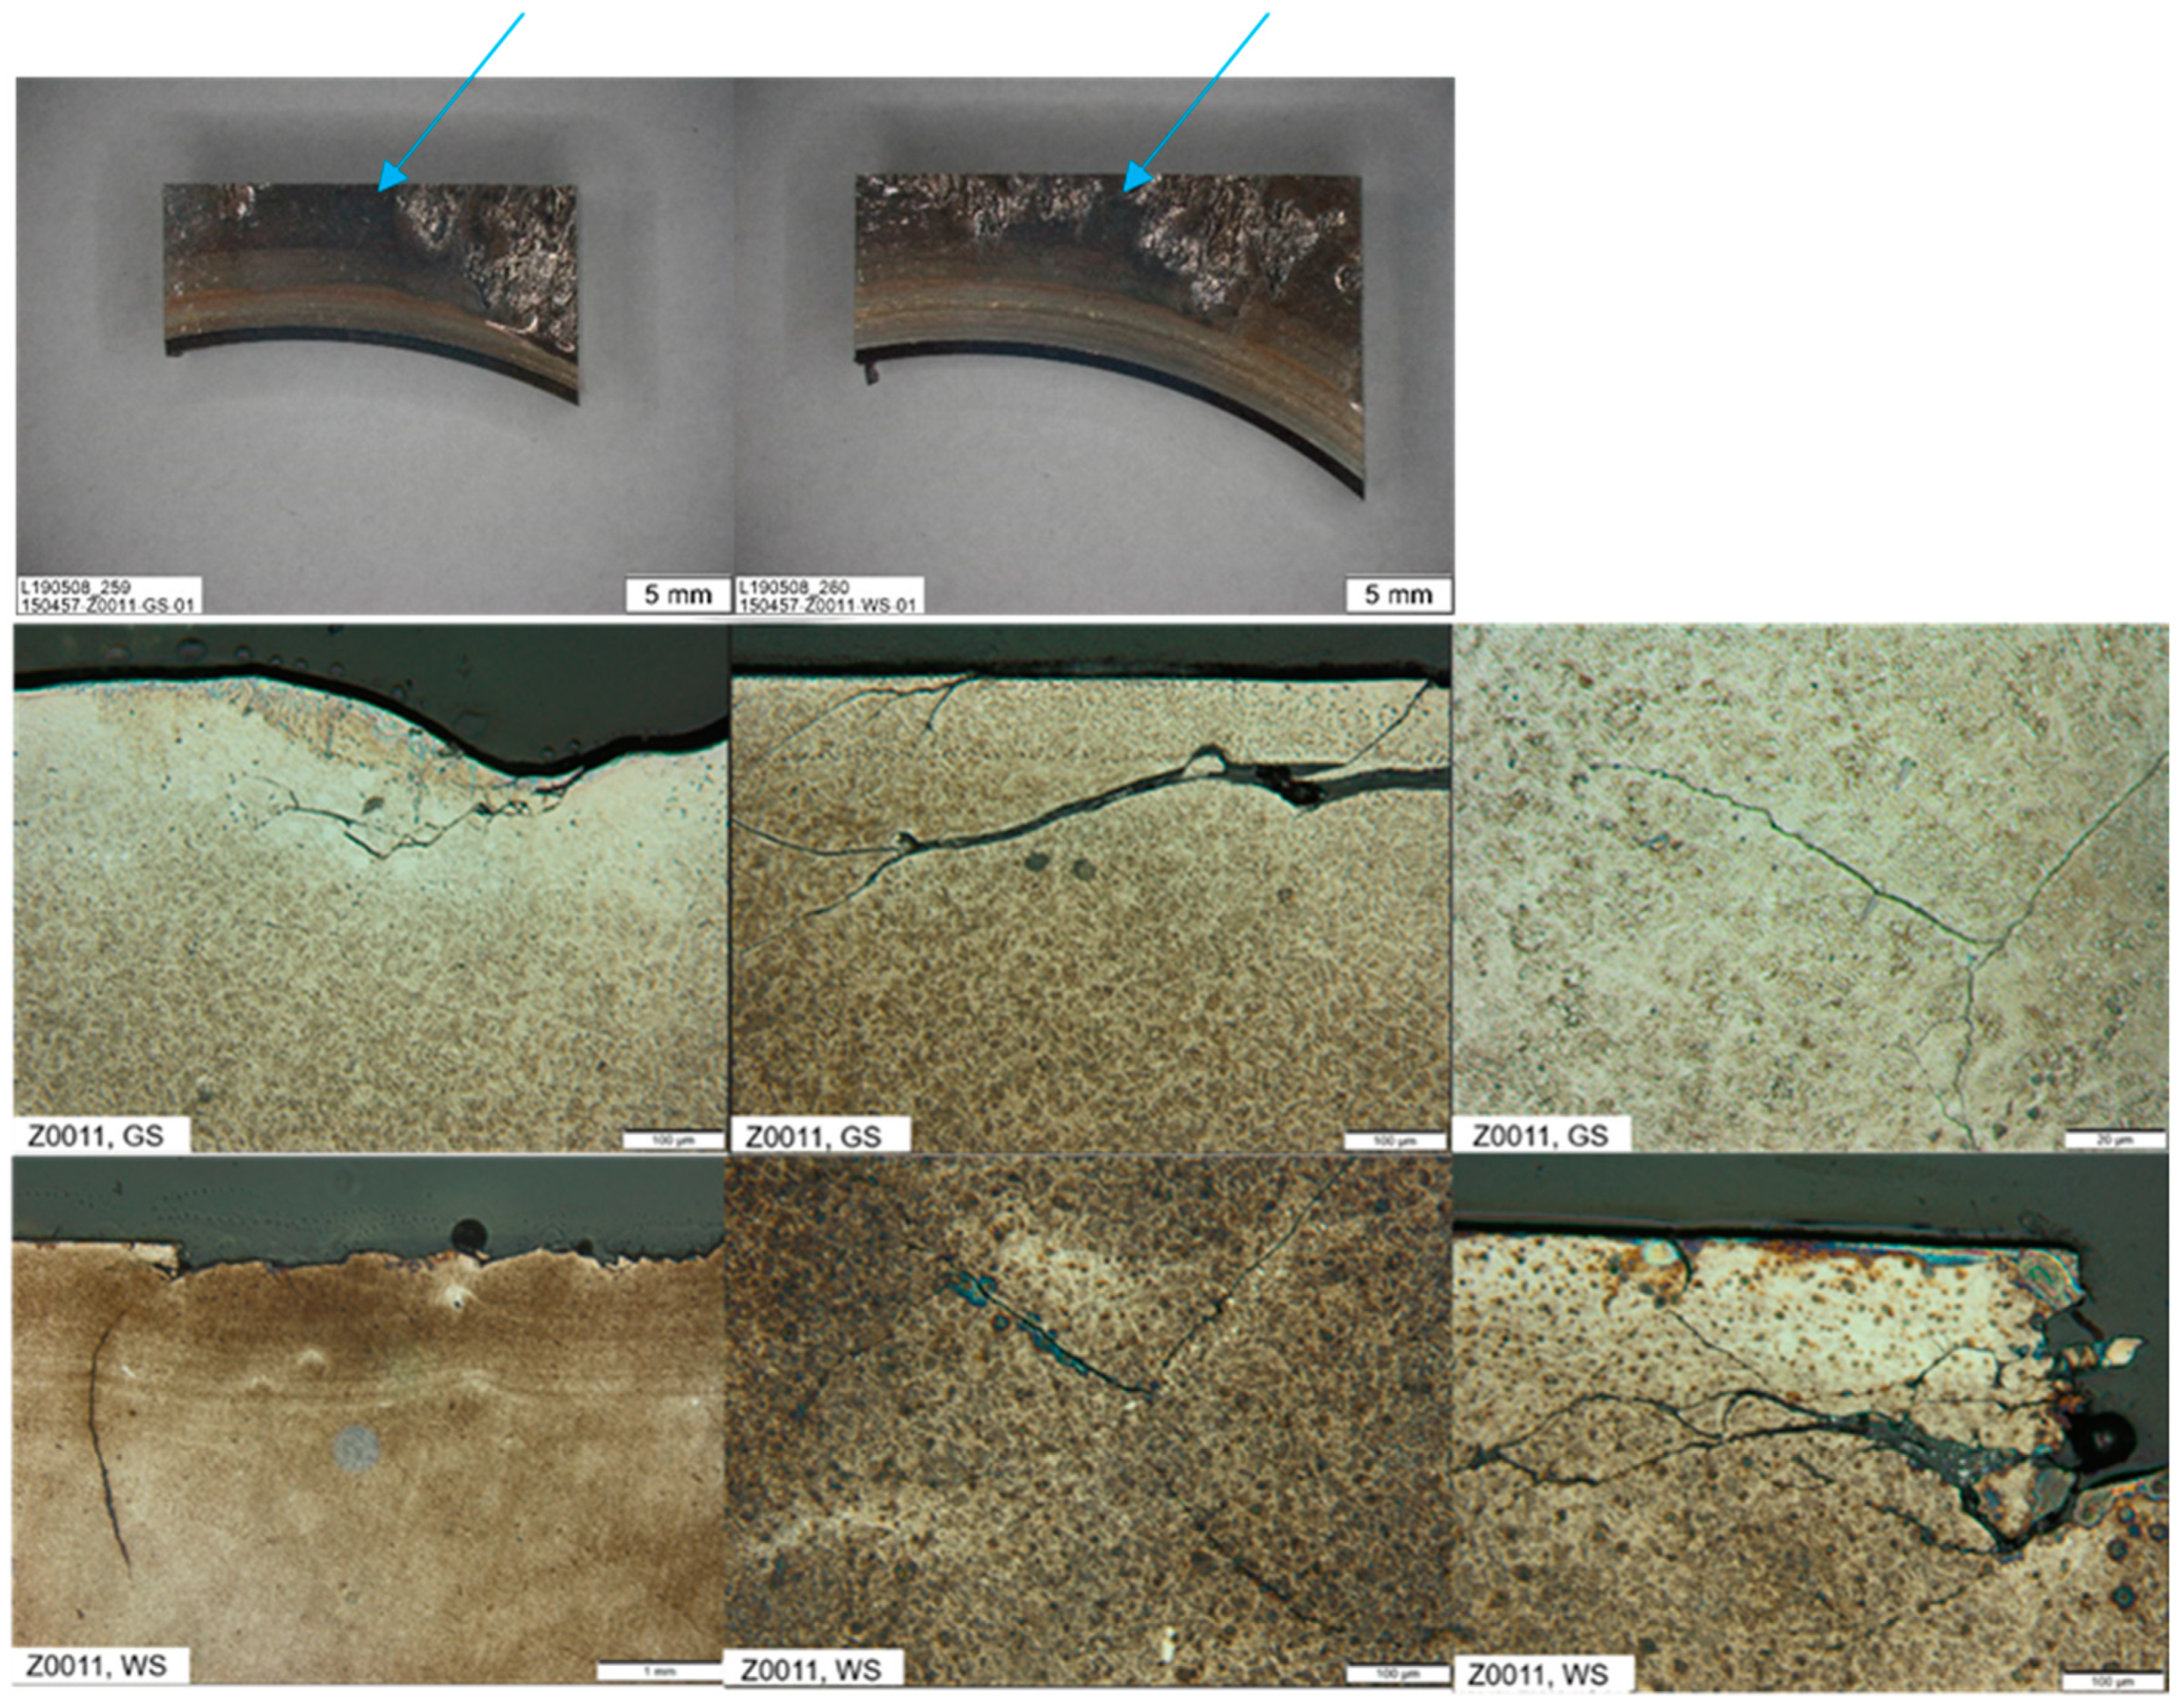
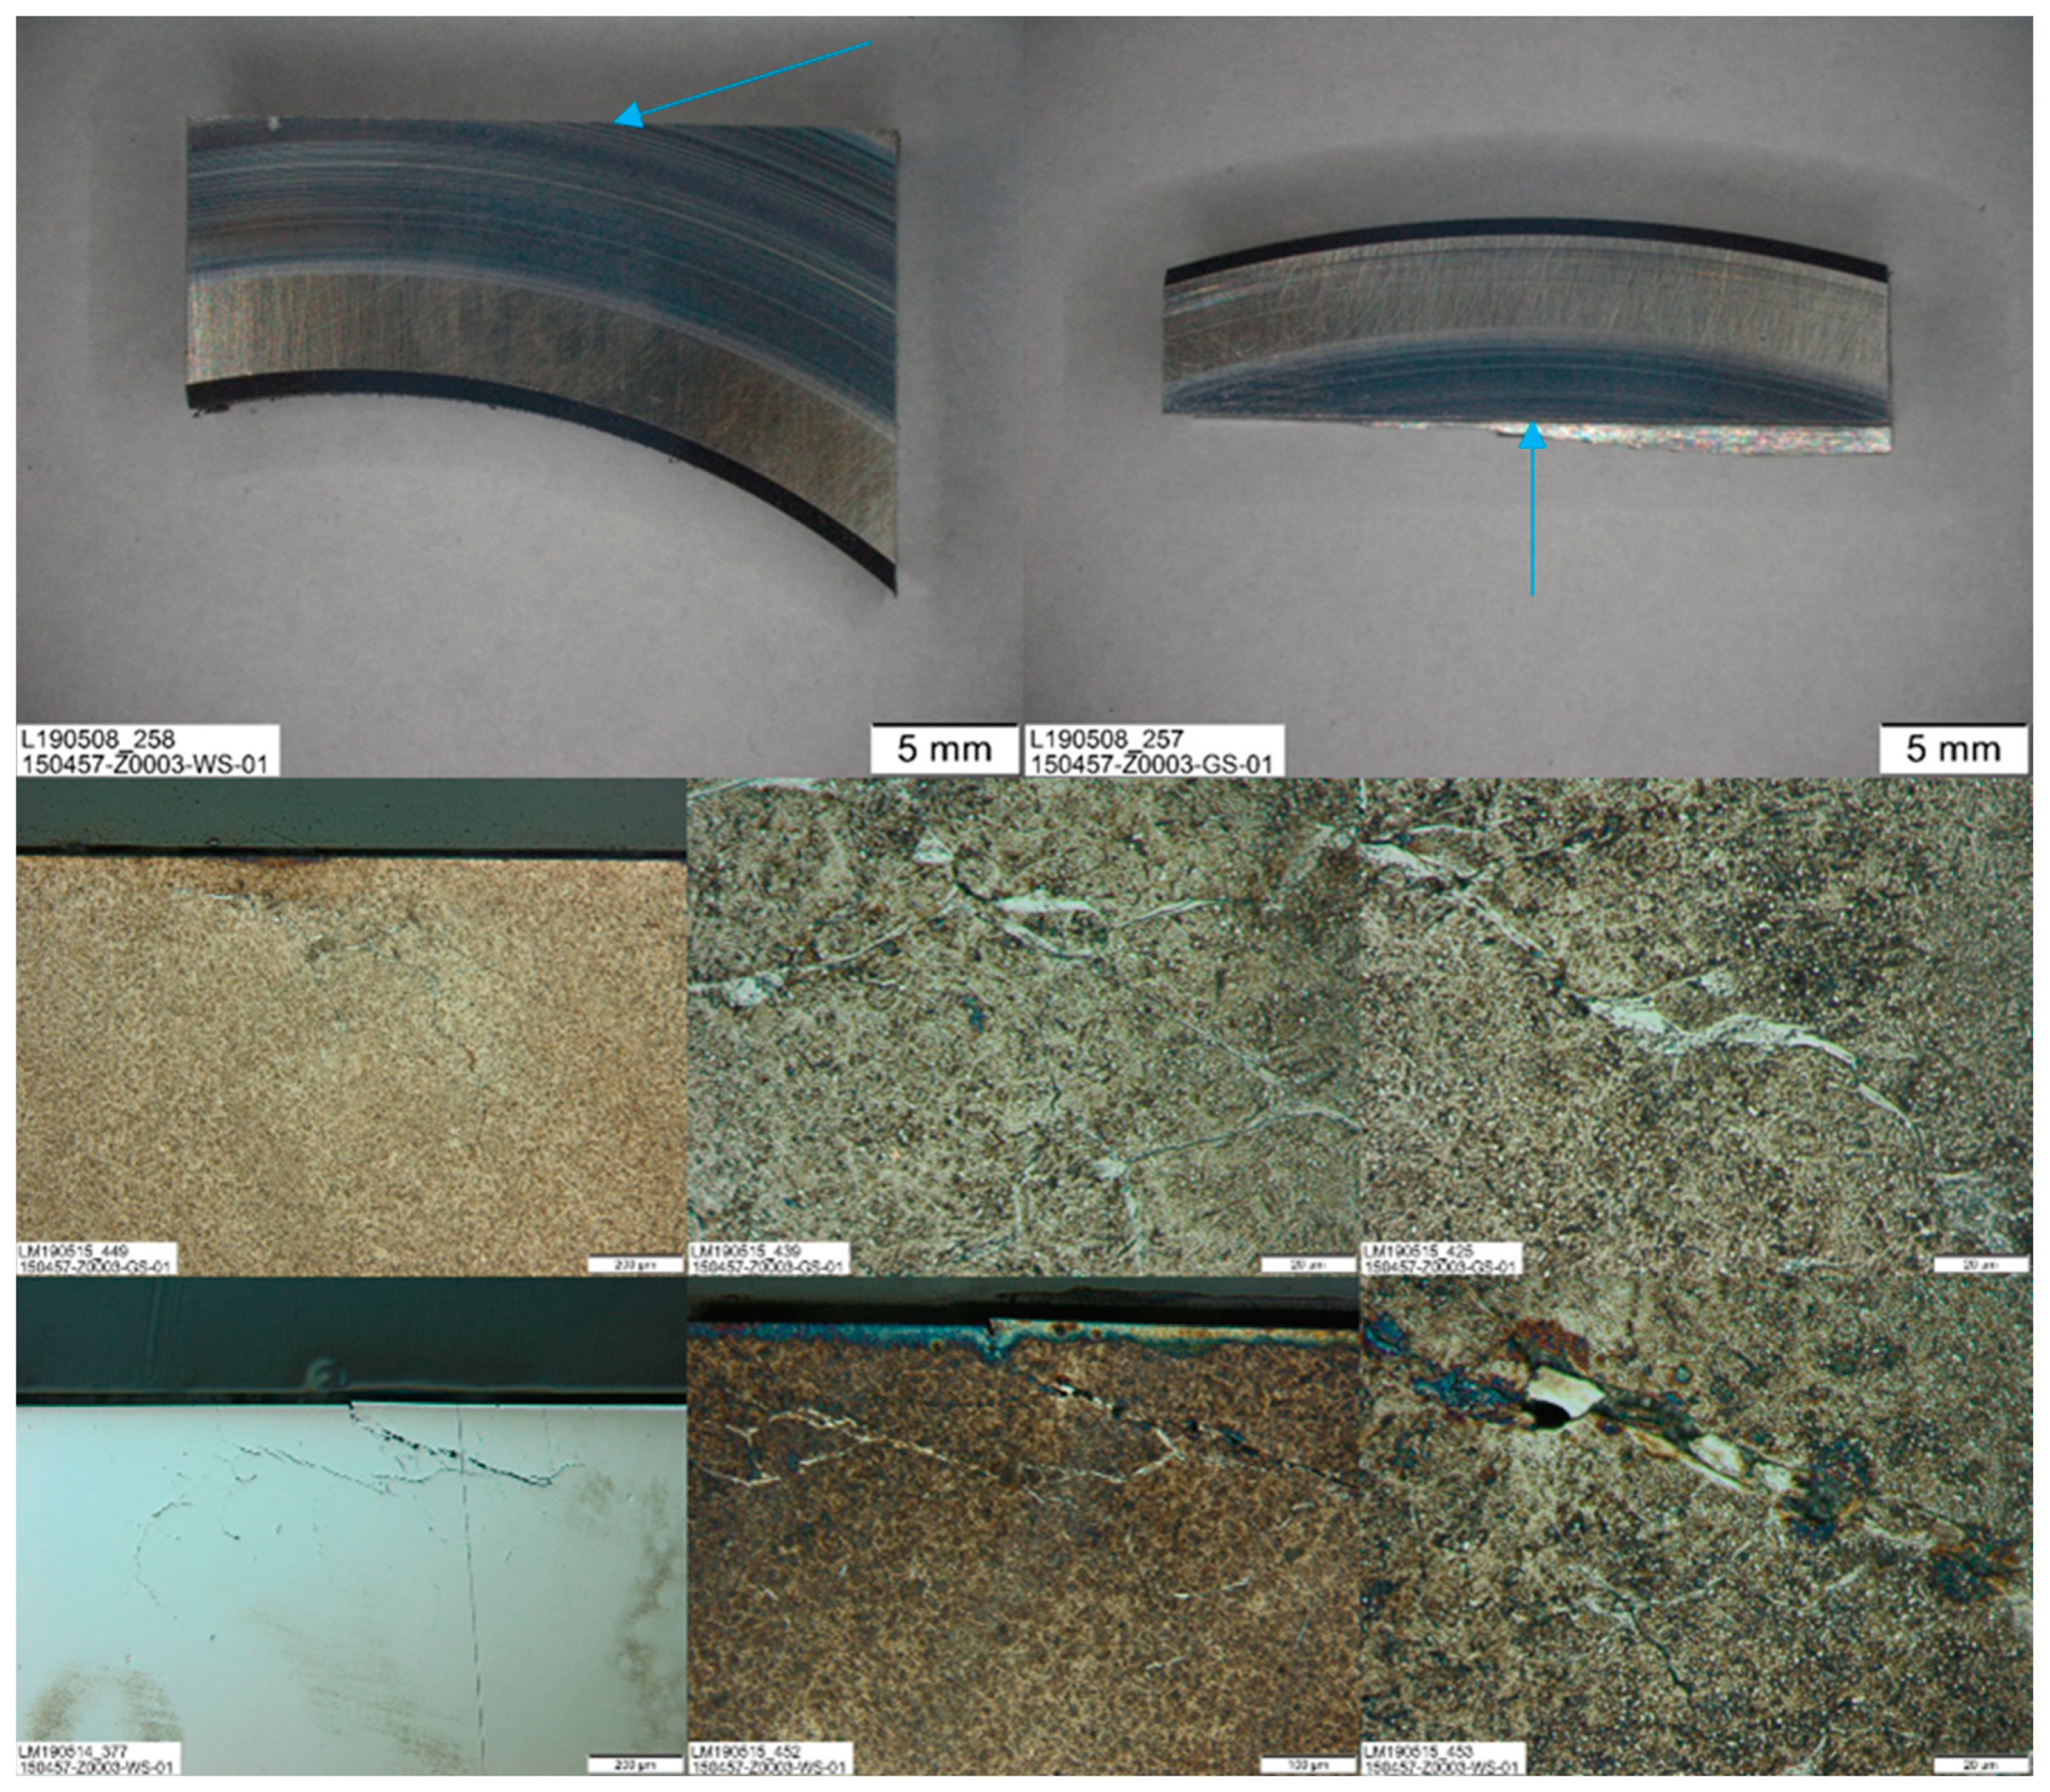
Both washers from low reference as well high reference washers show depositions of polyamide, most likely as a consequence of leaching them from the lubricant supply hoses. The relevance of deposits from auxiliary materials on WEC creation is not yet described in the literature. This is especially of interest, as the corresponding standard for the FE8 does not describe auxiliary materials, such as lubricant supply hoses, in detail [38]. Furthermore, other polyamide components, such as rolling element cages made out of polyamide, seem to be preferably used in FE8 test runs to study WEC (see Table A1). In this context, the repetitive finding of WEC through the use of polyamide hosing material in combination with the low reference lubricant is a novelty. In the same sense, the finding that the use of silicone or stainless steel hosing does not lead to WEC sheds a new light on the creation of WEC in industrial and automotive applications. The terminology of low and high reference lubricants in WEC-affected applications should be reconsidered.
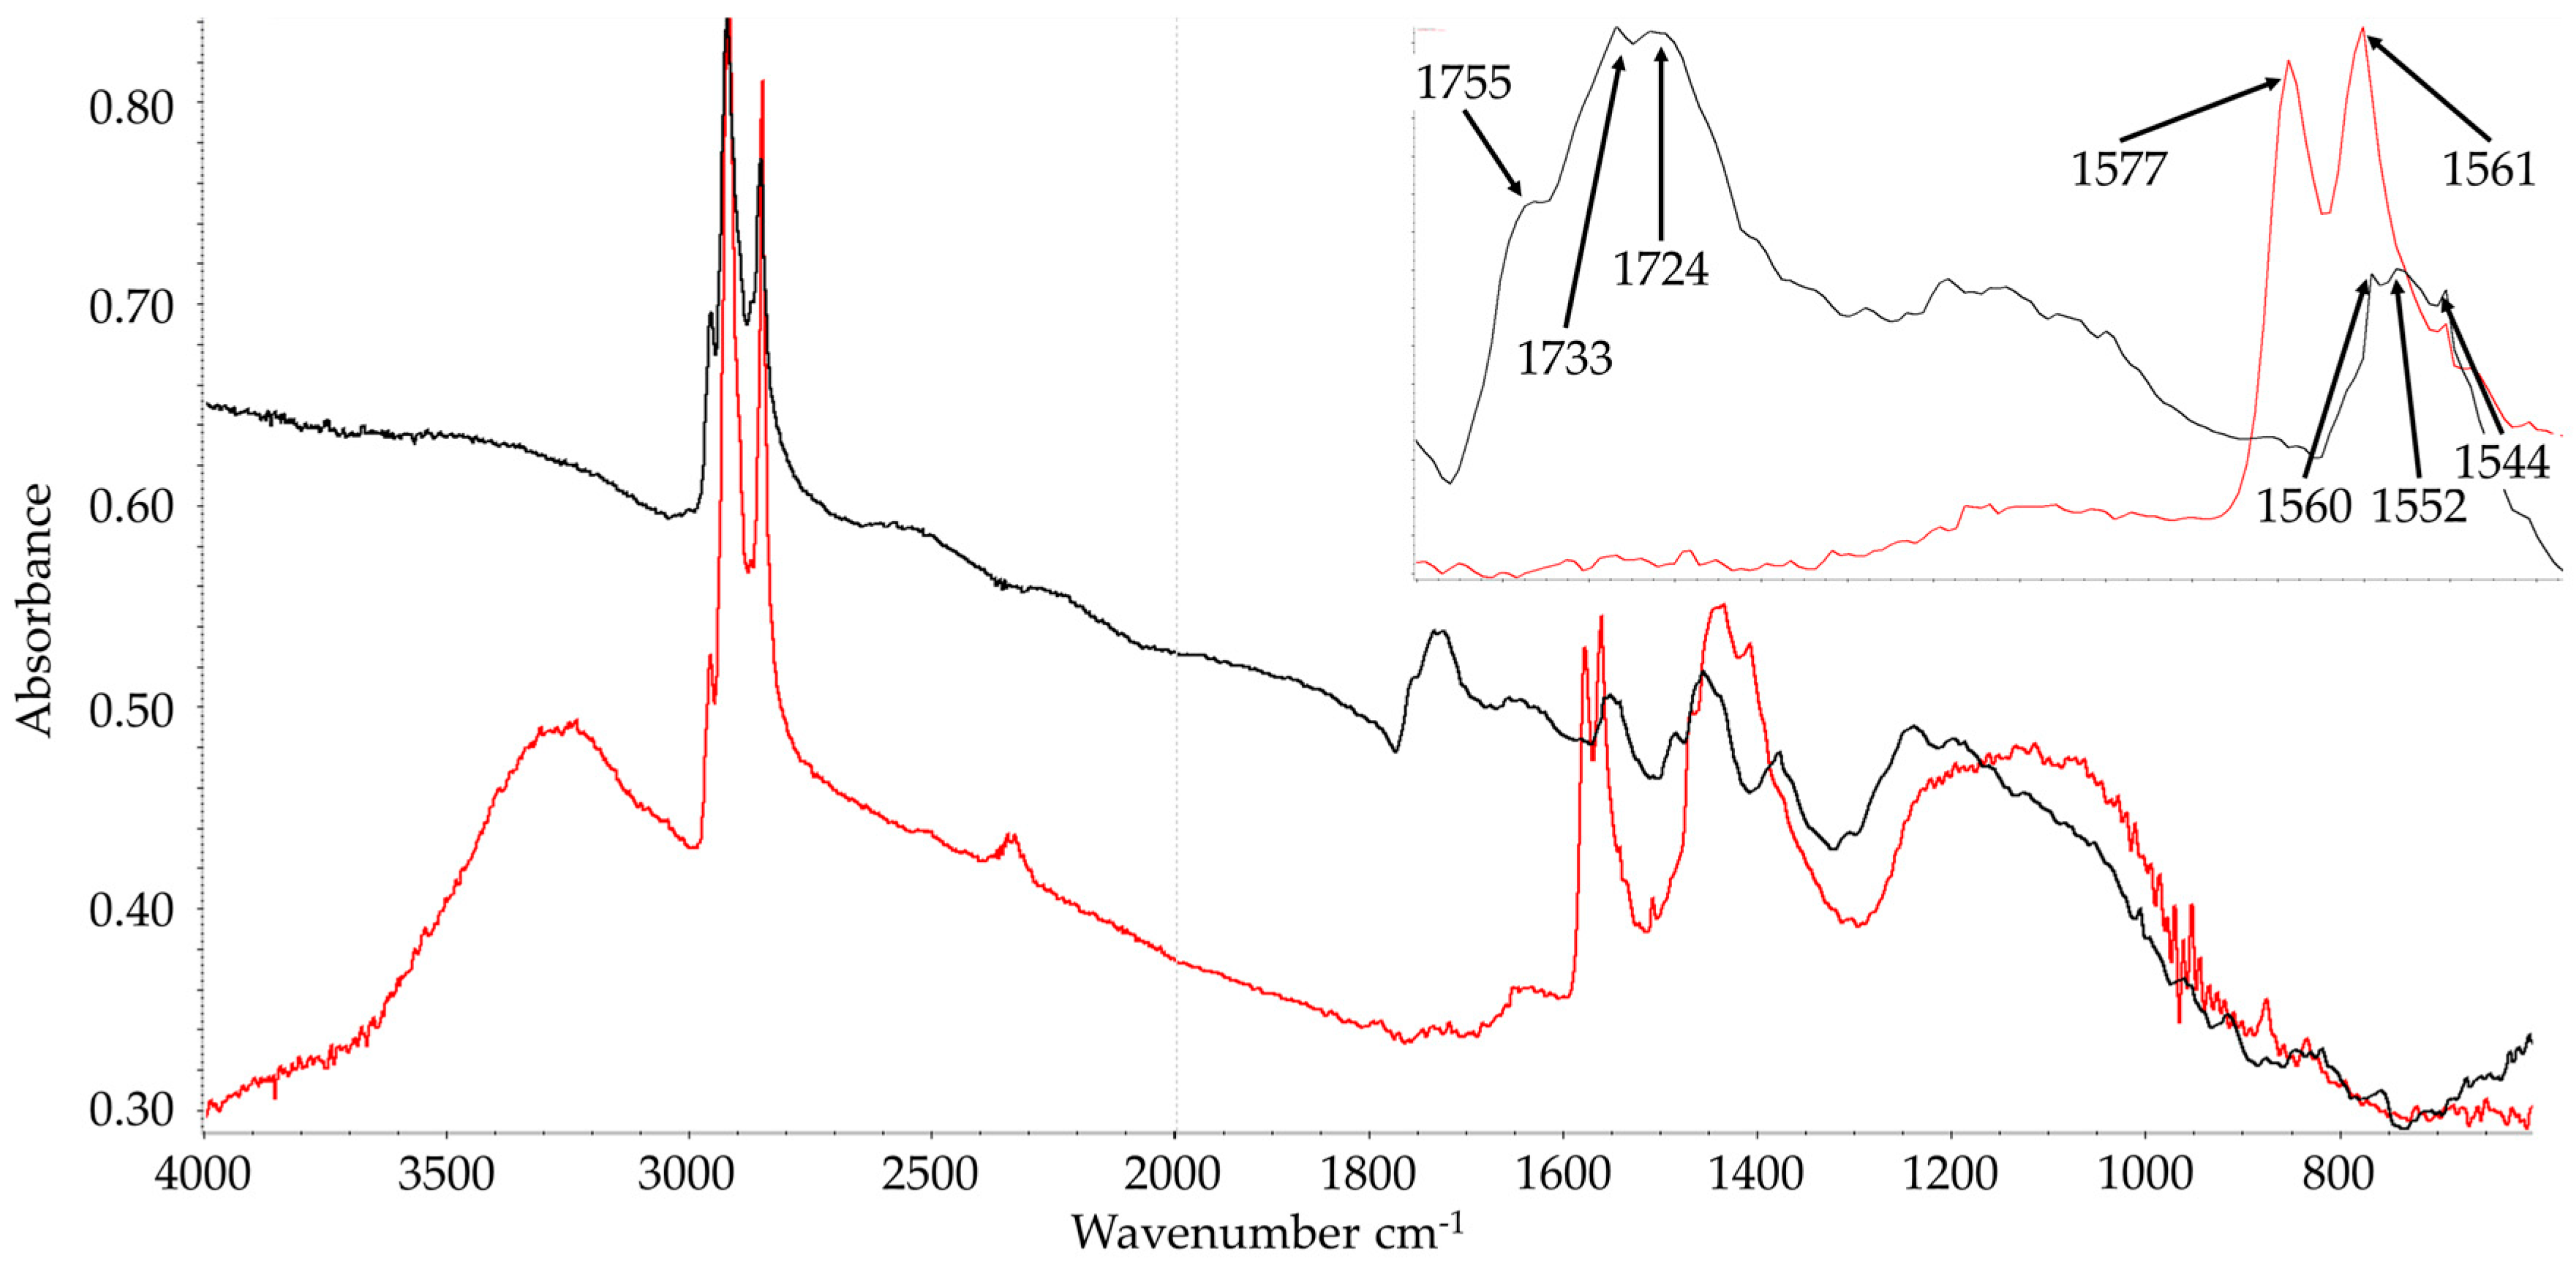
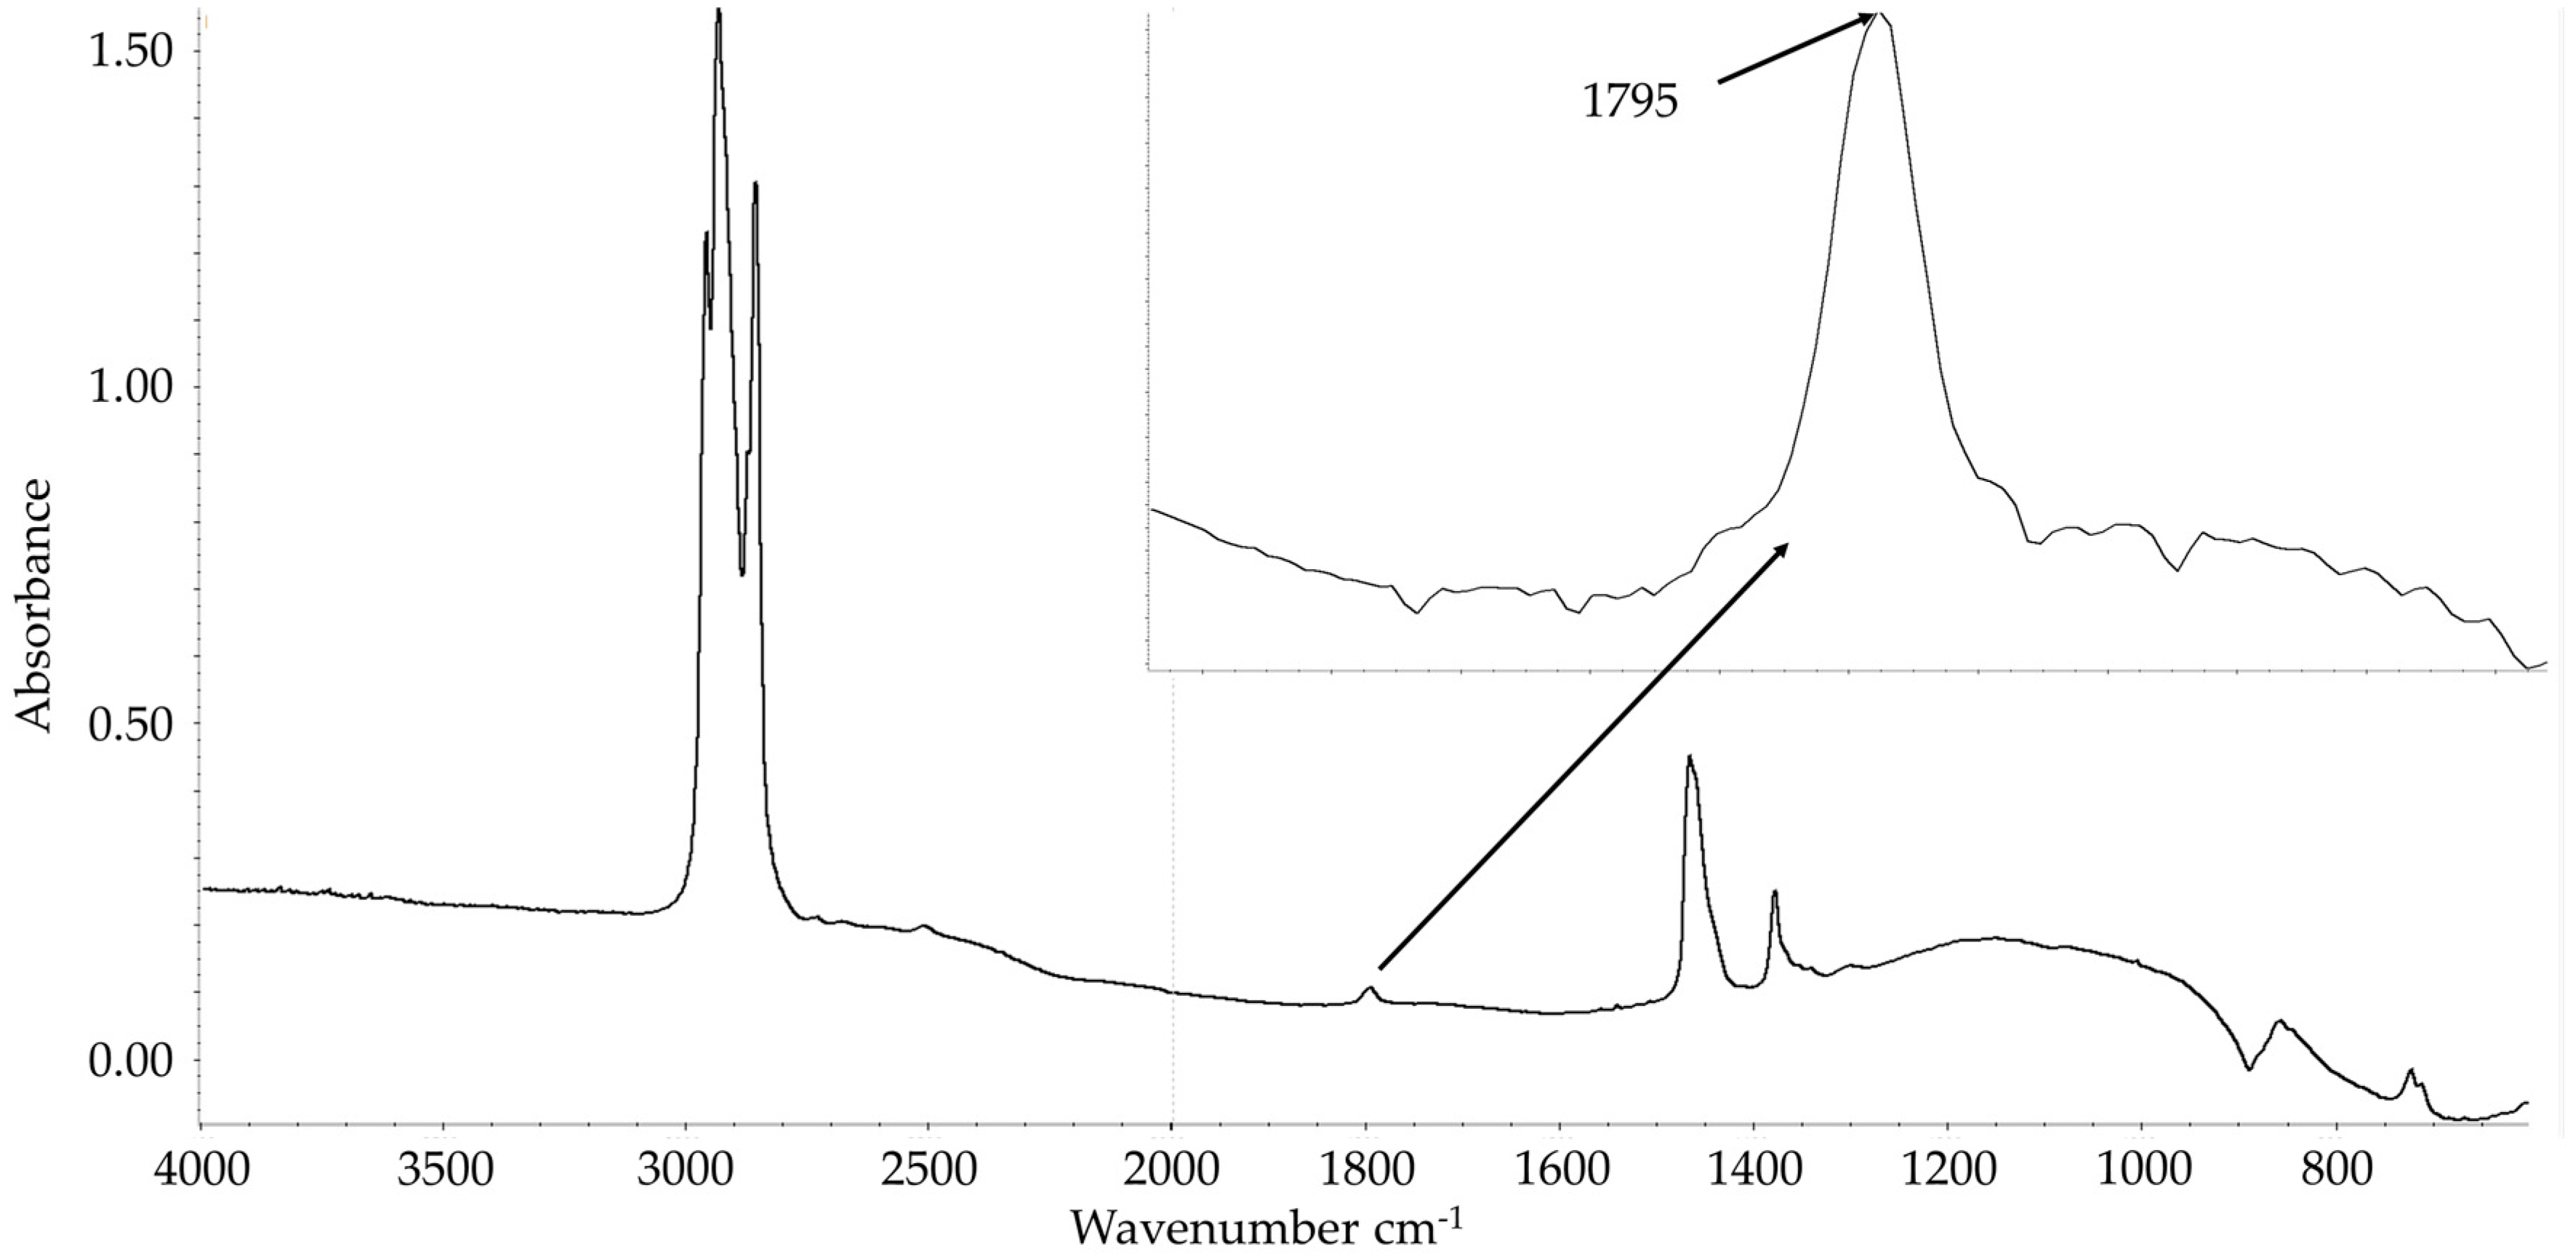
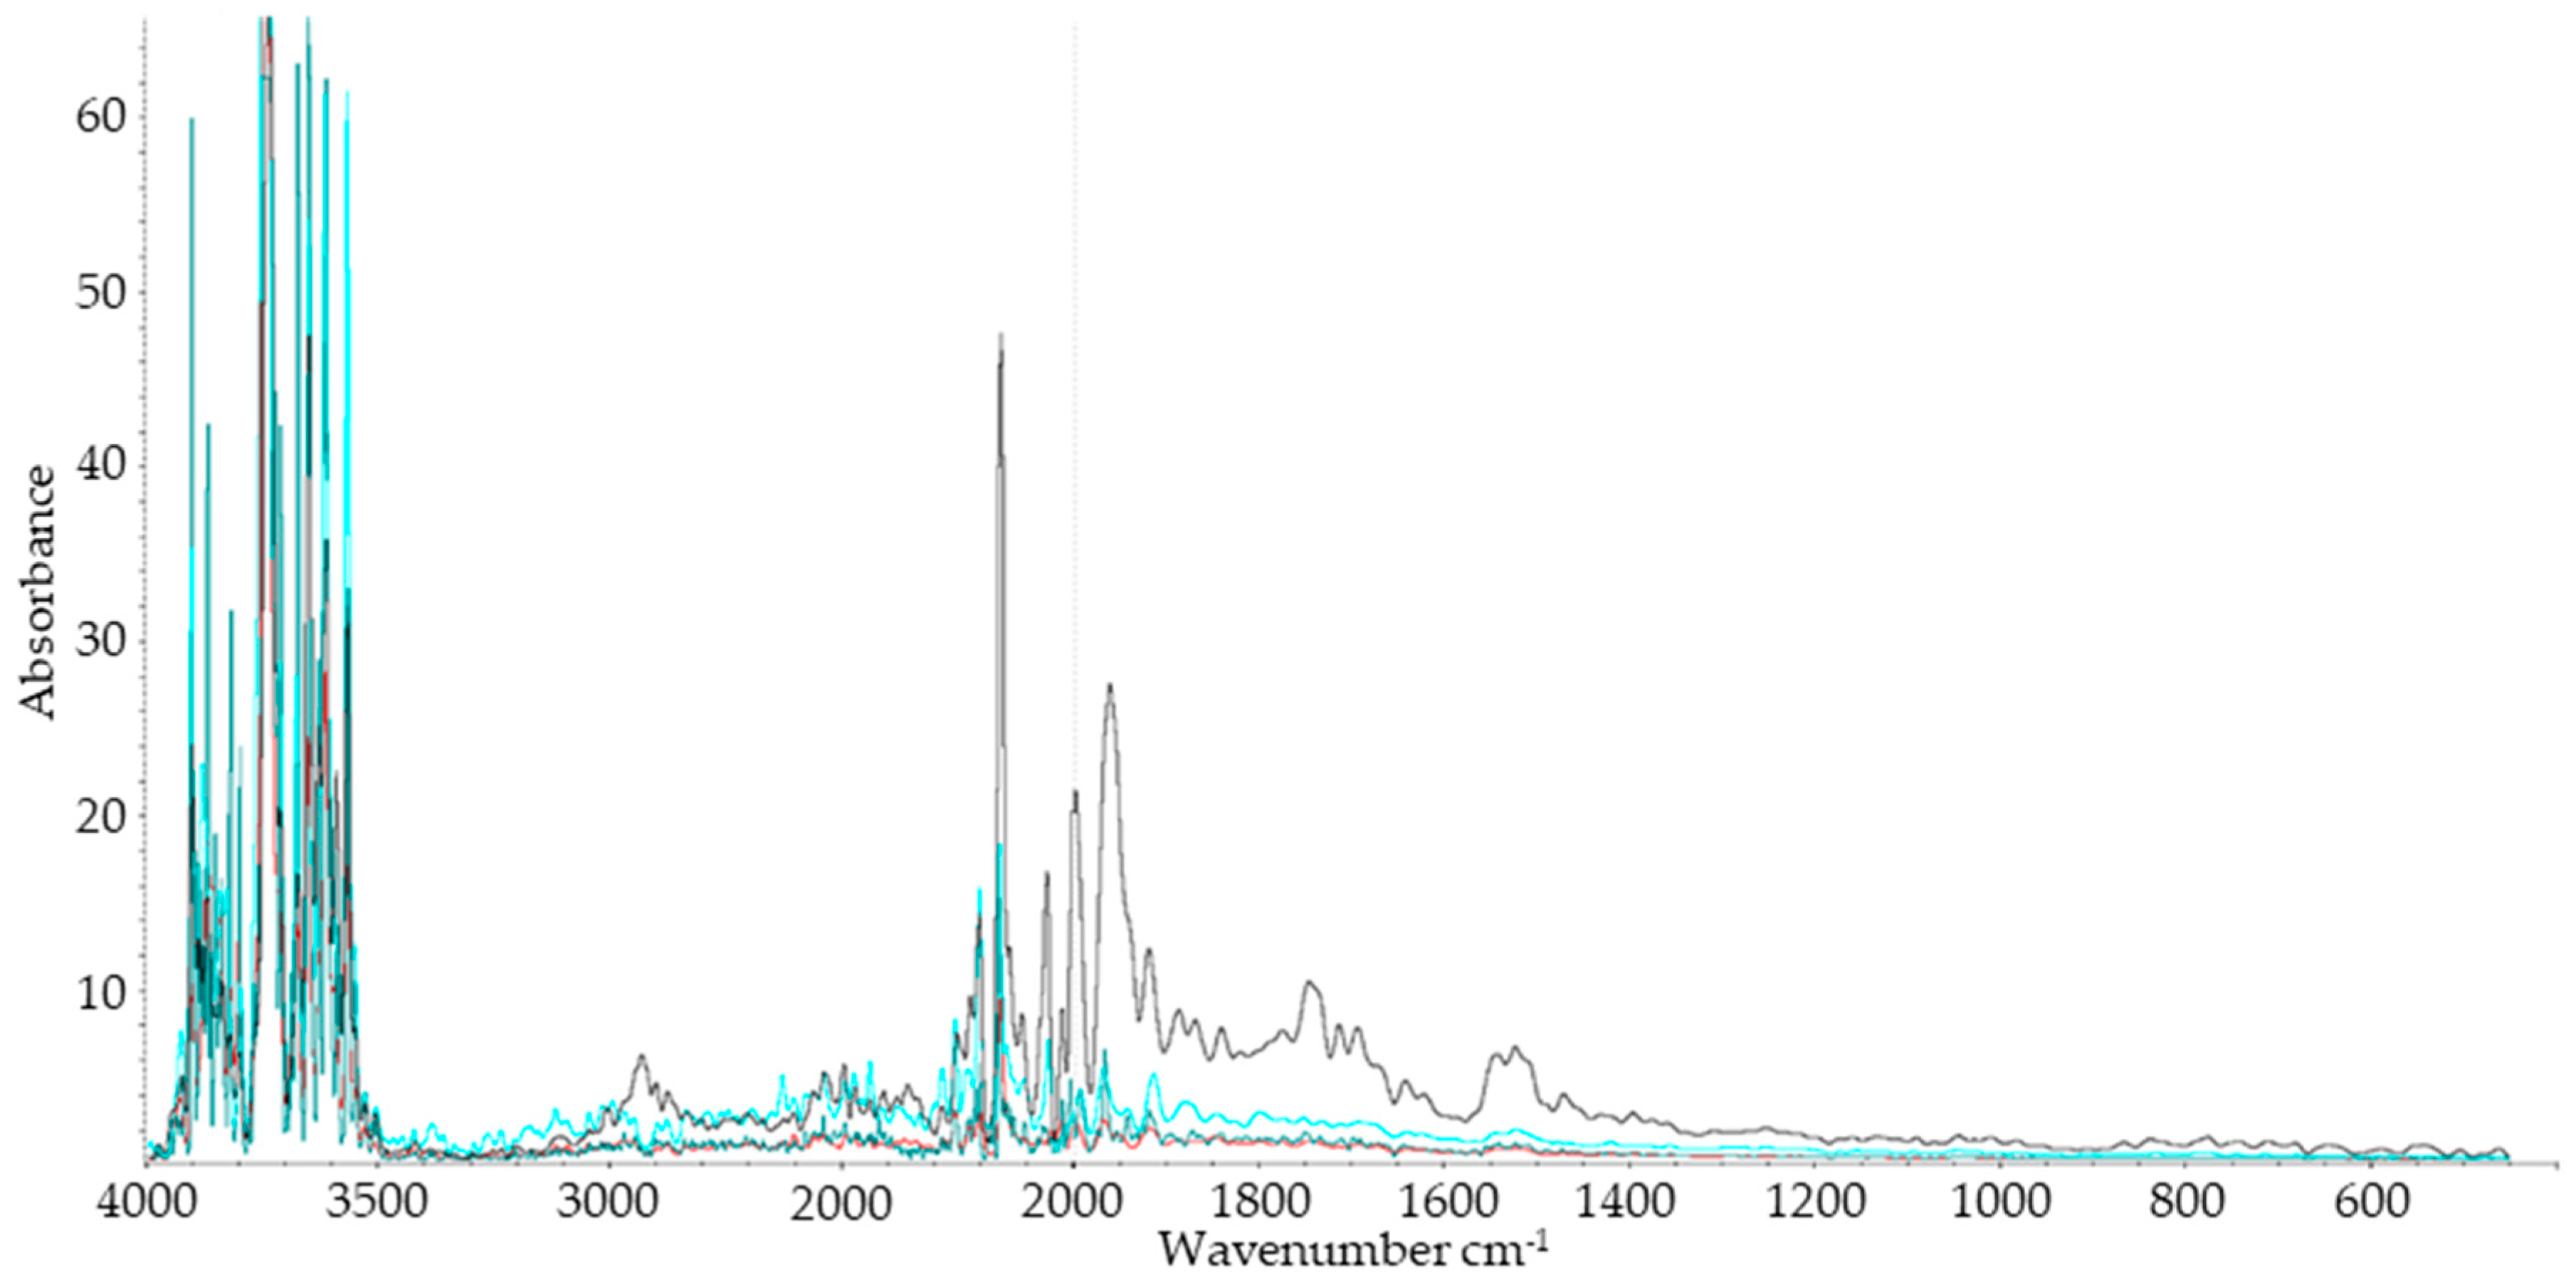
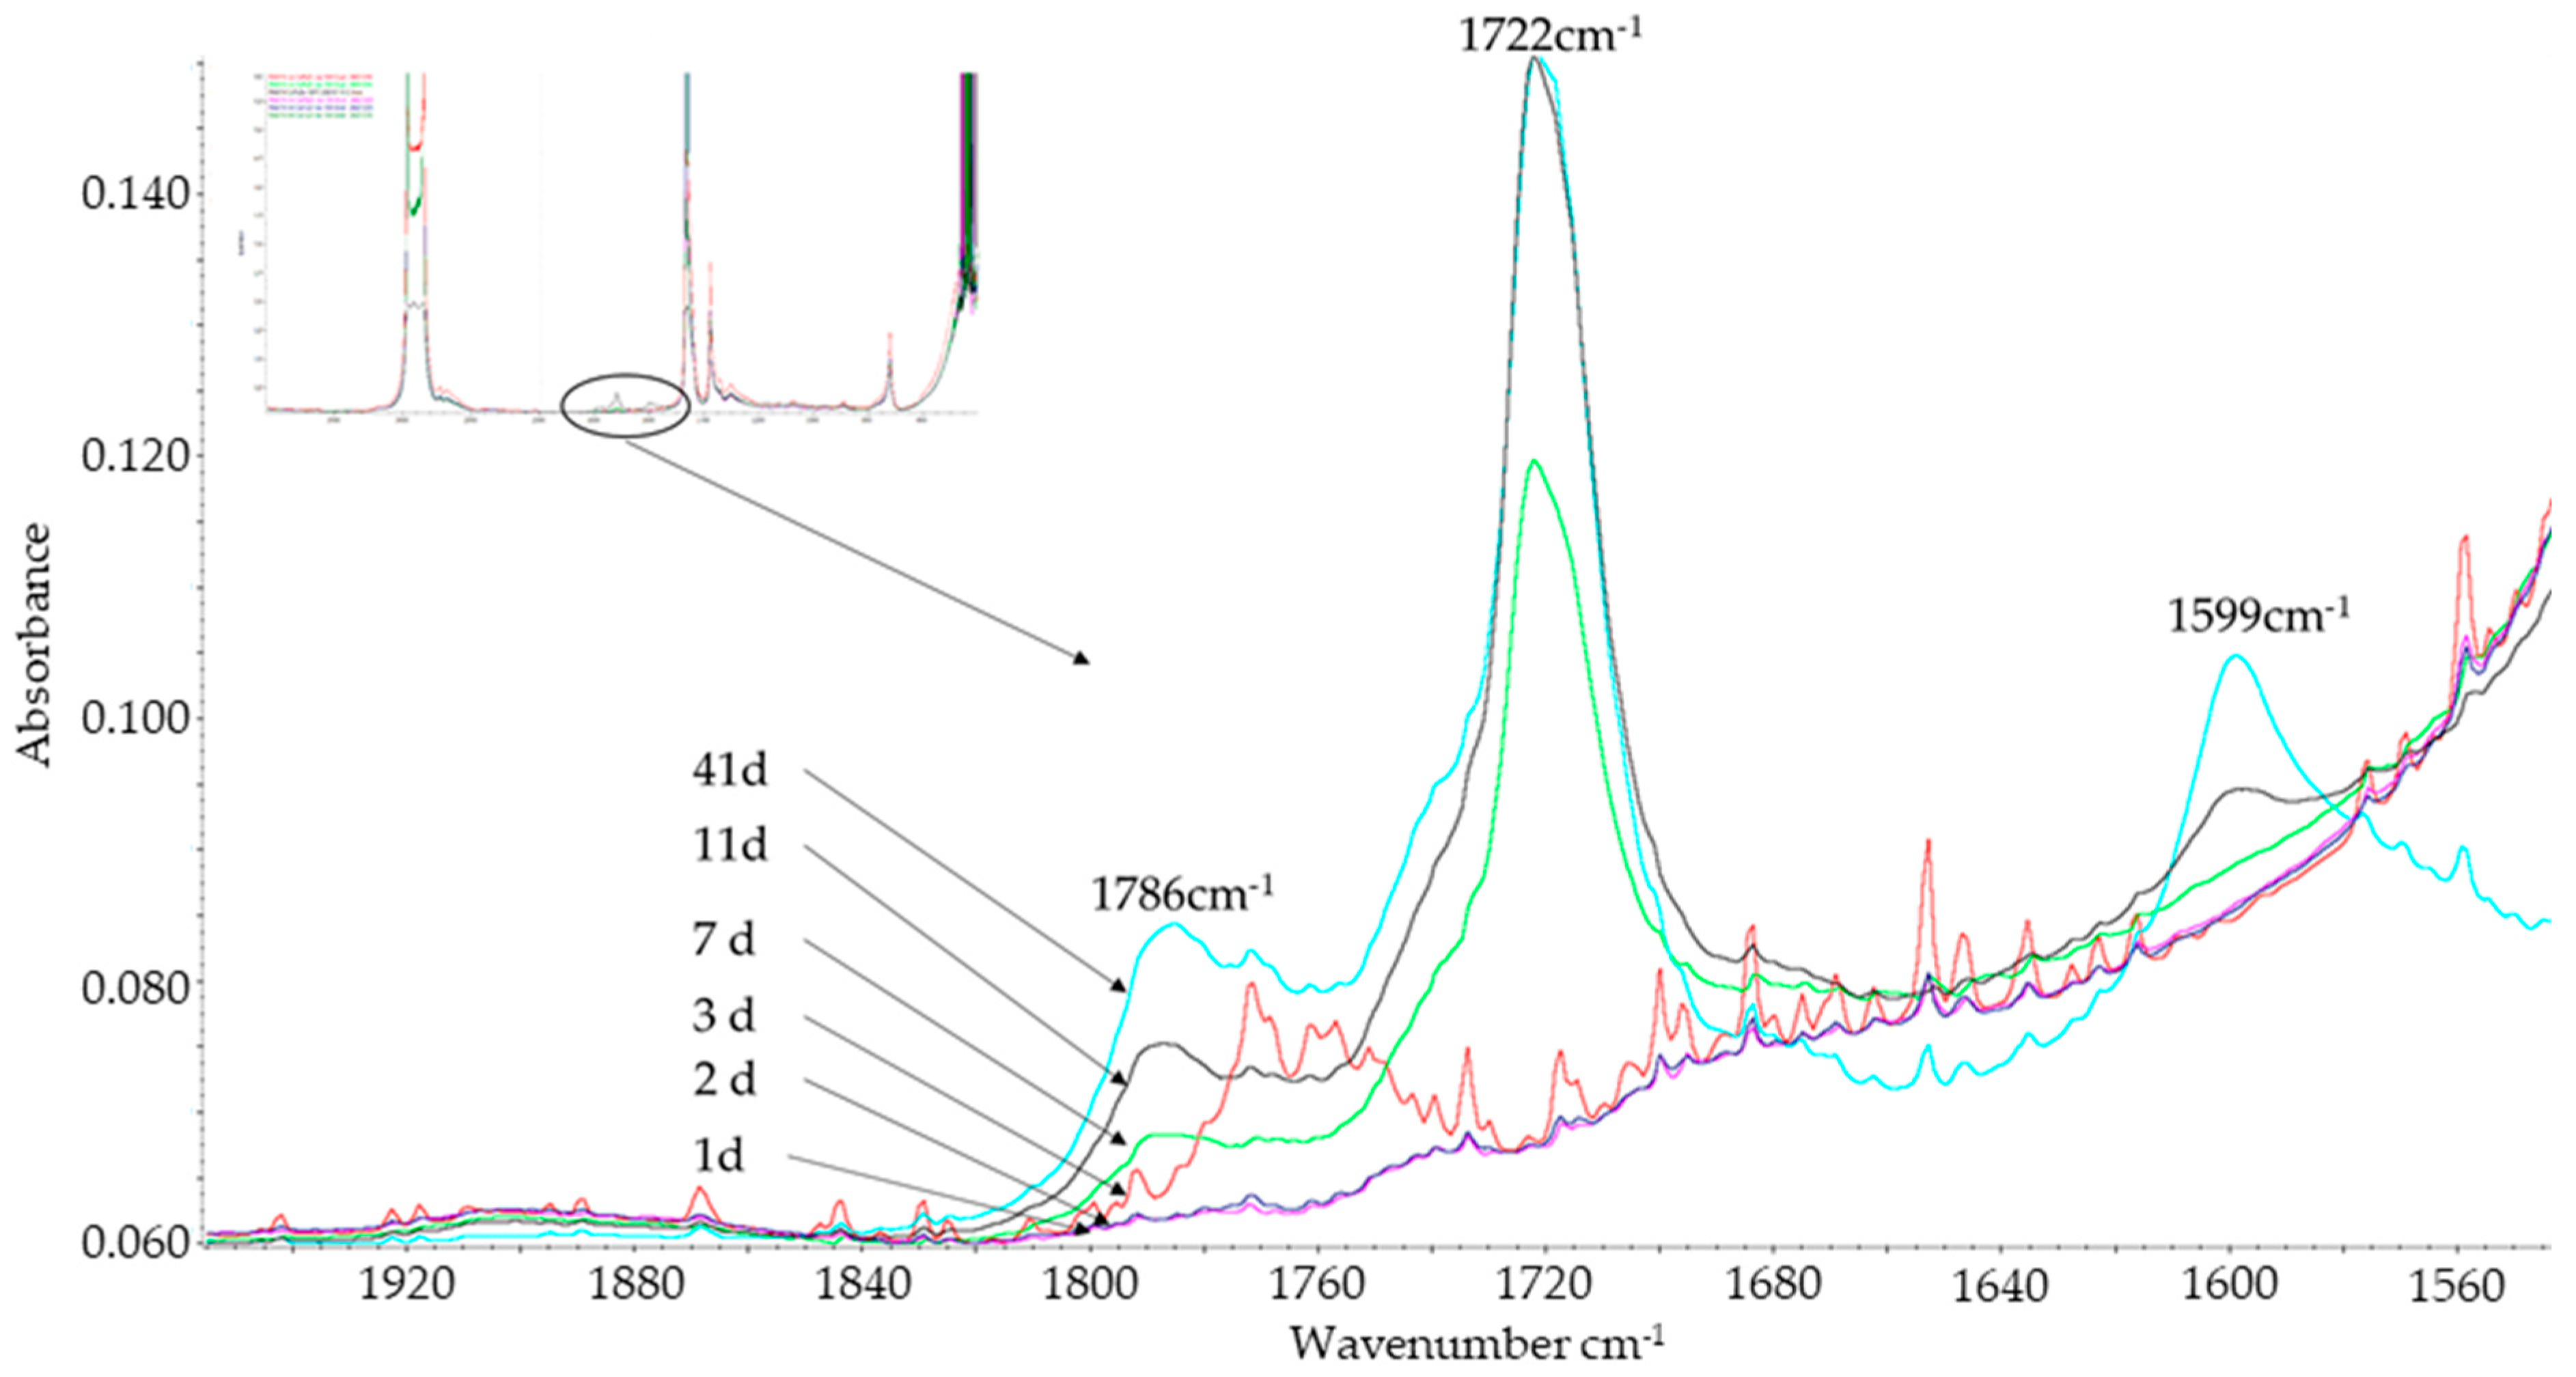
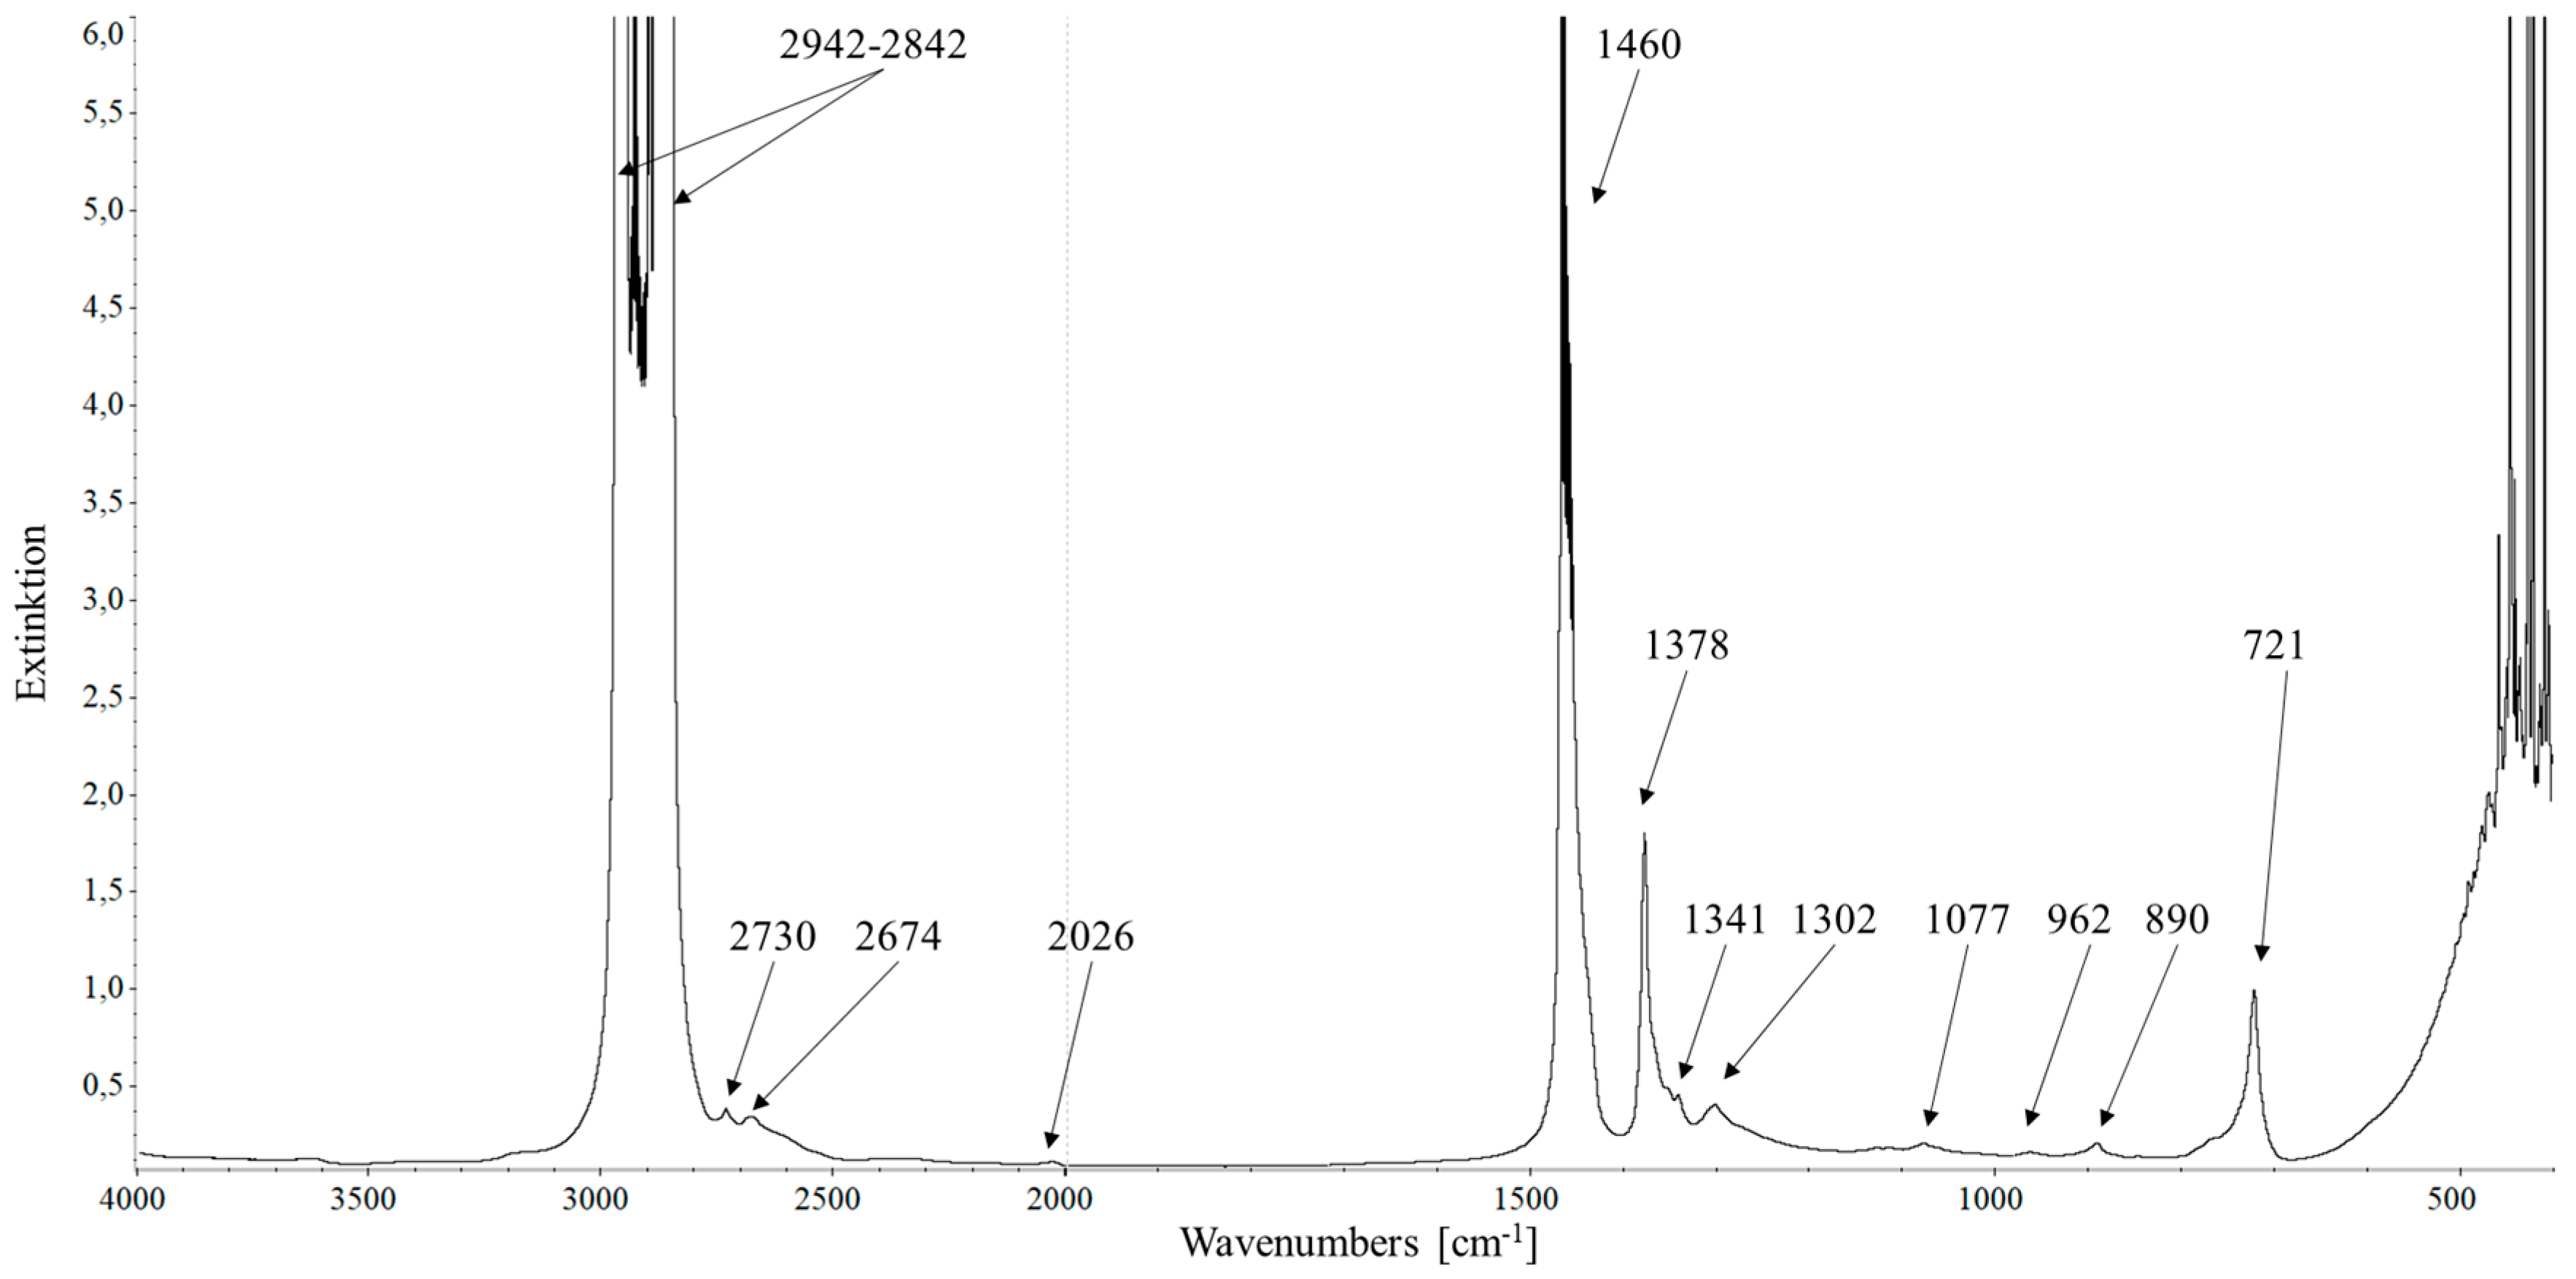
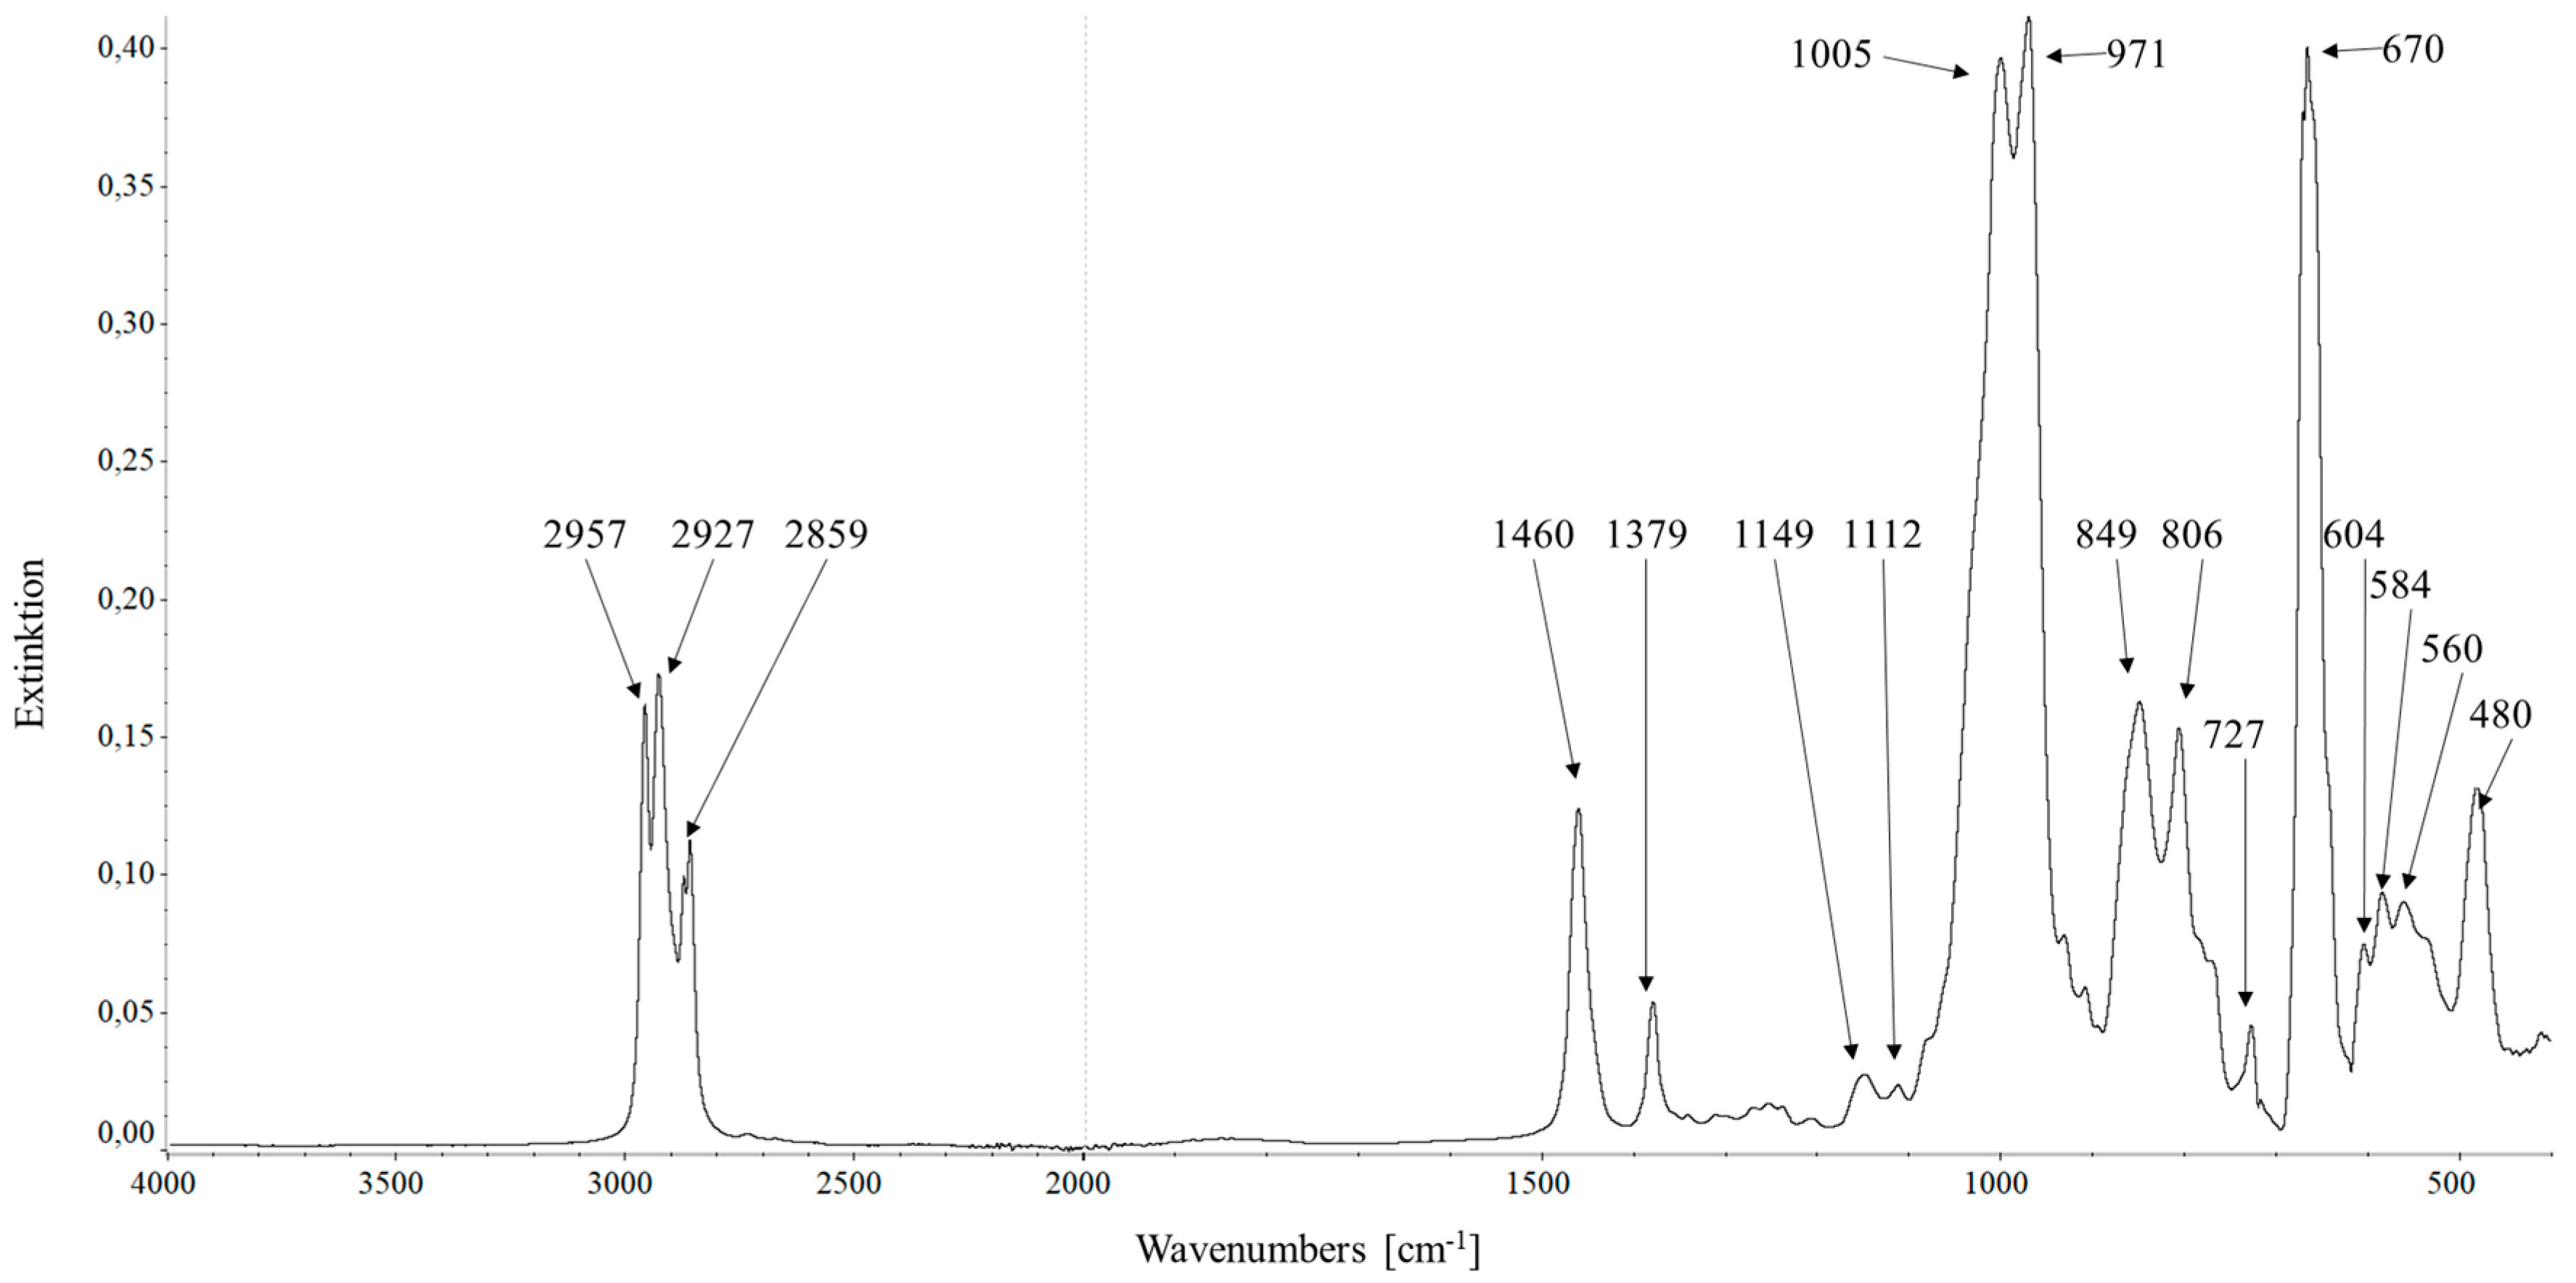
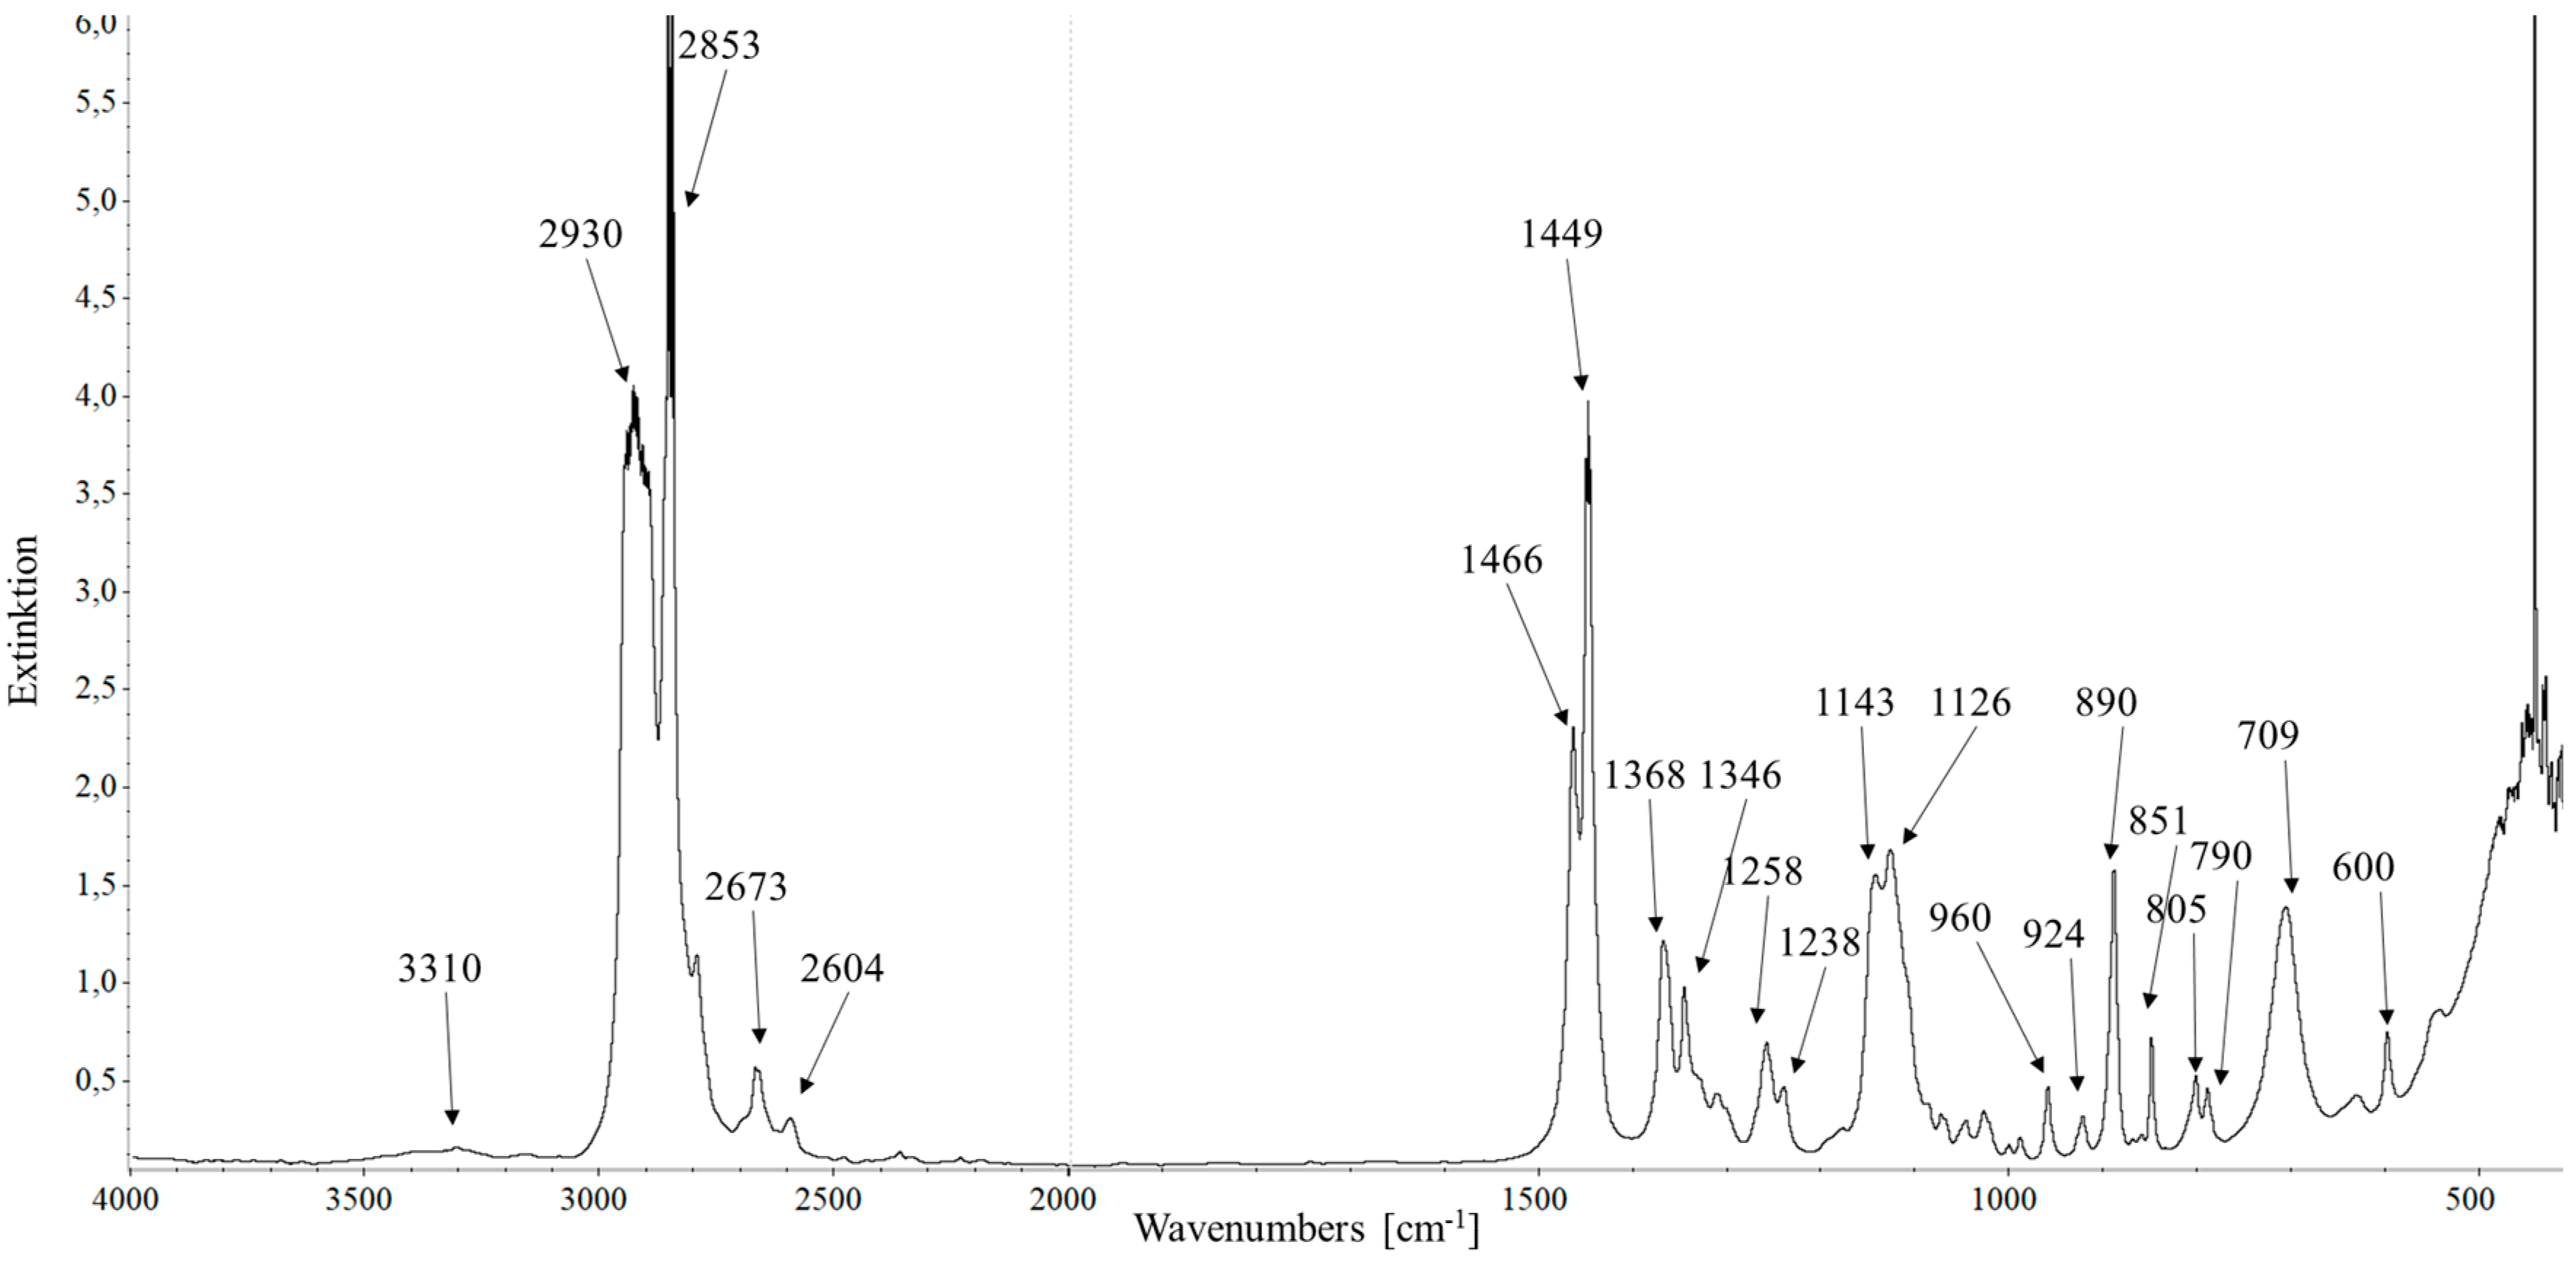
The bearing washers from both low and high reference oil-lubricated test runs exhibit a broad variety of functional groups at the surface, as identified with IR analysis (refer to Table 4 for an overview). The formation of a large share of the identified functional groups, such as alcohols, ketones, carboxylic acids, esters, and anhydrides, can be explained by hydrocarbon oxidation. Hydrocarbon oxidation, which is a free radical reaction, follows three primary stages: a relatively slow initiation phase, a propagation step, and eventual termination [44,45]. The initiation step starts with the formation of an R● –radical, most likely supported in this case by the presence of traces of transition metal ions (e. g. Fe, Cr, Cu). The active peroxide radical (R-OO●) is formed by a reaction with oxygen. The latter reacts with alkanes R-H to form alkane hydroperoxide (R-OOH) and alkyl free radicals (R●), thus maintaining the chain reaction. The reaction possibilities in the course of alkane oxidation are manifold, and some of the mechanisms were not fully understood until now. Possible pathways resulting in the identified functionalities summarized in Table 4 are presented in the following Equations. Alcohols can be achieved in two main ways: through a propagation reaction as presented in Equation (1), or via a combination of two peroxyl radicals as shown in Equation (2), together with the formation of a ketone [45].
Lubricants 12 00045 i001
Lubricants 12 00045 i002
It is also described that the alkyl hydroperoxides rearrange into a semi-acetal, which then produces an alcohol and an aldehyde (3) [44].
Lubricants 12 00045 i003
The aldehyde formed according to (3) reacts with oxygen to a peracid (4), and forms a very labile adduct with another aldehyde molecule (5) [44].
Lubricants 12 00045 i004
Lubricants 12 00045 i005
In the presence of water, the product resulting from (5) would be transformed into two molecules of fatty acids. Without water, which is the case in the test runs and the static test, one molecule of fatty acid anhydride and two molecules of fatty acid are formed (6) [44].
Lubricants 12 00045 i006
The esters identified on the washers are described in the literature as being formed through a Baeyer–Villiger oxidation, which begins with a peracid and a ketone (7) [44,45]. Alternatively, the formation of esters could occur through the reaction of a carboxylic acid with an alcohol.
Lubricants 12 00045 i007
Soap formation is described in the literature by attacking the metal surface with alkyl peroxy radicals or alkyl hydroperoxide, as shown in (8). The resulting ferrous oxide (in (8), FeO is shown as one representative of several oxides on the surface) forms soaps by a reaction with carboxylic acids (9) [46,47].
Lubricants 12 00045 i008
Lubricants 12 00045 i009
The presence of free carboxylic acids on the low reference washer in contrast to the high reference washers indicates fewer possibilities for the carboxylic acid to react with iron oxide in the low reference test run according to the mechanism presented in (8) and (9). Compared to the static test, exposing PAO to Fe, Cu, and Zn-powder at an elevated temperature of 100 °C, reactions within the FE8-tribocontact take place much faster and with a broader variety of reaction products. The authors in [47] showed that exposure to tribological stress reduces the inception time of alkane oxidation by three times for the appearance of a carboxyl-IR-peak. This refers to the field of mechanochemistry. In mechanochemistry, mechanical work is used to modify chemical reactions. Mechanical work can be concentrated onto a certain part of a solid, leading to the breakage of inter-atomic bonds and introducing defects around it, enhancing the activity. Through this activation, a part of the activation energy necessary for a chemical reaction is supplied by mechanical work. It could also be the case that the actual activation energy needed is decreased by mechanical work. The application of mechanochemistry to the lubrication of a solid contact is called tribochemistry and tribocatalysis [48,49].
Within both the high reference test runs and the static tests, copper carboxylates are most likely seen as a peak at approx. 1600 cm−1. This peak is not found in the low reference case (PAO/ZDDP/DCHA). Copper is known to form stable complexes with amines. Despite the fact that the complex stability for secondary amines is lower compared to primary amines [50], it is quite likely that the dicyclohexylamine forms a complex with copper ions blocking the copper soap formation. As another possibility for the absence of copper soaps, an exchange of Zn by Cu is reasonable [51,52,53].
Small IR peaks from low reference bearing washers after a test run of 18 h indicate the presence of alkenes. Alkene formation apart from catalytically degradation is described to take place above 350 °C by dehydrogenation when accompanied by hydrogen liberation, shown in Equation (10), or chain splitting, shown in Equation (11) [44].
Lubricants 12 00045 i010
Lubricants 12 00045 i011
A mechanism of stepwise cleavage of carbon chains is suggested by the authors of [54]. According to their findings in a study with a pin-on-disc tribometer and a paraffinic lubricant at room temperature, a mechanism is suggested that uses an alkene formation on a nascent steel surface followed by a further cleavage of the hydrocarbon chain into smaller molecules and carbon deposits, with each step accompanied by hydrogen liberation.
The presence of an amide functionality on the bearing washer is indicated even without PA-lubricant hosing in the low reference test run using a silicone hose. A formation during the test run is therefore likely. Carboxylic acids are, in general, able to form amides at elevated temperatures with amines [55] such as DCHA, thus explaining the formation of amide functionalities in the PAO/ZDDP/DCHA test run.
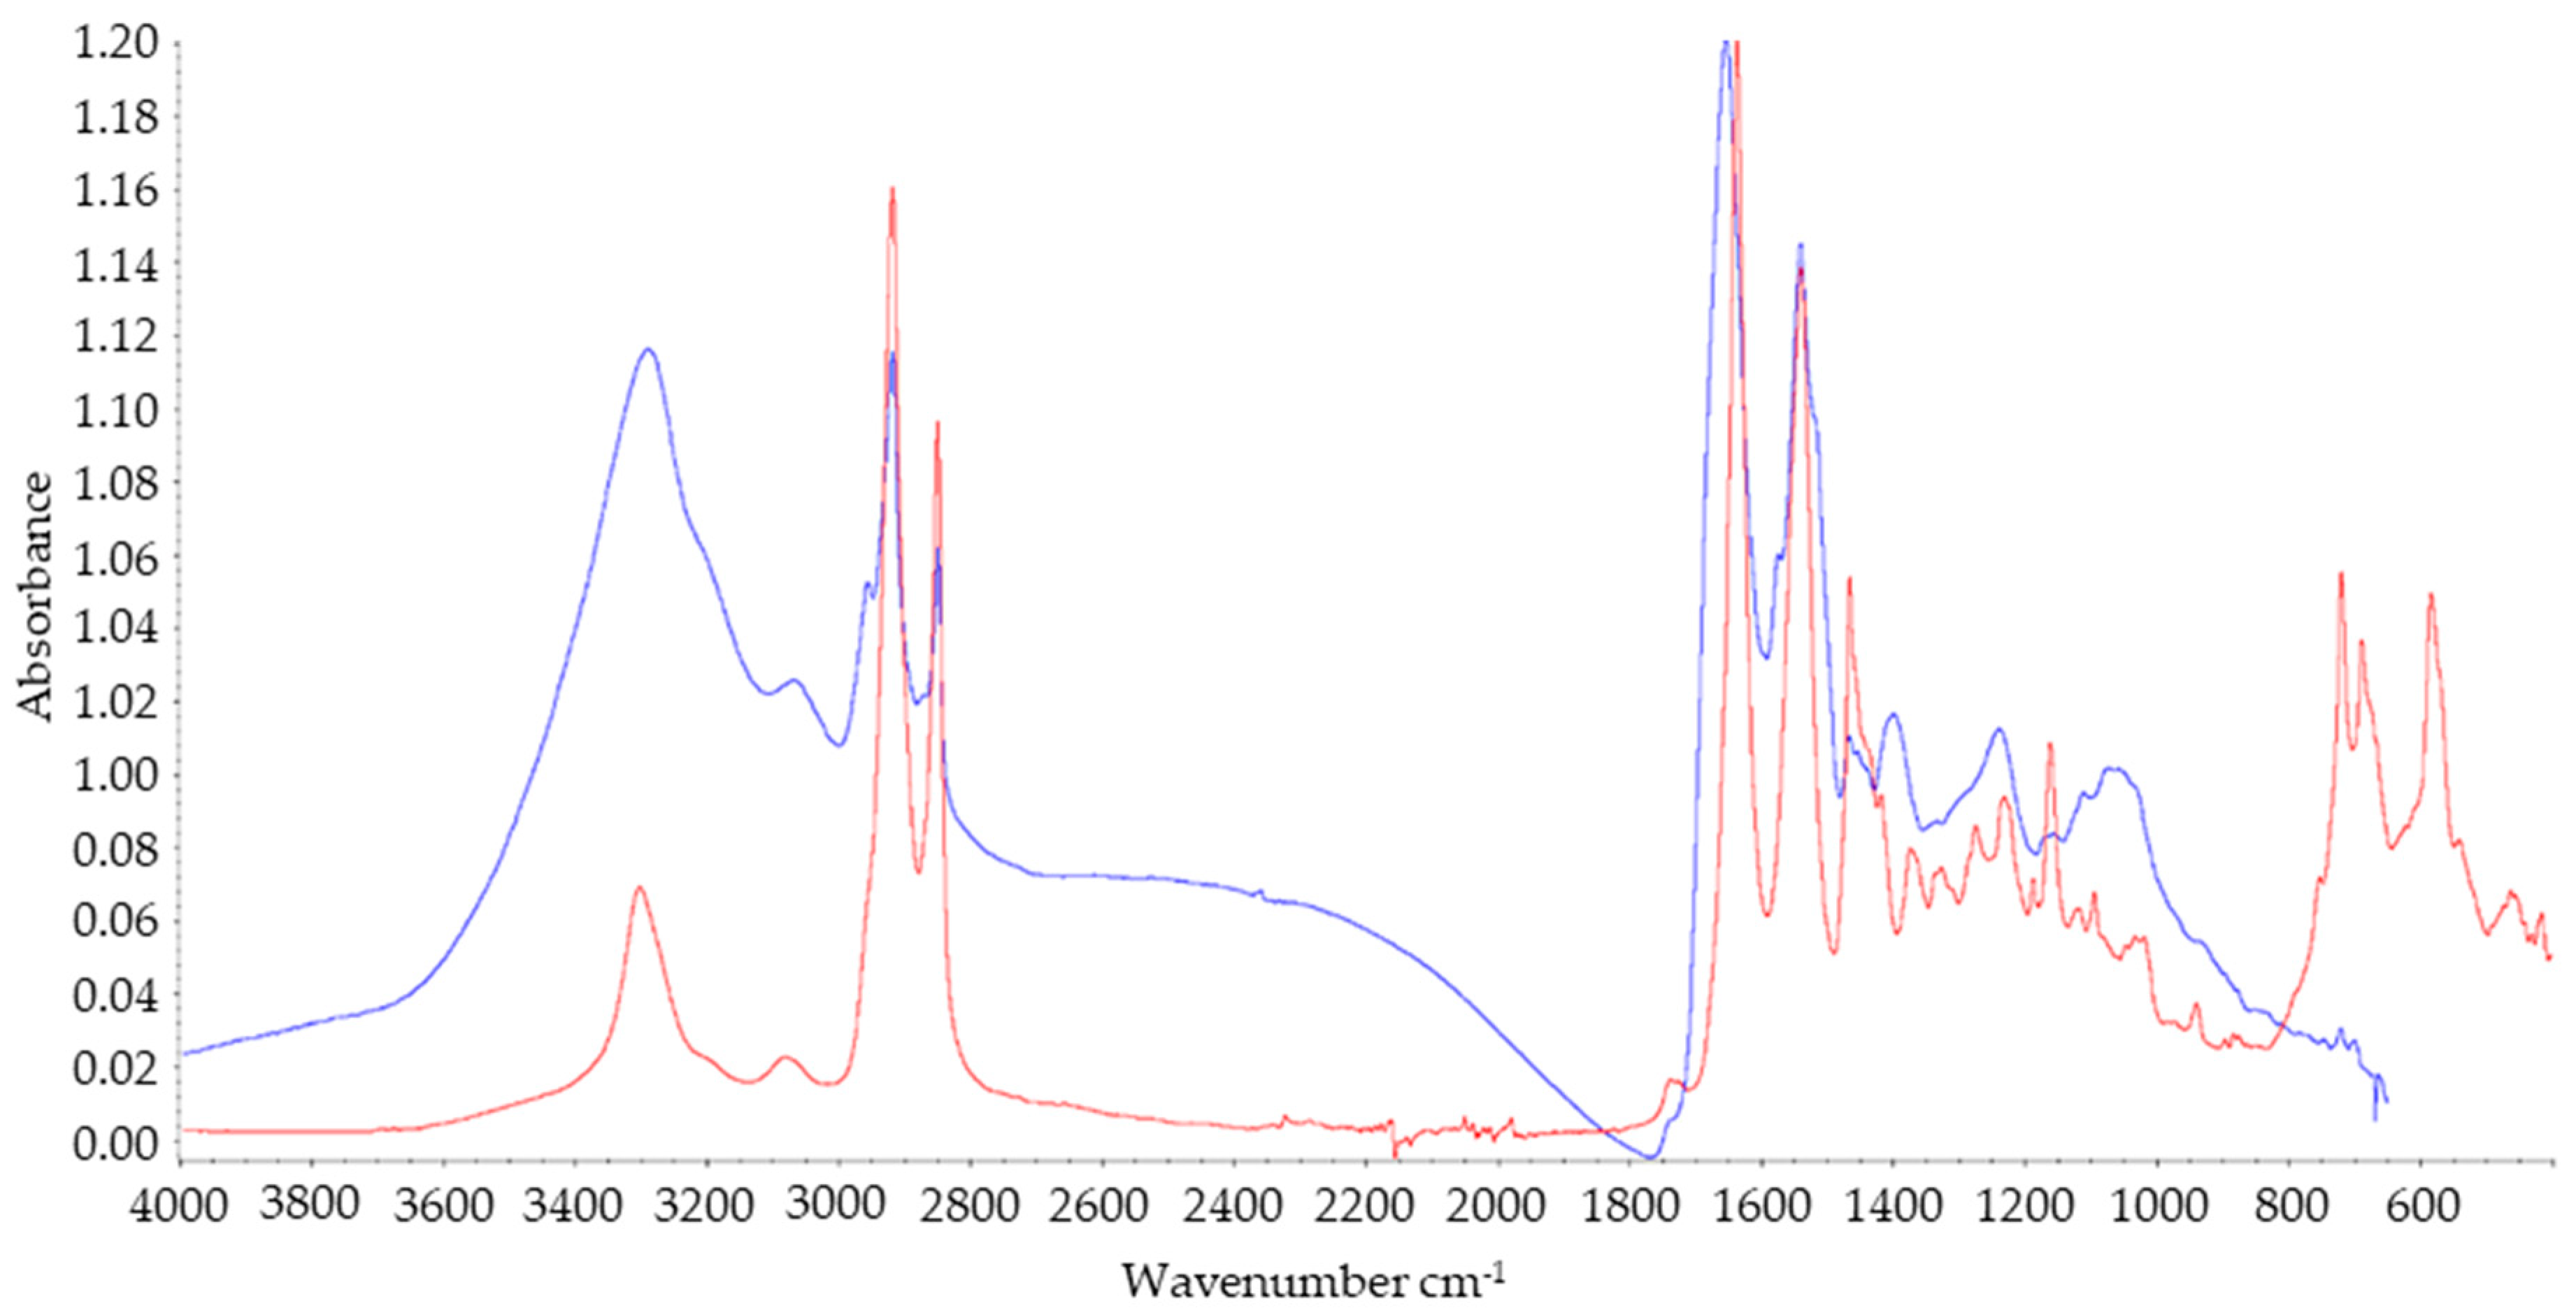
In the test runs without polyamide lubricant hosing and the usage of silicon hoses, no amide functionality occurred on the high reference bearing washers. Instead, both washers show infrared peaks indicating the presence of Si-C or inorganic Si-O functionalities [39], repeatedly indicating that auxiliary components are interacting significantly.
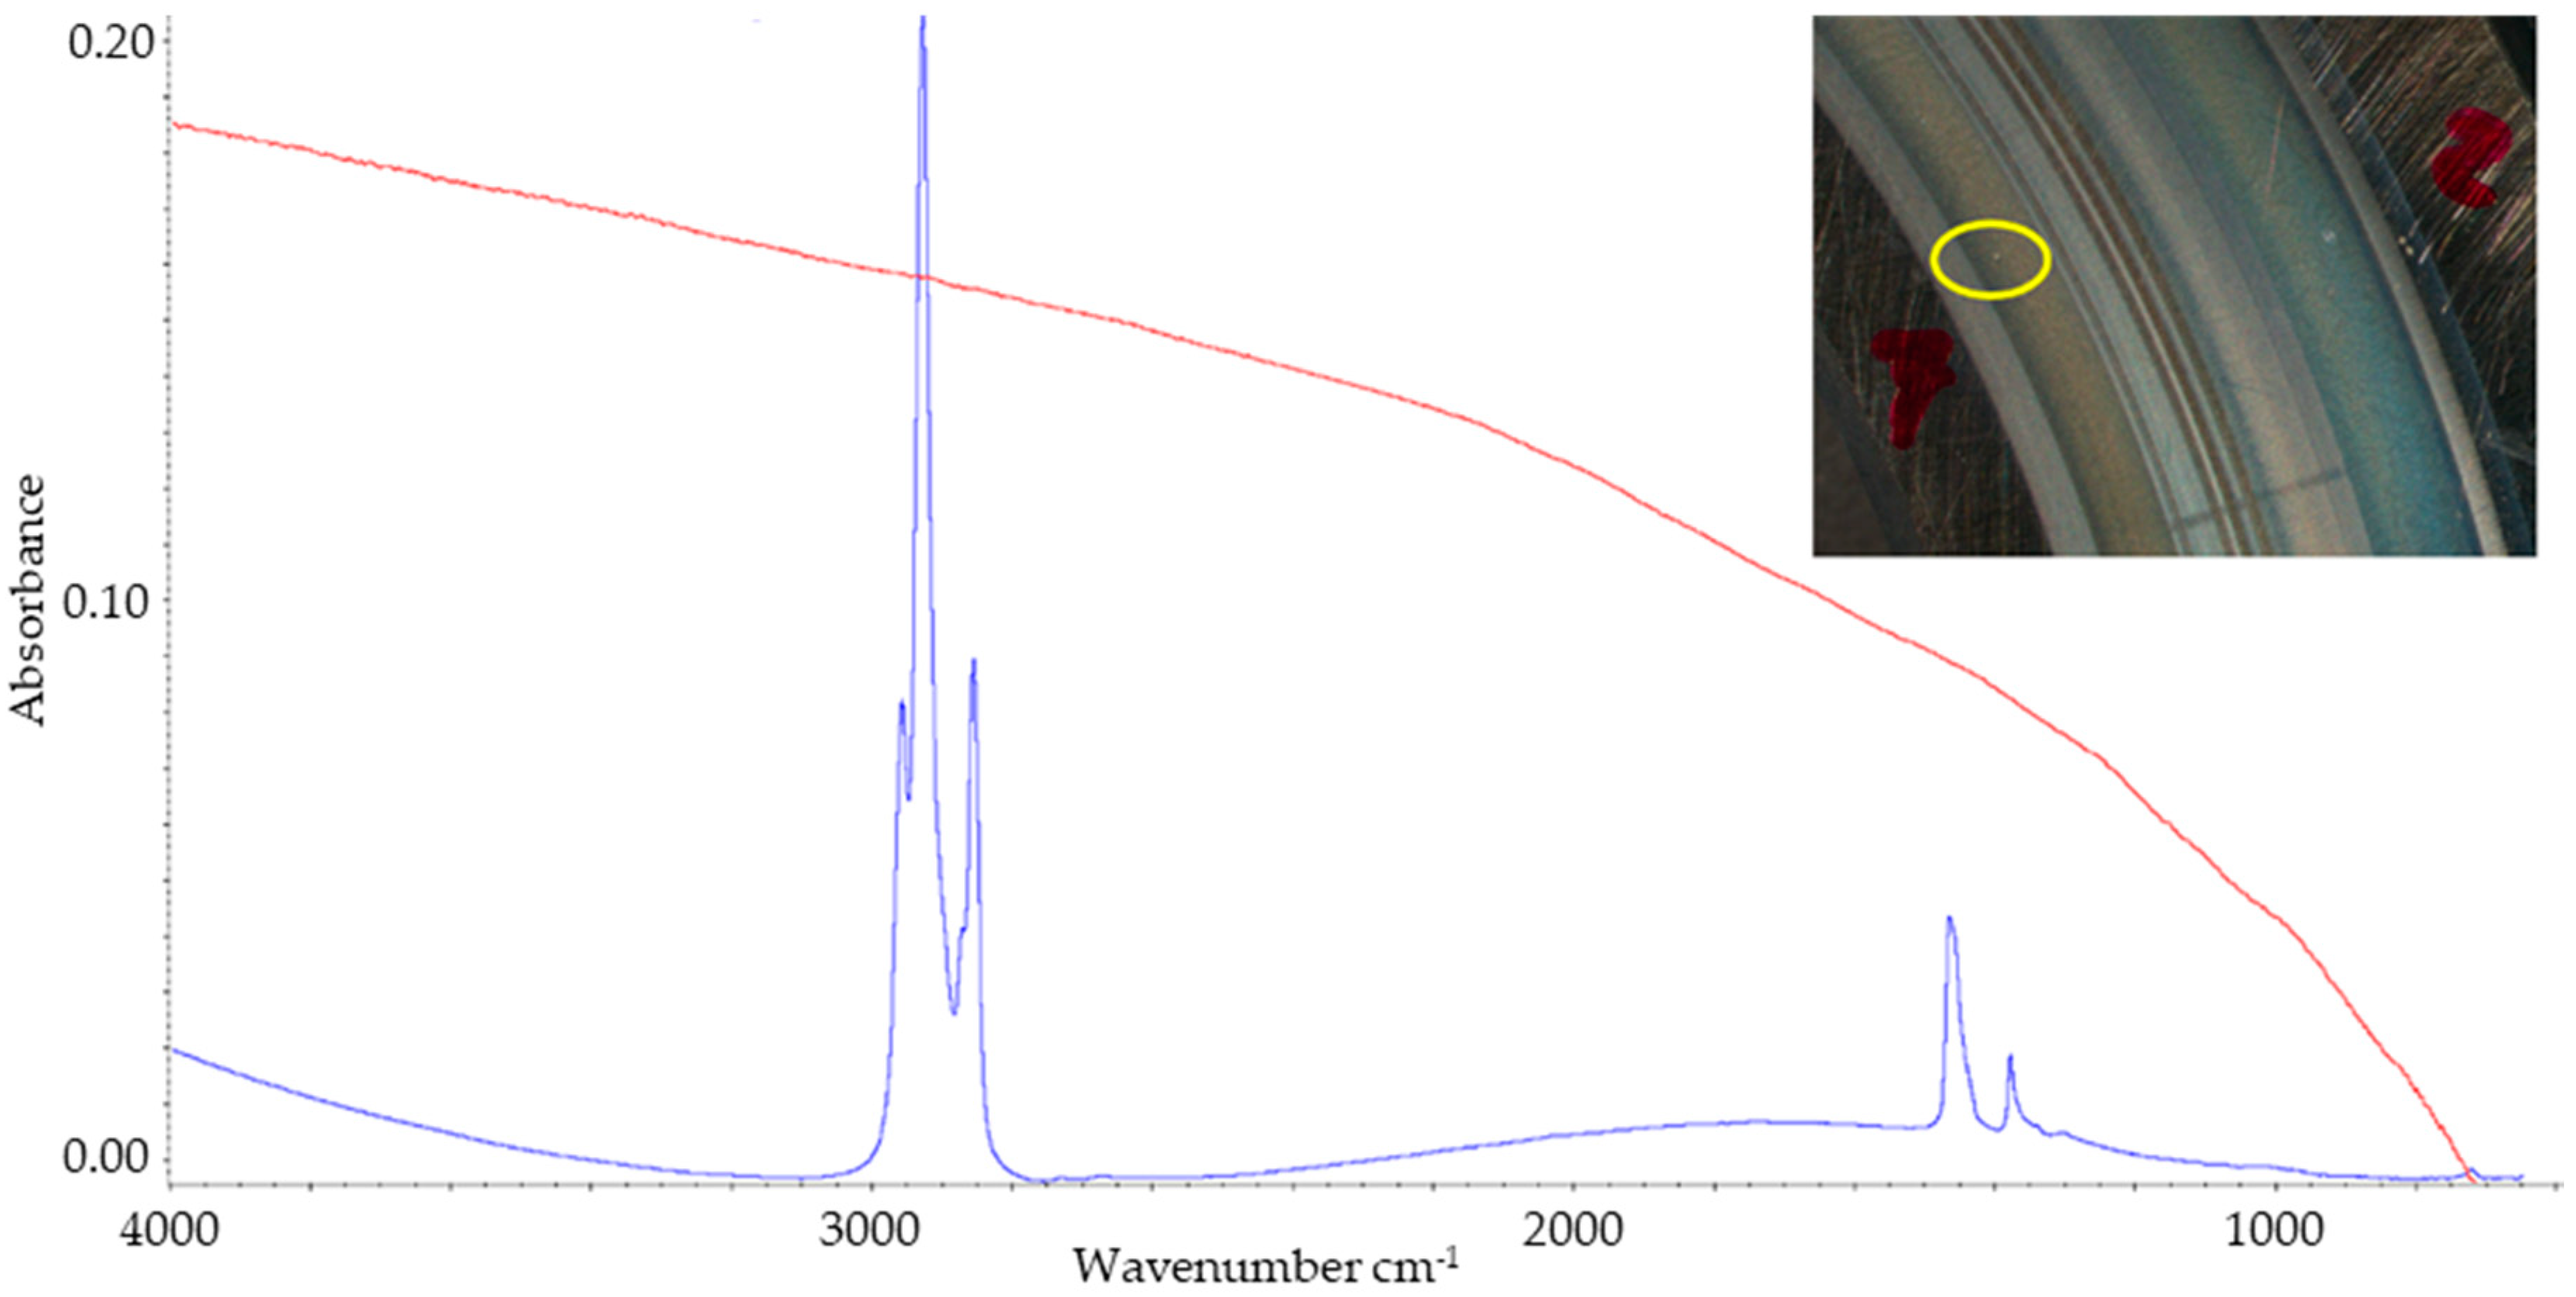
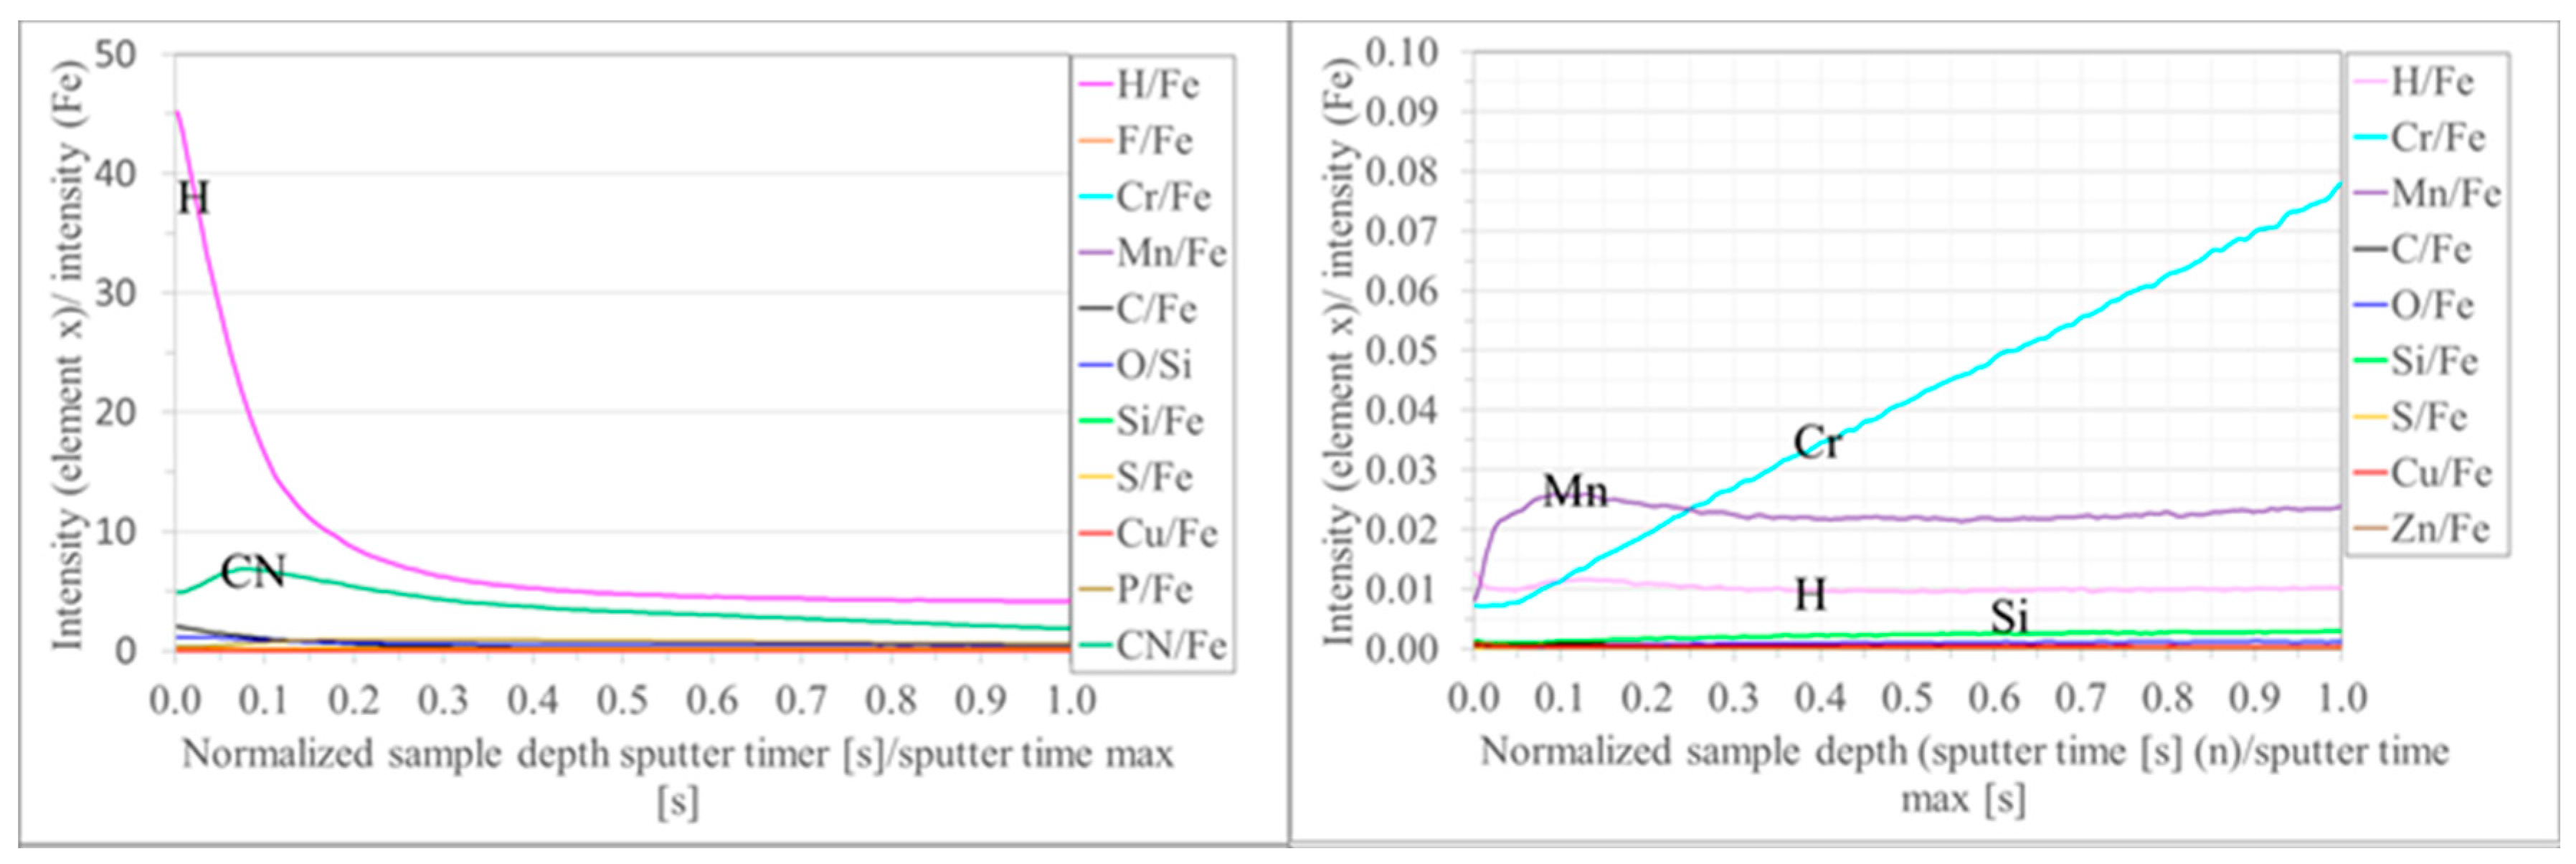
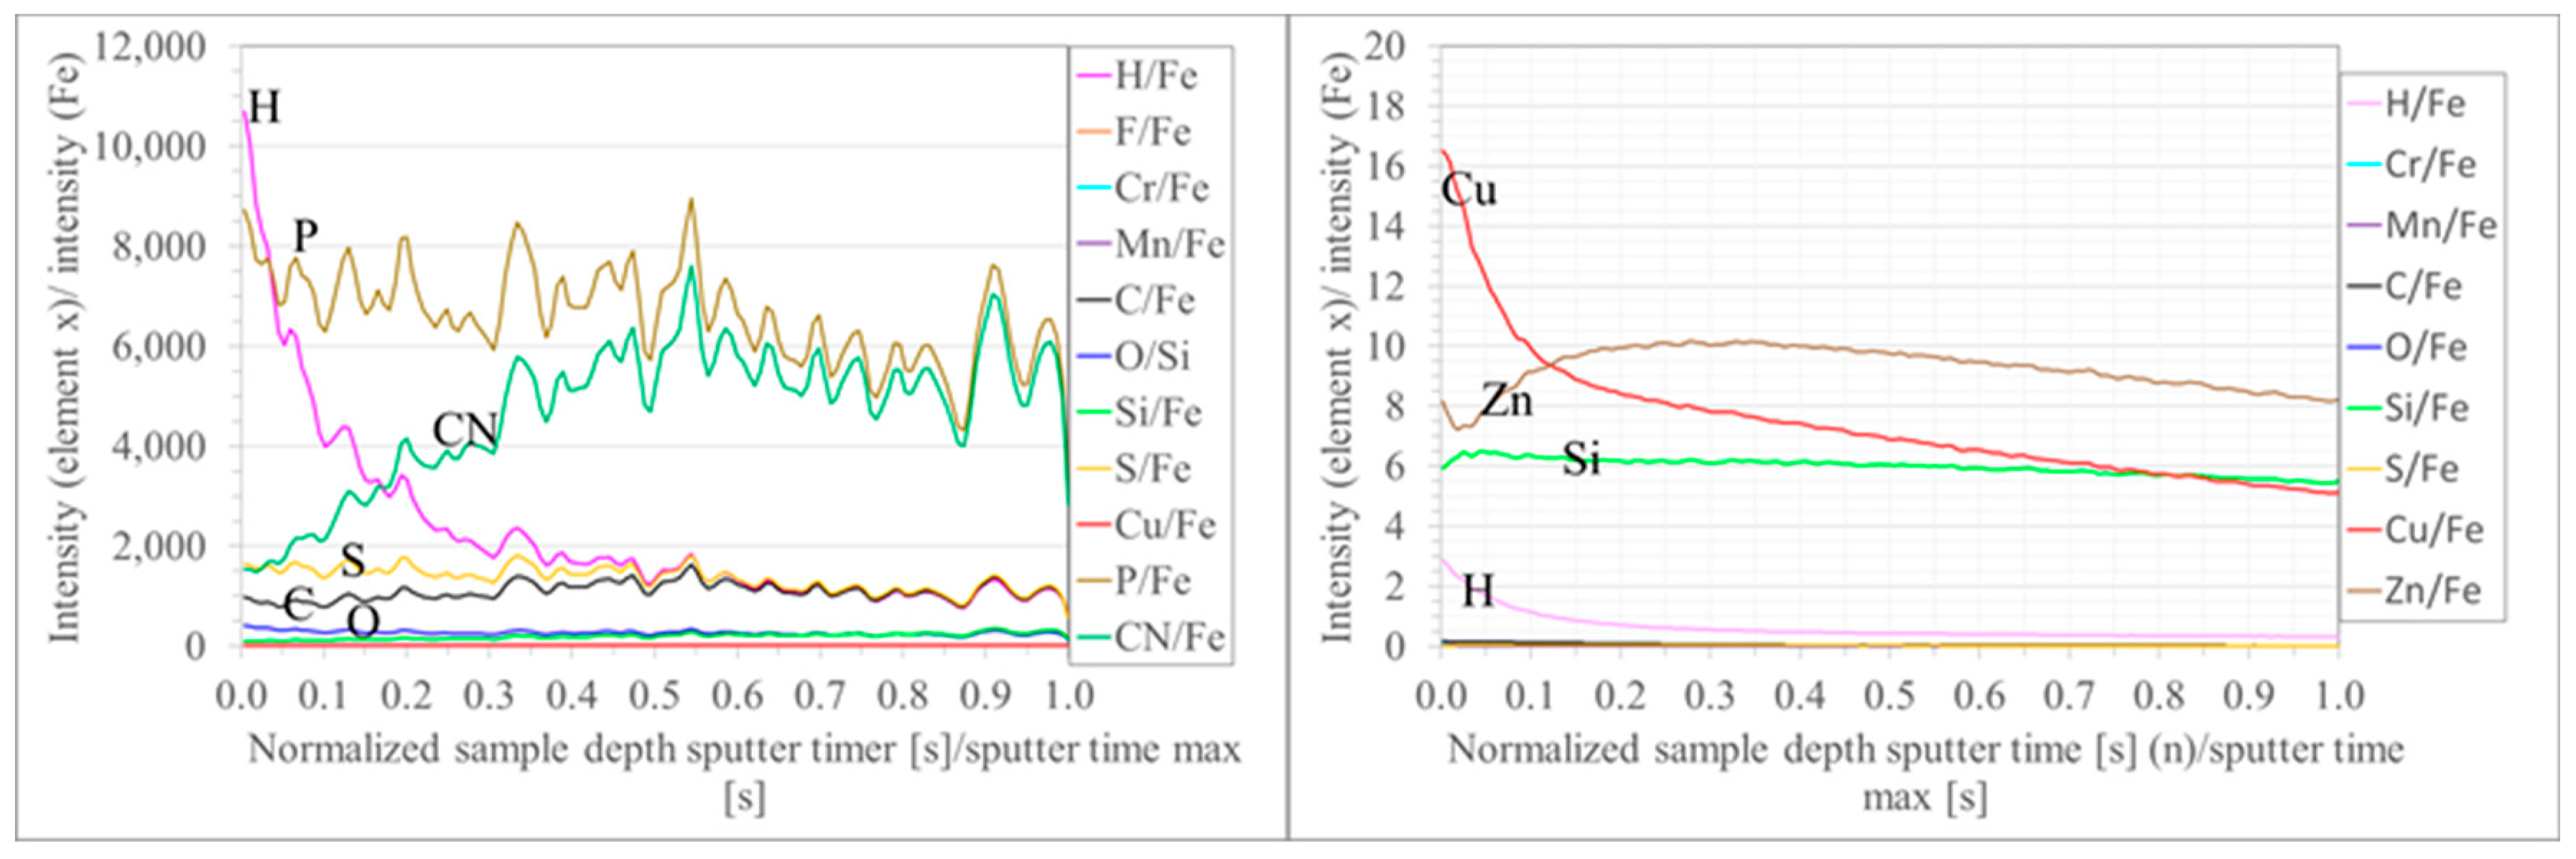
A comparison of TOF-SIMS signals from a cleaned, unused bearing washer and a washer after the test run lubricated with the low reference oil and a silicone supply hose is provided in Table 3. This comparison highlights a substantial rise in the signal of the element Si with a factor of approx. 1800, alongside anticipated increases in S, P, Zn, and C. Hints for the deposition of a silicon hosing material on the bearing washer were already given with infrared reflection spectrometry. The notably increased Si signal aligns well with this indication, providing further evidence of additional auxiliary material deposition, apart from the deposition of polyamide. Interestingly, the signal for copper is clearly elevated as well. This gives evidence that copper is present, despite the fact that no copper soaps were detected in the low reference case through infrared spectrometry. Since the removal of a potential copper-DCHA complex during the cleaning procedure before TOF-SIMS measurement is quite likely, a central atom exchange of ZDDP as presented in [51,52,53] becomes highly probable. Remarkably, the signals for CN were also significantly elevated by a factor of 1200 compared to an unused bearing washer. This finding is most likely explained by a characteristic of the TOF-SIMS measurement method. According to [42], signals for CN will be found if any species within the sample has N bound to a C, which is the case for the DCHA in the low reference lubricant.

5. Conclusions

A series of FE8 tests were performed to provoke WEC using a chemically well-defined low reference oil. Concurrently, tests were performed using a high reference oil that did not result in WEC. The reaction products were analysed using non-destructive infrared reflection spectrometry. A novel and significant factor on WEC creation was identified as deposits of auxiliary components material on the washers. While the low reference oil led to WEC in conjunction with the deposition of auxiliary polyamide material, the same oil did not induce failure when a silicone or stainless steel hose was used. This study reveals an unknown and significant parameter in WEC applications, suggesting its potential importance in discussions about WEC countermeasures in the field.
Similarly, the discussion in the field concerning the impact of low reference and high reference lubricants on WEC, and the root causes, should be reconsidered in light of the results from this study. These interesting results need to be further substantiated through more extensive statistics. Additionally, the underlying mechanism needs to be explored through further investigations to provide a detailed understanding of the observations outlined in this paper. It is noteworthy that polyamide and silicone occupy opposing ends of the triboelectric series.

Author Contributions

Conceptualization, J.W.; methodology, J.W., W.H. and L.W.; validation, J.W., W.H. and L.W.; investigation, J.W.; resources, J.W., W.H. and L.W.; data curation, J.W.; writing—original draft preparation, J.W. and W.H.; writing—review and editing, J.W., W.H. and L.W.; visualization, J.W.; supervision, L.W. and W.H.; project administration, J.W., L.W. and W.H. All authors have read and agreed to the published version of the manuscript.

Funding

This research received no external funding.

Data Availability Statement

All data are contained within the article.

Acknowledgments

The authors would like to thank Zeller+Gmelin GmbH & Co. KG for the support in this study, Wolfram Hempel (Zentrum für Sonnenenergie- und Wasserstoff-Forschung Baden-Württemberg (ZSW)) for performing the TOF-SIMS analysis and Tarek Lutz, Philipp Albrecht and Benedikt Reichel for conducting the metallographic analysis.

Conflicts of Interest

Author Jürgen Wranik was employed by the company Zeller+Gmelin GmbH & Co. KG. Author Walter Holweger was employed by the company Technology Consultant. The remaining authors declare that the research was conducted in the absence of any commercial or financial relationships that could be construed as a potential conflict of interest.

Appendix A

Table A1. Summary of the FE8 parameters of 30 studies [5,6,7,8,9,17,18,19,24,25,27,28,29,30,32,34,56,57,58,59,60,61,62,63,64,65,66,67,68,69]: (1) 31 load settings (1 study with 4 settings); (2) 33 speed settings (2 studies with 2 settings), 2 studies conducted a running-in phase, the final value (750 rpm) was used for the calculation; (3) 32 Temperature settings (4 studies with 2 settings); (4) 18 settings (3 studies with 2 settings), artificial surface smoothening/roughening in some studies led to a big variance; (5) 2 studies expressed the viscosity as SAE 80, and the mean viscosity of this SAE-class (9.8 mm2/s) was set in these cases; (6) 17 settings (3 studies with 2 settings). The authors extended a summary initially presented by [58] to include additional parameters such as location of WEC analysis and cage material.
ParameterMinimum ValueMaximum ValueMean ValueStandard Deviationn Studies
Load [kN] (1)208057.714.528
Speed [1/min] (2)300122064921231
Bearing Temperature [°C] (3)7012098.110.928
Hertzian Pressure [MPa]12002200178832513
Cage Material Brass 9
Cage Material Polymer 10
WEC Analysis in the washer 14
WEC Analysis in roller 11
Surface Roughness Roller [µm] (4)0.01550.431.1615
Surface Roughness Washer [µm] (4)0.0180.70.230.2315
Lubricant Flow Volume/Bearing [mL/min]100250134588
Lubricant Viscosity/40 °C [mm2/s]4610069.318.518
Lubricant Viscosity/100 °C [mm2/s] (5)9.29.89.50.35
Testing Time to WEC [h] (6)18200706216
Testing Time to Bearing Failure High Reference Lubricant [h] 200980 4
κ-Value0.440.500.460.034
Figure A1. A picture of the FE8 test rig: 1. Frame and crane for the test head. 2. Torque transducer. 3. Thermocouples for each bearing. 4. Test head. 5. Acceleration sensor. 6. Driving unit. 7. Control cabinet for terminals for cooling and fan heating. Figure adapted with permission from Ref. [35]. Copyright 2017, Schaeffler Technologies AG & Co.
Lubricants 12 00045 g0a1
Figure A2. A schematic of the test head with axial cylindrical roller bearings. 1. Housing. 2. Test bearing 2 (test head sided bearing). 3. Spacer. 4. Test bearing 1 (motor sided bearing). 5. Shaft. 6. Clamping bolt. 7. Bearing seat. 8. Drain pipe. 9. Cap. 10. Bearing support with screwed-on pilot pin. 11. Lid cup of spring package. 12. Lid. 13. Auxiliary bearing. Both test bearings consisted of a stationary housing (HW) and a rotating shaft washer (SW). The housing and the shaft washer are indicated in this schematic by HW and SW. Figure adapted with permission from Ref. [35]. Copyright 2017, Schaeffler Technologies AG & Co.
Lubricants 12 00045 g0a2

Evaluating Cleaning Procedure Efficiency for FE8 Test Runs Using TOF-SIMS Analysis for Residue Determination

To evaluate the effectiveness of the cleaning procedure in removing impurities (e.g., residues of the machining lubricants, corrosion protection of the bearing components) from the “as received” bearings before testing, several cleaning procedures were performed followed by a TOF-SIMS analysis of the bearing surface. Three different cleaning approaches were performed. All solvents and chemicals used were analytical-grade:
  • Multi-step flushing: Flushing in several steps (squeeze bottles) with heptane, then with isopropanol and again with heptane (flushing volume of each solvent 0.1 L) (Figure A3, first row).
  • Heptane flushing and oxalic acid immersion: Flushing with heptane, immersion of the bearing for 1 min in an 8% (w/w) solution of oxalic acid in water/ethanol (90/10, w/w), flushing with isopropanol and again with heptane (each solvent 0.1 L) (Figure A3, second row).
  • Extended oxalic acid immersion: Flushing with heptane, then immerse the bearing for 5 min in an 8% (w/w) solution of oxalic acid in water/ethanol (90/10, w/w), flushing with isopropanol and again with heptane (each solvent 0.1 L) (Figure A3, third row).
Based on these tests, a cleaning procedure including acid treatment does not provide any additional benefits in removing residues. A cleaning procedure involving heptane, isopropanol and a final heptane rinse (variant 1) proves to be adequate for eliminating residues from the bearing components.
Figure A3. Negative (left) and positive (right) TOF-SIMS. Device: Iontof ToF-SIMS5. Measurement carried out solely with Bi ions without additional sputter source. Estimated maximum of depth profile is 25 nm. First row: After flushing in several steps with heptane, then with isopropanol and again with heptane (each solvent 0.1 L). Second row: After flushing with heptane, immersion of the bearing for 1 min in an 8% (w/w) solution of oxalic acid in water/ethanol (90/10 w/w), flushing with isopropanol and again with heptane (each solvent 0.1 L). Third row: After flushing with heptane, immersion of the bearing for 5 min in an 8% (w/w) solution of oxalic acid in water/ethanol (90/10, w/w), flushing with isopropanol and again with heptane (each solvent 0.1 L).
Lubricants 12 00045 g0a3

Appendix B

Figure A4. An IR spectrum of the PAO base oil (transmission, spacer thickness 0.1 mm). The IR-spectrum shows peaks at (cm−1) 2942–2842 C-H stretching, (2730), (2674), (2026), (1460) methylene scissoring, (1378) C-H bending, (1341) C-CH3 bending, (1302) methylene twisting, (1077), (962) C-CH3 bending, (890), (721/0.16) methylene rocking.
Lubricants 12 00045 g0a4
Figure A5. IR-spectrum of the ZDDP (Additin RC 3080) (ATR) peaks in the IR-spectrum of Additin RC 3080 are categorised into 4 regions: the regions of higher wavenumbers between 3000 and 2800 cm−1 display symmetric and asymmetric stretching vibrations of the C-H groups. The bending vibration of CH2 groups occur within the range of 1500 and 1300 cm−1. An intense peak at 970 cm−1 relates to the stretching vibration of the P-O-C group. The region below 700 cm−1 shows the symmetric and asymmetric stretching vibrations of the P-S bond [70].
Lubricants 12 00045 g0a5
Figure A6. IR spectrum of DCHA (transmission, spacer thickness 0.05 mm). Typical secondary amine-related peaks are at 3310 cm−1 (NH stretch), 1143, and 1126 cm−1 (CN stretch).
Lubricants 12 00045 g0a6
Table A2. Measured properties of the PAO base oil.
ParameterStandardDurasyn 168
Optical assessment no colour, clear, no sludge
ColourDIN ISO 2049L0.5
Viscosity 40 °C [mm2/s]ASTM D 704246.3
Viscosity 100 °C [mm2/s]ASTM D 70427.85
Viscosity index [-]ASTM D 2270140
Density 15 °C [g/cm3]DIN EN ISO 121850.832
Refractive index [-]DIN 51423-21.4621
Water content (procedure C) [%]DIN 51777<0.01
TAN [mg KOH/g]DIN EN 12634<0.1
Insoluble in petrol (10 µm) [%] 0.01
Insoluble in petrol (5 µm) [%] 0.06
Insoluble in petrol (1.2 µm) [%] 0.06
Insoluble in petrol (0.8 µm) [%] 0.07
Conductivity [pS/m]DIN 51412-10.02
Preparation of the low reference lubricant:
In preparation for the FE8 test runs, 7 kg of each lubricant was prepared by mixing the necessary components and stirring it at 40 °C for 10 min. The lubricant preparation started with adding the base oil PAO followed by adding the additives ZDDP and DCHA. One kg of each lubricant mixture was retained for property analysis, while the remaining batch was used for FE8 testing. Since dicyclohexylamine reacts with CO2 in the air, promoted by moisture (from the air), it is important to avoid supernatant air in the sample bottle over a long period of time. This can be achieved by either filling the sample bottle entirely with the preparation to avoid any residual air above the liquid, or by blanketing the liquid with nitrogen to replace the residual air. Both of these precautions will prevent a chemical alteration of the DCHA-containing samples during storage.

Appendix C

After testing, the bearing surfaces were inspected, and areas with severe damage on the washer surfaces were cross-sectioned to identify microstructural alterations in the subsurface. In the case of inconclusive results, such as when WEC was expected but not found within an initial analysis, further analyses were performed on the second bearing washer, or washer(s) of the second bearing from the same test. Metallographic analyses were performed according to the following steps. An illustration of the sample preparation is shown in Figure A7.
  • First, a bearing washer is sectioned using a Discotom 5 saw from Struers GmbH, Germany, at a workpiece feed of 0.2 mm/s. Struers Corrozip coolant was used during cutting. According to the safety data sheet, the coolant contained boric acid and polyethylene glycols.
  • The prepared bearing piece was then mounted in an epoxy resin “EpoFix” manufactured by Struers GmbH, Germany.
  • The exposed surface in the resin was then ground and polished, following the steps described in Table A3.
  • The polished surfaces were etched with 3% nitric acid in isopropanol for 15 s before they were examined under the LOM (a BX51 from Olympus and a Smartzoom 5 from Zeiss).
Figure A7. Schematic representation of the locations of samples for WEC analysis.
Lubricants 12 00045 g0a7
Table A3. Grinding/polishing steps. All polishing aids were from Struers GmbH, Germany. Polishing agents contained diamond suspensions with 9 µm, 3 µm and 1 µm particles.
Grinding WheelPolishing AgentrpmClamping ForceDuration
MD-Piano 220-30040until plane
MD-AllegroDiaPro Allegro/Largo 9150305 min
MD-DacDiaPro Dac 3150305 min
MD-NapDiaPro Nap B 1150153 min
Figure A8. Images from PAO-1 test (duration 160 h 42 min). Top row: images of two cuts from the housing washer (HW) (left) and shaft washer (SW) (right). Blue arrows indicate the subsurface analysed. Middle row: Images after etching of subsurface of the HW. Bottom row: Images of subsurface after etching of the SW.
Lubricants 12 00045 g0a8
Figure A9. Metallographic analysis from PAO/ZDDP/DCHA-2 (test duration 32.5 h). Top row: Images of a cut from the SW (left) and the HW (right). Blue arrows indicate the area being further analysed. Middle row: Images of subsurface after etching of the HW. Bottom row: Images of subsurface after etching of the SW.
Lubricants 12 00045 g0a9
Figure A10. Metallographic analysis from the PAO/ZDDP/DCHA-4 (silicone lubricant supply hose), running time 96 h. First picture: Image of a cut from the SW. Blue arrow indicates the area being further analysed. Further pictures: Images of subsurface after etching, no WEC detected.
Lubricants 12 00045 g0a10

References

  1. Scott, D.; Loy, B.; Mills, G.H. Paper 10: Metallurgical Aspects of Rolling Contact Fatigue. Proc. Inst. Mech. Eng. Conf. Proc. 1966, 181, 94–103. [Google Scholar] [CrossRef]
  2. Guanteng, G.; Olver, A.V.; Spikes, H.A. The Advancing Frontier of Engineering Tribology; STLE/ASME: New York, NY, USA, 1999. [Google Scholar]
  3. Ilg, U. Einfluß von FVA 35, Heft 103 Normal-/Gleitbeanspruchung auf Gefüge und Eigenspannungsänderungen von Wälzelementen Unterschiedlicher Eigenspannungszustände; FVA: Frankfurt, Germany, 1981. [Google Scholar]
  4. Tamada, K.; Tanaka, H. Occurrence of brittle flaking on bearings used for automotive electrical instruments and auxiliary devices. Wear 1996, 199, 245–252. [Google Scholar] [CrossRef]
  5. Surborg, H. Einfluss von Grundölen und Additiven auf die Bildung von WEC in Wälzlagern; Verlag: Magdeburg, Germany, 2014. [Google Scholar]
  6. Evans, M.-H.; Richardson, A.; Wang, L.; Wood, R.; Anderson, W. Confirming subsurface initiation at non-metallic inclusions as one mechanism for white etching crack (WEC) formation. Tribol. Int. 2014, 75, 87–97. [Google Scholar] [CrossRef]
  7. Holweger, W.; Wolf, M.; Merk, D.; Blass, T.; Goss, M.; Loos, J.; Barteldes, S.; Jakovics, A. White etching crack root cause investigations. Tribol. Trans. 2014, 58, 59–69. [Google Scholar] [CrossRef]
  8. Kürten, D.R. Einfluss der Tribochemischen Schmierstoffoxidation auf Die Wasserstoffinduzierte Wälzkontaktermüdung. Ph.D. Dissertation, Karlsruher Institut für Technologie (KIT), Karlsruhe, Germany, 2015. [Google Scholar]
  9. Evans, M.-H.; Wang, L.; Wood, R. Formation mechanisms of white etching cracks and white etching area under rolling contact fatigue. Proc. Inst. Mech. Eng. Part J J. Eng. Tribol. 2014, 228, 1047–1062. [Google Scholar] [CrossRef]
  10. Manieri, F.; Stadler, K.; Morales-Espejel, G.E.; Kadiric, A. The origins of white etching cracks and their significance to rolling bearing failures. Int. J. Fatigue 2019, 120, 107–133. [Google Scholar] [CrossRef]
  11. Leimann, D.O. Calculation Method to Evaluate the Risk of WEC Occurrence in Industrial Applications. Bear. World 2020, 5, 19. [Google Scholar]
  12. Evans, M.-H. White structure flaking (WSF) in wind turbine gearbox bearings: Effects of ‘butterflies’ and white etching cracks (WECs). Mater. Sci. Technol. 2012, 28, 3–22. [Google Scholar] [CrossRef]
  13. Evans, M.-H. An updated review: White etching cracks (WECs) and axial cracks in wind turbine gearbox bearings. Mater. Sci. Technol. 2016, 32, 1133–1169. [Google Scholar] [CrossRef]
  14. KStadler; Lai, J.; Vegter, R. A review: The dilemma with premature white etching crack (WEC) bearing failures. In Bearing Steel Technologies: 10th Volume, Advances in Steel Technologies for Rolling Bearings; ASTM International: West Conshohocken, PA, USA, 2014; pp. 487–508. [Google Scholar]
  15. López-Uruñuela, F.J.; Fernández-Díaz, B.; Pagano, F.; López-Ortega, A.; Pinedo, B.; Bayón, R.; Aguirrebeitia, J. Broad review of “White Etching Crack” failure in wind turbine gearbox bearings: Main factors and experimental investigations. Int. J. Fatigue 2021, 145, 106091. [Google Scholar] [CrossRef]
  16. Ruellan, A.; Kleber, X.; Ville, F.; Cavoret, J.; Liatard, B. Understanding white etching cracks in rolling element bearings: Formation mechanisms and influent tribochemical drivers. Proc. Inst. Mech. Eng. Part J J. Eng. Tribol. 2015, 229, 886–901. [Google Scholar] [CrossRef]
  17. Danielsen, H.; Guzmán, F.G.; Muskulus, M.; Rasmussen, B.; Shirani, M.; Cornel, D.; Sauvage, P.; Wu, J.; Petrov, R.; Jacobs, G. FE8 type laboratory testing of white etching crack (WEC) bearing failure mode in 100Cr6. Wear 2019, 434, 202962. [Google Scholar] [CrossRef]
  18. Franke, J.; Carey, J.T.; Korres, S.; Haque, T.; Jacobs, P.W.; Loos, J.; Kruhoeffer, W. White etching cracking—Simulation in bearing rig and bench tests. Tribol. Trans. 2018, 61, 403–413. [Google Scholar] [CrossRef]
  19. Guzmán, F.G.; Oezel, M.; Jacobs, G.; Burghardt, G.; Broeckmann, C.; Janitzky, T. Reproduction of white etching cracks under rolling contact loading on thrust bearing and two-disc test rigs. Wear 2017, 390, 23–32. [Google Scholar] [CrossRef]
  20. Gould, B.; Demas, N.; Erck, R.; Lorenzo-Martin, M.C.; Ajayi, O.; Greco, A. The effect of electrical current on premature failures and microstructural degradation in bearing steel. Int. J. Fatigue 2021, 145, 106078. [Google Scholar] [CrossRef]
  21. Loos, J.; Bergmann, I.; Goss, M. Influence of High Electrical Currents on WEC Formation in Rolling Bearings. Tribol. Trans. 2021, 64, 708–720. [Google Scholar] [CrossRef]
  22. Loos, J.; Bergmann, I.; Goss, M. Influence of Currents form Electrostatic Charges on WEC Formation in Rolling Bearings. Tribol. Trans. 2016, 59, 865–875. [Google Scholar]
  23. Wranik, J.; Holweger, W.; Lutz, T.; Albrecht, P.; Reichel, B.; Wang, L. A Study on Decisive Early Stages in White Etching Crack Formation Induced by Lubrication. Lubricants 2022, 10, 96. [Google Scholar] [CrossRef]
  24. Danielsen, H.; Guzmán, F.G.; Dahl, K.; Li, Y.; Wu, J.; Jacobs, G.; Burghardt, G.; Fæster, S.; Alimadadi, H.; Goto, S.; et al. Multiscale characterization of White Etching Cracks (WEC) in a 100Cr6 bearing from a thrust bearing test rig. Wear 2017, 370, 73–82. [Google Scholar] [CrossRef]
  25. Diederichs, A.M.; Barteldes, S.; Schwedt, A.; Mayer, J.; Holweger, W. Study of subsurface initiation mechanism for white etching crack formation. Mater. Sci. Technol. 2016, 32, 1170–1178. [Google Scholar] [CrossRef]
  26. Gould, B.; Demas, N.G.; Pollard, G.; Rydel, J.J.; Ingram, M.; Greco, A.C. The effect of lubricant composition on white etching crack failures. Tribol. Lett. 2019, 67, 7. [Google Scholar] [CrossRef]
  27. Haque, T.; Korres, S.; Carey, J.T.; Jacobs, P.W.; Loos, J.; Franke, J. Lubricant effects on white etching cracking failures in thrust bearing rig tests. Tribol. Trans. 2018, 61, 979–990. [Google Scholar] [CrossRef]
  28. Pape, F.; Terwey, J.T.; Wiesker, S.; Averbeck, S.; Muhmann, C.; Lipinsky, D.; Arlinghaus, H.F.; Kerscher, E.; Sauer, B.; Poll, G. Tribological research on the development of White Etching Cracks (WECs). Forsch. Ingenieurwesen 2018, 82, 341–352. [Google Scholar] [CrossRef]
  29. Richardson, A.; Evans, M.-H.; Wang, L.; Ingram, M.; Rowland, Z.; Llanos, G.; Wood, R. The effect of over-based calcium sulfonate detergent additives on white etching crack (WEC) formation in rolling contact fatigue tested 100Cr6 steel. Tribol. Int. 2019, 133, 246–262. [Google Scholar] [CrossRef]
  30. Paladugu, M.; Lucas, D.R.; Hyde, R.S. Effect of lubricants on bearing damage in rolling-sliding conditions: Evolution of white etching cracks. Wear 2018, 398, 165–177. [Google Scholar] [CrossRef]
  31. Azzam, B.; Harzendorf, F.; Schelenz, R.; Holweger, W.; Jacobs, G. Pattern Discovery in White Etching Crack Experimental Data Using Machine Learning Techniques. Appl. Sci. 2019, 9, 5502. [Google Scholar] [CrossRef]
  32. Ruellan, A.; Stadler, K.; Rydel, J.J.; Ryan, H. The influence of lubricant formulation on early thrust and radial bearing damage associated with white etching cracks. Proc. Inst. Mech. Eng. Part J J. Eng. Tribol. 2020, 235, 1047–1059. [Google Scholar] [CrossRef]
  33. Franke, J.W.H.; Fritz, J.; Koenig, T.; Merk, D. Influence of Tribolayer on Rolling Bearing Fatigue Performed on an FE8 Test Rig—A Follow-up. Lubricants 2023, 11, 123. [Google Scholar] [CrossRef]
  34. Spille, J.; Wranik, J.; Barteldes, S.; Mayer, J.; Schwedt, A.; Zürcher, M.; Lutz, T.; Wang, L.; Holweger, W. A study on the initiation processes of white etching cracks (WECs) in AISI 52100 bearing steel. Wear 2021, 477, 203864. [Google Scholar] [CrossRef]
  35. Schaeffler Technologies AG & Co. KG. Manual Test Rig FE8 Acc. to DIN 51819; Schaeffler Technologies AG & Co. KG: Schweinfurt, Germany, 2017. [Google Scholar]
  36. Schaeffler Technologies AG & Co. KG. Schaeffler Medias. Available online: https://medias.schaeffler.de/en/product/rotary/rolling-and-plain-bearings/roller-bearings/axial-cylindrical-roller-bearings/81212-tv/p/395947 (accessed on 28 April 2023).
  37. Hamrock, B.J.; Dowson, D. Applications of Film Thickness Equations; NASA Technical Memorandum 81701; Lewis Research Center: Cleveland, OH, USA, 1983. [Google Scholar]
  38. DIN 51819-3; Prüfung von Schmierstoffen—Mechanisch-Dynamische Prüfung auf dem Wälzlagerschmierstoff-Prüfgerät FE8—Teil 3: Verfahren für Schmieröl—Einzusetzende Prüflager: Axialzylinderrollenlager. Beuth: Berlin, Germany, 2016.
  39. Stuart, B.H. Infrared Spectroscopy: Fundamentals and Applications: Stuart/Infrared Spectroscopy: Fundamentals and Applications; John Wiley & Sons, Ltd.: Chichester, UK, 2004. [Google Scholar]
  40. Coates, J. Interpretation of Infrared Spectra, A Practical Approach. In Encyclopedia of Analytical Chemistry; John Wiley & Sons Ltd.: Chichester, UK, 2000. [Google Scholar]
  41. Hesse, M.; Meier, H.; Zeeh, B. Spektroskopische Methoden in der Organischen Chemie; Thieme: Stuttgart, Germany, 2012. [Google Scholar]
  42. Spool, A.M. The Practice of TOF-SIMS: Time of Flight Secondary Ion Mass Spectrometry; Momentum Press Engineering: New York, NY, USA, 2016. [Google Scholar]
  43. Dogahe, K.J.; Guski, V.; Mlikota, M.; Schmauder, S.; Holweger, W.; Spille, J.; Mayer, J.; Schwedt, A.; Görlach, B.; Wranik, J. Simulation of the Fatigue Crack Initiation in SAE 52100 Martensitic Hardened Bearing Steel during Rolling Contact. Lubricants 2022, 10, 62. [Google Scholar] [CrossRef]
  44. Freund, M.; Csikós, R.; Keszthelyi, S.; Mózes, G.Y.I. Chemical, crystallographical and physical properties of liquid paraffins and paraffin waxes. In Developments in Petroleum Science; Elsevier: Amsterdam, The Netherlands, 1982. [Google Scholar]
  45. Gerry, K. Base Oil Degradation and Hydrocarbon Autoxidation. Ph.D. Dissertation, Imperial College London, London, UK, 2009. [Google Scholar]
  46. Mortier, R.M.; Fox, M.F.; Orszulik, S.T. Chemistry and Technology of Lubricants; Springer: Dordrecht, The Netherlands, 2010. [Google Scholar]
  47. Singh, A.; Gandra, R.T.; Schneider, E.W.; Biswas, S.K. Studies on the aging characteristics of base oil with amine based antioxidant in steel-on-steel lubricated sliding. J. Phys. Chem. C 2013, 117, 1735–1747. [Google Scholar] [CrossRef]
  48. Hiratsuka, K.; Kajdas, C. Mechanochemistry as a key to understand the mechanisms of boundary lubrication, mechanolysis and gas evolution during friction. Proc. Inst. Mech. Eng. Part J J. Eng. Tribol. 2013, 227, 1191–1203. [Google Scholar] [CrossRef]
  49. Li, X.; Tong, W.; Shi, J.; Chen, Y.; Zhang, Y.; An, Q. Tribocatalysis mechanisms: Electron transfer and transition. J. Mater. Chem. A 2023, 11, 4458–4472. [Google Scholar] [CrossRef]
  50. Massey, A.G.; Thomson, N.R.; Johnson, B.F.G. The Chemistry of Copper, Silver and Gold: Pergamon Texts in Inorganic Chemistry; Elsevier: Amsterdam, The Netherlands, 2017. [Google Scholar]
  51. Handley, T.H.; Dean, J.A. O,O’-Dialkyl Phosphorodithioic Acids as Extractants for Metals. Anal. Chem. 1962, 34, 1312–1315. [Google Scholar] [CrossRef]
  52. Martin, J.M. Antiwear mechanisms of zinc dithiophosphate: A chemical hardness approach. Tribol. Lett. 1999, 6, 1–8. [Google Scholar] [CrossRef]
  53. Spikes, H. The History and Mechanisms of ZDDP. Tribol. Lett. 2004, 17, 469–489. [Google Scholar] [CrossRef]
  54. Lu, R.; Minami, I.; Nanao, H.; Mori, S. Investigation of decomposition of hydrocarbon oil on the nascent surface of steel. Tribol. Lett. 2007, 27, 25–30. [Google Scholar] [CrossRef]
  55. Ouellette, R.J.; Rawn, D.J. Organic Chemistry; Elsevier: San Diego, CA, USA, 2014. [Google Scholar]
  56. Richardson, A.D.; Evans, M.-H.; Wang, L.; Wood, R.J.K.; Ingram, M.; Meuth, B. The evolution of white etching cracks (wecs) in rolling contact fatigue-tested 100cr6 steel. Tribol. Lett. 2018, 66, 6. [Google Scholar] [CrossRef]
  57. Richardson, A.D.; Evans, M.-H.; Wang, L.; Wood, R.J.K.; Ingram, M. Thermal desorption analysis of hydrogen in non-hydrogen-charged rolling contact fatigue-tested 100cr6 steel. Tribol. Lett. 2018, 66, 4. [Google Scholar] [CrossRef]
  58. Linzmayer, M.; Sous, C.; Guzmán, F.G.; Jacobs, G. Interlaboratory comparison: Round robin test for the damage reproduction of white etching crack in cylindrical roller thrust bearings. Wear 2021, 480, 203925. [Google Scholar] [CrossRef]
  59. Paladugu, M.; Hyde, R.S. Microstructure deformation and white etching matter formation along cracks. Wear 2017, 390, 367–375. [Google Scholar] [CrossRef]
  60. Kruhöffer, W.; Loos, J. WEC formation in rolling bearings under mixed friction: Influences and “friction energy accumulation” as indicator. Tribol. Trans. 2017, 60, 516–529. [Google Scholar] [CrossRef]
  61. Blass, T.; Trojahn, W.; Holweger, W. WEC formation in through hardened and case hardened steel—Influence of retained austenite. In Proceedings of the Second Conference for Wind Power Drives, Aachen, Germany, 3–4 March 2015. [Google Scholar]
  62. Khader, I.; Kürten, D.; Raga, R.; Winzer, N.; Kailer, A. Modeling hydrogen diffusion in a tribological scenario: A failure analysis of a thrust bearing. Wear 2019, 438, 203054. [Google Scholar] [CrossRef]
  63. Danielsen, H.; Guzmán, F.G.; Fæster, S.; Shirani, M.; Rasmussen, B.; Linzmayer, M.; Jacobs, G. Accelerated White Etch Cracking (WEC) FE8 type tests of different bearing steels using ceramic rollers. Wear 2022, 494, 204230. [Google Scholar] [CrossRef]
  64. Brandt, J.-M.; Benedek, M.; Guerin, J.S.; Fliege, J. Reliability-as-a-Service for bearing risk assessment investigated with advanced mathematical models. Internet Things 2020, 11, 100178. [Google Scholar] [CrossRef]
  65. Richardson, A.D.; Evans, M.H.; Wang, L.; Wood, R.J.; Anderson, W.B. Confirming subsurface initiation and propagation as one mechanism for white etching crack (WEC) formation. Tribol. Lubr. Technol. 2014, 70, 24. [Google Scholar]
  66. Blass, T.; Dinkel, M.; Trojahn, W. Bearing performance as a function of structure and heat treatment. Mater. Sci. Technol. 2016, 32, 1079–1085. [Google Scholar] [CrossRef]
  67. Pape, F.; Petzold, M.; Poll, G. Computational investigation of crack inducing forces on bearing surfaces regarding the tribofilm structure. Int. J. Comput. Methods Exp. Meas. 2019, 7, 340–349. [Google Scholar] [CrossRef]
  68. Zhao, N. A Study of Initiation Mechanisms of White Etching Cracking in Rolling Bearings; University of Southampton: Southampton, UK, 2021. [Google Scholar]
  69. Loos, J.; Kruhöffer, W.; Breutinger, F.; Rupprecht, M. WEC-Bildung in der Mischreibung: Rauheits-und Axialschwingungseinfluss. Tribol. Und Schmier. 2016, 63, 27. [Google Scholar]
  70. Piras, F.M. In Situ Attenuated Total Reflection Tribometry. Ph.D. Thesis, ETH, Zürich, Switzerland, 2002. [Google Scholar]
Figure 1. Illustrations of the 81212 bearing components and their dimensions [mm]: T (height) 26, d (bore diameter) 60, D = d1 (outer diameter) 95, D1 (bore diameter housing washer) 62, roller length = roller diameter 11 [36]. Please note that the actual bearing used for the tests has a cage containing 15 rolling elements.
Lubricants 12 00045 g001
Figure 2. Optical features on the bearing washer surface from the test run PAO-3 and their infrared spectra. Typical wavenumbers allocated to secondary amides are indicated with the letters a–e in the spectra: 3330 cm−1 (N-H stretching, a), 1656 cm−1 (amide-carbonyl stretching, amide I-band, b), 1546 cm−1 (coupling of N-H bending and C-N stretching, amide II-band, c), 3074 cm−1 (overtone of amide II-band, d), and 701 cm−1 (NH-wagging, e). Peaks not allocated to amides are 2060 cm−1 (CN, CO, NCO complexes), 1450 cm−1, 1407 cm−1, 1243 cm−1 (C-O stretching of carboxylic acid), 1081 cm−1 (C-O stretching), and 930 cm−1 (C-O-H bending of carboxylic acid). If the C-O originated from alcohols, a peak at 3600 cm−1 would appear.
Lubricants 12 00045 g002
Figure 3. Surface infrared spectra of bearing washer from PAO/ZDDP/DCHA-8 (blue) with an overlay spectra of a polyamide oil supply hose of the FE8 test rig (red), (test duration 20 h 0 min, ending criteria preset running time).
Lubricants 12 00045 g003
Figure 4. Infrared spectra of visible spots on bearing washer surface from the test PAO/ZDDP/DCHA-9 (test duration 18 h 0 min, ending criteria preset running time). Red and blue lines are spectra taken from the two different spots as shown in the pictures.
Lubricants 12 00045 g004
Figure 5. Infrared spectra of a spot marked by the yellow circle on the surface of the bearing washer from the test PAO/ZDDP/DCHA-9 before (blue) and after (red) cleaning with heptane.
Lubricants 12 00045 g005
Figure 6. Negative (left) and positive (right) TOF-SIMS measurement on an unused bearing carried out solely with Bi-ions without additional sputter source. Estimated maximum depth of profile was 25 nm.
Lubricants 12 00045 g006
Figure 7. Negative (left) and positive (right) TOF-SIMS measurement carried out solely with Bi-ions without additional sputter source. Estimated maximum depth of profile was 25 nm. Bearing surface of Z0051 (PAO/ZDDP/DHCA-5, running time 96 h).
Lubricants 12 00045 g007
Figure 8. The surface IR-spectra of two different spots on the shaft washer of the test-head-sided bearing of the test run PAO-4 (test duration 18 h 0 min, ending criteria preset running time) with different C=O-species. Peaks at 1755 cm−1, 1733 cm−1 (ester C=O stretching), and 1724 cm−1 (ketone C=O stretching), with different carboxylic acid salts at 1560 cm−1, 1552 cm−1, 1544 cm−1 (black spectrum), 1577 cm−1, and 1561 cm−1 (red spectrum).
Lubricants 12 00045 g008
Figure 9. The surface IR-spectra on the shaft washer of the test-head-sided bearing of test run PAO-4. Peak at 1795 cm−1 might indicate the presence of a lacton or an anhydrid.
Lubricants 12 00045 g009
Figure 10. Infrared spectra on the washer surface of motor sided bearing PAO/ZDDP/DCHA-10, test duration 18 h 0 min, ending criteria preset running time. The spectra were recorded by using the ATR mode with using a pressure of 100 psi. Procedure: Background on the fresh metal surface; recorded spectra at point of interest; used the implemented recording software (Omnic, Version 8.1.11) to calculate the difference in spectra regarding the background; and used Kubelka-Munk function for reflectance correction. Each line with different colour represents a spectrum on the bearing surfaces. Peaks at 3900–3500 cm−1 (Me-OH, R-OH), 3006 cm−1 with small shoulders at 3033 cm−1 and 3051 cm−1 (=C-H stretching), 2163 cm−1 (CN, SCN, OCN), 2058, 1998, 1954 cm−1 (typical for carbonyl metal complexes), 1747 cm−1 (ester C=O stretching), 1713 cm−1 (carboxylic acid C=O stretching), 1542 cm−1 (carboxylate), 1528, 1511 cm−1 (NO, amides), and 1400 cm−1 (=C-H in-plane bending).
Lubricants 12 00045 g010
Figure 11. Infrared spectra on the washer surface (PAO/ZDDP/DCHA-10) with peaks at 3280 cm−1 (secondary amide N-H stretching), 1650 cm−1 (amide C=O), and 1550 cm−1 (amide N-H). Each colour represents a spectrum on a different location.
Lubricants 12 00045 g011
Figure 12. Infrared spectra of poly-α-olefin containing 1% of iron, 1% of copper and 1% of zinc powder stored at 100 °C for 1d (magenta), 2d (blue), 3d (red), 7d (green), 11d (black) and 41d (cyan). The first indication of carboxyl functionalities after 2–3 d, clearly pronounced after 7d at 1786 cm−1 and 1722 cm−1. Formation of 1599 cm−1 peak after 11d.
Lubricants 12 00045 g012
Table 1. Summary of the oil samples prepared for the study.
Preparation TagPAO [%]ZDDP [%]DCHA [%]
PAO100
PAO/ZDDP/DCHA952.52.5
Table 2. Overview of the conducted tests on the FE8 test rig. Oil supply hosing material PA = polyamide, AISI 316 = flexible stainless steel and silicone, n.d. = not determined.
Test TagRunning Time [hh:mm]Cause of EndingHosing Oil SupplyWEC y/n
PAO/ZDDP/DHCA-172:15Torque > 35 NmPAy
PAO/ZDDP/DHCA-232:30Sound sensor > 16PAy
PAO/ZDDP/DHCA-324:52Manually stoppedPAy
PAO/ZDDP/DHCA-496:05Torque > 35 NmSiliconen
PAO/ZDDP/DHCA-530:00Preset running timeAISI 316n
PAO/ZDDP/DHCA-691:57Torque > 35 NmPAy
PAO/ZDDP/DHCA-792:50Torque > 35 NmSiliconen
PAO/ZDDP/DHCA-820:00Preset running timePAn
PAO/ZDDP/DHCA-918:00Preset running timePAn.d.
PAO/ZDDP/DHCA-1018:00Preset running timeSiliconen.d.
PAO-1160:42Torque > 35 NmPAn
PAO-2137:47Torque > 35 NmPAn
PAO-318:00Preset running timePAn.d.
PAO-418:00Preset running timeSiliconen.d.
Table 3. Overview of the mean values of measured TOF-SIMS signals until an approx. depth of 25 nm from a low reference bearing washer compared to an unused one.
Element xIonisation Mode Mean Value of Signal x/Signal Fe from PAO/ZDDP/DCHA (a)Mean Value of Signal x/Signal Fe from a Virgin Bearing after Cleaning (b)a/b
HNegative22238278
CNegative10900.392795
ONegative2650.58457
SiNegative1970.111791
SNegative13530.226150
PNegative66300.768724
CNNegative46973.721263
HPositive0.610.0161
SiPositive5.980.00-
CuPositive7.430.00-
ZnPositive9.260.00-
Disclaimer/Publisher’s Note: The statements, opinions and data contained in all publications are solely those of the individual author(s) and contributor(s) and not of MDPI and/or the editor(s). MDPI and/or the editor(s) disclaim responsibility for any injury to people or property resulting from any ideas, methods, instructions or products referred to in the content.

