Article

Prediction of Thrust Force and Torque for High-Speed Drilling of AL6061 with TMPTO-Based Bio-Lubricants Using Machine Learning

1
Department of Technology, Savitribai Phule Pune University, Pune 411007, India
2
Department of Mechanical Engineering, All India Shri Shivaji Memorial Society’s College of Engineering, Pune 411001, India
3
Vel Tech Rangarajan Dr. Sagunthala R&D Institute of Science and Technology, Chennai 600062, India
4
Department of Industrial Engineering, College of Engineering, King Saud University, P.O. Box 800, Riyadh 11421, Saudi Arabia
5
Industrial Engineering Department, College of Engineering, University of Houston, Houston, TX 77204, USA
*
Author to whom correspondence should be addressed.
Lubricants 2023, 11(9), 356; https://doi.org/10.3390/lubricants11090356
Submission received: 18 July 2023 / Revised: 11 August 2023 / Accepted: 15 August 2023 / Published: 23 August 2023
(This article belongs to the Special Issue Advances in Surface Engineering and Tribology)

Abstract

:
This study was designed to examine the effects of a trimethylolpropane trioleate (TMPTO)-based lubricant on thrust force and torque under the high-speed drilling of Al-6061 as an effective environmentally friendly cutting fluid. The tribological performance of three lubricant blends was evaluated based on ASTM standards. TMPTO base oil, notably enhances load-carrying capacity under extreme pressure conditions, with a seizer load of 7848 N. The best-performing oil was further optimized using a Taguchi-based design experiment to investigate the effect of different additive concentrations on thrust force and torque under actual contact conditions. Experiments were conducted using three critical machining parameters: additive concentration, spindle speed, and feed rate. The results of the ANOVA analysis reveal that spindle speed contributes most substantially (62.99%) to torque, with feed rate (23.72%) and additive concentration (7.74%) also showing significant impacts. On the other hand, thrust force is primarily influenced by feed rate (73.52%), followed by spindle speed (16.82%), and additive concentration (6.28%). Furthermore, a machine learning model was developed to predict and compare a few significant aspects of high-speed drilling machinability, including thrust force and torque. Three different error metrics were utilized in order to assess the performance of the predicted values, namely the coefficient of determination (R2), mean absolute percentage error (MAPE) and mean square error (MSE), which are all based on the coefficient of determination. Compared to other models, decision tree produces more accurate prediction values for cutting forces. The present study provides a novel approach for evaluating the most promising biodegradable lube oils and predicting cutting forces by formulating a perfect blend.

1. Introduction

A collaborative effort between researchers and industry experts is actively involved in improving the characteristics of vegetable-based lubricants to make them sustainable cutting fluids. Additive technology and the chemical modification of vegetable oils are some methods being explored to enhance their tribological properties and overall performance. With ongoing research and development, vegetable-based lubricants will likely improve performance and eventually replace mineral-based cutting fluids in various applications [1,2]. Cutting fluid dissipates the heat generated in the metal cutting process and also minimizes friction between the tool–work interface, allowing smoother and more efficient cutting. Mineral-based metal cutting fluids have less lubricity compared to vegetable oils. However, they are toxic, non-biodegradable, and detrimental to human beings [2,3,4,5].
Researchers are exploring trimethylolpropane trioleate (TMPTO) as a potential environmentally friendly lubricant additive and its efficacy under different working conditions. TMPTO is likely being evaluated as a potential bio-lubricant due to its low toxicity and excellent biodegradability, which are important properties for reducing the environmental impact of lubricants [6,7]. Adding chemically sulfurized vegetable oil-based additives enhances the lubricating properties of TMPTO base oil [8]. Sulfurized vegetable oil-based additives are known to have excellent antiwear and extreme pressure (EP) properties. They can form a protective film on metal surfaces, reducing friction and wear under high-pressure conditions. This protective film is a barrier between the moving surfaces, preventing direct metal-to-metal contact and reducing frictional losses [9]. Bio-lubricants derived from vegetable oils through chemical modification with TMP provide a sustainable and environmentally friendly alternative to mineral-based lubricating oils. They offer similar performance characteristics and can be applied across diverse fields and industries while reducing the overall environmental impact and promoting a more sustainable approach to lubrication.
María et al. (2021) experimentally proved that adding graphene nanoparticles improves the lubricating properties of TMPTO, leading to a thicker and more effective lubricating film between moving surfaces. A thicker film can help reduce friction and wear, enhancing overall lubrication performance. On the other hand, adding boron hexagonal nitride nanoparticles seems to have the opposite effect, causing a reduction in film thickness. This suggests that the presence of boron hexagonal nitride nanoparticles in TMPTO may hinder the formation of a thick lubricating film, potentially resulting in less effective lubrication between the surfaces. As a result, film thickness decreases, which can harm lubrication performance.
Furthermore, their experimental results also indicate slightly lower friction coefficient values with the influence of nanoparticles. This suggests that both the graphene nanoplatelets and boron hexagonal nitride nanoparticles can positively reduce friction between the surfaces [10,11]. Wu et al. (2015) tried to optimize the synthesis process of trimethylolpropane trioleate (TMPTO) utilizing oleic acid (OA) and trimethylolpropane (TMP) [12].
José et al. (2019) studied nano-lubricants composed of an ester base oil primarily consisting of trimethylolpropane trioleate, utilizing dispersions of hexagonal boron nitride (h-BN) nanoparticles at mass concentrations of 0.50, 0.75, and 1.0 wt.%. Their findings suggest that h-BN nanoparticles in the nano-lubricant formulation created physical protective tribofilms between the rubbing surfaces. These tribofilms are considered to have a vital role in reducing friction and minimizing wear, thus enhancing the overall tribological performance of the nano-lubricant system [13]. Similar trends in antifriction and antiwear performance were obtained for graphene nanoplatelets at a mass concentration of 0.25% of graphene nanoplatelets (GnP) [14]. The wear prevention properties of a trimethylolpropane (TMP) ester obtained from palm oil were assessed using a four-ball machine under different lubrication regimes. The results indicate that adding 3% of this palm oil-based TMP ester to any regular base oil significantly reduces the coefficient of friction and wear scar by up to 30% [15].
Polyol ester-based vegetable oils have shown promising properties compared to those of mineral-based lubricants during the high-speed drilling of aluminum and stainless-steel material [16,17,18]. Using graphene-based nanofluid leads to a substantial reduction in drilling torque, which is approximately 25% lower compared to that of a typical emulsion lubricant. Consequently, employing the nanofluid results in a significant expansion of tool life, of up to 20 times longer, compared to that when using a conventional emulsion lubricant [19].
In the context of drilling fluid applications, trimethylolpropane ester (TMPE) was investigated as an additive, specifically as a nonionic surfactant. It was studied alongside other potential polyol esters, including neopentyl glycol ester (NPGE) and pentaerythritol ester. The purpose of this examination was likely to assess the suitability and effectiveness of TMPE, NPGE, and pentaerythritol ester as additives in drilling fluids, potentially evaluating their impact on various properties such as viscosity, lubricity, stability, or other relevant performance factors [7,20,21].
Machine learning (ML) has found numerous applications in machining processes across various contexts, such as roughness quality prediction, tool condition monitoring, process optimization, quality control, etc. [21,22]. The versatility and adaptability of machine learning make it a powerful tool for optimizing and enhancing various aspects of machining operations and cutting tools [23,24]. Various techniques are used for the prediction of cutting forces and torque in drilling, such as artificial neural networks [25,26], the response surface methodology [27,28], and the use of different machine learning algorithms [29,30,31] under dry as well as lubricated conditions.
The predictions developed using advanced machine learning techniques are more accurate in optimizing machining operations and reducing production costs. It is worth noting that publicly accessible research on machine learning models specifically developed for machining with cutting fluids may be relatively limited compared to that for dry machining. Moreover, there is very limited information available regarding the prediction of thrust force and torque under biodegradable lubrication conditions in order to be able to make accurate predictions. Cutting fluids can affect temperature distribution, chip disposal, friction, and tool life, influencing the forces involved in cutting operations and torque. Including cutting fluid-related parameters in the model can help capture these effects and improve the accuracy of the predictions.
Investigating the impact of TMPTO-based lubricant on thrust force and torque during the high-speed drilling of Al-6061 is essential to enhancing machining performance and prolong tool life, improving surface quality, boosting energy efficiency, and ensuring overall process sustainability. The objective of this study was to investigate the drilling process of Al 6061 using a TMPTO-based bio-lubricant as the drilling fluid. The main focus was on understanding and predicting the cutting forces and torque involved in high-speed drilling operations. In addition, the current study presents four regression-based machine learning techniques (linear regression, decision Trees, random forest and support vector machine) to construct predictive models that determine how machining forces develop during turning. An optimization problem was developed to find the exact combination of parameters so that maximum accuracy could be achieved with the fewest resources possible. This would ensure that the model was efficient and effective in its predictions.

2. Materials and Methods

2.1. Lubricants

TMPTO (trimethylolpropane trioleate) was chosen as the base oil due to its significant rheological properties and long-chain fatty acid content [6,7,32,33]. Three additives were obtained from the local market to formulate the blend. The blends were thoroughly mixed using a magnetic stirrer to ensure uniformity. Among the three formulated samples, sample A contains chemically modified sulfurized vegetable oil additive, which has a sulfur content of 15%, while sample B contains a sulfurized vegetable oil-based olefin, which has a sulfur content of 26.6%, and sample C has a sulfur content of 39.7%. The rheological properties of additives are presented in Table 1 as influenced by a lube oil formulator.
Infrared spectroscopy was used to characterize the molecular structure of the formulated TMPTO base oil, as depicted in Figure 1. Olefinic (alkane) C-H stretching and bending vibration peaks were observed at 3004.38 cm−1 and 1461.37 cm−1 to 1354.68 cm−1, respectively. Peaks for the carbonyl (C=O) stretching vibration and methylene (C-H) bending vibration were observed at 1740.90 cm−1 and 1461.37 cm−1, respectively. Trimethylolpropane trioleate (TMPTO) peaked at 721.33 cm−1 due to its long alkyl chain.

2.2. Four-Ball Test

Experiments were carried out on the DUCOMTR-30L four-ball tester to investigate the effect of additives in TMPTO base oil on wear. The test setup consists of four steel balls (made up of AISI E52100 chrome alloy) with 62–64 HRC arranged in a triangular configuration. Three balls are fixed at the base, forming a lower stationary ball pot, while the fourth ball, known as the top ball, is placed on top and loaded against the stationary balls. The ball holder assembly securely holds the four balls in place during the test. The holder usually has the ability to rotate the top ball at a specific speed. The ball holder assembly allows for the lubricant under study to be applied to the balls during the experiment. It also houses the temperature and load control mechanisms. An arrangement is in place to apply a specific load on the top ball to create contact pressure between the balls. This load is critical in determining the wear and extreme pressure properties of the lubricant. The temperature of the lubricant in the ball pot, the rotation speed of the top ball, and the applied load were all continuously monitored using an electronic controller.

2.3. Antiwear and Extreme Pressure Tests

Ducom’s four-ball tester is employed for conducting AW/EP (Anti-Wear/Extreme Pressure) tests per ASTM D4172-94 and ASTM D2783-88 standards [34,35]. The lubricant evaluation process involves assembling three 12.7 mm diameter steel balls tightly together and covering them with the lubricant under examination. A 12.7 mm diameter steel ball is pressed with a force of either of 392 N into the space formed by the three clamped balls, creating a three-point contact configuration. The temperature of the test lubricant is precisely controlled at 75 °C, and then the top ball is set in motion, rotating at 1200 rpm) for a duration of 60 min. The lubricants are compared based on the average size of the wear scars formed on the three lower clamped balls [34].
After the test, a solvent organic compound such as acetone removes the oil from the wear scars on the balls. Subsequently, an optical microscope is utilized to measure the diameter of the wear scars.
EP tests determine the lubricant’s ability to prevent wear and indicate the load at which it fails. ASTM D2783 is used to measure EP properties. The parameters used to measure the device’s properties are time = 10 s, temperature = 27 °C, RPM = 1760, and load = 6–800 kgf, as defined in the standard [35]. The test procedure involves conducting a series of tests, each lasting 10 s. The tests are performed at increasing loads until welding occurs. Welding refers to the phenomenon where the load-carrying ability of the lubricant is exceeded, resulting in the welding of the steel balls due to extreme pressure. The load at which welding takes place provides a measure of the extreme pressure properties of the lubricant. Higher loads before welding indicate better EP characteristics of the lubricating fluid. The results and discussion section of the study includes a comprehensive analysis and discussion of the AW (anti-wear) and EP (extreme pressure) test outcomes.

2.4. Drilling Condition

We intended in this work to conduct a comparative analysis of a variety of different approaches for modeling the drilling process of Al 6061 in order to compare the results. Aluminum 6061 (Al-6061) is a widely used alloy in various industries due to its excellent combination of mechanical properties, good formability, and high corrosion resistance. It belongs to the 6xxx series of aluminum alloys and is commonly used for structural applications, such as in aerospace, automotive, marine, and general engineering. The tensile strength of Aluminum 6061 typically ranges from about 140 to 290 MPa. Experiments on an Al 6061 workpiece were conducted to obtain the datasets for the models. A 150 mm × 150 mm × 20 mm plate was used for this investigation, the chemical composition and major mechanical properties of which are depicted in Table 2 and Table 3, respectively.
Drilling experiments were performed using HSS drill tools on a BFW Chakra BMV 60 CNC machining center. Thrust force and torque measurements were captured using a wireless Spike tool holder dynamometer. Experimental cutting force values were monitored and recorded using a data acquisition system, as depicted in Figure 2.

3. Experimental Design

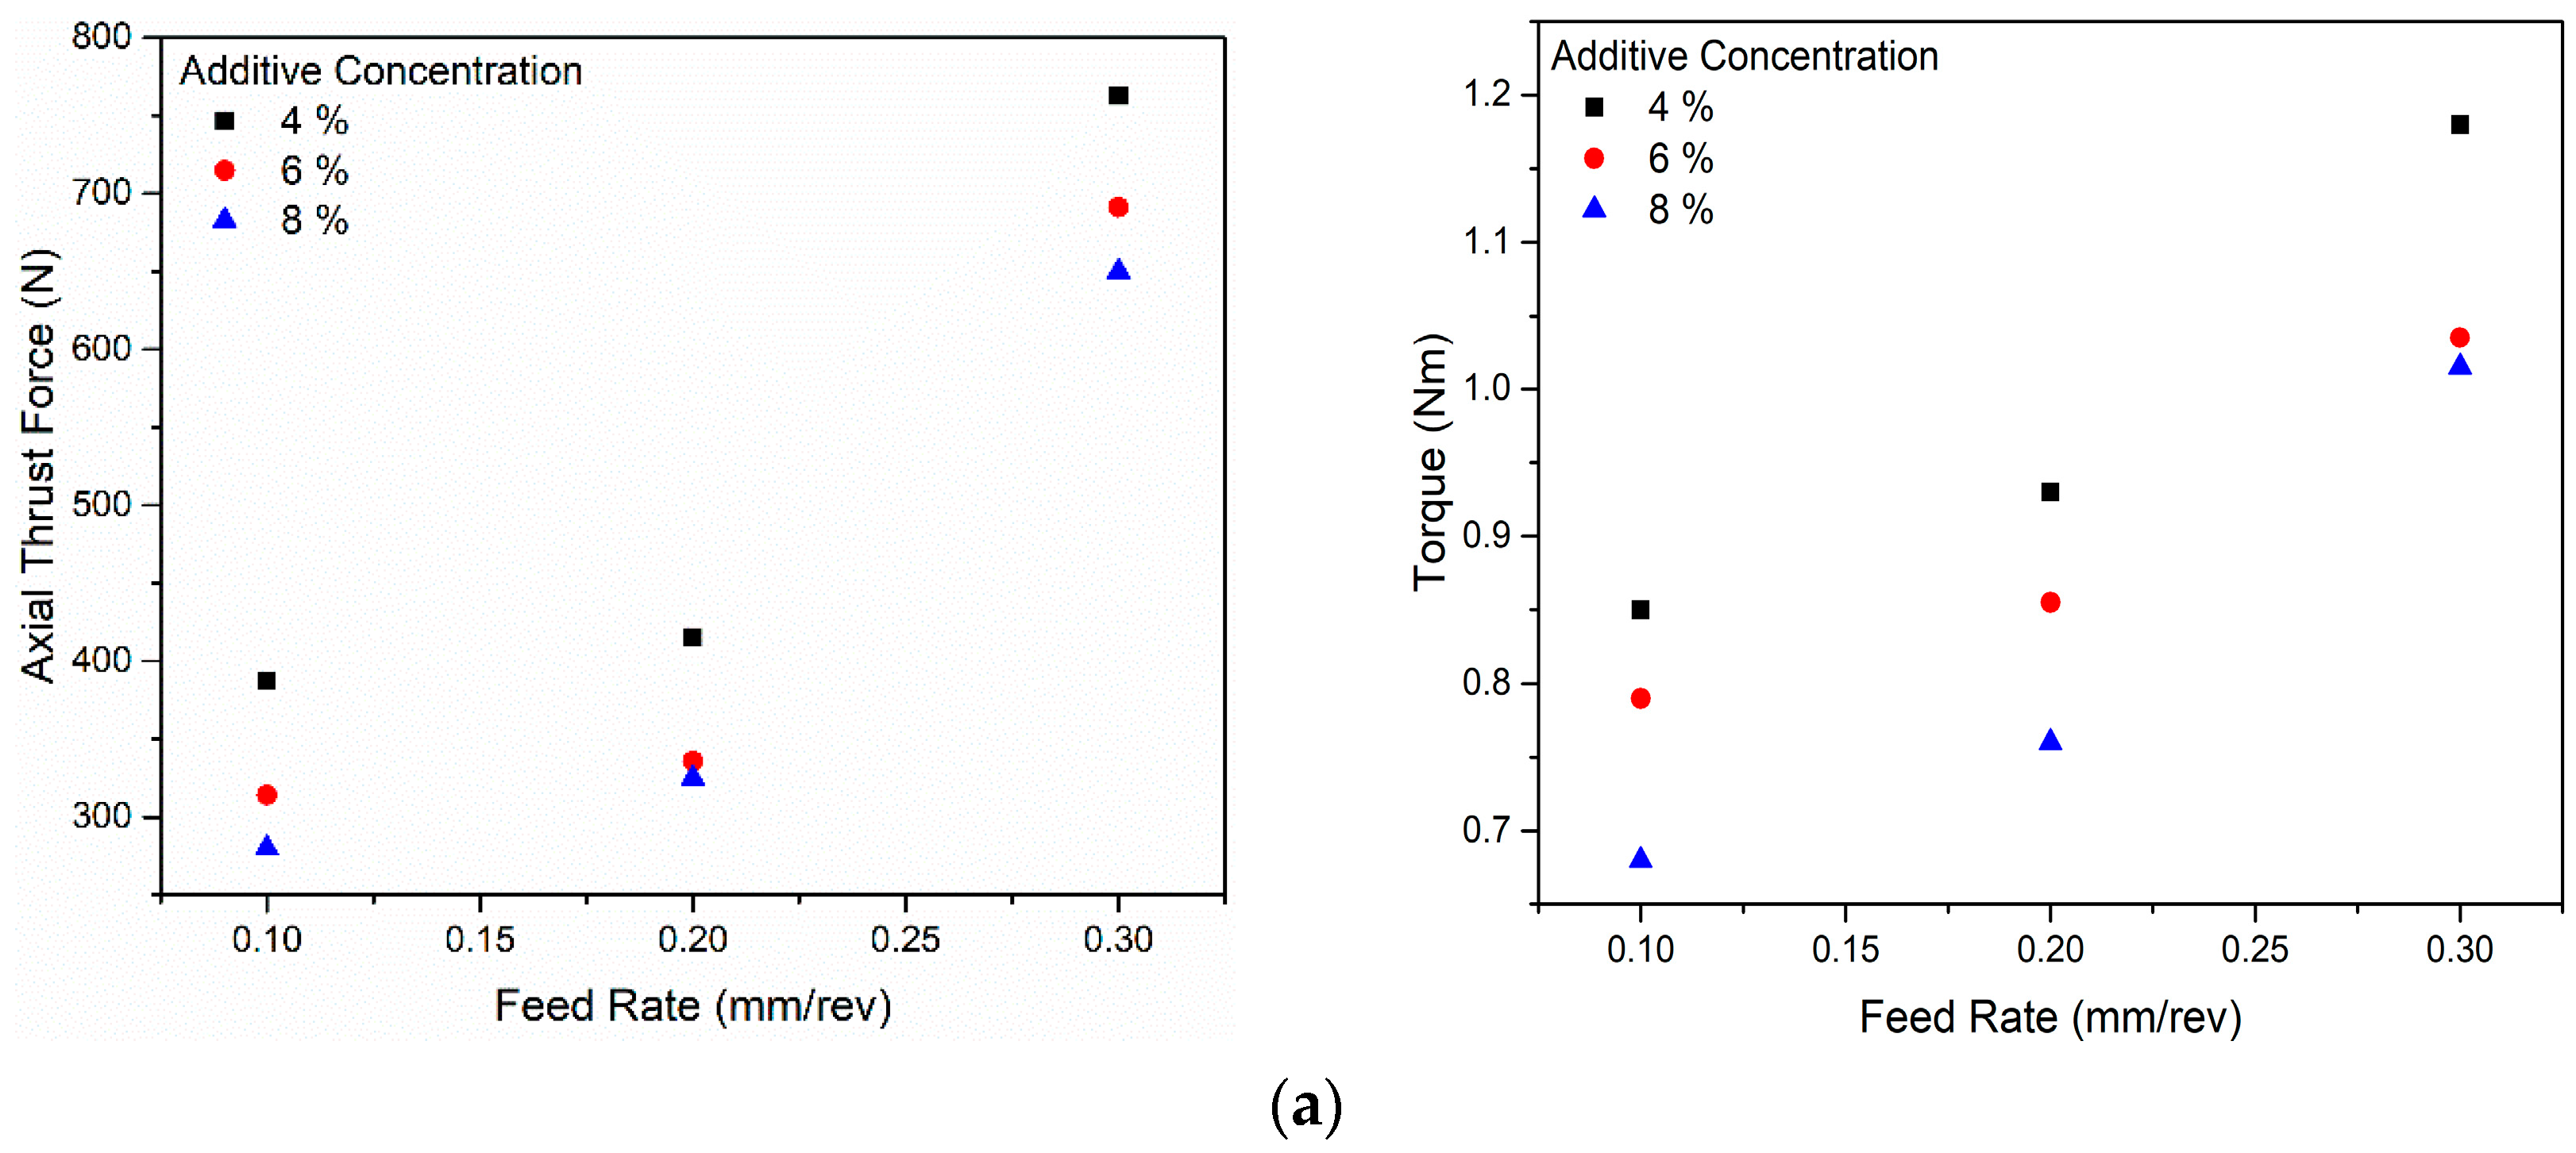
This study aimed to investigate the influence of additive concentration, spindle speed, and feed rate on thrust force and torque. The chosen parameters directly impact the lubrication conditions between contacting surfaces, affecting film thickness, friction, and tool wear. Understanding the relationship between these parameters and thrust force and torque is essential to optimizing lubrication performance and enhancing the efficiency and reliability of the tribological system under actual contact conditions. A Taguchi L9 orthogonal array that systematically varies these parameters while measuring thrust force and torque can provide valuable insights into their interaction and effects in a practical setting. The data obtained from such experiments can be used to develop predictive models and optimize lubrication strategies for specific applications.
A preliminary screening result of AW/EP was used to select the blend for this investigation. Three levels, as well as three key control factors, were considered in this investigation. For the most effective type of lube oil, the control factors and corresponding levels were additive concentrations, with a 4%, 6% and 8%, spindle speed; 3053 RPM, 4580 RPM and 6107 RPM; and a feed rate of 0.1 mm; 0.2 mm, and 0.3 mm. The level of control factor determines values taken for the experiment. The experiment was conducted using the L27 orthogonal array. Under Taguchi’s orthogonal array, the proposed investigation entails the conduction of 27 experiments. In order to analyze the variance and single-to-noise ratios of the results, each response parameter was replicated twice, leading to a total of 54 observations. Upon completion of the experiment, the response parameters are transformed into a signal-to-noise (S/N) ratio. Calculated S/N ratio values are compared to the obtained results to see if they deviate from or are close to them. In the present study, the objective function follows a “smaller is better” approach, as indicated by Equation (1). This is because all the response parameters are anticipated to have smaller values for improved performance.
S N = l o g 1 n i = 1 n y 2

3.1. Machine Learning Models for Predicting Responses

3.1.1. Multiple Linear Regression

The multiple linear regression algorithm (MLR) is a linear regression algorithm used in datasets where the dependent variable is a single one, and the independent variables are multivariate [23]. Linear regression is a type of regression analysis that demonstrates a linear relationship between one or more independent variables and a dependent variable. By using multiple linear regression, the dependent variable (y) is modeled via the independent variables (x1, x2, x3xn) as shown in Equation (2),
y = w 1 x 1 + w 2 x 2 + w 3 x 3 + + w n x n + b
where,
  • x1, x2, x3, …, xn are the independent variables;
  • y is the dependent variable;
  • n is a positive integer;
  • b is the bias or the intercept;
  • w1, w2, w3, …, wn are the weights.

3.1.2. Random Forest Regression

The random forest regression algorithm is a class of machine learning algorithms that combines multiple random decision trees, each of which is trained on a subset of the data set to generate a model [36]. As a result of using multiple trees, the algorithm becomes more stable, and the variance is reduced. Random forest regression is a popular model in the field of regression analysis due to its ability to work well with large and diverse data sets.
The algorithm creates each tree based on a different sample of input data, which are used as input information. The features are randomly selected for splitting at each node, and the trees are run in parallel at each node without any interaction. In order to produce a single prediction, the predictions from all of the trees are then averaged to produce a single result that can be referred to as the prediction of the random forest. A visual representation of a random forest is shown in Figure 3.

3.1.3. Support Vector Machines

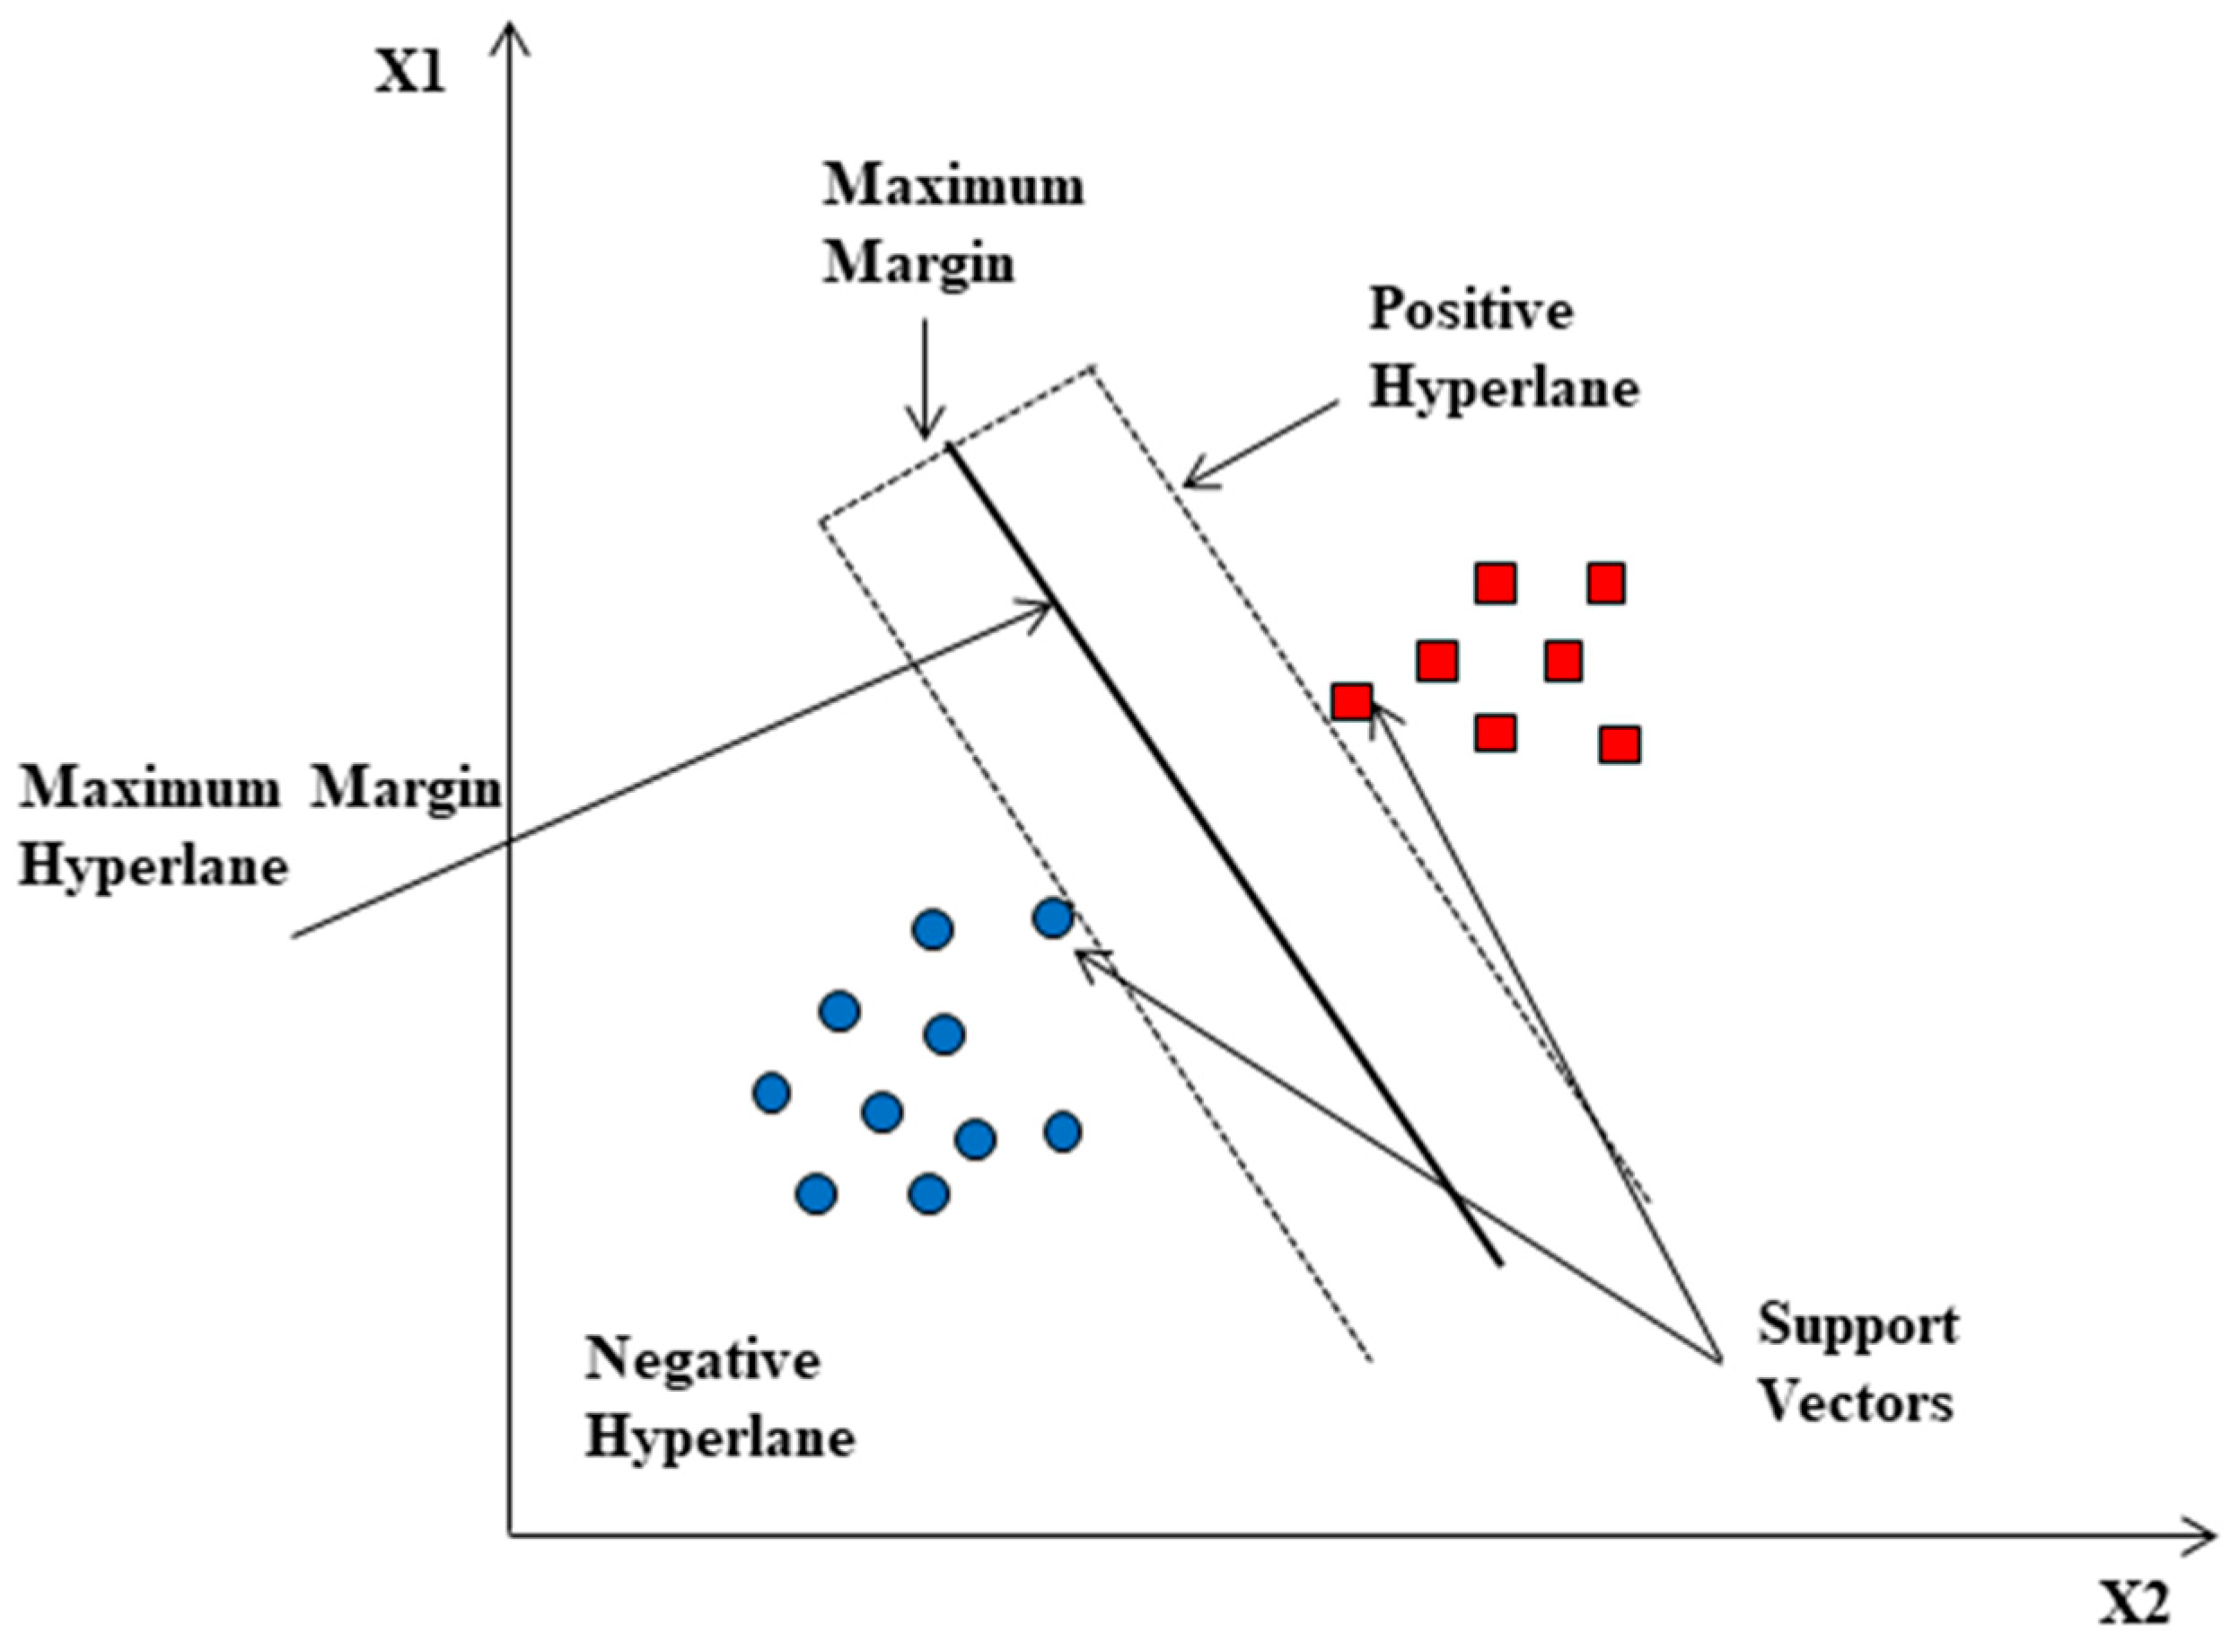
Support vector machines are used to classify data points based on a hyperplane in N-dimensional space (N-number of features), as shown in Figure 4. As a result, several possible hyperplanes can be used to separate the two data points [36]. The objective is to find a plane with the maximum margin, representing the maximum distance between two data points. By increasing the margin’s distance, future data points can be classified with greater confidence because they will be reinforced with some reinforcement. Data points are classified using hyperplanes, which are decision boundaries. Depending on which side of the hyperplane the data points fall on, they can be classified into different categories.
Furthermore, in the context of feature space, the dimensionality of the hyperplane is determined by the number of input features. When two input features exist, the hyperplane reduces to a line in the feature space. Three input features convert the hyperplane into a two-dimensional plane. As the number of features increases, visualizing the data and the relationships among the features becomes more challenging.

3.1.4. Decision Tree

In its most basic form, a decision tree can be explained as a flowchart showing the clear path that leads to a decision. Figure 5 shows a graphical representation of the decision tree.
In data analytics, decision tree is an algorithm used to determine whether data can be classified based on a condition. Initially, a decision tree starts at a point called a node, then branches away from it in two or more directions. Generally, each branch has many possible outcomes, and it is a combination of various decisions and chance events that lead to the outcome.

3.2. Model Performance Evaluation

Training and testing subsets were divided in 80:20 ratios, widely accepted and well-established. Three statistical indices were used to assess the accuracy of the proposed model: mean square error (MSE), mean absolute per cent error (MAPE), and coefficient of determination (R2). These indices provide quantitative measures to assess the performance and predictive capability of the model. The MSE quantifies the average squared difference between predicted and actual values, the MAPD measures the average percentage deviation between predicted and actual values, and the R2 indicates the proportion of variance in the dependent variable explained by the model. The accuracy of any data-driven modeling technique is commonly measured by using all of these indices [31]. The coefficient of determination (R2) value is calculated by using Equation (3).
R 2 = 1 i = 1 n ( Y o b s e r v e d   v a l u e Y p r e d i c t e d   v a l u e ) 2 i = 1 n ( Y o b s e r v e d   v a l u e Y ¯ ) 2
To determine the performance of a model, the mean squared error (MSE) is usually used per Equation (4).
M S E = 1 n i = 1 n y P y A 2
yP represents the predicted values, yA represents the actual values, and n is the number of samples. It is also possible to evaluate the reliability of the neural network model’s result using the mean absolute percentage error (MAPE). MAPE is calculated by using Equation (5):
M A P E = 100 % n i = 1 n y ρ y A y A
However, MSE and MAPE are both measures of the accuracy of a model, but they differ in how they handle outliers. R-squared is a measure of how well the model accounts for the variance in the data and is not affected by outliers. MSE is more affected by outliers because it squares all errors, while MAPE is more robust since it takes the absolute value of the error. R-squared is not affected by outliers since it is a measure of the variance explained by the model, not the accuracy of the model itself.
In studies involving animals or humans and other research requiring ethical approval, it is crucial to provide details regarding the authority that granted approval and the corresponding ethical approval code. This information ensures transparency and demonstrates compliance with ethical standards.

4. Results

4.1. Tribological Performance

A microscope was used to measure the diameter of the wear scars on the surface of the test ball. In comparison to lube oil A (0.44 mm) and lube oil B (0.40 mm), lube oil C showed the smallest AWSD (0.37 mm) and best AW properties, as shown in Figure 6.
A combination of TMPTO-based vegetable oils with long fatty acid chains and a proportion of sulfur has a synergistic effect on the performance of lubricants, suggesting that they enhance the performance of the oil itself. A series of extreme pressure tests were carried out until the point of welding was reached. Based on the observations, it has been noted that lube oil A exhibits poor performance under extreme pressure conditions, specifically ceasing at a load of 2000 N. In comparison, lube oil B ceases at a higher load of 6082 N, while lube oil C exhibits even better performance, ceasing at 7848 N. In conclusion, the experimental findings indicate that lube oil C, which incorporates a chemically modified sulfuric additive in conjunction with TMPTO base oil, notably enhances load-carrying capacity under extreme pressure and temperature conditions. This highlights the additive’s effectiveness in improving the lubricant’s performance in demanding operational scenarios. This modification delivers superior performance and long-term stability, making lube oil C the best option for industrial applications requiring heavy-duty performance.

4.2. Preliminary Results of Experiment

According to the previous section, sample C showed the best anti-wear and extreme pressure performance results, followed by samples B and A. An in-depth analysis of sample C in actual contact during the drilling operation was conducted using a Taguchi technique to determine the thrust force, torque, surface roughness, and power consumption.
A summary of the experimental values is shown in Figure 7. It is evident that cutting parameters and cutting forces are correlated. Despite the increased additive concentration, both cutting forces remained minimal and stable. Increasing feed rate increased cutting forces. Based on the results of Wei et al. [37], the change in thrust force concerning spindle speed is minimal or negligible. Therefore, this study’s result is consistent with the results we found for drilling aluminum alloys. Furthermore, twenty-seven (27) drilling experiments were conducted utilizing a Taguchi-based orthogonal array design. The thrust force and torque were individually modeled using a polynomial mathematical model, allowing for the independent analysis and optimization of these parameters.

4.3. Analysis of Thrust and Torque Force

Figure 8 shows sample of acquisition for the thrust and torque force obtained from the wireless Spike tool holder dynamometer.
Additionally, at the highest spindle speed chosen for this study, a slight increase in thrust force and torque was observed when employing a high feed rate. This can be attributed to the increased number of holes drilled, leading to heightened tool wear due to the elevated friction between the tool and the workpiece. Consequently, higher forces are generated as a result. Adding a chemically sulfurized vegetable oil additive (GS 440L) to TMPTO base oil significantly increases layer formation between the workpiece and tool. As a result of this composition, the trio film remains stable and hydrodynamic lubrication is maintained during drilling. On the other hand, slight effects of additive concentrations in the range of 4–8% seem to be observed on thrust force and torque force. Table 4 depicts the measured response value and single-to-noise ratios (S/N) of thrust force and torque.
To determine the proportionate change in the signal-to-noise (S/N) ratio for thrust force, parameter ranking and an analysis of variance (ANOVA) were conducted using MINITAB software (version 21.4.1). These analyses provide valuable insights into the relative importance of the parameters and the significance of their effects on thrust force. Table 5 and Table 6 illustrate the results of these calculations.
Figure 9 shows the main effects plots of the S/N ratios for the various parameters of the model that correspond to the various S/N ratios.
The analysis of Table 6 indicates that the most significant factor controlling thrust force is feed rate (73.52%), followed by speed (16.82%) and additive concentration (6.28%) as the least significant factor.
Table 7 and Table 8 illustrate the ranking of the parameters and analysis of variance for torque. Figure 10 shows the main effects plots of the S/N ratios for the various parameters
Table 8 indicates that the most significant factor controlling torque force is speed (62.99%), followed by feed rate (23.72%) and additive concentration (7.74%) as the least significant factor.

4.4. Prediction of Responses Using Different Machine Learning Models

Four different regression-based machine learning models were used to predict the response parameters of high-speed drilling operations. Figure 11 shows the proposed scheme for predicting response parameters using machine learning techniques. In this session, 54 data points derived from the experimental data were used to create and test the model. The 80% input data were randomly selected to train the model, and the 20% input data were used for testing and model evaluation.
Three input variables are used to predict responses by different models, including additive concentration, spindle speed, and feed rate. A standard scalar function was used to scale the training and testing data to minimize errors caused by unit differences in input parameters. The model is cross-validated using GridSearch CV to ensure that the parameters are the best and the model is not overfit or underfit. The model is evaluated through training and test errors to determine whether it is underfit or overfit. Authors compare the four models’ predictions for thrust force depicted in Table 9 and Figure 12. Three performance indicators are used to determine the accuracy of the predicted models. Table 10 shows the errors associated with testing and training for thrust force. It was found that decision tree gave the most accurate prediction for thrust force based on the error metrics used, followed by the Tree Support vector machine (SVM), linear regression, and random forest.
Table 11 and Figure 13 represent a comparison between the experimental torque values and the predicted values. According to the performance indicator for torque, as depicted in Table 12, it was found that the Tree Support vector machine (SVM) gave the most accurate prediction for torque based on the error metrics used, followed by Linear regression, decision tree and random forest.
Support vector machines (SVMs) have been established as highly efficient and accurate models. This study’s results validate this assertion, confirming SVMs as the optimal choice for regression tasks. However, the selection of the most suitable model depends on the nature of the problem at hand. For linear problems, SVMs tend to yield the highest accuracy. Conversely, when dealing with nonlinear problems, neural networks or random forests may be more appropriate choices [36,37].
The future scope of work involves conducting a comprehensive investigation into the impact of the TMPTO-based lubricant on thrust force and torque during the high-speed drilling of Al-6061 in order to enhance machining performance, extending tool longevity, enhancing surface quality, increasing energy efficiency, and upholding the overall sustainability of the process.

5. Conclusions

This experimental study investigated four responses using three key point parameters for Al 6061 material during drilling operations. From this investigation, the following conclusions may be drawn:
(1)
Incorporating the chemically sulfurized vegetable oil-based additive GS 440L with TMPTO base oil yields substantial enhancements in high-speed metal cutting applications, particularly when working with non-ferrous materials. This additive combination improves the lubricating properties and performance of the cutting process, leading to improved cutting efficiency.
(2)
The investigated properties reveal an additive concentration range that is optimized when combined with TMPTO base oil. TMPTO base oil, notably enhances load-carrying capacity under extreme pressure conditions, with a seizer load at 7848 N.
(3)
Based on the SN ratio analysis and ANOVA ranking of the test parameters, selected test parameters were statistically significant for the response variables. The results of the ANOVA analysis reveal that spindle speed contributes most substantially (62.99%) to torque, with feed rate (23.72%) and additive concentration (7.74%) also showing significant impacts. On the other hand, thrust force is primarily influenced by feed rate (73.52%), followed by spindle speed (16.82%), and additive concentration (6.28%).
(4)
Experimental and machine learning predictions confirmed strong correlations, and the proposed model offered acceptable results with relatively high prediction accuracy.
(5)
The forthcoming research will offer valuable insights into the applicability of TMPTO-based lubricants in high-speed drilling operations in order to enhance machining performance, prolong tool life, improve surface quality, boost energy efficiency, and ensure the overall sustainability of metalworking processes.

Author Contributions

Conceptualization, P.K. and B.B.; methodology, P.K., B.B., S.N., S.S., P.C., E.A.N. and A.K.; software, P.K., B.B., S.N. and S.S.; validation, P.K., B.B., S.N., S.S. and A.K.; formal analysis, P.K., B.B., S.N. and S.S.; investigation, P.K. and B.B.; resources, P.K., B.B., S.N. and S.S.; data curation, P.K., B.B., S.N., S.S., P.C., E.A.N. and A.K; writing—original draft preparation, P.K. and B.B.; writing—review and editing, P.K., B.B., S.S. and P.C.; visualization, P.K., B.B., S.N., S.S., P.C., E.A.N. and A.K; supervision, P.K., B.B. and S.S.; project administration, P.C., E.A.N. and A.K.; funding acquisition, E.A.N. and A.K. All authors have read and agreed to the published version of the manuscript.

Funding

King Saud University for funding this work through Researchers Supporting Project number (RSP2023R164), King Saud University, Riyadh, Saudi Arabia.

Institutional Review Board Statement

Not applicable.

Informed Consent Statement

Not applicable.

Data Availability Statement

Not applicable.

Acknowledgments

The authors extend their appreciation to King Saud University for funding this work through the Researchers Supporting Project number (RSP2023R164), King Saud University, Riyadh, Saudi Arabia.

Conflicts of Interest

The authors declare no conflict of interest.

References

  1. Bachchhav, B.D. Challenges in formulating Vegetable Based Metalworking Lubricants: A Review. In Proceedings of the TRIBOINDIA-2018 An International Conference on Tribology, Mumbai, India, 13–15 December 2018; pp. 13–15. [Google Scholar] [CrossRef]
  2. Gajrani, K.K.; Sankar, M.R. Past and Current Status of Eco-Friendly Vegetable Oil Based Metal Cutting Fluids. Mater. Today Proc. 2017, 4, 3786–3795. [Google Scholar] [CrossRef]
  3. Canter, N. Special Report: Growth likely but future still uncertain for environmentally friendly additives. Tribol. Lubr. Technol. 2018, 74, 12–22. [Google Scholar]
  4. Ghaisas, Y.G. Bio-based lubricants Road to conserve and improve energy efficiency. Labour Ind. Chron. 2014, 370–373. [Google Scholar]
  5. Rudnick, L.R. Additives: Chemistry and Applications, 2nd ed.; CRC Press: Boca Raton, FL, USA, 2009. [Google Scholar]
  6. Lee, C.T.; Lee, M.B.; Hamdan, S.H.; Chong, W.W.F.; Chong, C.T.; Zhang, H.; Chen, A.W.L. Trimethylolpropane trioleate as eco-friendly lubricant additive. Eng. Sci. Technol. Int. J. 2022, 35, 101068. [Google Scholar] [CrossRef]
  7. Raof, N.A.; Hamid, H.A.; Mohamad Aziz, N.A.; Yunus, R. Prospects of Plant-Based Trimethylolpropane Esters in the Biolubricant Formulation for Various Applications: A Review. Front. Mech. Eng. 2022, 8, 833438. [Google Scholar] [CrossRef]
  8. Kathamore, P.S.; Bachchhav, B.D. Tribological investigations of trimethylolpropane trioleate bio-based lubricants. Ind. Lubr. Tribol. 2021, 73, 1074–1083. [Google Scholar] [CrossRef]
  9. Bachchhav, B.D.; Kathamore, P.S. Wear behavior of environment friendly trimethylolpropane trioleate-based lubricant. Ind. Lubr. Tribol. 2022, 74, 557–563. [Google Scholar] [CrossRef]
  10. Guimarey, M.J.; Goncalves, D.E.; del Río, J.M.L.; Comunas, M.J.; Fernandez, J.; Seabra, J.H. Lubricant properties of trimethylolpropane trioleate biodegradable oil: High pressure density and viscosity. film thickness, Stribeck curves and influence of nanoadditives. J. Mol. Liq. 2021, 335, 116410. [Google Scholar] [CrossRef]
  11. Qiao, S.; Shi, Y.; Wang, X.; Lin, Z.; Jiang, Y. Synthesis of biolubricant trimethylolpropane trioleate and its lubricant base oil properties. Energy Fuels 2017, 31, 7185–7190. [Google Scholar] [CrossRef]
  12. Wu, Y.; Li, W.; Wang, X. Synthesis and properties of trimethylolpropane trioleate as lubricating base oil. Lubr. Sci. 2015, 27, 369–379. [Google Scholar] [CrossRef]
  13. Liñeira del Río, J.M.; Guimarey, M.J.; Comuñas, M.J.; López, E.R.; Prado, J.I.; Lugo, L.; Fernández, J. Tribological and thermophysical properties of environmentally-friendly lubricants based on trimethylolpropane trioleate with hexagonal boron nitride nanoparticles as an additive. Coatings 2019, 9, 509. [Google Scholar] [CrossRef]
  14. del Río, J.M.L.; Guimarey, M.J.; Comunas, M.J.; Lopez, E.R.; Amigo, A.; Fernandez, J. Thermophysical and tribological properties of dispersions based on graphene and a trimethylolpropane trioleate oil. J. Mol. Liq. 2018, 268, 854–866. [Google Scholar] [CrossRef]
  15. Zulkifli, N.W.M.; Kalam, M.A.; Masjuki, H.H.; Shahabuddin, M.; Yunus, R. Wear prevention characteristics of a palm oil based TMP (trimethylolpropane) ester as an engine lubricant. Energy 2013, 54, 167–173. [Google Scholar] [CrossRef]
  16. Pranav, P.; Sneha, E.; Rani, S. Vegetable oil-based cutting fluids and its behavioral characteristics in machining processes: A review. Ind. Lubr. Tribol. 2021, 73, 1159–1175. [Google Scholar] [CrossRef]
  17. Kania, D.; Yunus, R.; Omar, R.; Abdul Rashid, S.; Mohamed Jan, B.; Arsanjani, N. Nonionic Polyol Esters as Thinner and Lubricity Enhancer for Synthetic-Based Drilling. Fluids. J. Mol. Liq. 2018, 266, 846–855. [Google Scholar] [CrossRef]
  18. Sales, W.F.; Machado, Á.R.; Bonney, J.; Ezugwu, E.O. Evaluation of cutting fluids using scratch tests and turning process. J. Braz. Soc. Mech. Sci. Eng. 2007, 29, 372–378. [Google Scholar] [CrossRef]
  19. Hoang, T.-D.; Mai, T.-H.; Nguyen, V.-D. Enhancement of Deep Drilling for Stainless Steels by Nano-Lubricant through Twist Drill Bits. Lubricants 2022, 10, 173. [Google Scholar] [CrossRef]
  20. Kania, D.; Yunus, R.; Omar, R.; Abdul Rashid, S.; Mohamed Jan, B.; Aulia, A. Adsorption of Non-ionic Surfactants on Organoclays in Drilling Fluid Investigated by Molecular Descriptors and Monte Carlo Random Walk Simulations. Appl. Surf. Sci. 2021, 538, 148154–148159. [Google Scholar] [CrossRef]
  21. Jhaveri, R.H.; Revathi, A.; Ramana, K.; Raut, R.; Dhanaraj, R.K. A Review on Machine Learning Strategies for Real-World Engineering Applications. Mob. Inf. Syst. 2022, 2022, 1833507. [Google Scholar] [CrossRef]
  22. Ben Ishak, A. Variable selection using support vector regression and random forests: A comparative study. Intell. Data Anal. 2016, 20, 83–104. [Google Scholar] [CrossRef]
  23. Rong, S.; Bao-Wen, Z. The research of regression model in machine learning field. In MATEC Web of Conferences; EDP Sciences: Ulis, France, 2018; Volume 176, pp. 1–4. [Google Scholar] [CrossRef]
  24. Aggogeri, F.; Pellegrini, N.; Tagliani, F.L. Recent advances on machine learning applications in machining processes. Appl. Sci. 2021, 11, 8764. [Google Scholar] [CrossRef]
  25. Efkolidis, N.; Dinopoulou, V.; Kakoulis, K. Prediction of cutting forces in drilling AL6082-T6 by using artificial neural networks. IOP Conf. Ser. Mater. Sci. Eng. 2020, 916, 012036. [Google Scholar] [CrossRef]
  26. Peng, B.; Bergs, T.; Schraknepper, D.; Klocke, F.; Döbbeler, B. A hybrid approach using machine learning to predict the cutting forces under consideration of the tool wear. Procedia CIRP 2019, 82, 302–307. [Google Scholar] [CrossRef]
  27. Kyratsis, P.; Markopoulos, A.P.; Efkolidis, N.; Maliagkas, V.; Kakoulis, K. Prediction of Thrust Force and Cutting Torque in Drilling Based on the Response Surface Methodology. Machines 2018, 6, 24. [Google Scholar] [CrossRef]
  28. Kyratsis, P.; Garcia-Hernandez, C.; Vakondios, D.; Antoniadis, A. Thrust force and torque mathematical models in drilling of Al7075 using the responce surface methodology. In Book Design of Experiments in Production Engineering; Davim, J.P., Ed.; Springer: Berlin/Heidelberg, Germany, 2016; pp. 151–164. [Google Scholar] [CrossRef]
  29. Kumar, V.; Dubey, V.; Sharma, A.K. Comparative analysis of different machine learning algorithms in prediction of cutting force using hybrid nanofluid enriched cutting fluid in turning operation. Mater. Today Proc. 2023, 302–307. [Google Scholar] [CrossRef]
  30. Agarwal, R.; Gupta, V.; Singh, J.; Jain, V. Prediction of surface roughness and cutting force induced during rotary ultrasonic bone drilling via statistical and machine learning algorithms. Proc. Inst. Mech. Eng. Part C J. Mech. Eng. Sci. 2022, 236, 11123–11135. [Google Scholar] [CrossRef]
  31. Rodríguez-Pérez, R.; Bajorath, J. Evolution of Support Vector Machine and Regression Modeling in Chemoinformatics and Drug Discovery. J. Comput.-Aided Mol. Des. 2022, 36, 355–362. [Google Scholar] [CrossRef]
  32. Owuna, F.J.; Dabai, M.U.; Sokoto, M.A.; Dangoggo, S.M.; Bagudo, B.U.; Birnin-Yauri, U.A.; Hassan, L.G.; Sada, I.; Abubakar, A.L.; Jibrin, M.S. Chemical modification of vegetable oils for the production of biolubricants using trimethylolpropane: A review. Egypt. J. Pet. 2019, 29, 75–82. [Google Scholar] [CrossRef]
  33. Khan, M.B.; Zahid, R.; Kazim, A.H.; Javed, K. Synthesis and use of TMP ester biolubricant derived from cottonseed oil in SI engine. Ind. Lubr. Tribol. 2019, 73, 1084–1090. [Google Scholar] [CrossRef]
  34. ASTM D 4172-94; Standard Test Method for Wear Preventive Characteristics of Lubricating Fluid (Four-Ball Method). ASTM International: West Conshohocken, PA, USA, 1999.
  35. ASTM D 2783-88; Standard Test Method for Measurement of Extreme-Pressure Properties of Lubricating Fluids (Four-Ball Method). ASTM International: West Conshohocken, PA, USA, 1998.
  36. Kinaneva, D.; Hristov, G.; Kyuchukov, P.; Georgiev, G.; Zahariev, P.; Daskalov, R. Machine Learning Algorithms for Regression Analysis and Predictions of Numerical Data. In Proceedings of the 3rd International Congress on Human-Computer Interaction, Optimization and Robotic Applications (HORA), Ankara, Turkey, 11–13 June 2021; pp. 1–6. [Google Scholar] [CrossRef]
  37. Wei, Y.; An, Q.; Ming, W.; Chen, M. Effect of drilling parameters and tool geometry on drilling performance in drilling carbon fiber–reinforced plastic/titanium alloy stacks. Adv. Mech. Eng. 2016, 8, 1687814016670281. [Google Scholar] [CrossRef]
Figure 1. FTIR for the TMPTO oil-based bio-lubricant.
Lubricants 11 00356 g001
Figure 2. The workflow used for the research.
Lubricants 11 00356 g002
Figure 3. Representation of random forest construction from a visual point of view.
Lubricants 11 00356 g003
Figure 4. Graphical representation of SVM.
Lubricants 11 00356 g004
Figure 5. Graphical representation of decision tree.
Lubricants 11 00356 g005
Figure 6. Optical images of anti-wear scars at 150× magnification for lube oil A, B, and C.
Lubricants 11 00356 g006
Figure 7. Experimental values derived from wireless Spike tool holder dynamometer at different spindle speeds: (a) 3053 RPM, (b) 4580 RPM and (c) 6107 RPM.
Lubricants 11 00356 g007aLubricants 11 00356 g007b
Figure 8. Representative thrust and torque force measurement under drilling at spindle speed = 4580 RPM, additive concentration = 8% and feed rate f = 0.1 mm/rev.
Lubricants 11 00356 g008
Figure 9. Main effects plot for S/N ratios of thrust force.
Lubricants 11 00356 g009
Figure 10. Main effects plot for S/N ratios of torque force.
Lubricants 11 00356 g010
Figure 11. Proposed scheme for predicting response parameters.
Lubricants 11 00356 g011
Figure 12. Predicted values of thrust force from different machine learning algorithms.
Lubricants 11 00356 g012
Figure 13. Predicted values of torque force from different machine learning algorithms.
Lubricants 11 00356 g013
Table 1. Base oils and additives rheological properties.
Product DesignationLube Oil ALube Oil BLube Oil C
Acid Value (mg KOH/mg)0.120.10.1
Density (15 °C g/cm3)11.0461
Viscosity (40 mm2/s)3004940
Pour Point (°C)−12−40−15
Flash Point (COC, °C)200144164
Table 2. Chemical constituents of Al6061.
ElementsMgCuCrFeSiMnOthersAl
Percentage0.80.10.250.50.90.50.3Others
Table 3. Mechanical properties of Al6061.
AlloyThermal Conductivity
W/m.K
Coefficient of Thermal Expansion K−1Melting Point (°C)
Min Max
Elastic Modulus
GPa
Electricity Resistivity
Ώ.m
Al-606118024 × 10−6555
650
700.038 × 10⁻⁶
Table 4. Experimental results and S/N ratios for thrust and torque force.
RunInput Process ParametersAxial Thrust Force (N)Torque (Nm)
Additive Concentration (%)Spindle Speed (RPM)Feed Rate (mm/rev)Replica 1Replica 2Average Axial Thrust Force (N)S/N RatiosReplica 1Replica 2Average Torque Force (Nm)S/N Ratios
1430530.1321323322−50.160.850.790.821.41
2430530.2353359356−51.030.910.950.930.63
3430530.3611615613−55.751.041.001.02−0.13
4445800.1371367369−51.341.181.241.21−2.70
5445800.2526528527−54.441.411.431.42−3.29
6445800.3720724722−57.171.631.591.61−5.82
7461070.1426422424−52.551.401.421.41−5.06
8461070.2565573569−55.101.651.711.68−5.93
9461070.3750752751−57.511.991.951.97−6.49
10630530.1317311314−49.940.740.780.762.05
11630530.2345341343−50.710.850.870.861.36
12630530.3585579582−55.301.061.021.04−0.30
13645800.1338336337−50.550.840.880.861.31
14645800.2511515513−54.201.081.021.05−0.38
15645800.3709707708−57.001.341.401.37−2.70
16661070.1395401398−52.001.221.281.25−1.90
17661070.2536542539−54.631.471.491.48−3.41
18661070.3711707709−57.011.761.721.74−4.81
19830530.1293287290−49.250.670.690.683.35
20830530.2338334336−50.530.730.790.762.38
21830530.3609607608−55.681.191.171.18−1.44
22845800.1345341343−50.710.950.890.920.72
23845800.2488490489−53.791.121.081.10−0.83
24845800.3689685687−56.741.221.181.20−1.58
25861070.1423421422−52.511.251.351.30−2.28
26861070.2541547544−54.711.401.421.41−2.98
27861070.3703697700−56.901.671.631.65−4.35
Table 5. The S/N ratio table for thrust force.
LevelAdditive Concentration (%)Spindle Speed (RPM)Feed Rate (rev/mm)
1−53.89−52.04−51.00
2−53.48−53.99−53.24
3−53.42−54.77−56.56
Delta0.472.735.56
Rank321
Table 6. ANOVA table for thrust force.
SourceDFAdj SSAdj MSF-Valuep-Value% Contribution
Concentration (%)236,89818,44921.960.0086.28
Spindle Speed (RPM)298,85449,42758.840.00016.82
Feed Rate (rev/mm)2432,240216,120257.290.00073.52
Error2019,895840 3.38
Total26587,889 100
Table 7. The S/N ratio table for torque.
LevelAdditive Concentration (%)Spindle Speed (RPM)Feed Rate (rev/mm)
1−2.231.090.07
2−0.96−1.37−1.21
3−0.78−3.68−2.83
Delta1.454.782.90
Rank312
Table 8. ANOVA table for torque.
SourceDFAdj SSAdj MSF-Valuep-Value% Contribution
Concentration (%)20.23320.11660413.910.0007.74
Spindle Speed (RPM)21.89870.949337113.240.00062.99
Feed Rate (rev/mm)20.71490.3574742.640.00023.72
Error200.16770.008384 5.56
Total263.0145 100
Table 9. Predicted values of thrust force from different machine learning algorithms.
Exp. No.Test No.Exp. ValueLinear RegressionRandom ForestDecision TreeSVM
81569580560570575
162398408415396390
183709700718709720
204336344348337325
265544555569542551
Table 10. Performance metrics for thrust force.
Models/Performance MetricsTest Data ResultTraining Data Result
R-SquaredMSEMAER-SquaredMSEMAE
Random Forest0.92152727.2990.98383.213.588
Linear Reg.0.94120531.8580.93155231.159
SVM0.950.05670.1720.980.01590.107
Decision Tree0.98580.50.0001.0022.1660.000
Table 11. Predicted values of torque from different machine learning algorithms.
Exp. No.Test No.Exp. ValueLinear RegressionRandom ForestDecision TreeSVM
311.021.061.081.091.04
1421.051.081.141.161.05
1731.481.521.561.571.51
1841.741.721.891.821.76
2351.11.081.171.191.13
Table 12. Performance metrics for torque.
Models/Performance MetricsTest Data ResultTraining Data Result
R-SquaredMSEMAER-SquaredMSEMAE
Random Forest0.880.00540.04800.940.00710.0632
Linear Reg.0.920.01070.08170.930.00770.0711
SVM0.930.08340.21370.960.04120.1631
Decision Tree0.890.01520.10331.000.00000.000
Disclaimer/Publisher’s Note: The statements, opinions and data contained in all publications are solely those of the individual author(s) and contributor(s) and not of MDPI and/or the editor(s). MDPI and/or the editor(s) disclaim responsibility for any injury to people or property resulting from any ideas, methods, instructions or products referred to in the content.

