Friction and Wear in Stages of Galling for Sheet Metal Forming Applications


Abstract
:1. Introduction
2. Materials and Methods
2.1. Materials
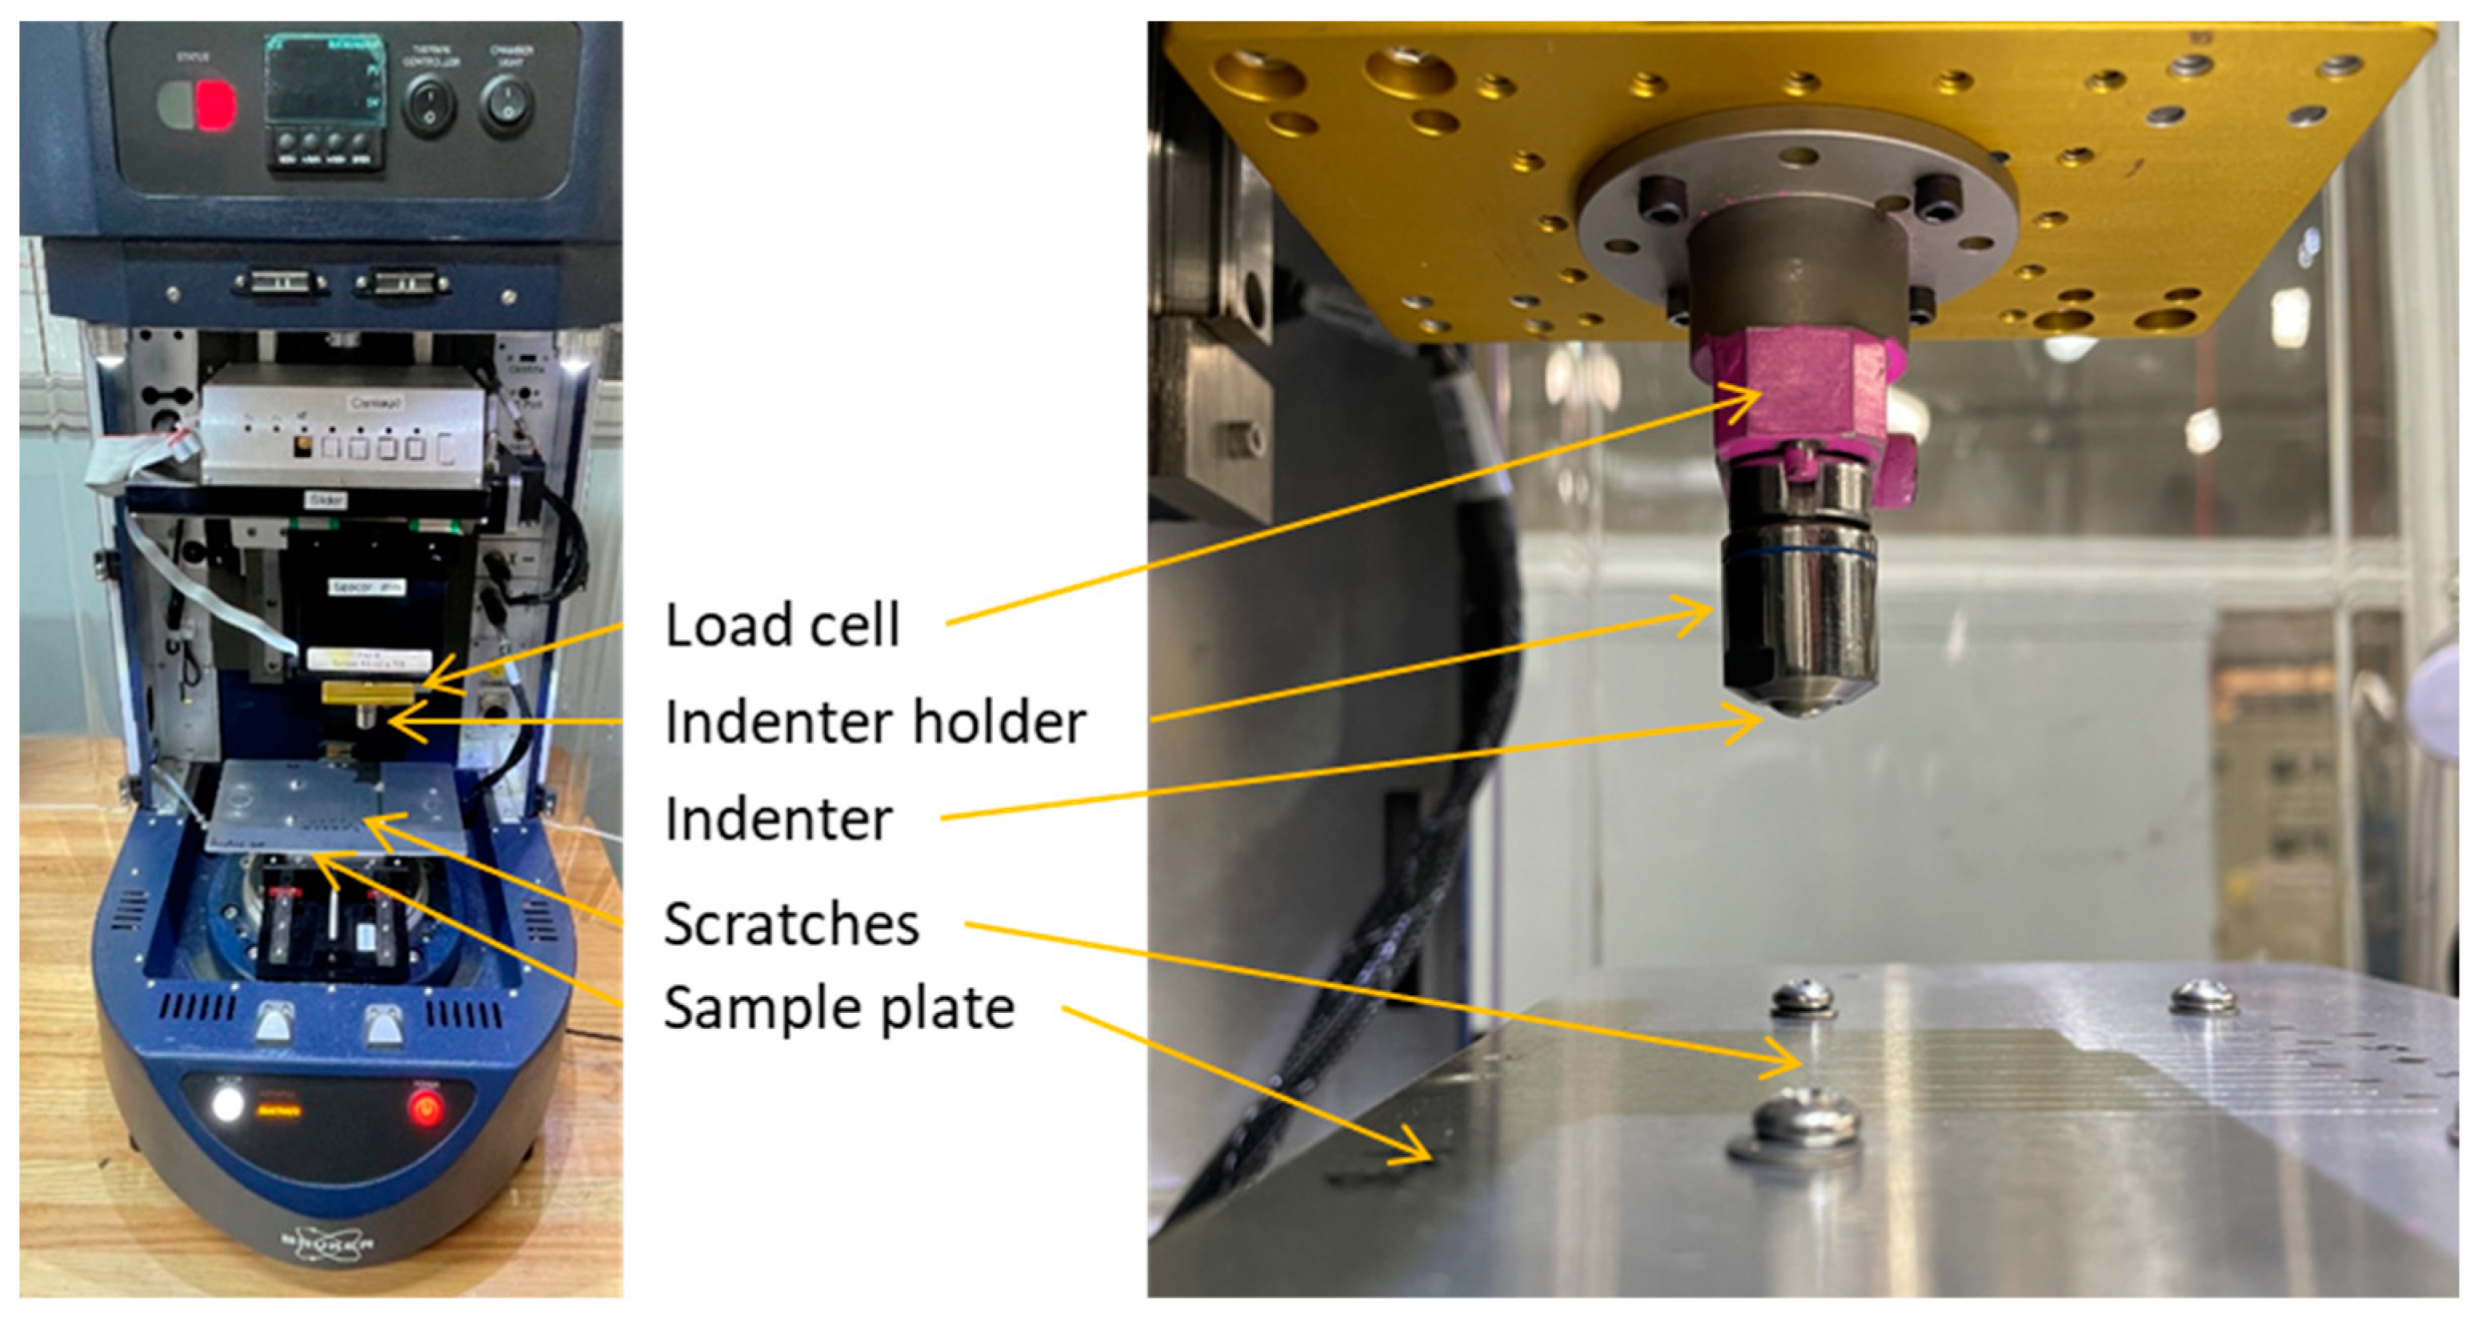
2.2. Test Setup
2.3. Data Processing
2.4. Test Conditions
3. Results
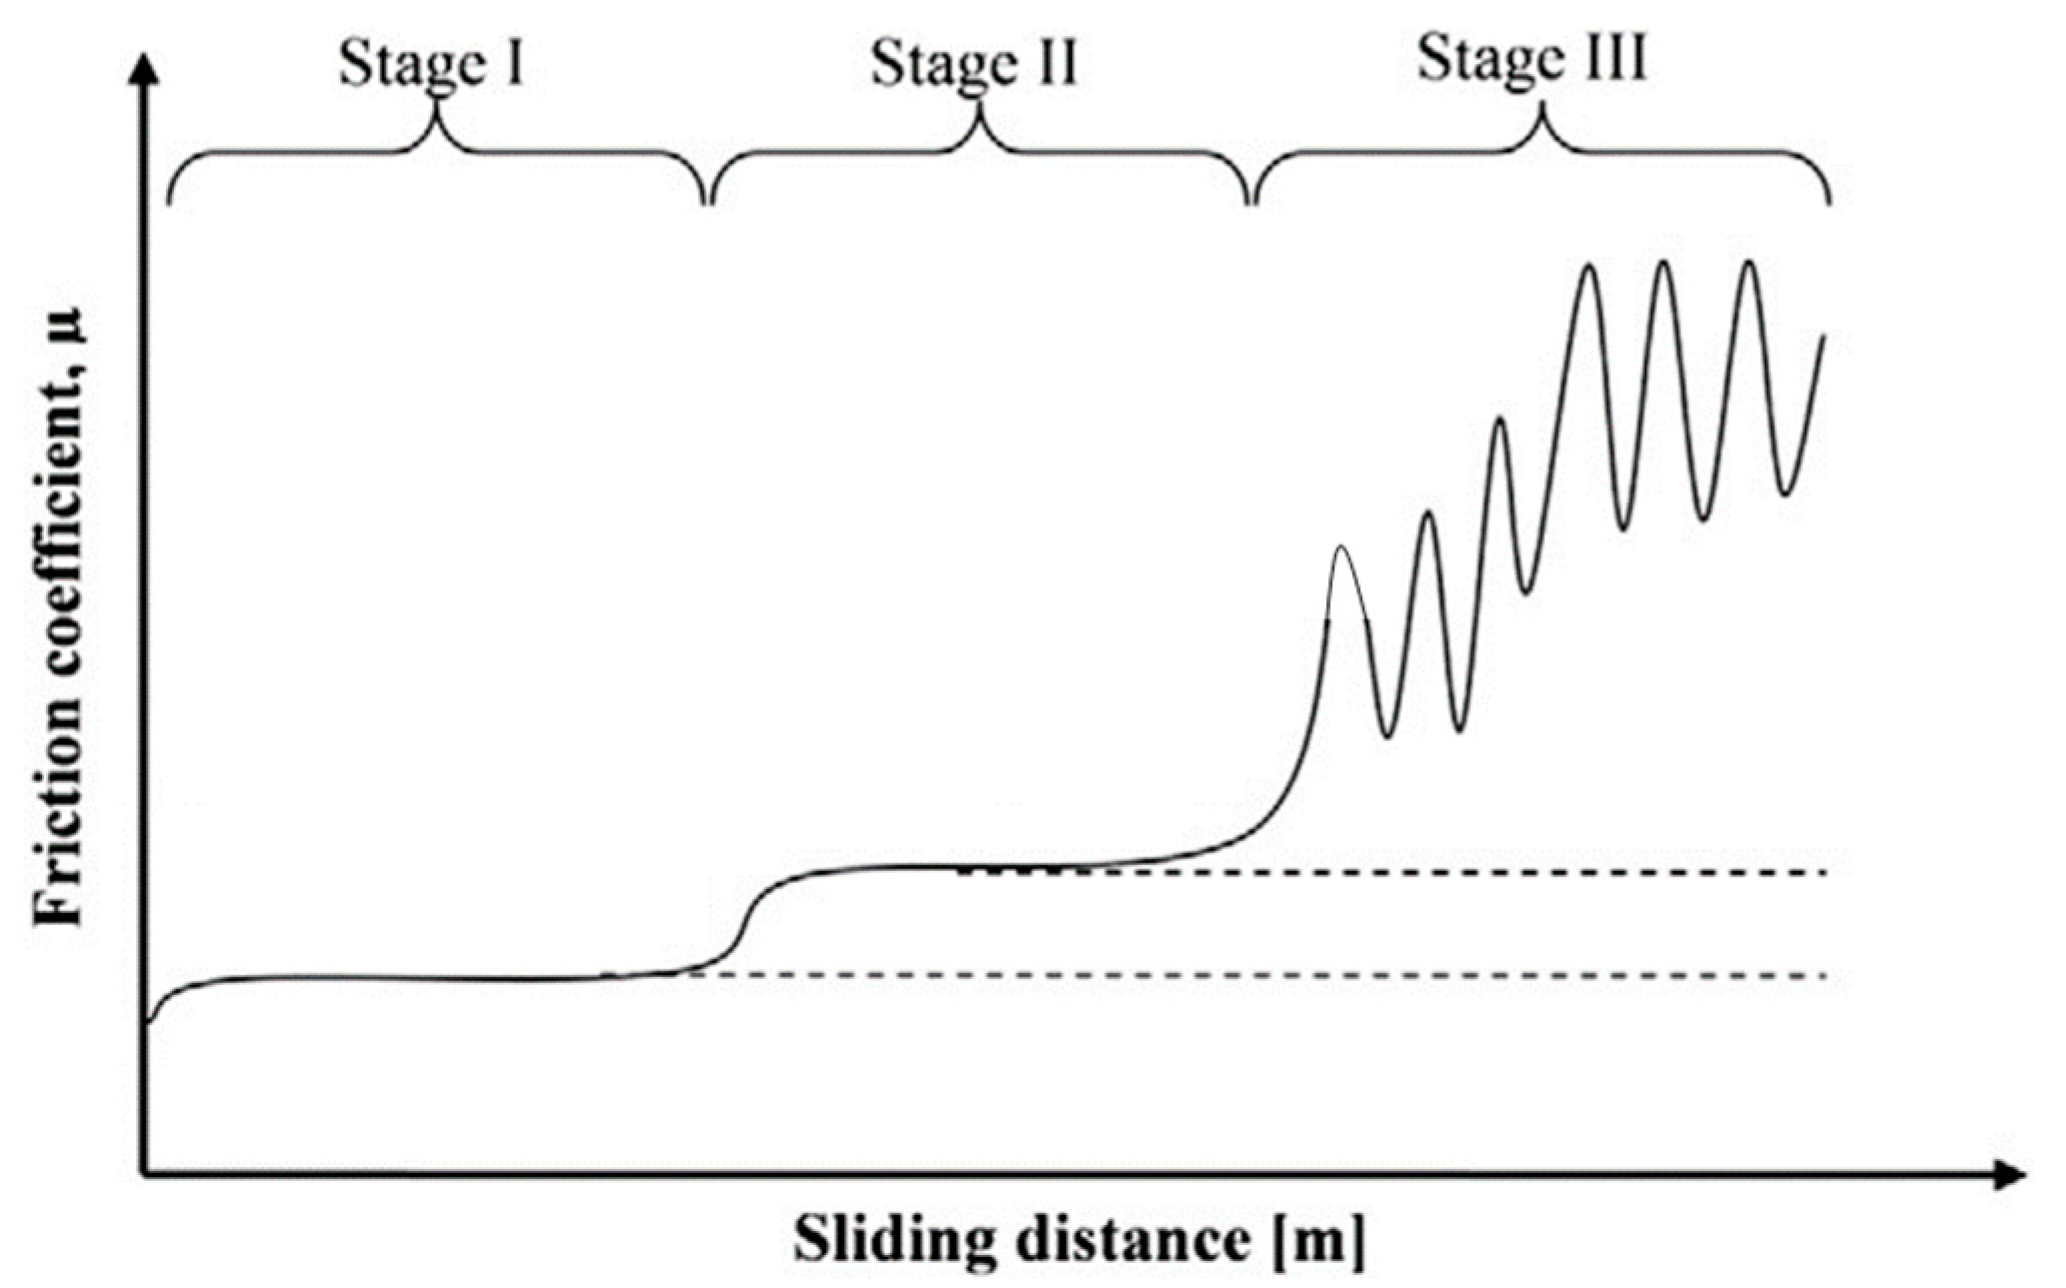
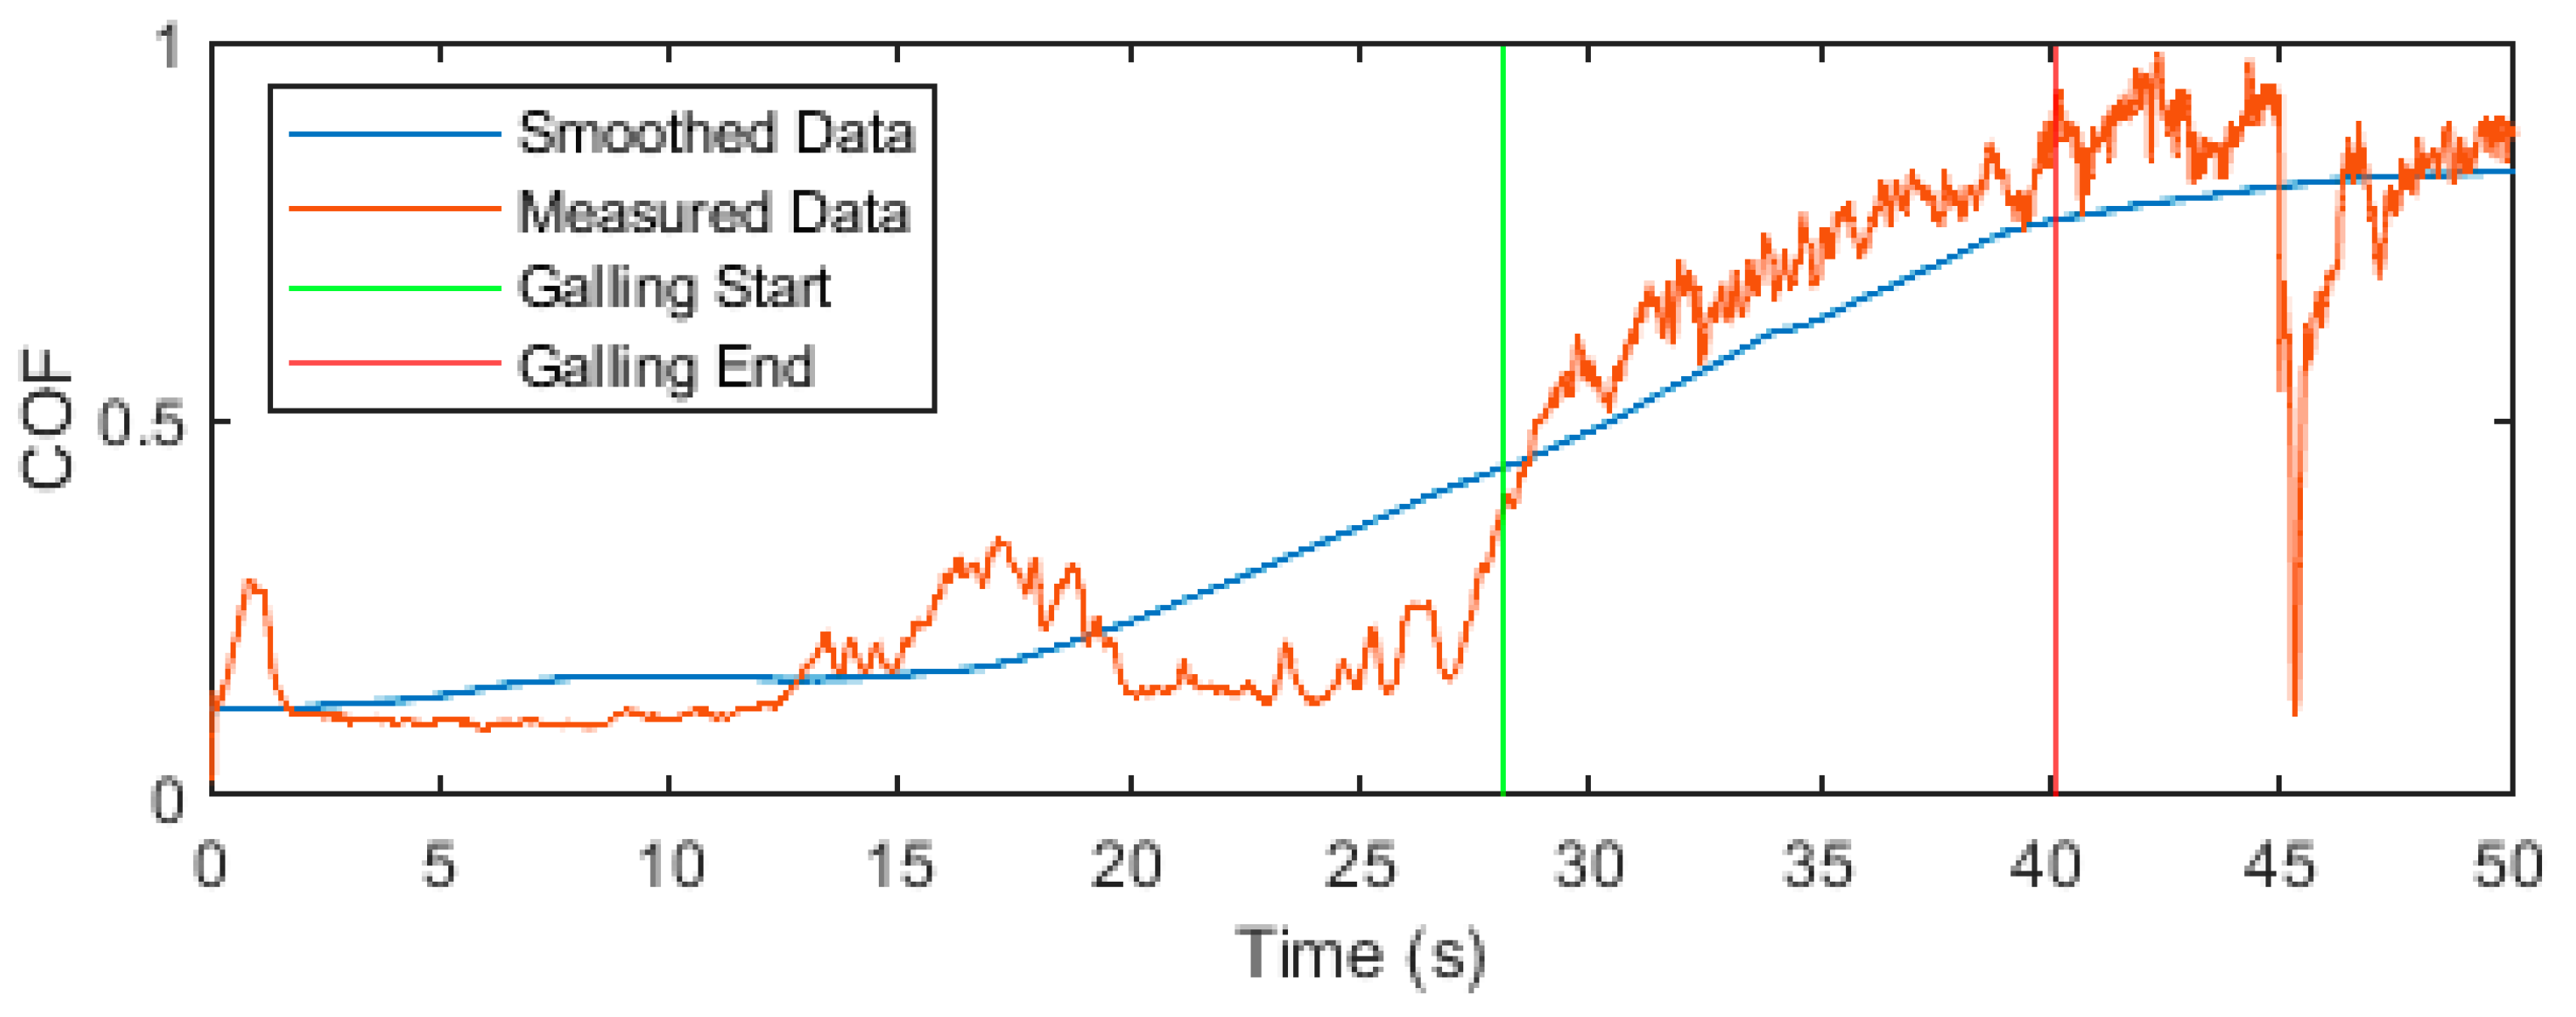
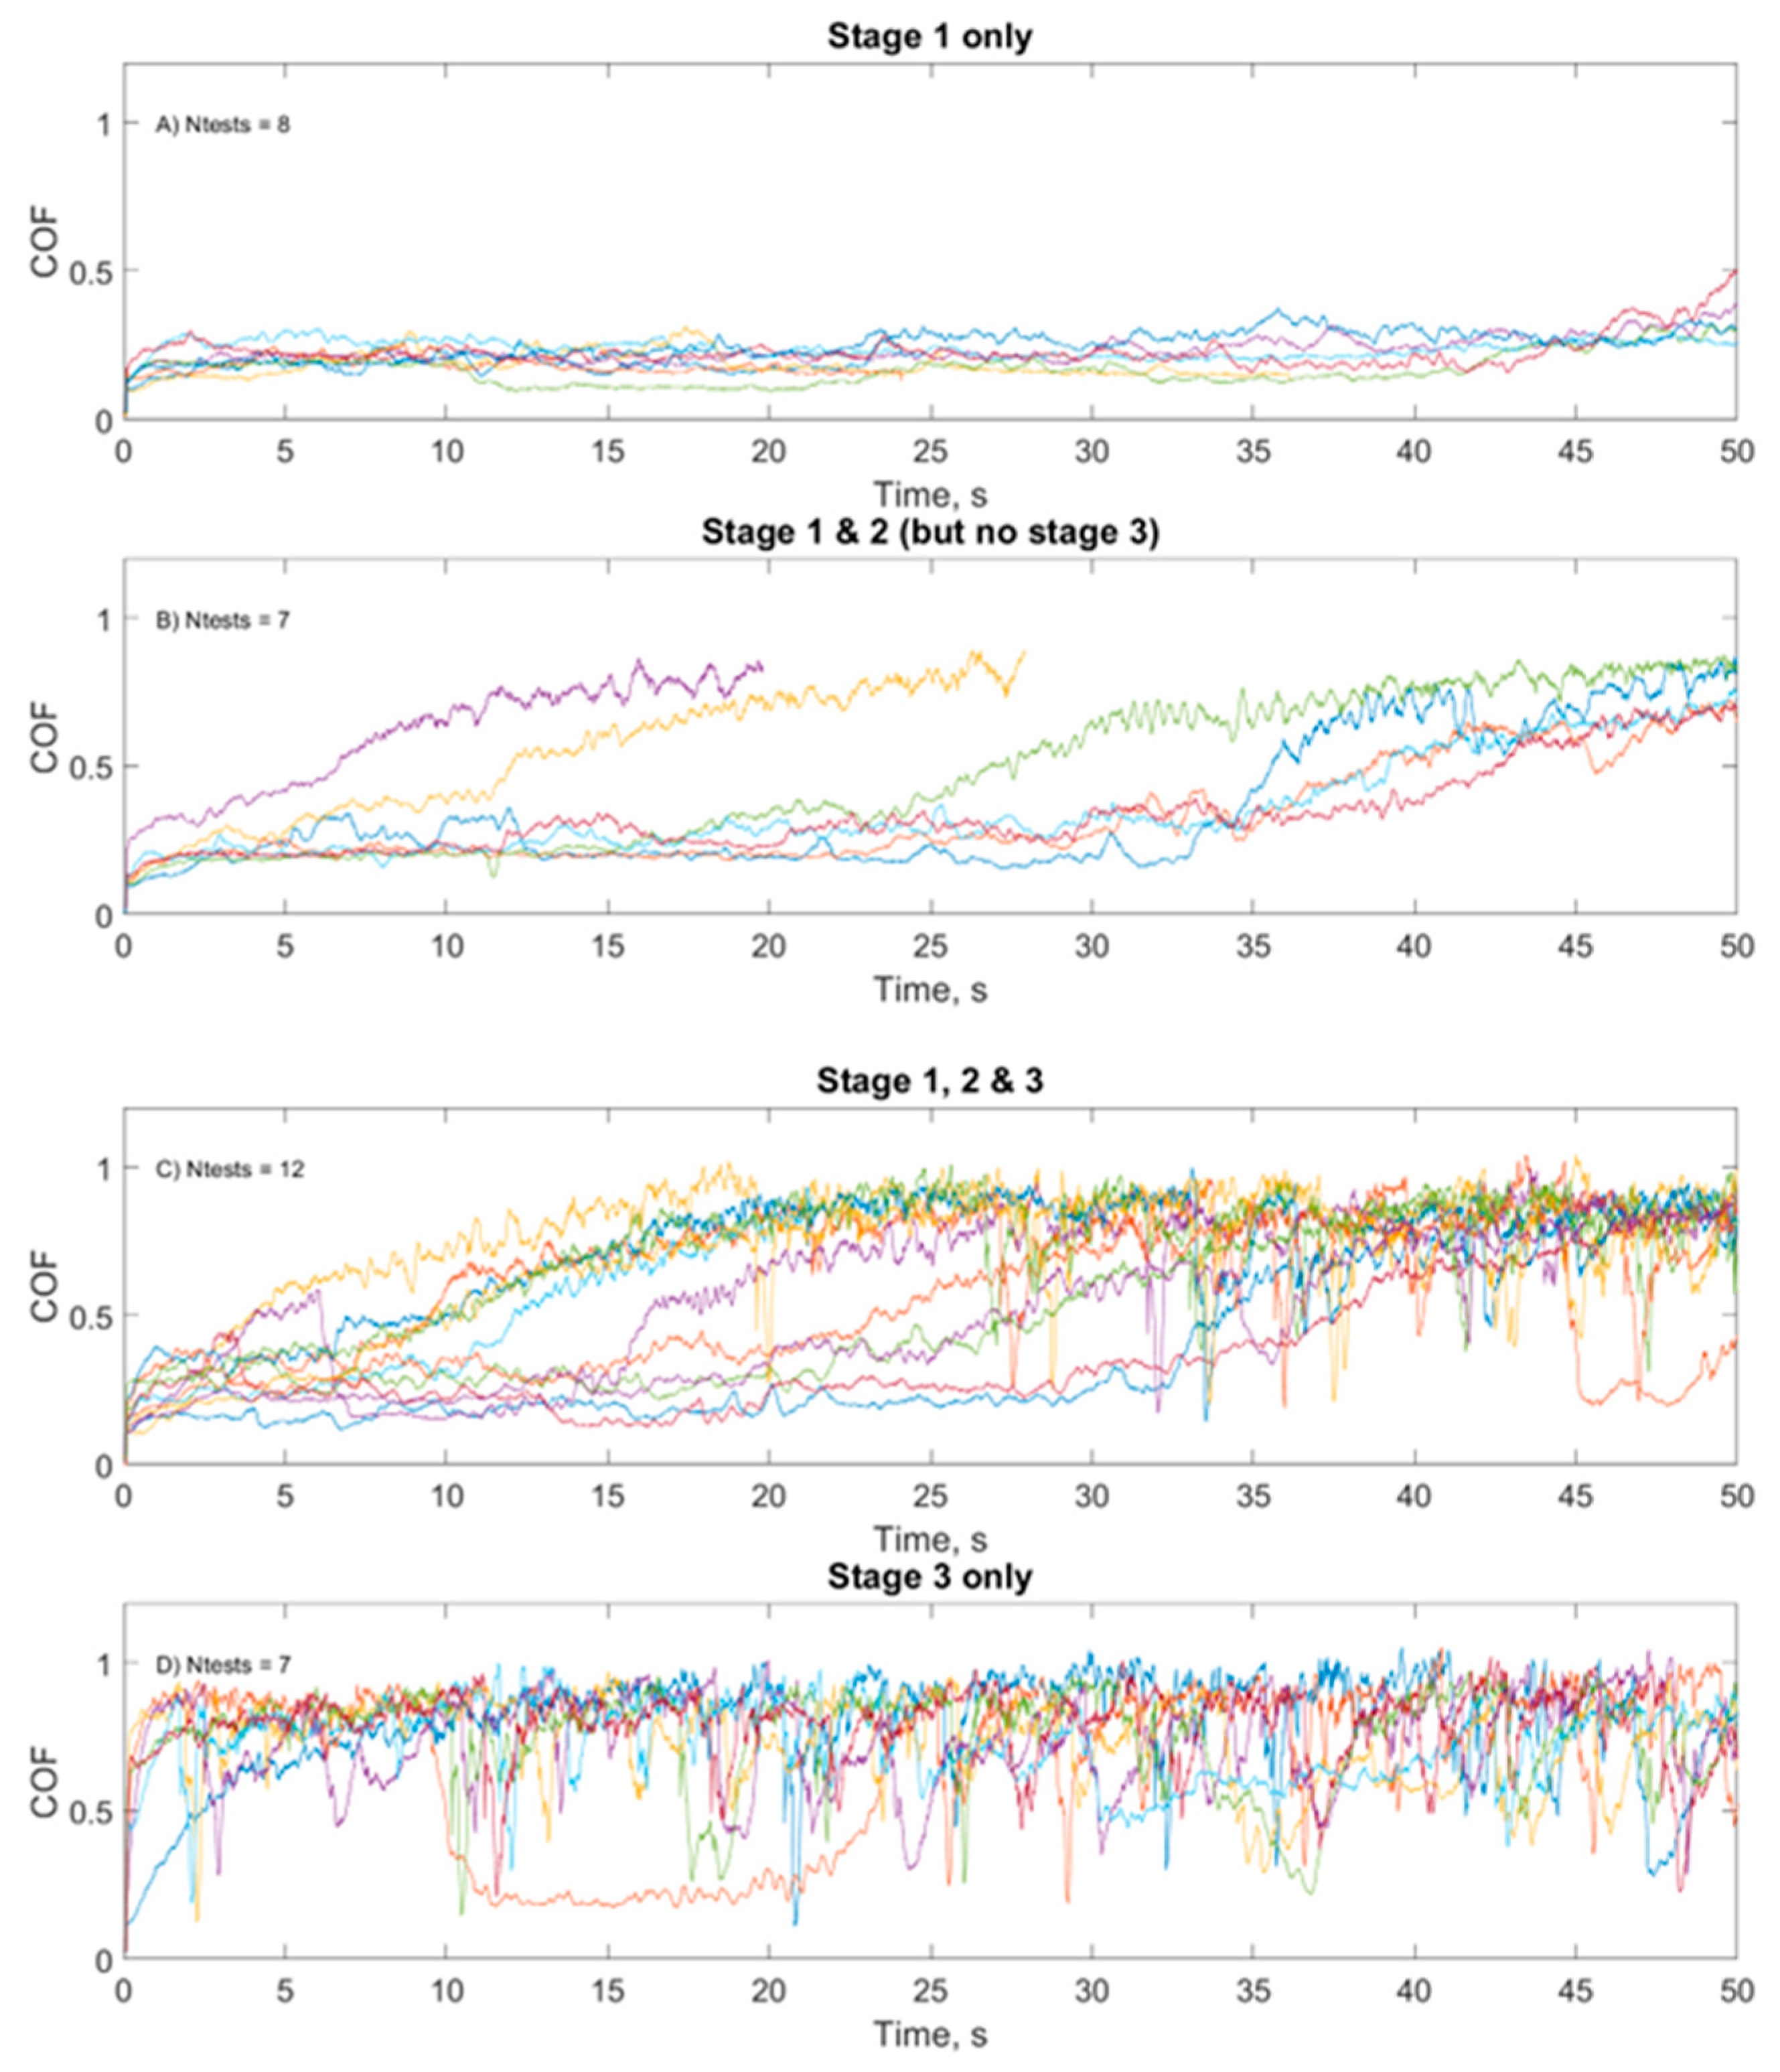
3.1. Friction
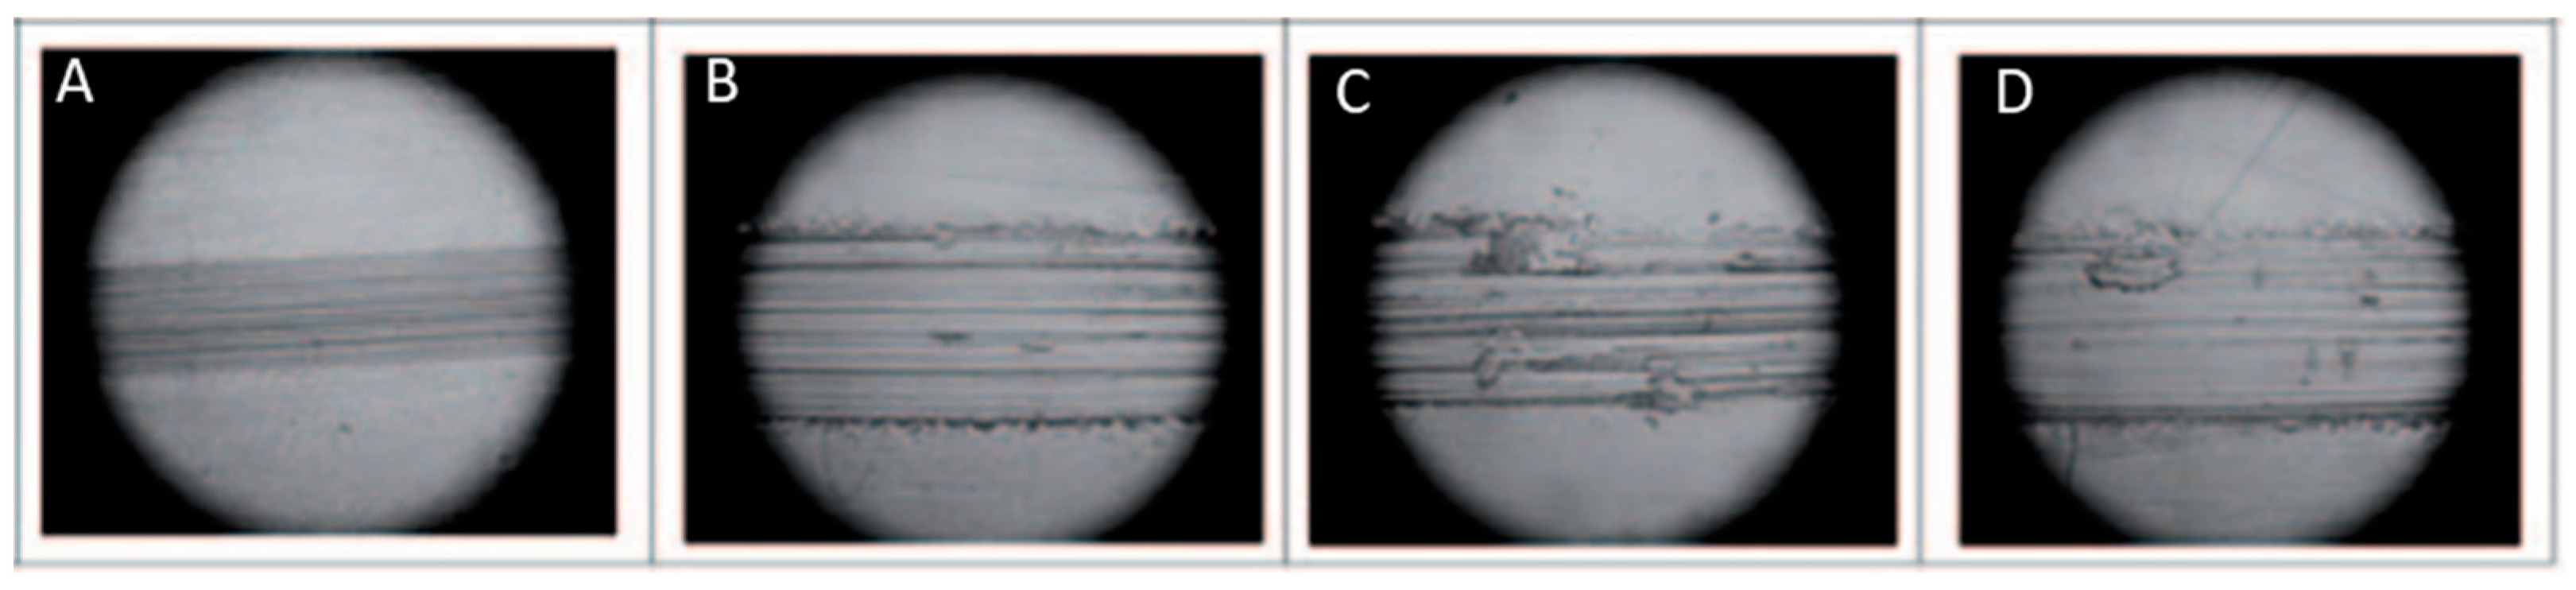
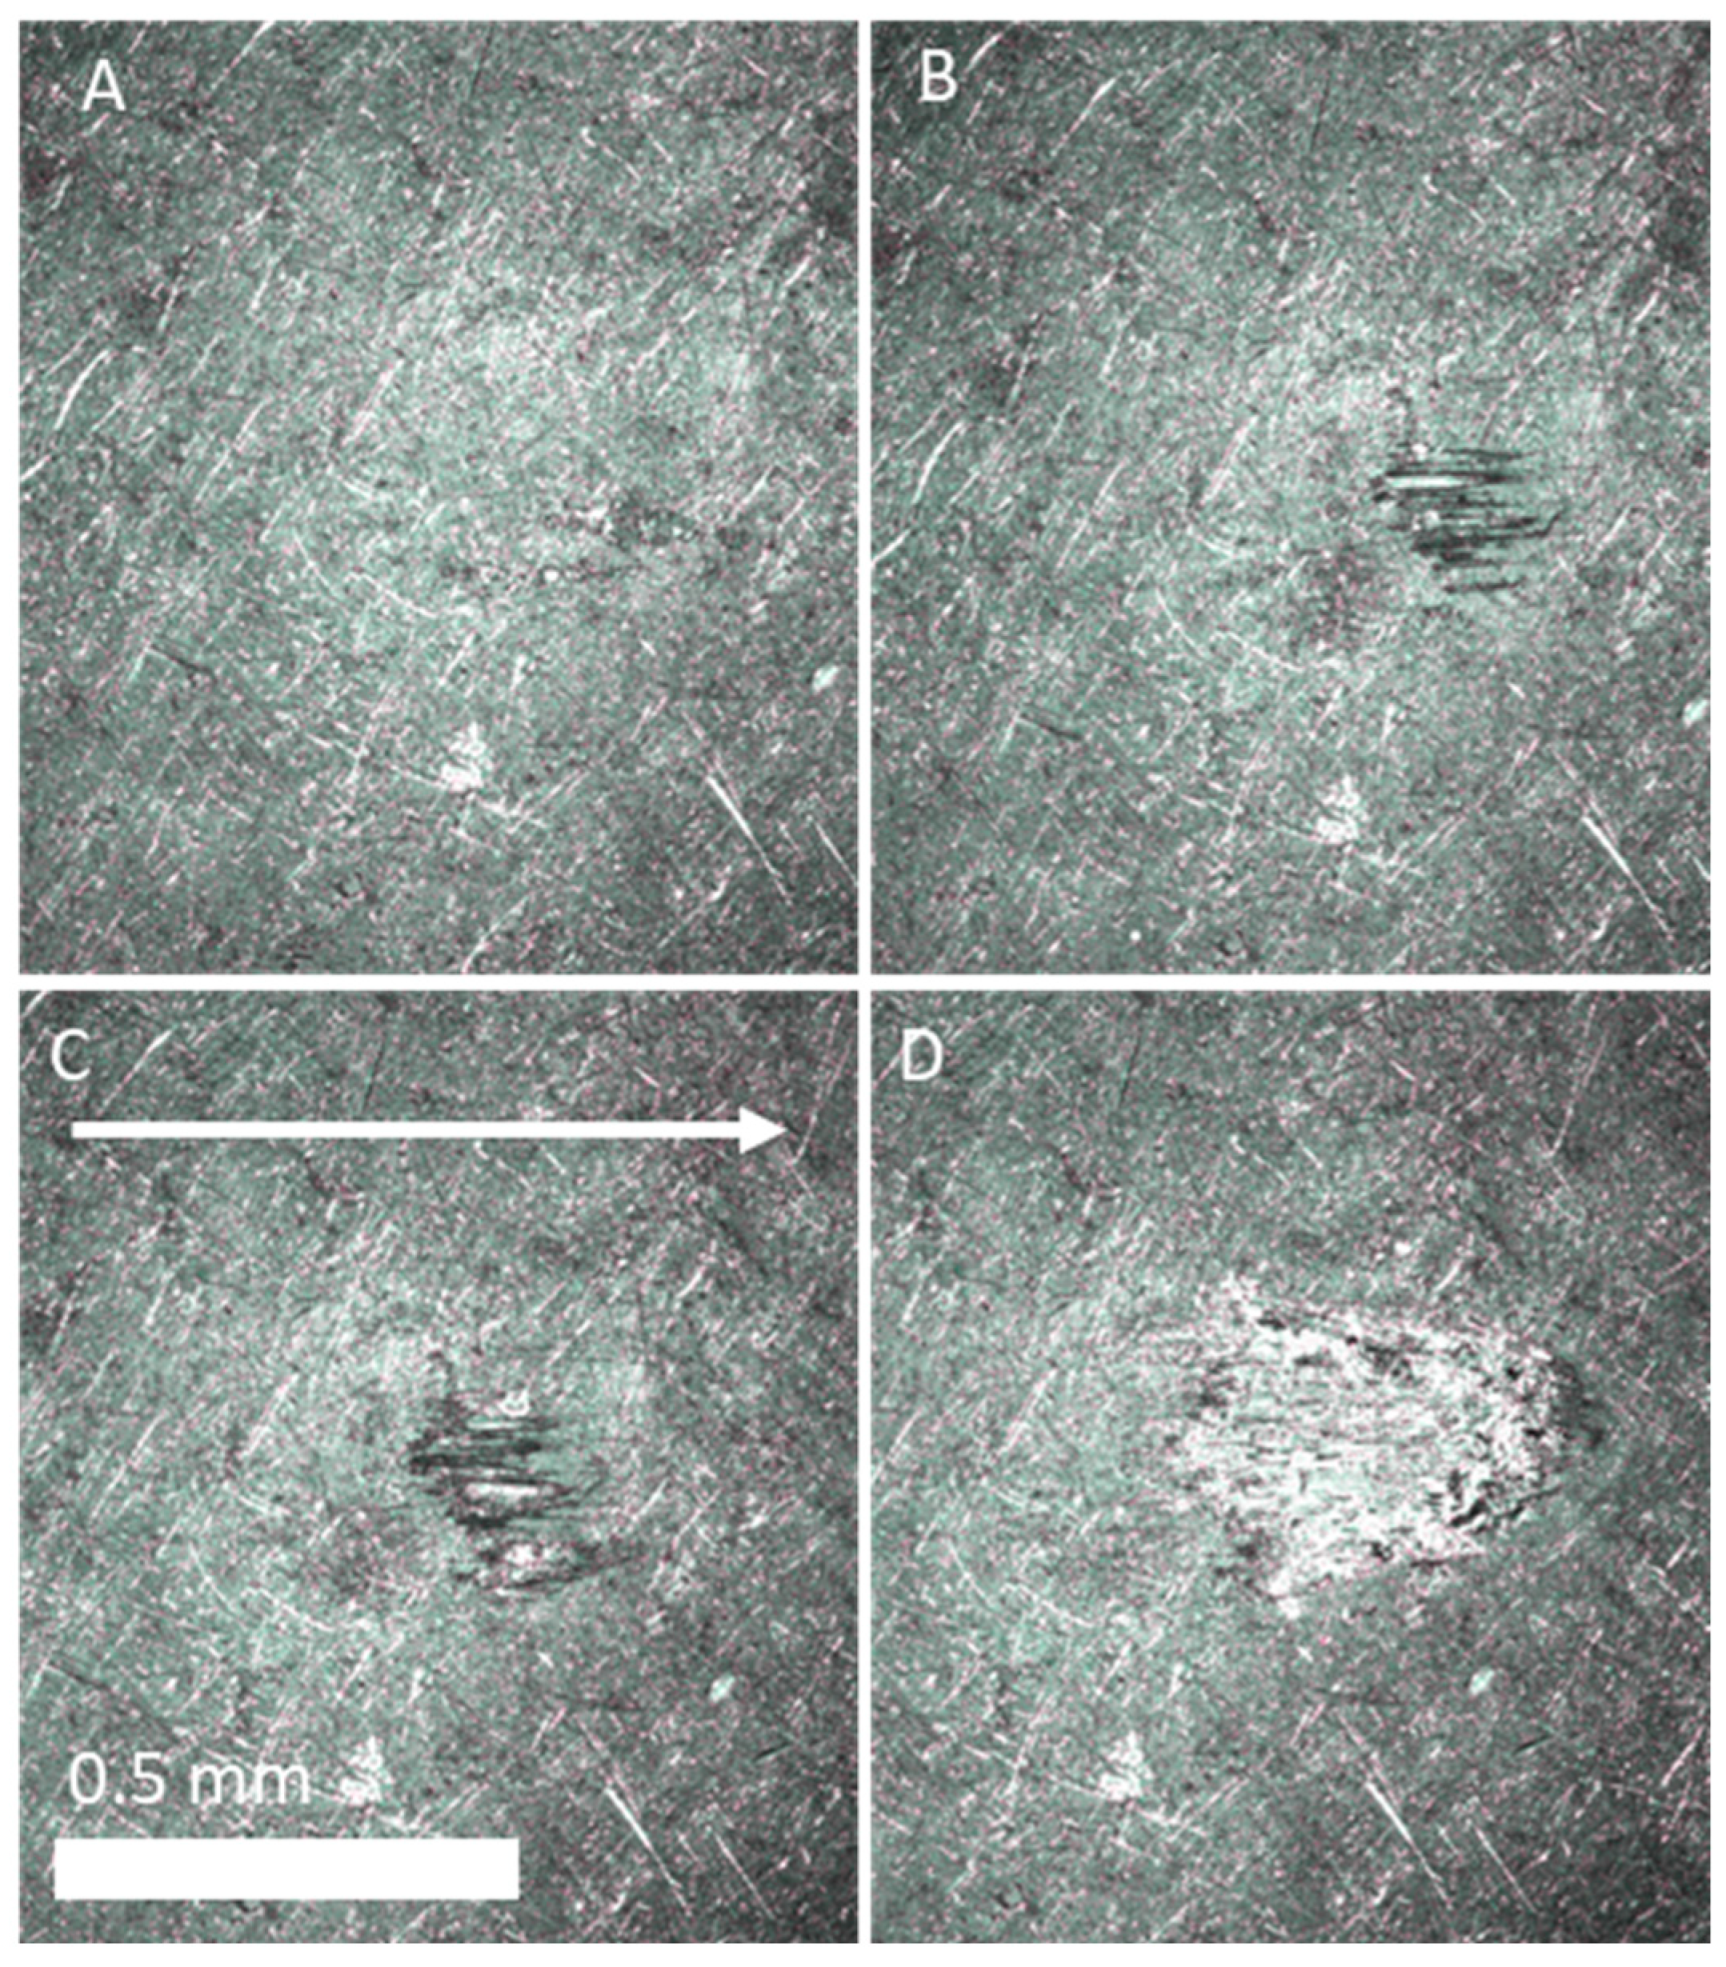
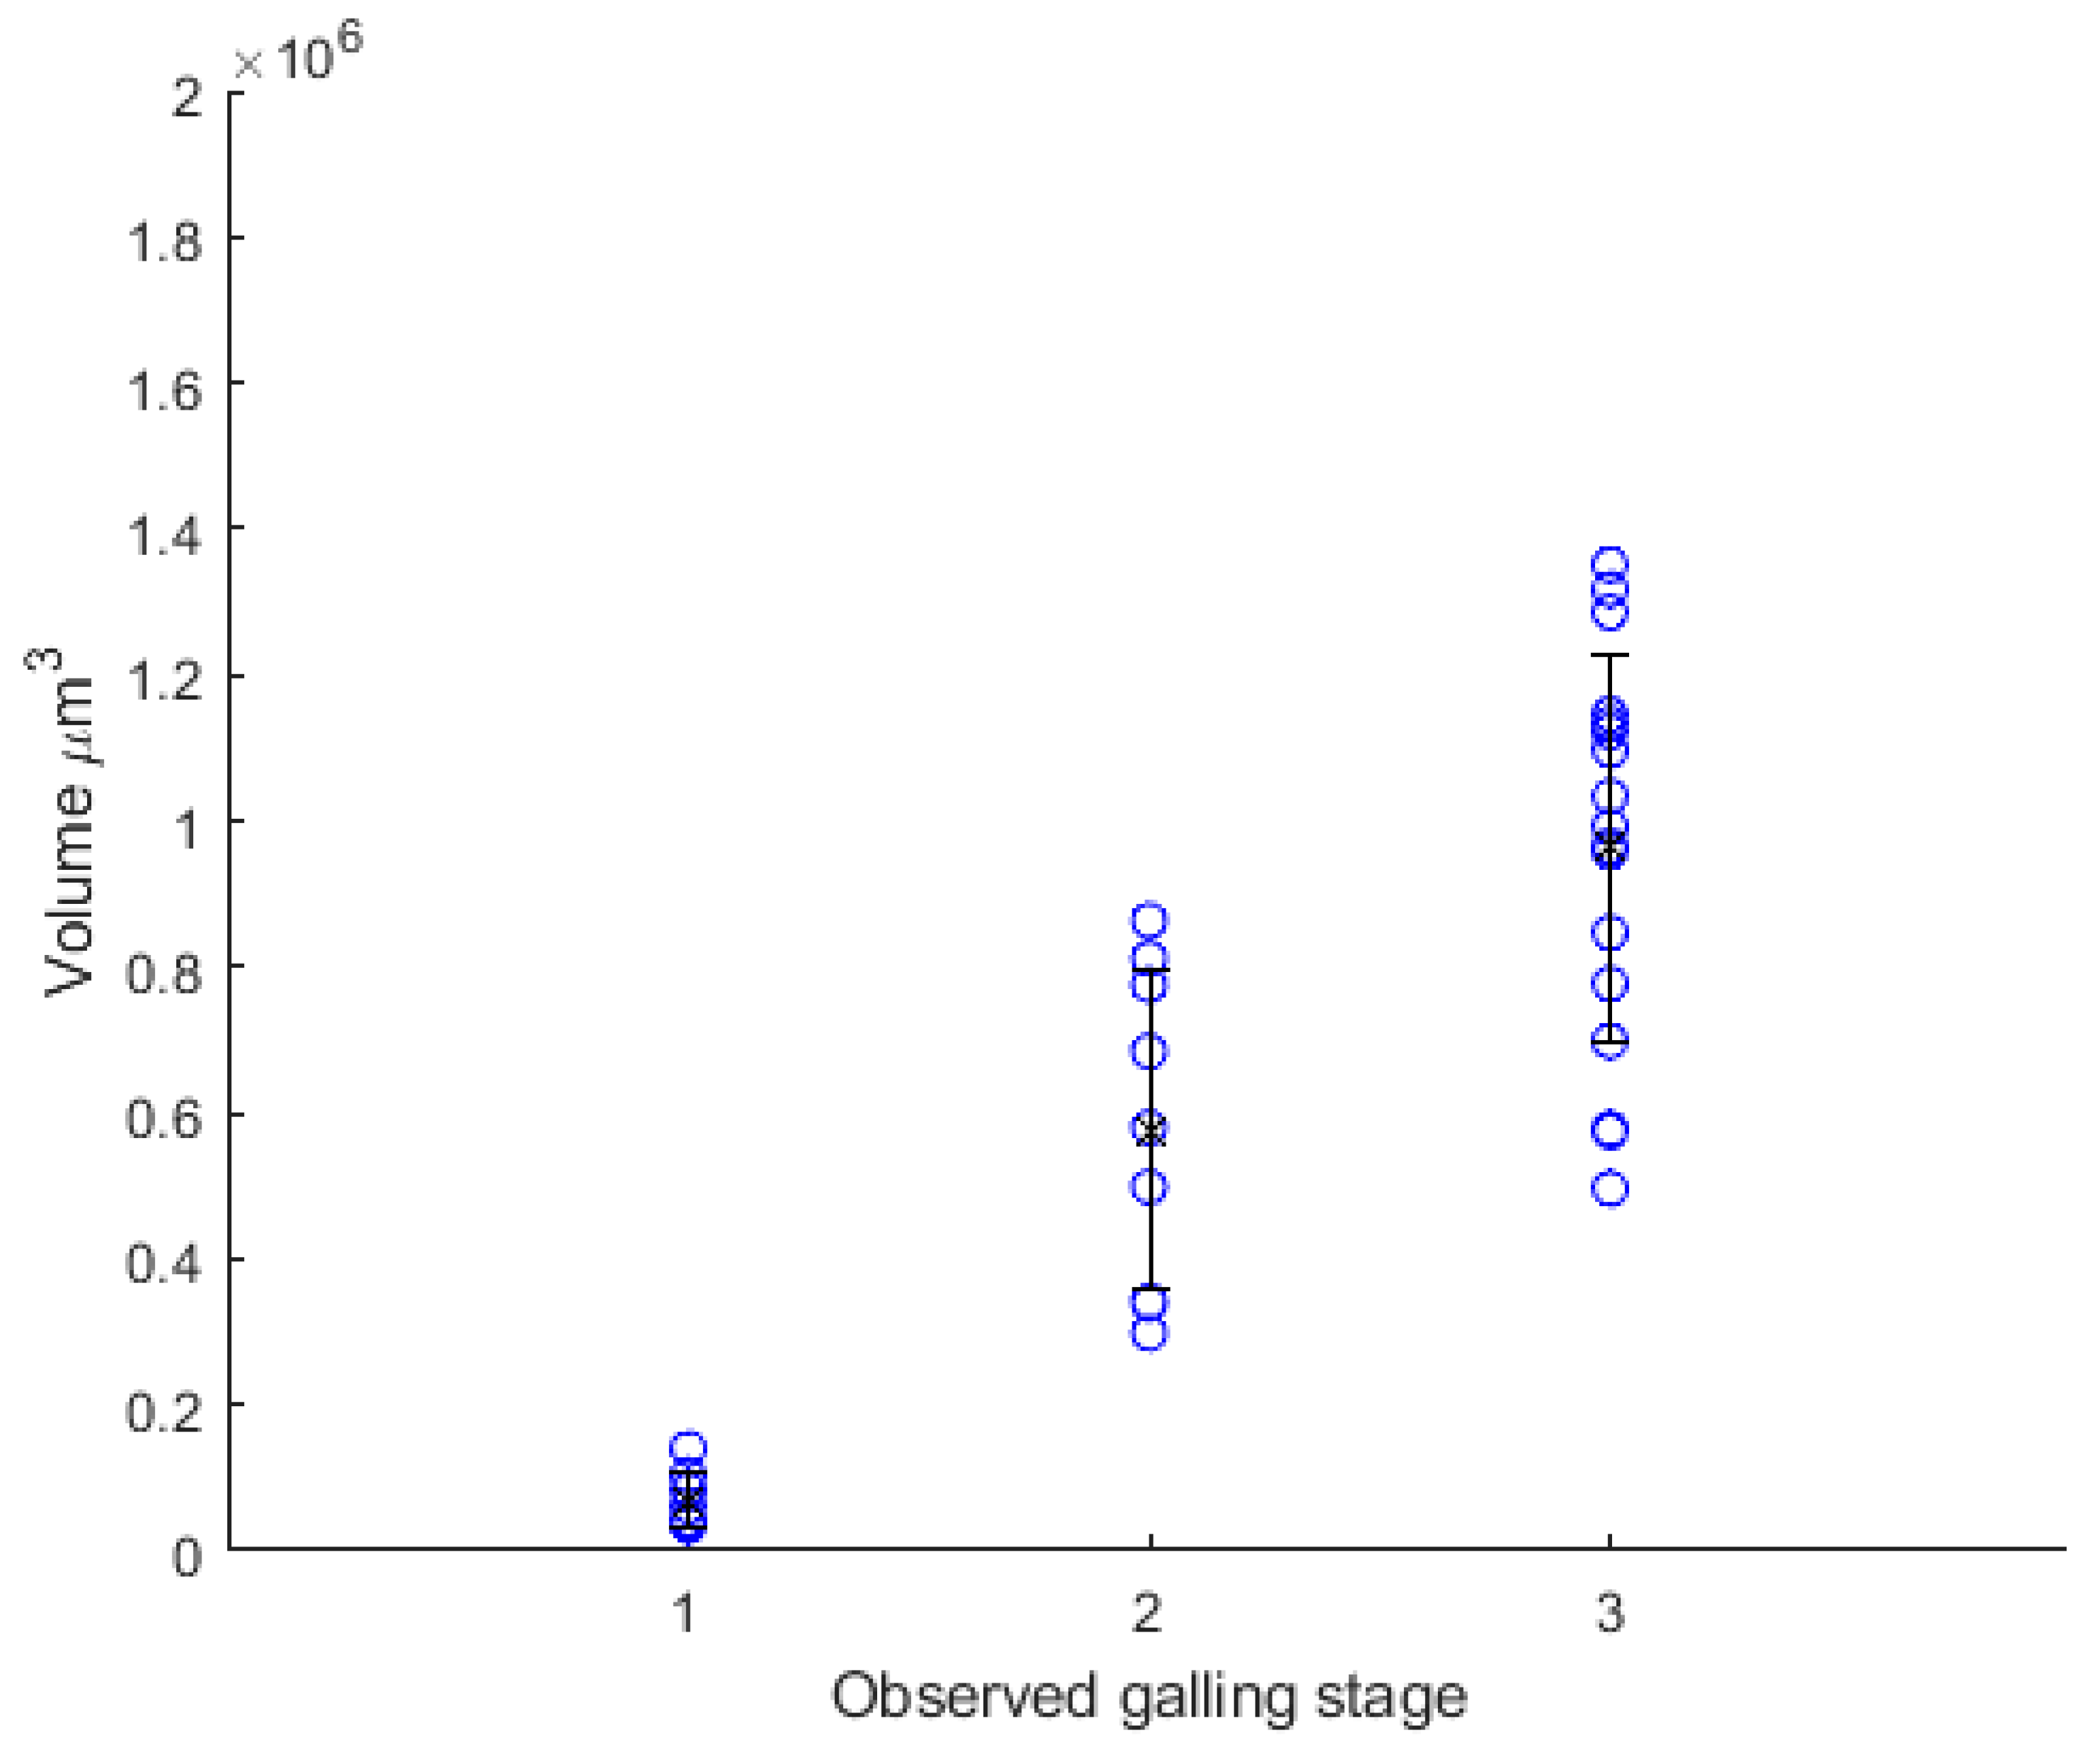
3.2. Lump Growth on the Tool
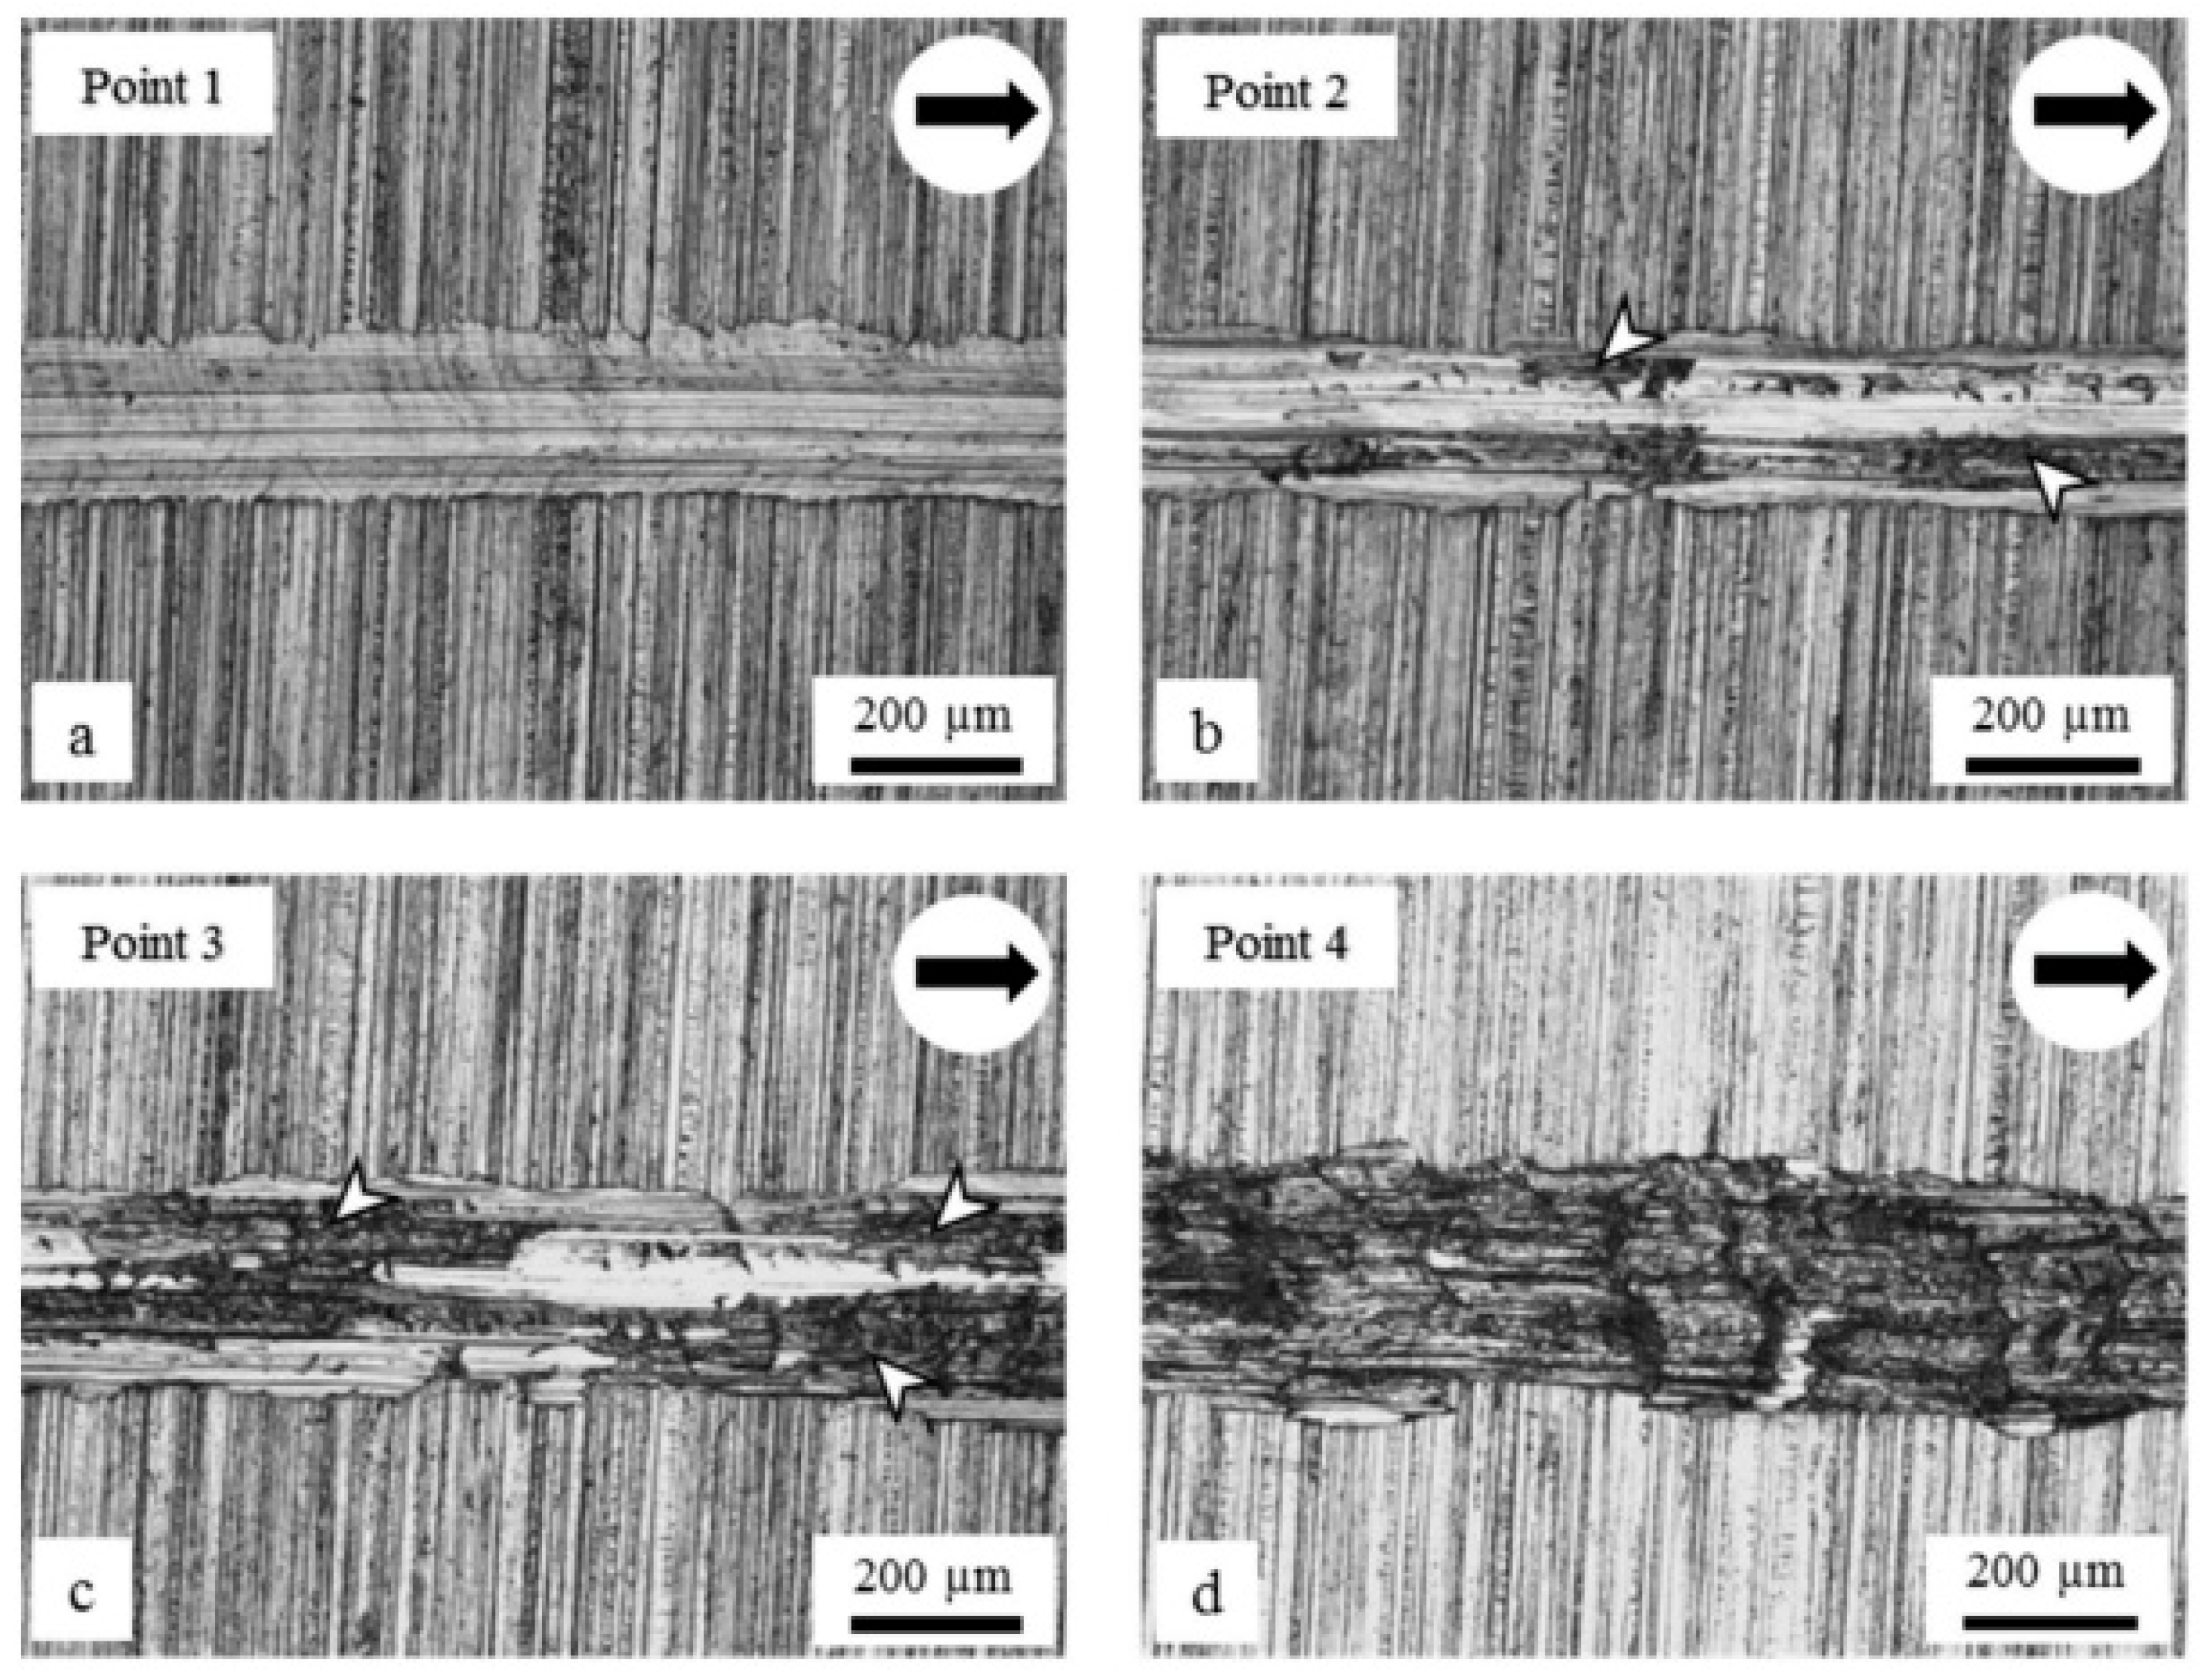
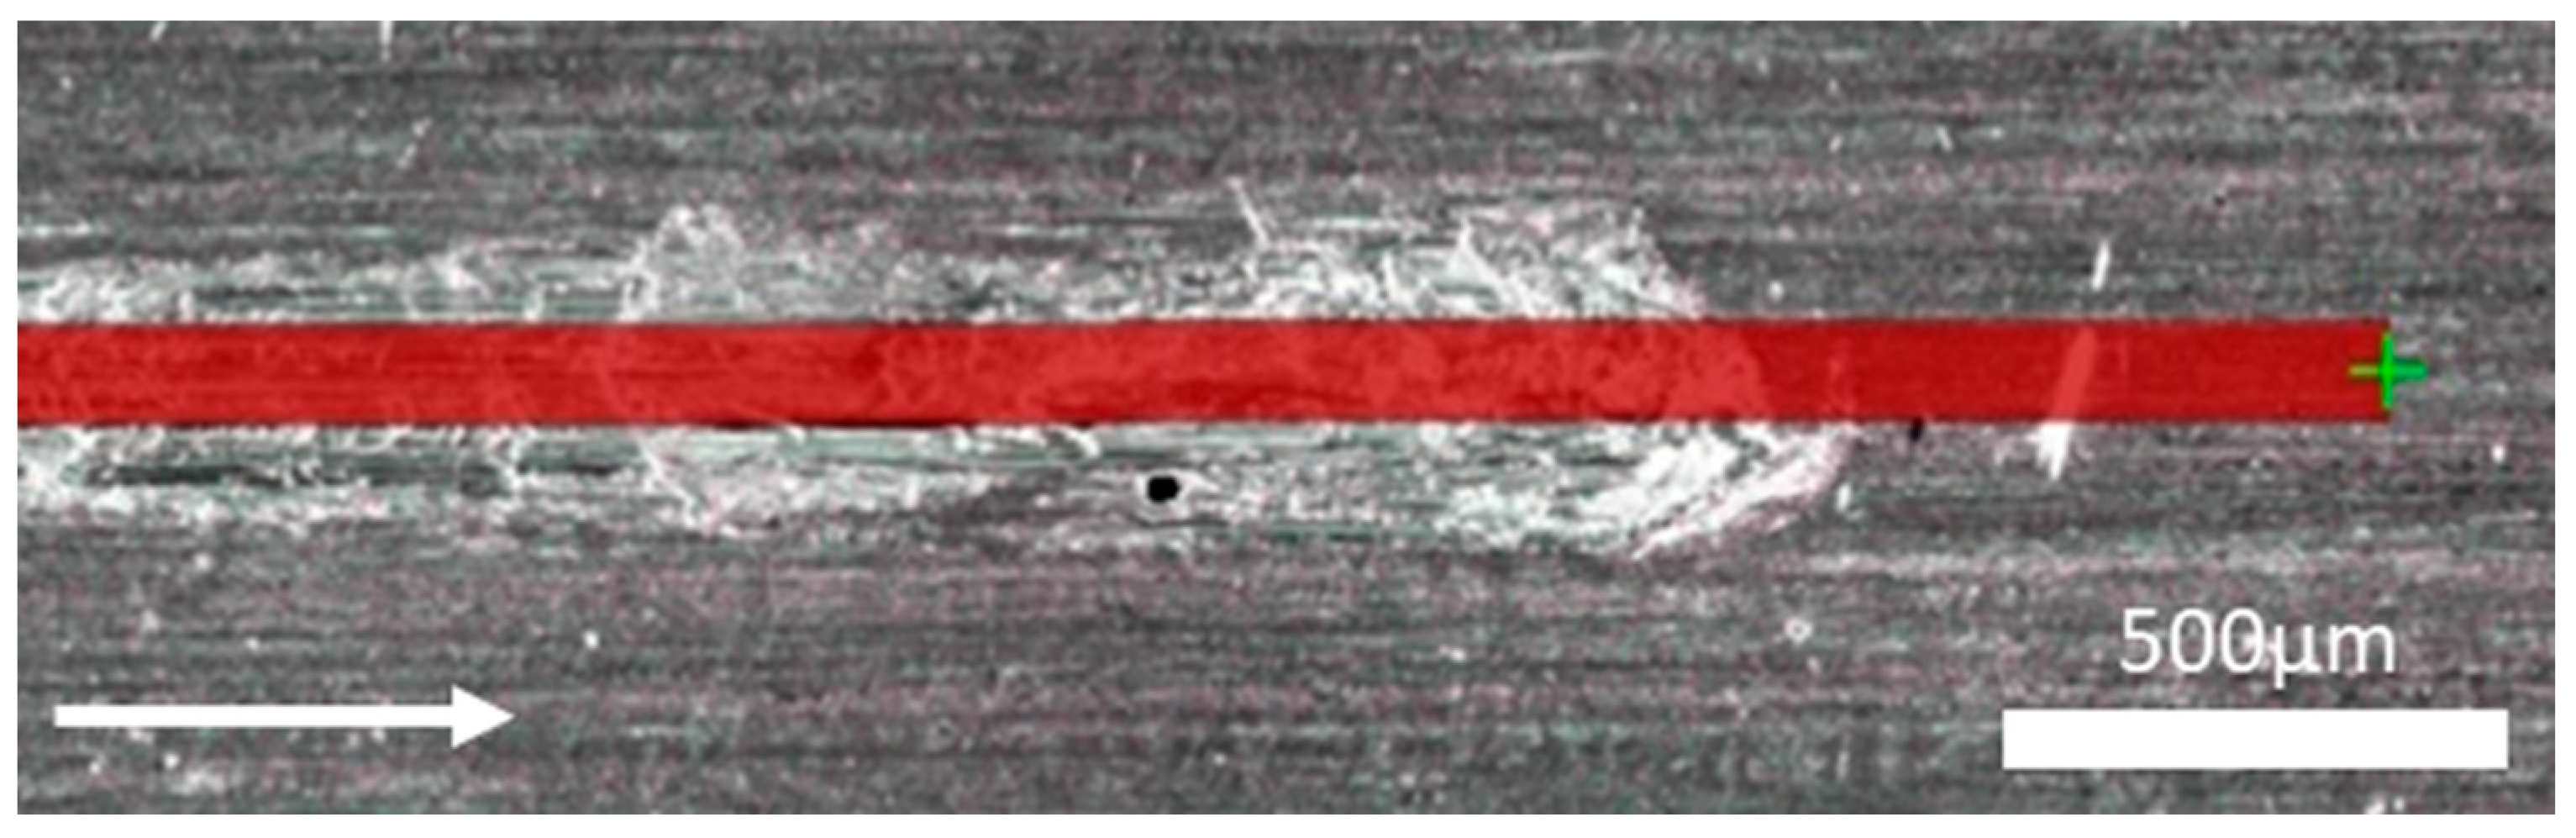
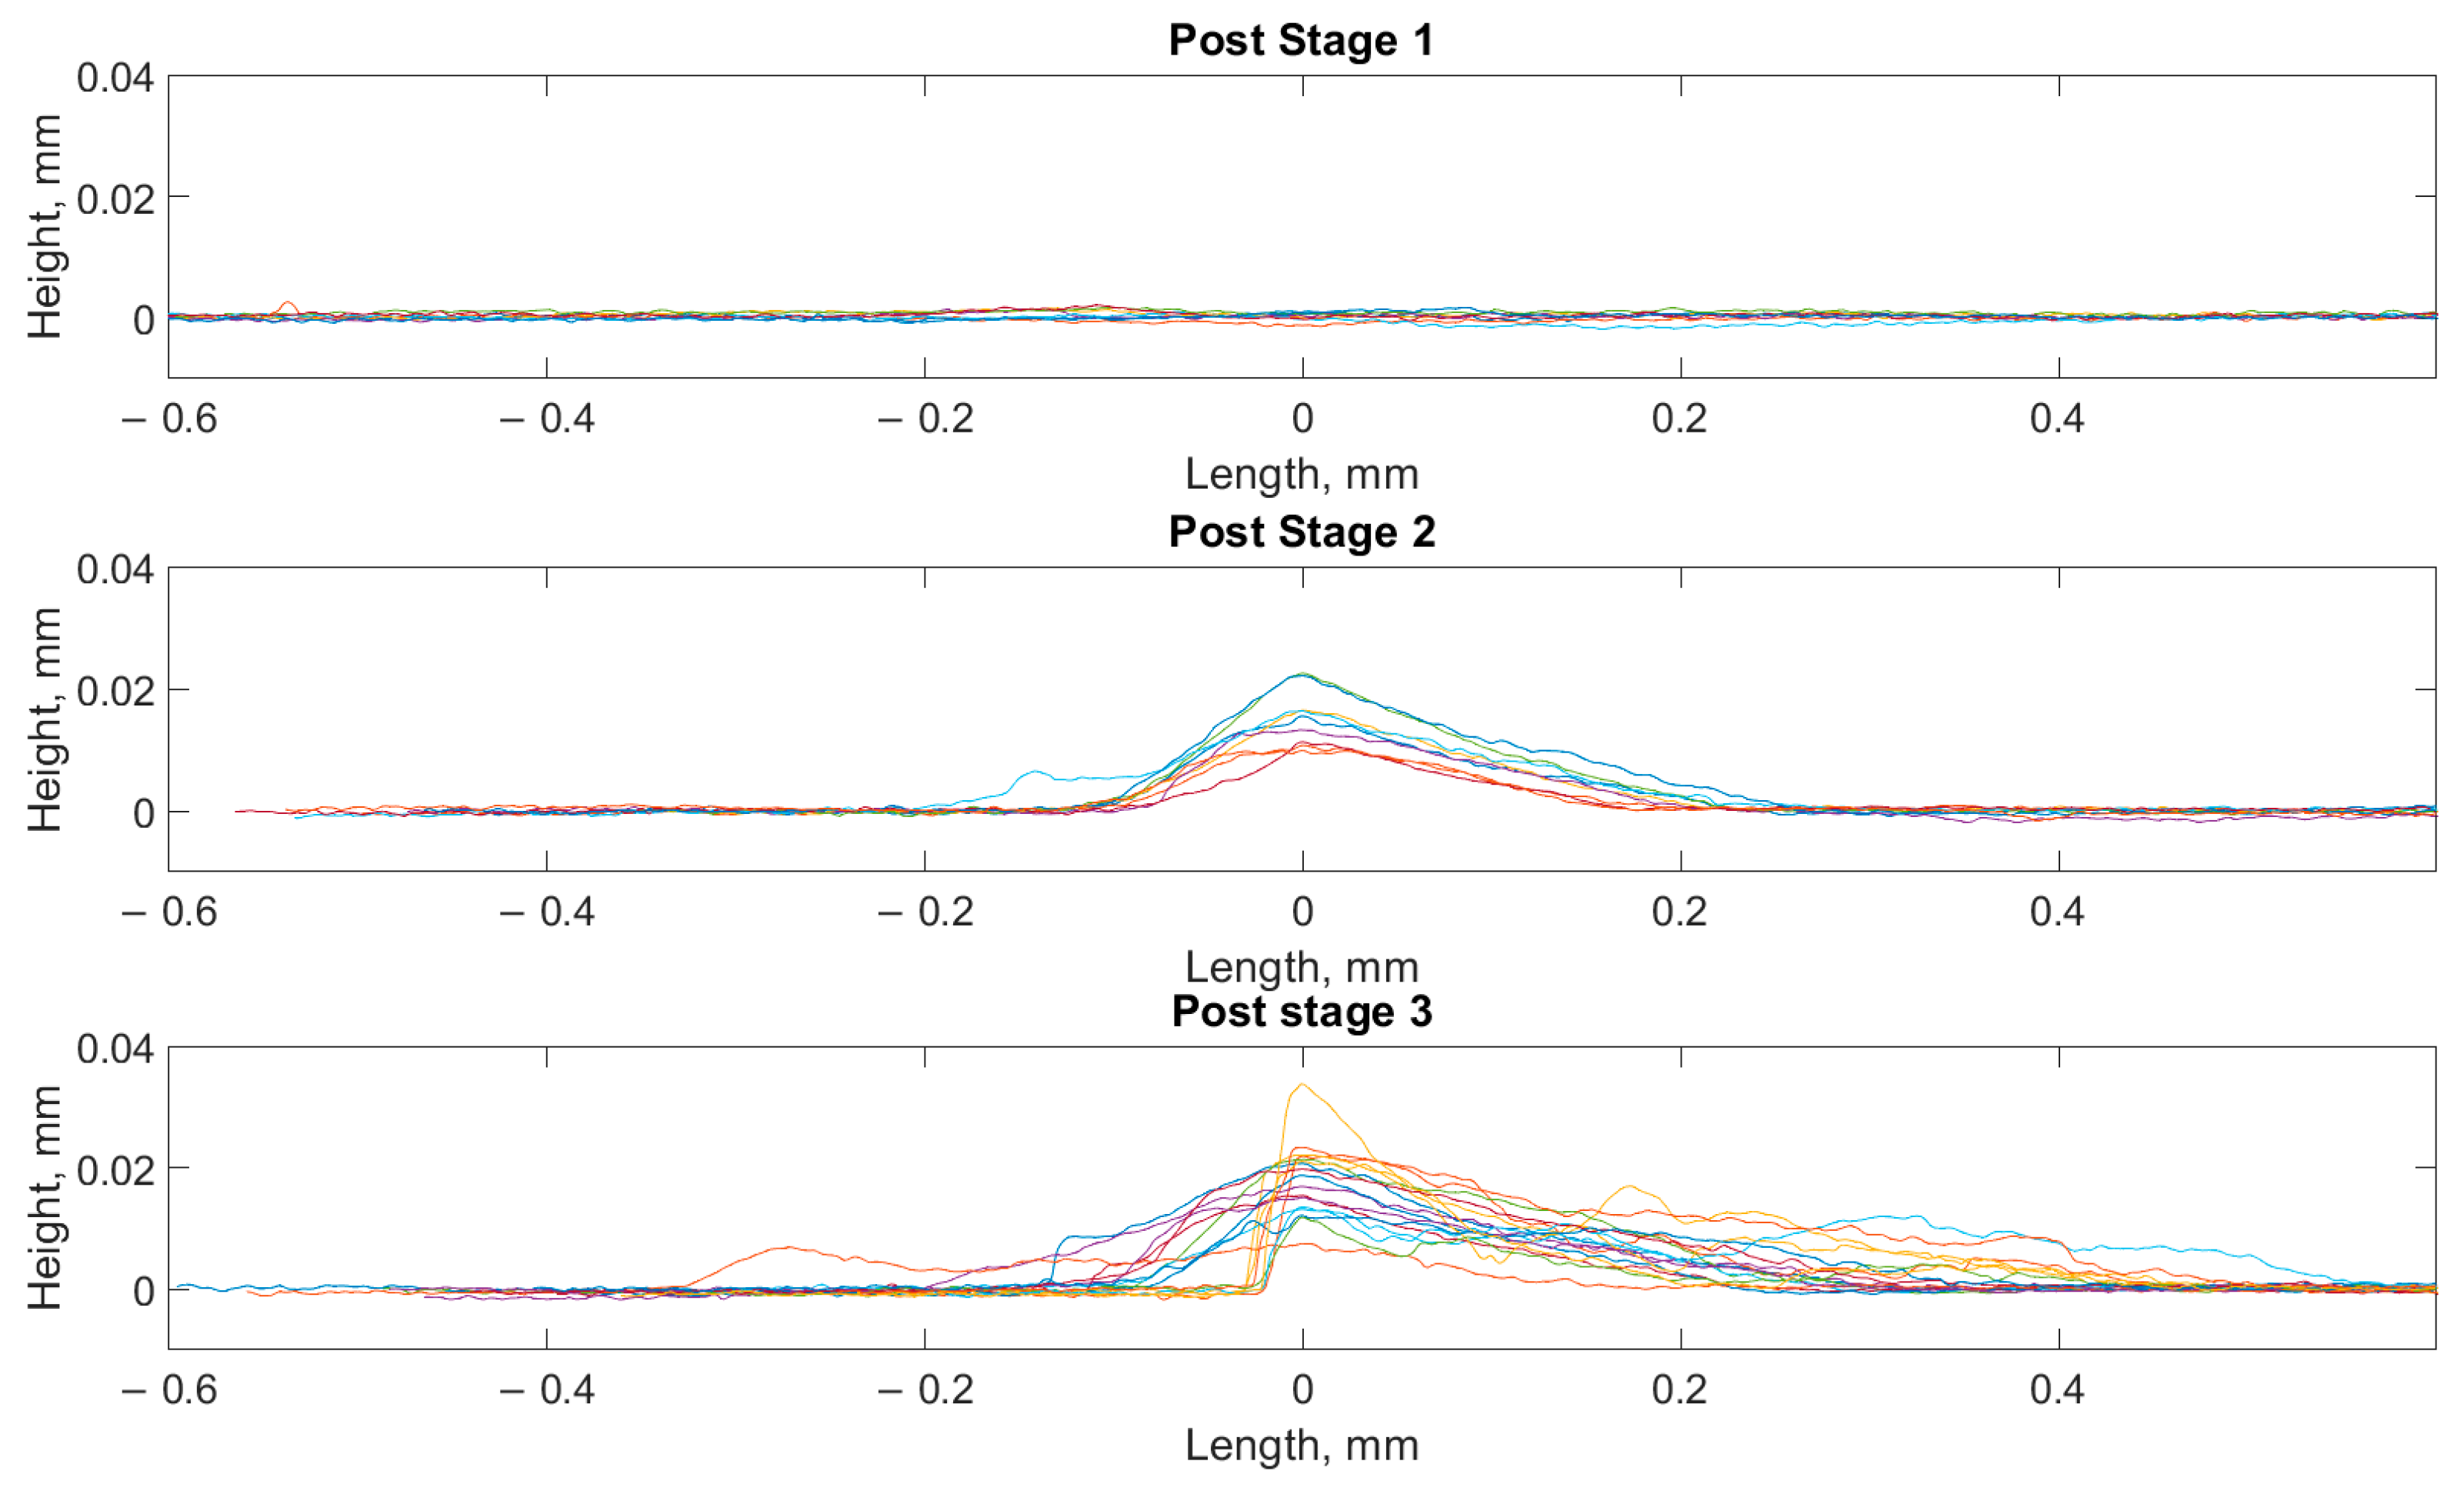
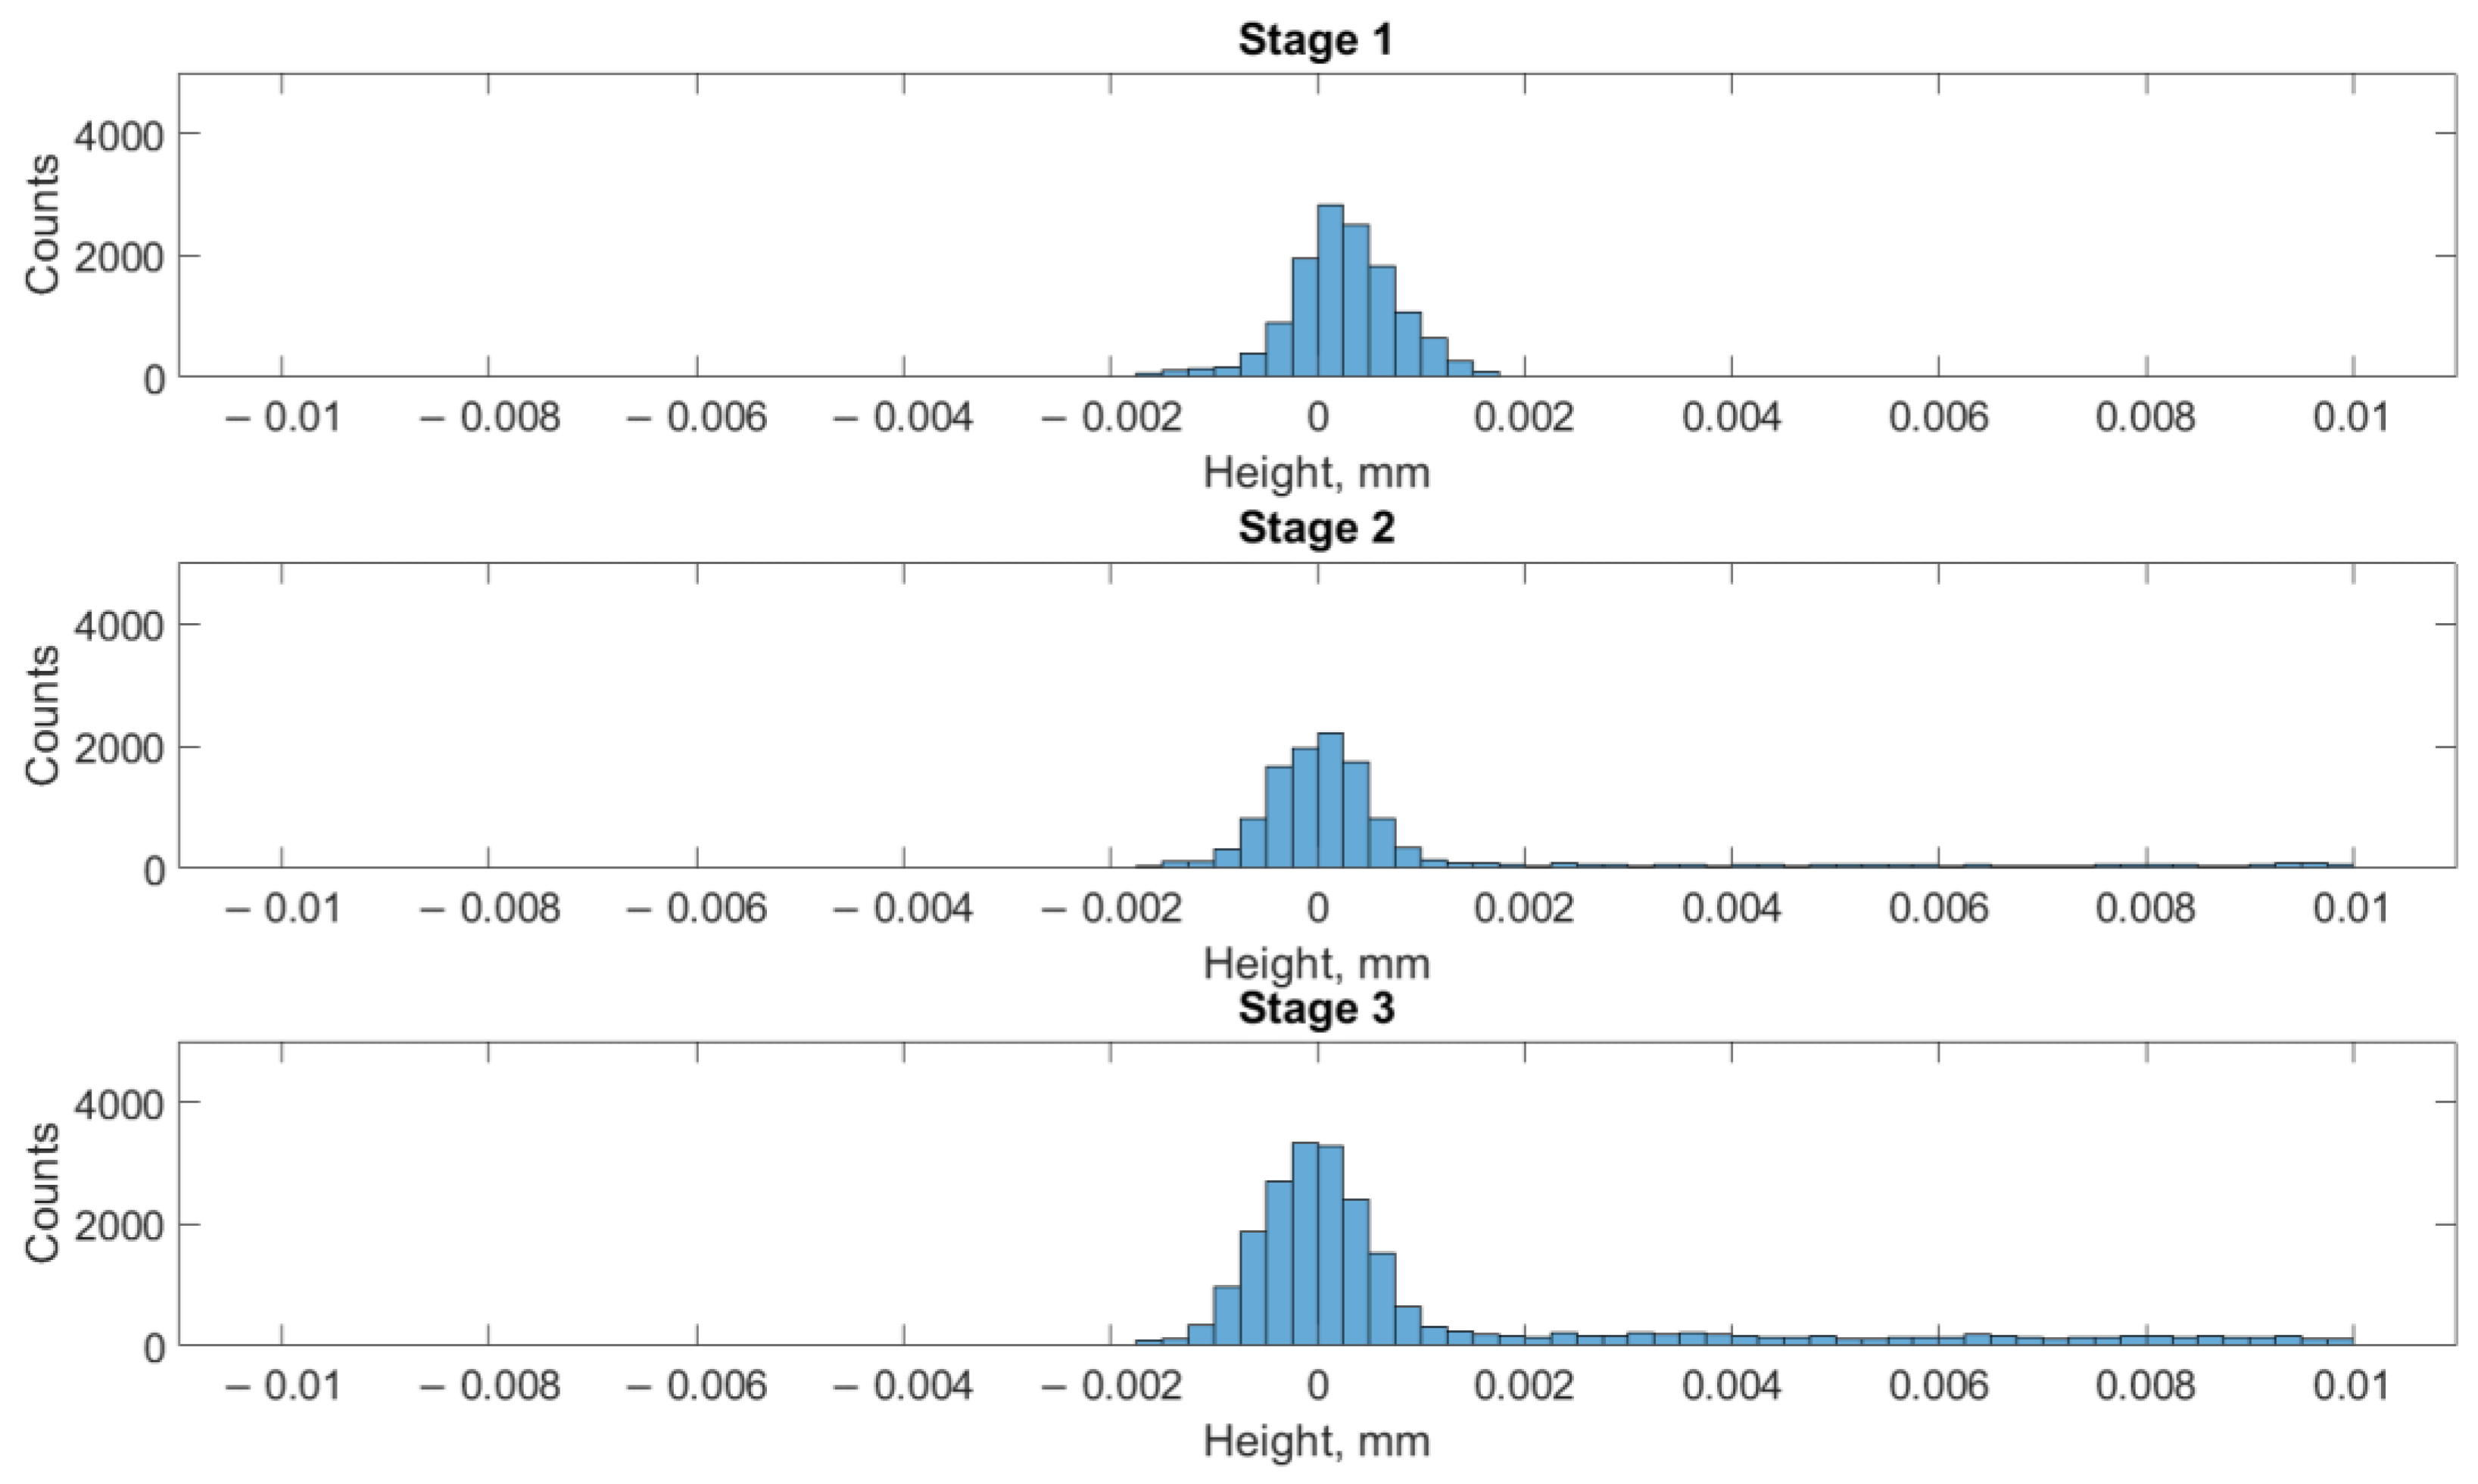
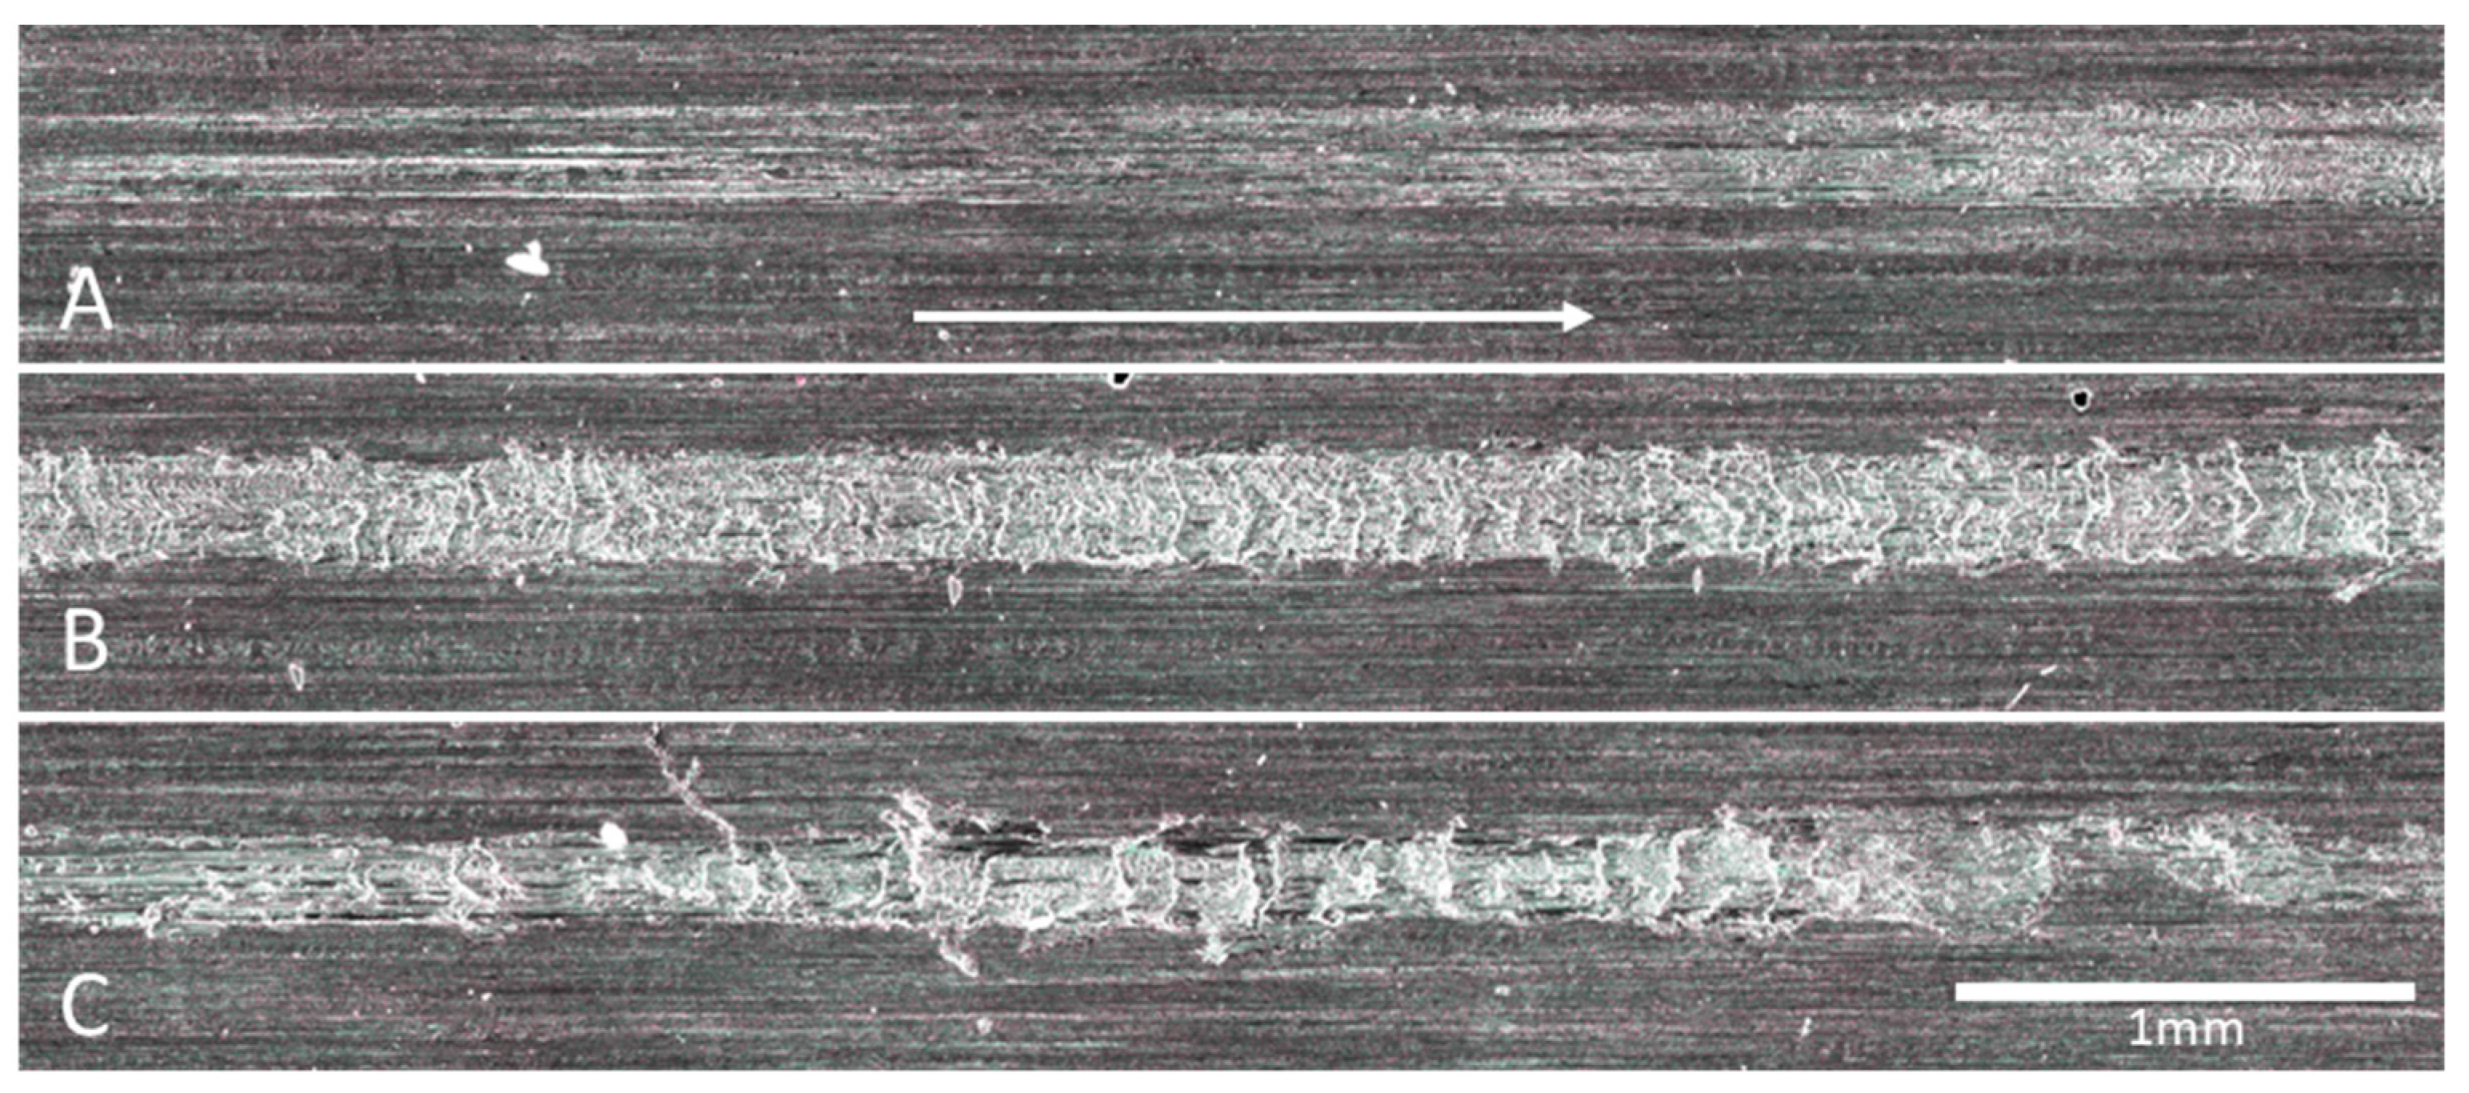
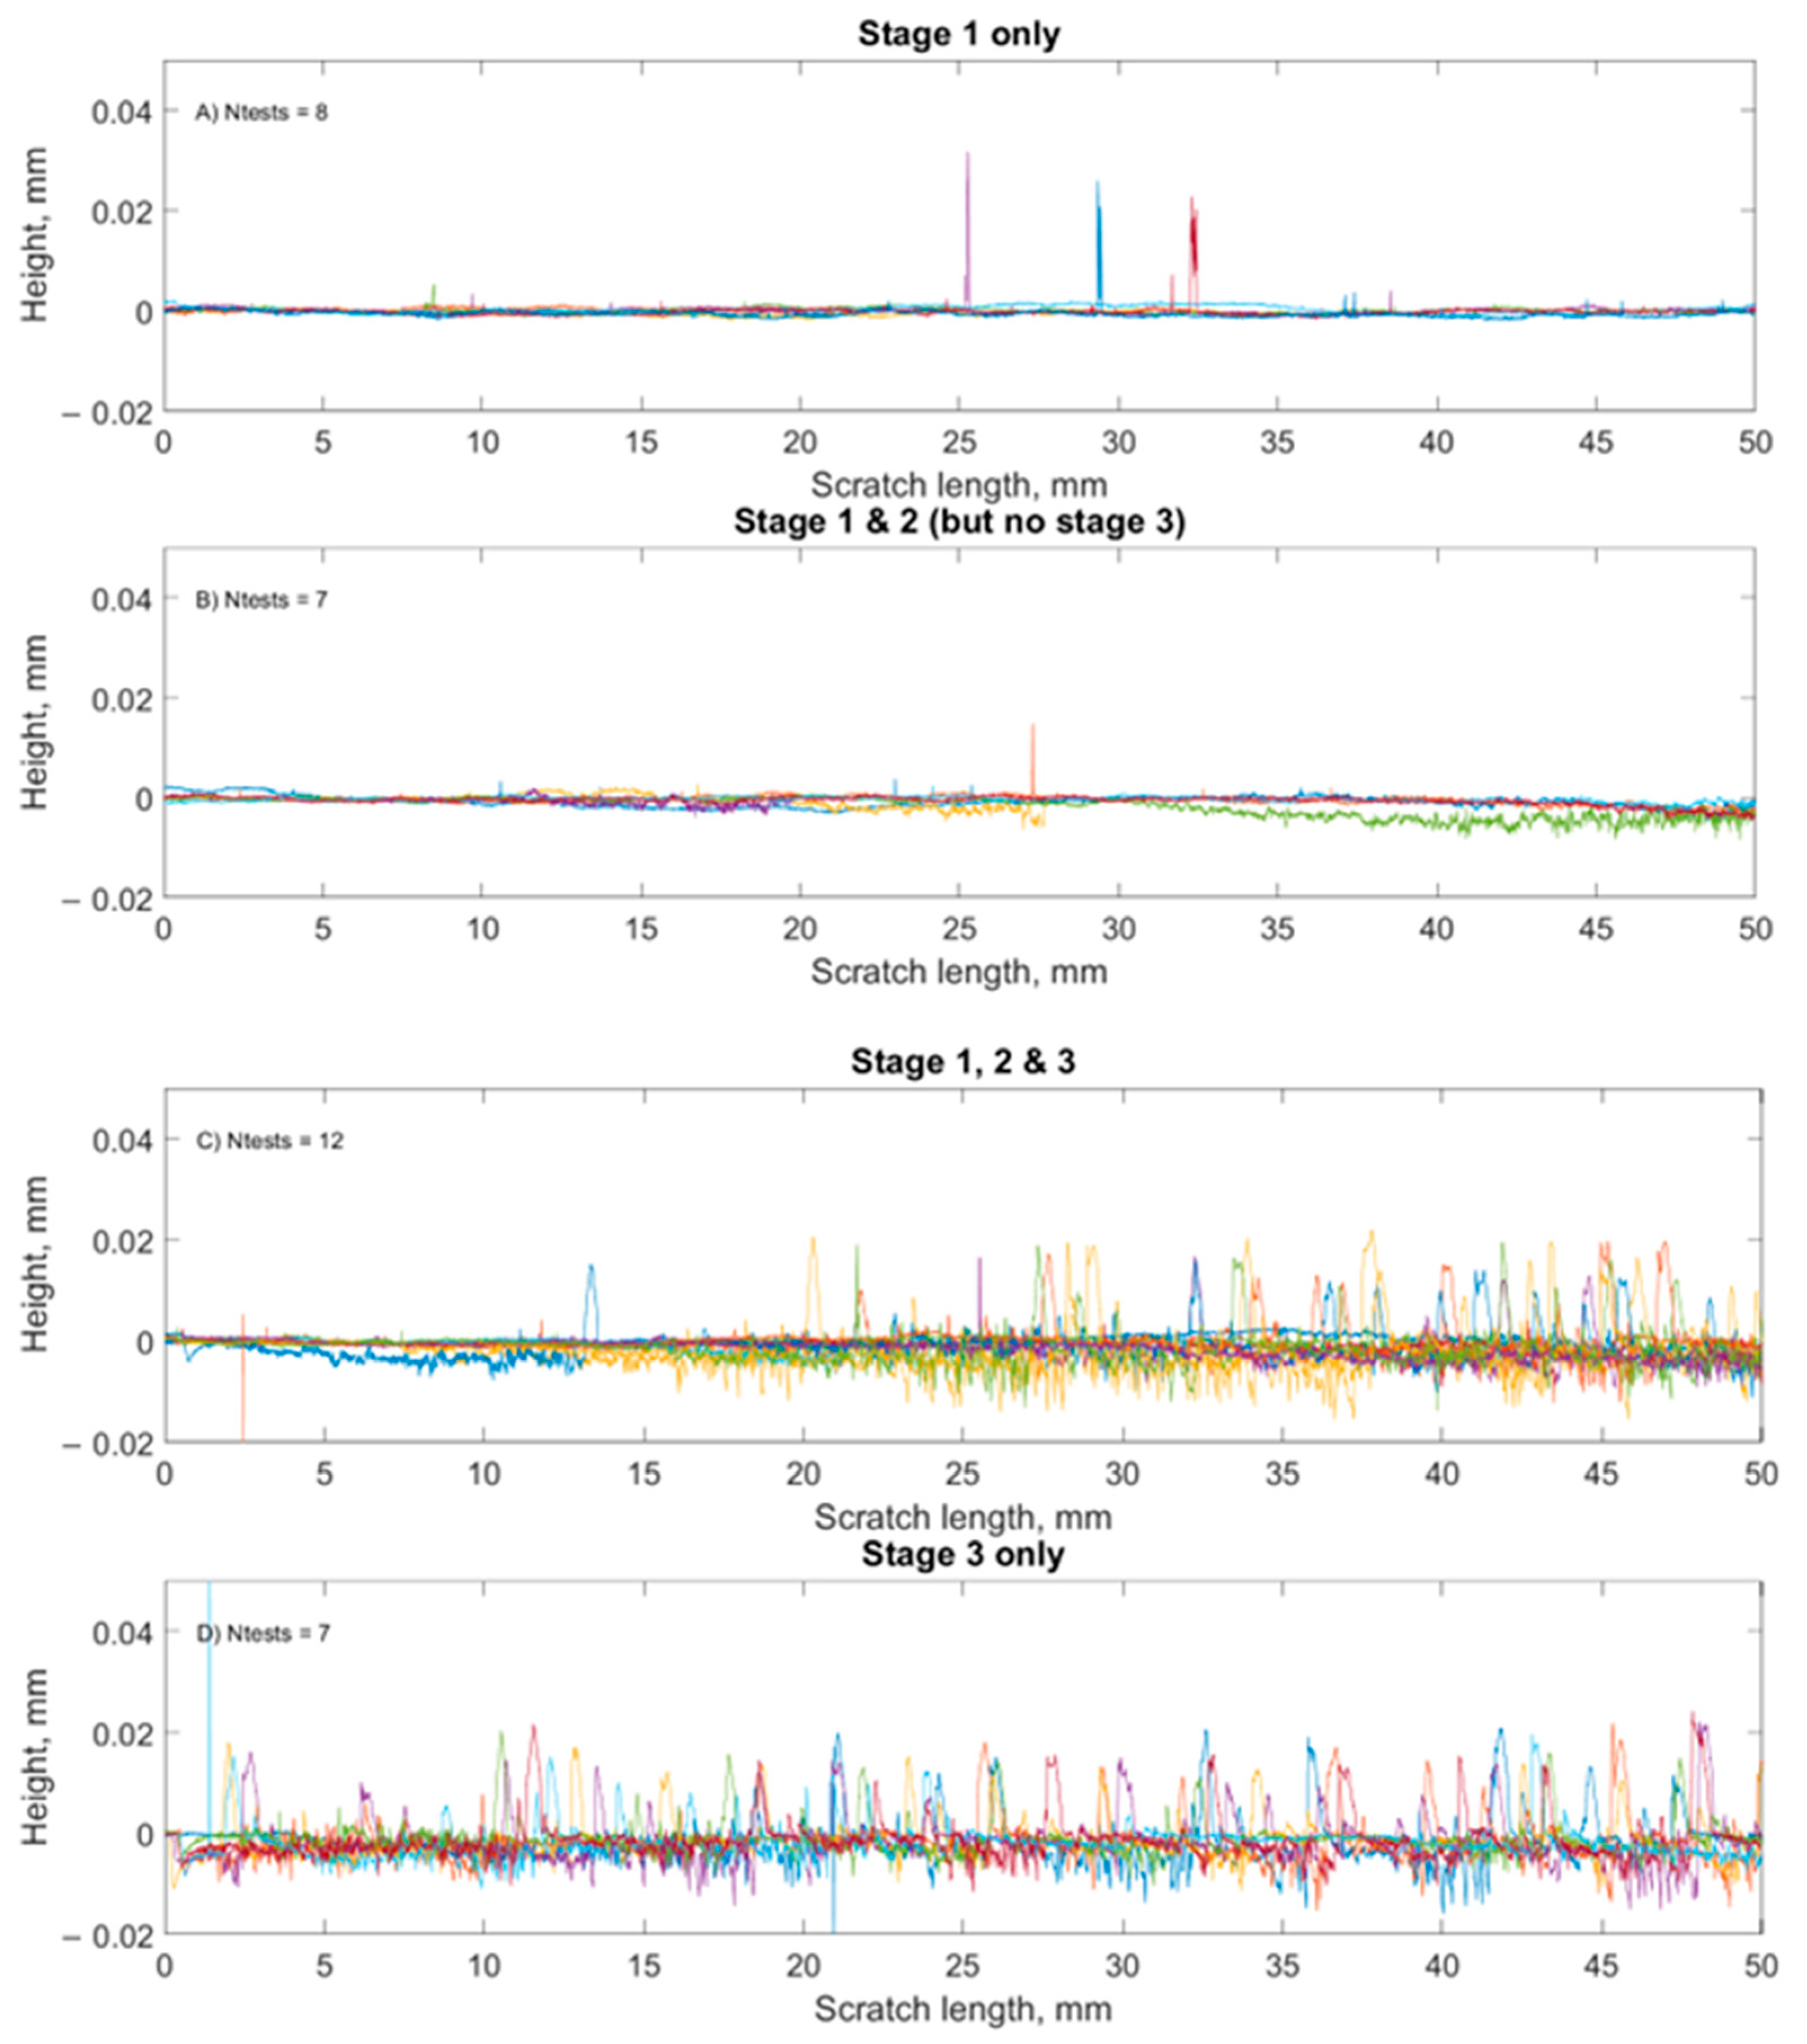
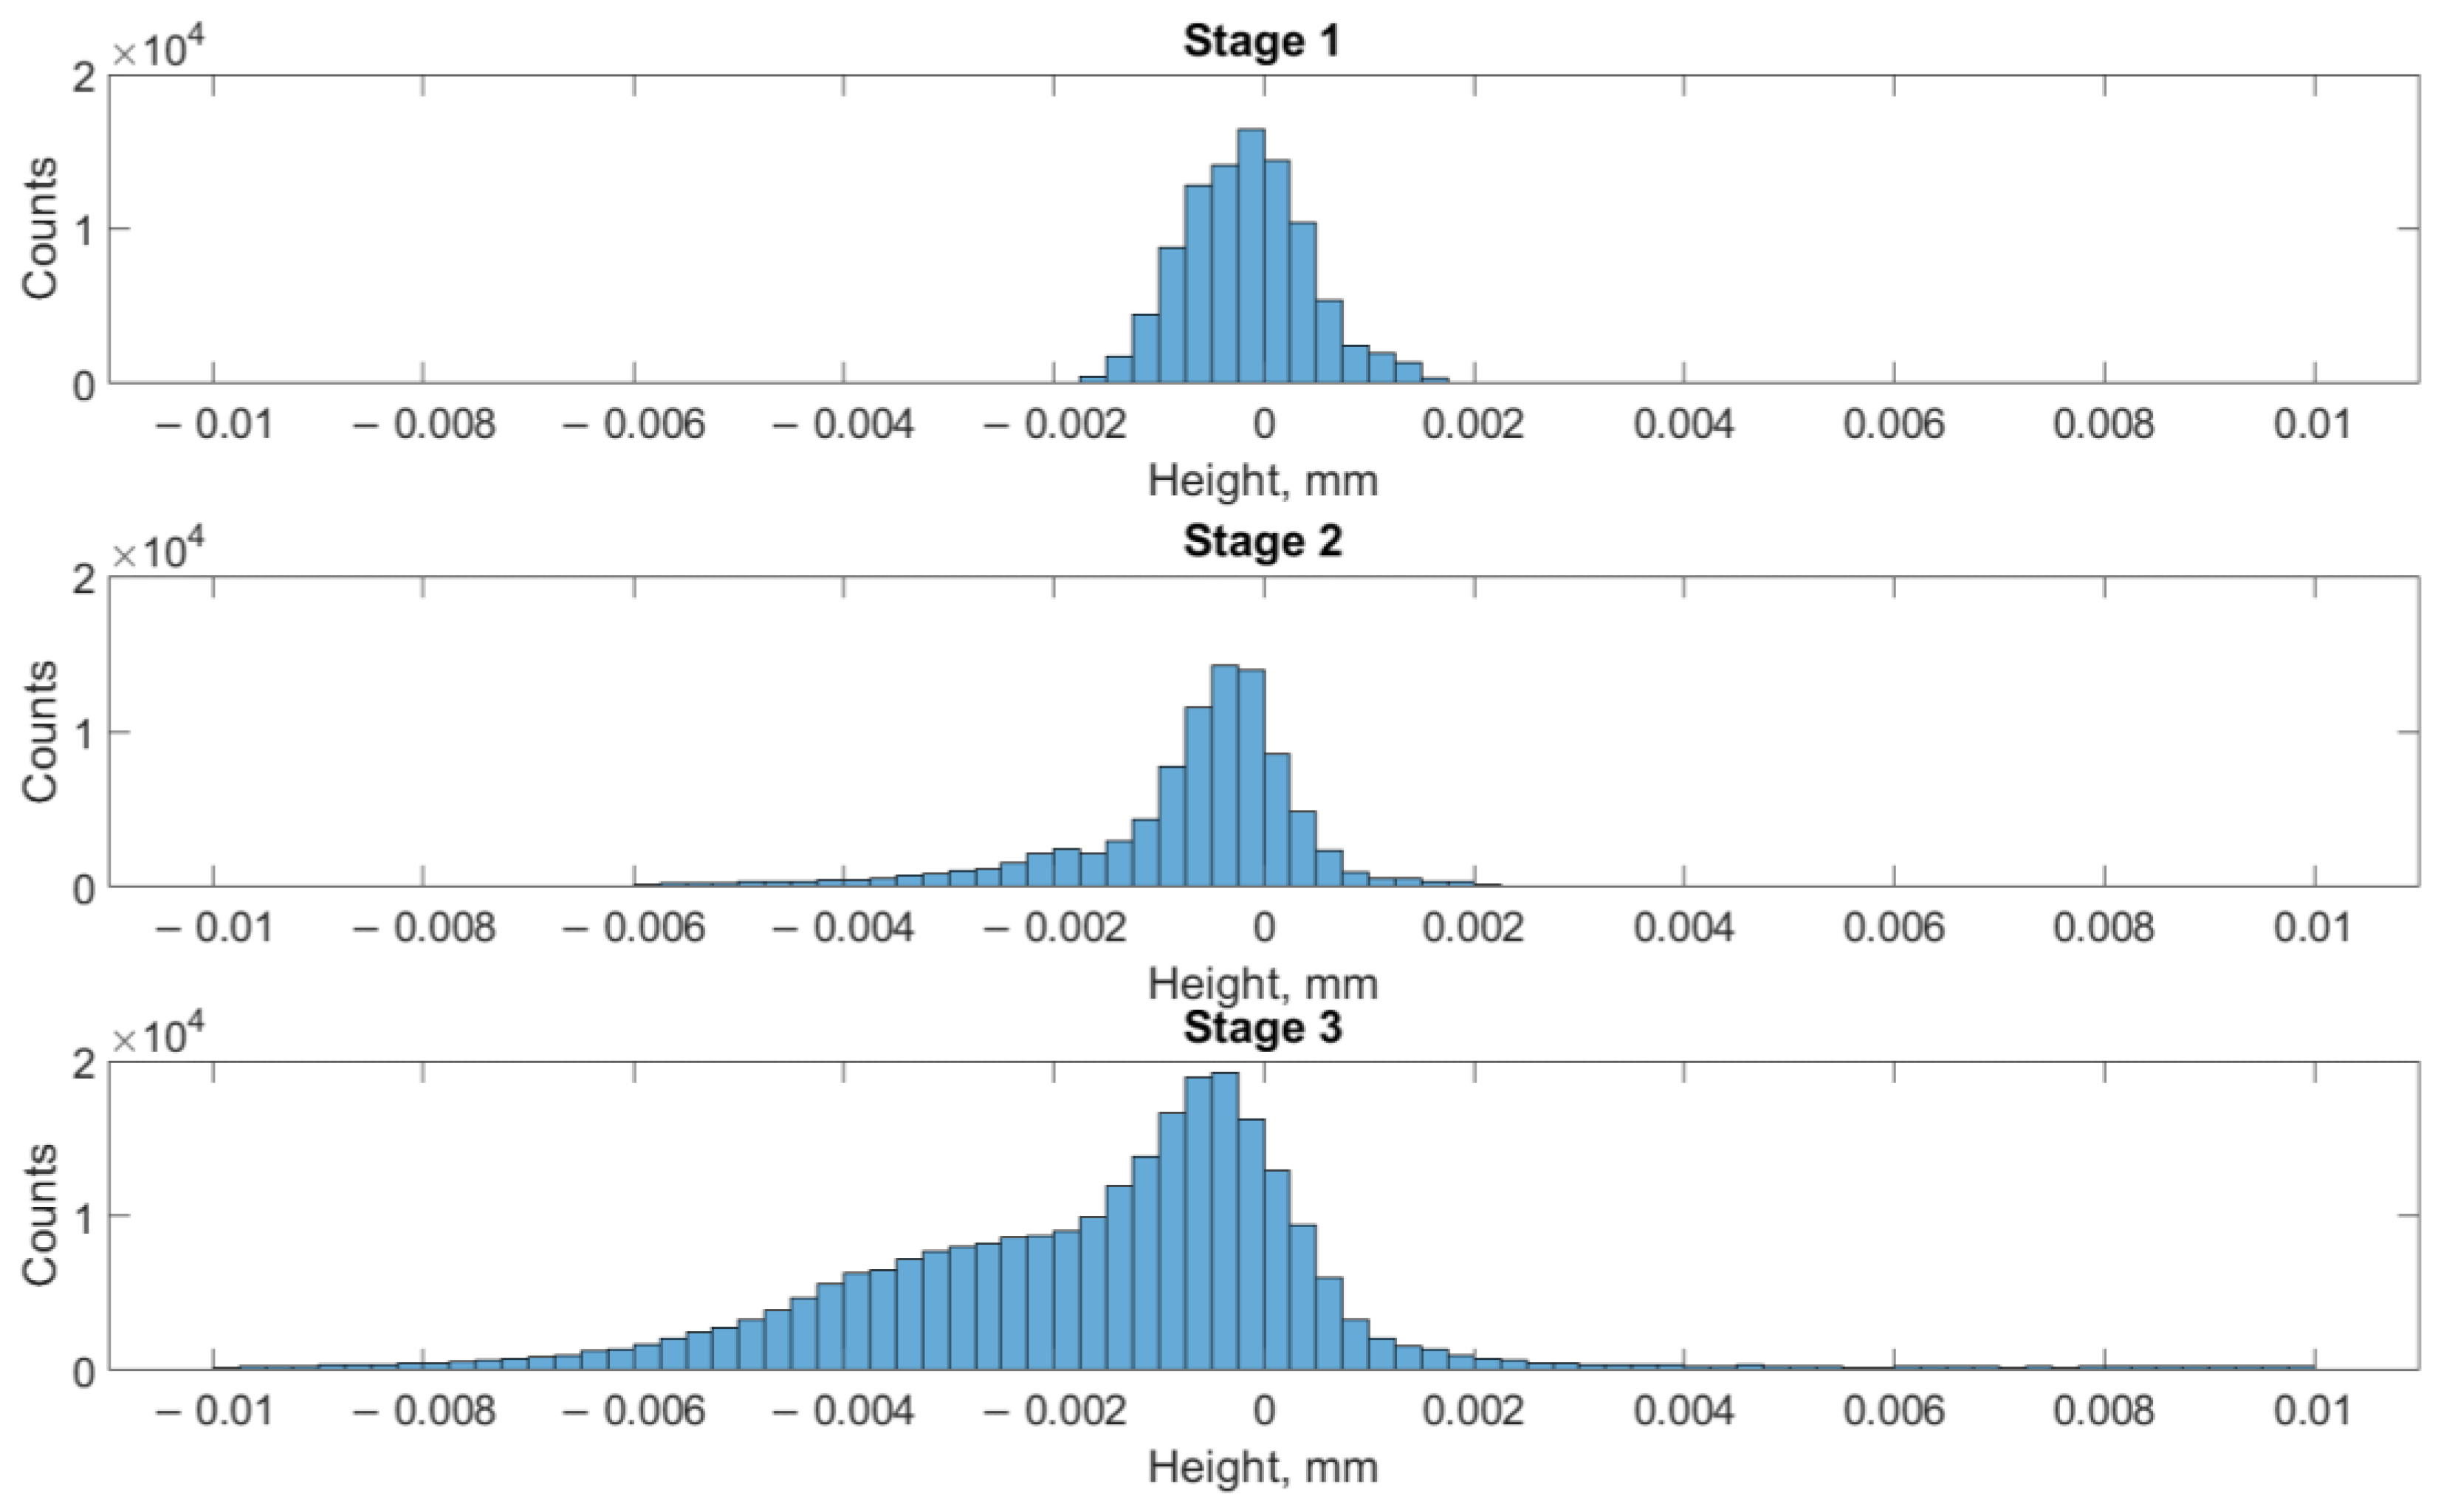
3.3. Scratch Morphology
4. Discussion
4.1. Friction
4.2. Lump Growth on the Indenter
4.3. Scratch Morphology
5. Conclusions
- The galling evolution is characterized by the coefficient of friction regimes.
- Stage 1 showed little to no lump growth on the indenter. Stage 2 showed uniform lump growth, while stage 3 showed less uniform lump growth. In some cases, the lumps in stage 3 showed the development of a steep edge at the beginning of the lump.
- The scratch morphology from stage 2 and 3 showed a series of peaks and troughs across the scratch, as opposed to the expected damage mechanism of longitudinal scratches in the scratch.
- Using a novel investigation of the distribution of the heights of these peaks and troughs showed that, as the amount of material adhered to the indenter increased, the depth of the grooves on the scratch surface perpendicular to the sliding direction also increased.
Author Contributions
Funding
Data Availability Statement
Acknowledgments
Conflicts of Interest
References
- Shanbhag, V.V.; Rolfe, B.F.; Arunachalam, N.; Pereira, M.P. Investigating galling wear behaviour in sheet metal stamping using acoustic emissions. Wear 2018, 414–415, 31–42. [Google Scholar] [CrossRef]
- Devenport, T.; Rolfe, B.; Pereira, M.; Griffin, J.M. Analysis of Acoustic Emissions for Determination of the Mechanical Effects of Scratch Tests. Appl. Sci. 2022, 12, 6724. [Google Scholar] [CrossRef]
- Gåård, A.; Sarih, R. Influence of Tool Material and Surface Roughness on Galling Resistance in Sliding against Austenitic Stainless Steel. Tribol. Lett. 2012, 46, 179–185. [Google Scholar] [CrossRef]
- Heinrichs, J.; Jacobson, S. Mechanisms of Transfer of Aluminium to PVD-Coated Forming Tools. Tribol. Lett. 2012, 46, 299–312. [Google Scholar] [CrossRef]
- Shanbhag, V.V.; Rolfe, B.F.; Pereira, M.P. Investigation of Galling Wear Using Acoustic Emission Frequency Characteristics. Lubricants 2020, 8, 25. [Google Scholar] [CrossRef] [Green Version]
- Hou, Y.; Yu, Z.; Li, S. Galling Failure Analysis in Sheet Metal Forming Process. J. Shanghai Jiaotong Univ. 2010, 15, 245–249. [Google Scholar] [CrossRef]
- Pujante, J.; Pelcastre, L.; Vilaseca, M.; Casellas, D.; Prakash, B. Investigations into wear and galling mechanism of aluminium alloy-tool steel tribopair at different temperatures. Wear 2013, 308, 193–198. [Google Scholar] [CrossRef] [Green Version]
- Daure, J.L.; Carrington, M.J.; McCartney, D.G.; Stewart, D.A.; Shipway, P.H. Measurement of friction in galling testing—An example of its use in characterising the galling behaviour of hardfacings at ambient and elevated temperature. Wear 2021, 476, 203736. [Google Scholar] [CrossRef]
- Schedin, E. Galling mechanisms in sheet forming operations. Wear 1994, 179, 123. [Google Scholar] [CrossRef]
- Vilhena, L.M.; Antunes, P.V.; Ramalho, A. Galling characterization for the pair composed by aluminium and M2 steel under dry and lubricated conditions by using load-scanning test method. J. Braz. Soc. Mech. Sci. Eng. 2018, 40, 284. [Google Scholar] [CrossRef]
- Eriksson, J.; Olsson, M. Tribological testing of commercial CrN, (Ti,Al)N and CrC/C PVD coatings—Evaluation of galling and wear characteristics against different high strength steels. Surf. Coat. Technol. 2011, 205, 4045–4051. [Google Scholar] [CrossRef]
- Liu, H.; Yang, X.; Zheng, Y.; Wang, L. Experimental Study on Galling Behavior in Aluminum stamping processes. Phys. Sci. Forum 2022, 4, 102022. [Google Scholar]
- Gåård, A.; Krakhmalev, P.; Bergström, J. Wear Mechanisms in Galling: Cold Work Tool Materials Sliding against High-strength Carbon Steel Sheets. Tribol. Lett. 2009, 33, 45–53. [Google Scholar] [CrossRef]
- Sindi, C.T.; Najafabadi, M.A.; Salehi, M. Investigation of surface damages during sheet metal forming using acoustic emission. Proc. Inst. Mech. Eng. Part J J. Eng. Tribol. 2013, 227, 286–296. [Google Scholar] [CrossRef]
- Domitner, J.; Silvayeh, Z.; Shafiee Sabet, A.; Öksüz, K.I.; Pelcastre, L.; Hardell, J. Characterization of wear and friction between tool steel and aluminum alloys in sheet forming at room temperature. J. Manuf. Process. 2021, 64, 774–784. [Google Scholar] [CrossRef]
- Yang, X.; Hu, Y.; Zhang, L.; Zheng, Y.; Politis, D.J.; Liu, X.; Wang, L. Experimental and modelling study of interaction between friction and galling under contact load change conditions. Friction 2022, 10, 454–472. [Google Scholar] [CrossRef]
- Lu, J.; Song, Y.; Zhou, P.; Lin, J.; Dean, T.A.; Liu, P. Process parameters effect on high-temperature friction and galling characteristics of AA7075 sheets. Mater. Manuf. Process. 2021, 36, 967. [Google Scholar] [CrossRef]
- Lu, J.; Song, Y.; Hua, L.; Zhou, P.; Xie, G. Effect of temperature on friction and galling behavior of 7075 aluminum alloy sheet based on ball-on-plate sliding test. Tribol. Int. 2019, 140, 105872. [Google Scholar] [CrossRef]
- AISI 4140 Chrome-Molybdenum High Tensile Steel. Available online: https://www.azom.com/article.aspx?ArticleID=6116 (accessed on 30 May 2023).
- Aluminium Alloys—Aluminium 5083 Properties, Fabrication and Applications. Available online: https://www.azom.com/article.aspx?ArticleID=2804 (accessed on 30 May 2023).
- Pereira, M.P.; Yan, W.; Rolfe, B.F. Contact pressure evolution and its relation to wear in sheet metal forming. Wear 2008, 265, 1687–1699. [Google Scholar] [CrossRef]
- Daure, J.L.; Kóti, D.; Carrington, M.J.; McCartney, D.G.; Stewart, D.A.; Shipway, P.H. Galling of stainless steels as a function of test conditions in an ASTM G196-type test setup—The role of temperature, rotational velocity, interrupted rotation and rotational distance. Wear 2023, 524–525, 204804. [Google Scholar] [CrossRef]
- Safara Nosar, N.; Olsson, M. Influence of tool steel surface topography on adhesion and material transfer in stainless steel/tool steel sliding contact. Wear 2013, 303, 30–39. [Google Scholar] [CrossRef]
- Budinski, K.G.; Budinski, S.T. Interpretation of Galling Tests. Wear 2015, 332–333, 1185–1192. [Google Scholar] [CrossRef]
- Heinrichs, J.; Olsson, M.; Jacobson, S. Mechanisms of material transfer studied in situ in the SEM. Wear 2012, 292–293, 49–60. [Google Scholar] [CrossRef]
- Heinrichs, J.; Olsson, M.; Jacobson, S. New understanding of the initiation of material transfer and transfer layer build-up in metal forming—In situ studies in the SEM. Wear 2012, 292–293, 61–73. [Google Scholar] [CrossRef]
- Hu, Y.; Wang, L.; Politis, D.J.; Masen, M.A. Development of an interactive friction model for the prediction of lubricant breakdown behaviour during sliding wear. Tribol. Int. 2017, 110, 370–377. [Google Scholar] [CrossRef] [Green Version]
- Vilaseca, M.; Molas, S.; Casellas, D. High temperature tribological behaviour of tool steels during sliding against aluminium. Wear 2011, 272, 105–109. [Google Scholar] [CrossRef]
- Pujante, J.; Vilaseca, M.; Casellas, D.; Riera, M.D. The Role of Adhesive Forces and Mechanical Interaction on Material Transfer in Hot Forming of Aluminium. Tribol. Lett. 2015, 59, 10. [Google Scholar] [CrossRef] [Green Version]
- Gåård, A.; Krakhmalev, P.; Bergström, J. Wear mechanisms in deep drawing of carbon steel—Correlation to laboratory testing. Tribotest 2008, 14, 1–9. [Google Scholar] [CrossRef]
- Heinrichs, J.; Jacobson, S. Laboratory test simulation of galling in cold forming of aluminium. Wear 2009, 267, 2278–2286. [Google Scholar] [CrossRef]
- Ghiotti, A.; Simonetto, E.; Bruschi, S. Influence of process parameters on tribological behaviour of AA7075 in hot stamping. Wear 2019, 426–427, 348–356. [Google Scholar] [CrossRef]
- Choi, H.; Kim, S.; Seo, P.; Kim, B.; Cha, B.; Ko, D. Experimental investigation on galling performance of tool steel in stamping of UHSS sheets. Int. J. Precis. Eng. Manuf. 2014, 15, 1101–1107. [Google Scholar] [CrossRef]
- Määttä, A.; Vuoristo, P.; Mäntylä, T. Friction and adhesion of stainless steel strip against tool steels in unlubricated sliding with high contact load. Tribol. Int. 2001, 34, 779–786. [Google Scholar] [CrossRef]
- Gåård, A.; Krakhmalev, P.; Bergström, J. Influence of tool steel microstructure on origin of galling initiation and wear mechanisms under dry sliding against a carbon steel sheet. Wear 2009, 267, 387–393. [Google Scholar] [CrossRef]
- Heinrichs, J.; Jacobson, S. The influence from shape and size of tool surface defects on the occurrence of galling in cold forming of aluminium. Wear 2011, 271, 2517–2524. [Google Scholar] [CrossRef]
- Rogers, S.R.; Bowden, D.; Unnikrishnan, R.; Scenini, F.; Preuss, M.; Stewart, D.; Dini, D.; Dye, D. The interaction of galling and oxidation in 316L stainless steel. Wear 2020, 450–451, 203234. [Google Scholar] [CrossRef] [Green Version]
- Karlsson, P.; Gåård, A.; Krakhmalev, P.; Bergström, J. Galling resistance and wear mechanisms for cold-work tool steels in lubricated sliding against high strength stainless steel sheets. Wear 2012, 286–287, 92–97. [Google Scholar] [CrossRef]
- Mao, L.J.; He, X.; Cai, M.J.; Qian, L.Q. Influence of Contact Load on the Dry Sliding Wear Performance of 7075 Aluminum Alloy. Exp. Tech. 2023, 47, 357–367. [Google Scholar] [CrossRef]
- Heinrichs, J.; Jacobson, S. Laboratory test simulation of aluminium cold forming—influence from PVD tool coatings on the tendency to galling. Surf. Coat. Technol. 2010, 204, 3606–3613. [Google Scholar] [CrossRef]
- Huttunen-Saarivirta, E.; Kilpi, L.; Hakala, T.J.; Metsäjoki, J.; Ronkainen, H. Insights into the behaviour of tool steel-aluminium alloy tribopair at different temperatures. Tribol. Int. 2018, 119, 567. [Google Scholar] [CrossRef]
- Moghadam, M.; Christiansen, P.; Bay, N. Detection of the Onset of Galling in Strip Reduction Testing Using Acoustic Emission. Procedia Eng. 2017, 183, 59–64. [Google Scholar] [CrossRef] [Green Version]


| Plate | Ra (in Sliding Direction) (µm) | Ra (across Sliding Direction) (µm) |
|---|---|---|
| 1 | 0.027 | 0.202 |
| 2 | 0.031 | 0.275 |
| 3 | 0.024 | 0.231 |
| 4 | 0.023 | 0.229 |
| 5 | 0.021 | 0.286 |
| 6 | 0.031 | 0.243 |
| Average | 0.026 | 0.244 |
| Element | % Present |
|---|---|
| Si | 0.4 |
| Fe | 0.4 |
| Cu | 0.1 |
| Mn | 0.4–1.0 |
| Mg | 4.0–4.9 |
| Zn | 0.25 |
| Ti | 0.15 |
| Cr | 0.05–0.25 |
| Al | Balance |
| Ball Sample Number | Galling Stage(s) Observed for Scratch Increment A (0–50 mm) | Galling Stage(s) Observed for Scratch Increment B (50–100 mm) | Galling Stage(s) Observed for Scratch Increment C (100–150 mm) | Total Scratch Length (mm) |
|---|---|---|---|---|
| 1 | 1, 2, 3 | - | - | 50 |
| 2 | 1 | - | - | 24 |
| 3 | 1 | - | - | 24 |
| 4 | 1 | - | - | 36 |
| 5 | 1, 2 | - | - | 50 |
| 6 | 1, 2, 3 | - | - | 50 |
| 7 | 1, 2, 3 | - | - | 50 |
| 8 | 1, 2, 3 | - | - | 50 |
| 9 | 1, 2, 3 | - | - | 50 |
| 10 | 1, 2, 3 | - | - | 50 |
| 11 | 1 | 2 | 3 | 150 |
| 12 | 1 | 2 | 3 | 150 |
| 13 | 1, 2 | 3 | - | 100 |
| 14 | 1 | 1,2 | - | 100 |
| 15 | 1, 2 | - | - | 50 |
| 16 | 1, 2 | - | - | 50 |
| 17 | 1, 2 | 3 | - | 100 |
| 18 | 1, 2 | 3 | - | 100 |
| 19 | 1, 2 | 3 | - | 100 |
| 20 | 1, 2 | 3 | - | 100 |
| 21 | 1, 2 | 3 | - | 100 |
| 22 | 1, 2 | 3 | - | 100 |
Disclaimer/Publisher’s Note: The statements, opinions and data contained in all publications are solely those of the individual author(s) and contributor(s) and not of MDPI and/or the editor(s). MDPI and/or the editor(s) disclaim responsibility for any injury to people or property resulting from any ideas, methods, instructions or products referred to in the content. |
© 2023 by the authors. Licensee MDPI, Basel, Switzerland. This article is an open access article distributed under the terms and conditions of the Creative Commons Attribution (CC BY) license (https://creativecommons.org/licenses/by/4.0/).
Share and Cite
Devenport, T.M.; Griffin, J.M.; Rolfe, B.F.; Pereira, M.P. Friction and Wear in Stages of Galling for Sheet Metal Forming Applications. Lubricants 2023, 11, 288. https://doi.org/10.3390/lubricants11070288
Devenport TM, Griffin JM, Rolfe BF, Pereira MP. Friction and Wear in Stages of Galling for Sheet Metal Forming Applications. Lubricants. 2023; 11(7):288. https://doi.org/10.3390/lubricants11070288
Chicago/Turabian StyleDevenport, Timothy M., James M. Griffin, Bernard F. Rolfe, and Michael P. Pereira. 2023. "Friction and Wear in Stages of Galling for Sheet Metal Forming Applications" Lubricants 11, no. 7: 288. https://doi.org/10.3390/lubricants11070288