Article

Application of Taguchi Technique to Study Tribological Properties of Roller-Burnished 36CrNiMo4 Steel

by
Andrzej Dzierwa
1,*,
Nataliia Stelmakh
2 and
Nika Tikanashvili
3
1
Department of Manufacturing Technology and Production Engineering, Rzeszow University of Technology, Powstancow Warszawy 8, 35-959 Rzeszow, Poland
2
Igor Sikorsky Kyiv Polytechnic Institute, National Technical University of Ukraine, 37 Prosp. Peremohy, 03056 Kyiv, Ukraine
3
Faculty of Engineering, Georgian Aviation University, 16 Ketevan Dedofali Ave., 0144 Tbilisi, Georgia
*
Author to whom correspondence should be addressed.
Lubricants 2023, 11(5), 227; https://doi.org/10.3390/lubricants11050227
Submission received: 15 April 2023 / Revised: 10 May 2023 / Accepted: 15 May 2023 / Published: 17 May 2023

Abstract

:
The purpose of this work was to study the effect of roller burnishing process on tribological properties of 36CrNiMo4 steel. The experiments were performed under dry and starved lubrication contact conditions. The influence of selected parameters such as applied load, sliding speed, and sliding distance on the coefficient of friction and wear volume was investigated. The Taguchi technique was used to estimate the parameters significantly affecting the tribological properties. The levels of tested input factors were as follows: applied load—5, 10, and 15 N, sliding speed—0.24, 0.48, and 0.72 m/s, and sliding distance—160, 282, and 404 m. The results revealed that load was the most dominating factor that affects the wear volume and the coefficient of friction. The influence of other input factors was smaller. Regression analysis was also performed to predict tribological behavior. The results demonstrated good agreement between experimental and predicted results. The worn-out samples were analyzed using SEM to reveal the wear mechanism.

1. Introduction

Machine and/or machine component reliability is the probability of the machine running without failure, which can be calculated by dividing the actual working time by the total scheduled working time [1]. The increasing development of technology places more and more demands on machines, which should be characterized not only by better performance, but also by higher reliability [2,3]. Machine reliability takes into account several aspects including mechanics, tribology, or environment.
One of the main types of damage to machine components is wear including, among others, abrasive wear [4], adhesive wear [5], erosive wear [6], and fretting wear [7]. Therefore, the high-quality of machine part surfaces is usually needed. Many types of finishing treatments are used in the mechanical industry. One of them that can delay the wear process is the burnishing technique [8]. Burnishing is a low-energy consuming and chipless process that can produce a good surface finish by deforming the peaks of the roughness [9]. It is due to the plastic deformation of surface asperities by pressing a burnishing element along the surface of the workpiece [10]. Burnishing surfaces are also characterized by increased hardness and the presence of compressive stresses. The burnishing technique includes, among others, roller burnishing [11], ball burnishing [12], slide burnishing [13], and techniques such as shot-peening [14,15]. In the case of roller burnishing one or more rollers are used to plastify and form the surface layer of the element. Prasad et al. [16] investigated the effects of roller burnishing on the surface properties of wrought aluminum alloys AA6063. From their work, it can be seen that roller burnishing process caused an increase in hardness and a decrease in surface roughness. A positive effect on corrosion resistance and wear resistance was also observed. Authors of [17] performed a roller burnishing process on aluminum 6061 under different parameters and different burnishing orientations. The authors demonstrated a significant decrease in the friction coefficient and weight loss under lubricated contact conditions. The best effect was observed when sliding took place in the direction parallel to the burnishing orientation. Kovacs [18] investigated the tribological properties of C45 steel treated with magnetic polishing and roller burnishing as well as the combination of both technologies. It has been found that improvement in surface quality can be easily achieved by changing the magnetic and kinematic parameters of the process. Yaman et al. [19] performed tests of additively manufactured Inconel 718 alloy. The authors showed that by using appropriate machining parameters, it was possible to increase the wear resistance of as-built samples by 38% and heat-treated samples by 55%. The magnetic-assisted roller burnishing process of flat metal surfaces was investigated by the authors of [20]. Steel and aluminum alloy samples were used in their research. As in the work [16], a decrease in surface roughness and an increase in hardness were observed. Zhang et al. [21] investigated the effect of roller burnishing on the high cycle fatigue performance of AZ80 magnesium alloy. The authors reported an increase in the fatigue performance of AZ80 by 110% under optimum conditions. The hardness and wear resistance of roller-burnished 316L stainless steel has been tested in [22]. The design of the experiment analysis indicated that burnishing force was the most important factor in improving the hardness of the roller-burnished surfaces. A positive effect on wear resistance was also noticed.
The aim of the study presented in [23] was to develop a device for mechanical plastic deformation of structural Rb40 steel using ball and roller burnishing and to investigate the evolution of associated roughness, hardness, and wear resistance. The authors reported that roller burnishing provides optimal roughness results, particularly when the initial surface quality is close to 3 μm. The design of the roller burnishing tool and its effect on the surface integrity of Al 6061 was also the subject of research by the authors [24]. The outcomes revealed that roller burnishing improves surface roughness significantly by 60% with the increase in pressure. Hence, the hydraulic system by means of which pressure can be varied plays a vital role. Moreover, as the burnishing force increased, the wear resistance of 6061 aluminum decreased. Franzen et al. [25] investigated thermally sprayed tool coatings after the roller burnishing process. The authors found out that the thermally sprayed and burnished coatings were characterized by an increased contact area in the strip tensile test, which led to a decrease in local tribological loads in the coatings and a clear reduction of cracks on the drawn sheet metal strips compared to unfinished coatings.
A review of the literature on the burnishing process shows that most of the work focuses on the effects of treatment on surface quality, surface morphology, surface topography, roughness, and hardness, but with little focus on the effect of the roller burnishing technique on tribological properties and on the optimization of tribological parameters. Therefore, the aim of this paper is to analyze the effect of a roller burnishing process on friction and wear resistance of steel surfaces in dry and lubricated conditions. The design of the experiment based on the Taguchi method has been used to assess the role of load, sliding speed, and sliding distance on the tribological properties. In addition, the regression equations necessary to determine the relationship between the input and output factors were calculated. Finally, the reliability of the developed models was compared with the values calculated in the experiment.

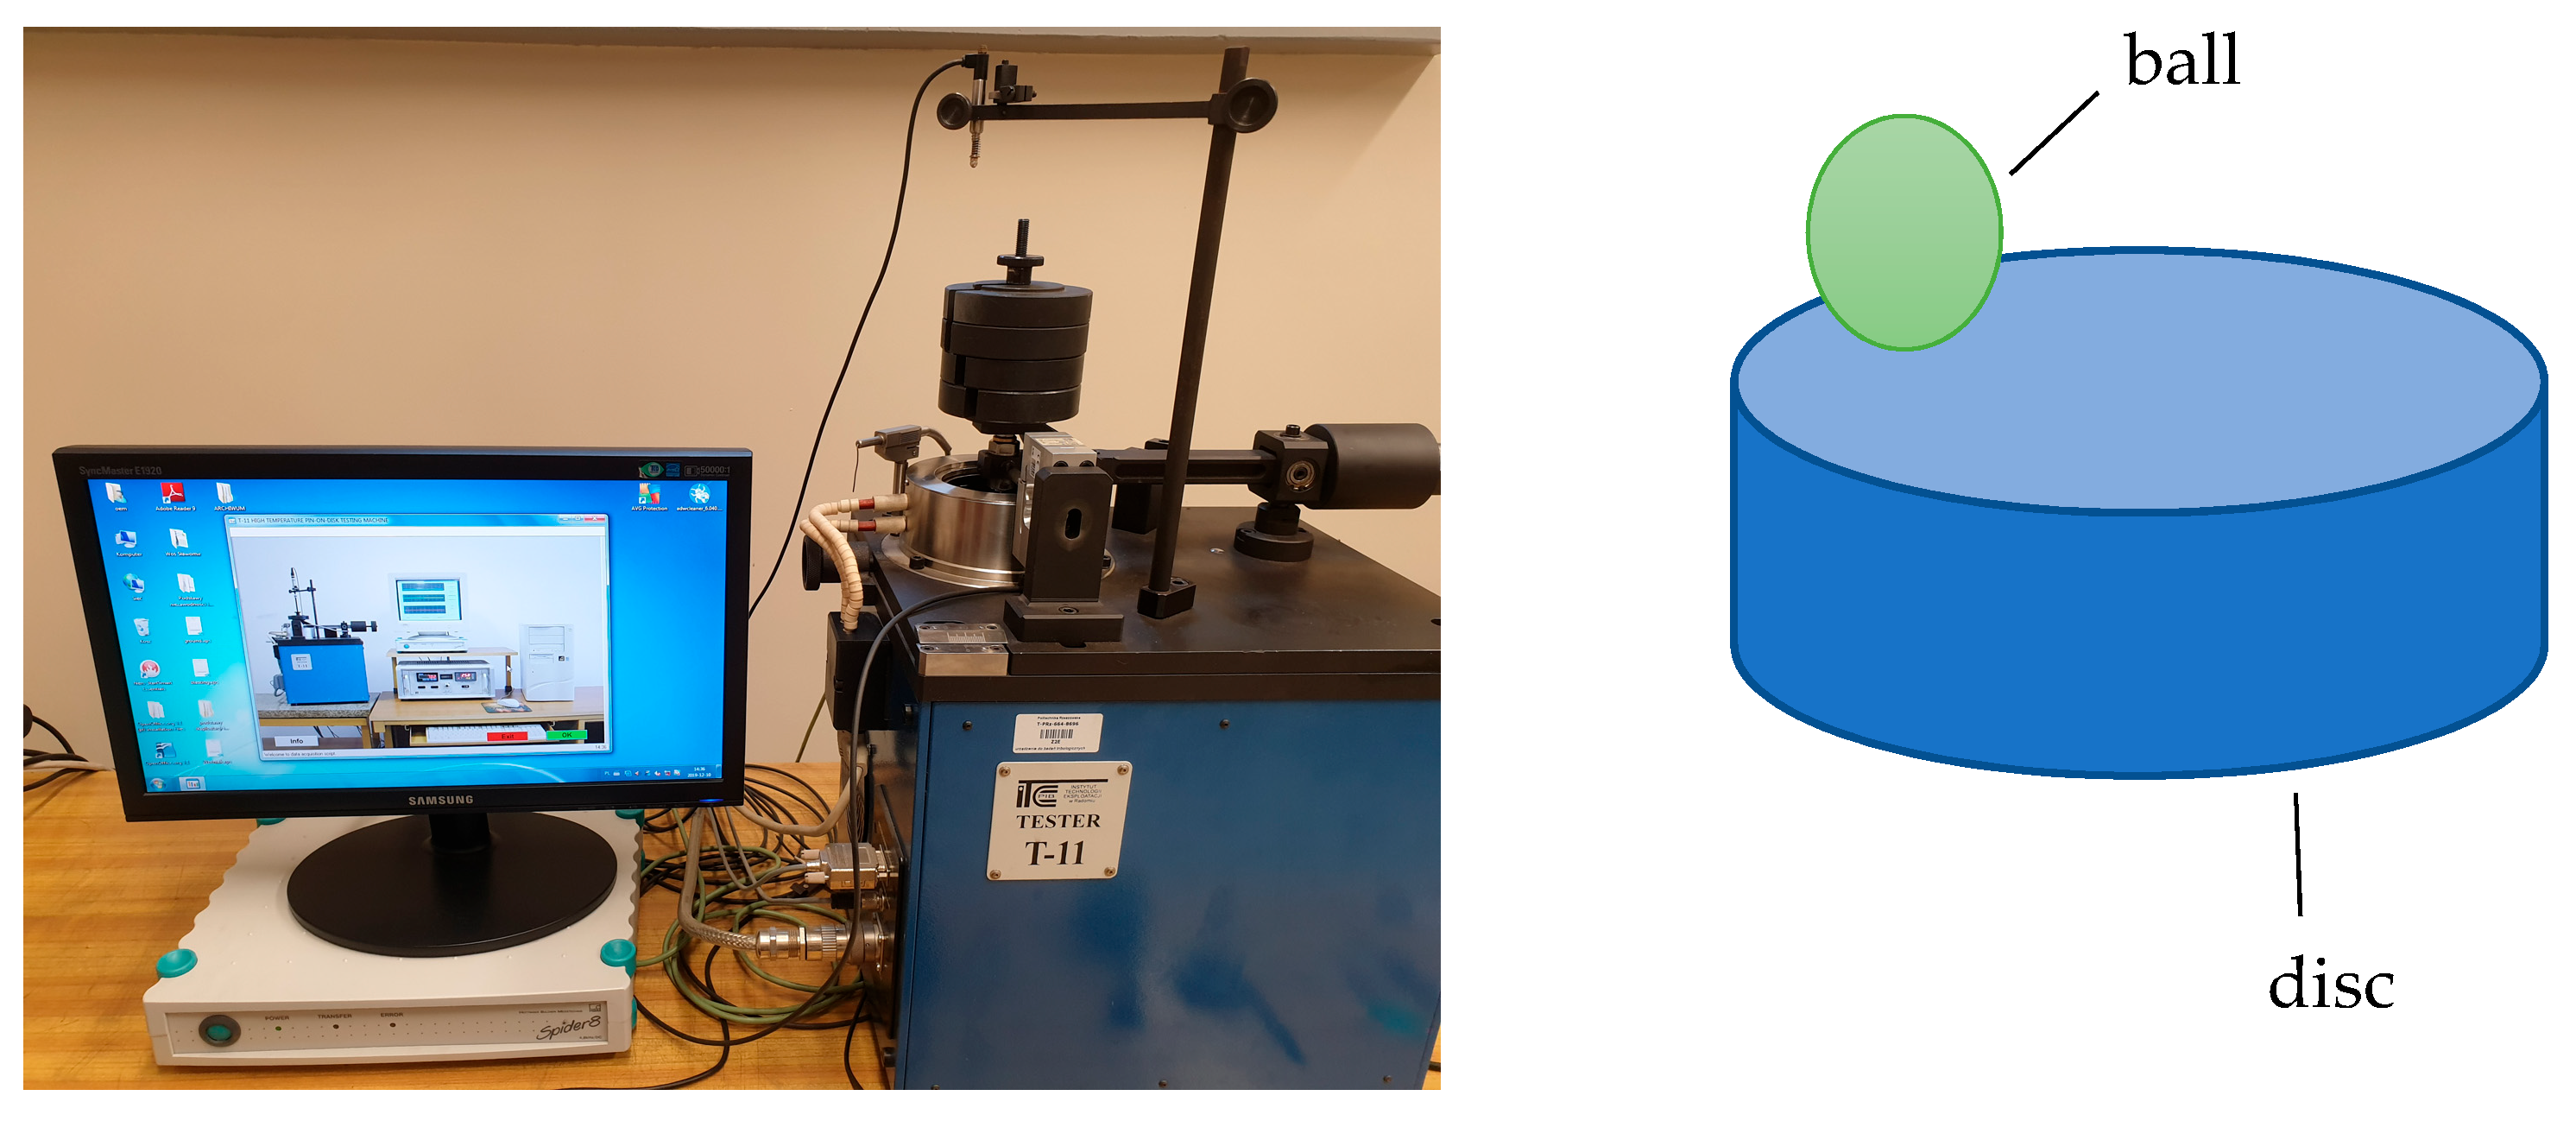
2. Materials and Methods

Roller burnishing tests were conducted at room temperature using the EG5 single roller burnishing tool (Figure 1). The single roller burnishing tool EG5 was chosen because it consists of a tool body equipped with a tool shank, a spring assembly that allows the roller head to move with no play and very low friction, and a gauge that indicates the burnishing force as measured by spring deflection. Other advantages of roller burnishing include, for example, short cycle time and elimination of set-up and auxiliary processing time, the fact that the process can be used on both conventional and CNC-controlled machines, long tool life, and low noise emission. The burnishing tool was installed in the chuck of a conventional lathe. Samples were prepared from 36CrNiMo4 alloy special steel of hardness 42 ± 2 HRC and had a diameter of 25 mm and a height of 8 mm. These dimensions enabled the use of samples in tribological tests. Before burnishing, samples were milled in other to obtain the Sa (arithmetical mean height of the surface) parameter equal to 0.87 µm. Figure 2 presents an isometric view of the milled surface and several surface topography parameters. A description of the parameters used can be found in [26,27] as well as some of them are presented in Appendix A. The roller burnishing process was performed using the parameters presented in Table 1. The rotational speed was set to 450 [rpm].
After burnishing, the surface topography of the samples was measured by a white light interferometer Talysurf CCI Lite. The measuring area was 3.3 × 3.3 mm and surface topography parameters were calculated using the TalyMap software according to [27]. The microhardness of burnished surfaces was measured using a Brivisor KL2 tester equipped with HME measuring electronics by means of a static indenter using the Vickers method with a constant load of 4.9 N. Then the sample with the lowest value of Sa parameter as well as with the largest values of microhardness was selected to tribological tests. Wear and friction investigations were performed in dry and lubrication contact conditions. Tests under starved lubrication conditions were carried out using L-AN 46 oil (viscosity index: 96). Before those tests, one drop of oil was applied to the contact zone of frictional pairs. Tribological tests were conducted using a tribological tester T-11 in a ball-on-disc configuration (Figure 3). Apart from 36CrNiMo4 steel discs, the frictional pairs consisted of stationary balls made of SiC of hardness 72 ± 2 HRC. Tribological tests were performed in accordance with the G 99—95a (reapproved 2000) standard—“Standard test method forwear testing with a pin-on-disk apparatus”.
Friction and wear experiments were performed using Taguchi’s L27 (33) orthogonal arrays [28]. The tests were carried out taking into account input factors such as load, sliding distance, and sliding speed. The levels of input parameters are presented in Table 2. The authors used the Minitab ver. 17 software (Minitab Inc., Pennsylvania, United States) for statistical analysis of the obtained results using the Taguchi method. All experiments were repeated three times.
The Taguchi method is based on the idea that the quality of a product or process can be improved by reducing the variation in its output caused by variations in its input factors. The Taguchi method is widely used in various industries, including manufacturing, engineering, and healthcare. This method consists of three stages: system design, parameter design, and tolerance design. The main advantages of the Taguchi method include:
  • Reduced variability;
  • Simplicity;
  • Robustness;
  • Customer satisfaction;
  • Cost-effectiveness.
The Taguchi method has been used by many engineers and researchers as an optimization technique and it uses a loss function to calculate the deviation between the experimental values and the desired values. This loss function is further converted into a signal-to-noise ratio (S/N) [29]. Usually, in the analysis of the S/N ratio, three types of quality characteristics are used, namely “the lower, the better”, “the higher, the better”, and “the nominal, the best”. The purpose of the research was to determine the minimum values of friction coefficient and wear; hence, “the lower, the better” quality characteristic was used.
During tests, the friction force was recorded as a function of time, and after tribological tests, the wear level of the discs was measured by a white light interferometer Talysurf CCI Lite. The measuring area was the same as in the case of measurements after burnishing and it was 3.3 × 3.3 mm. Measurements were made in four places, every 90 degrees. Then, the wear was calculated using a special method—the least squares method (Figure 4). In this method, the calculated volume is included between the bottom of the hole and the „P” plane, where the „P” plane is the least squares plane calculated on all the points outside of the contour drawn.
Scanning electron microscope (SEM) analysis was also performed to characterize the wear track patterns. The authors used a Phenom ProX microscope—one of the most advanced imaging models in the Phenom series. The Phenom ProX microscope is dedicated to easily acquire SEM images of the highest quality with magnification up to 350,000× and image resolution of less than 6 nm. What is more, the time from loading the sample up to acquiring the SEM image can be less than 1 min.

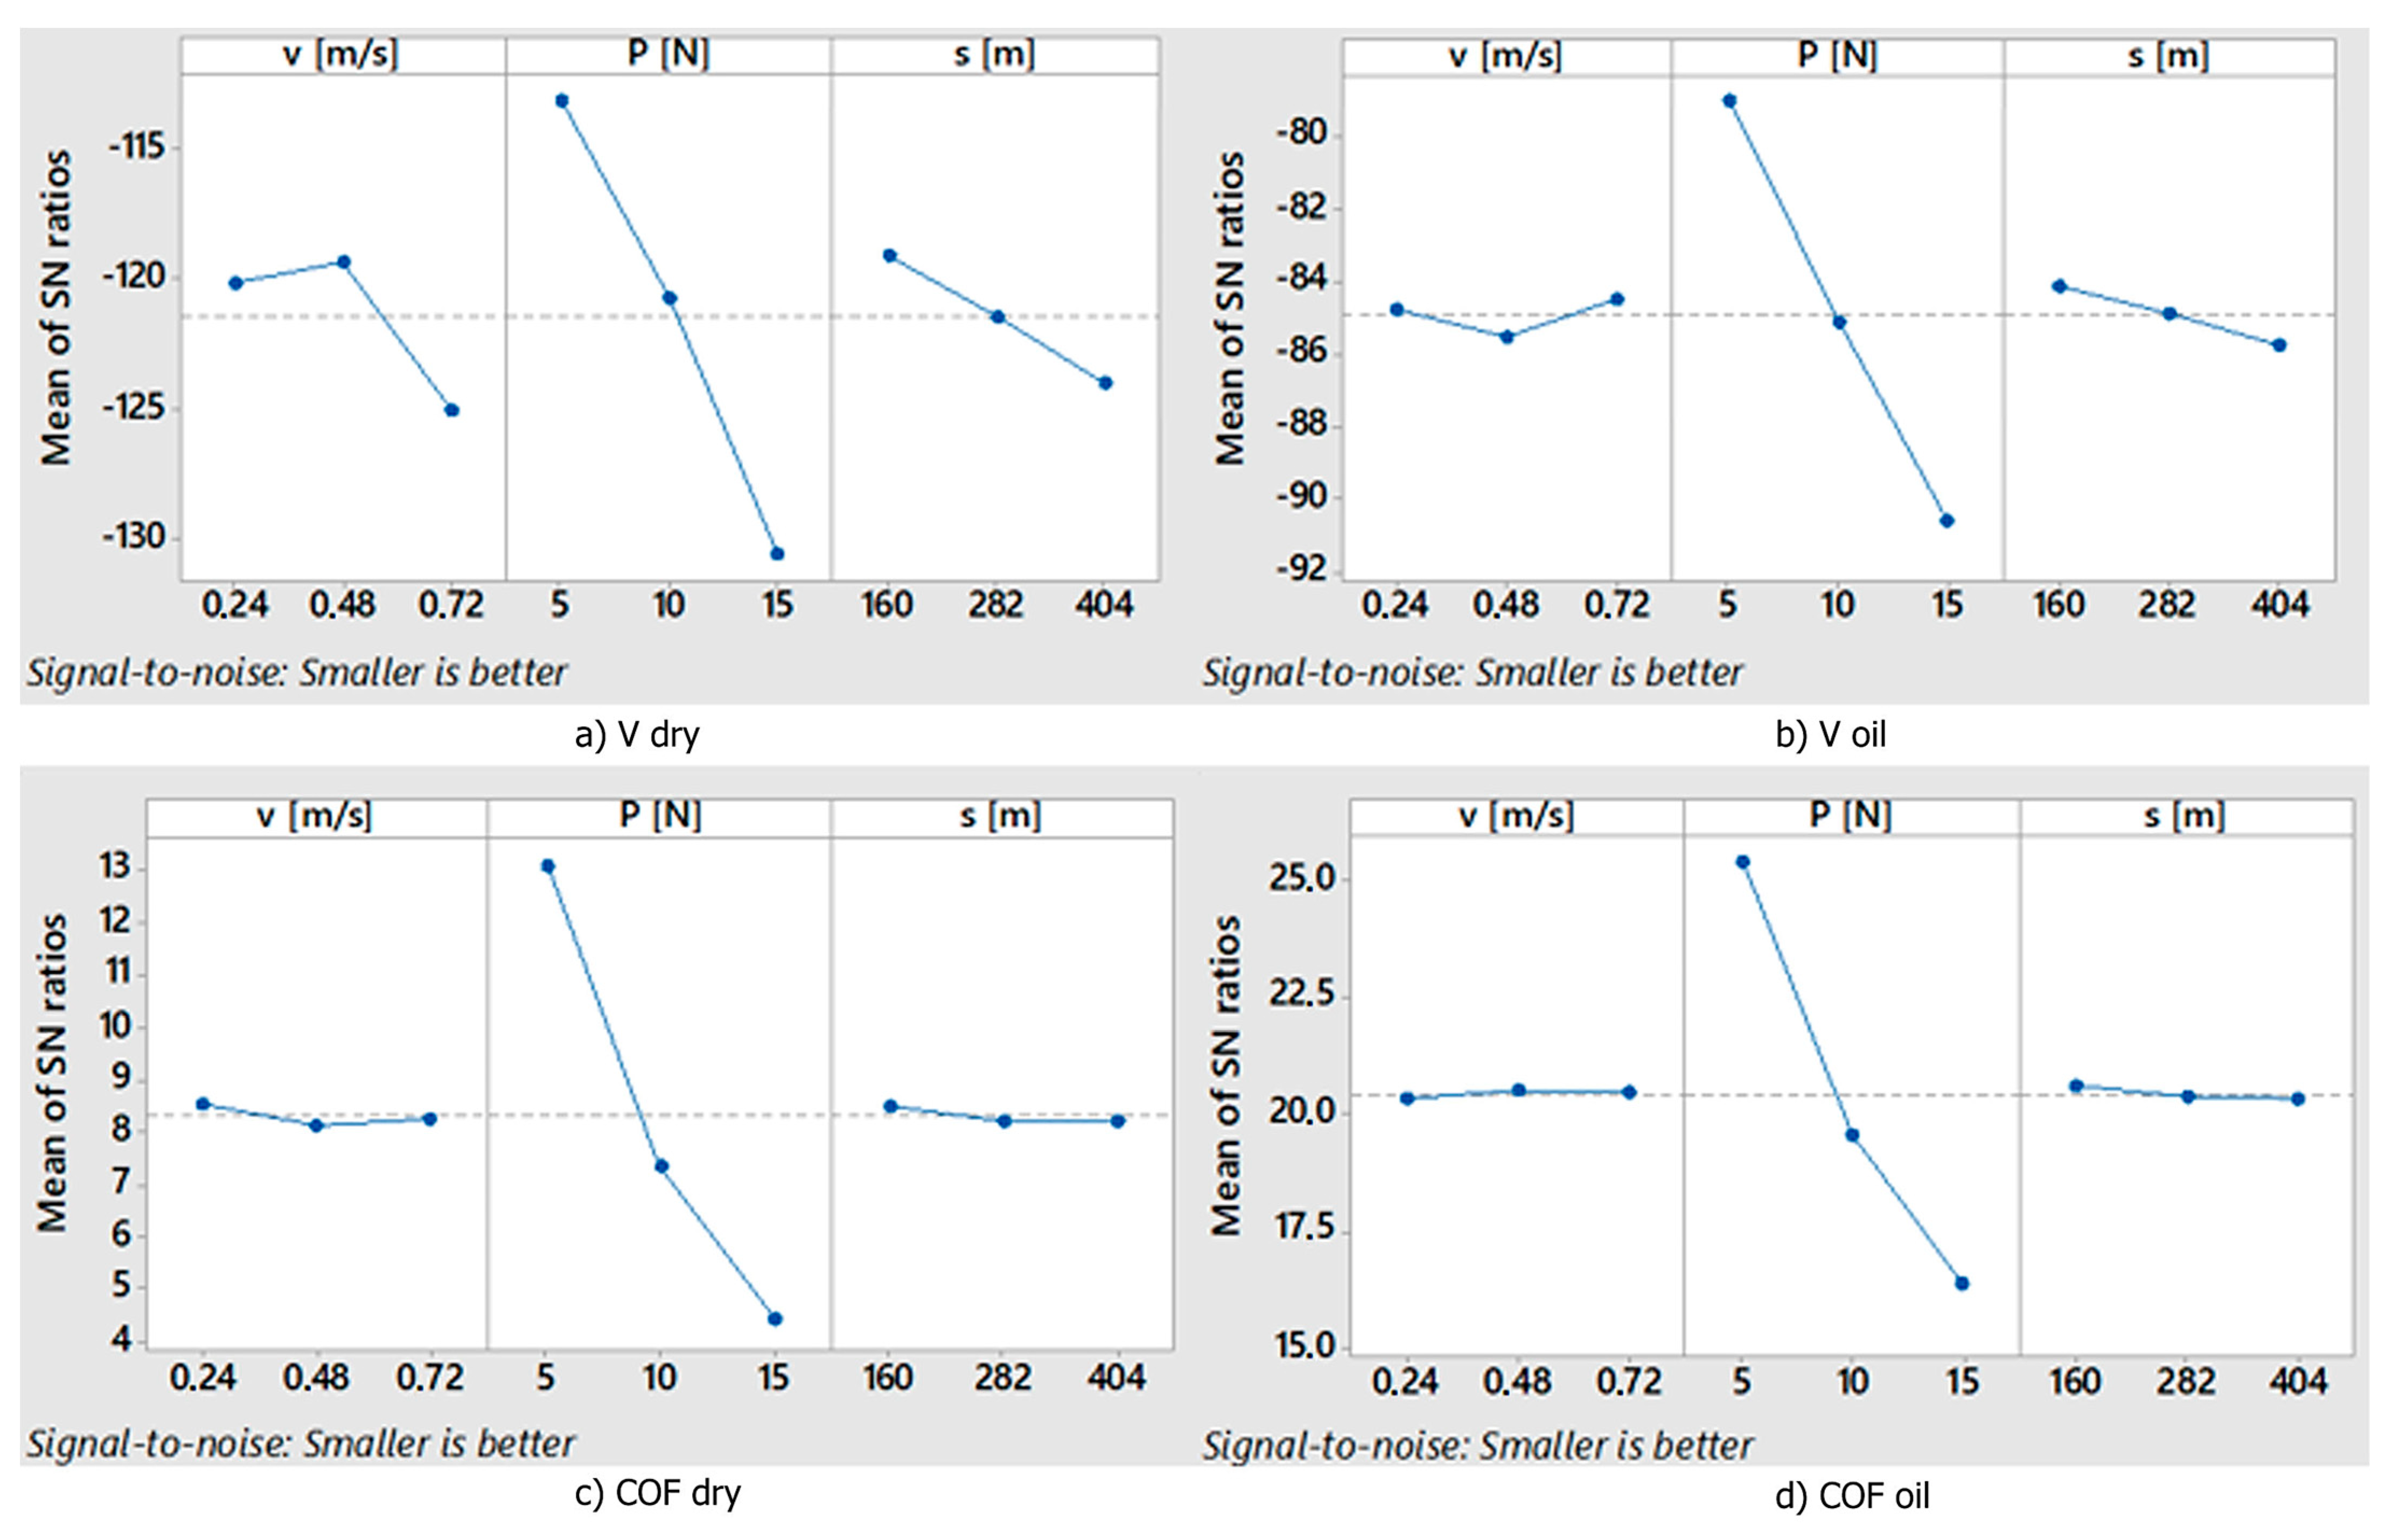
3. Results and Discussion

Table 3 presents the results of roller burnishing tests. The lowest value of arithmetical mean height Sa—0.317 µm was obtained when the value of the load was the highest (1350 N) and the feed was at an average level of 0.10 mm/rev (Figure 5). In addition, the value of the Sz parameter, in this case, was the smallest and amounted to 7.32 µm. Generally, surfaces after the roller burnishing process were characterized by negative values of skewness Ssk (from −2.12 to −2.97) and positive values of kurtosis Sku (from 8.4 to 12.1). Negative skewness means fairly deep valleys in a smoother plateau and positive kurtosis (over 3) indicates relatively many high peaks and low valleys located on the surface. The worst result in terms of surface smoothness was obtained in the case of variant 4, which was characterized by the following entry parameters: load: 850 N and feed 0.15 mm/rev. In this case, the Sa parameter was more than twice as large as in the most favorable variant. The surface with the lowest value of the Sa parameter was selected for further detailed tribological tests.
The surface was also characterized by the areal material ratio parameters: Sk (core roughness depth), Spk (reduced peak height), and Svk (reduced valley depth). The Spk parameter can provide information on the surface’s wear resistance during the running-in (the lower value of the Spk, the greater the wear resistance) whereas the Svk parameter characterizes the performance of the surface in a regime of lubrication. The roughness height Sk, however, determines the roughness height after running-in and characterizes surface properties in a steady-state period [30]. Sedlacek et al. [31] suggest that the Spk/Svk ratio is more important than the value of these parameters separately. In a selected surface topography, the Svk parameter was visibly larger than Spk, which made the tribological couples tend to reduce the coefficient of friction (especially with a negative value of the Ssk parameter).
Figure 6 shows the contour diagram (Figure 6a) and the density of the distribution of the data points in the burnished surface (Figure 6b). It can be seen that the roller-burnished surface has clearly smaller hills in relation to the valleys. The height of the highest surface summit from the mean surface Sp was 1.47 µm. In turn, the depth of the lowest surface pit from the mean surface Sv was 5.85 µm. Hence, the maximum height of the surface Sz, expressed as the sum of the height of the highest summit and the depth of the lowest pit of the surface, was 7.32 µm. The distribution of ordinates of the surface topography (Figure 6b) graphically presents the distribution of ordinate heights within the total surface depth and is equal to the statistical probability density function [32]. The nature of the ordinate distribution depends largely on the shape of the surface topography, and in particular on the change in the ratio of material and voids as a function of height. In the case of the burnished surface, the distribution of ordinates is similar to the normal distribution, with a visible negative skewness of the surface. We can also see that the greatest load capacity of the surface occurs at a depth of 0.371 µm.
Developed interfacial area ratio Sdr is defined as the ratio of the increment of the boundary area in the area of definition to the size of the area of definition [33]. This parameter is used as a measure of surface complexity, especially in the case of comparisons of surface conditions between individual treatments [34]. This parameter largely depends on the measurement conditions. Most often it takes values in the range from 0 to 10%. In the case of a flat real surface, Sdr = 0. As a result of the roller burnishing process, this parameter reached the value of 0.373%. Such values of the Sdr parameter (less than 1%) are characteristic of smooth finishing treatments such as honing, lapping, polishing, etc.
Additional information on the fluid retention can be acquired using a special function of „MountainsMap” software called vectorization of micro-valleys network (Figure 7). The software allows you to determine three important parameters: the maximum and average depths of the furrows and their density. The maximum depth of the grooves on the burnished surface was 5.18 μm, with a visible density of furrows—315 cm/cm2. On the basis of the vector distribution of microgrooves, the surface structure can also be assessed. The analysis confirmed previous observations about the anisotropic nature of the surface.
Averaged power spectral density function (PSD) is the Fourier transform of the autocorrelation function and illustrates how the surface irregularity deviation is distributed with the surface frequency. The PDS is very sensitive to all disturbances of the generated surfaces appearing in the machining system [35]. For surface analysis using this function, the actual machining marks are assumed to be perpendicular to the orientation of the power spectral density. The PSD spectrum of the roller-burnished surface is shown in Figure 8. The distribution contains visible one low-frequency component with a wavelength similar to the feed rate of 0.118 mm and the amplitude of 0.25 µm.
Table 3 also shows that mainly the increase in load improves the microhardness. The influence of other input parameters of the roller burnishing process was small. The number of tool passes may also be of significant importance for the changes in microhardness [36]. However, in the present work, the assumed value of the Sa parameter was obtained after just one pass of the tool.
The results of tribological tests are presented in Table 4. For each entry parameter, the coefficient of friction and wear volume in dry sliding conditions (COF dry and V dry), as well as the coefficient of friction and wear volume in starved lubrication conditions (COF oil and V oil), were calculated. From Table 4, it is evident that values of the tribological parameters characterizing dry sliding contact were much higher than in starved lubrication contact conditions. Wear volume results show that sample 10 (dry contact) and sample 19 (lubricated contact) with a load of 5 N and sliding distance of 160 m obtained the minimum volumetric wear, whereas samples 27 (dry contact) and 18 (lubricated contact) with a load of 15 N and sliding distance of 404 m had the maximum wear volume. This clearly indicates the influence of load and sliding distance on the volumetric wear of the investigated steel. The variability of the wear volume ranged between 232,636 and 6,179,705 µm3 in dry contact conditions. That variability was smaller in lubricated contact and achieved the range between 6186 and 41,321 µm3. The lowest average value of the coefficient of friction was recorded for sample 2 (dry contact) and sample 10 (lubricated contact). On the other hand, samples 26 (dry contact) and 16 (lubricated contact) achieved the largest values of COF. The most important parameter influencing the changes in the value of the friction coefficient was load. At the beginning of the tests, the coefficient of friction increased rapidly and obtained a steady-state value after the sliding distance of 20–50 m. The reasons for higher COF in the running-in period may be the low value of surface roughness [37] and the fact that the static friction is higher than the dynamic friction [38]. With a low value of surface roughness, the sample and counter-sample are quickly matched in the ball-on-disc contact. The variability of the friction coefficient ranged between 0.199 and 0.646 in dry contact conditions as well as between 0.048 and 0.157 when the contact was lubricated.
The S/N response tables for wear volume and coefficient of friction are presented in Table 5 and Table 6. These tables show the calculated S/N ratios for each level of control factor. The response table contains ranks based on Delta statistics that compare the relative magnitude of effects. The higher the delta value, the greater influence of the factor. The analysis of Table 5 and Table 6 shows that the load has the strongest influence on wear volume and coefficient of friction, regardless of the test conditions. The influence of other input parameters is slightly less visible. The graphs for S/N ratios are shown in Figure 9. The graphs allow you to easily read the parameters responsible for minimizing the wear volume and friction coefficient. In the case of volumetric wear, the most important input parameter turned out to be load, followed by sliding speed and sliding distance (dry contact conditions) and load then sliding distance and finally sliding speed (in lubricated contact). The load was also the most important parameter for the coefficient of friction. Under dry friction conditions, the next parameters after load were the sliding speed and sliding distance. On the other hand, in lubricated contact conditions the order was reversed. The lowest values of volumetric wear and coefficient of friction were obtained for the following parameters:
-
v = 0.48 m/s; P = 5 N; s = 160 m for wear volume under dry sliding conditions;
-
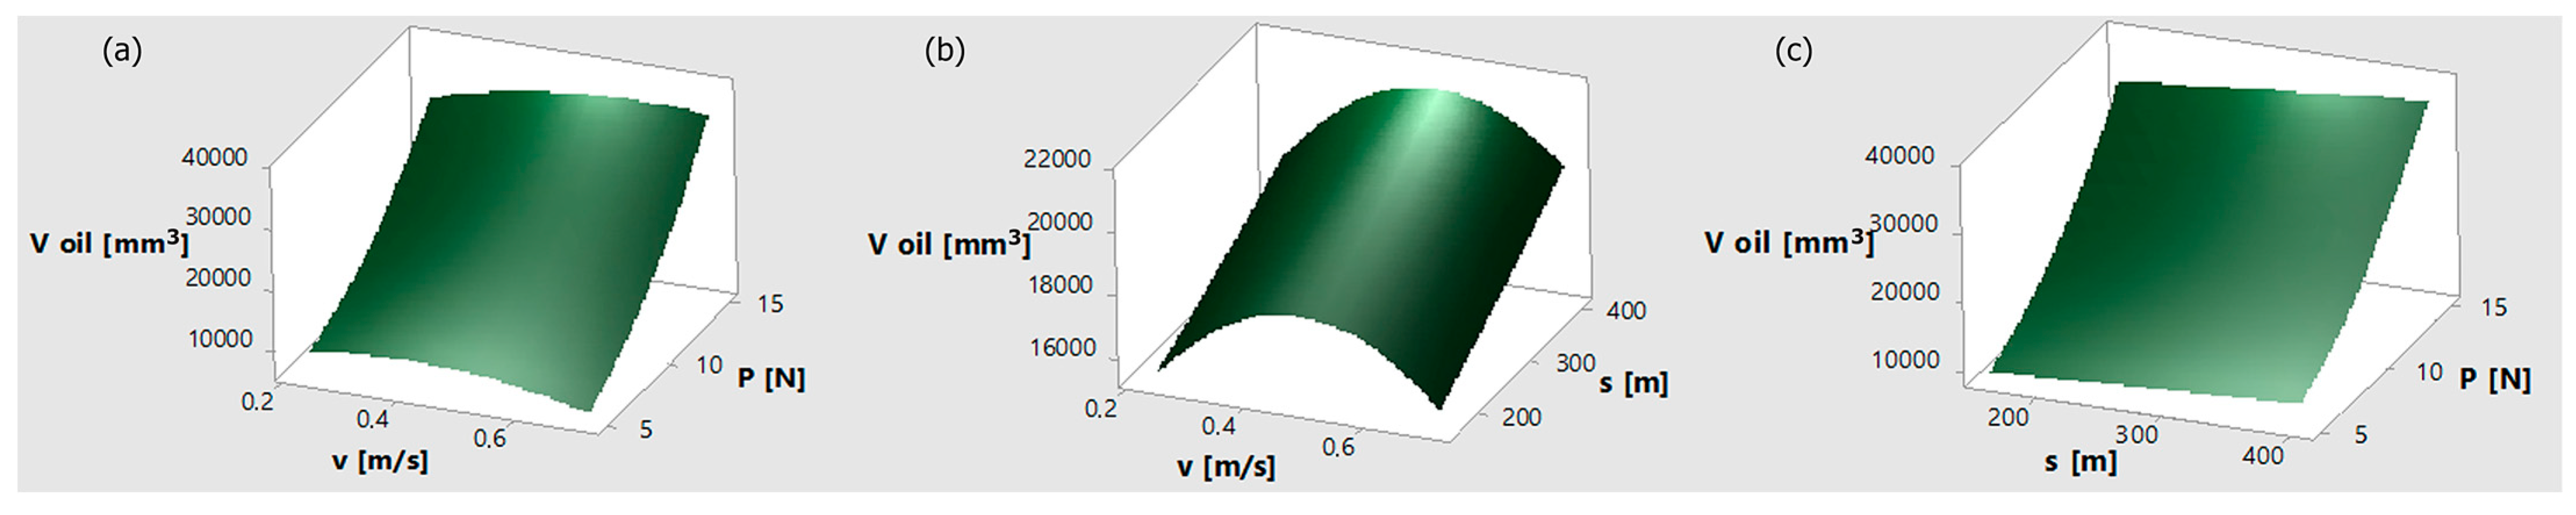
v = 0.72 m/s; P = 5 N; s = 160 m for wear volume under lubricated sliding conditions;
-
v = 0.24 m/s; P = 5 N; s = 282 m for friction coefficient under dry sliding conditions;
-
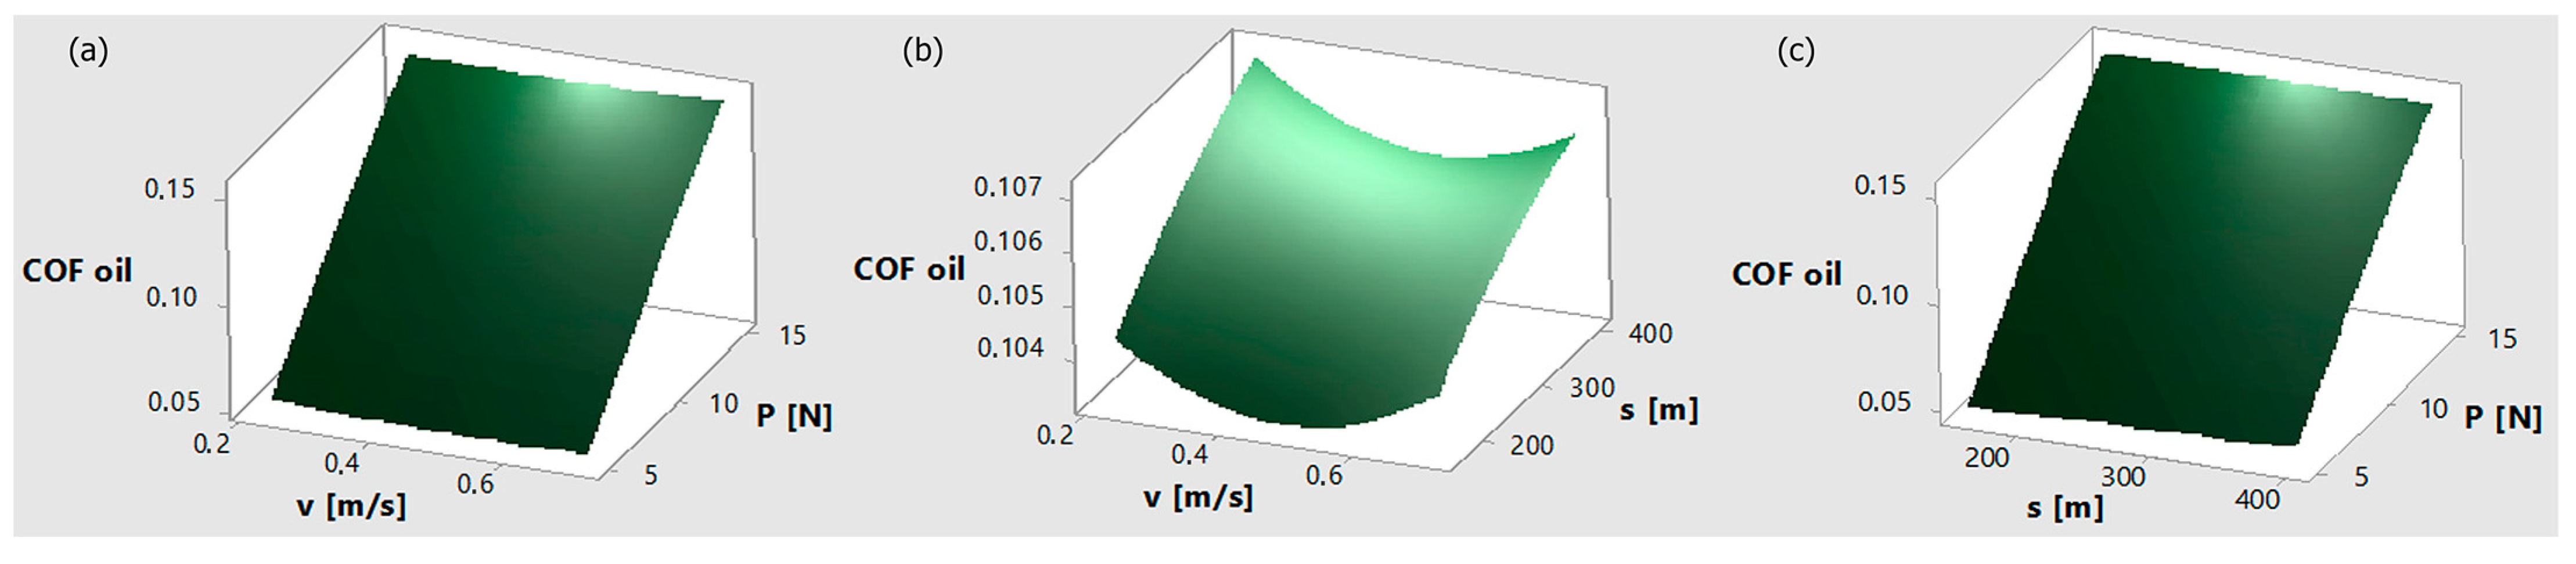
v = 0.48 m/s; P = 5 N; s = 160 m for friction coefficient under lubricated sliding conditions.
The variation of wear volume and coefficient of friction between tribological process parameters are shown in Figure 10, Figure 11, Figure 12 and Figure 13 in the form of graphs for dry and lubricated contact conditions. Figure 10a and Figure 11a illustrate the influence of sliding speed and load on the volumetric wear of the discs. It can be seen from the graph that wear volume raises with a rise in load for both sliding conditions. A similar situation was observed in the case of friction coefficient (Figure 12a and Figure 13a). The influence of the sliding speed on the changes in the amount of wear volume compared to the load was small.
Figure 10b and Figure 11b present the influence of the sliding speed and sliding distance on the volumetric wear of the discs. It can be noticed from the plots that the volumetric wear was slightly raised with a rise in the sliding distance, and these changes are primarily visible in the dry friction tests. The impact of sliding speed is ambiguous. In the case of dry contact conditions, the increase in sliding speed resulted in a gradual increase in wear volume. On the other hand, under lubricated contact conditions, the highest volumetric wear was recorded for the central value of the sliding speed. The influence of sliding speed and sliding distance on the coefficient of friction is presented in Figure 12b and Figure 13b. In the case of lubricated contact conditions, volumetric wear raises with a rise in sliding distance and obtains the smallest values at the middle value of sliding speed. Under dry contact conditions, the largest coefficient of friction was observed around central values of sliding speed and sliding distance.
How the load and sliding distance affect changes in the wear volume is presented in Figure 10c and Figure 11c. It is visible that the influence of load is dominant. On the other hand, an increase in sliding speed caused a slight increase in wear volume mainly in dry contact conditions. Similar effects were observed with a coefficient of friction (Figure 12c and Figure 13c): adominant effect of load and a marginal effect of sliding distance.
The steady-state value of the friction coefficient corresponded to the fixed value of the friction force. In the initial phases of the study, the friction force increased rapidly and reached a stable value, usually after 20–50 m of sliding distance. Such a quick achievement of a stable value was the result of the low surface roughness of burnished elements. What is more, the higher the normal load, the less time it took to reach steady friction [39]. The third law of friction, which states that friction is independent of sliding speed, is not generally valid and friction may increase or decrease as a result of changes in sliding speed for different material combinations [40]. In the tests carried out, the minimum effect of the sliding speed on changes in the value of the friction coefficient was obtained, both in dry and lubricated contact conditions.
Anova analysis can also be used to determine the process parameters that have the greatest impact on the tribological characteristics. Anova results obtained for V dry, V oil, COF dry, and COF oil are presented in Table 7, Table 8, Table 9 and Table 10. From Table 7, it was found that V dry is significantly influenced by load followed by sliding speed and sliding distance. The percentage contribution of load, sliding speed, and sliding distance on V dry was 79.88%, 11.39%, and 6.19%, respectively. The influence of the interaction of input parameters was minimal. In addition, Table 8, Table 9 and Table 10 show that the applied load is the primary factor influencing the tribological properties. In the case of the friction coefficient (COF dry, COF oil), the percentage of other input factors was below zero. Only in the case of V oil was the contribution of the sliding distance and the load*sliding speed interaction above one percent, amounting to 1.89% and 2.42%, respectively.
Regression analysis was performed to predict the wear volume and coefficient of friction under dry and lubricated contact conditions. Equations (1)–(4) give the regression equations (mathematical models) for wear volume (V dry and V oil) and coefficient of friction (COF dry and COF oil) depending on the test conditions.
Wear volume under dry sliding conditions:
V   dry = 6,255,316 16,672,442   v   809,574   P 2414   s + 14,482,186   v 2 + 38,484   P 2 2.3   s 2 + 433,633   v   P        + 4139   v s + 632   P s 221   v P s
Wear volume under lubricated sliding conditions:
V   oil = 2999 + 29508   v 996   P + 6.2   s 42116   v 2 + 138.3   P 2 + 0.0056   s 2 +   1031   v P   8.5   v s + 0.01   P s        + 1.64   v   P   s
Friction coefficient under dry sliding conditions:
COF   dry = 0.144 + 0.273   v +   0.0502   P + 0.000568   s 0.248   v 2 0.000731   P 2   0.000001   s 2 0.0002   v P 0.000159   v s + 0.000002   P   s + 0.000014   v P s
Friction coefficient under lubricated sliding conditions:
COF   oil =   0.0186 + 0.0038   v + 0.01322   P + 0.000089   s + 0.0183   v 2 0.000091   P 2 0.00213   v   P 0.000105   v   s 0.000007   P s   + 0.000010   v   P   s
Figure 14 shows the scatter graphs between experimental (grey line) and predicted (blue line) results for wear volume and coefficient of friction under dry and lubricated contact conditions. These results demonstrate good agreement between experimental and predicted results. The coefficient of determination of the regression models for wear volume in dry and lubricated conditions was 0.93 and 0.98, coefficient of friction in dry and lubricated conditions was 0.99 and 0.98.
The confirmation test was also conducted to validate the results based on the models. Table 11 and Table 12 show the results of confirmation tests for wear volume and coefficient of friction, respectively. The improvements in S/N ratios from initial to optimal levels are about 10% and 12% for V dry and V oil and about 38% and 25% for COF dry and COF oil, respectively. Therefore, friction and wear performances are improved by using Taguchi method.
The scanning electron microscope anaysis was carried out on the samples after the tribological testing was completed. SEM images of worn surfaces created during tribological tests are shown in Figure 15. The images were taken at different magnification, while the figure shows those with a magnification of 1100×. Figure 15a,c present surfaces generated in lubricated contact conditions characterizes by the largest (Figure 15a) and the lowest (Figure 15c) wear volume. Similarly, Figure 15b,d show worn out surfaces created in dry contact conditions—Figure 15b with the largest and Figure 15d with the lowest volumetric wear.
The analyzed SEM images clearly show larger wear scars of 36CrNiMo4 alloy steel under dry sliding conditions than in lubricated contact. The presence of areas with grooves and plastic deformation was observed on the worn surfaces. In addition, deep and wide surface furrows indicate the predominant abrasive character of wear. During the friction process, surface irregularities on the surface of the rotating steel disc are in contact with the ball surface. Due to the significant difference in the hardness of the 36CrNiMo4 alloy steel and the ball, the irregularities of the mating surfaces are pressed into the sample and its soft surface is scratched. A similar worn surface morphology confirming the wear mechanism in boundry lubricated contact conditions was found by Yin et al. [41], who studied the wear of the steel–bronze frictonal pairs. The relatively high hardness of the steel counter-body (HRC = 56), the presence of lubricant, and the low roughness of the surfaces of the bronze specimens minimize the likelihood of micro-junction on the surfaces minimizing the adhesion component of friction, hence reducing wear.
In addition (especially in dry contact conditons), the presence of wear debris formed due to the abrasion induced by the sliding of a harder ball on the softer surface of steel disc indicates a more complex abrasive–adhesive character of wear with plastic deformations of the asperities. At the similar load, surfaces with low roughness and higher microhardness tend to expand their elastic strain zones. In the context of adhesive wear, the friction of hard metals is slighty less than that of softer metals partly due to the reduced ductility of the metal junctions, which reduces junction growth [42,43].
In many cases, wear debris can be a very useful diagnostic tool for analyzing the wear mechanism. In our work carried out at ambient temperature, the wear debris was mostly in the form of a metallic wear particles but some powder particles were also found, which may indicate that in addition to abrasion, a delamination process takes place. However, as noted by the authors of [44,45], this situation may change in the studies at the evaluated temperatures.

4. Conclusions

Friction and wear behavior of 36CrNiMo4 alloy steel at ambient temperature in dry and lubricated sliding conditions according to the Taguchi method was tested in the present study. The following conclusions were drawn from the above results and analysis:
The research results show that the load is the most dominant factor influencing the wear volume and coefficient of friction regardless of sliding conditions. The load was followed by sliding distance (in the case of volumetric wear) and the sliding speed (in the case of the friction coefficient).
Signal-to-noise ratio analysis shows that the parameter combination (load (level 1), sliding speed (level 2), sliding distance (level 1) and load (level 1), sliding sdistance (level 1), sliding speed (level 3)) resulted in minimum wear volume in dry and lubricated contact conditions. On the other hand, the combination of parameters (load (level 1), sliding speed (level 1), sliding distance (level 2) and load (level 1), sliding distance (level 1), sliding speed (level 2)) resulted in minimum coefficient of friction in both test conditions, respectively.
The results of the Anova also show that load is the most critical significant factor for both wear volume and friction coefficient in dry and lubricated contact conditions. The influence of sliding speed and sliding distance was smaller and influence of interaction of input parameters was minimal.
Regression models were developed. They showed a high agreement of the results obtained in the experiment with the results calculated from the models.
As a result of the co-action between the sliding elements, new disc surface textures were created. Predominant abrasive character of wear was found. What is more, the presence of wear debris formed during friction process indicates a more complex abrasive–adhesive character of wear with plastic deformations of the asperities. The wear of ball was significantly smaller than wear o disc.

Author Contributions

Conceptualization, A.D., N.S., and N.T.; methodology, A.D.; software, A.D.; validation, N.S., N.T., and A.D.; formal analysis, N.S. and N.T.; investigation, A.D., N.S., and N.T.; resources, N.S. and N.T.; writing—original draft preparation, A.D., N.S., and N.T.; writing—review and editing, A.D., N.S., and N.T. All authors have read and agreed to the published version of the manuscript.

Funding

This research received no external funding.

Data Availability Statement

The data presented in this study are available on request from the corresponding author.

Conflicts of Interest

The authors declare no conflict of interest.

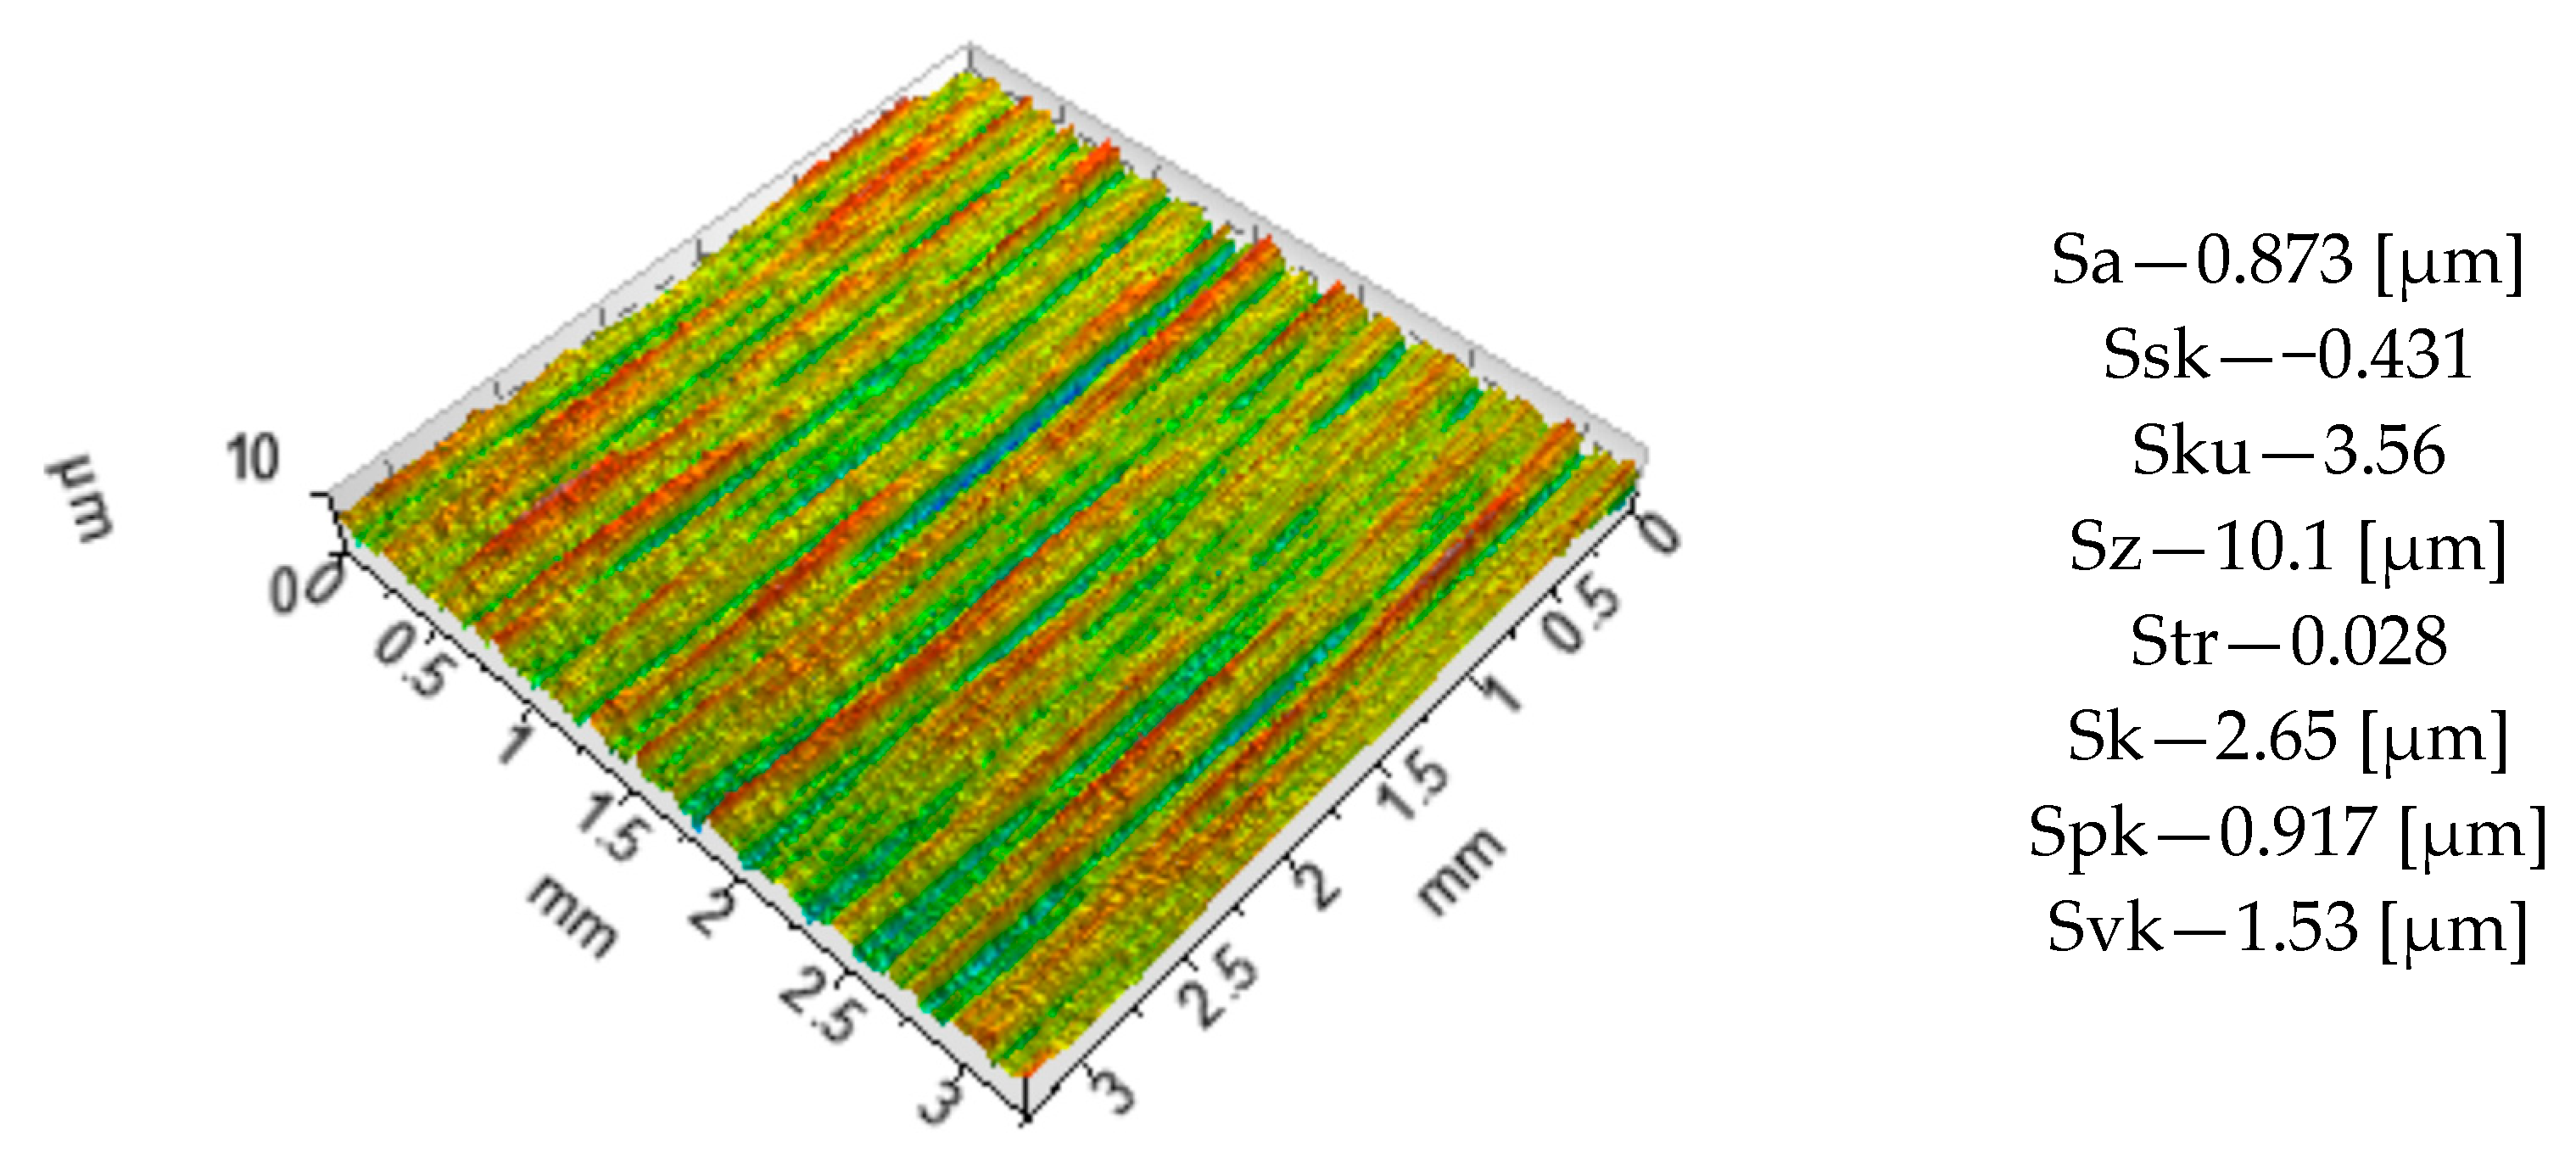
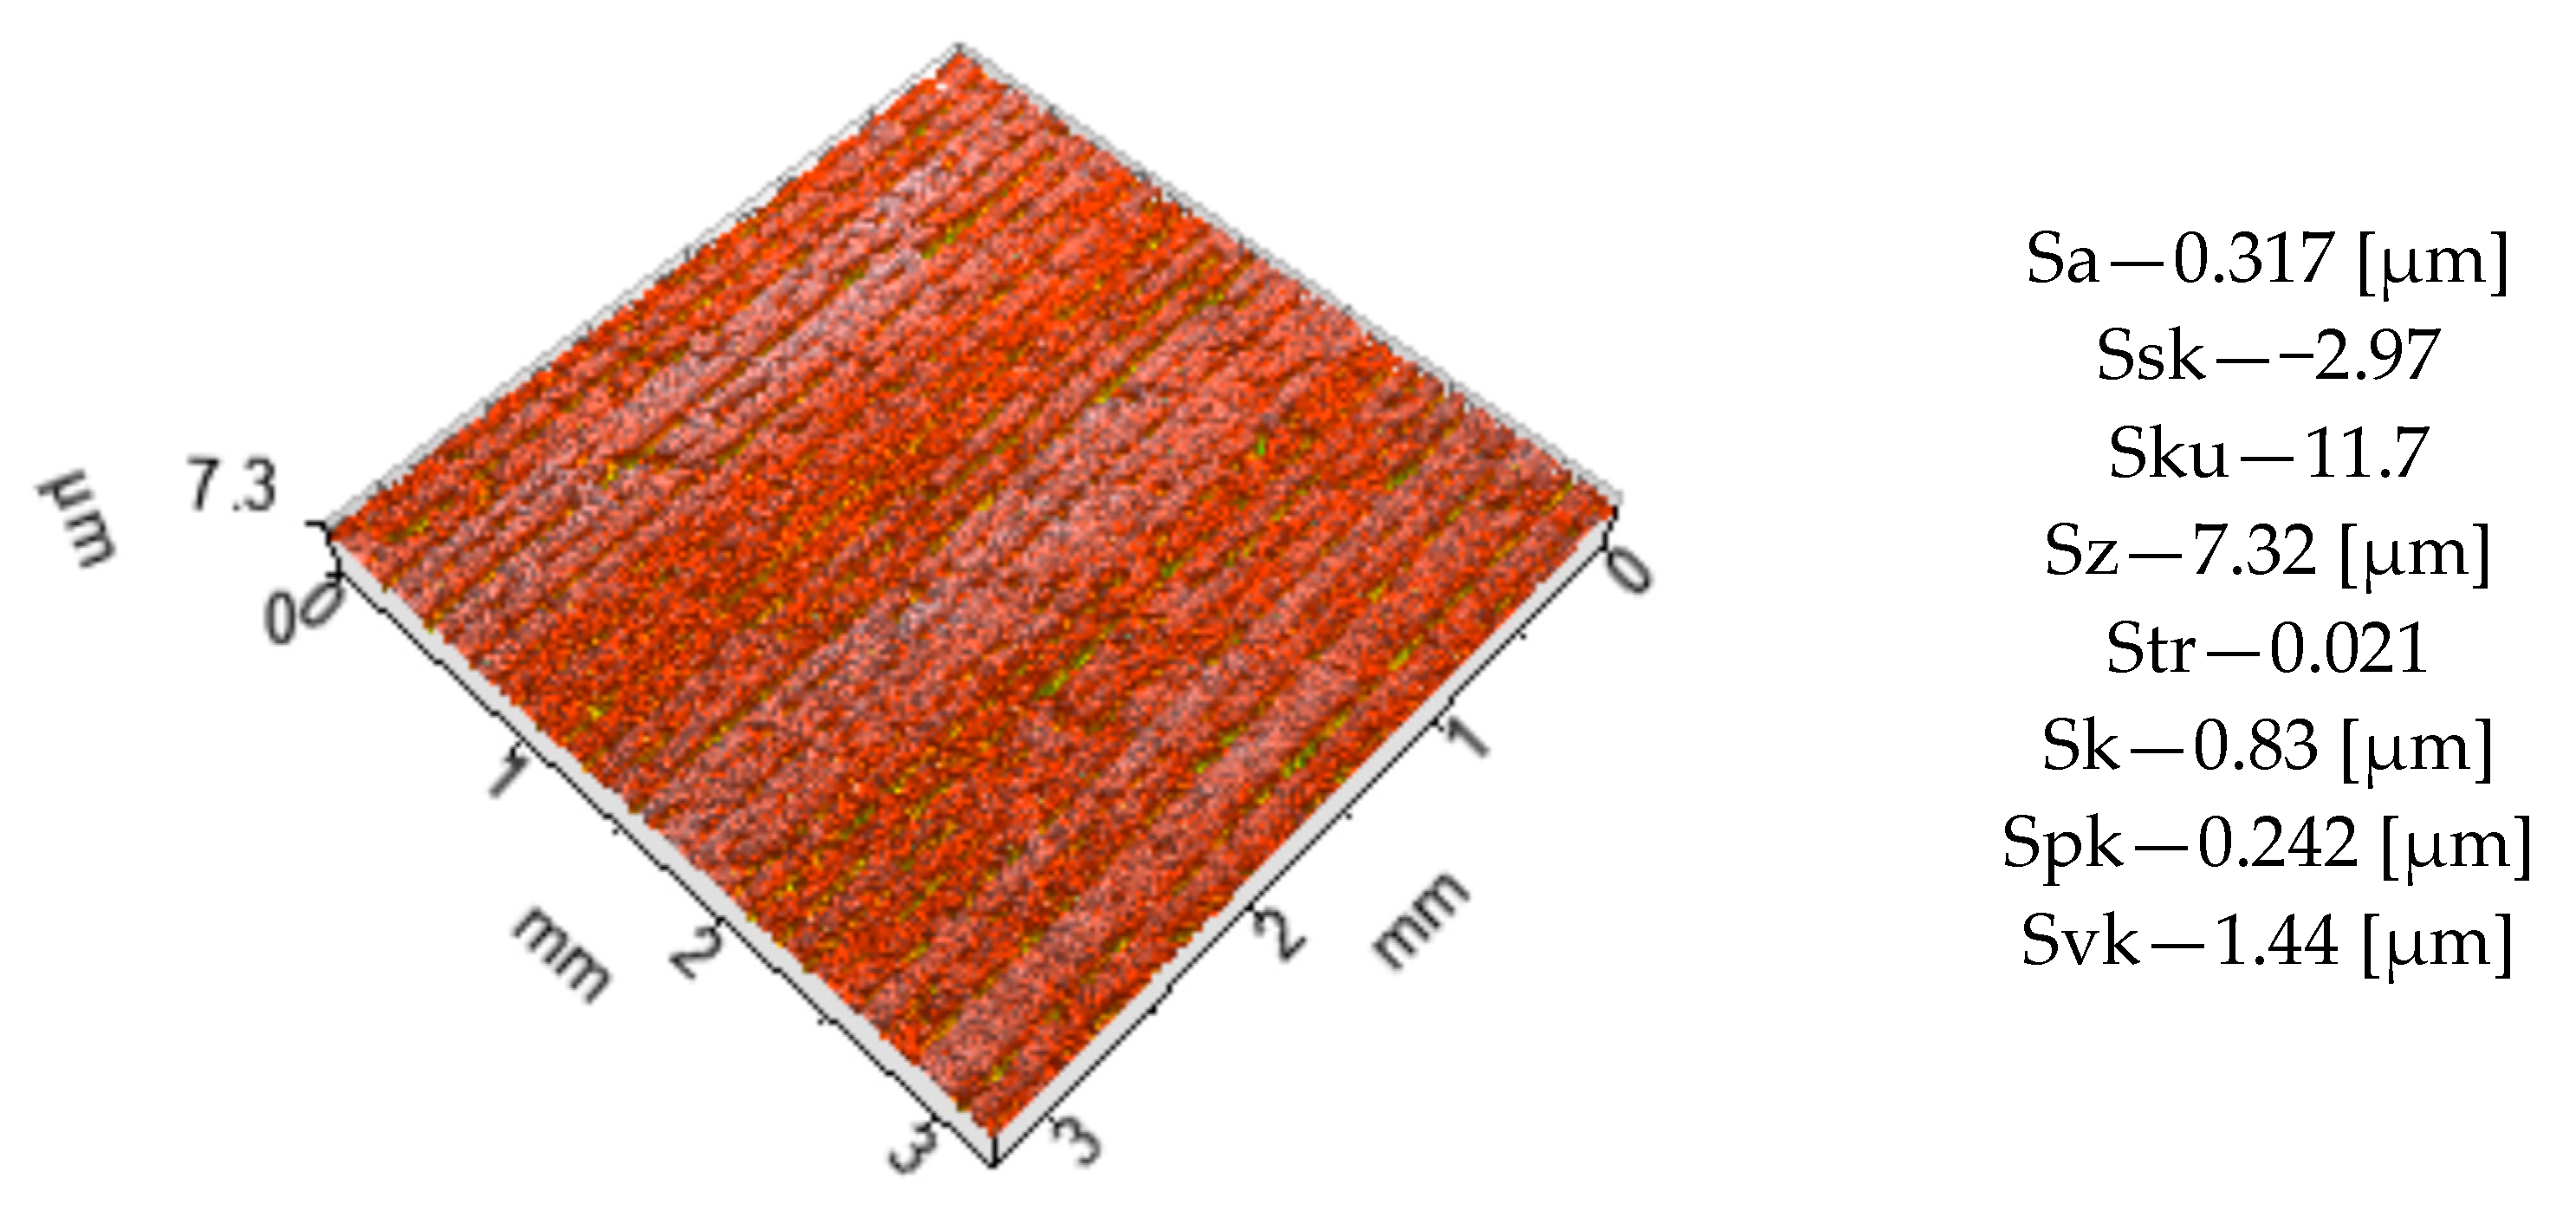
Appendix A. Surface Topography Parameters [24]

  • Sa [µm], Arithmetic Mean Height
The arithmetic mean height or Sa parameter is defined as the arithmetic mean of the absolute value of the height within a sampling area.;
Sa = 1 A A z x , y dxdy
  • Sq [µm], R oot Mean Square Height
The root mean square height or Sq parameter is defined as the root mean square value of the surface departures, z(x,y), within the sampling area, A.
Sq = 1 A A z 2 x , y dxdy
  • Ssk, Skewness
Skewness is the ratio of the mean of the height values cubed and the cube of Sq within a sampling area,
Ssk = 1 Sq 3 1 A A z 3 x , y dxdy
  • Sku, Kurtosis
The Sku parameter is a measure of the sharpness of the surface height distribution and is the ratio of the mean of the fourth power of the height values and the fourth power of Sq within the sampling area,
Sku = 1 Sq 4 1 A A z 4 x , y dxdy
  • Sz [µm], Maximum height of the surface
  • Str, Texture aspect ratio
Str parameter is a measure of the spatial isotropy or directionality of the surface texture.
  • Sk [µm], Core roughness depth
Sk parameter is a measure of the “core” roughness (peak-to-valley) of the surface with the predominant peaks and valleys removed.
  • Spk [µm], Reduced peak height,
Spk parameter is a measure of the peak height above the core roughness
  • Svk [µm], Reduced valley depth
Svk parameter is a measure of the valley depth below the core roughness.

References

  1. Swamidass, P.M. Machine reliability. In Encyclopedia of Production and Manufacturing Management; Springer: Boston, MA, USA, 2020. [Google Scholar]
  2. Gevorkyan, E.; Prokopiv, M.; Rucki, M.; Morozow, D. Durability and exploitation performance of cutting tools made out of chromium oxide nanocomposite materials. Eksploat. Niezawodn. 2019, 21, 686–691. [Google Scholar] [CrossRef]
  3. Yuanfan, Y. The study on mechanical reliability design method and its application. Energy Procedia 2012, 17, 467–472. [Google Scholar] [CrossRef]
  4. Du, C.; Sheng, C.; Liang, X.; Rao, X.; Guo, Z. Effects of temperature on the tribological properties of cylinder-liner piston ring lubricated with different oils. Lubricants 2023, 11, 115. [Google Scholar] [CrossRef]
  5. Zhang, H.; Etsion, I. Evolution of adhesive wear and friction in elastic-plastic spherical contact. Wear 2021, 478, 203915. [Google Scholar] [CrossRef]
  6. Adak, D.K.; Pal, V.; Das, S.; Ghara, T.; Joardar, H.; Alrasheedi, N.; Haldar, B. Surface preparation for coating and erosion MRR of SS 304 using silicon carbide abrasive jet. Lubricants 2023, 11, 10. [Google Scholar] [CrossRef]
  7. Lenart, A.; Pawlus, P.; Dzierwa, A.; Sęp, J.; Dudek, K. The effect of surface topography on dry fretting in the gross slip regime. Arch. Civ. Mech. Eng. 2017, 17, 894–904. [Google Scholar] [CrossRef]
  8. Priyadarsini, C.; Venkata Ramana, V.S.N.; Aruna Prabha, K.; Swethaa, S. A review on ball, roller, low plasticity burnishing process. Mater. Today Proc. 2019, 18, 5087–5099. [Google Scholar] [CrossRef]
  9. Barahate, V.; Govande, A.R.; Tiwari, G.; Sunil, B.R.; Dumpala, R. Parameter optimization during single roller burnishing of AA6061-T6 alloy by design of experiments. Mater. Today Proc. 2022, 50, 1967–1970. [Google Scholar] [CrossRef]
  10. Aviles, R.; Albizuri, J.; Rodrıguez, A.; De Lacalle, L.L. Influence of low-plasticity ball burnishing on the high-cycle fatigue strength of medium carbon AISI 1045 steel. Int. J. Fatigue 2013, 55, 230–244. [Google Scholar] [CrossRef]
  11. Sunny, S.; Mathews, R.; Yu, H.; Malik, A. Effects of microstructure and inherent stress on residual stress induced during powder bed fusion with roller burnishing. Int. J. Mech. Sci. 2022, 219, 107092. [Google Scholar] [CrossRef]
  12. Swirad, S.; Wydrzynski, D.; Nieslony, P.; Krolczyk, G.M. Influence of hydrostatic burnishing strategy on the surface topography of martensitic steel. Measurement 2019, 138, 590–601. [Google Scholar] [CrossRef]
  13. Toboła, D.; Morgiel., J.; Maj, Ł. TEM analysis of surface layer of Ti-6Al-4V ELI alloy after slide burnishing and low-temperature gas nitriding. Appl. Surf. Sci. 2020, 515, 145942. [Google Scholar] [CrossRef]
  14. Korzynski, M.; Dzierwa, A.; Pacana, A.; Cwanek, J. Fatigue strength of chromium coated elements and possibility of its improvement with ball peening. Surf. Coat. Technol. 2009, 204, 615–620. [Google Scholar] [CrossRef]
  15. Bucior, M.; Kluz, R.; Trzepieciński, T.; Jurczak, K.; Kubit, A.; Ochał, K. The effect of shot peening on residual stress and surface roughness of AMS 5504 stainless steel joints welded using the TIG method. Materials 2022, 15, 8835. [Google Scholar] [CrossRef]
  16. Jaya Prasad, V.; Sam Joshi, K.; Venkata Ramana, V.S.N.; Chiranjeevi, R. Effect of roller burnishing on surface properties of wrought AA6063 aluminium alloys. Mater. Today Proc. 2018, 5, 8033–8040. [Google Scholar] [CrossRef]
  17. El-Tayeb, N.S.M.; Low, K.O.; Brevern, P.V. Influence of roller burnishing contact width and burnishing orientation on surface quality and tribological behaviour of Aluminium 6061. J. Mater. Process. Technol. 2007, 186, 272–278. [Google Scholar] [CrossRef]
  18. Kovács, Z. The investigation of tribological characteristics of surface improved by magnetic polishing and roller burnishing. Procedia Eng. 2016, 149, 183–189. [Google Scholar] [CrossRef]
  19. Yaman, N.; Sunay, N.; Kaya, M.; Kaynak, Y. Enhancing surface integrity of additively manufactured inconel 718 by roller burnishing process. Procedia CIRP 2022, 108, 681–686. [Google Scholar] [CrossRef]
  20. Kodácsy, J.; Liska, J. Magnetic assisted roller burnishing and deburring of flat metal surfaces. Adv. Mat. Res. 2012, 472, 908–911. [Google Scholar] [CrossRef]
  21. Zhang, P.; Lindemann, J. Effect of roller burnishing on the high cycle fatigue performance of the high-strength wrought magnesium alloy AZ80. Scr. Mater. 2005, 52, 1011–1015. [Google Scholar] [CrossRef]
  22. Tugay, I.O.; Hosseinzadeh, A.; Yapici, G.G. Hardness and wear resistance of roller burnished 316L stainless steel. Mater. Today Proc. 2021, 47, 2405–2409. [Google Scholar] [CrossRef]
  23. Hamadache, H.; Laouar, L.; Zeghib, N.E.; Chaoui, K. Characteristics of Rb40 steel superficial layer under ball and roller burnishing. J. Mater. Process. Technol. 2006, 180, 130–136. [Google Scholar] [CrossRef]
  24. Hemanth, S.; Harish, A.; Nithin Bharadwaj, R.; Bhat, A.B.; Sriharsha, C. Design of roller burnishing tool and its effect on the surface integrity of Al 6061. Mater. Today Proc. 2018, 5, 12848–12854. [Google Scholar] [CrossRef]
  25. Franzen, V.; Trompeter, M.; Brosius, A. Finishing of thermally sprayed tool coatings for sheet metal forming operations by roller Burnishing. Int. J. Mater. Form. 2010, 3 (Suppl. S1), 147–150. [Google Scholar] [CrossRef]
  26. Dzierwa, A.; Reizer, R.; Pawlus, P.; Grabon, W. Variability of areal surface topography parameters due to the change in surface orientation to measurement direction. Scanning 2014, 36, 170–183. [Google Scholar] [CrossRef] [PubMed]
  27. PN-EN ISO 25178-2:2012; Geometrical Product Specifications (GPS)—Surface texture: Areal—Part 2: Terms, Definitions and Surface Texture Parameters. International Organization for Standardization: Geneva, Switzerland, 2012.
  28. Montgomery, D.C. Design and Analysis of Experiments, 8th ed.; John Wiley & Sons, Inc.: Hoboken, NJ, USA, 2012. [Google Scholar]
  29. Kıvak, T. Optimization of surface roughness and flank wear using the Taguchi method in milling of Hadfield steel with PVD and CVD coated inserts. Measurement 2014, 50, 19–28. [Google Scholar] [CrossRef]
  30. Johansson, S.; Nilsson, P.H.; Ohlsson, R.; Anderberg, C.; Rosen, B.G. New cylinder liner surfaces for low oil consumption. Tribol. Int. 2008, 41, 854–859. [Google Scholar] [CrossRef]
  31. Sedlacek, M.; Podgornik, B.; Vizintin, J. Influence of surface preparation on roughness parameters, friction and wear. Wear 2009, 266, 482–487. [Google Scholar] [CrossRef]
  32. Oczoś, K.E.; Liubimov, V. Struktura Geometryczna Powierzchni; Oficyna Wydawnicza Politechniki Rzeszowskiej: Rzeszów, Poland, 2003. (In Polish) [Google Scholar]
  33. Wieczorowski, M. Teoretyczne podstawy przestrzennej analizy nierówności powierzchni. Inżynieria Maszyn 2013, 18, 7–34. (In Polish) [Google Scholar]
  34. Barányi, I.; Czifra, A.; Kalácska, G. Height-independent topographic parameters of worn surfaces. Sustain. Constr. Des. 2011, 2, 35–40. [Google Scholar] [CrossRef]
  35. Grzesik, W.; Rech, J.; Żak, K. Characterization of surface textures generated on hardened steel parts in high-precision machining operations. Int. J. Adv. Manuf. Technol. 2015, 78, 2049–2056. [Google Scholar] [CrossRef]
  36. El-Axir, M.H.; Othman, O.M.; Abodiena, A.M. Improvements in out-of-roundness and microhardness of inner surfaces by internal ball burnishing proces. J. Mater. Process. Technol. 2008, 196, 120–128. [Google Scholar] [CrossRef]
  37. Dzierwa, A.; Pawlus, P. Wear of a rough disc in dry sliding contact with a smooth ball: Experiment and modeling. Arch. Civ. Mech. Eng. 2021, 21, 85. [Google Scholar] [CrossRef]
  38. Abdelgnei, M.A.; Omar, M.Z.; Ghazali, M.J.; Mohammed, M.N.; Rashid, B. Dry sliding wear behaviour of thixoformed Al-5.7Si–2Cu-0.3 Mg alloys at high temperatures using Taguchi method. Wear 2020, 442–443, 203134. [Google Scholar] [CrossRef]
  39. Chowdhury, M.A.; Helali, M.M. The effect of amplitude of vibration on the coefficient of friction. Tribol. Int. 2008, 41, 307–314. [Google Scholar] [CrossRef]
  40. Chowdhury, M.A.; Nuruzzaman, D.M.; Roy, B.K. Experimental investigation of friction coefficient and wear rate of stainless steel 304 sliding against smooth and rough mild steel counterfaces. Gazi Univ. J. Sci. 2013, 26, 597–609. [Google Scholar]
  41. Yin, Y.L.; Yu, H.L.; Wang, H.M.; Song, Z.Y.; Zhang, Z.; Ji, X.C.; Cui, T.H.; Wei, M.; Zhang, W. Friction and wear behaviours of steel/bronze tribopairs lubricated by oil with serpentine natural mineral additive. Wear 2020, 456–457, 203387. [Google Scholar] [CrossRef]
  42. Tabor, D. Friction, Lubrication, and Wear. In Mechanical Design Handbook, 2nd ed.; Rothbart, H., Brown, T., Eds.; McGraw-Hill: New York, NY, USA, 2006. [Google Scholar]
  43. Duncheva, G.V.; Maximov, J.T.; Anchev, A.P.; Dunchev, V.P.; Argirov, Y.B.; Kandeva-Ivanova, M. Enhancement of the wear resistance of CuAl9Fe4 sliding bearing bushings via diamond burnishing. Wear 2022, 510–511, 204491. [Google Scholar] [CrossRef]
  44. Żurowski, W.; Brzózka, K.; Górka, B. Analysis of surface layers and wear products by Mössbauer spectral analysis. Wear 2013, 297, 958–965. [Google Scholar] [CrossRef]
  45. Żurowski, W.; Brzózka, K.; Górka, B. Structure of friction products and the surface of tribological system elements. Nukleonika 2013, 58, 99–103. [Google Scholar]
Figure 1. Roller burnishing tool EG5.
Lubricants 11 00227 g001
Figure 2. Isometric view of milled surface.
Lubricants 11 00227 g002
Figure 3. Tribological tester T-11, photo (left), contact scheme (right).
Lubricants 11 00227 g003
Figure 4. Example of wear volume calculation.
Lubricants 11 00227 g004
Figure 5. Surface topography of the sample with the lowest value of Sa parameter.
Lubricants 11 00227 g005
Figure 6. Contour diagram (a) and the depths histogram with Abbott–Firestone curve (b)—sample no. 2.
Lubricants 11 00227 g006
Figure 7. Vectorization of micro-valleys network—sample no. 2.
Lubricants 11 00227 g007
Figure 8. Averaged power spectral density—sample no. 2.
Lubricants 11 00227 g008
Figure 9. Main effects plots for S/N ratio, (a) V dry, (b) V oil, (c) COF dry, (d) COF oil.
Lubricants 11 00227 g009
Figure 10. Effect of selected tribological parameters on wear volume in dry sliding conditions: v and P (a); v and s (b); s and P (c).
Lubricants 11 00227 g010
Figure 11. Effect of selected tribological parameters on wear volume in lubricated sliding conditions: v and P (a); v and s (b); s and P (c).
Lubricants 11 00227 g011
Figure 12. Effect of selected tribological parameters on friction coefficient in dry sliding conditions: v and P (a); v and s (b); s and P (c).
Lubricants 11 00227 g012
Figure 13. Effect of selected tribological parameters on friction coefficient in lubricated sliding conditions: v and P (a); v and s (b); s and P (c).
Lubricants 11 00227 g013
Figure 14. Comparison of the results obtained in experiment and prediction for (a) V dry, (b) V oil, (c) COF dry, (d) COF oil.
Lubricants 11 00227 g014
Figure 15. SEM images of worn-out surfaces created in lubricated (a) sample 18, (c) sample 19, and in dry contact conditions (b) sample 27, (d) sample 10.
Lubricants 11 00227 g015
Table 1. Roller burnishing input parameters.
Input Parameters Levels
−101
Load [N]3508501350
Feed [mm/rev]0.040.080.12
Table 2. Levels of tribological parameters.
LevelsLoad [N]Sliding Distance [m]Sliding Speed [m/s]
151600.24
2102820.48
3154040.72
Table 3. Results of roller burnishing process.
No.Load [N]Feed [mm/rev]Sa, µmSz, µmSskHm [HV]
113500.150.541 ± 0.0512.8 ± 0.10−2.83 ± 0.03430.1 ± 10.2
213500.100.317 ± 0.037.32 ± 0.08−2.97 ± 0.04434.7 ± 12.1
313500.050.352 ± 0.0410.2 ± 0.09−2.12 ± 0.04433.9 ± 10.4
48500.150.699 ± 0.0513.1 ± 0.10−2.68 ± 0.03420.4 ± 8.9
58500.100.538 ± 0.048.95 ± 0.06−2.19 ± 0.04418.9 ± 10.2
68500.050.371 ± 0.029.41 ± 0.05−2.01 ± 0.03421.1 ± 9.6
73500.150.611 ± 0.0511.6 ± 0.07−2.33 ± 0.04409.9 ± 10.4
83500.100.512 ± 0.048.62 ± 0.05−2.52 ± 0.05408.6 ± 11.2
93500.050.414 ± 0.039.74 ± 0.07−2.17 ± 0.04412.8 ± 10.4
Table 4. Results of the research.
No.Sliding Speed [m/s]Load [N]Sliding
Distance [m]
V Dry [µm3]COF dryV Oil [µm3]COF Oil
10.245160264,525 ± 11.3%0.221 ± 2.1%8345 ± 3.1%0.051 ± 2.0%
20.245282314,125 ± 12.4%0.199 ± 2.6%9021 ± 3.5%0.059 ± 3.2%
30.245404363,819 ± 12.1%0.217 ± 2.9%10,743 ± 2.8%0.061 ± 1.9%
40.2410160886,585 ± 10.9%0.411 ± 3.1%17,652 ± 4.1%0.101 ± 2.5%
50.2410282947,932 ± 14.2%0.423 ± 3.4%19,058 ± 2.6%0.104 ± 2.5%
60.24104041,355,865 ± 13.8%0.456 ± 3.0%20,662 ± 3.8%0.105 ± 3.3%
70.24151602,278,320 ± 15.6%0.554 ± 3.6%27,411 ± 3.6%0.149 ± 3.6%
80.24152823,385,465 ± 16.5%0.599 ± 3.9%29,111 ± 3.5%0.152 ± 4.4%
90.24154044,115,245 ± 15.8%0.566 ± 3.9%30,056 ± 2.9%0.157 ± 4.0%
100.485160232,636 ± 11.9%0.211 ± 3.8%9210 ± 3.8%0.048 ± 3.1%
110.485282331,606 ± 12.2%0.241 ± 2.5%9800 ± 4.0%0.054 ± 2.8%
120.485404892,155 ± 11.8%0.217 ± 3.9%11,132 ± 4.2%0.055 ± 3.1%
130.4810160739,710 ± 15.4%0.416 ± 4.2%15,843 ± 4.0%0.111 ± 4.0%
140.4810282829,326 ± 12.8%0.463 ± 4.4%16,877 ± 4.5%0.101 ± 3.8%
150.48104041,020,186 ± 10.1%0.425 ± 3.6%18,772 ± 4.9%0.098 ± 4.2%
160.48151601,698,658 ± 13.7%0.602 ± 4.1%36,005 ± 4.2%0.162 ± 4.0%
170.48152822,232,065 ± 11.6%0.635 ± 4.8%38,451 ± 4.2%0.151 ± 3.8%
180.48154042,989,875 ± 15.5%0.622 ± 4.6%41,321 ± 4.8%0.148 ± 3.8%
190.725160557,744 ± 11.6%0.235 ± 2.9%6186 ± 2.8%0.055 ± 3.0%
200.725282745,458 ± 16.2%0.209 ± 4.8%7821 ± 3.1%0.051 ± 3.1%
210.725404912,545 ± 15.5%0.238 ± 4.4%8932 ± 3.2%0.049 ± 3.0%
220.72101601,002,631 ± 14.4%0.421 ± 5.1%16,024 ± 4.0%0.098 ± 4.0%
230.72102821,517,910 ± 12.5%0.413 ± 4.9%18,005 ± 5.8%0.109 ± 4.5%
240.72104041,898,562 ± 15.4%0.428 ± 4.4%19,212 ± 4.2%0.121 ± 4.6%
250.72151604,345,632 ± 12.2%0.568 ± 4.6%31,895 ± 5.5%0.147 ± 4.6%
260.72152825,875,496 ± 11.1%0.646 ± 5.3%34,212 ± 5.1%0.155 ± 4.9%
270.72154046,179,705 ± 10.6%0.603 ± 5.0%36,810 ± 4.7%0.151 ± 4.9%
Table 5. S/N response table for wear volume.
LevelControl Factors
V DryV Oil
vPsvPs
1−120.1−113.1−119.1−84.73−78.99−84.06
2−119.3−120.7−121.4−85.47−85.08−84.86
3−125.0−130.6−123.9−84.41−90.54−85.69
Delta5.717.54.91.0611.551.63
Rank213312
Table 6. S/N response table for coefficient of friction.
LevelControl Factors
COF DryCOF Oil
vPsvPs
18.55013.1338.50120.3225.4320.62
28.1517.3698.52420.5519.3720.40
38.2574.4568.23320.4816.3420.32
Delta0.3998.6770.2780.239.090.30
Rank213312
Table 7. Anova results for V dry.
SourceDFSeq SSAdj SSAdj MSFPContribution
v [m/s]2196.75196.7584.87429.780.00011.39%
P [N]21379.541379.54689.770242.040.00079.88%
s [m]2106.95106.9553.47418.760.0016.19%
v [m/s]∗P [N]432.4532.458.1132.850.0971.88%
v [m/s]∗s [m]49.239.232.3070.810.5530.53%
P [N]∗s [m]46.286.281.5690.550.7040.36%
Residual Error822.8022.802.850
Total261726.99
Table 8. Anova results for COF dry.
SourceDFSeq SSAdj SSAdj MSFPContribution
v [m/s]20.7670.7670.3841.940.2050.22%
P [N]2350.978350.978175.489889.110.00098.50%
s [m]20.4480.4480.2241.130.3690.13%
v [m/s]∗P [N]40.6350.6350.1590.800.5560.18%
v [m/s]∗s [m]41.0381.0380.2601.320.3430.29%
P [N]∗s [m]40.8710.8710.2181.100.4180.24%
Residual Error81.5791.5790.197
Total26356.316
Table 9. Anova results for V oil.
SourceDFSeq SSAdj SSAdj MSFPContribution
v [m/s]25.3055.3052.65238.250.0000.83%
P [N]2600.510600.510300.2554329.480.00094.49%
s [m]211.98911.9895.99586.440.0001.89%
v [m/s]∗P [N]415.36315.3633.84155.380.0002.42%
v [m/s]∗s [m]40.4810.4810.1201.740.2350.08%
P [N]∗s [m]41.2691.2690.3174.580.0320.20%
Residual Error80.5550.5550.069
Total26635.473
Table 10. Anova results for COF oil.
SourceDFSeq SSAdj SSAdj MSFPContribution
v [m/s]20.2490.2490.1250.250.7850.06%
P [N]2382.260382.260191.130383.330.00098.11%
s [m]20.4440.4440.2220.440.6560.11%
v [m/s]∗P [N]41.4641.4640.3660.730.5940.38%
v [m/s]∗s [m]40.8100.8100.2020.410.8000.21%
P [N]∗s [m]40.3950.3950.0990.200.9320.10%
Residual Error83.9893.9890.499
Total26389.611
Table 11. Results of the confirmation experiments for wear volume.
Initial
Parameter
Optimal
Parameter
Predicted ParameterInitial
Parameter
Optimal
Parameter
Predicted Parameter
V DryV Oil
LevelA2B2C2A2B1C1A2B1C1A2B2C2A3B1C1A3B1C1
V [µm3]829,326232,636162,32016,87761865709
S/N ratio (dB)−118.375−107.334−108.905−84.546−75.828−76.164
Table 12. Results of the confirmation experiments for coefficient of friction.
Initial
Parameter
Optimal
Parameter
Predicted ParameterInitial
Parameter
Optimal
Parameter
Predicted Parameter
COF DryCOF Oil
LevelA2B2C2A1B1C2A1B1C2A2B2C2A2B1C1A2B1C1
COF0.4630.1990.2100.1010.0480.051
S/N ratio (dB)8.68514.02313.85719.91426.37525.717
Disclaimer/Publisher’s Note: The statements, opinions and data contained in all publications are solely those of the individual author(s) and contributor(s) and not of MDPI and/or the editor(s). MDPI and/or the editor(s) disclaim responsibility for any injury to people or property resulting from any ideas, methods, instructions or products referred to in the content.

