Lubrication Condition Monitoring in EHD Line Contacts of Thrust Needle Roller Bearing Using the Electrical Impedance Method

 ,
, 
Abstract
:1. Introduction
2. Measurement Principle
2.1. Outline
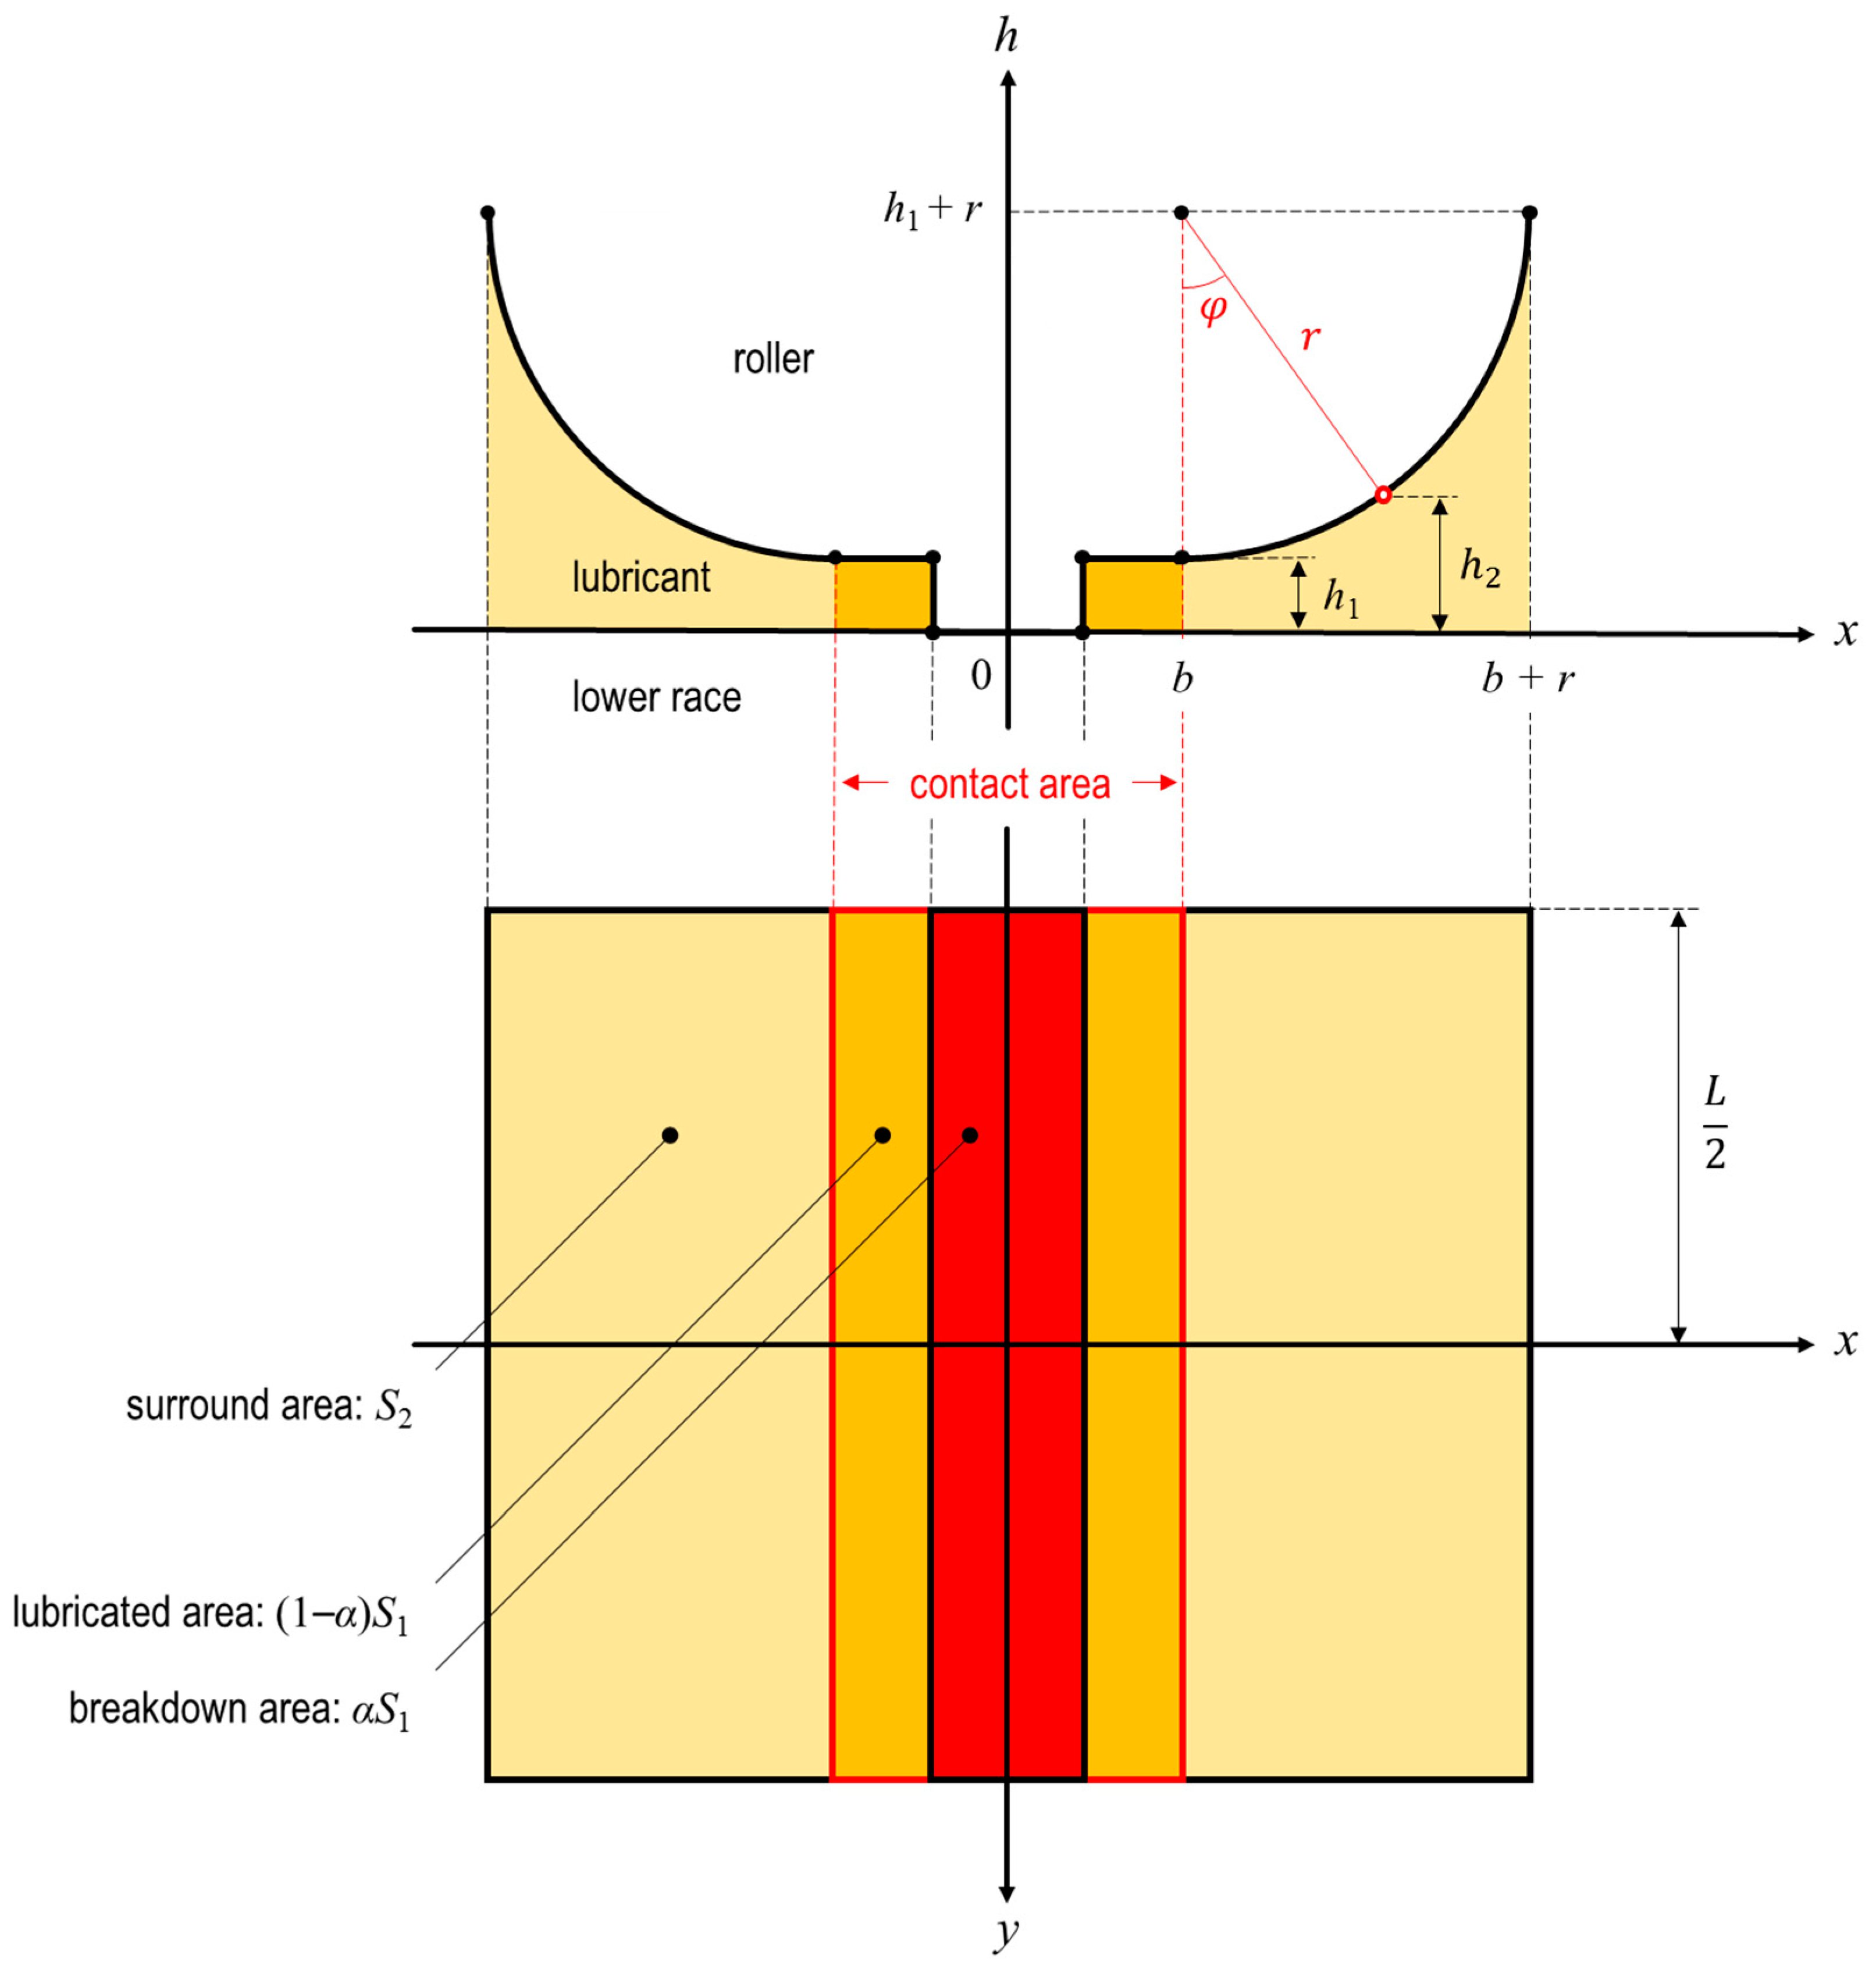
2.2. Geometrical Model
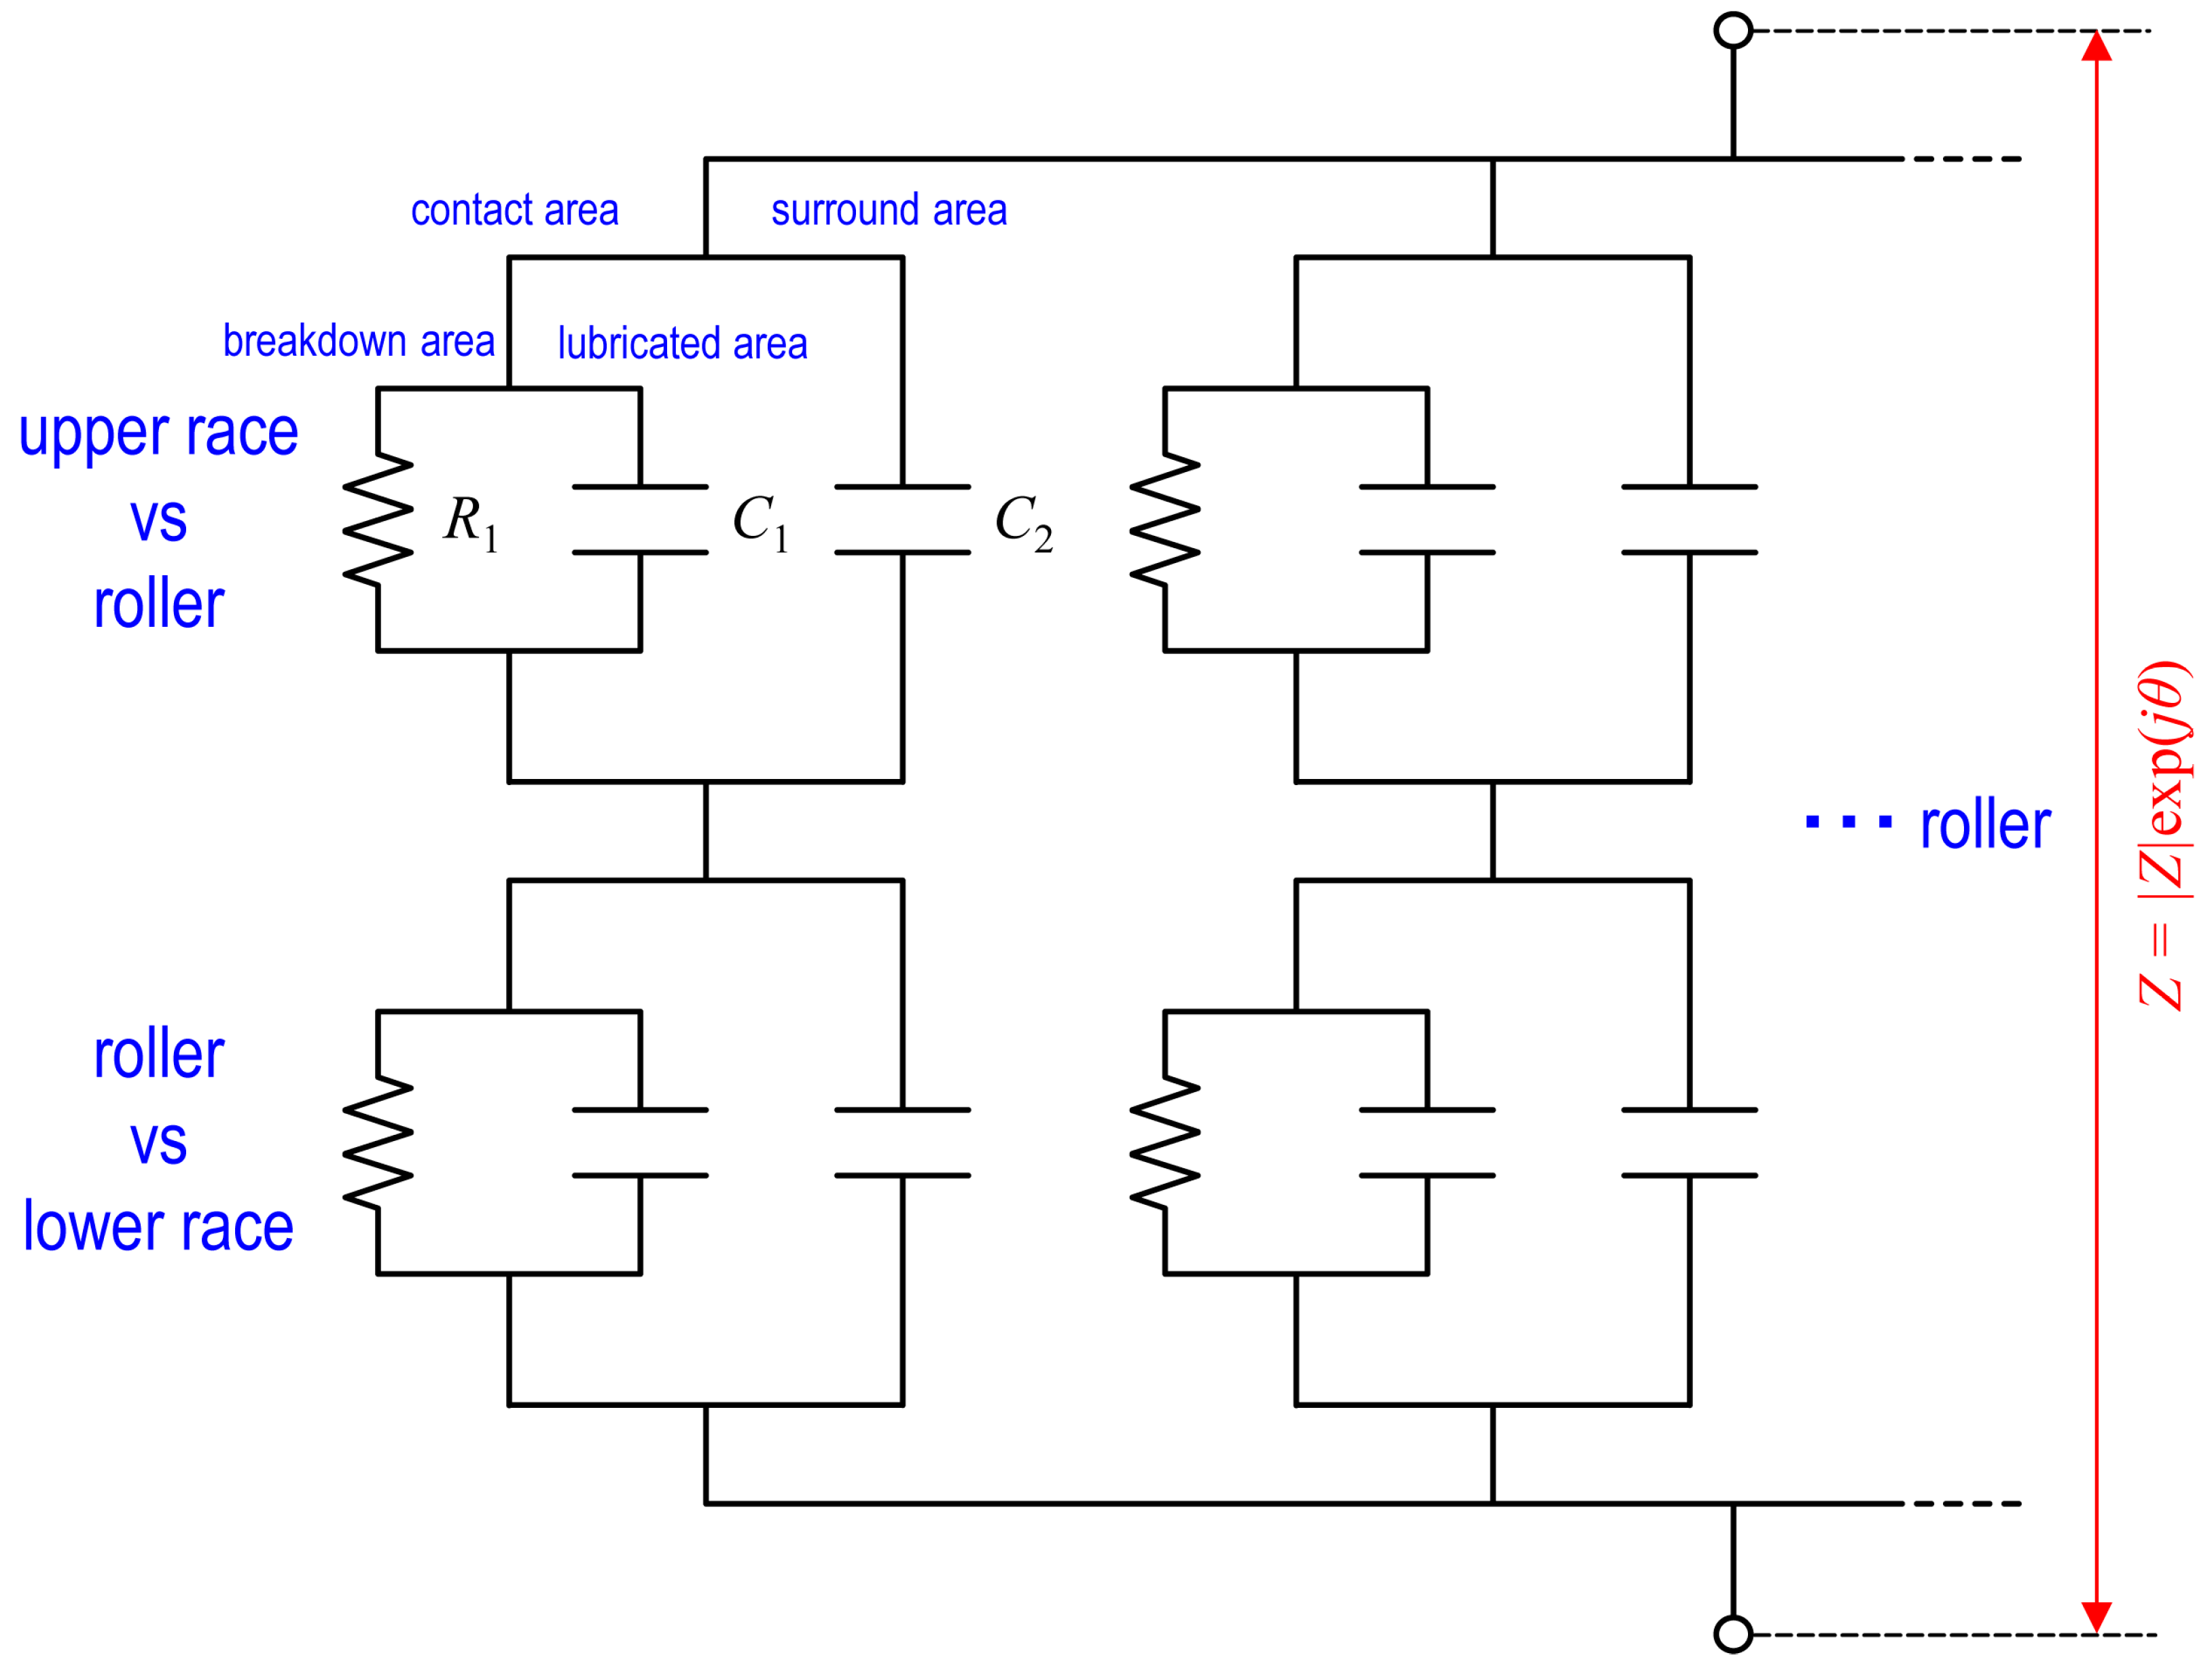
2.3. Electrical Model
2.4. Complex Impedance Analysis
3. Experimental Details
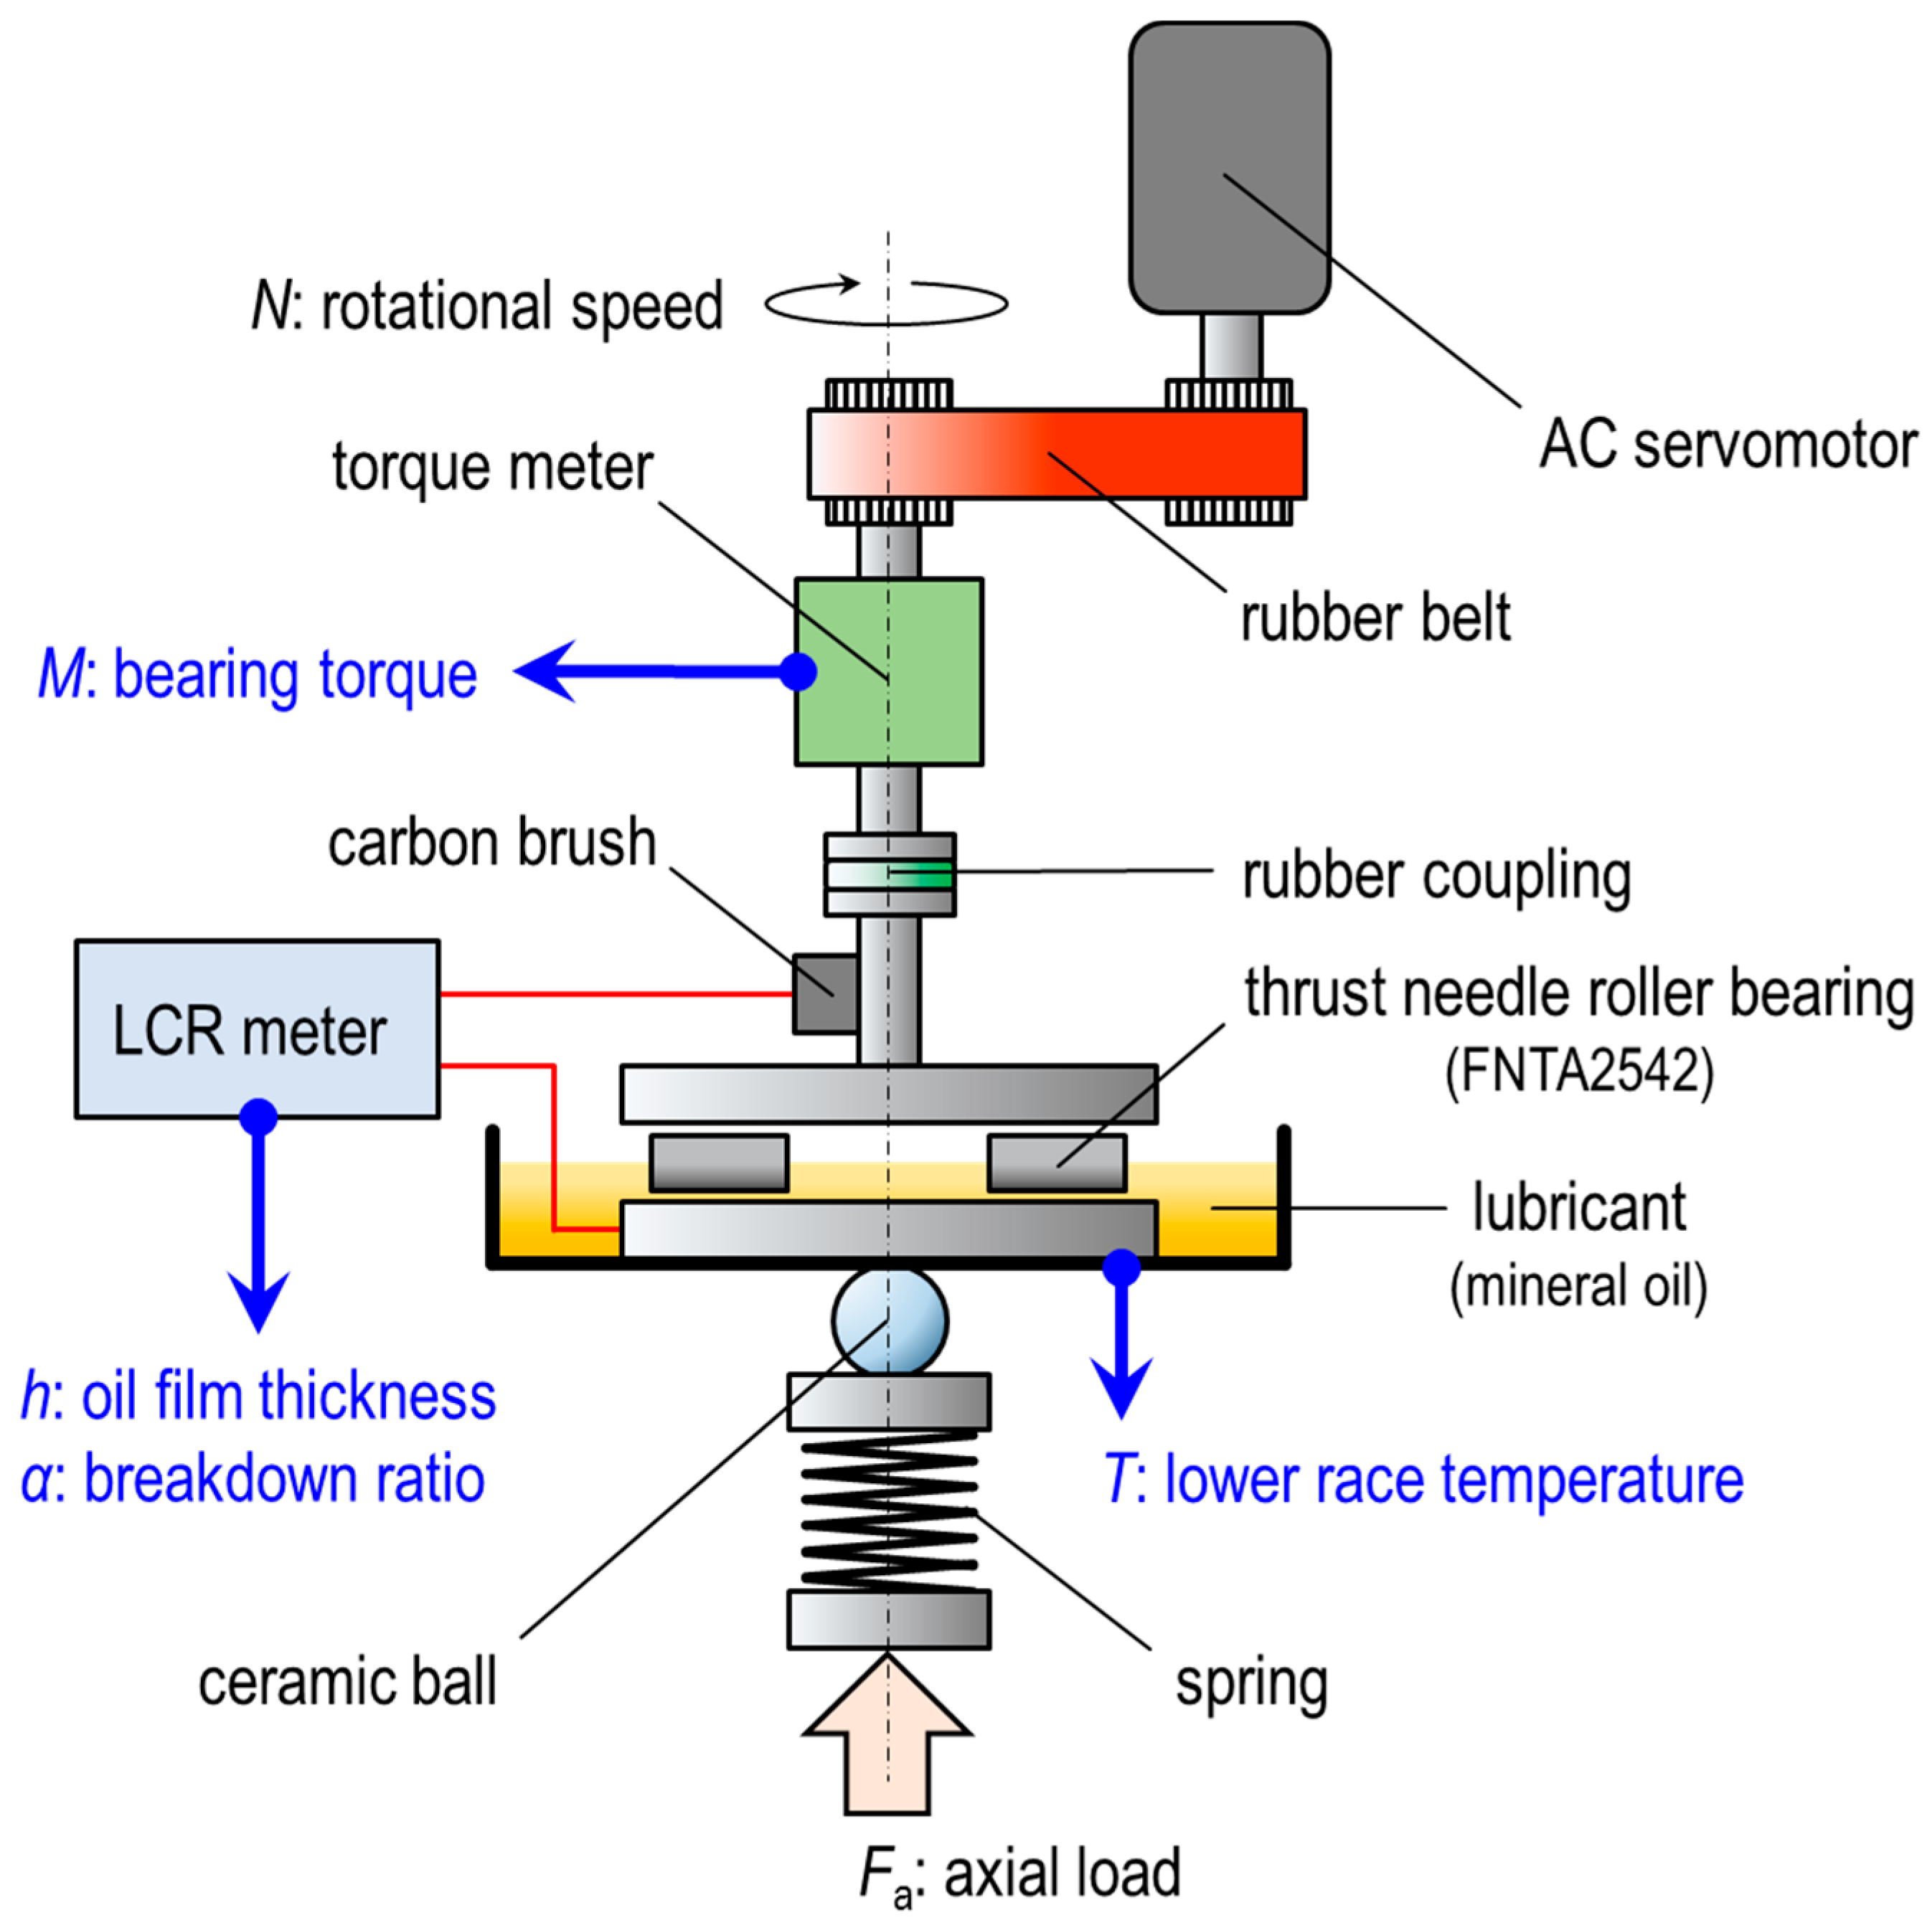
3.1. Apparatus
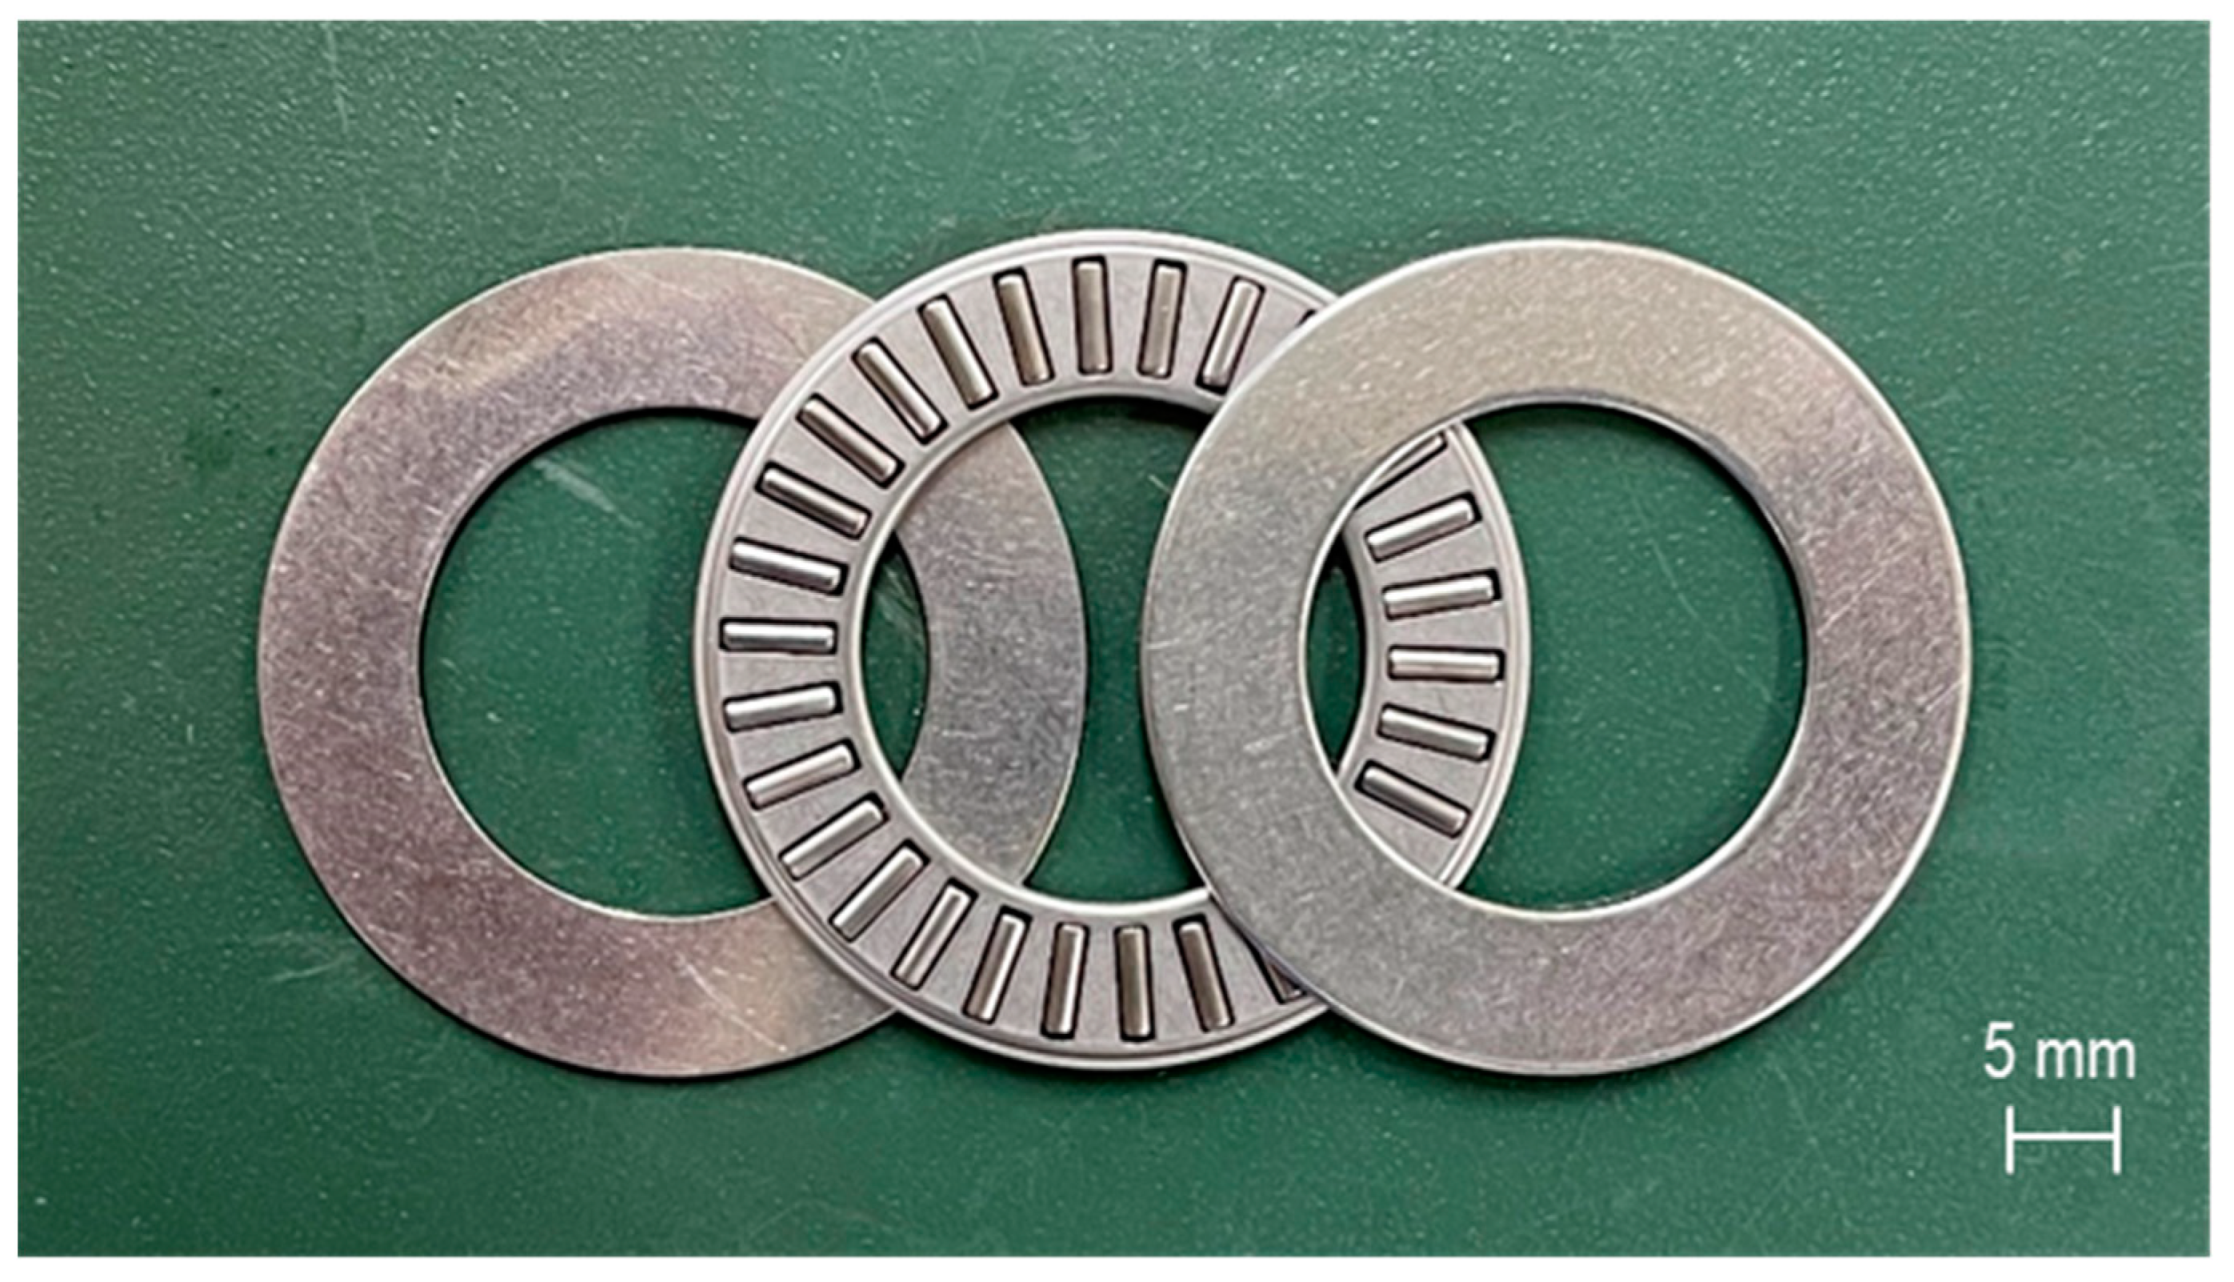
3.2. Materials
3.3. Procedure
4. Experimental Results
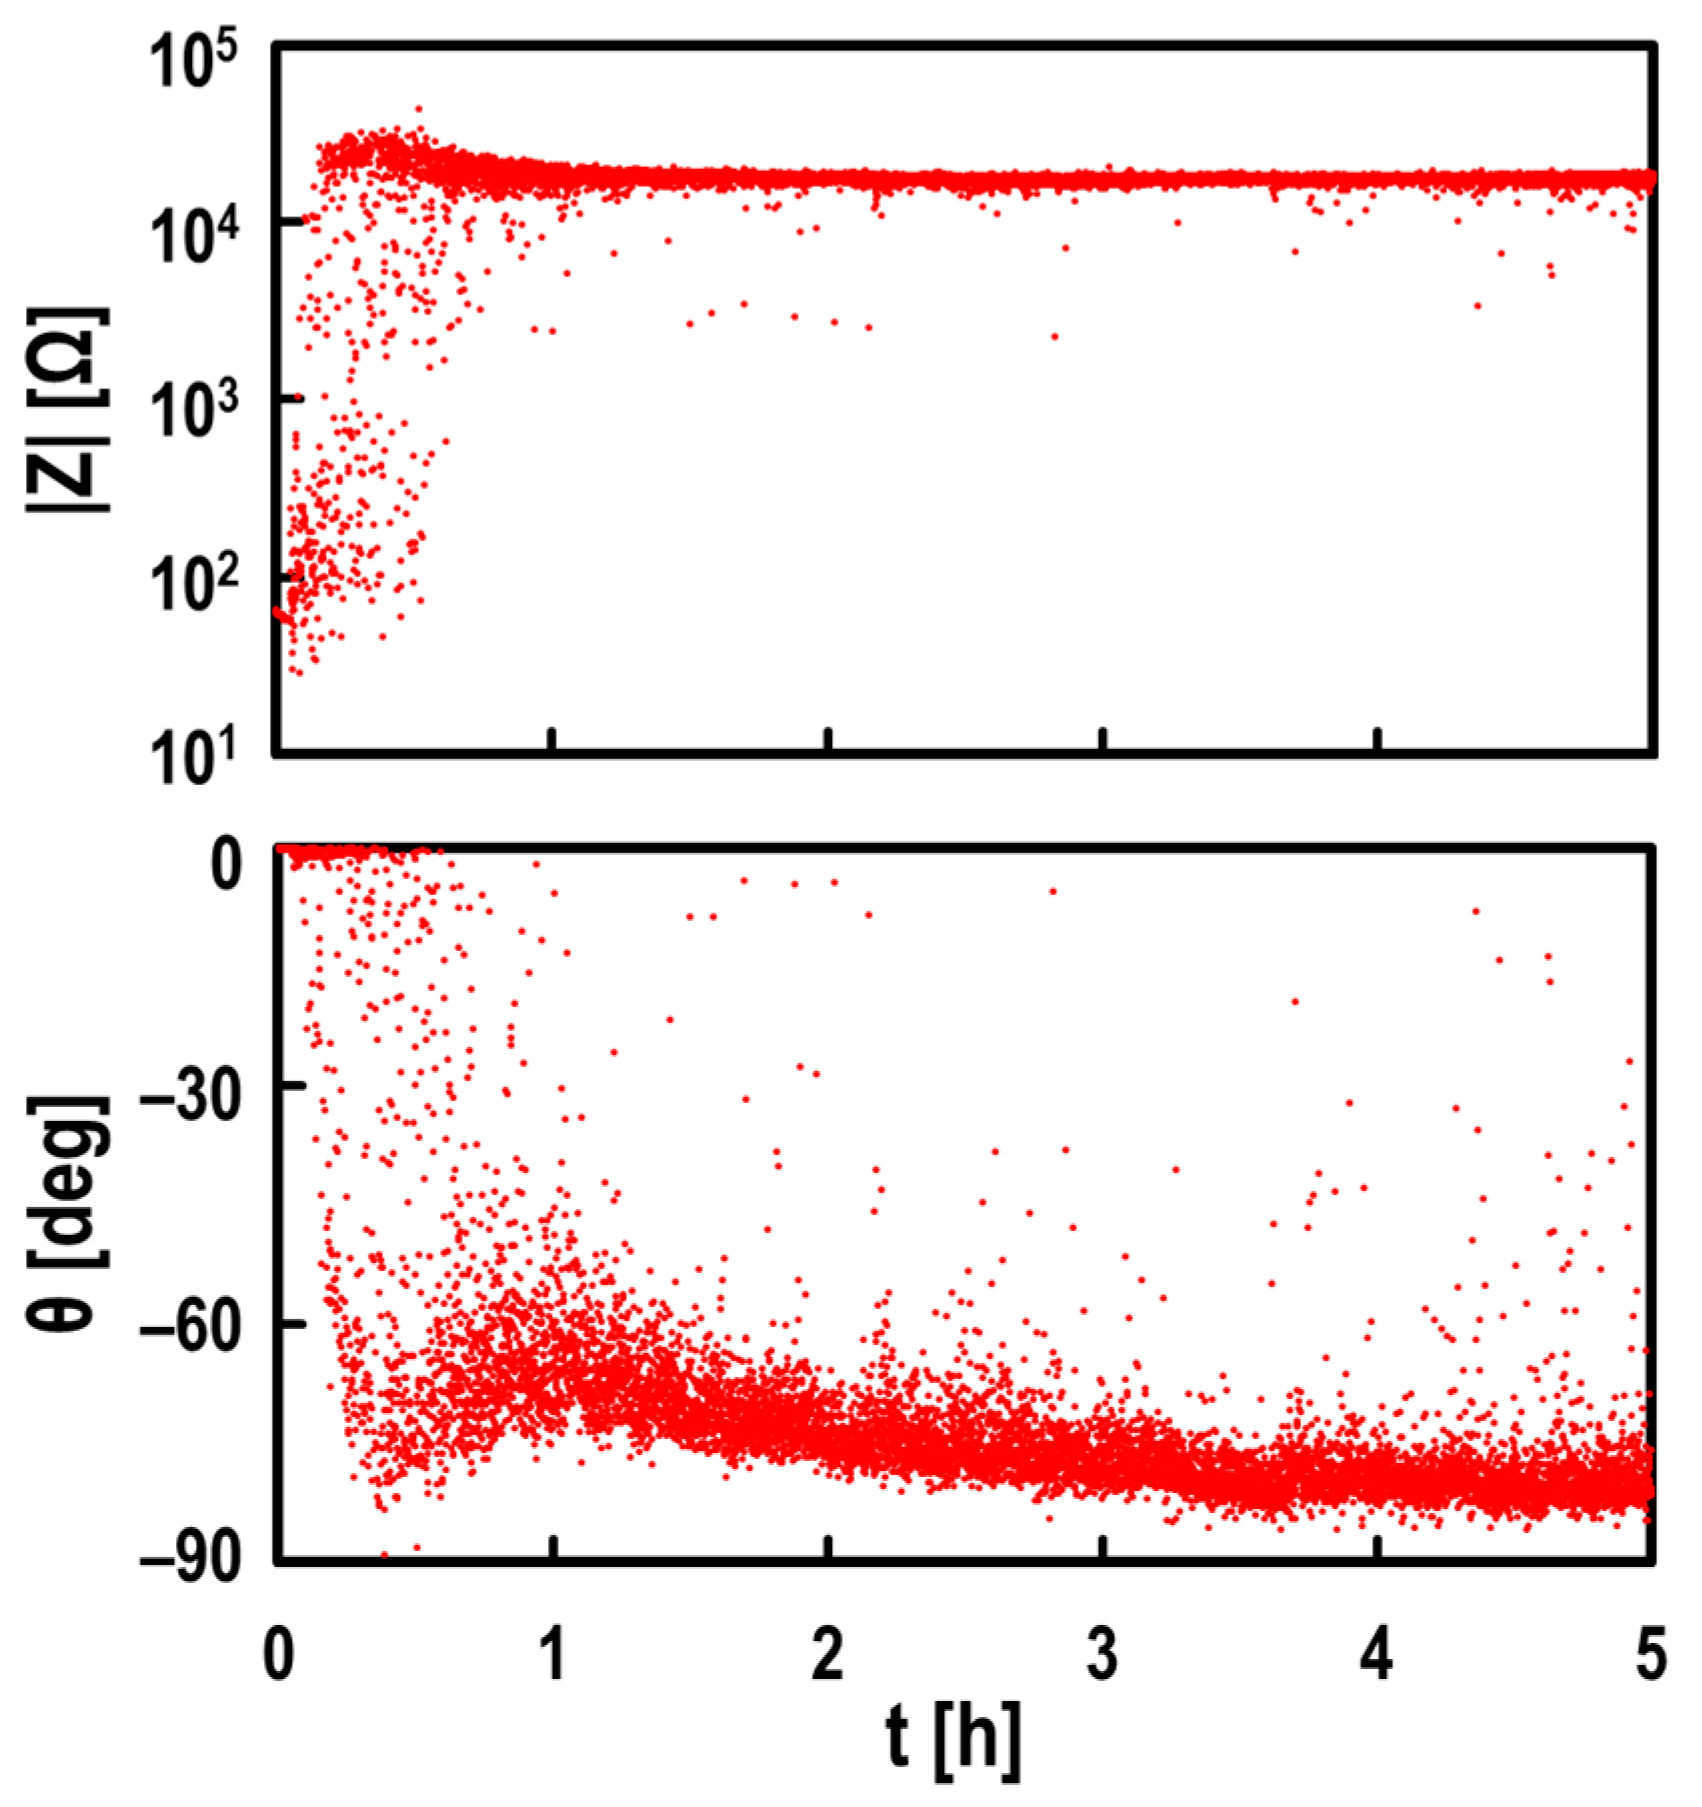
4.1. Measurements of |Z| and θ
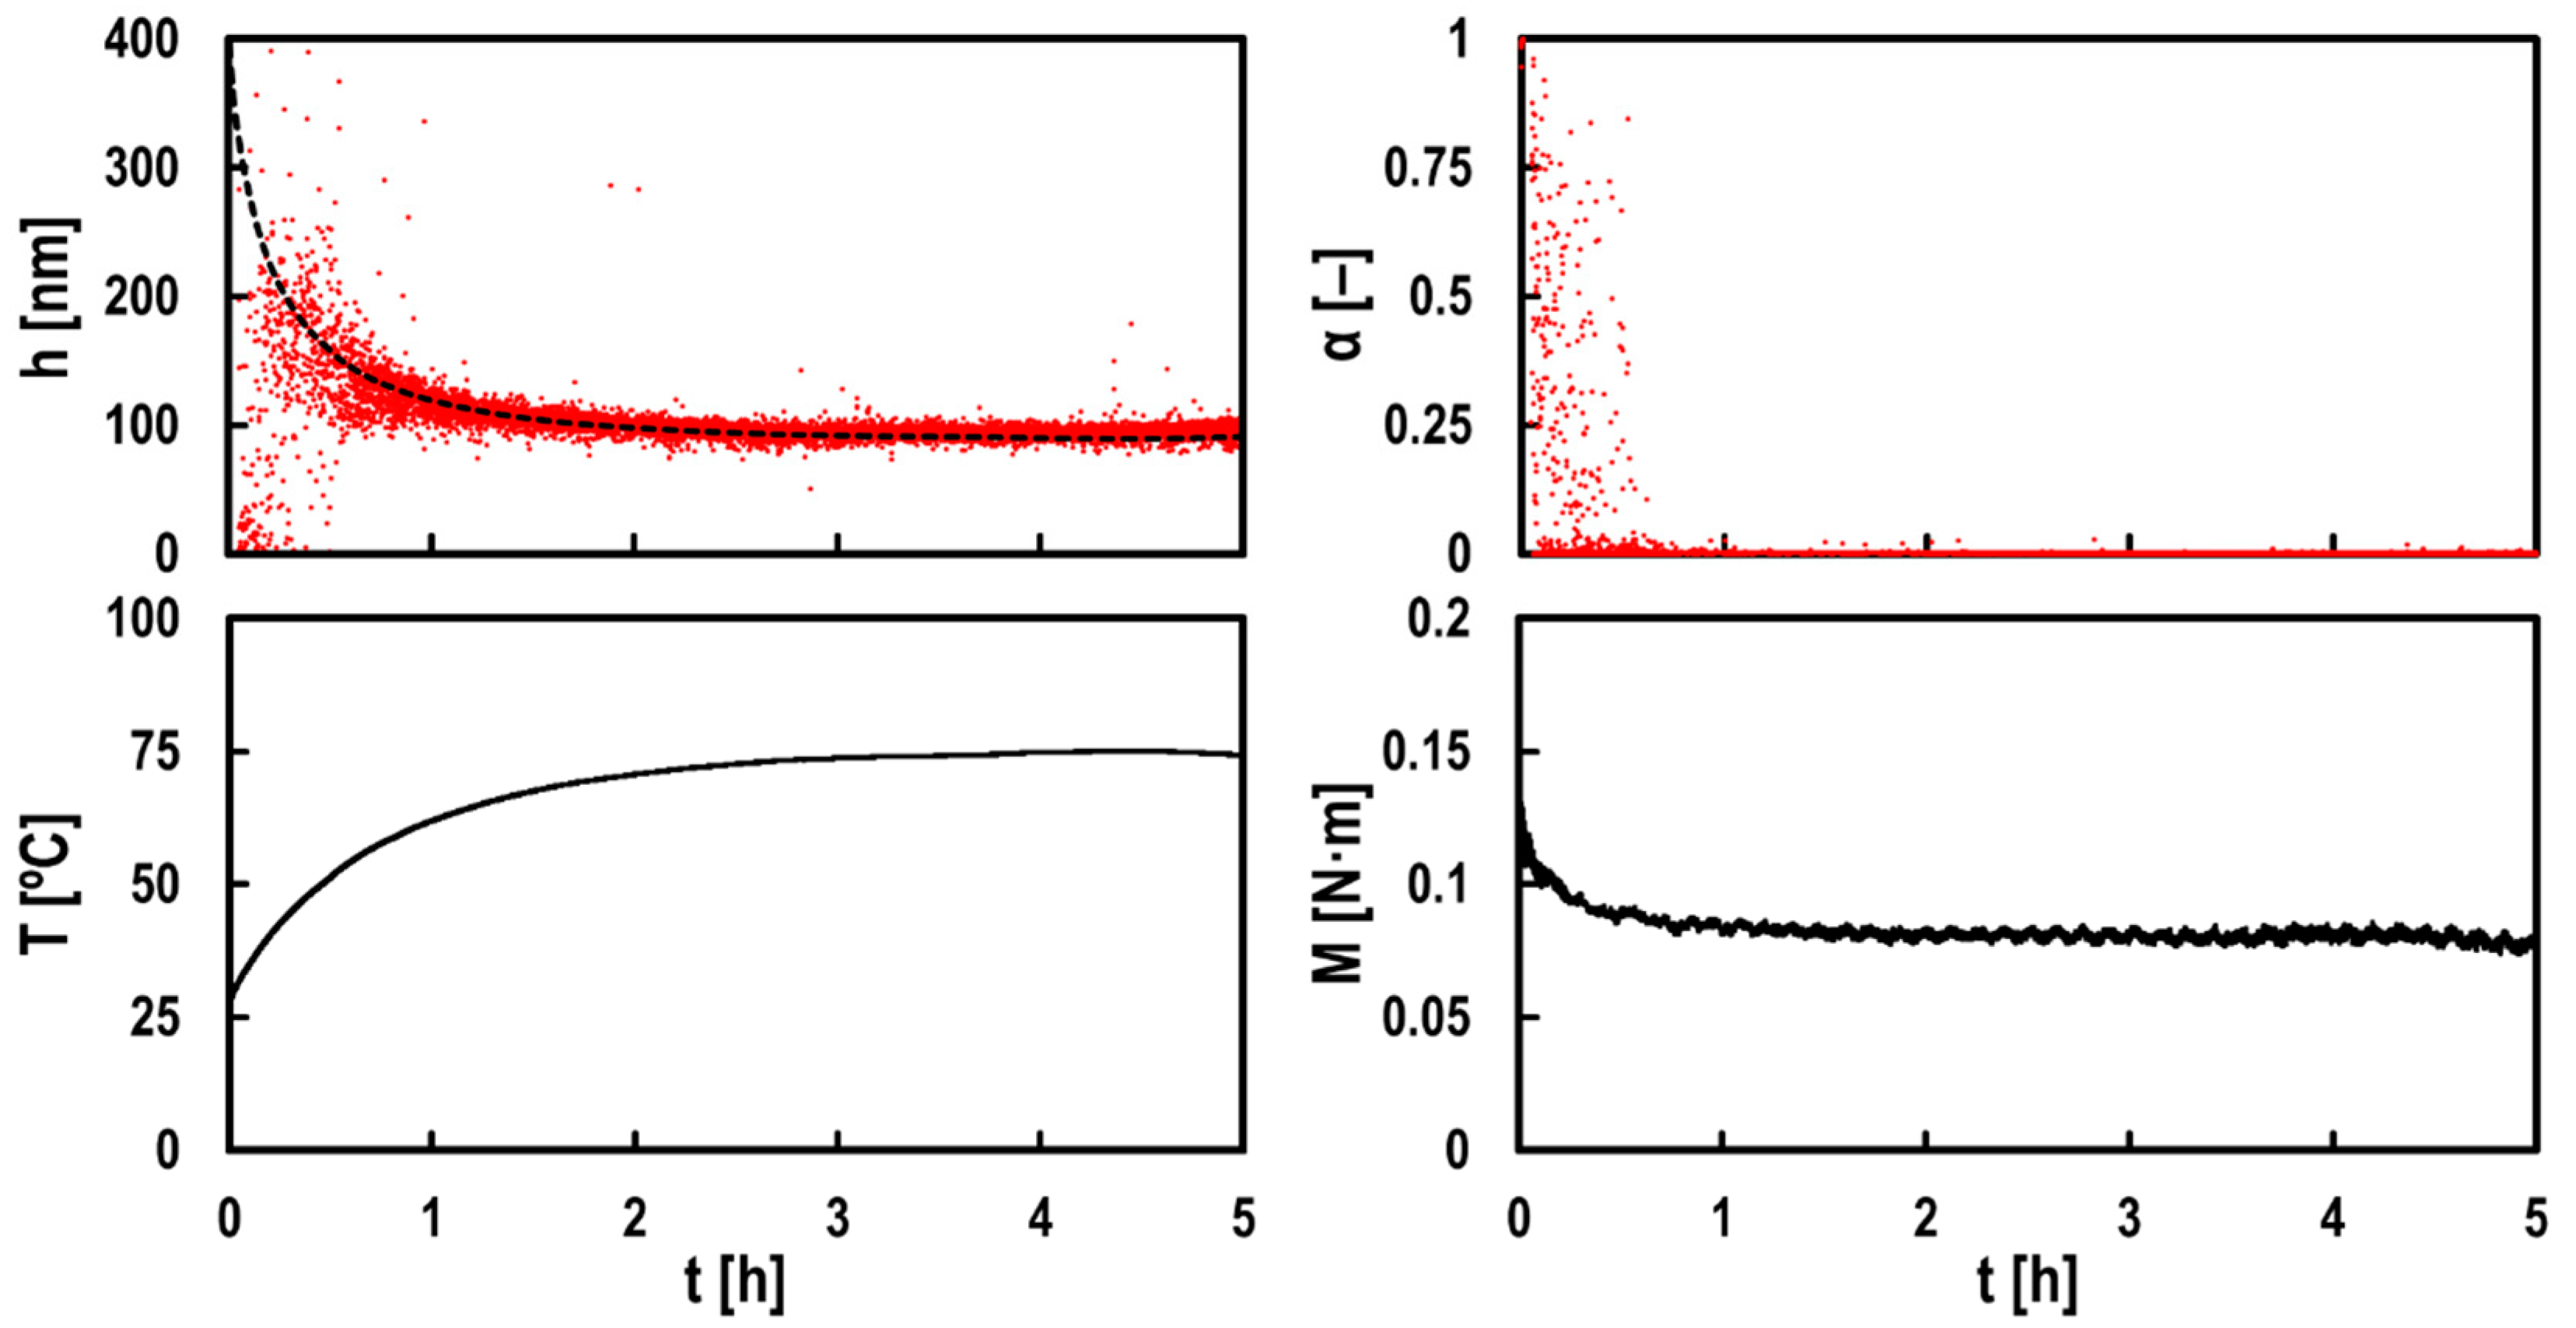
4.2. Measurements of h, α, T, and M
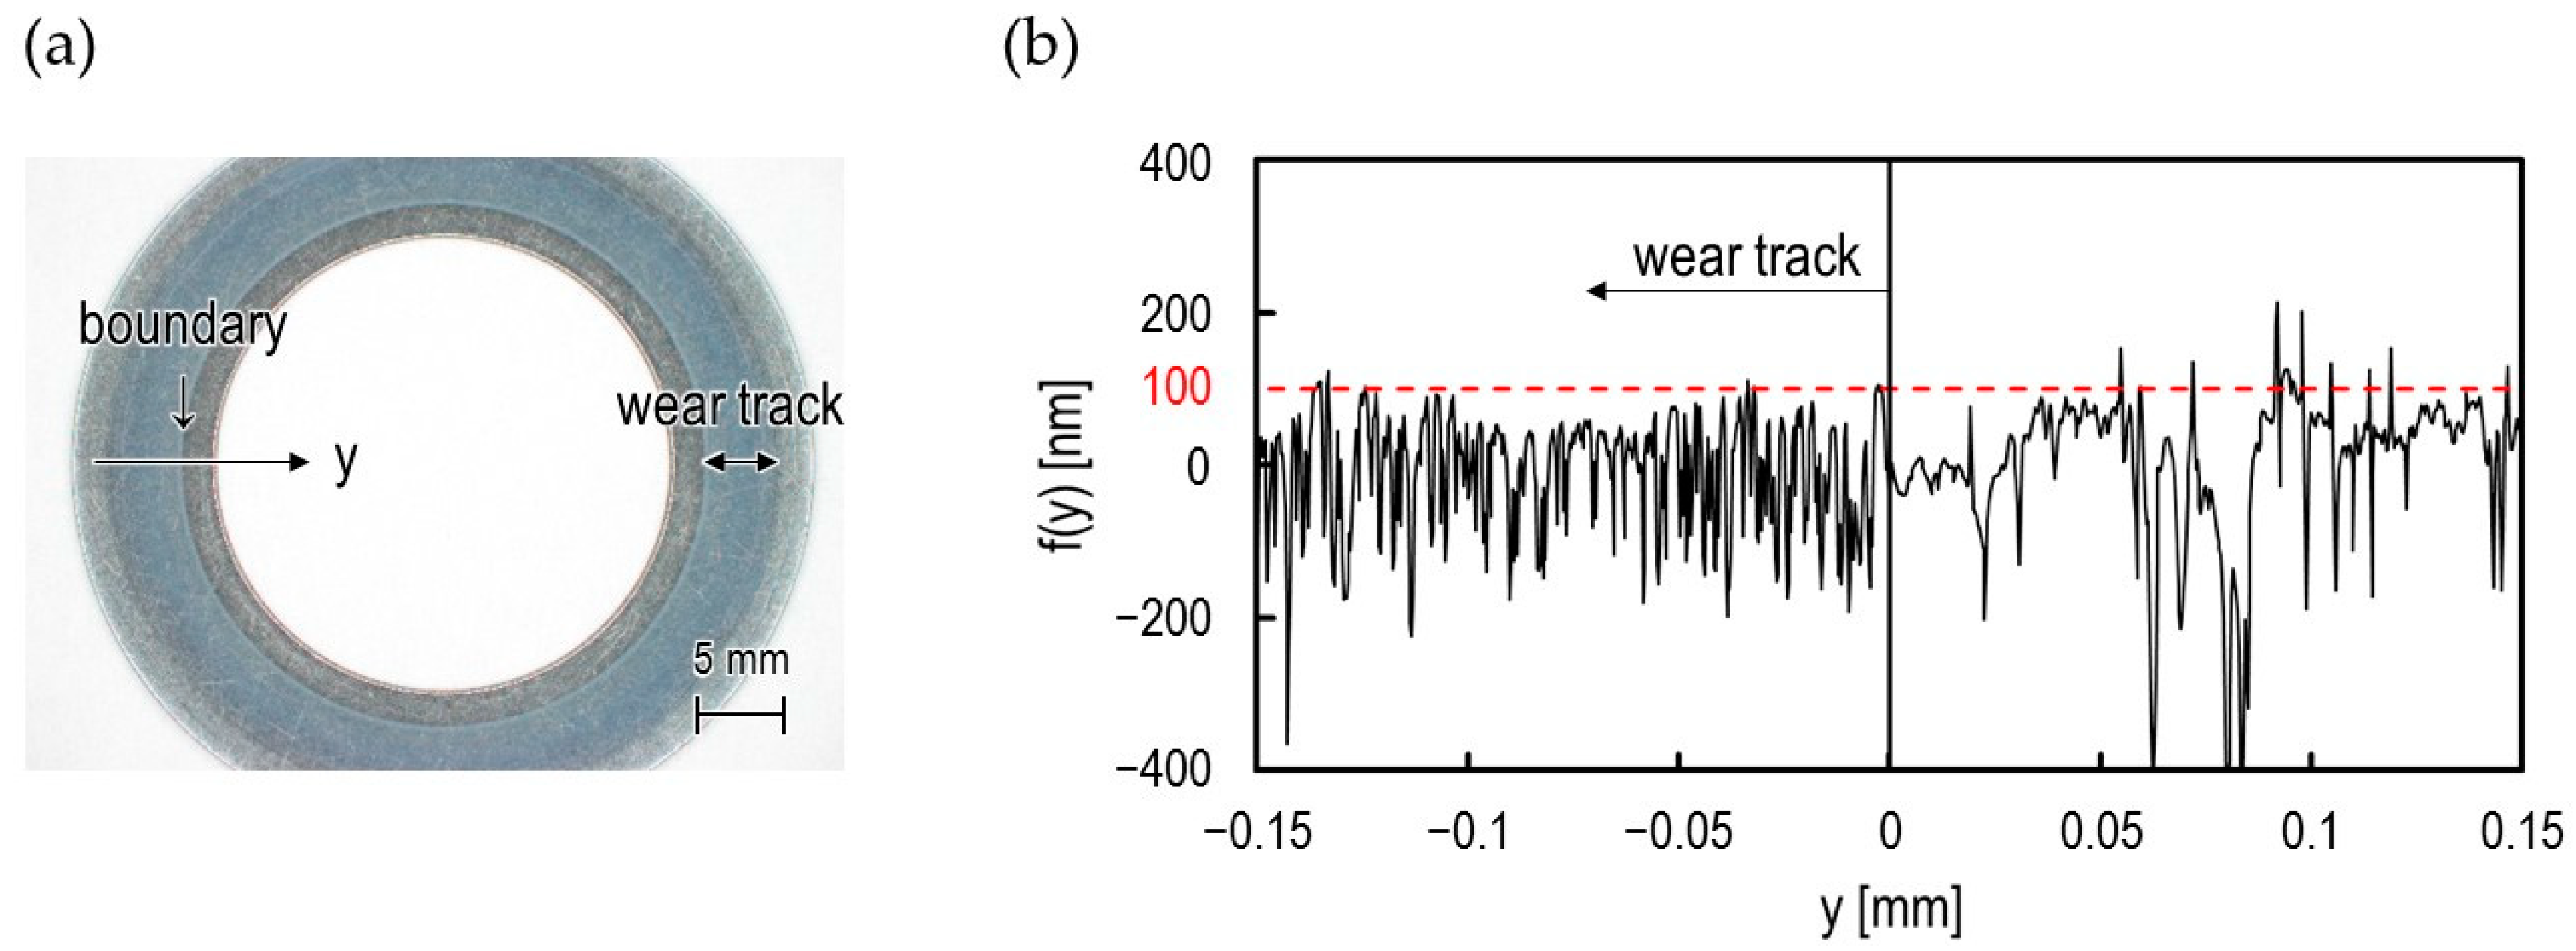
4.3. Observations of Tested Bearing
5. Discussion
5.1. Validation of Measured h-Values
5.2. Validation of Measured α-Values
6. Conclusions
- We theoretically demonstrated that the thickness and breakdown ratio of oil films can be simultaneously measured using the complex impedance generated when a sinusoidal voltage is applied to EHD line contacts.
- We applied the developed method to an actual thrust needle bearing, and we simultaneously measured the oil film thickness and breakdown ratio. The oil film thickness and breakdown ratio fluctuated significantly immediately after starting the test, but the breakdown ratio decreased over time. Furthermore, the oil film thickness after one hour was thought to be completed when the running-in wear was found to almost match the theoretical value. It was also confirmed that the lower race temperature and bearing torque were both constant values at that time, thus indicating that the lubricated condition was stable.
- Based on the results of measuring the surface roughness of the lower race after the test, asperities of 100 nm or more, observed in the undamaged part, were not found in the wear track. One hour after the start of the test, the oil film thickness was also approximately 100 nm, and there was no breakdown area; it is thought that running-in wear was almost completed at this time.
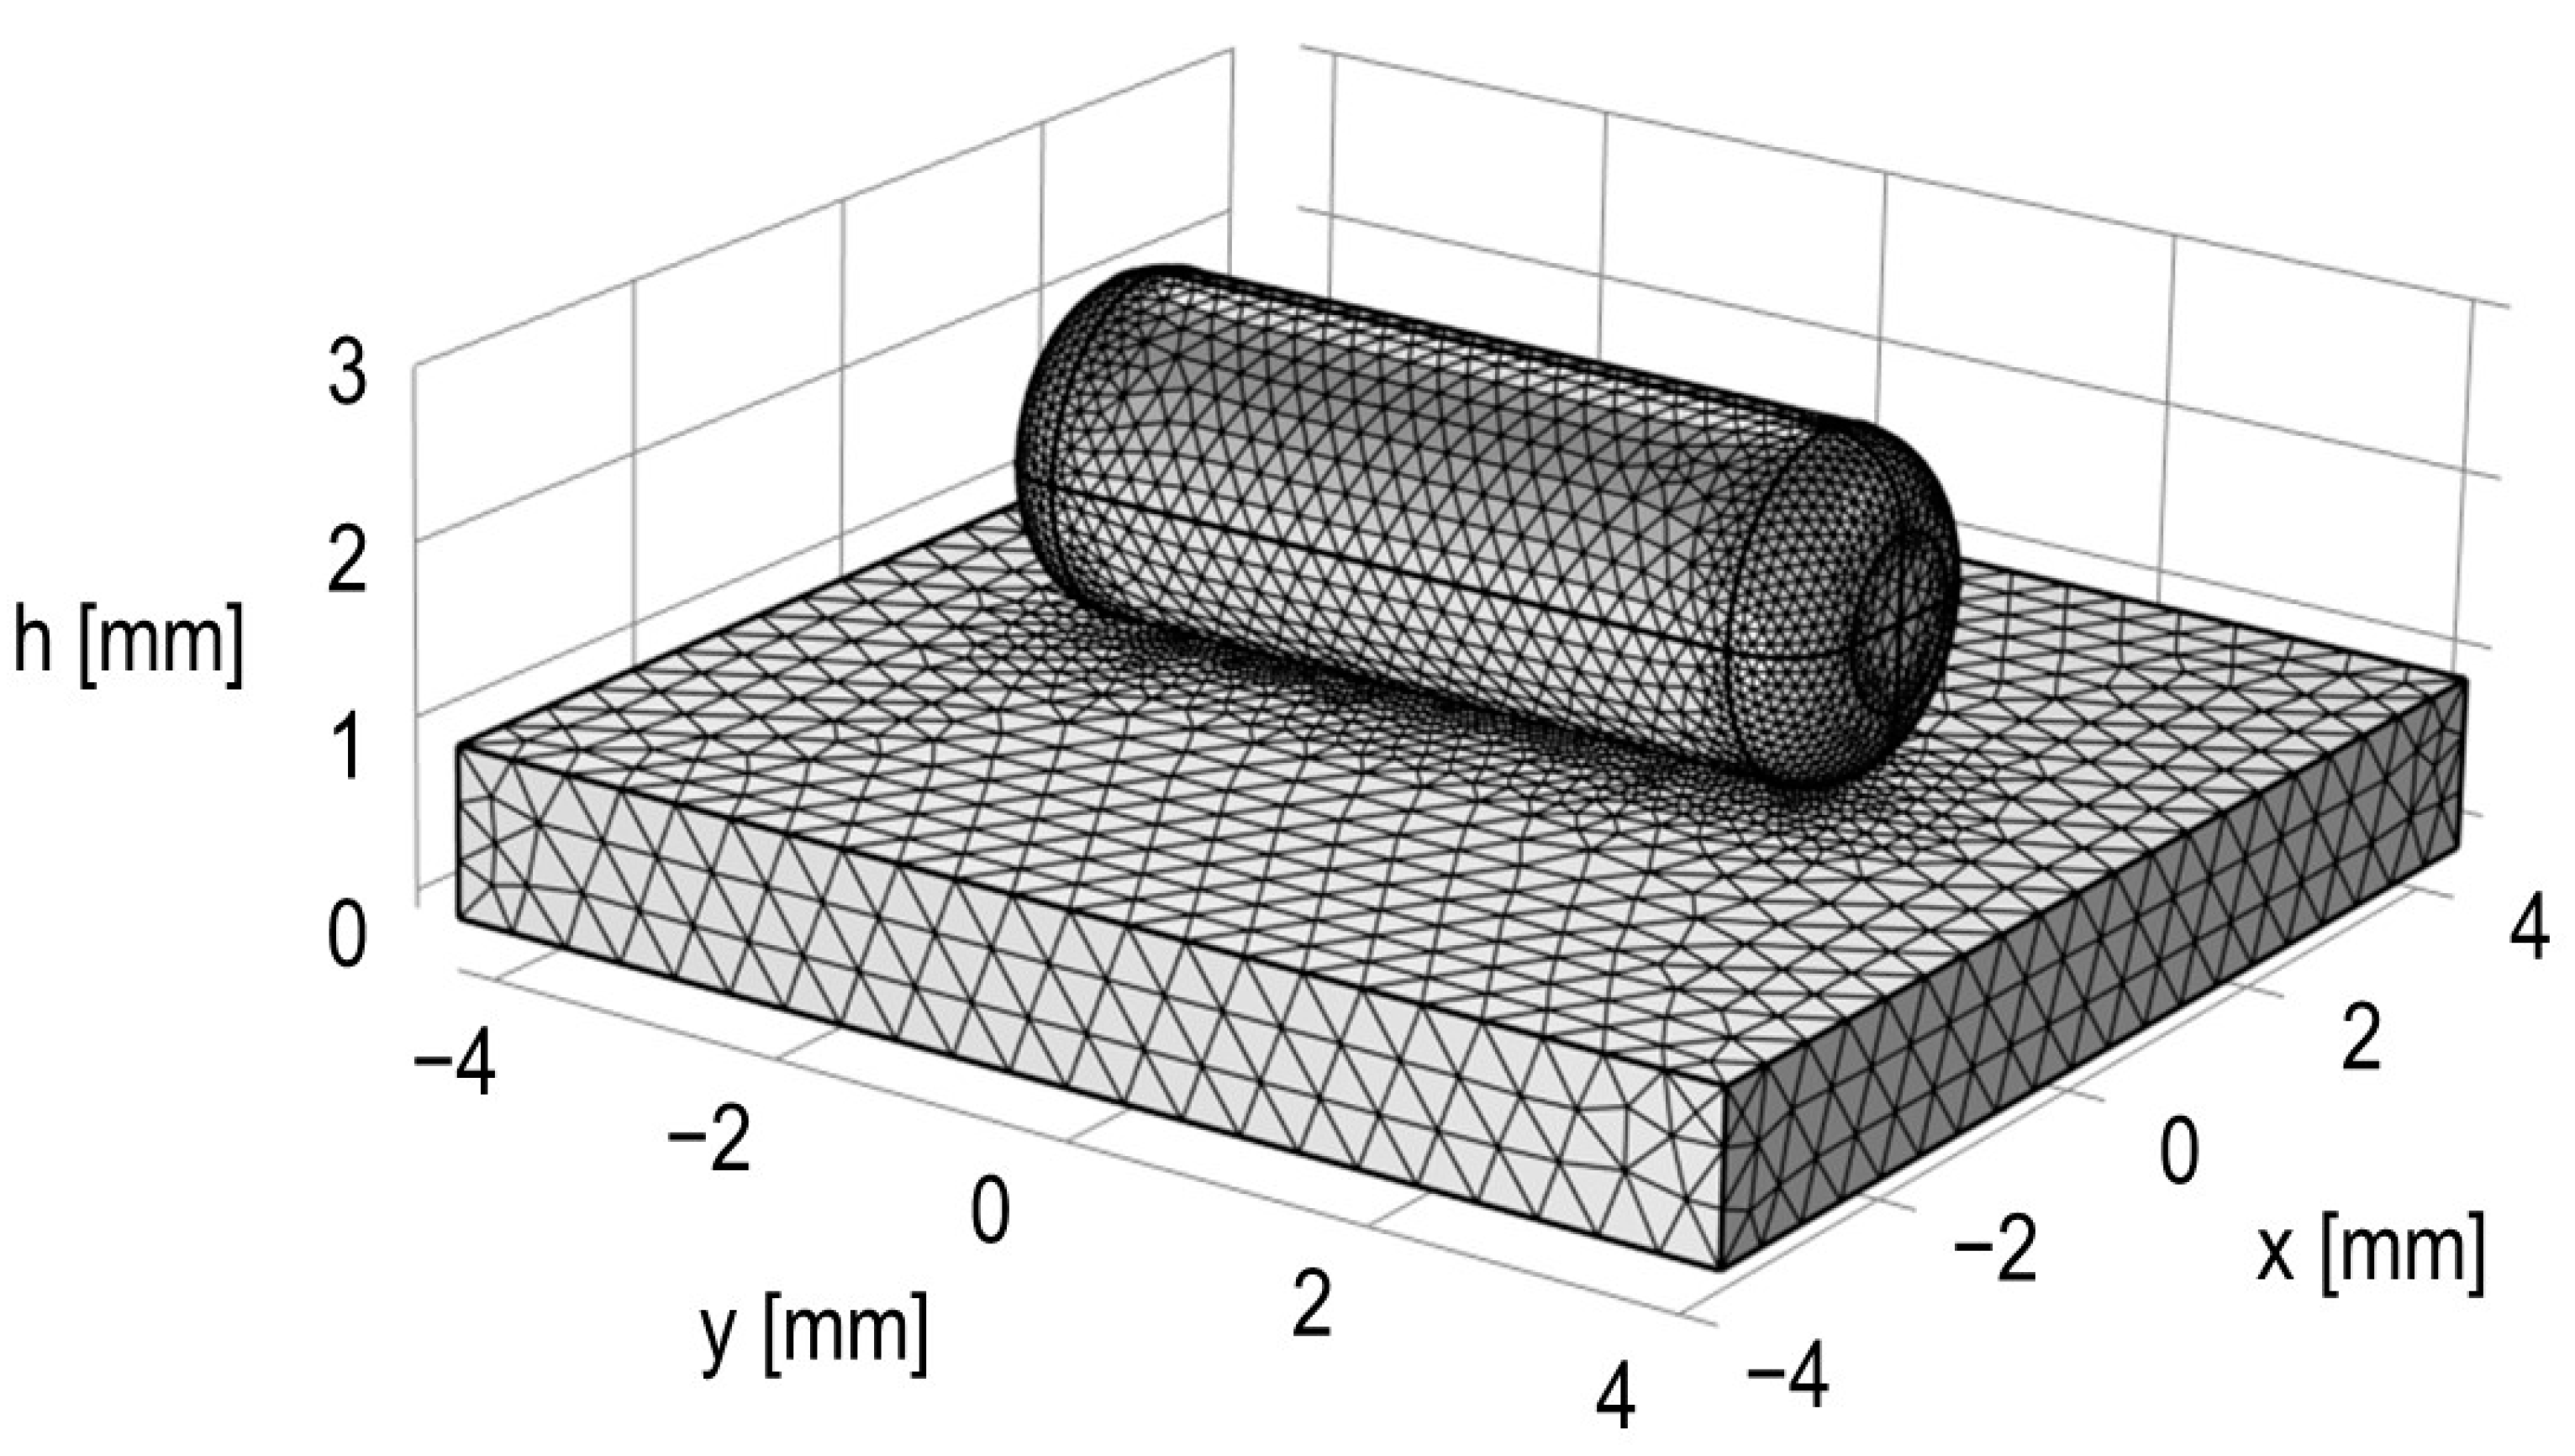
- When using this method, the oil film thickness in the EHD line contacts is determined by ignoring the capacitance generated in the chamfer of the roller end face. As a result of calculating the capacitance in the actual roller shape using FEM, we confirmed that there is generally no problem in ignoring the capacitance that occurs in the chamfer of the roller end face. However, this suggests that when the length of the roller’s straight part is relatively short compared with the total length of roller, the capacitance occurring in the chamfer part of the roller end face cannot be ignored.
- We clarified the relationship between the oil film parameter Λ and breakdown ratio α in EHD line contacts. When Λ < 3, we found that α tended to increase as Λ decreased. The reason for the large variation in the obtained test results is that running-in wear occurred in this study.
7. Patents
Author Contributions
Funding
Data Availability Statement
Acknowledgments
Conflicts of Interest
Nomenclature
| Hertzian halfwidth | [m] | |
| f | AC frequency | [Hz] |
| f(y) | height of surface roughness in y-axis direction | [m] |
| h | coordinate perpendicular to the xy plane | [m] |
| h1 | oil film thickness in lubricated area | [m] |
| h2 | oil film thickness in surrounding area expressed as | [m] |
| mean oil film thickness expressed as | [m] | |
| j | imaginary unit | [–] |
| n | number of rollers per bearing | [–] |
| radius of roller | [m] | |
| chamfer curvature at roller edge | [m] | |
| t | time | [s] |
| x | coordinate in rolling direction | [m] |
| y | coordinate across rolling direction | [m] |
| C1 | capacitance in lubricated area within EHD line contact | [F] |
| C2 | capacitance in roller straight area surrounding EHD line contact | [F] |
| C2c | capacitance in chamfer area | [F] |
| C2t | total capacitance between roller and race reflecting actual geometry | [F] |
| E | electric field strength | [V/m] |
| Fa | axial load | [N] |
| I | alternating current expressed as | [A] |
| |I| | amplitude of alternating current | [A] |
| L | length of roller straight area | [m] |
| Lt | total length of roller | [m] |
| M | bearing torque | [N·m] |
| N | rotational speed of upper race | [s−1] |
| R1 | resistance in breakdown area under a dynamic contact | [Ω] |
| R10 | resistance of the breakdown area under a stationary contact (i.e., α = 1) | [Ω] |
| root mean square roughness of roller | [m] | |
| root mean square roughness of lower race | [m] | |
| S1 | Hertzian contact area | [m2] |
| S2 | roller surface area surrounding EHD line contact | [m2] |
| T | lower race temperature | [°C] |
| V | sinusoidal voltage expressed as | [V] |
| |V| | amplitude of sinusoidal voltage | [V] |
| Ve | RMS amplitude of sinusoidal voltage expressed as | [V] |
| Z | complex impedance expressed as | [Ω] |
| |Z| | modulus of complex impedance under dynamic contacts | [Ω] |
| |Z0| | modulus of complex impedance under stationary contacts | [Ω] |
| α | breakdown ratio of oil films | [–] |
| ε | dielectric constant of lubricant expressed as | [F/m] |
| ε0 | dielectric constant of vacuum | [F/m] |
| εoil | relative permittivity of lubricant | [–] |
| θ | phase of complex impedance under dynamic contacts | [deg] |
| θ0 | phase of complex impedance under stationary contacts | [deg] |
| ν | kinematic viscosity of lubricant | [m2/s] |
| φ | polar angle | [rad] |
| ω | angular frequency of AC voltage expressed as | [rad/s] |
| Λ | film parameter expressed as | [–] |
| dimensionless number expressed as | [–] |
References
- Yin, J.; Overpeck, J.; Peyser, C.; Stouffer, R. Big Jump of Record Warm Global Mean Surface Temperature in 2014–2016 Related to Unusually Large Oceanic Heat Releases. Geophys. Res. Lett. 2018, 45, 1069–1078. [Google Scholar] [CrossRef]
- Gohar, R.; Cameron, A. The Mapping of Elastohydrodynamic Contacts. ASLE Trans. 1967, 10, 215–225. [Google Scholar] [CrossRef]
- Tallian, T.E. On Competing Failure Modes in Rolling Contact. ASLE Trans. 1967, 10, 418–439. [Google Scholar] [CrossRef]
- Maruyama, T.; Saitoh, T.; Yokouchi, A. Differences in Mechanisms for Fretting Wear Reduction between Oil and Grease Lubrication. Tribol. Trans. 2017, 60, 497–505. [Google Scholar] [CrossRef]
- Schneider, V.; Behrendt, C.; Höltje, P.; Cornel, D.; Becker-Dombrowsky, F.M.; Puchtler, S.; Gutiérrez Guzmán, F.; Ponick, B.; Jacobs, G.; Kirchner, E. Electrical Bearing Damage, A Problem in the Nano- and Macro-Range. Lubricants 2022, 10, 194. [Google Scholar] [CrossRef]
- Liu, J.; Ni, H.; Zhou, R.; Li, X.; Xing, Q.; Pan, G. A Simulation Analysis of Ball Bearing Lubrication Characteristics Considering the Cage Clearance. ASME J. Tribol. 2023, 145, 044301. [Google Scholar] [CrossRef]
- Johnston, G.J.; Wayte, R.; Spikes, H.A. The Measurement and Study of Very Thin Lubricant Films in Concentrated Contacts. Tribol. Trans. 1991, 34, 187–194. [Google Scholar] [CrossRef]
- Kaneta, M.; Sakai, T.; Nishikawa, H. Effects of Surface Roughness on Point Contact EHL. Tribol. Trans. 1993, 36, 605–612. [Google Scholar] [CrossRef]
- Sugimura, J.; Jones, W.R.; Spikes, H.A. EHD Film Thickness in Non-steady State Contacts. ASME J. Tribol. 1998, 120, 442–452. [Google Scholar] [CrossRef]
- Kaneta, M.; Ozaki, S.; Nishikawa, H.; Guo, F. Effects of Impact Loads on Point Contact Elastohydrodynamic Lubrication Films. Proc. Inst. Mech. Eng. Part J J. Eng. Tribol. 2007, 221, 271–278. [Google Scholar] [CrossRef]
- Maruyama, T.; Saitoh, T. Oil Film Behavior under Minute Vibrating Conditions in EHL Point Contacts. Tribol. Int. 2010, 43, 1279–1286. [Google Scholar] [CrossRef]
- Kaneta, M.; Nishikawa, H.; Kanada, T.; Matsuda, K. Abnormal Phenomena Appearing in EHL Contacts. ASME J. Tribol. 1996, 118, 886–892. [Google Scholar] [CrossRef]
- Yagi, K.; Vergne, P. Abnormal Film Shapes in Sliding Elastohydrodynamic Contacts Lubricated by Fatty Alcohols. Proc. Inst. Mech. Eng. Part J J. Eng. Tribol. 2007, 221, 287–300. [Google Scholar] [CrossRef]
- Nakano, K.; Spikes, H.A. Process of Boundary Film Formation from Fatty Acid Solution. Tribology Online 2012, 7, 1–7. [Google Scholar] [CrossRef]
- Spikes, H.A. Triboelectrochemistry: Influence of Applied Electrical Potentials on Friction and Wear of Lubricated Contacts. Tribol. Lett. 2020, 68, 90. [Google Scholar] [CrossRef]
- Furey, M.J. Metallic Contact and Friction between Sliding Surfaces. ASLE Trans. 1961, 4, 1–11. [Google Scholar] [CrossRef]
- Chu, P.S.Y.; Cameron, A. Flow of Electric Current Through Lubricated Contacts. ASLE Trans. 1967, 10, 226–234. [Google Scholar] [CrossRef]
- Lugt, P.M.; Severt, R.W.M.; Fogelström, J.; Tripp, J.H. Influence of Surface Topography on Friction, Film Breakdown and Running-in in the Mixed Lubrication Regime. Proc. Inst. Mech. Eng. Part J J. Eng. Tribol. 2001, 215, 519–533. [Google Scholar] [CrossRef]
- Lord, J.; Larsson, R. Film-forming Capability in Rough Surface EHL Investigated Using Contact Resistance. Tribol. Int. 2008, 41, 831–838. [Google Scholar] [CrossRef]
- Clarke, A.; Weeks, I.J.J.; Evans, H.P.; Snidle, R.W. An Investigation into Mixed Lubrication Conditions Using Electrical Contact Resistance Techniques. Tribol. Int. 2016, 93, 709–716. [Google Scholar] [CrossRef]
- Crook, A.W. Elastohydrodynamic Lubrication of Rollers. Nature 1961, 190, 1182–1183. [Google Scholar] [CrossRef]
- Prashada, H. Theoretical Evaluation of Impedance, Capacitance and Charge Accumulation on Roller Bearing Operated under Electrical Fields. Wear 1988, 125, 223–239. [Google Scholar] [CrossRef]
- Jablonka, K.; Glovnea, R.; Bongaerts, J. Evaluation of EHD Films by Electrical Capacitance. J. Phys. D: Appl. Phys. 2012, 45, 385301. [Google Scholar] [CrossRef]
- Jablonka, K.; Glovnea, R.; Bongaerts, J.; Morales-Espejel, G. The Effect of the Polarity of the Lubricant upon Capacitance Measurements of EHD Contacts. Tribol. Int. 2013, 61, 95–101. [Google Scholar] [CrossRef]
- Jablonka, K.; Glovnea, R.; Bongaerts, J. Quantitative Measurements of Film Thickness in a Radially Loaded Deep-Groove Ball Bearing. Tribol. Int. 2018, 119, 239–249. [Google Scholar] [CrossRef]
- Shetty, P.; Meijer, R.J.; Osara, J.A.; Lugt, P.M. Measuring Film Thickness in Starved Grease-Lubricated Ball Bearings: An Improved Electrical Capacitance Method. Tribol. Trans. 2022, 65, 869–879. [Google Scholar] [CrossRef]
- Schneider, V.; Bader, N.; Liu, H.; Poll, G. Method for in Situ Film Thickness Measurement of Ball Bearings under Combined Loading using Capacitance Measurements. Tribol. Int. 2022, 171, 107524. [Google Scholar] [CrossRef]
- Nakano, K.; Akiyama, Y. Simultaneous Measurement of Film Thickness and Coverage of Loaded Boundary Films with Complex Impedance Analysis. Tribol. Lett. 2006, 22, 27–134. [Google Scholar] [CrossRef]
- Manabe, K.; Nakano, K. Breakdown of Oil Films and Formation of Residual Films. Tribol. Int. 2008, 41, 1103–1113. [Google Scholar] [CrossRef]
- Schnabel, A.; Marklund, P.; Minami, I.; Larsson, R. Monitoring of Running-in of an EHL Contact Using Contact Impedance. Tribol. Lett. 2016, 63, 35. [Google Scholar] [CrossRef]
- Nihira, T.; Manabe, K.; Tadokoro, C.; Ozaki, S.; Nakano, K. Complex Impedance Measurement Applied to Short-Time Contact Between Colliding Steel Surfaces. Tribol. Lett. 2015, 57, 29. [Google Scholar] [CrossRef]
- Maruyama, T.; Nakano, K. In Situ Quantification of Oil Film Formation and Breakdown in EHD Contacts. Tribol. Trans. 2018, 61, 1057–1066. [Google Scholar] [CrossRef]
- Maruyama, T.; Maeda, M.; Nakano, K. Lubrication Condition Monitoring of Practical Ball Bearings by Electrical Impedance Method. Tribol. Online 2019, 14, 327–338. [Google Scholar] [CrossRef]
- Hamrock, B.J.; Dowson, D. Isothermal Elastohydrodynamic Lubrication of Point Contacts: Part IV—Starvation Results. ASME J. Lubr. Technol. 1977, 99, 15–23. [Google Scholar] [CrossRef]
- Cann, P.M. The Transition between Fully Flooded and Starved Regimes in EHL. Tribol. Int. 2004, 37, 859–864. [Google Scholar] [CrossRef]
- Maruyama, T.; Saitoh, T. Relationship between Supplied Oil Flow Rates and Oil Film Thicknesses under Starved Elastohydrodynamic Lubrication. Lubricants 2015, 3, 365–380. [Google Scholar] [CrossRef]
- Dowson, D. Elastohydrodynamic and Micro-elastohydrodynamic Lubrication. Wear 1995, 190, 125–138. [Google Scholar] [CrossRef]
- Puchtler, S.; Schirra, T.; Kirchner, E.; Späck-Leigsnering, Y.; De Gersem, H. Capacitance Calculation of Unloaded Rolling Elements—Comparison of Analytical and Numerical Methods. Tribol. Int. 2022, 176, 107882. [Google Scholar] [CrossRef]
- Johnson, K.L.; Greenwood, J.A.; Poon, S.Y. A Simple Theory of Asperity Contact in Elastohydrodynamic Lubrication. Wear 1972, 19, 91–108. [Google Scholar] [CrossRef]


Disclaimer/Publisher’s Note: The statements, opinions and data contained in all publications are solely those of the individual author(s) and contributor(s) and not of MDPI and/or the editor(s). MDPI and/or the editor(s) disclaim responsibility for any injury to people or property resulting from any ideas, methods, instructions or products referred to in the content. |
© 2023 by the authors. Licensee MDPI, Basel, Switzerland. This article is an open access article distributed under the terms and conditions of the Creative Commons Attribution (CC BY) license (https://creativecommons.org/licenses/by/4.0/).
Share and Cite
Maruyama, T.; Radzi, F.; Sato, T.; Iwase, S.; Maeda, M.; Nakano, K. Lubrication Condition Monitoring in EHD Line Contacts of Thrust Needle Roller Bearing Using the Electrical Impedance Method. Lubricants 2023, 11, 223. https://doi.org/10.3390/lubricants11050223
Maruyama T, Radzi F, Sato T, Iwase S, Maeda M, Nakano K. Lubrication Condition Monitoring in EHD Line Contacts of Thrust Needle Roller Bearing Using the Electrical Impedance Method. Lubricants. 2023; 11(5):223. https://doi.org/10.3390/lubricants11050223
Chicago/Turabian StyleMaruyama, Taisuke, Faidhi Radzi, Tsutomu Sato, Shunsuke Iwase, Masayuki Maeda, and Ken Nakano. 2023. "Lubrication Condition Monitoring in EHD Line Contacts of Thrust Needle Roller Bearing Using the Electrical Impedance Method" Lubricants 11, no. 5: 223. https://doi.org/10.3390/lubricants11050223