Article

Tribocorrosive Aspects of Tungsten Carbide, Silicon Nitride, and Martensitic Steel under Fretting-like Conditions

AC2T research GmbH, Viktor-Kaplan-Straße 2/c, A-2700 Wiener Neustadt, Austria
*
Author to whom correspondence should be addressed.
Lubricants 2023, 11(5), 195; https://doi.org/10.3390/lubricants11050195
Submission received: 16 February 2023 / Revised: 1 April 2023 / Accepted: 25 April 2023 / Published: 27 April 2023
(This article belongs to the Special Issue Corrosion and Tribocorrosion Behavior of Metals and Alloys)

Abstract

:
Water-based lubrication faces the common challenge of component lifetime extension which is impaired by tribocorrosion due to material surface depassivation. However, such mechanisms in a pH-neutral and low-halide electrolyte require additional understanding. A ball-on-flat configuration study of hard-phase materials in a low amplitude–high frequency sliding contact against martensitic chromium steel with contact pressures around 200 MPa is presented. Under lubrication by purified water, tungsten carbide-based metal matrix composite (MMC) with NiCr binder and silicon nitride-based ceramic (SiAlON) against DIN/EN 1.4108 steel yielded coefficients of friction above unity. Wear scar enlargement led to fretting-like conditions with adhesion becoming the fundamental wear mechanism. A tribocorrosion-induced depletion of tungsten carbide and nickel was determined for MMC. SiAlON materials suffered extreme wear under the formation of abrasive SiO2, while heat-treated DIN/EN 1.4125 steel showed lower friction and wear, but also showed signs of hydrogen embrittlement. Results from accompanying single-material corrosion experiments could not satisfactorily explain the phenomena. Including galvanic interaction and the influence of contact geometry, a new tribocorrosion model for fretting conditions is proposed. It describes an expanding anodic belt located at the inner-most crevice position of an otherwise cathodically polarized material. Low conductivity of the electrolyte is seen as a key player in this process, while the galvanic situation between two materials in contact was shown to invert when water was substituted by a wet organic phase.

1. Introduction

1.1. Water-Based Lubrication

In recent years, water-based lubrication has received growing attention [1] due to the requirements of making stationary and mobile machinery more environmentally acceptable in terms of water and soil contamination by leakage, spilling, and waste storage. This trend is nowadays fueled by the necessities of a consecutive transition away from fossil energy towards renewable energy resources and demands for the establishment of sustainable processes. Water-based cutting fluids have been in use for decades, thus taking advantage of waters’ high heat capacity, while the emulsified oil-phase provides tribological relevant properties and disperses cutting wear products into the bulk fluid. Water-based lubrication of advanced materials such as ceramics [2,3,4], polymers [5,6], and low-surface energy coatings such as diamond-like-carbon [7,8,9] is a well-researched topic. There is widespread consensus that an appropriate lubrication of metallic compounds by a water-based lubricant is hampered by its high surface energy [10], which inhibits spreading on the lubricated surface. Nevertheless, recent progress in the technical implementation for transmissions and other purposes [11,12,13,14,15] show that, by synergistic development of the utilized surface material and the lubricant additive technology, such obstacles can be surmounted. Evidently, it is also necessary to search for appropriate materials or develop surface structures or coatings, which assist in the compensation of the tribologically disadvantageous physico-chemical properties of an aqueous lubricant. The selection of the correct material requires even more attention if the lubricant-additive-to-water option becomes severely restricted, e.g., to mitigate contamination issues.
Wear-sensitive tribological situations involving conventional materials are undoubtedly affected by lower lubricity. If the lubricant’s load-carrying capacity fails to provide a sufficiently separating interphase at such contacts, deformation of the surfaces in contact combined with nearly lubricant-free slip cause sub-surface strains which may induce severe wear. The related changes in surface topography and texture make this degradation self-accelerating. In the case of a lubricant such as water with a considerable vapor pressure, excessive leakage due to defects in the sealing surfaces may quickly raise difficulties with cavitation [16].
Hence, it follows that for scenarios which were formerly solved by utilization of a (hydro)carbon-based lubricant, a reassessment of the performance in a water-based lubricant is inevitable.
The application of a water-based lubricant requires a corrosion-resistant system. Apart from conventional corrosion science, specific aspects of the (tribo-)corrosiveness of water as a lubricant, and therefore simultaneously as an electrolyte, have been widely investigated [17]. Commonly, it is closely related to the nature and strength of the electrolyte ionic composition and to a material which interacts with the electrolyte in a detrimental way. In purified water, without the option of the addition of a corrosion inhibitor, attention related to the partial pressure of dissolved oxygen or carbon dioxide is necessary. Carbon dioxide—dissolving as carbonic acid—has a direct influence on the pH level, while oxygen is the most essential contributor to cathodic reactions in aqueous electrolytes by the consumption of electrons gained from anodic sites.
According to [17], the following reactions describe the main cathodic and anodic reactions in aerated water (1)–(3). The interaction pathway of water with metal ions (Men+) in the neutral to alkaline regime (4) is by formation of metal hydroxides with generally low solubility. In the acidic regime, many metals form soluble ions (5). As a consequence, metal hydroxides dissolve in the presence of hydroxonium ions. Details about the oxygen reduction reactions (1) and (2), including the intermediate peroxide state, can be found in [18].
O2(aqu.) + 2H2O + 4e ⇆ 4OH,
O2(aqu.) + 2H3O+ + 4e ⇆ 4H2O,
Me(0) ⇆ Men+ + ne,
Men+ + nOH ⇆ Me(OH)n,
Me(OH)n + nH3O+ ⇆ Men+ +2nH2O.
Eventually, the respective metal oxides resulting from reaction (4) form a surface layer or deposit with a thickness that depends on the substrate, its galvanic relation to other materials, the electrolyte, and the limiting mass flows towards the surface. This layer cumulatively suppresses further corrosion reactions of the metal [19]. Nevertheless, mechanical degradation, adverse geometry conditions, or aggressive electrolytes may lead to corrosion of materials that otherwise form an inert passive layer [20].

1.2. Hard-Phase Materials Selected for Water-Based Lubrication

For machine elements with high demands on geometry preservation or low wear, hard-phase materials are used extensively [21]. A typical representative of this category is tungsten carbide (WC) [22,23,24,25]. Intergranular adhesion of hard phase crystallites is accomplished by a metallic binder, which makes 6–20 wt.% of the material. Different material properties can be achieved by binder quantity and composition. Such composites are summarized under the term metal matrix composite (MMC). WC-MMC fracture toughness of 8–30 MPa m1/2 [26] is superior to ceramic materials such as silicon carbide or alumina [27]. A recent review of the microstructures of cemented carbides including the discussion of structure-based functional gradients achieved by post-sintering thermal treatment has been written by García et al. [26].
Cobalt as a binder contributes to the wettability of the WC phase, a synergistic hardening by the partial dissolution of W and C during the thermal stage of material processing [28], and the preservation of the high temperature face-centered cubic (FCC) phase during cooling [26]. Commonly, Co is added via CoCr or CrCoMo alloys [22], providing hardness from 750 up to 2250 HV [26]. Nickel or Nickel–Chrome (NiCr) as hard phase binders are alternatives in acidic media, where Co may be selectively dissolved [29,30]. However, they are more difficult to blend with the hard phase and, with MMC hardness around 1200–1700 HV, are regarded as less rigid [31], but more chemically stable under anodic polarization [32]. Pereira et al. [33] elaborated improvement in exposure-based saltwater corrosion resistance of various Ni-based sintered MMC compared to Co-based representatives. Zhang et al. report that the addition of Mo to a combined WC-TiCNi MMC has a stabilizing effect of the passive plateau formed under mild anodic polarization [34].
A key property of WC aside from high hardness is the ability of tungsten to form a rigid and chemically stable oxide scale. Its formation is described by Stojadinović et al. [35], while Anik et al. studied its dissolution kinetics [36]. Although Lillard et al. observed degradation by partial hydration of the outer tungsten trioxide layer in acidic media [37], it is agreed that tungsten oxide, as well as tungsten carbide, are highly stable under such conditions. In alkaline media, however, they become gradually weakened by a partly corrosive process involving soluble tungstate anions [38].
Alternatives to MMC may be provided by employment of ceramics or ceramic-based coatings. Widely engaged representatives of this category are silicon nitride-based ceramics. Silicon nitride (Si3N4) as engineering material was developed in the 1970s [39,40], and it is used where high demands for wear resistance, corrosion, and thermal shock resistance are required [41,42,43]. Advanced ceramics developed from conventional Si3N4 material are based on a Si-Al-O-N system, which are chemically more inert [43] than Si3N4. While the α-SiAlON form (MexSi12−(m+n)Alm+nOnN16−n, with Me as Y, Ca, Li, Nd cation) is commonly of approximately isomorphous and small-sized granular structure [44], β-SiAlON grains (Si6−nAlnOnN8−n, with Y2O3 or MgO as a sintering additive) are typically of elongated shape and provide higher strength and toughness than the α-SiAlON form [45]. However, α-SiAlON hardness is substantially higher (~2000 HV10) than the β-SiAlON hardness (~1500 HV10). A common approach to combine both hardness and fracture toughness are ceramics which are based on both α and β morphology [46,47].
Typical wear maps of several ceramic species obtained under oil and water lubrication were compiled by Bhushan [48] and Hsu [49]. Fischer and Tomizawa identified several zones of wear for Si3N4 ceramics under lubrication of water and other low-molecular lubricants [50,51,52], while Gates and Hsu applied this principle for lubrication by alcohols [53].

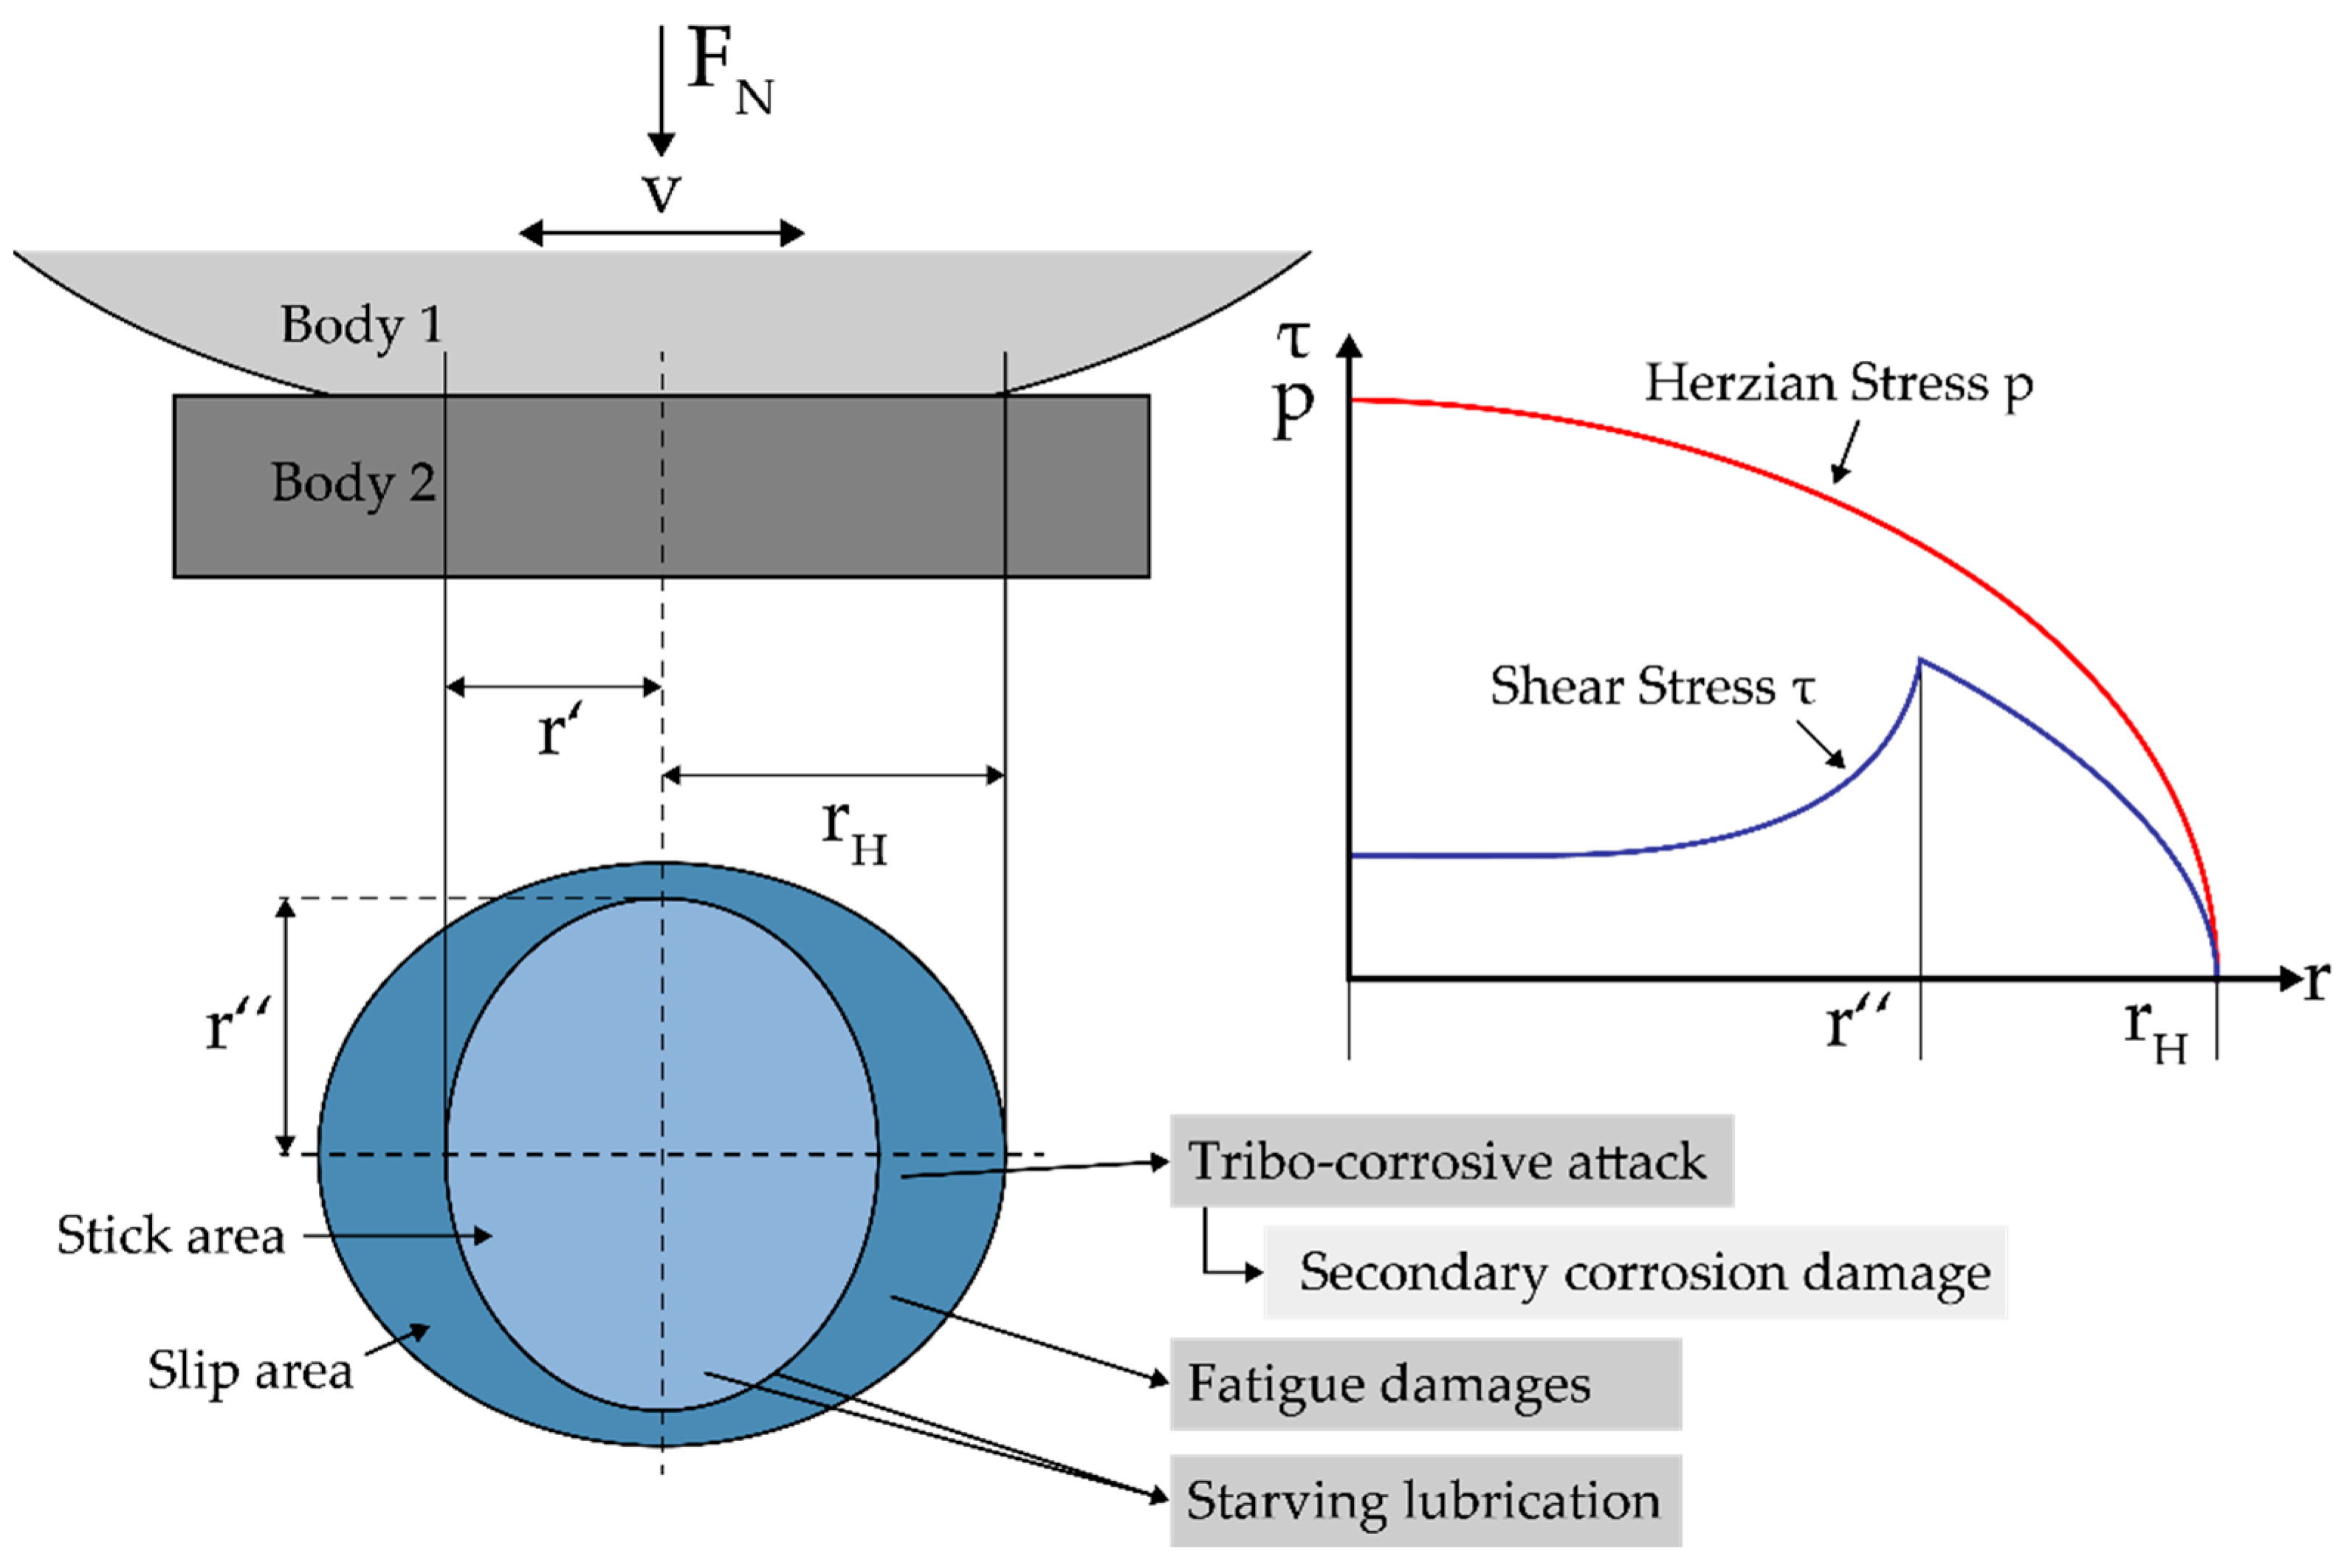
1.3. Fretting Conditions

Between solid mechanical parts, which are resting against each other, oscillations of the forces maintaining the contact lead to micro-movements of the surfaces. In 1955, R. B. Waterhouse defined fretting [54] as a particular form of wear and provided several suggestions on reducing the extent of material degradation. Unlike regular reciprocating sliding, fretting is defined as a displacement of two bodies in contact having the amplitude of the displacement δ smaller than the Hertzian radius rH of the contact area [55]. Under symmetrical conditions of the contact (e.g., a ball-on-flat situation), the eccentricity ε = δ/rH of the movement must therefore be ≤1. The displacement may manifest itself as a radial or lateral slip, an axial lift, or a combination of both movements.
Mechanically critical situations in fretting occur when strain peaks at the boundary between stick and partial slip are repeatedly induced. In Figure 1, the radius r′ corresponds to this boundary in the direction of the oscillation amplitude, while r″ represents the boundary in orthogonal direction. Shear stress τ reaches its maximum there. Degradation of the material is expected if the work of friction (WF) absorbed in the contact is above the fatigue strength. Typically for fretting, the initiation of sub-surface cracks would start around r′ or r″. Hence, fretting fatigue is a commonly observed damage pattern [56].
A second source of material damage is related to the depletion of lubricant in a fretting contact. This leads to an increase in tensile stress at the surface, whereas the increase in WF is generally observed later than in a non-lubricated fretting contact [57]. If tribocorrosion is a consequence of fretting, two main mechanisms of material damage are regularly observed:
  • Surface oxidation processes driven by energy dissipation;
  • (Mechanical or chemical) removal of the protective or passive layer.
The passive layer, mainly consisting of metal oxides, may be instantly rebuilt. Nevertheless, repeated abrasion or reforming processes lead to heterogeneities at the surface, and this makes it prone for local defects and therefore localized corrosion. The central area of the fretting contact as shown in Figure 1 is cut off from the supply of fresh lubricant and likewise from oxygen diffusion. Differences in the amount of oxygen available at sites undergoing frequent depassivation–repassivation cycles may induce the formation of a galvanic element. The anode will most likely be located at the site with the highest oxygen demand, the depassivated wear track. The potential difference that forms between this anode and the cathode, which must be within a limited distance outside the tribocontact, is evidently the driver of a corrosion current.

1.4. Tribocorrosion of Water-Lubricated Hard-Phase Materials

Tribocorrosion is, as stated by Landolt et al. [58], the transformation of a material in a synergistic activity of physico-chemical and mechanical interactions related to tribological contact. The main mechanisms are in equivalence to conventional corrosion the oxidation and dissolution of metallic compounds as the anodic corrosion reaction, although non-metal structures such as ceramics or organic materials may also react in a similar manner. The cathodic reaction is often related to the reduction of oxygen or water, but also other oxidants can play a role. Obviously, identical reactions are to be expected in tribocorrosion as in classical material corrosion, but not exclusively and in any case under different kinetic conditions.
A specific research area which investigates water-based lubricants of physiologically isotonic salinity in connection with hard phase material is biotribology [59]. More commonly, the material of choice in many tribological situations under exposure to water or moisture are steels of various grades, of which steel grades with Cr > 12% are regarded as passive metals. Additional alloying and/or specific annealing procedures provide wear-resistant materials of high strength with corrosion-resistant properties. However, such materials may fail in a corrosive environment when polarized above the critical pitting potential. Under tribocorrosive conditions, the regular corrosion mode is the occurrence of active dissolution of the material in and at the wear scar [60]. The presence of chloride ions accelerates the degradation of stainless steel surfaces by the formation of corrosion pits. The presence of mechanical surface stresses, such as exerted in a sliding contact, exacerbates the effect of chloride by the reduction of the critical electrochemical potential of pitting corrosion. Under local cathodic potentials, materials may suffer damage by elemental hydrogen. Hydrogen-induced cracking (HIC) or hydrogen embrittlement expresses itself as a possible consequence of localized corrosion. Nascent hydrogen from cathodic activity adsorbs at the material surface, migrates into so-called trap positions, and recombines to molecular H2 with the generation of high compressive stress, which leads to material fracture [59]. Due to the higher inherent stress of BCT (body-centered tetragonal) lattice, high-strength martensitic and duplex steels are in addition more prone to HIC [61] than ductile austenitic steels with FCC lattice [62].
MMC tribocorrosion was recently reviewed by Toptan and Rocha [63], with a focus on lightweight Al- or Ti-based composites, but also WC hard-phase materials were discussed. WC-based MMC tribocorrosion in aqueous media of different salinity and pH has been investigated more in detail by several research groups. One of the first articles describing the electrochemical behavior of WC-MMC is by Human et al. [64]. They state that ‘The corrosion behavior of the hard metal composites cannot be predicted from that of tungsten carbide and pure cobalt’, which is mainly due to the formation of a wide plateau of potential-independent current which was observed when scanning from cathodic to anodic. Other authors [65,66] explain this behavior as pseudo-passivity due to selective Co binder dissolution in near-neutral aqueous solutions, while WC grains become coated by a pore-free layer of WO3. Under tribocorrosive conditions in a medium of lower pH, these attributions remain valid but need to be amended by the additional influence of hard phase distribution and binder material composition [67]. As a matter of fact, the interest for hard material in the mining industry focusses on WC-MMC tribocorrosive wear investigations in an alkaline environment. In non-acidic electrolytes, researchers agree that the degradation of WC-Co MMC initiates at the hard phase grain boundary [68], where decarburization of the WC by diffusion and oxidation may occur during the sintering process of the material. This phenomenon is well known for sprayed coatings. Thakare et al. also state [69] that at a pH of >6 in an aqueous slurry, tribochemical impact is mainly due to an abrasion-related anodic current under which a passivation of the surfaces in contact is re-established. If the pH exceeds 11, the intragranular phase is preferentially attacked by corrosion which then progresses onto the WC grain, which cannot form a protective layer in alkaline [31].
At lower pH, the galvanic potential of elemental Co is less than of elemental W [70]. Corrosion current is, however, less pronounced due to the formation of a protective Co-oxide layer at anodic polarization [71]. Several authors report the depletion of MMC binder phase by Co dissolution, which leads to a mechanical destabilization of the hard phase and, consequently, to the ejection of loosely bound hard-phase particles under shear. Attempts to balance the disadvantageous corrosion situation are by a minimization of the free binder diameter (or contiguity of the WC/WC contacts), which requires smaller hard-phase grains [72], or the addition of a second hard phase (TiC, TaC, NbC) [73]. Improvements in tribocorrosion behavior at low or high pH by the complete or partial substitution of Co by Ni are reported [71], although Cho et al. [74] show in their description of uniform Ni- or NiCr-binders to WC granular phase, a micro-galvanic corrosion between the WC grains and the binder phase may occur. However, a recent tribocorrosion study of our workgroup in a CO2-rich environment was published, which included thermally sprayed WC-Cr3C2-NiCr, and elaborated this material as best performer [75].
In terms of wear resistance, the lower hardness of the elemental Ni as a binder may be counterproductive. A balancing effect is reported for the addition of small amounts of Cr [28], which forms Cr3C2 as an additional hard phase and a corrosion-resistant Cr2O3 surface layer. Tribocorrosion of Co- and Ni-based MMC is summarized in two recent review articles: Wood et al. [31] accentuated positive and negative synergies of corrosion and wear. They described the combination of a faster (wear-related) and a slower (creep corrosion) process, of which the latter is related to mechanically formed cracks. Katiyar [76] compiled corrosion, tribological, and tribocorrosion data of WC-MMC with different binder material. In his study, a four-step corrosion process is elucidated, including galvanic coupling between the (cathodic) WC hard phase and the (anodic) Co binder; this interaction resulted in binder phase dissolution. Nevertheless, some important recognitions made in corrosion studies of such materials are pending validation in a tribocorrosive environment. An example is the study of Barbatti et al. [28], who confirmed that additional nitridation to (W,Ti)C-based MMC enhances the corrosion resistance of Ni or Co base binder in 1 M H2SO4.
Based on experience with corrosion-related failures, ceramic materials are the preferred choice in water lubricated tribosystems. Although they are generally known as non-corroding, this statement is mainly restricted to the range of their chemical stability. Numerous triboexperiments involving ceramics under fretting conditions consider the degree of humidity as an important parameter affecting wear, even in the observation of per se dry contacts. Water is found to catalyze the degradation of nitrides by hydrolytic reactions (6). The formation of a -Si-OH bond is synchronous with the release of an NHx intermediate, becoming eventually NH3 [77].
Si3N4 + 12H2O → 3Si(OH)4 + 4NH3(aqu.).
A similar impact on wear was found by the studies of Kalin et al. in reciprocating sliding of self-mated silicon nitride at amplitudes of fretting dimension [78,79], whereas under oil-lubricated conditions [79], the mating surface layers contained only silicon as a contributor originating from Si3N4.
The objective of the present work is to characterize the tribocorrosive aspects of various hard phase material under fretting conditions. An interdisciplinary approach is taken from the viewpoints of tribometrology, corrosion science, and tribocorrosion. One main task is to elaborate interaction models that are valid under such fretting conditions, while another is to determine whether characteristic interactions can be defined on a material group basis.

2. Materials and Methods

2.1. Hard-Phase Materials and Electrolytes

Three categories of materials were investigated for their tribocorrosive reactions under water-lubricated fretting-like conditions. Table 1 shows the designation of the materials as used in the text and relevant material data: an MMC with WC and TiC as hard phase and NiCr as binder material, two SiAlON ceramics of α- and α/β -form, respectively, and two 1.4125 steel grades with different annealing temperature, hardened to a target hardness of 700 and 840 HV, respectively, in accordance with DIN 17022-2. These materials form the experimental matrix. Materials were dedicated to the experiments as shown in the columns to the right: Nitridized stainless steel 1.4108 was the selected counter material for all tribometrological experiments. For electrochemical measurements, 1.4112 steel was added as well-investigated stainless-steel reference material [80].
In Table 2 and Table 3, the corresponding elemental material compositions are listed. For MMC, elemental ratios, phase composition, and the porosity were estimated from microscopic and spectroscopic analysis.
Materials were tailored by a project associate partner and employed in different geometries per discipline: (Electrochemical measurements) MMC and HT1 were 1.7 mm diameter spheres; 1.4108 and 1.4112 were frontal-face hard-turned cylinders of 4.5 mm diameter. (Tribometrology) The preparation of flat samples of MMC (from spheres as above) and SN1 (from spheres of 3.0 mm diameter) is described in the subsequent tribometer section. SN2, HT1, HT2 were prepared as polished flat discs of diameter 12.0 mm (HT1; HT2) and 25 mm (SN2), and 1.4108 counter bodies as hard-turned spherical segments with a radius of 16 mm. With 1.4108 steel as the curved and all other geometries as the flat component, a ball-on-flat configuration in tribometrological experiments was attained.
Two electrolytes/lubricants were investigated, and their composition and their physico-chemical properties are according to Table 4: purified water (W1) and an organic processing fluid (F1) with arbitrarily provided moisture by adding around 1 wt.% of W1. Both F1 and W1 are transparent solutions without precipitate or emulsified phase. Chloride is present far below the corrosion-critical value of 100 ppm. W1 includes a Na-acetate buffer of 0.14 ± 0.01 mmol L−1, and the resulting pH is 6.6–7.0.

2.2. Tribometer Configuration

Triboexperiments were performed with an SRV®5 tribometer (Optimol Instruments Prüftechnik GmbH, Munich, Germany) with a low load (up to 200 N) tangential force element at room temperature (22–26 °C) and a modified transducer with a constant amplification ratio. A specific adapter for the investigation of small spherical samples was manufactured (Figure 2a). Spheres serving as base body material were embedded into a polyphenolic resin, ground, and wet-polished to equatorial height with diamond paste. The electrical contact was formed by pins inserted from the embedded side. Disc-shaped materials were similarly placed as base body in the holder without further adaptation. Spheres not in operation in the respective experiments and crevices to the adapter were insulated by ethanolic polyvinyl butyral (PVB) solution. The samples were rinsed with a minimum of ultra-pure water before and after the experiment and then stored in a desiccator for further surface analysis. The counter body holder was fitted with an insulating basket to allow for the active inclusion of the counter body material in the electrochemical experiment (Figure 2b).
Table 5 shows the parameters of the SRV®5 tribometer runs. Friction was steadily recorded as an average over 50 cycles as well as per HSA® true data measurements at a rate of 1000 data points per cycle at a pre-scheduled experimental progress (25/50/75% of the entire runtime). The duration of runs with F1 was adapted to account for evaporative losses of volatile organic compounds (VOC) and thus the composition of F1. The pre-set value Fn_set compensated the modification of the upper specimen holder with respect to the higher pending weight. A normal load Fn of 2 N corresponded to an initial contact pressure of approximately 200 MPa and an initial contact diameter of 43 µm (MMC/1.4108 contact). Positioning accuracy of the counter body on the flat specimen was determined prior to experiments involving the carrier with embedded hemispheres (Figure 2a) by PTFE tape imprint and found to deviate < ±0.4 mm from the target center. Pre-tests delivered an effective loss of 4 µm per half-stroke due to elastic properties of the setup. Thus, the initial conditions with 92 µm stroke length coincide with the boundary between reciprocating sliding and gross slip fretting mode [57]. Gross slip was achieved shortly after the start of the respective experiment due to wear-related surface alignment.

2.3. Electrochemical Measurements

2.3.1. Specimen Preparation

The materials MMC and 1.4125 HT1 (embedded spherical specimen) as well as 1.4108 and the reference material 1.4112 (embedded flats) were investigated in a sequence of electrochemical experiments with W1 as the electrolyte (referred to as ‘electrochemical laboratory experiments’). MMC and HT1 spheres were molded into insulating cylindrical carriers and contacted by harness from the rear. As insulation media for the cylinder-to-specimen crevice, PVB solution was applied. The electrical contact resistance was verified to be below 10 Ohm. Prepared steel samples of 1.4108 and 1.4112 steel were similarly embedded as cylinders with the exposed segment of the machined surface facing the electrolyte. Acid-free silicone (AS1745, ACC silicones Europe, Bridgwater, UK) was used to protect the lateral side of the cylindrical specimen and the carrier harness parts against electrolyte contact. The surfaces exposed in the electrochemical experiments were approximately 2.2 mm2 for the MMC and 14.8 mm2 for the steel parts. These areas were used in current density calculations.

2.3.2. Electrochemical Experimental Setup

Parameters of the electrochemical measurements are listed in Table 6. All experiments were carried out at room temperature (23–25 °C). Potential values mentioned in the results discussion refer to the difference versus the respective reference electrode of the method unless stated otherwise. The electrochemical measurements on the tribometer comprised the measurement of the open circuit potential (OCP) of either the base body material or the counter body material versus a leak-free reference electrode suitable for both aqueous and organic electrolytes (Ag/AgCl/KCl 3.4 M gel electrode et072, eDAQ, Inc., Denistone East, Australia; E0 = +0.206 V vs. NHE). The triboexperiments were conducted with a Parstat 4000A potentiostat (Princeton Applied Research, Ametek Scientific Instruments, Oak Ridge, TN, USA) in a 2-electrode setup with the working electrode (WE) connection at the counter body. In the experimental results discussion of this work, this mode is later referred to as B-RE. Except for ceramic materials, WE harness was adapted by an alternator which allowed us to operate the base body material as the WE against the RE (mode A-RE).
The vertical approach and withdrawal of the counter body effected changes in the measured potential due to a different amount of surface wettened by the electrolyte. To better assess the potential change during sliding, a settling period of at least 900 s was introduced to allow for the WE potential to stabilize before the triboexperiment. After the triboexperiments, a measurement of the OCP stabilization in W1 was performed for a minimum of 6000 s. In F1, this period was shortened by evaporation.
The electrochemical laboratory experiments comprised a consecutive series of measurements with the same WE specimen: determination of the OCP; a brief cathodic polarization (CC) which investigated the response of the materials in cathodic and followed by a recovery period of at least 3600 s; a non-destructive cyclovoltammetric measurement (CV); and the recording of a polarization curve (PDYN) between −1.2 V and +1.6 V. As a potentiostat, a Versastat 3F (Princeton Applied Research, Ametek Scientific Instruments, Oak Ridge, TN, USA) was used in non-floating mode. All potentials mentioned in the discussion of the electrochemical laboratory experiments were versus reference electrode (RE), which was an Ag/AgCl/NaCl 3M type K0265 (Ametek Scientific Instruments, Oak Ridge, TN, USA; E0 = +0.209 V vs. NHE). The RE was introduced into the electrolyte via a Luggin capillary filled with a conductive gel. The capillary tip was directed laterally to the exposed WE surface at 1 mm distance. As a CE, a Pt coil opposite to the WE and in the distance of approximately 100 mm was used. W1 solutions of 250 mL volume were left open for aeration and stirred by a magnetic stirrer at the same speed throughout. All electrochemical experiments were repeated at least twice for each material. Accidental Cl contamination due to the infiltration of RE/Luggin filling was ruled out by comparing W1 conductivity values before and after the experiments.
The electrochemical laboratory experiments included also additional potentiostatic measurements (PSTAT) with pristine MMC specimen, which were performed in W1 after the determination of the OCP. The setup was identical with the other measurements of this series. The potential and duration of the PSTAT measurements were derived from the previous measurements and are listed in the results section.

2.4. Surface Analysis

Visual inspection and imaging of the wear tracks after the experiments was by light microscopy. The wear scar diameter (WSD) corresponds to the maximum extension of the wear track perpendicular to stroke direction. Three-dimensional topography measurements were carried out by a Leica DCM 3D confocal white light microscope (Leica Microsystems GmbH) at a z-resolution of below 10 nm.
Scanning electron microscopy (SEM) was performed in a JEOL JSM-IT500LV equipped with a Bruker Quantax® energy dispersive X-ray spectrometer (EDX). X-ray photoelectron spectroscopy (XPS) analyses were obtained on a Thermo Fisher Scientific Theta Probe® with monochromatic Al Kα X-ray source (1486.6 eV). The base pressure of the system was 2 × 10⁻⁸ Pa. High-resolution spectra were acquired at 50 eV pass energy. Peak fitting was performed with the Thermo Fisher Scientific Avantage® Data System software, using Gaussian/Lorentzian curve fitting. The C1s peak for adventitious carbon at 284.8 eV was used as a binding energy reference. Sputtering of the samples was done with 3 keV Ar+ ions. Chemical state information was derived using Avantage® in-built peak energy association as well as the NIST spectroscopy database, which is available online [81].

3. Results and Discussion: Triboexperiments

3.1. Experiments in Electrolyte W1

The work of friction WF as system energy uptake is the most influential parameter under fretting since mechanical deformation and friction temperature determine material and interface properties as well as the degradation mode. Friction results are presented as continuous curves of the coefficient of friction (COF) versus time as well as the position resolved friction µ(x) at around the half-time of the experiment. The loop integral over this curve corresponds to WF. WF, µ(x), and COF are linked via Equation (7):
C O F = x m i n x m a x   µ ( x ) 2   ( x m a x x m i n ) = W F ( F N 2 s ) ,
with xmin and xmax being the extremities of the stroke length s.
Typical results of the evolution of the COF can be found in Figure 3a for the materials MMC, SN1, SN2, and both 1.4125 steel grades, all against counter body 1.4108 steel.
Friction in W1 was found to reach unusually high values, which indicated severe interaction such as adhesion or large-scale plastic deformation of the mated surfaces. Most materials showed a pronounced running-in behavior until fairly constant friction was attained. Except for SN2, COF was lowest after start, and values between 0.6 (HT2) and 1.2 (MMC) were measured. Steady-state friction of MMC, SN1, and SN2 ceramics established in the progress of the experiment at values substantially above 1.0, with MMC manifesting the highest values of 1.6. Ceramics SN1 and SN2 matched at friction around 1.2. By contrast, HT1 and HT2 steel showed friction reduction after a brief running-in, and final COF was close to 1.0.
High-frequency data acquisition of the position resolved friction (Figure 3b) allowed an insight into dynamic effects not visible from COF. For most of the material combinations, friction force peaks occurred at the onset or during sliding which resembled slip-stick behavior: MMC/steel was found to have a maximum static coefficient of friction at stroke extremities but sliding at constant friction in-between. When the running-in period was completed, maxima of µ(x) per cycle reached in steady state an average 1.3 to 1.5 times the overall COF. The same effects, but weaker pronounced were obtained from steel/steel measurements. In contrast, in ceramics/steel contacts, oscillations of µ(x) were more pronounced at constant sliding velocity. The amplitude of these oscillations increased with the progress of the experiments, which was most likely a consequence of the broadening wear scar. From the perspective of fretting conditions, such a behavior can be interpreted as the expansion of the central, non-lubricated area of the contact (as shown in Figure 1). Increasing this area obviously favors slip-stick effects. The stronger expression of oscillations was found for SN2, where the µmax/COF ratio reached values around 2.0. SN1 µmax/COF ratio was between 1.4 and 1.7. Thus, the expression of local friction maxima obviously depended on the detailed composition of the ceramic material, while the impact on wear was comparable for both.
Related to steady-state friction and wear scar diameter, material groups can be ranked according to the summarizing results in Figure 3c:
  • High friction, high wear: SN1, SN2;
  • High friction, moderate wear: MMC;
  • Moderate friction, moderate wear: HT1, HT2.
It is therefore possible to make a clear differentiation between the material groups. This group-wise behavior indicates further different modes of interaction between the investigated base body materials and the stainless steel counter body.

3.2. Experiments in Electrolyte F1

F1 tribometrological data are likewise summarized in Figure 4.
COF of MMC against 1.4108 steel was much lower in F1 than in W1, with rather static values around 0.3 after a short running-in period (Figure 4a). The position resolved friction µ(x) shown in Figure 4b was flat, without any oscillations occurring at a later stage of the experiment. Friction of SN1 ceramic against 1.4108 steel was comparable to that of MMC at the beginning of sliding, but already increased substantially during running-in. SN2 ceramic friction showed an instantaneous rise immediately after start, reaching with 0.85 a similar peak value as SN1, and maintaining this level throughout the experiment. Similar to W1 experiments, ceramics showed major differences in their position resolved friction µ(x): While unidirectional friction of SN1 ceramic was steady and the hysteresis became homogeneously broader with increasing time, the immediate increase in SN2 ceramic COF appeared to be a consequence of slip-stick oscillations occurring after a proportional increase following the turnaround. Although 1.4125 HT1 and 1.4125 HT2 materials were not investigated in F1, data of comparable experiments can be found in [82,83].
Related to steady-state friction and wear scar diameter (Figure 4c), investigated material groups in F1 can be ranked by:
  • Moderate friction, moderate wear: SN1, SN2;
  • Low friction, low wear: MMC;
Thus, discrimination between the investigated material groups is possible, as in W1.

3.3. Contact Surface Analysis

The two domains of friction observed in W1 (MMC, SN ceramics with COF ≥ 1; HT1/HT2 steel with COF ≤ 1) expressed themselves in different wear mechanisms. Optical and SEM images of the various material combinations are shown in Figure 5, Figure 6, Figure 7 and Figure 8. MMC/1.4108 steel combination (Figure 5) was characterized by a negligible wear volume of MMC, while the steel counter body suffered severe abrasive wear, leading to a disappearance of the manufacturing groove profile. A domain of adhesive wear was found in the center of the contact, where material transfer from steel to MMC was observed. This cross-welded material was visible in the optical microscope as a brighter spot. Details from this location obtained by elemental analysis showed that the highest intensities of Fe did not coincide with a higher concentration of oxygen, and therefore metallic material must be assumed (Figure 5a, bottom row). Closer to the wear scar edge, Fe and O occurred simultaneously, indicating oxidative conditions (Figure 5a, right). From MMC to steel (Figure 5b), no material transfer was observed which may be due to the ploughing effect of the WC grains on the steel surface. Ray-like structures were found within the wear area of the steel part close to the edges (Figure 5b, right). Their nuclei were identified as Cr-rich hard-phase particles which were dislocated from their position and rubbed into the softer steel matrix.
The worn areas in ceramic/steel contacts (Figure 6) were much larger than for MMC/steel contacts. Wear track centers were typically characterized by a combination of adhesion and mutual material transfer. Fe-rich material was deposited around the contact area of the ceramic body (Figure 6a). Within the ceramic’s wear scar (Figure 6b right), locally compacted debris is found, mostly composed of SiO2 and FexOy, and surrounded by abrasion grooves. The co-existence of high concentrations of Si and O inside and outside of the steel wear scar (Figure 6b bottom) indicated a fretting-induced decomposition of the Si3N4, most likely by the generation of a nanocrystalline SiO2 abrasive powder [84]. These particles acted as a wear-promoting third-body in the tribosystem and were seen to be responsible for the extremely high friction. Two recent research articles discuss the influence of third-body hard-phase particle size and agree that friction losses can dramatically increase at certain particle dimensions, which is related to a chiseling effect of the debris [85,86].
The microscopic image of the HT1/1.4108 contact showed an expressed center in the HT1 wear scar (Figure 7a), where grooves from sliding wear appeared sharp-edged and less regular, thus attenuating light reflection under macroscopic view. In contrast, HT2/1.4108 contact was mostly dominated by mild grooves without breakdown zones of the material (Figure 8a). Observations on both materials were consistent with those on their 1.4108 counter bodies (Figure 7b and Figure 8b). In the rougher zone of HT1 contact area, small cavities were observed, surrounded by flakes of deposited material (Figure 7a, right). These flakes were undoubtedly formed after the triboexperiment since they were retrieved in the sliding area. These cavities were mostly located at or within carbon-rich sites and evidently generated by tribocorrosive processes. Interpreting this as a typical indicator of HIC at high hardness martensitic surfaces, acidic conditions can be assumed at the position of their appearance rather than strongly cathodic potentials. Consequently, fretting conditions on such a material promote the formation of acidic zones in a neutral electrolyte, where hydrogen evolution potential is comparably higher. The transfer of hydrogen across the solid–liquid interface would be facilitated by the depassivation of the material due to fretting—leading to a reduction of hydrogen evolution overpotentials—or by surface strains occurring under fretting conditions. Recombined H2 arising from bulk metal would locally create highly acidic sites, where a stainless steel surface might lose its inertness towards acidic corrosion, and transpassive dissolution would occur. The HIC-corroborating post-triboexperiment deposit piles around the assumed hydrogen corrosion sites were most likely Fe3+ containing oxides, which had reached their limit of solubility. Hence, a severe secondary degradation phenomenon beside the mechanically induced wear by fretting was observed.
Wear tracks of all contacts obtained in the triboexperiments with F1 were substantially slimmer than those obtained with W1. The most significant reduction of the wear scar width occurred in MMC/1.4108 steel contact (Figure 9), which correlates with the COF reduction from 1.4 to 0.3. Nonetheless, a comparable, albeit smaller central area formation on the MMC surface with an optically bright spot was found (marked area in Figure 9a). This spot was surrounded by an outer parenthesis-like ring of deposits. Central area surface deposits were C-rich and therefore predominantly organic, mixed with metal and metal oxides. In the spot center, an excess of Fe compared to O showed that running-in conditions in F1 (Figure 4, MMC line) may have included an adhesive part as well, during which a slim layer of steel material adhered on MMC. Later in these experiments, following asperity removal on both materials, organic F1 could well penetrate the entire contact area, and the tribological interaction became mild sliding wear without a lack of lubricant. Low wear of the steel counter body was confirmed by a preservation of the manufacturing groove pattern on the upper body (Figure 9b). Wear particles deposited outside of the wear scar could be identified by their typical bright-lemon color as debris from a WO3 scale. The dominance of WO3 in comparison with FexOy showed that tribocorrosion mechanisms are still present when an aqueous phase (W1) was substituted by an organic phase with low water content (F1). Oxidizing conditions prevailed in the contact, but unlike in W1, WC seemed to have to oxidize sacrificially in favor of the steel material.
SN1 and SN2 ceramics against steel behaved in F1 similarly as in W1, except that the wear rate was generally less. Abrasion played an important role in SN1 wear (Figure 10a,b), although central spots showed contribution from adhesion. In SN2 wear (Figure 10c,d), adhesion was the preferred wear mode. The unequal distribution of Fe and O within the wear scars on SN2 again characterized a metal transfer from the counter surface. Encompassing the wear scar tightly, a homogeneously composed Fe/O-containing ring of wear particles indicated the deposition of abraded material. Thus, wear occurred on both bodies in contact. The individual wear mode may be derived from a correlation of the ceramic wear profile to the respective friction hysteresis data. A steady but very high friction µ(x) could be correlated with a single predominant wear mode, e.g., adhesion, while oscillations of µ(x)—or: slip-stick behavior—might indicate a dual wear mode, e.g., adhesion and abrasion. In fact, the existence of numerous small metal-containing seizure spots on the entire SN2 contact surface gave an explanation why position resolved friction oscillated stronger with this material. It can be considered that adhesive forces and material cohesion might be of the same level, and when surface boundary stress would exceed a threshold value, periods of slip under strain relaxation would occur. In SN1, adhesion dominated large parts of the fretting center, thus changes in friction occurred only when starting to slide from the end points. Nevertheless, it can be stated that the extremely high wear rates neither suggest β-SiAlON (SN1) nor α/β-SiAlON (SN2) as material in such a contact. Whether some aspects of wear are related to a specific SiAlON-structure needs further investigation.
Confocal white light microscopy was applied for the additional investigation of SN1 ceramics wear mechanism. The results shown in Figure 11 confirm the synergetic appearance of severe abrasion and the formation of nano-scale wear particles in W1 (Figure 11a). The non-lubricated central fretting area was evidently the primary source of these particles. By stroke movement, the particles gradually migrated in the role as an additional abrasive towards the edge of the wear scar, where they were deposited.
Under F1 lubrication (Figure 11b), wear was less severe and under closer observation also of a different manner. No central wear area was formed, and the deposition of wear particles directly at the wear track was negligible (most particles were deposited outside of the depicted area, apparently due to a lower coalescence of the wear particles in F1 than in W1). The wear mode is in this case more related to adhesive processes: Fracture patterns from torn-out debris at the bottom of the grooves exhibit a mesh structure of bulk SiAlON material.
Thus, the interaction of 1.4108 with SN1 under W1 lubrication and under F1 lubrication can be tribochemically distinguished. In W1, starving lubrication led to the formation of chemically aggressive conditions, accelerating the decomposition of Si3N4 in accordance with reaction (6), presumably at the grain boundaries. This reaction must be supplemented by the dehydration reaction (8), which led to the generation of abrasive particles. It should be noted that reactions (6) and (8) describe the decomposition of Si3N4 which is not corrosion-based.
Si(OH)4 → SiO2 + 2H2O.
The formation of SiO2 is an indicator that the water molecules can be easily split off in such conditions, which is feasible under higher temperatures and acidic conditions. A major absence of water would as well shift this reaction towards the product. F1 might have not contained enough water to trigger full Si3N4 decomposition. It is assumed that adhesion as the result of insufficient lubricity of the organic compound exerted strains at the ceramic material surface, which were then the source of the observed fractures. The experimentally determined early rise of COF to an approximately constant level confirmed that the individual wear modes in W1 and F1 initiated as soon as fretting conditions are fulfilled.
Some discrepancy of this result to the findings summarized in a Si3N4 wear map for water [48], where the current conditions (sliding speed 10 mm s−1, mean Hertzian pressure 0.2 GPa) would clearly match an adhesion-free micro-abrasion scenario, can be well explained by (a) fretting conditions instead of gross sliding conditions, which make fatigue and thermal impact more relevant; (b) the mating of different materials instead of self-mated materials; and (c) the specific tribocorrosion situation in fretting, leading to surface activation and therefore a higher interaction rate between the individual materials.

3.4. Triboexperiments Combined with OCP Measurement in Electrolyte W1

Tribometrological investigations were extended by the inclusion of OCP measurements. Monitoring of the OCP is an essential method in tribocorrosion science to display the balance between depassivation by sliding wear and the antagonistic repassivation reactions, which limit material dissolution. The counter body was the standard WE (mode B-RE). If a conductive material was used as the base body (MMC, HT1, HT2), it was selected at least once per material combination as WE (mode A-RE). In most of the experiments, both modes A-RE and B-RE were employed at least once before and during sliding, and at least once after the end of sliding in the OCP recovery period. After mode switching, no potential bias was detected. Except for the case of a tribocontact situation, the respective other material was thus temporarily excluded from the circuit. However, during sliding, the low ohmic connection of both materials via tribocontact included contributions from each material to the overall potential, according to the mixed potential theory.
In Figure 12, results are summarized for the evolution of OCP during the triboexperiments with different material pairs in W1. Figure 12a shows elements of a typical measurement: the potential stabilization before contact, lasting until motionless pre-load contact is performed at the tribometer (T-I); the potential drop during (T-II); and the potential recovery after the triboexperiment (T-III). In the same figure, the potential curves obtained for SN1/SN2 against counter body 1.4108 are shown. Figure 12b–d represent the respective potential curves obtained for MMC, HT2, and HT1 materials against counter body 1.4108, and the individual potential of 1.4108 of the same experiment when measuring in alternating mode (B-RE and A-RE mode, as shown by material icons).
In theory, rubbing leads to a removal of the passive layer, which goes hand in hand with an increase in the metal dissolution rate. The associated behavior of the potential with depassivation is a decrease, exerted by an increasing anodic current density. In our experiments, aerated conditions were present. Thus, in a first approach, the cathodic current was not considered to limit the corrosion reaction; hence, dissolution continued. With the broadening of the wear scar, the available area of the anodic reaction increased; hence, the potential decreased further. The most clearly pronounced drop of the potential was with the ceramic materials SN1 and SN2: Immediately after the onset of sliding, 1.4108 potential became dramatically lower, and quickly stabilized below −0.2 V. This value was widely preserved until the end of the run; therefore, no protective tribolayer—which may furnish a barrier to the anodic dissolution—was formed. In combination with MMC (Figure 12b) or HT2/HT1 steels (Figure 12c,d), 1.4108 counter material reached its end potentials more gradually and remained at higher values of −0.16 V and −0.14 V, respectively.. This may either indicate the formation of a protective tribolayer, a smaller proportional area of non-passivated material (which is in good correlation with the gradually slower expansion of the wear area), or a potential balancing reaction since more than one material is involved.
When sliding stopped, the potentials of all materials recovered approximately to their original value. It is an excellent indicator of full metal surface repassivation when the potential before start and the recovered potential after the triboexperiment match. Small deviations may be related to minimal changes of the immersion.
Differences between the potentials measured for the individual material combinations occurred as well during the recovery period: Although, at the end of measurement, the potential of all the 1.4108 steel counter bodies was comparably similar, an overlay of the 1.4108 steel potential evolution after the end of sliding did not yield identical progress of the curves. On the one hand, wear scar diameter (by affecting the ratio between depassivated and passivated area) and small deviations in the wetted area of the counter material contributed to the difference between the potential trends. On the other hand, material transfer and formation of deposits individually influenced the general potential level. With more than one material in the electrical contact (such as during sliding), individual potential-current density units of those components superposed to form the overall potential. Therefore, the potential of 1.4108 was biased by the respective counter material.
This was the case immediately before and during the triboexperiment (see the shift of both individual potential at the end of T-I period in Figure 12d, where HT1 and 1.4108 went into contact). Against ceramics, no electrochemical involvement of another metallic component was present. Hence, those curves can be regarded as the most typical for rubbed 1.4108 steel. At the end of the triboexperiment, all conductive base body materials of this investigation were at more positive potentials than 1.4108 steel. For this reason, in an electrically joined constellation, they represented a macroscopic cathode. Therefore, 1.4108 steel was the macroscopic anode, and electrons migrated from 1.4108 steel to the counter body material. This finding may be converted into electrochemical reactions: Being 1.4108 steel the anode, metal dissolution was thus its major reaction. The cathodic reduction reactions such as the reduction of dissolved oxygen occurred dominantly on HT1/HT2/MMC surface. However, some less expressed cathodic reactivity may still be assumed on 1.4108 steel non-rubbed surface. Nevertheless, such an outcome is a clear indication of a galvanic interaction between the two materials, which is promoted by fretting.
Another important aspect was found for HT1 steel. As indicated in Figure 12d, several potential breakdowns were recorded at a substantial time after the end of the experiment. The potential forming on a long-term scale after each drop can be nevertheless still associated with the overall trend. Commonly, a local removal of the passivation layer by sliding wear manifests itself in an immediate drop in potential. In contrast to wear-related phenomena, potential drops occurring in the long term after the triboexperiment tended to form smooth transitions, particularly at their onsets. In combination with the results obtained by microscopy, these potential-drop-and-recovery events represent most probably a scenario of H2 outgassing, described by the following steps:
  • Fretting-assisted adsorption of a hydrogen donor such as acid or water followed by cathodic reduction and the migration of atomic hydrogen across the depassivated metal surface into bulk material;
  • The formation of typical cleavages [87] initiated in bulk metal as by common HIC theory;
  • Cleavage crack expansion to the steel-electrolyte interface;
  • In presence of a reductant (e.g., O2, Fe3+), H2 oxidation to H3O+;
  • Acidic attack of the pristine and highly active interior cleavage surface causing the drop of the potential;
  • The cleavage surface repassivating after outgassing, leading to potential recovery.
Thus, HIC mechanisms can also be identified in the posterior period of a triboexperiment by means of a characteristic potential trend: The higher hardness of HT1 steel evidently promoted HIC, while the softer HT2 steel did not show signs of H2 outgassing. This means that the integration of atomic hydrogen into bulk material is supported by the distortion level of martensite BCT lattice. Hence, the second important recognition derived from this experimental result is that a fretting contact between such stainless steels may promote the formation of elemental hydrogen.

3.5. Triboexperiments Combined with OCP Measurement in Electrolyte F1

The tribocorrosion experiments with F1 as electrolyte were similarly conducted as those with W1, except that the period of sliding was shortened to 45 min. The measurement mode was exclusively B-RE. The initial period T-I was kept short due to F1 volatility, and contacting under pre-load was performed for 30 s. After the end of sliding, around 1 mL additional F1 was briefly added to compensate for evaporation losses, permitting us to follow the OCP trend for several more minutes.
Although F1 composition is nearly 99% organic, the aqueous contamination was sufficiently high to enable disturbance-free measurements. A major difference was, as shown in the tribometrological section of this work, the higher load resilience of F1 and the less pronounced transitions of static and sliding friction, both resulting in less severe wear-related phenomena. Hence, the exposure rate of blank depassivated 1.4108 was smaller, and therefore also anodic dissolution was considered much lower. Oxygen availability was estimated to be equivalent to W1. For those experiments, the material combinations MMC/1.4108, SN1/1.4108, and SN2/1.4108 were measured for their potential evolution (Figure 13).
In F1, the potential of the WE, i.e., the upper body of 1.4108 material, was measured around +0.1 ± 0.03 mV vs. RE before start. With a ceramic bottom material, identically as in the experiments in W1, the measured potential complies with the potential trend of 1.4108 steel material alone. At the onset of sliding, the potential increased by 10–20 mV and remained then either at a stable value during the entire remaining sliding period, or it dropped gradually towards the initial value. When sliding stopped, the potential quickly decreased in every experiment by about 10–40 mV. The addition of F1 for compensating the evaporation losses resulted in a fairly stable potential, which was throughout 20–40 mV lower than before rubbing. Although the course of the potential during rubbing was not always identical, overall trends coincided per ceramic SN1/SN2 used (Figure 13a). Characteristically, after running-in, 1.4108 against SN2 ceramic was at a lower potential by around 30 mV.
OCP measurements of an MMC/1.4108 steel in a fretting contact lubricated with F1 showed a different trend during sliding (Figure 13b). The overall starting potential in the contact before rubbing was below +0.1 V but increased much more pronouncedly to around +0.15 V. This potential was maintained until the end of the experiment without a major deviation, and the 1.4108 steel potential after the experiment in separated state was 10–25 mV above the initial value. Since wear scars of ceramic against steel in F1 (Figure 10b,c) were by dimension tremendously larger than those of MMC in F1 against steel, two auxiliary fretting experiments for the impact of fluid convection on a mainly intact 1.4108 steel surface alone were carried out: 1.4108 steel was rubbed for comparison against the embedding resin of the polished MMC hemispheres, with a comparably small area in contact. In this case, the potential decreased by some 10 mV during the experiment (Figure 13b; line ‘REF’). Considering practically no wear on steel except a somewhat polished spot on the surface in this reference configuration, the potential trend corresponds to minor anodic activation of the steel, or a diminishing of the cathodic activity. Thus, this measurement does not explain the results from the other experiments.
In contrast, ceramic/1.4108 steel and MMC/1.4108 steel contacts in F1 exerted mild cathodic activation and/or reduced anodic activity, hence, pulling the overall potential during fretting towards higher values. This corresponds to an increase in passivation. The more gradual potential evolution of the MMC/1.4108 steel may be related to lower wear. Nevertheless, while potentials decreased in W1, they increased in F1. Since convection as a possible source of the phenomenon can be excluded by the result of the reference experiment, the most straightforward explanation would be that the polarization of MMC/1.4108 steel is inverse to W1 polarization: Steel would correspond in F1 to the cathode, consuming electrons which are provided by the anodic MMC material. In this scenario, the gradual potential increase would be connected to the slowly expanding wear scars. No further experimental clarification was done, but it can be assumed that in a wet organic phase, the water content at the metal surface may be disproportionate compared to bulk concentration. Therefore, any water-based reactions such as ion solvatization or changes in pH milieu, which result from local corrosion reactions, may be either more pronounced (pH sensitive surface reactions) or more limited (solvatization) than in a bulk aqueous phase.
Numerical potential data for 1.4108 steel collected from all experiments and the deviations between the individual runs of each material combinations were added to Table S1 which is available as supplementary information.

4. Results and Discussion: Electrochemical Laboratory Experiments

The individual electrochemical reactions, which contributed to the OCP formation in the tribocorrosion measurements on SRV®5 tribometer, are ad hoc not accessible by interpretation of OCP data. Electrochemical laboratory experiments of the individual materials provided additional information such as the corrosion potential and the material- and electrolyte-specific exchange current density for the interpretation of the differences between the various materials in W1-lubricated fretting contact with 1.4108.

4.1. Electrochemical Behavior of Selected Materials in Aqueous Environment

All experiments were performed in W1 with the respective material as the WE against RE. Conductivity measurements of W1 after the experiments with MMC gave an increase of 2–10% of the original conductivity, which was related to anodic dissolution products. With the larger steel parts, conductivity rose between 50 and 200% for the same reason. Stainless martensitic 1.4112 steel was used as the reference material for the polarization experiments. Abbreviations used for the methods are defined in Table 6.

4.1.1. Cathodic Polarization, Cyclovoltammetric and Potentiodynamic Study

CC scans at −1.2 V showed exponentially dropping currents which evolved uniformly for all materials and at a comparable current density. The steady potential value obtained from OCP recovery after CC was likewise similar for all investigated materials and served as reference for the following experiments.
The electrochemical laboratory experiments with linear potential scans are summarized in Figure 14. Single-loop CV measurements at a scanning rate of 0.0025 V s−1 and a starting potential of −1.2 V are displayed in Figure 14a (1.4108 steel and 1.4112 steel reference) and Figure 14c (MMC and 1.4125 steel). Behavior in cathodic was very similar, with the lowest current densities j found for MMC. Switching to anodic was around −0.2 V, with 1.4108 steel and MMC at the highest potential values. Exchange current densities were throughout around 1 µA cm−2. No plateau phase with a potential-invariant current was observed—which would be typical for passivity—but 1.4112 and 1.4125 steel were found to behave very inertly in the entire anodic range. Maximum anodic current reached 10 µA cm−2 for these materials. Reference 1.4112 steel did not deviate from linearity at any potential; 1.4125 steel showed onset of pitting formation above +0.5 V (main diagram + insert in Figure 14c), but repassivation was obtained at higher potentials in all experiments; 1.4108 steel followed the trend of the other two materials at lower potentials but expressed a clear breakdown at potential between +0.55 V and +0.75 V (main diagram and insert in Figure 14a). After passing the potential vertex, reverse scan currents rose further, underlining the transpassive state of 1.4108 steel. Recovery potential established between 0 and +0.4 V. The other two steel grades expressed a thickening of the passive layer with currents substantially depressed and a transition to cathodic at potentials around +0.4 V. MMC activated mildly with a small active–passive–active transition between +0.1 V and +0.25 V. Maximum current densities of MMC in anodic exceeded those of passive steel grades by 1.5 orders of magnitude. Nevertheless, lower currents shown in the reverse scan also indicated for MMC the formation of a thicker protective layer which limited further anodic dissolution [36]. However, a behavior of pseudo-passivity as it was reported for W oxidation in acidic [74] could not be confirmed for W1 electrolyte.
PDYN scans from −1.2 to +1.6 V (Figure 14b,d) were performed at a lower scan rate (0.001 V s−1) and repeated mainly the findings from CV measurements. Interestingly, 1.4125 steel showed a clearly higher cathodic activity, which might be a consequence of the scan rate reduction. Transition to anodic matched for all materials within a 0.05 V interval. In anodic, the 1.4112 steel reference exhibited passivity until polarization exceeded +0.4 V, followed by minor activation at higher potentials without any indication of transpassivity. The pseudo-maximum around +1.0 V may be most likely associated with the formation of soluble CrVI [75]; 1.4108 steel shifted to transpassive behavior above +0.5 to +0.9 V (lines from two experiments are shown in Figure 14b); 1.4125 steel showed pitting onsets above +0.5 V before becoming transpassive above +0.8 V. Although the potentials of passive–transpassive transition were similar for these two materials, 1.4125 steel had a clear limitation of the anodic current at around 1 mA cm−2. MMC behaved actively in mild anodic conditions, whereas at higher potentials, the current evolution lost its dynamics, and maximum current densities met with 1.4125 steel values. Reverse scan measurements showed activation for both transpassive materials and low-scale passivation for MMC. The reference steel grade showed repassivation nearly instantly when scanning switched towards cathodic potentials.
In summary, potentiodynamic methods elucidate pronounced differences between the materials’ corrosion behavior. The reference material 1.4112 steel was anodically activated, but no transpassive activation could be achieved. In contrast, 1.4108 and 1.4125 steel formed both metastable pittings above +0.5 V, and a breakdown potential was observed for both materials, located between +0.55 and +0.9 V. In transpassive state, repassivation was accomplished when the potential was reduced towards 0 V. MMC was characterized by an active–passive–active transition at around +0.2 V. A further increase in potential led to the conversion of dissolved metal ions into species contributing to protective layer formation and its growth, limiting further dissolution. No pitting onsets were measured for MMC. These observations were accompanied by an approximate reversibility of the current line after the anodic potential vertex, which shows that the material remained active. Pseudo-passivity as described in the literature for the individual material WC at the pH value of W1 [38], could therefore not be confirmed for WC-containing MMC. As an additional confirmation of activeness, the MMC anodic to cathodic transition potential was found close to the cathodic/anodic transition value.

4.1.2. Potentiostatic Measurements of MMC

For a better understanding of the activation mechanisms of MMC at mild anodic potentials, two PSTAT experiments at different potentials A and B were performed (Figure 15). The position of the potentials versus measured transition cathodic/anodic were selected at and above the observed active/passive transition in the CV scan. These potential values are marked in Figure 14d and include an additional bias of +0.08 V to account for scanning speed-related potential shifts.
Currents measured at both potentials converged to a steady value after a short period. Due to the difference in currents (1:75), the time of exposure was adapted (data table in Figure 15), providing a charge ratio of approximately 1:10 between the experiments. Light microscopy images of the exposed sphere area showed numerous small opaque spots distributed across the entire area, with their size increased at the higher potential. The appearance of fringe colors indicated semi-transparent surface films of different thickness from anodic dissolution reactions. The SEM images in Figure 15 show surface details of the polarized samples at different magnifications, which are compared to images obtained from an original surface without electrochemical exposure. At the lower potential (A), backscatter mode images (BSD) showed an apparent higher fragmentation rate of the bright WC crystals compared to the reference, whereas secondary electron images (SED) indicated a certain recession of the binder material (uniformly grey in BSD), especially at the boundaries to WC grains. Therefore, finer grains of WC may have as well become visible by the removal of the top binder layer. At the higher potential (B), the adumbrated mechanisms observed in (A) became more intense. An obvious protrusion of corrosion-resistant matrix carbides (dark) was found in BSD images. SED images showed a clear corrosive attack at the frontal parts of WC crystals as well on some parts of the binder, which appeared as face side roughening and a pronunciation of line structures crossing the WC crystals.
As an interpretation, MMC underwent heterogeneous corrosion reactions at anodic potentials with different consequences. In scenario (A), material integrity was widely preserved. This can also be assumed for the mechanical properties of the material. However, at such long exposure times, the brittleness of the MMC top layer might have increased due to partial binder depletion. A comparable scenario was already described by several authors [68,76] who claim that grain boundary structures of WC-based MMC are often decarburized, with less corrosion-resistant W2C becoming the dominating species at the boundary. Related to the investigated MMC in this work, selective dissolution may origin at binder-forming Ni or elemental W (which may have been added as a wetting promotor in MMC manufacturing [88]). Both may undergo anodic dissolution, whereas Ti and—with limitations—Cr should remain stable at these conditions. The consequence of a binder reduction at the grain boundaries would be, however, a decrease in WC grain adhesion and a predisposition for grain pull-out under mechanical load. With their hardness preserved, these grains would act as secondarily generated abrasive particles, when a sliding motion between such surfaces would be induced during mild anodic exposure of MMC. This is an understandably undesirable scenario in tribology and would promote a rapid increase in component wear. Under alkaline conditions, such an effect was already reported [31].
In scenario (B), intragranular corrosion of WC was observed. Such conditions would evidently lead to a quick decrease in particle hardness and—related to tribology—a higher inherent wear rate or even failure of MMC material. Accompanied by the observed binder dissolution, the mechanism would correspond to the skeletonization of the material which was mentioned in several studies [28,65]. Under such conditions, MMC surface morphology is characterized by the dominating existence of the highly oxidation-stable compounds of the binder, which surrounded cleavages of corroded and ejected hard-phase grains, including major changes in surface toughness and topography.

4.2. Surface Analysis by XPS

Surfaces of spherical MMC samples generated in the electrochemical experiments were characterized by XPS and compared to an untreated sample as reference (Figure 16). For mitigation of airborne contamination, surfaces were sputter cleaned until adventitious carbon fell below 5 at.% in the measured volume (typically 30–300 s); hence, the data do not comprise the outermost atomic layers. The large spread in sputter times also resulted from large angle variations related to geometry-related deflection on a curved sample and the changes in morphology of sub-micron crystalline material as described above. A five-point average of the relative chemical composition is provided in Figure 16a for different electrochemical test conditions against a pristine reference: after PDYN, after PSTAT (A), and after PSTAT (B). Bonding energies rounded to 0.5 eV are: C1s carbide at 283 eV; Cr2p3 metallic at 574.5 eV, oxides (III) at 576 eV; Mo3d5/2 metallic at 228 eV, oxides (IV) at 229.5 eV; Ni2p3 metallic at 852.5 eV; Ti2p3 (Ti, TiO, TiC, TiN) at 454–457 eV, oxides (IV) at 458.5 eV; W4f72 (W and WC) at 31.5–32 eV, oxide (IV) at 33 eV and (VI) at 36 eV. Given concentration are in relative at.% in the respective analyzed volume.
XPS analysis of the spheres submitted to the electrochemical experiments showed depletion of metallic and carbidic W, which increased in proportion with the anodic potential. Notably, WC surface concentration was depressed under strong anodic potentials, as they were provided by the conditions of the potentiodynamic experiment. This can be read from the mutual reduction of elemental W and carbidic C in Figure 16a, data set ‘PDYN’. Ni was better preserved than W in this sample, which may as well indicate a second and higher corrosion resistant phase consisting of NiTi aside of NiCr. Remaining compounds were Cr (Crmet, CrIII) and Ti (TiN, TiC) of which especially their oxides were abundant after potentiodynamic exposure. TiO2 was the compound with the highest prevalence under these conditions, meaning that at MMC surface, all other compounds were widely reduced.
The preferential formation of WO2 at potentiostatic test condition (A) can be confirmed from a single-side broadening of the W/WC peak basis at both W4f7 and W4f5 energies. A correlation may be possible with the additional activation peak, which was observed at low positive potentials in the CV and PDYN scans. Formation of WO3 is expected at higher potentials, such as were present during the PDYN scan. The appearance of major WO2 quantities may be seen as an indicator of an acidic environment, since at neutral conditions (pH > 6 for high concentrations of W) [38], metallic tungsten would preferentially oxidize to soluble WO42− without intermediate stage. A comparably less pronounced formation of WO2 under oxidizing conditions was found at tungsten-coated surfaces in tribocontacts involving aprotic lubricants [89].

4.3. Correlation of Tribometrological and Electrochemical Results

A comparison of MMC morphology of specimen after a triboexperiment and under exposure to high anodic potentials, both in W1, confirmed that different components are attacked under anodic polarization and under tribocorrosion conditions. Image processing of SEM images obtained in backscatter mode enabled us to determine the distribution of the hard phase. The results shown in Figure 17 clearly indicate that under tribocorrosive conditions (Figure 17b), WC (yellow color) was more prominent on the surface compared to a non-treated surface (Figure 17a). The difference was mostly formed by the emergence of smaller grains or grain tips from the receding binder (blue color), thus making WC the dominant phase at the surface. The same was valid for particles of the second hard phase (TiC or Cr3C2; red color). Nevertheless, individual larger grains of WC appeared more fractionized than without sliding, which could be related to either mechanical wear or corrosive wear, as found in the potentiostatic measurements (Figure 15). Binder material removal from the surface appeared uniform across the entire surface.
The image generated from a sample under high anodic potential exposure (Figure 17c) illustrates the selective disappearance of the WC phase, with large patches of binder covering the surface. Although it is not possible to visually distinguish between grain removal by binder loss and grain disappearance by dissolution, the second option is the more likely since the visible grains mostly spot out from the bottom of cleavages. However, the intergranular fraction of the binder seemed to have become less as well; it may have dissolved parallel with the WC grains, which is related to its small thickness. The most corrosion-resistant material was the second carbide phase, which even started penetrating through the binder patches. These carbides were evidently protected by a resistant oxide layer, preventing further anodic dissolution. Hence, the magnitude of material mass m dissolution −dm/dt under high anodic potentials can be characterized as being for WC >> NiCr-Binder > Cr3C2, TiC.
Electrochemical experiments and post-experimental elemental surface analysis by two different methods showed that corrosion and tribocorrosion reaction mechanisms agree only partially. A reason may be the high relative error of spectroscopic mapping of elements with a low abundance such as Cr or Ni, but also an overestimation of Cr quantity which was actually a remainder from steel cross-welding. The recognition of a preference towards binder dissolution under tribocorrosive conditions and towards WC hard phase dissolution under high anodic polarization from phase distribution plots can be useful for the determinations of solubility domains, which may explain the heterogeneity of element distribution found on MMC specimen surfaces after the triboexperiments.
In the triboexperiments, several elements underwent apparently selective dissolution under conditions that could not yet be precisely defined. An approach was made based on the thermodynamic Eh-pH relationship [70], and pH ranges have been defined where thermodynamic equilibrium drives the oxidation of Ni in favor of the reduction of W (Table 7).
The potentials in Table 7 show that W oxidation potential is dependent on the pH since an oxide of low solubility is formed. Ni2+ does not form a hydroxide at this pH; therefore, the potential is only dependent on the concentration in the solution. In acidic, Ni becomes easier oxidized than W.
For a correlation of localized tribocorrosion events with reactions under the condition of a local pH it is necessary to estimate any formation of potential gradients which may occur at the MMC surface. The low conductivity of the electrolyte is the backbone of the formation of localized potentials. Individual sites with different corrosion reactions can form since the required potential difference is maintained by the high ohmic drop of any current passing the electrolyte.
Using a simple corrosion model for the calculation of the potential and current distribution in a recess [91], the measured solution conductivity G in combination with an arbitrarily selected polarization resistance Rp (=ΔE/Δj) can be formulated as a dimensionless Wagner Number Wa, which is known as a descriptor for potential losses by diffusion limitation. At Wa = 1, potential and current distribution are uniform at the entire electrode surface. The smaller Wa, the more non-uniform electrode geometry hampers the homogeneous distribution of the potential (e.g., along a recess). Although this corrosion model explains only the primary current distribution based on the geometry, the interplay of G and Rp-based dissolution kinetics can be well shown. E and I have been calculated on the basis of this model for several values of Wa (Table 8).
However, this approach needs to distinguish clearly between the current I(x) flowing at a deliberate position x in the electrolyte, and the current passing the electrode surface at the same position x, which builds up I(x) integrally, and which can be expressed in its intensity by current density (unit A cm−2). In the case of a decreasing Wa, the cathodic current evolution in the electrolyte is therefore concentrated within the proximity of the anode located at x = 0. Thus, current densities at these positions must be substantially higher than more remote since here the entire current in the electrolyte is provided. As an example, with Wa = 0.01, 63% of the total current evolves within the first 100 µm of the cathodic length. With Wa becoming very small, the potential drop becomes practically zero at a wider distance from the anode. This means that the entire current evolves at a very narrow segment of the electrode, which means further that current density must be very high at this location. This recognition allows us to claim the existence of different corrosion reaction mechanisms at different positions of the electrode surface. An additional prerequisite can be that the diffusion of oxygen is limited at the entry of the recess, which is in the model calculation at x = 1 cm.
If the conductivity of the electrolyte does not essentially increase by the corrosion reactions, the surface of the MMC flat in a triboexperiment will form a rather homogeneous potential profile at locations where the vertical distance to the counter material is sufficiently high. At closer positions to the contact area, the increasing concentration of wear particles will consume a large amount of the available oxygen, which can diffuse into the confined electrolyte only from the encompassing cleavage between upper and lower specimen. This will separate, on the one hand, the cathodic reaction (1) or (2) from the anodic reaction, which will be metal dissolution (3). The cathodic reaction will migrate toward the entry of the recess, i.e., away from the wear scar.
The anodic reaction, on the other hand, can be associated with the contact area, where surface depassivation and therefore metal activity towards dissolution reaches its maximum. This results in a classical model of localized corrosion, and the extent of the corrosion reaction and the distance between cathode and anode is controlled by the solution resistance.
Related to the tribocorrosion experiments performed in this work, the ball-on-flat geometry with an extended spherical part practically covering the disc material fairly suits the requirements of channel or crevice formation, as it is prerequisite for a low Wa. This means that in practice, i.e., in such triboexperiments as they have been described in this work, diffusion limitation effects may become significant. It means further that the dimension of the material working as the cathode is of second order, since the reactivity will be confined at or around the wear scar. This remains valid unless electrolyte conductivity would substantially increase.
For the description of localized corrosion effects, SEM and EDX measurements of two specimens submitted to triboexperiments were employed, and the dependence of the Fe/Ni distribution on the position is shown in Figure 18. Figure 18a shows a SEM image of the lateral edge of the wear scar obtained in backscatter mode. Three zones can be visually distinguished: the center area (a-I), the adjacent area to the wear track (a-II), and the area outside of the wear track (a-III). A representative reference spectrum was obtained at the outermost surface of the specimen (not shown). Due to the partial removal of the binder, which is in accordance with Figure 17, the bright WC phase dominates. The outer area appears darker than the wear area and is optically more indifferent, while the adjacent area is dark, which is the effect of an oxide layer deposited in this segment. The boundary to the outside area is astonishingly clearly pronounced which shows that mass transport influence by fluid dynamics becomes in fretting subordinate.
The primary participating reactions of metal dissolution are shown as (9)–(14) for the elements Fe, Ni, Cr, Ti, and W:
Fe(0) ⇆ Fe2+ + 2e,
Ni(0) ⇆ Ni2+ + 2e,
Cr(0) ⇆ Cr3+ + 3e,
Ti(0) ⇆ Ti4+ + 4e.
Tungsten reacts in neutral conditions under the formation of soluble tungstate.
W(0) + 12H2O ⇆ WO42− + 8H3O+ +6e.
In acidic conditions, the insoluble oxide is formed.
WO42− + 2H3O+ ⇆ WO3 + 3H2O.
Cr and Ti instantly form a hydroxide of low solubility, which reacts then further to the oxide, preventing further dissolution (15).
2Cr3+ + 6OH ⇆ 2Cr(OH)3 ⇆ Cr2O3 + 3H2O.
Reaction (15) can be adequately written for Ti. Fe reacts further with available oxygen, forming likewise the low soluble hydroxide (16).
4Fe2+ + O2 + 18H2O ⇆ 4Fe(OH)3 + 8H3O+.
Reaction (16) will acidify the electrolyte as long as there is oxygen available. Notably, Fe2+ will be the ion with the highest prevalence in the contact area due to high wear on the steel part. Hence, (16) is highly responsible for the local pH milieu. Passivating elements balance their dissolution by instantly forming an oxide or hydroxide layer (15). On the contrary, the non-passivating elements Fe and Ni will dissolve further. Fe arises from steel wear, and Ni, which forms a low-soluble oxide only at high anodic potentials, from the binder.
Tungstate will react in this solution by
WO42− + 4H3O+ + 2e⇆ WO2 + 6H2O.
Reaction (17) explains why WO2 indicates an acidic environment.
In Figure 18c, normalized EDX spectra of the indicated segments in Figure 18a are presented. Balancing the effects of selective dissolution, the peaks of the respective spectra were normalized to Ti Kα peak at 4.5 keV. The spectra segment of lower energy which includes Ti and Cr can be found in Figure S1a in the supplementary information. Fe signal was maximum at the boundary area (a-II), which identifies the main compound of the visually dark and amorphous debris as FexOy·zH2O, thus material dissolved anodically from the steel counterpart. The outer area (a-III) contained a minor amount of Fe, while reference area (REF) and wear center (a-I) were free from Fe. Ni at 7.5 keV was not so clearly differentiated, but the signal in the center (a-I) was slightly lower than of the reference, which indicates that the ratio Ti/Ni had changed. The boundary area (a-II) signal is comparable with the reference signal, which indicates that bulk MMC material was not altered here, and differences in the spectrum are related to the addition of Fe (and Cr) from steel wear. Ni concentration in the outer area (a-III) was found higher, and this confirms that Ni was dissolved in the wear area, and sedimented as a hydroxide remote to the wear scar.
Figure 18b shows a magnification of a wear scar center with a clear indication of adhered material from the steel counterpart (darker area). The segment below following the band of Fe is characterized by irregularities in the surface. EDX spectra (Figure 18d and the spectra segment including Ti and Cr added as supplementary data Figure S1b) were recorded at the location of adhered steel material (b-I), in the zone of irregularities (b-II), some 20 µm outside of the central zone (b-III), and at a reference position in a non-contact area (REF). Spectra were again normalized against Ti Kα. Fe peak was highest in (b-I), but also present at a corresponding quantity in b-II and b-III, but not in the reference. Ni concentration could be clearly distinguished between b-I (lowest) and b-III (highest). The reference concentration was lower than at b-III, but higher than b-II. Interpretation is more difficult since all areas lie within the wear area, but the coincidence of metallic Fe at the surface and the dissolution of chemically more stable Ni from binder indicates that at the fretting center (where the cross-welding of steel to MMC occurs), aqueous redox reactions may play a minor role probably because of the cut of water supply due to fretting. In areas where water could penetrate underneath, the dissolution reactions of the corrosion mechanism occurred obviously at different intensity, and therefore pH and oxygen level would locally adapt. At the highest contact pressures (following the Fe band), the most aggressive conditions could be estimated, and therefore the level of acidity. Including the recognitions from the crevice model, the outside lying cathodic area will steadily migrate with progressing wear (and locally increasing electrolyte conductivity by corrosion products) away from the geometric contact middle. Therefore, the anodic or the cathodic contributors to the overall tribocorrosion reaction(s) in a fretting contact of two conductive materials cannot be described in static terms. Their occurrence is neither homogeneously distributed on the respective macroscopic anode or cathode area nor invariant with time, even if steady state sliding conditions are fulfilled. They depend on the local potential which is defined by:
  • The distance between the anodic and cathodic site;
  • The solution resistance between the sites and the polarization resistance of these sites;
  • The concentration of the oxygen, which is limited by diffusion to the cathodic sites and the lubricant gap internal consumption, mainly by the oxidation of Fe2+ to Fe3+.

4.4. Implication of the Experimental Tribocorrosion Results: A Dynamic Fretting Crevice Corrosion Model

In Figure 19, a more general model of the fretting-based tribocorrosion scenario is presented. In an analogy to the investigated MMC–steel tribocontact, it describes the status, the primary corrosion products generated and the progress of crevice tribocorrosion with increasing wear under fretting conditions at a deliberate progress of the experiment. Electrolyte conductivity is assumed to be low. For this model, all reactions occur on the sphere part only, while the flat acts only as a wear particle producing counterpart. The general spreading of the sites across the entire surface is inhibited by the solution resistance. In step 1, the fretting crevice is formed, and oscillations start. The cathodic site expands close to the contact line of the two bodies, where it has access to the required amount of an oxidant (e.g., O2). Wear particles are generated in the slip area and accumulate (step 2), while along the stick-line, anoxic–anodic conditions form, as was described in this work, mainly by excessive replenishment of the electrolyte with wear particles and anodically generated metal ions in a highly confined volume of the electrolyte. Except for providing low-resistance electric contact between both bodies, the central stick area is not contributing to the corrosion events described in this model simply because the situation in this sector is not yet clarified enough. However, it may be regarded as an additional source of wear particles and its oxidation products. In step 3, the slim anodic area at the inner crevice is swiftly shifting towards outside as soon as wear particles are generated, while the adjacent cathodic site is consecutively pushed along the length of the crevice. The width of the cathodic site is determined by geometry relations, polarization resistance, and electrolyte conductivity. When flat material and sphere material are both conductive, a potential bias by galvanic interaction modifies the reaction scenario at each site and at each material. It is therefore possible not only to attribute the respective role as an electrode to the materials, but also to analyze the impact of the tribocontact areas themselves on the overall scenario. Because lubricant conductivity is low, their role becomes even more expressed. Essential in the performed experiments was the lower solubility of FeIII compared to FeII in a neutral to mildly alkaline aqueous electrolyte, which made it precipitate at the crevice length where oxygen became available. As an experimentally validate indicator of the localized available oxygen around the tribocontact, the color intensity of the more reddish Fe(OH)3 commonly reached a maximum at several tens to hundreds of µm distant from the contact line with the counter body (Figure 18a).
Although dissolution mechanisms are forced in the contact area, Fe may be nonetheless present within the wear scar center, but rather as a result of material transfer, and then not necessarily as an oxide species. Fe located in the wear center was shown by EDX to be preferably of metallic nature, which is an excellent confirmation of the depletion of oxygen by anodically dissolved iron in the diffusion path.
By acidification, a redox reaction can thus form between tungsten oxide or tungstate and Ni from binder (18).
WO42− + 4H3O+ + Ni ⇆ WO2 + 6H2O + Ni2+.
This reaction describes the depletion of Ni from MMC binder under reduced availability of oxygen when the pH milieu changes from neutral to acidic. Thermodynamic basis is the data provided in Table 7.

4.5. Interpretation of Tribocorrosion in Electrolyte F1

The principle of the presented corrosion model of a fretting contact lubricated by aqueous W1 may be used as well for the explanation of mechanisms occurring in F1 electrolyte, which is by around 99 wt.% organic and 1 wt.% aquatic. Dissolved oxygen concentration in F1 may be assumed comparable as in W1, while conductivity would be lower by two orders of magnitude. Experimentally it was shown that F1 reduced friction and wear in MMC–steel contact. With ceramics SN1 and SN2, no benefit of lubrication was obtained, and the relevant wear mechanism has been identified as adhesive wear, and, additionally for SN1, abrasion by secondarily generated particles. Observed fractures in the SN1 material might also have a tribocorrosion background but were not attempted to explain further. In both cases, 1.4108 steel potential increased during sliding. However, in combination with MMC, the absolute increase was higher. Thus, steel can be assumed to have its passive layer preserved during sliding, while oxygen transport promoting the cathodic reaction is enhanced by sliding. This associates the steel with the role of the macroscopic cathode, while MMC—which, according to the polarization experiments, does not passivate—would then form the anode. This combination depicts the reverse galvanic couple compared to W1 situation.
Wear acceleration by corrosion may be subordinate in F1 due to the absolute low solubility of metal ions, so any reactive sites would rather cover with precipitates. Nevertheless, local pH scenarios may establish if water molecules may preferably assemble at the solid/liquid boundary. Such a site forming at MMC would lead to the existence of lower pH by overall anodic polarization and therefore to a galvanic coupling of binder, grain boundary, and WC grain. As explained, pH reduction affects binder Ni to be oxidized instead of WC material.
The inversion of the polarization may have dire consequences on the integrity of MMC material. Considered a stack order of W1–F1 interactions with comparable fretting conditions and otherwise invariant positions of both components, as may occur for a functional mechanical element composed of such materials, such reverse polarization effects may accumulate a protective layer thinning (as by cathodic reaction under reduced oxygen) and localized dissolution (as by sacrificial anodic reaction) at the binder region. The subsequent depletion of Ni is a very plausible scenario in such conditions. Consequently, WC grain ejection as a typical failure mode of less corrosion stable Co-base binders might also occur with a Ni-base binder if tribocorrosive conditions serve the formation of local domains of strong acidity at MMC surface.
A model representation based on the considerations of degradation modes in situations with recurrent contact–non-contact is shown in Figure 20.

5. Conclusions

Tribocorrosion-based degradation mechanisms of three material categories in a fretting contact lubricated by low conductive water-base (W1) or organic-base (F1) under 2 N load against 1.4108 steel were investigated in an SRV®5 tribometer. High friction and high wear dominated silicon nitride ceramic/steel interaction in both lubricants. This is related in both cases to insufficient formation of a lubricating film, which led in aqueous lubrication to the decomposition of ceramic material under the formation of secondary wear particles. In the organic medium, adhesive processes were dominant. W1-lubricated MMC/steel contacts showed higher friction and milder wear than ceramic/steel contacts. The higher friction was associated with a ploughing effect of protruding hard-phase carbides as a consequence of binder removal and localized seizure in the contact center. Steel/steel contacts in W1 showed comparably lower friction and wear.
The friction and wear reduction in F1 for MMC/steel couples opposed the concept of mechanical interaction dominating wear. Additional electrochemical experiments revealed the existence of a galvanic element in the tribocontact. Electrochemical polarization measurements showed that individual cathodic and anodic reactivity of the MMC components can be responsible for localized corrosion on the same material. The exact process appears to be different in W1 and in F1 and requires further investigation. Four major degradation mechanisms could be identified:
  • The degradation of non-conductive silicon nitride-base ceramics in a fretting contact follows in aqueous lubrication a pattern of non-corrosive tribochemical decomposition, which results in abrasion-promoting nanocrystalline SiO2 particles;
  • For conductive materials, cathodic reactions could be limited by the low conductivity of W1 to a narrow circular segment around the contact area, while anodic dissolution would occur directly in the depassivated wear scar. Driving mechanisms would be primarily the reduction of oxygen on the cathodic side and the constant formation of wear particles, leading to anodic dissolution of iron from the counter material;
  • With progressing wear and expansion of the contact area, oxygen depletion may occur at the central contact due to excess Fe2+ concentration. This is proposed to be accompanied by local pH reduction and the emergence of anoxic reactions mechanisms. Hydrogen may be the product of the cathodic reaction. With ultra-hardened martensitic steel, typical indicators of HIC (blisters and post-experimental potential drops by relayed blister cracking) were found in central parts of the wear tracks;
  • Related to pH reduction, MMC tribocorrosion mechanisms may become inverted compared to the scenario at the original pH of the electrolyte. While WC grain boundary preferably dissolves under neutral conditions, pH reduction would promote Ni dissolution. This effect is supported by thermodynamic data of the metal dissolution reactions and confirmed by EDX measurements in the proximity of the central contact. A redox reaction of Ni with tungstate was elaborated, which may play a key role in this localized corrosion phenomenon;
  • These mechanisms are valid in particular in fretting contacts, where an electrolyte is under small convective flows. Under reciprocating slide conditions, aeration might occur at the entire wear area, leading to partial repassivation of the surfaces and therefore to conventional “film formation–film abrasion” scenarios. This reaction pattern shows also that MMCs with a corrosion-resistant NiCr binder may fail under fretting conditions;
  • The low friction and wear of the MMC/1.4108 steel couple in F1 can therefore be explained to some extent by the absence of partial binder dissolution. Nevertheless, an alternation of aqueous and (wet) organic lubrication of MMC/steel couples, which might be of technical interest, could lead to a stack order of localized cathodic reduction in one medium and forced oxidation on the same location in the other medium. Thus, binder dissolution and ejection of hard phase carbide would be the consequence.
The comprising dynamic model of localized corrosion which we presented in this work, combining elements of solution resistance, galvanic interaction, and crevice corrosion phenomena to a summarizing mechanism, has, to the best of our knowledge, not yet been shown in previous research work.

Supplementary Materials

The supporting information can be downloaded at: https://www.mdpi.com/article/10.3390/lubricants11050195/s1. Table S1. OCP evolution of 1.4108 material before (T-I), during (T-II), and after the triboexperiment (T-III). Time domains td_exp of the experimental progress for W1 and F1 in minutes versus start of the triboexperiment and average OCP values E(0) to E(5) obtained for the 1.4108 counter body material at these time domains (W1: in combination with MMC; HT1; HT2; SN1; SN2; F1: in combination with MMC; SN1; SN2 and polyphenolic resin Ref). Similar results are combined in groups A-D. Figure S1. Complementary EDX spectra of the range 4000–6000 keV showing Ti and Cr abundance in measured areas (a) a-I to a-III shown in Figure 18a, (b) b-I to b-III shown in Figure 18b. EDX spectra acquired at positions b-I to b-III. All EDX peaks are base line corrected and normalized to Ti Kα at 4.5 keV. REF is the spectra of a distant area outside of the respective wear area.

Author Contributions

Methodology, M.K.; Investigation, M.K.; Data curation, M.K.; Writing—original draft, M.K.; Writing—review & editing, J.B. and M.K.; Supervision, J.B. All authors have read and agreed to the published version of the manuscript.

Funding

This work was funded by the “Austrian COMET-Program” (project InTribology1, no. 872176) via the Austrian Research Promotion Agency (FFG) and the federal states of Niederösterreich and Vorarlberg and was carried out within “The Excellence Centre of Tribology” (AC2T research GmbH).

Data Availability Statement

The data presented in this study are available on request from the corresponding author. However, data beyond the contents of this article cannot be provided to third parties due to confidentiality reason related with the grant conditions.

Acknowledgments

The authors would like to express their gratitude to Harsha Raghuram (TU Wien) for suggestions on correct wording in the final phase of the manuscript.

Conflicts of Interest

The authors declare no conflict of interest.

References

  1. Rahman, M.H.; Warneke, H.; Webbert, H.; Rodriguez, J.; Austin, E.; Tokunaga, K.; Rajak, D.K.; Menezes, P.L. Water-Based Lubricants: Development, Properties, and Performances. Lubricants 2021, 9, 73. [Google Scholar] [CrossRef]
  2. Xue, Q.; Wei, J. Tribochemistry in Ceramic Lubrication. Lubr. Sci. 1996, 8, 369–377. [Google Scholar] [CrossRef]
  3. Jahanmir, S.; Ozmen, Y.; Ives, L.K. Water Lubrication of Silicon Nitride in Sliding. Tribol. Lett. 2004, 17, 409–417. [Google Scholar] [CrossRef]
  4. Basu, B.; Kalin, M. (Eds.) Friction and Wear of Oxide Ceramics in an Aqueous Environment. In Tribology of Ceramics and Composites; John Wiley & Sons, Inc.: Hoboken, NJ, USA, 2011; pp. 485–501. [Google Scholar]
  5. Yamamoto, Y.; Takashima, T. Friction and Wear of Water Lubricated PEEK and PPS Sliding Contacts. Wear 2002, 253, 820–826. [Google Scholar] [CrossRef]
  6. Yamamoto, Y.; Hashimoto, M. Friction and Wear of Water Lubricated PEEK and PPS Sliding Contacts Part 2. Composites with Carbon or Glass Fibre. Wear 2004, 257, 181–189. [Google Scholar] [CrossRef]
  7. Ronkainen, H.; Varjus, S.; Holmberg, K. Tribological Performance of Different DLC Coatings in Water-Lubricated Conditions. Wear 2001, 249, 267–271. [Google Scholar] [CrossRef]
  8. Tokoro, M.; Aiyama, Y.; Masuko, M.; Suzuki, A.; Ito, H.; Yamamoto, K. Improvement of Tribological Characteristics under Water Lubrication of DLC-Coatings by Surface Polishing. Wear 2009, 267, 2167–2172. [Google Scholar] [CrossRef]
  9. Reuter, S.; Weßkamp, B.; Büscher, R.; Fischer, A.; Barden, B.; Löer, F.; Buck, V. Correlation of Structural Properties of Commercial DLC-Coatings to Their Tribological Performance in Biomedical Applications. Wear 2006, 261, 419–425. [Google Scholar] [CrossRef]
  10. Kalin, M.; Polajnar, M. The Wetting of Steel, DLC Coatings, Ceramics and Polymers with Oils and Water: The Importance and Correlations of Surface Energy, Surface Tension, Contact Angle and Spreading. Appl. Surf. Sci. 2014, 293, 97–108. [Google Scholar] [CrossRef]
  11. Majdič, F.; Velkavrh, I.; Kalin, M. Improving the Performance of a Proportional 4/3 Water-Hydraulic Valve by Using a Diamond-like-Carbon Coating. Wear 2013, 297, 1016–1024. [Google Scholar] [CrossRef]
  12. Strmčnik, E.; Majdič, F.; Kalin, M. Water-Lubricated Behaviour of AISI 440C Stainless Steel and a DLC Coating for an Orbital Hydraulic Motor Application. Tribol. Int. 2019, 131, 128–136. [Google Scholar] [CrossRef]
  13. Majdič, F.; Pezdirnik, J.; Kalin, M. Experimental Validation of the Lifetime Performance of a Proportional 4/3 Hydraulic Valve Operating in Water. Tribol. Int. 2011, 44, 2013–2021. [Google Scholar] [CrossRef]
  14. Sagraloff, N.; Dobler, A.; Tobie, T.; Stahl, K.; Ostrowski, J. Development of an Oil Free Water-Based Lubricant for Gear Applications. Lubricants 2019, 7, 6–8. [Google Scholar] [CrossRef] [Green Version]
  15. Zhang, K.; Yan, W.; Simic, R.; Benetti, E.M.; Spencer, N.D. Versatile Surface Modification of Hydrogels by Surface-Initiated, Cu 0-Mediated Controlled Radical Polymerization. ACS Appl. Mater. Interfaces 2020, 12, 6761–6767. [Google Scholar] [CrossRef] [PubMed] [Green Version]
  16. de Assis Severiano, J.; Silva, A.S.; Sussushi, E.M.; da Silva Sant’Anna, M.V.; da Cunha, M.A.; Bergmann, C.P.; Griza, S. Corrosion Damages of Flow Regulation Valves for Water Injection in Oil Fields. Eng. Fail. Anal. 2019, 96, 362–373. [Google Scholar] [CrossRef]
  17. Virtanen, S. Corrosion and Passivity of Metals and Coatings. In Tribocorrosion of Passive Metals and Coatings; Landolt, D., Mischler, S., Eds.; Woodhead Publishing Limited: Cambridge, UK, 2011; pp. 3–28. ISBN 9781845699666. [Google Scholar]
  18. Santana-Casiano, J.M.; González-Dávila, M.; Millero, F.J. Oxidation of Nanomolar Levels of Fe(II) with Oxygen in Natural Waters. Environ. Sci. Technol. 2005, 39, 2073–2079. [Google Scholar] [CrossRef] [PubMed]
  19. Uhlig, H.H. Uhlig’s Corrosion Handbook; Revie, R.W., Ed.; The Electrochemical Society Series; John Wiley & Sons, Inc.: Hoboken, NJ, USA, 2011; ISBN 9780470080320. [Google Scholar]
  20. Mischler, S.; Spiegel, A.; Landolt, D. The Role of Passive Oxide Films on the Degradation of Steel in Tribocorrosion Systems. Wear 1999, 225–229, 1078–1087. [Google Scholar] [CrossRef]
  21. Batchelor, A.W.; Stachowiak, G.W. Tribology in Materials Processing. J. Mater. Process. Technol. 1995, 48, 503–515. [Google Scholar] [CrossRef]
  22. Bhagat, R.B.; Conway, J.C.; Amateau, M.F.; Brezler, R.A. Tribological Performance Evaluation of Tungsten Carbide-Based Cermets and Development of a Fracture Mechanics Wear Model. Wear 1996, 201, 233–243. [Google Scholar] [CrossRef]
  23. Gopi, R.; Saravanan, I.; Devaraju, A.; Ponnusamy, P. Tribological Behaviour of Thermal Sprayed High Velocity Oxy-Fuel Coatings on Tungsten Carbide—A Review. Mater. Today Proc. 2021, 39, 292–295. [Google Scholar] [CrossRef]
  24. Veinthal, R.; Tarbe, R.; Kulu, P.; Käerdi, H. Abrasive Erosive Wear of Powder Steels and Cermets. Wear 2009, 267, 1838–1844. [Google Scholar] [CrossRef]
  25. Vilhena, L.; Domingues, B.; Fernandes, C.; Senos, A.; Ramalho, A. Mechanical and Tribological Characterization of WC-Co and WC-AISI 304 Composites by a Newly Developed Equipment. Materials 2022, 15, 1187. [Google Scholar] [CrossRef] [PubMed]
  26. García, J.; Collado Ciprés, V.; Blomqvist, A.; Kaplan, B. Cemented Carbide Microstructures: A Review. Int. J. Refract. Met. Hard Mater. 2019, 80, 40–68. [Google Scholar] [CrossRef]
  27. Micallef, C.; Zhuk, Y.; Aria, A.I. Recent Progress in Precision Machining and Surface Finishing of Tungsten Carbide Hard Composite Coatings. Coatings 2020, 10, 731. [Google Scholar] [CrossRef]
  28. Barbatti, C.F.; Sket, F.; Garcia, J.; Pyzalla, A. Influence of Binder Metal and Surface Treatment on the Corrosion Resistance of (W,Ti)C-Based Hardmetals. Surf. Coat. Technol. 2006, 201, 3314–3327. [Google Scholar] [CrossRef] [Green Version]
  29. Kamdi, Z.; Apandi, M.N.M.; Ibrahim, M.D. Wear and Corrosion Behaviour of Tungsten Carbide Based Coatings with Different Metallic Binder. In Advanced Materials for Sustainability and Growth, Proceedings of the 3rd Advanced Materials Conference 2016 (3rd AMC 2016), Langkawi Island, Malaysia, 28–29 November 2016; AIP Publishing: Melville, NY, USA, 2017; p. 120005. [Google Scholar]
  30. Tomlinson, W.J.; Linzell, C.R. Anodic Polarization and Corrosion of Cemented Carbides with Cobalt and Nickel Binders. J. Mater. Sci. 1988, 23, 914–918. [Google Scholar] [CrossRef]
  31. Wood, R.J.K.; Herd, S.; Thakare, M.R. A Critical Review of the Tribocorrosion of Cemented and Thermal Sprayed Tungsten Carbide. Tribol. Int. 2018, 119, 491–509. [Google Scholar] [CrossRef]
  32. Souza, V.A.D.; Neville, A. Linking Electrochemical Corrosion Behaviour and Corrosion Mechanisms of Thermal Spray Cermet Coatings (WC-CrNi and WC/CrC-CoCr). Mater. Sci. Eng. A 2003, 352, 202–211. [Google Scholar] [CrossRef]
  33. Pereira, P.; Rocha, A.M.F.; Sacramento, J.; Oliveira, F.J.; Senos, A.M.R.; Malheiros, L.F.; Bastos, A.C. Corrosion Resistance of WC Hardmetals with Different Co and Ni-Based Binders. Int. J. Refract. Met. Hard Mater. 2022, 104, 105799. [Google Scholar] [CrossRef]
  34. Zhang, Q.; Lin, N.; He, Y. Effects of Mo Additions on the Corrosion Behavior of WC-TiC-Ni Hardmetals in Acidic Solutions. Int. J. Refract. Met. Hard Mater. 2013, 38, 15–25. [Google Scholar] [CrossRef]
  35. Stojadinović, J.; Bouvet, D.; Mischler, S. Prediction of Removal Rates in Chemical-Mechanical Polishing (CMP) Using Tribocorrosion Modeling. J. Bio- Tribo-Corros. 2016, 2, 8. [Google Scholar] [CrossRef] [Green Version]
  36. Anik, M.; Cansizoglu, T. Dissolution Kinetics of WO3 in Acidic Solutions. J. Appl. Electrochem. 2006, 36, 603–608. [Google Scholar] [CrossRef]
  37. Lillard, R.S.; Kanner, G.S.; Butt, D.P. The Nature of Oxide Films on Tungsten in Acidic and Alkaline Solutions. J. Electrochem. Soc. 1998, 145, 2718–2725. [Google Scholar] [CrossRef]
  38. Anik, M.; Osseo-Asare, K. Effect of pH on the Anodic Behavior of Tungsten. J. Electrochem. Soc. 2002, 149, B224. [Google Scholar] [CrossRef]
  39. Wang, Y.S.; Narasimhan, S.; Larson, J.M.; Barber, G.C. A Review of Ceramic Tribology and Application of Si-Based Ceramics to Engine Valves/Seat Inserts. SAE Trans. 1996, 105, 330–342. [Google Scholar] [CrossRef]
  40. Erdemir, A.; Erck, R.A.; Fenske, G.R.; Hong, H. Solid/Liquid Lubrication of Ceramics at Elevated Temperatures. Wear 1997, 203–204, 588–595. [Google Scholar] [CrossRef] [Green Version]
  41. Hara, Y. Application of Fine Ceramics in Industrial Fields. Corros. Eng. 1989, 38, 493–499. [Google Scholar] [CrossRef] [Green Version]
  42. Eichler, J. Industrial Applications of Si-Based Ceramics. J. Korean Ceram. Soc. 2012, 49, 561–565. [Google Scholar] [CrossRef] [Green Version]
  43. Grigoriev, S.N.; Fedorov, S.V.; Hamdy, K. Materials, Properties, Manufacturing Methods and Cutting Performance of Innovative Ceramic Cutting Tools—A Review. Manuf. Rev. 2019, 6, 19. [Google Scholar] [CrossRef] [Green Version]
  44. Cao, G.Z.; Metselaar, R. A′-Sialon Ceramics: A Review. Chem. Mater. 1991, 3, 242–252. [Google Scholar] [CrossRef] [Green Version]
  45. Izhevskiy, V.A.; Genova, L.A.; Bressiani, J.C.; Aldinger, F. Progress in SiAlON Ceramics. J. Eur. Ceram. Soc. 2000, 20, 2275–2295. [Google Scholar] [CrossRef]
  46. Cao, G.Z.; Metselaar, R.; Ziegler, G. Microstructure and Properties of Mixed α’+β’-Sialons. In Proceedings of the 4th International Symposium on Ceramic Materials and Components for Engine; Carlsson, R., Johansson, T., Kahlman, L., Eds.; Springer: Dordrecht, The Netherlands, 1992; pp. 188–195. [Google Scholar]
  47. Reis, P.; Filho, V.; Davim, J.P.; Xu, X.; Ferreira, J.M.F. Wear Behavior on Advanced Structural Ceramics: α-Sialon Matrix Reinforced with β-Sialon Fibers. Mater. Des. 2005, 26, 417–423. [Google Scholar] [CrossRef]
  48. Bhushan, B. Wear Maps. In Modern Tribology Handbook; CRC Press LLC: Boca Raton, FL, USA, 2001; Volume I, ISBN 0-8493-8403-6. [Google Scholar]
  49. Hsu, S.M.; Shen, M.C. Wear Mapping of Materials. In Wear—Materials, Mechanisms and Practice; John Wiley & Sons Ltd.: Chichester, UK, 2014; pp. 369–423. [Google Scholar]
  50. Fischer, T.E.; Tomizawa, H. Interaction of Tribochemistry and Microfracture in the Friction and Wear of Silicon Nitride. Wear 1985, 105, 29–45. [Google Scholar] [CrossRef]
  51. Tomizawa, H.; Fischer, T.E. Friction and Wear of Silicon Nitride and Silicon Carbide in Water: Hydrodynamic Lubrication at Low Sliding Speed Obtained by Tribochemical Wear. ASLE Trans. 1987, 30, 41–46. [Google Scholar] [CrossRef]
  52. Tomizawa, H.; Fischer, T.E. Friction and Wear of Silicon Nitride at 150° C to 800 °C. ASLE Trans. 1986, 29, 481–488. [Google Scholar] [CrossRef]
  53. Gates, R.S.; Hsu, S.M. Silicon Nitride Boundary Lubrication: Lubrication Mechanism of Alcohols. Tribol. Trans. 1995, 38, 645–653. [Google Scholar] [CrossRef]
  54. Waterhouse, R.B. Fretting Corrosion. Proc. Inst. Mech. Eng. 1955, 169, 1157–1172. [Google Scholar] [CrossRef]
  55. ASTM G204-10; Standard Test Method for Damage to Contacting Solid Surfaces under Fretting Conditions. ASTM (American Society for Testing and Materials) International: West Conshohocken, PA, USA, 2010. [CrossRef]
  56. Nesládek, M.; Španiel, M.; Jurenka, J.; Růžička, J.; Kuželka, J. Fretting Fatigue—Experimental and Numerical Approaches. Int. J. Fatigue 2012, 44, 61–73. [Google Scholar] [CrossRef]
  57. Kapsa, P. Environmental Effects of Fretting. In Tribocorrosion of Passive Metals and Coatings; Landolt, D., Mischler, S., Eds.; Woodhead Publishing Limited: Cambridge, UK, 2011; pp. 100–118. ISBN 2013206534. [Google Scholar]
  58. Landolt, D.; Mischler, S.; Stemp, M. Electrochemical Methods in Tribocorrosion: A Critical Appraisal. Electrochim. Acta 2001, 46, 3913–3929. [Google Scholar] [CrossRef]
  59. Ribeiro, A.M.; Alves, A.C.; Silva, F.S.; Toptan, F. Electrochemical Characterization of Hot Pressed CoCrMo-HAP Biocomposite in a Physiological Solution. Mater. Corros. 2015, 66, 790–795. [Google Scholar] [CrossRef]
  60. Stemp, M.; Mischler, S.; Landolt, D. The Effect of Mechanical and Electrochemical Parameters on the Tribocorrosion Rate of Stainless Steel in Sulphuric Acid. Wear 2003, 255, 466–475. [Google Scholar] [CrossRef]
  61. Guennouni, N.; Maisonnette, D.; Grosjean, C.; Andrieu, E.; Poquillon, D.; Blanc, C. Influence of Hydrogen on the Stress-Relaxation Properties of 17-4PH Martensitic Stainless Steel Manufactured by Laser Powder Bed Fusion. Mater. Sci. Eng. A 2022, 831, 142125. [Google Scholar] [CrossRef]
  62. Bargel, H.-J.; Schulze, G. (Eds.) Werkstoffkunde; Springer-Lehrbuch; Springer: Berlin/Heidelberg, Germany, 2012; ISBN 978-3-642-17716-3. [Google Scholar]
  63. Toptan, F.; Rocha, L.A. Tribocorrosion in Metal Matrix Composites. In Processing Techniques and Tribological Behavior of Composite Materials; Tyagi, R., Davim, J.P., Eds.; IGI Global: Hershey, PS, USA, 2015; pp. 149–167. [Google Scholar]
  64. Human, A.M.; Exner, H.E. Electrochemical Behaviour of Tungsten-Carbide Hardmetals. Mater. Sci. Eng. A 1996, 209, 180–191. [Google Scholar] [CrossRef]
  65. Sutthiruangwong, S.; Mori, G.; Kösters, R. Passivity and Pseudopassivity of Cemented Carbides. Int. J. Refract. Met. Hard Mater. 2005, 23, 129–136. [Google Scholar] [CrossRef]
  66. Hochstrasser, S.; Mueller, Y.; Latkoczy, C.; Virtanen, S.; Schmutz, P. Analytical Characterization of the Corrosion Mechanisms of WC-Co by Electrochemical Methods and Inductively Coupled Plasma Mass Spectroscopy. Corros. Sci. 2007, 49, 2002–2020. [Google Scholar] [CrossRef]
  67. Huttunen-Saarivirta, E.; Heino, V.; Isotahdon, E.; Kilpi, L.; Ronkainen, H. Tribocorrosion Behaviour of Thermally Sprayed Cermet Coatings in Paper Machine Environment. Tribol. Int. 2020, 142, 106006. [Google Scholar] [CrossRef]
  68. Thakare, M.R.; Wharton, J.A.; Wood, R.J.K.; Menger, C. Exposure Effects of Strong Alkaline Conditions on the Microscale Abrasion—Corrosion of D-Gun Sprayed WC-10Co-4Cr Coating. Tribol. Int. 2008, 41, 629–639. [Google Scholar] [CrossRef]
  69. Thakare, M.R.; Wharton, J.A.; Wood, R.J.K.; Menger, C. Investigation of Micro-Scale Abrasion-Corrosion of WC-Based Sintered Hardmetal and Sprayed Coating Using in Situ Electrochemical Current-Noise Measurements. Wear 2009, 267, 1967–1977. [Google Scholar] [CrossRef]
  70. Pourbaix, M. Atlas of Electrochemical Equilibria in Aqueous Solutions, 2nd ed.; Pourbaix, M., Ed.; CEBELCOR: Brussels, Belgium, 1974; ISBN 978-0915567980. [Google Scholar]
  71. Thakare, M.R.; Wharton, J.A.; Wood, R.J.K.; Menger, C. Exposure Effects of Alkaline Drilling Fluid on the Microscale Abrasion-Corrosion of WC-Based Hardmetals. Wear 2007, 263, 125–136. [Google Scholar] [CrossRef]
  72. Tang, W.; Zhang, L.; Chen, Y.; Zhang, H.; Zhou, L. Corrosion and Strength Degradation Behaviors of Binderless WC Material and WC-Co Hardmetal in Alkaline Solution: A Comparative Investigation. Int. J. Refract. Met. Hard Mater. 2017, 68, 1–8. [Google Scholar] [CrossRef]
  73. Lin, N.; He, Y.; Wu, C.; Liu, S.; Xiao, X.; Jiang, Y. Influence of TiC Additions on the Corrosion Behaviour of WC-Co Hardmetals in Alkaline Solution. Int. J. Refract. Met. Hard Mater. 2014, 46, 52–57. [Google Scholar] [CrossRef]
  74. Cho, J.E.; Hwang, S.Y.; Kim, K.Y. Corrosion Behavior of Thermal Sprayed WC Cermet Coatings Having Various Metallic Binders in Strong Acidic Environment. Surf. Coat. Technol. 2006, 200, 2653–2662. [Google Scholar] [CrossRef]
  75. Trausmuth, A.; Kronberger, M.; Raghuram, H.; Rojacz, H.; Badisch, E.; Rodríguez Ripoll, M. Tribocorrosion Performance of Fe-Base and Ni-Base Wear Resistant Coatings in CO2 Anoxic Environments. Corros. Sci. 2022, 196, 110035. [Google Scholar] [CrossRef]
  76. Katiyar, P.K. A Comprehensive Review on Synergy Effect between Corrosion and Wear of Cemented Tungsten Carbide Tool Bits: A Mechanistic Approach. Int. J. Refract. Met. Hard Mater. 2020, 92, 105315. [Google Scholar] [CrossRef]
  77. Mizuhara, K.; Hsu, S.M. Tribochemical Reaction of Oxygen and Water on Silicon Surfaces. Tribol. Ser. 1992, 21, 323–328. [Google Scholar] [CrossRef]
  78. Kalin, M.; Vižintin, J.; Novak, S. Effect of Fretting Conditions on the Wear of Silicon Nitride against Bearing Steel. Mater. Sci. Eng. A 1996, 220, 191–199. [Google Scholar] [CrossRef]
  79. Kalin, M.; Vižintin, J.; Novak, S.; Dražič, G. Wear Mechanisms in Oil-Lubricated and Dry Fretting of Silicon Nitride against Bearing Steel Contacts. Wear 1997, 210, 27–38. [Google Scholar] [CrossRef]
  80. Huttunen-Saarivirta, E.; Kilpi, L.; Hakala, T.J.; Carpen, L.; Ronkainen, H. Tribocorrosion Study of Martensitic and Austenitic Stainless Steels in 0.01M NaCl Solution. Tribol. Int. 2016, 95, 358–371. [Google Scholar] [CrossRef]
  81. National Institute of Standards and Technology, Gaithersburg, U.S. NIST X-Ray Photoelectron Spectroscopy Database, Version 4.1. Available online: http://srdata.nist.gov/xps/ (accessed on 21 December 2021).
  82. Goyal, V.; Sharma, S.K.; Kumar, B.V.M. Effect of Lubrication on Tribological Behaviour of Martensitic Stainless Steel. Mater. Today Proc. 2015, 2, 1082–1091. [Google Scholar] [CrossRef]
  83. Venske, A.F.; de Castro, V.V.; da Costa, E.M.; dos Santos, C.A. Sliding Wear Behavior of an AISI 440B Martensitic Stainless Steel Lubricated with Biodiesel and Diesel-Biodiesel Blends. J. Mater. Eng. Perform. 2018, 27, 5427–5437. [Google Scholar] [CrossRef]
  84. Basu, B.; Kalin, M. (Eds.) Case Study: Sialon Ceramics. In Tribology of Ceramics and Composites; John Wiley & Sons, Inc.: Hoboken, NJ, USA, 2011; pp. 167–184. [Google Scholar]
  85. Hu, Q.; Ji, D.; Shen, M.; Zhuang, H.; Yao, H.; Zhao, H.; Guo, H.; Zhang, Y. Three-Body Abrasive Wear Behavior of WC-10Cr3C2-12Ni Coating for Ball Mill Liner Application. Materials 2022, 15, 4569. [Google Scholar] [CrossRef] [PubMed]
  86. Li, Y.; Schreiber, P.; Schneider, J.; Greiner, C. Tribological Mechanisms of Slurry Abrasive Wear. Friction 2023, 11, 1079–1093. [Google Scholar] [CrossRef]
  87. Depover, T.; Wallaert, E.; Verbeken, K. Fractographic Analysis of the Role of Hydrogen Diffusion on the Hydrogen Embrittlement Susceptibility of DP Steel. Mater. Sci. Eng. A 2016, 649, 201–208. [Google Scholar] [CrossRef]
  88. Ghasali, E.; Ebadzadeh, T.; Alizadeh, M.; Razavi, M. Mechanical and Microstructural Properties of WC-Based Cermets: A Comparative Study on the Effect of Ni and Mo Binder Phases. Ceram. Int. 2018, 44, 2283–2291. [Google Scholar] [CrossRef]
  89. Totolin, V.; Rodríguez Ripoll, M.; Jech, M.; Podgornik, B. Enhanced Tribological Performance of Tungsten Carbide Functionalized Surfaces via In-Situ Formation of Low-Friction Tribofilms. Tribol. Int. 2016, 94, 269–278. [Google Scholar] [CrossRef]
  90. Haynes, W.M. (Ed.) CRC Handbook of Chemistry and Physics, 88th ed.; CRC Press: Boca Raton, FL, USA, 2008; ISBN 9780429170195. [Google Scholar]
  91. Kelly, R.G.; Scully, J.R.; Shoesmith, D.W.; Buchheit, R.G. Electrochemical Techniques in Corrosion Science and Engineering; Marcel Dekker, Inc.: New York, NY, USA, 2002; ISBN 0824799178. [Google Scholar]
Figure 1. Schematic of the elements and the stress situation of a typical fretting contact in a ball-on-flat configuration under the load FN with tangential oscillation at speed v. The stick and the slip areas are associated with regular damage mechanisms of fretting.
Lubricants 11 00195 g001
Figure 2. Custom-tailored adapter for SRV®5 experiments. (a) Cross-section of the carrier of hemispherical elements; (b) PEEK holder for bottom and top specimen carrier with mounted counter body.
Lubricants 11 00195 g002
Figure 3. Friction in W1 lubricated tribometer experiments. (a) Representative coefficient of friction COF vs. time; (b) position resolved friction µ(x) at 3600 s runtime against counter material 1.4108 steel; (c) overall numerical averages for the steady-state COF (t ≥ 2400 s; solid color) and the wear scar diameter (WSD; hatched color) of all N experiments per material combination (N ≥ 2). The cumulative error includes the standard deviation between the individual experiments (COF, WSD) and the fluctuation within a single experiment (COF).
Lubricants 11 00195 g003
Figure 4. Friction in F1 lubricated tribometer experiments. (a) Representative coefficient of friction COF vs. time; (b) friction vs. position at 1200 s runtime of experiments against counter material 1.4108 in F1; (c) overall numerical averages of the steady-state COF (t ≥ 900 s; solid color) and the wear scar diameter (WSD; hatched color) of all experiments (N ≥ 2). Error bars are as described in Figure 3.
Lubricants 11 00195 g004
Figure 5. Optical and SEM images of wear scars obtained in W1. Part 1—MMC. (a) MMC specimen, optical image. The dashed pink line accentuates the wear track. The dominant wear mode is adhesion. The backscatter mode SEM image shows a wear scar surface detail at high magnification. EDX spectra show the distribution of the elements Fe and O at different segments of the wear area, as indicated by arrows. (b) Reference 1.4108 counter body specimen from the same experiment. The SEM/EDX details show Cr hard phase embedded into the steel matrix by sliding.
Lubricants 11 00195 g005
Figure 6. Optical and SEM images of wear scars obtained in W1. Part 2—ceramics. (a) SN1 specimen, optical image. The dominant wear mode is third-body abrasion. The SEM/EDX images show the wear scar overview elemental-wise with the deposit regions in axial of wear particles from the steel part. Centrally, a few spots of Fe also show an adhesive component. (b) Reference 1.4108 counter body specimen from the same experiment. The backscatter mode SEM image shows a surface detail at high magnification. EDX spectra show by the distribution of the elements Si and O that particles formed by a tribochemical–oxidative reaction of the SiAlON ceramic react as an additional abrasive and are mostly ejected from the contact, but also partly embedded into the steel matrix.
Lubricants 11 00195 g006
Figure 7. Optical and SEM images of wear scars obtained in W1. Part 3—1.4125 HT1. (a) HT1 specimen. The dominant wear mode is abrasion combined with HIC-based tribocorrosion. The SEM image shows the wear scar center with tribocorrosion products at several crack mouths, which were formed evidently after the sliding experiment. (b) Reference 1.4108 counter body specimen from the same experiment. The SEM image shows abrasive wear and a small amount of fine particles.
Lubricants 11 00195 g007
Figure 8. Optical and SEM images of wear scars obtained in W1. Part 4—1.4125 HT2. (a) HT2 specimen. The wear mode is dominantly abrasion with low-scale adhesion. The SEM image shows the wear scar center with debris plasticized among sliding grooves, forming a tribolayer. (b) Reference 1.4108 counter body specimen from the same experiment. The SEM image shows abrasive wear with subordinate seizure effects.
Lubricants 11 00195 g008
Figure 9. Optical and SEM images of wear scars obtained in F1. Part 1—MMC. (a) MMC specimen. The dominant wear mode is mild abrasion with low-scale adhesion in the center. The SEM image shows the adhesive spot in the wear scar center with steel material smeared onto MMC. Fe and O rich areas barely coincide. (b) Reference 1.4108 counter body specimen from the same experiment.
Lubricants 11 00195 g009
Figure 10. Optical and SEM images of wear scars obtained in F1. Part 2—ceramics. (a) SN1 specimen. The dominant wear mode is combined adhesion–abrasion. The SEM/EDX elemental distribution shows a small adhesive spot in the wear scar center and Fe oxides outside the contact. (b) Reference 1.4108 counter body specimen from the same experiment with SN1. (c) SN2 specimen. The dominant wear mode is adhesion–oxidation. The SEM/EDX elemental distribution shows numerous adhesion spots in the wear scar center. Simultaneous occurrence of Fe and O show the pronounced expression of oxidation mechanisms. (d) Reference 1.4108 counter body specimen from the same experiment with SN2.
Lubricants 11 00195 g010
Figure 11. Confocal white light measurements of SN1 wear area obtained against 1.4108 steel in (a) W1; (b) F1. For a better comparison, the arrows located at the surface image corner determine a 500 × 500 µm square.
Lubricants 11 00195 g011
Figure 12. Tribocorrosion experiments on SRV®5 in W1. Potential E of tested materials in mode A-RE or B-RE. (a) Basic schematic (T-I, T-II, T-III) and OCP measurement in SN1/1.4108 or SN2/1.4108 experiments; (b) OCP measurement MMC/1.4108; (c) OCP measurement HT2/1.4108; (d) OCP measurement HT1/1.4108 with an asterisk (*) marking events of hydrogen outgassing from the material. The light blue render corresponds to the triboexperiment. Materials measured in alternating WE experiments are shown by markers, whereas encircled markers indicate materials measured in mutual contact. Chain dotted lines connect OCP curves during alternation.
Lubricants 11 00195 g012
Figure 13. Tribocorrosion experiments on SRV®5 in F1. Potential E of tested materials in mode A-RE. (a) OCP measurement SN1/1.4108 and SN2/1.4108; (b) OCP measurement MMC/1.4108. A curve of 1.4108 rubbing against the holder resin (REF) was added as reference. The light blue render corresponds to the triboexperiment.
Lubricants 11 00195 g013
Figure 14. Electrochemical laboratory experiments: potential scans. (a) Cyclovoltammetric measurement and (b) polarization curve of 1.4108 (flat) and 1.4112 (flat; reference); (c) cyclovoltammetric measurement and (d) polarization curve MMC (sphere) and 1.4125 HT1 (sphere). The scans to lower potentials are held in the respective softer color. The small inserts in (a,c) show pitting initiation behavior during a respective second experiment for the materials 1.4108 and 1.4125 HT1. Units of the inserts correspond to the main diagram. Experimental details are described in Table 6.
Lubricants 11 00195 g014
Figure 15. Electrochemical laboratory experiments: potentiostatic measurements. Images of the MMC spheres held under anodic polarization at a stable potential (A) or (B) and a reference image from an untreated specimen. Backscatter images: Zooming-in starts from top left clockwise. Bottom left are secondary electron images from the identical location at the highest magnification.
Lubricants 11 00195 g015
Figure 16. Surface element and valence distribution of electrochemically investigated MMC samples measured by XPS. (a) Relative atomic concentrations averaged over 5 points each for untreated, PDYN, PSTAT (A) at +0.16 V and PSTAT (B) at +0.34 V polarization. C-Carbide (C1s) and W/WC (W4f7/2) results are 0.5-times compressed for sake of visibility of smaller concentrations; (b) intensity distribution of W valences 0; +IV; +VI for untreated reference and for PSTAT (A) treated sample.
Lubricants 11 00195 g016
Figure 17. MMC surface morphology from SEM data. Phase distribution of (a) MMC as received; (b) MMC after triboexperiment in W1 over 100,000 sliding cycles under OCP, wear scar center; (c) after electrochemical exposure in W1 to potentiodynamic potential in electrochemical laboratory experiments (Figure 14d). First row: SEM images obtained in backscatter mode. Second row: phase distribution obtained from upper images according to elemental contrast: WC (yellow); amorphous binder (blue); agglomerated second carbide phase (red). Grey boundaries indicate transition between phases.
Lubricants 11 00195 g017
Figure 18. Elemental concentration variation on various locations of samples from triboexperiments. Distribution of the elements Fe and Ni of two different triboexperiments against 1.4108 steel at OCP with and without cross-welded steel and at different positions of the wear area. (a) SEM image of wear track edge, positions are: (a-I) central wear track; (a-II) boundary; (a-III) outside of the wear track; (b) SEM image of wear track center with adhesive transfer from steel counterpart, positions are: (b-I) Fe-transfer; (b-II) adjacent at identical contact pressure as (b-I); (b-III) adjacent at lower contact pressure; (c) EDX spectra acquired at positions a-I to a-III; (d) EDX spectra acquired at positions b-I to b-III. All EDX peaks are base line corrected and normalized to Ti Kα at 4.5 keV. REF is the spectra of a distant area outside of the respective wear area.
Lubricants 11 00195 g018
Figure 19. General model of fretting-related corrosion in a ball-on-flat contact crevice with a low conductive electrolyte at a deliberate progress. The corrosion site location is projected on the spherical part only. In step 1, the fretting crevice is established, and separation of cathode and anode area occurs. With increasing wear (step 2), the initially narrow anodic belt expands towards the ingress. The wider cathodic belt is pushed ahead with the anode (step 3).
Lubricants 11 00195 g019
Figure 20. Recurrent formation of critical anodic/cathodic surface polarization as a proposed scenario of degradation related to alternation of an aqueous medium W1 and an organic medium F1.
Lubricants 11 00195 g020
Table 1. Investigated materials.
MaterialDescriptionHardnessDensity (/g cm−3)TribometricElectrochemical
MMC 1 2WC-TiC-NiCr2050 ± 50 (HV10)14.3 ± 0.3XX
SN1 3β-SiAlON1550 (HV10)3.21X
SN2 2α/β-SiAlON1500 (HV50)3.24X
HT1 (1.4125 4)Stainless martensitic steel835 ± 10 (HV10)7.7XX
HT2 (1.4125 5)700 ± 10 (HV10)X
1.4108700 ± 50 (HV10)XX
1.4112 X
1 Porosity ≤ 0.5%. 2 Grain size category of WC is 0.9 µm. 3 Stabilizers Y2O3; Al2O3. 4 Heat-treatment procedure follows: 2-step austenitising; quenching + cryogenic treatment by pressurized nitrogen; tempering at 100 °C. 5 Heat-treatment procedure follows: 2-step austenitising; quenching + cryogenic treatment by pressurized nitrogen; tempering at 200 °C.
Table 2. MMC material composition. Data were retrieved from EDX measurements.
MaterialUnitHard PhaseBinderOthers
W
(as WC)
Ti
(as TiC)
Cr
(as Cr3C2)
TotalNi
(as NiCr)
Cr
(as NiCr)
MoTotal
MMCratio 1
(at.%)
4 (±0.5):1:0.1 (±0.05) 2.4 (±1):1:0.4 (±0.25)
wt.% 90–92 8–10<1
1 Estimated.
Table 3. Stainless steel elemental composition.
MaterialUnitFeCCrNiMoVSiMnPSN
1.4112wt.%balance0.85–0.9517.0–19.0-0.90–1.300.07–0.12≤1.00≤1.00≤0.040≤0.015-
1.4108balance0.28–0.3514.4–16.0≤0.530.90–1.10-≤1.05≤1.03≤0.025≤0.0050.35–0.45
1.4125balance0.92–1.2315.8–18.2-0.37–0.85-≤1.05≤1.03≤0.045≤0.035-
Table 4. Electrolyte/lubricant composition and physico-chemical values at 20 °C.
ParameterUnitW1F1
Description Test water, aeratedProcessing fluid
Compositionmg L−1Cationic
Ca/Mg/K 0.5; Na 4.0; Si 1.5
Anionic
NO3 0.5; Cl 2.0; SO4 5.0; CH3COO 8.4
vol.% Agents 1–2; W1 1.12
VOC 1 balance
Precipitate NoneNone
Densityg cm−30.990.79
Dynamic viscositymPa s1.20.7
ConductivityµS cm−1310.15
Dielectric permittivity78.54.4 ± 0.5
Tribometric XX
Electrochemical X
1 Main compound structures (Σ ≥ 95%) are CxHy and CzH3zO. Parameters printed in bold (last two rows) refer to the experimental use of the respective electrolyte/lubricant.
Table 5. Experimental parameters: triboexperimental setup. Normal load Fn and pre-set normal load Fn_set are explained in the text.
Tribometric ParameterUnitW1F1
Base material 1 MMC 2
SN1 2, SN2 3
MMC 2
SN1 2, SN2 3
HT1 3, HT2 3
Counter material 1 1.4108
Normal load
(pre-set normal load)
N2.0 ± 0.1
(1.5 ± 0.1)
Strokeµm100
FrequencyHz50
Temperature Room temperature
Durations72002700
Track lengthm7227
1 Dimensions see text; 2 polyphenolic insert with embedded specimen; 3 disc material.
Table 6. Experimental parameters: electrochemical experimental setup. Conditions of measurements including tribometer runs and electrochemical laboratory experiments.
Experimental
Section
MethodStepRE TypeDAQ RateE vs. RE
/V
Exposure Time or Scan Rate
TribometricOCP et072 (gel)10 Hz
PotentiodynamicOCP1K0265 (salt water) + gel bridge10 Hzuntil stable
CC2−1.2300 s
CV3as increment per 0.0010 V{−1.2| + 0.8|−1.2}0.0025 V s−1
PDYN4{−1.2| + 1.6 1 |−0.4}0.0010 V s−1 2
0.0050 V s−1 3
PotentiostaticOCP1K0265 (salt water) + gel bridge10 Hzuntil stable
PSTAT2start: 10 Hz
steady: 1 Hz
see textsee text
1 The experimental limitation of the anodic polarization was additionally set to the potential where a current density of ~0.1 A cm−2 was reached. 2 Scan rate towards anodic potentials. 3 Scan rate towards cathodic potentials.
Table 7. Potentials of W and Ni oxidation to the indicated ions (prevalent products in parentheses). Values are for reaction in water at pH 7, 5, 3 versus NHE at 25 °C and 0.1 MPa and the given concentrations. Values were calculated from standard data [90]. The more stable educt (reduced species of W or Ni) is printed in bold italics.
pHc (W4+; W6+; Ni2+)
/mol L−1
W→W4+ (WO2)
E/V
W→W6+ (WO3, WO42−)
E/V
Ni→Ni2+ (Ni2+)
E/V
710−6−0.621−0.5540.413
5−0.503−0.4360.413
3−0.3850.318−0.413
710−4−0.591−0.4950.354
5−0.473−0.3770.354
3−0.3550.259−0.354
Table 8. Geometry influence on cathodic polarization. Potential E(x) and current I(x) at the electrode surface in a linear recess of length L and height h at a deliberate distance x (in bold) from an anode positioned at x = 0 cm. The descriptor of the geometry, the conductivity G and the polarization resistance Rp are summarized by the dimensionless Wagner Number Wa. The average cathodic current Itot in the electrolyte is 10−5 A across the recess mouth at x = 0 cm. The polarization of −0.25 V is arbitrarily chosen. For the reason of simplicity, the electrode area was determined to be 1 cm2.
Wa 1E(x)
/V
–Itot
/10−6 A
–I(x)
/10−6 A
0.1−0.25−0.183−0.053−0.026107.32.21.0
0.04−0.152−0.021−0.0016.10.80.2
0.01−0.092−0.00203.70.070.003
0.004−0.051002.10.004<0.0001
@ position x/cm00.10.50.800.10.50.8
1 Calculation of Wa following [91]: G = 30 × 10−6 Ohm−1 cm−1; L = 1 cm; h = 0.04 cm; Rp = 83.3; 33.3; 8.33; 3.33 kOhm cm2.
Disclaimer/Publisher’s Note: The statements, opinions and data contained in all publications are solely those of the individual author(s) and contributor(s) and not of MDPI and/or the editor(s). MDPI and/or the editor(s) disclaim responsibility for any injury to people or property resulting from any ideas, methods, instructions or products referred to in the content.

