Sanded Wheel–Rail Contacts: Experiments on Sand Crushing Behaviour


Abstract
: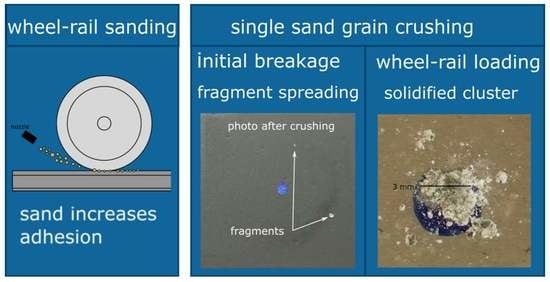
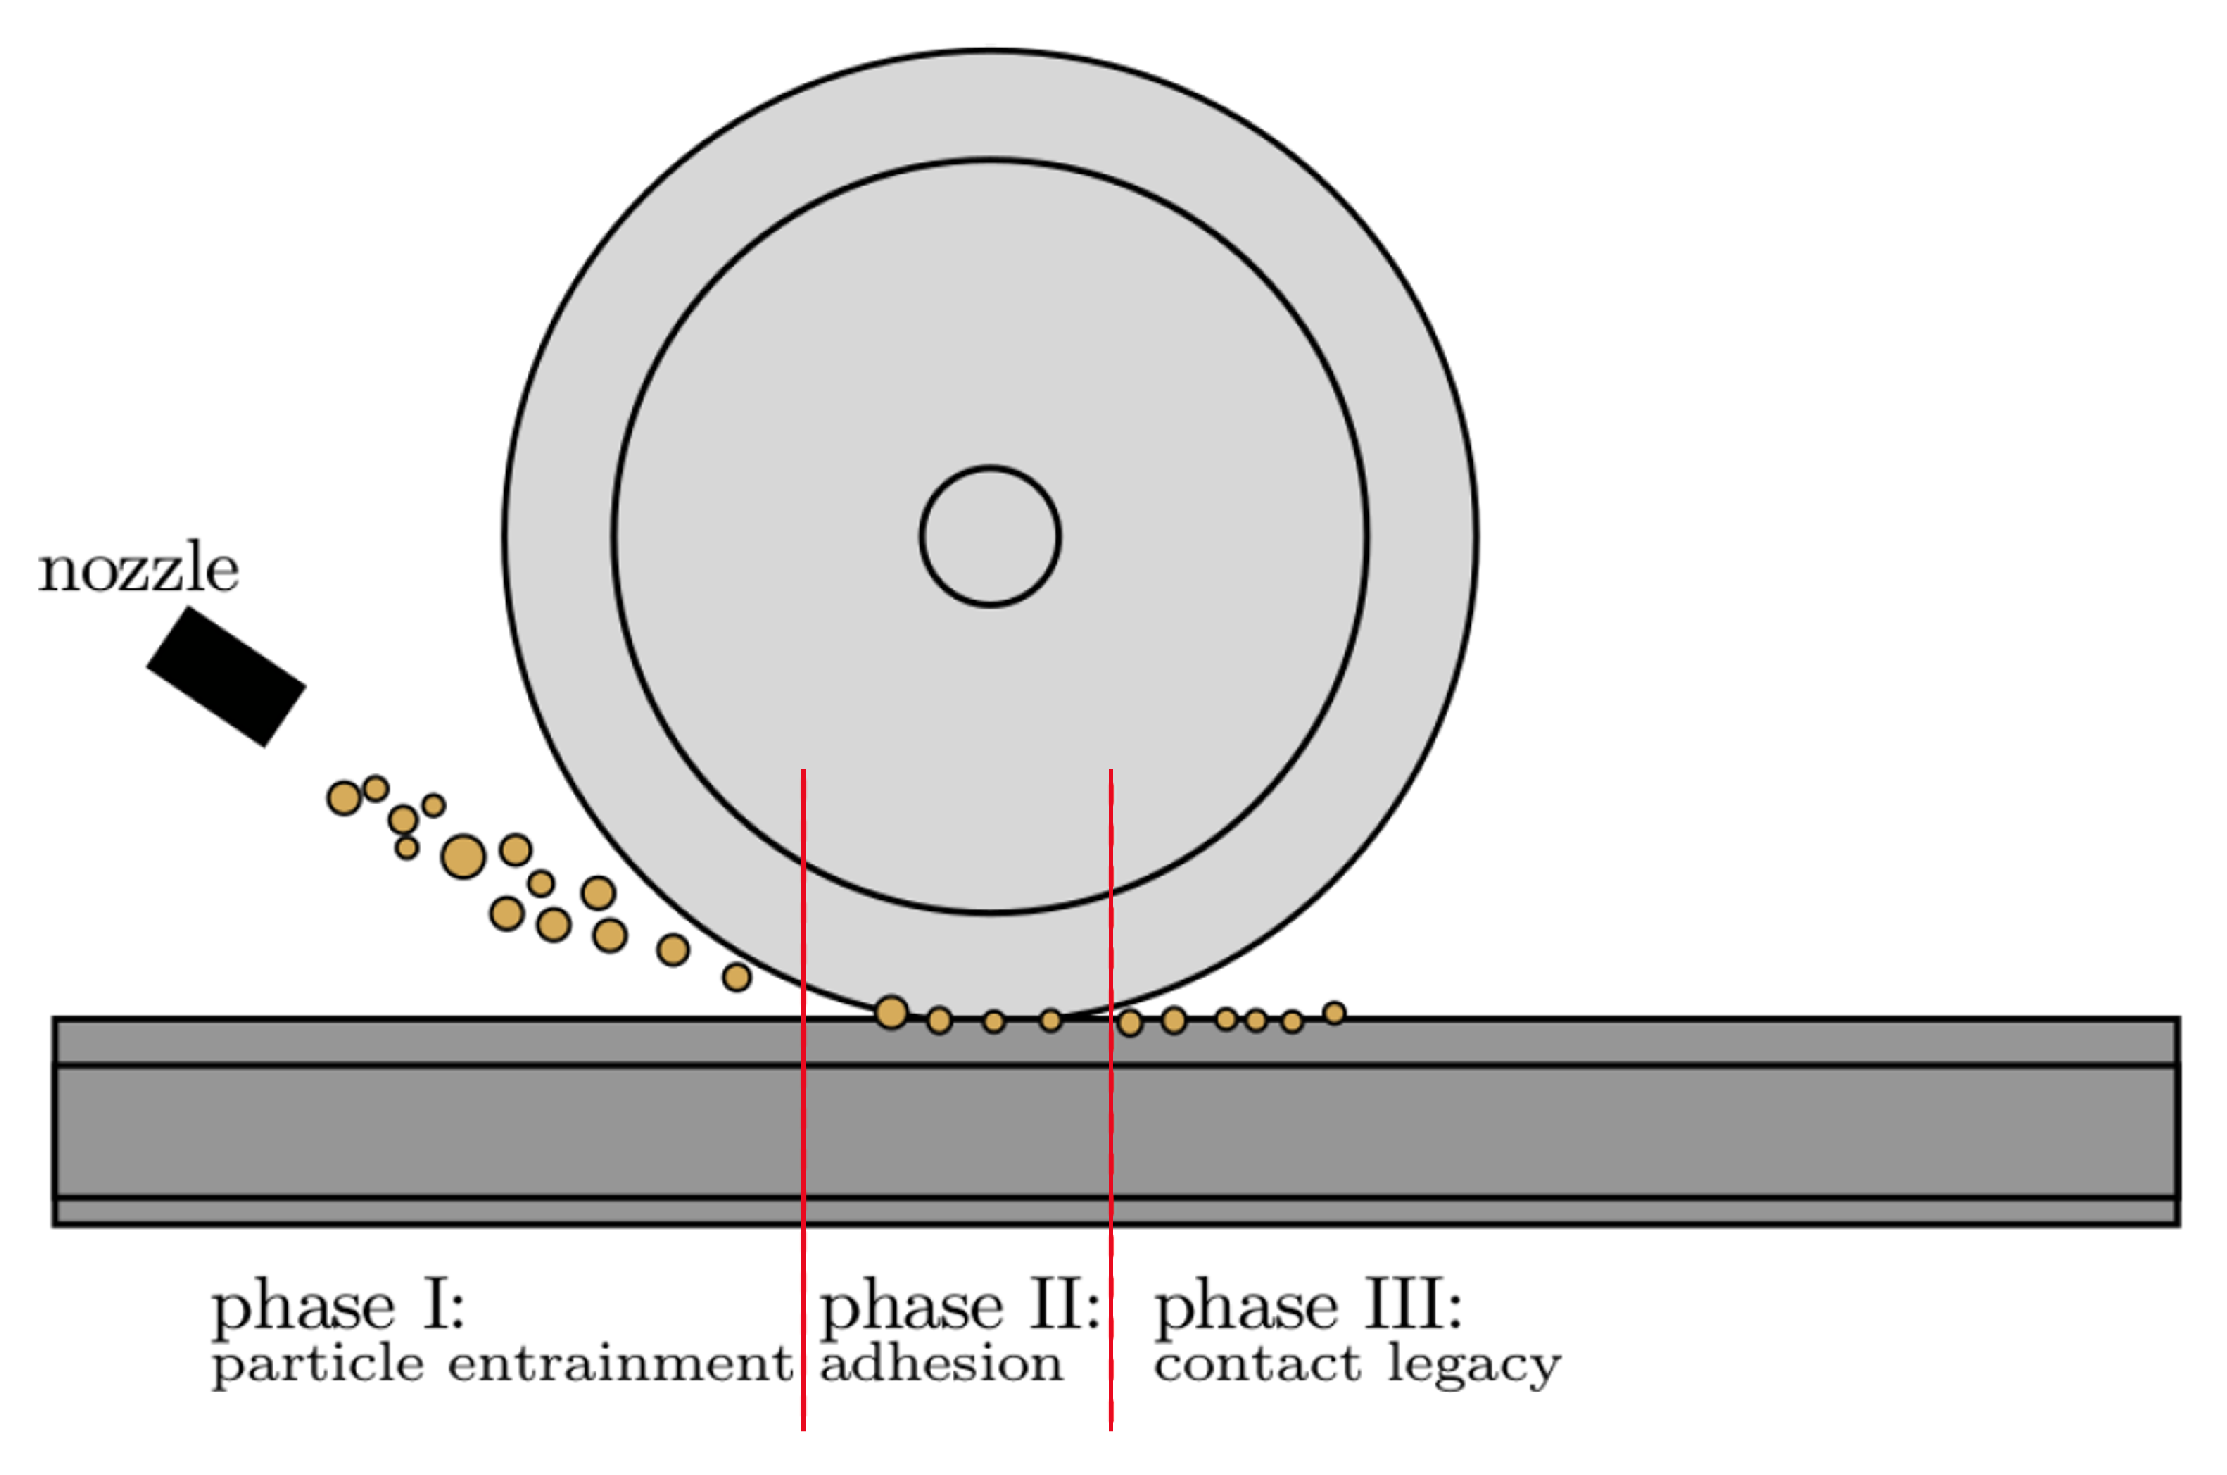
1. Introduction
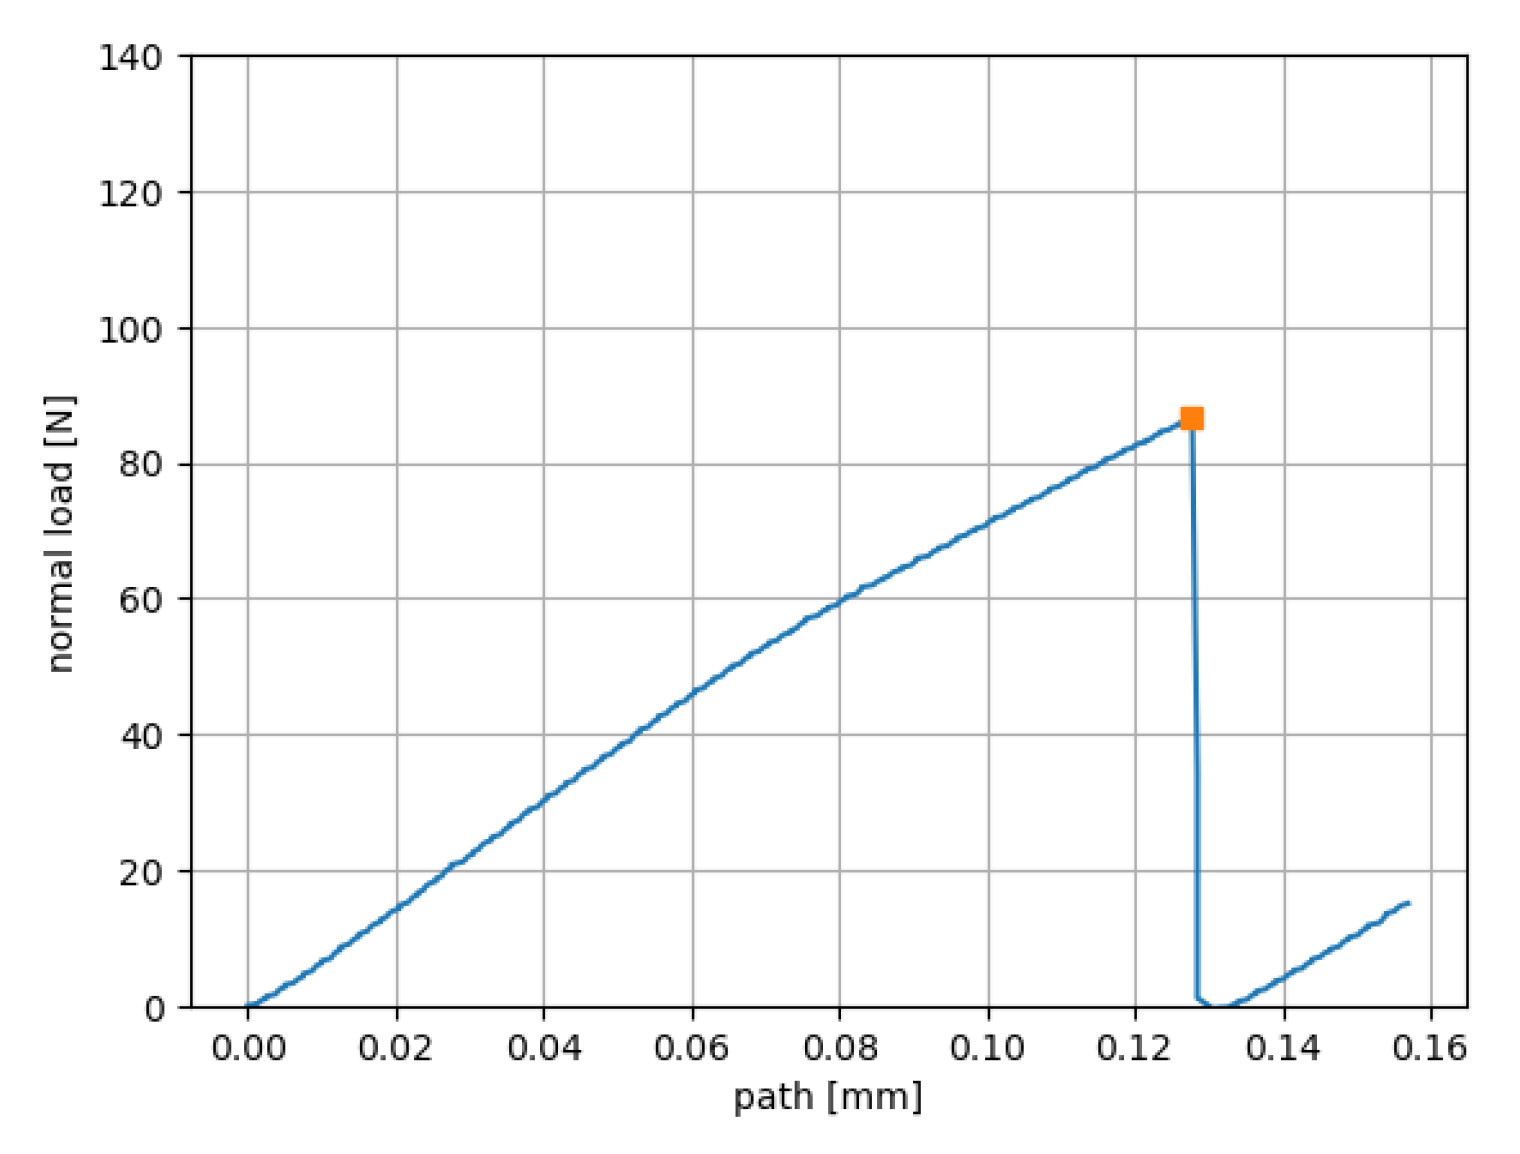
2. Single Grain Crushing: First Breakage
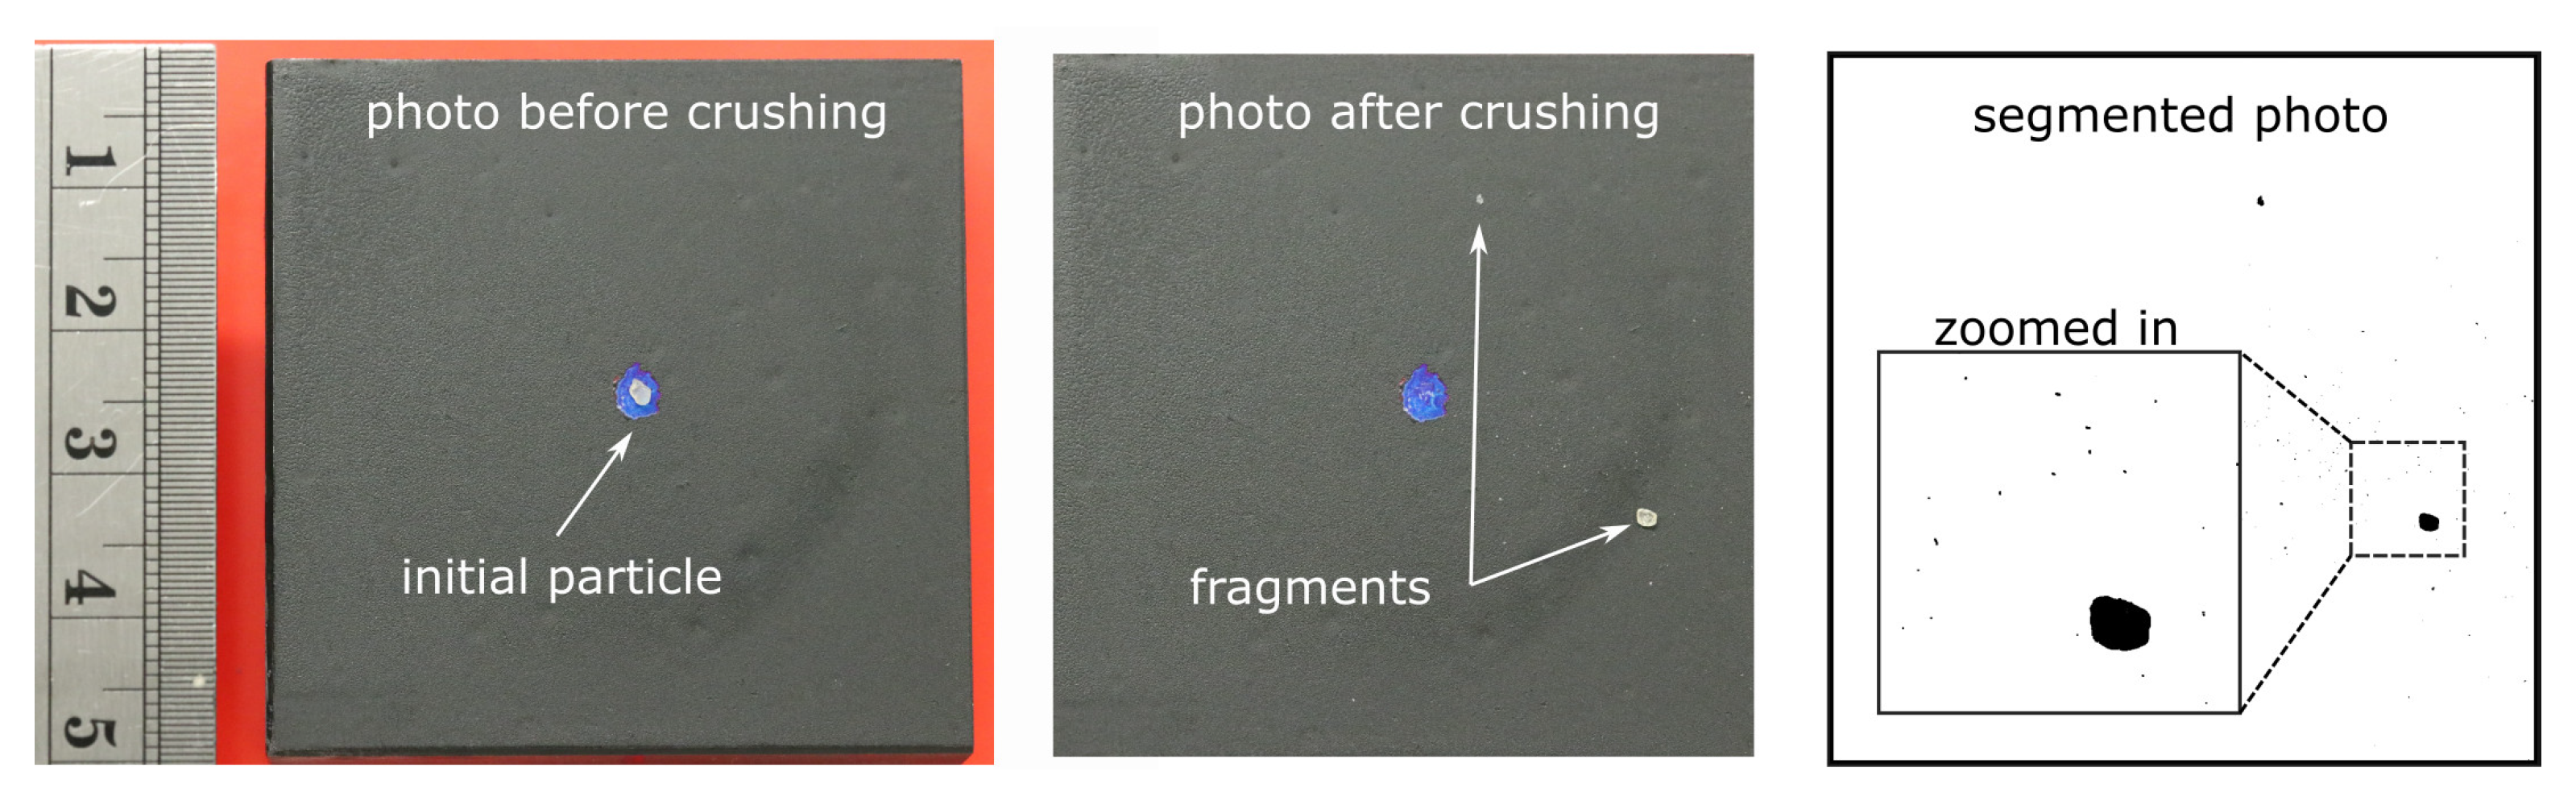
2.1. Materials and Methods
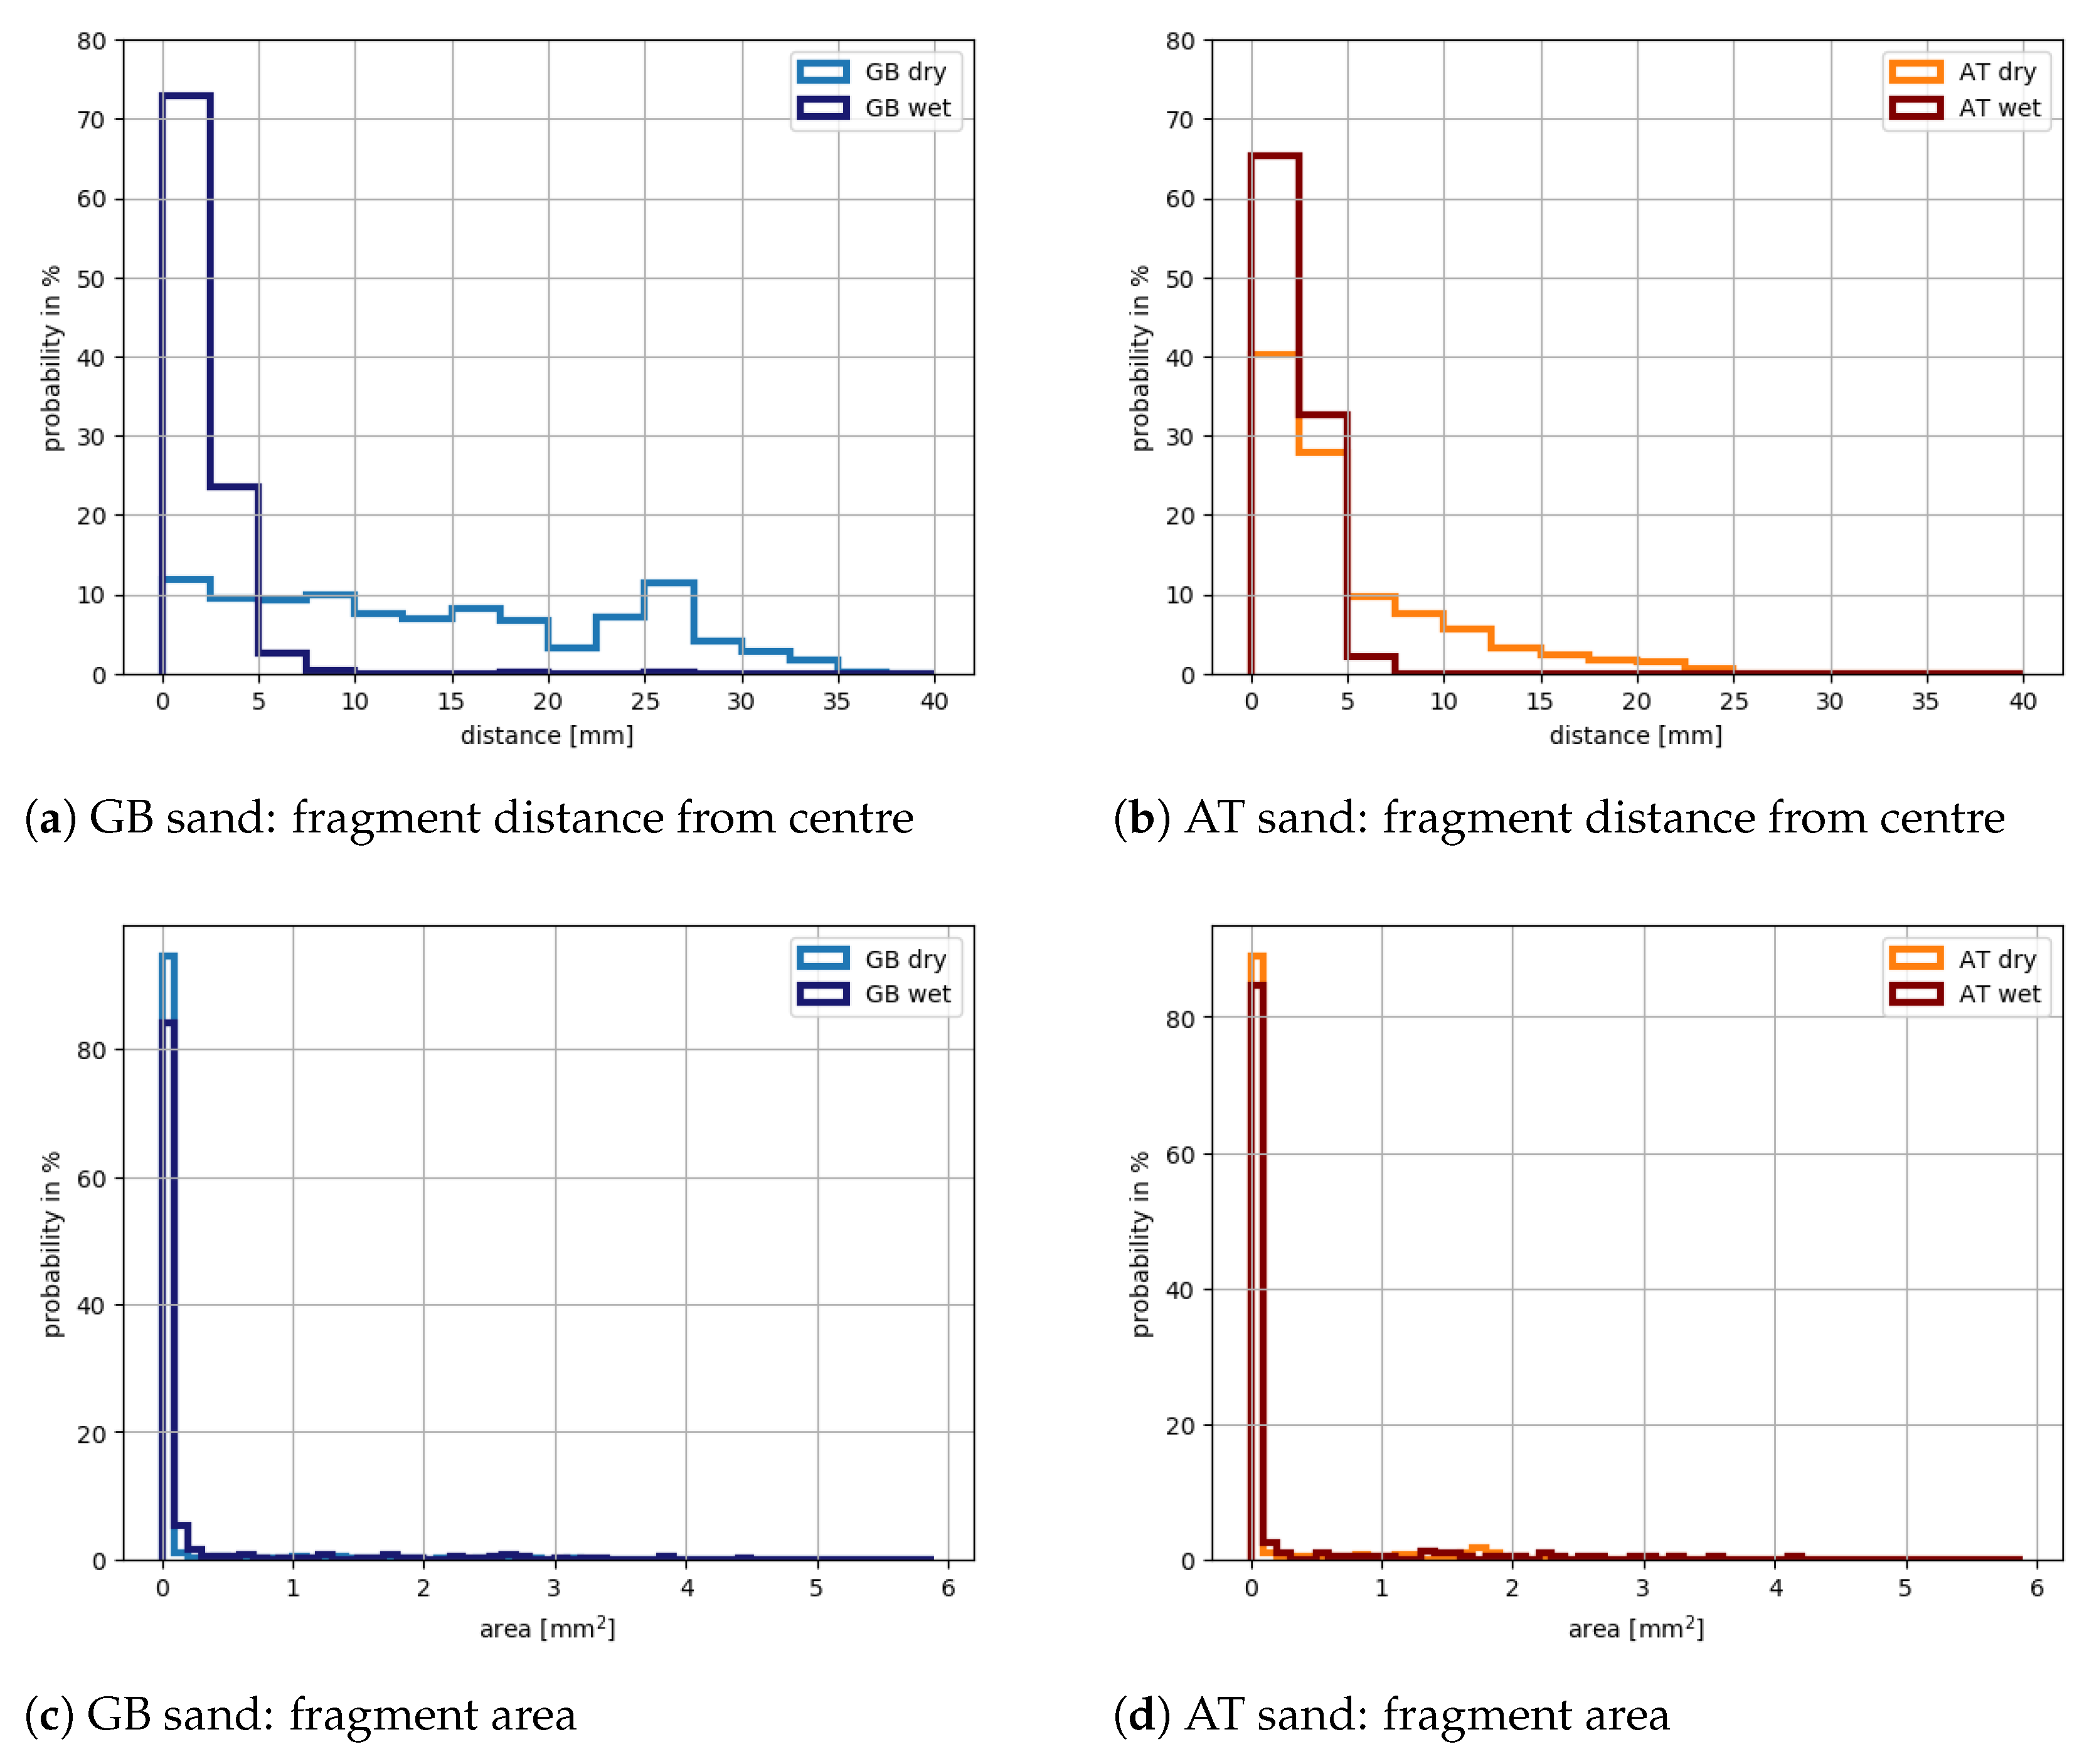
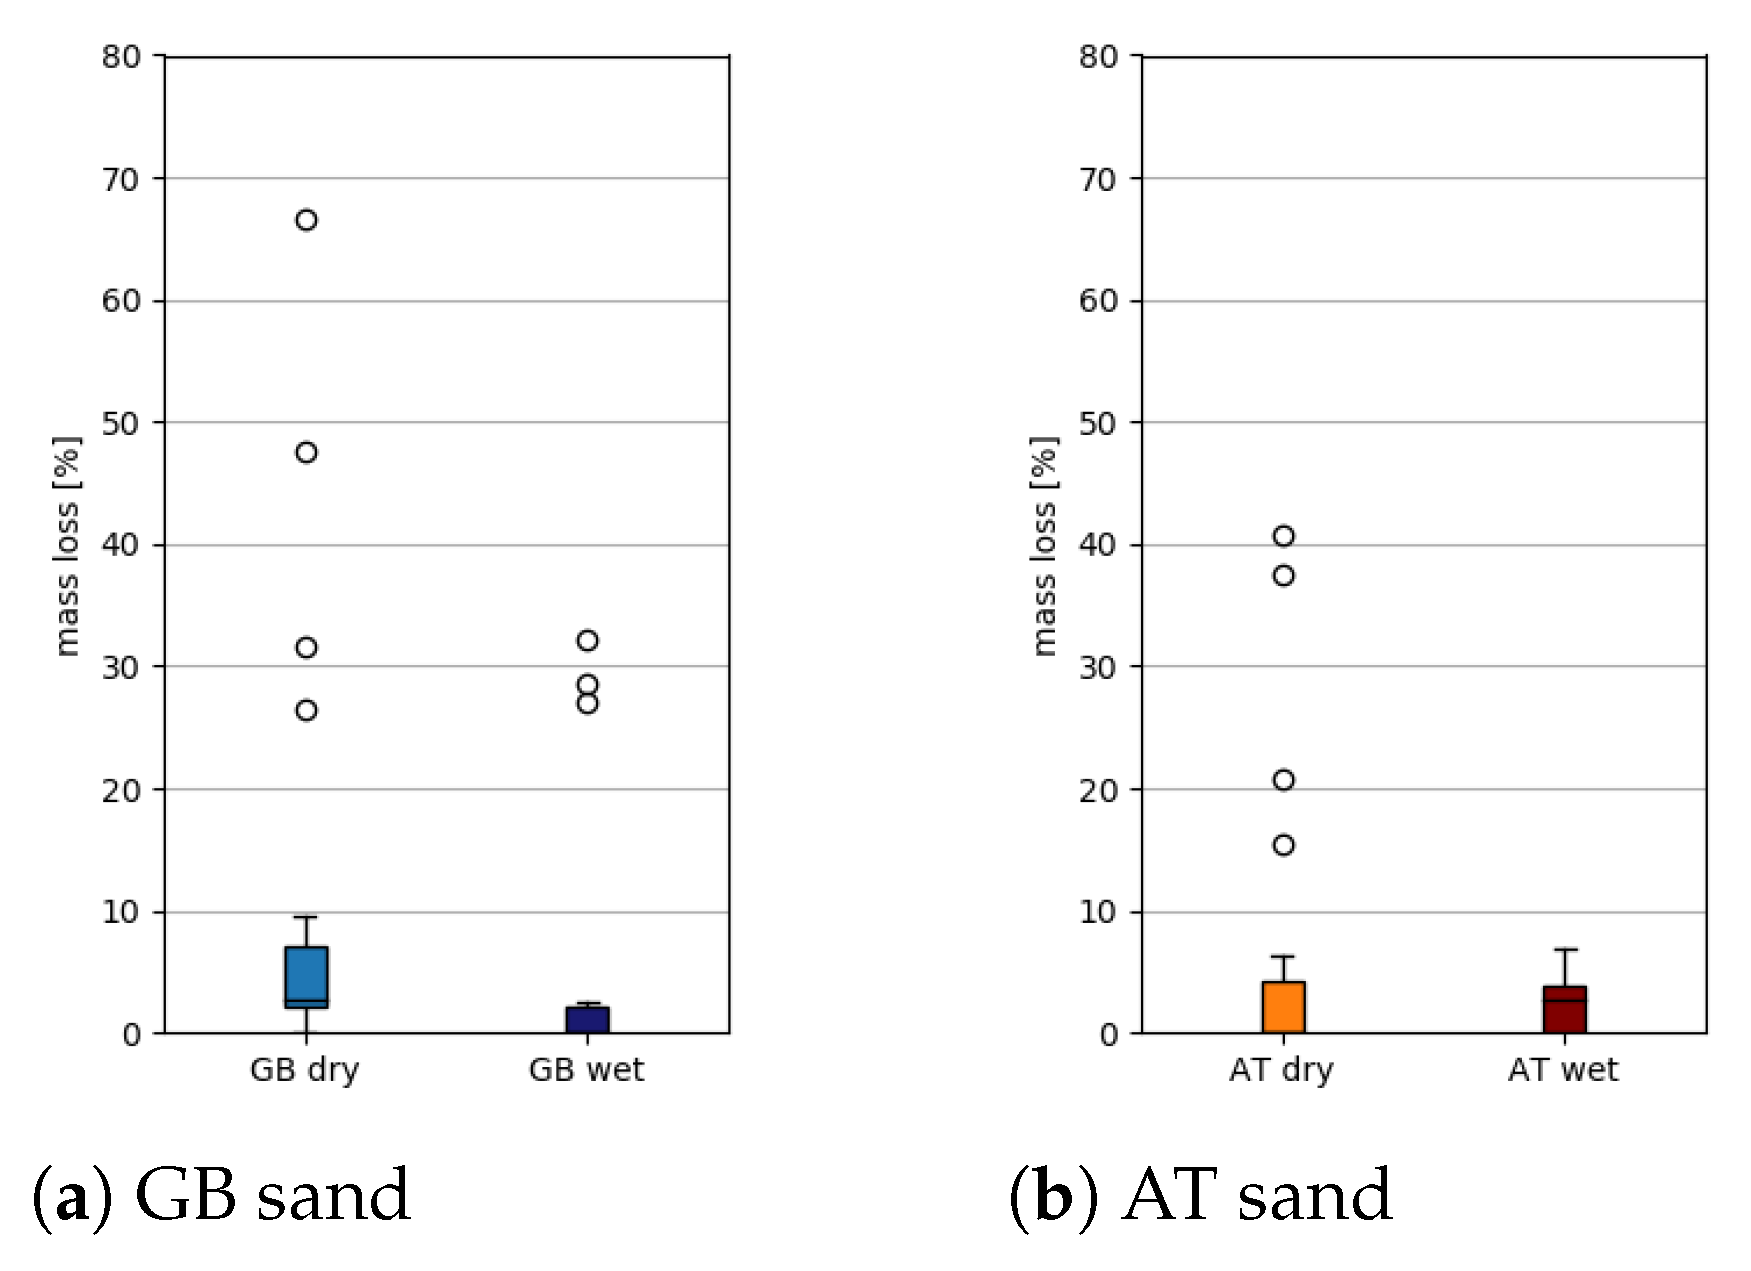
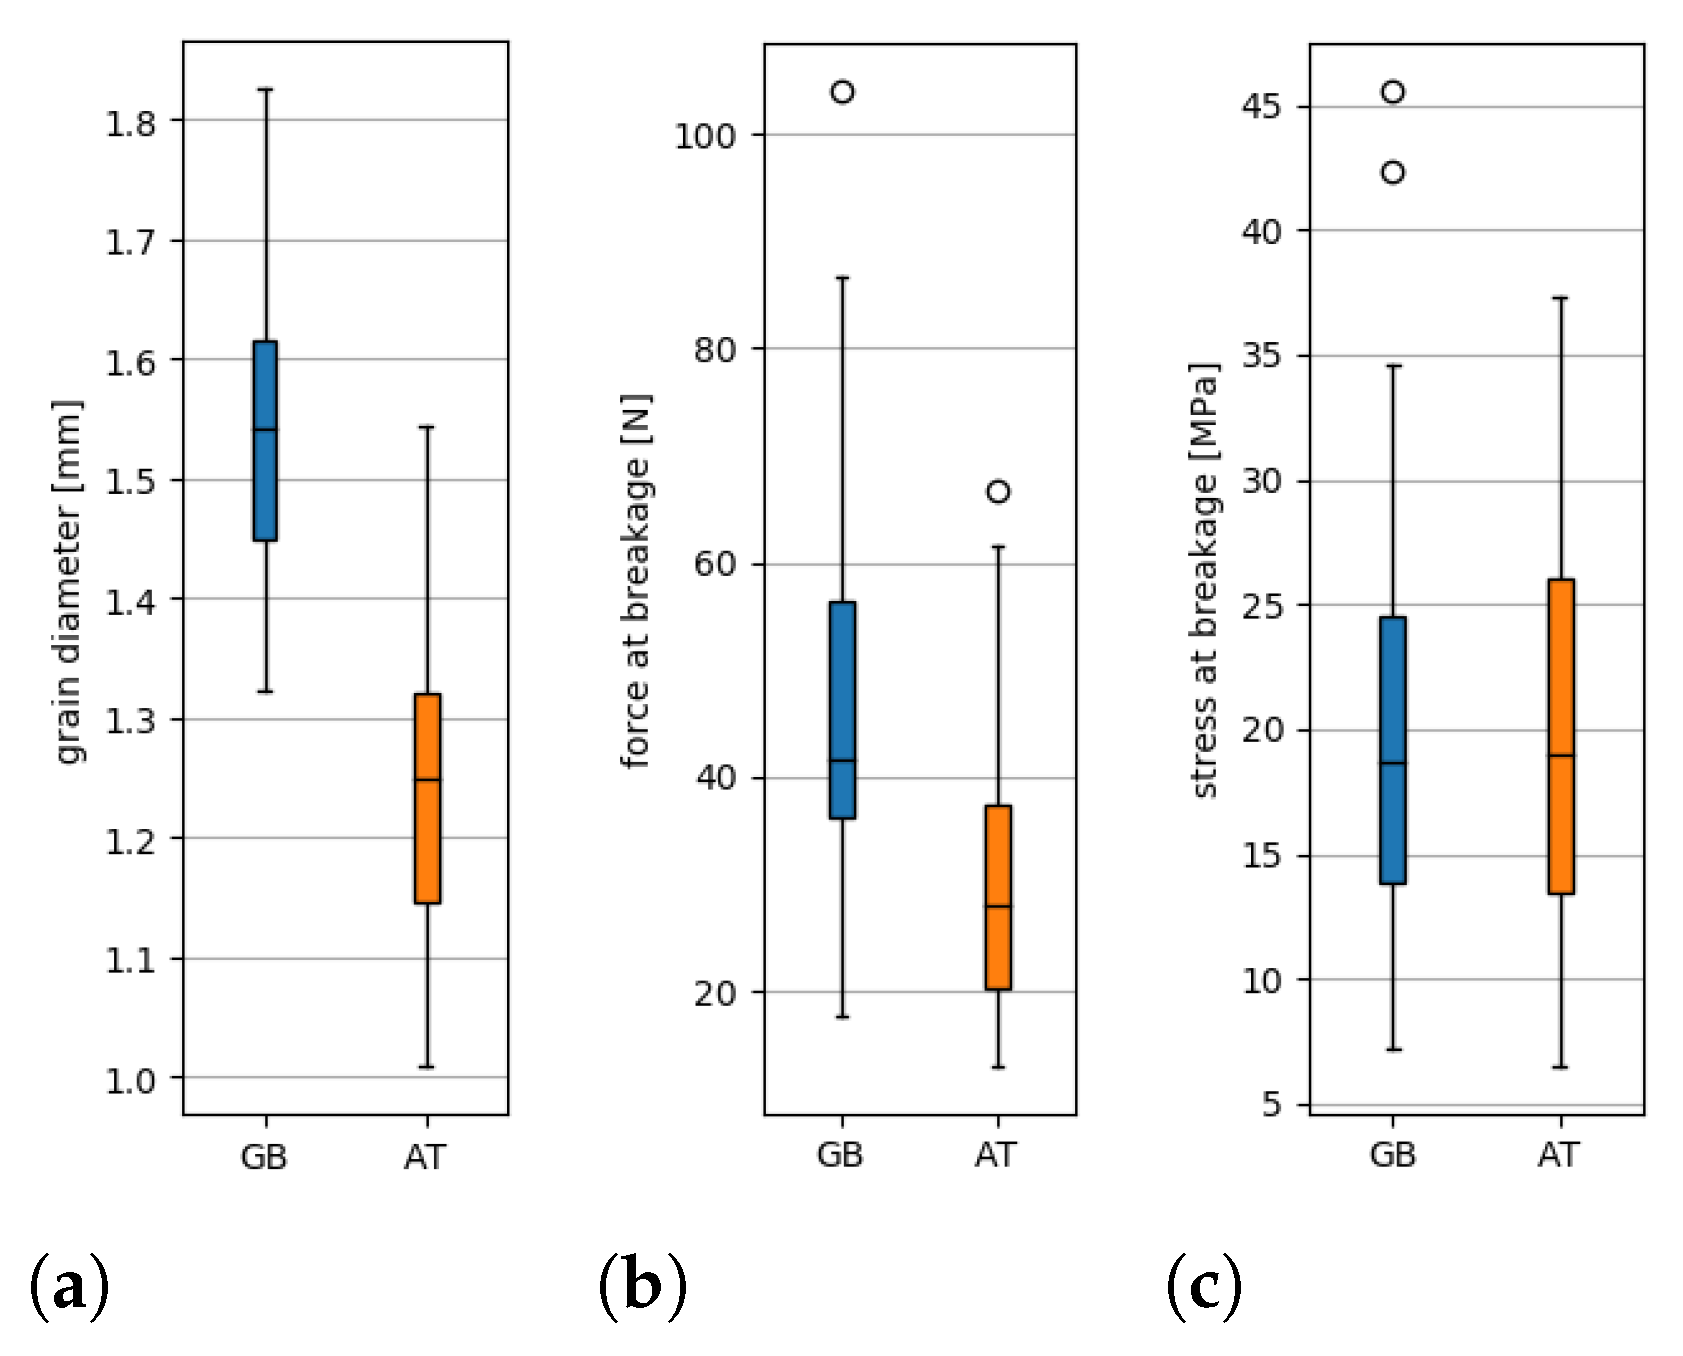
2.2. Results: Analysis of Fragment’s Size and Spread
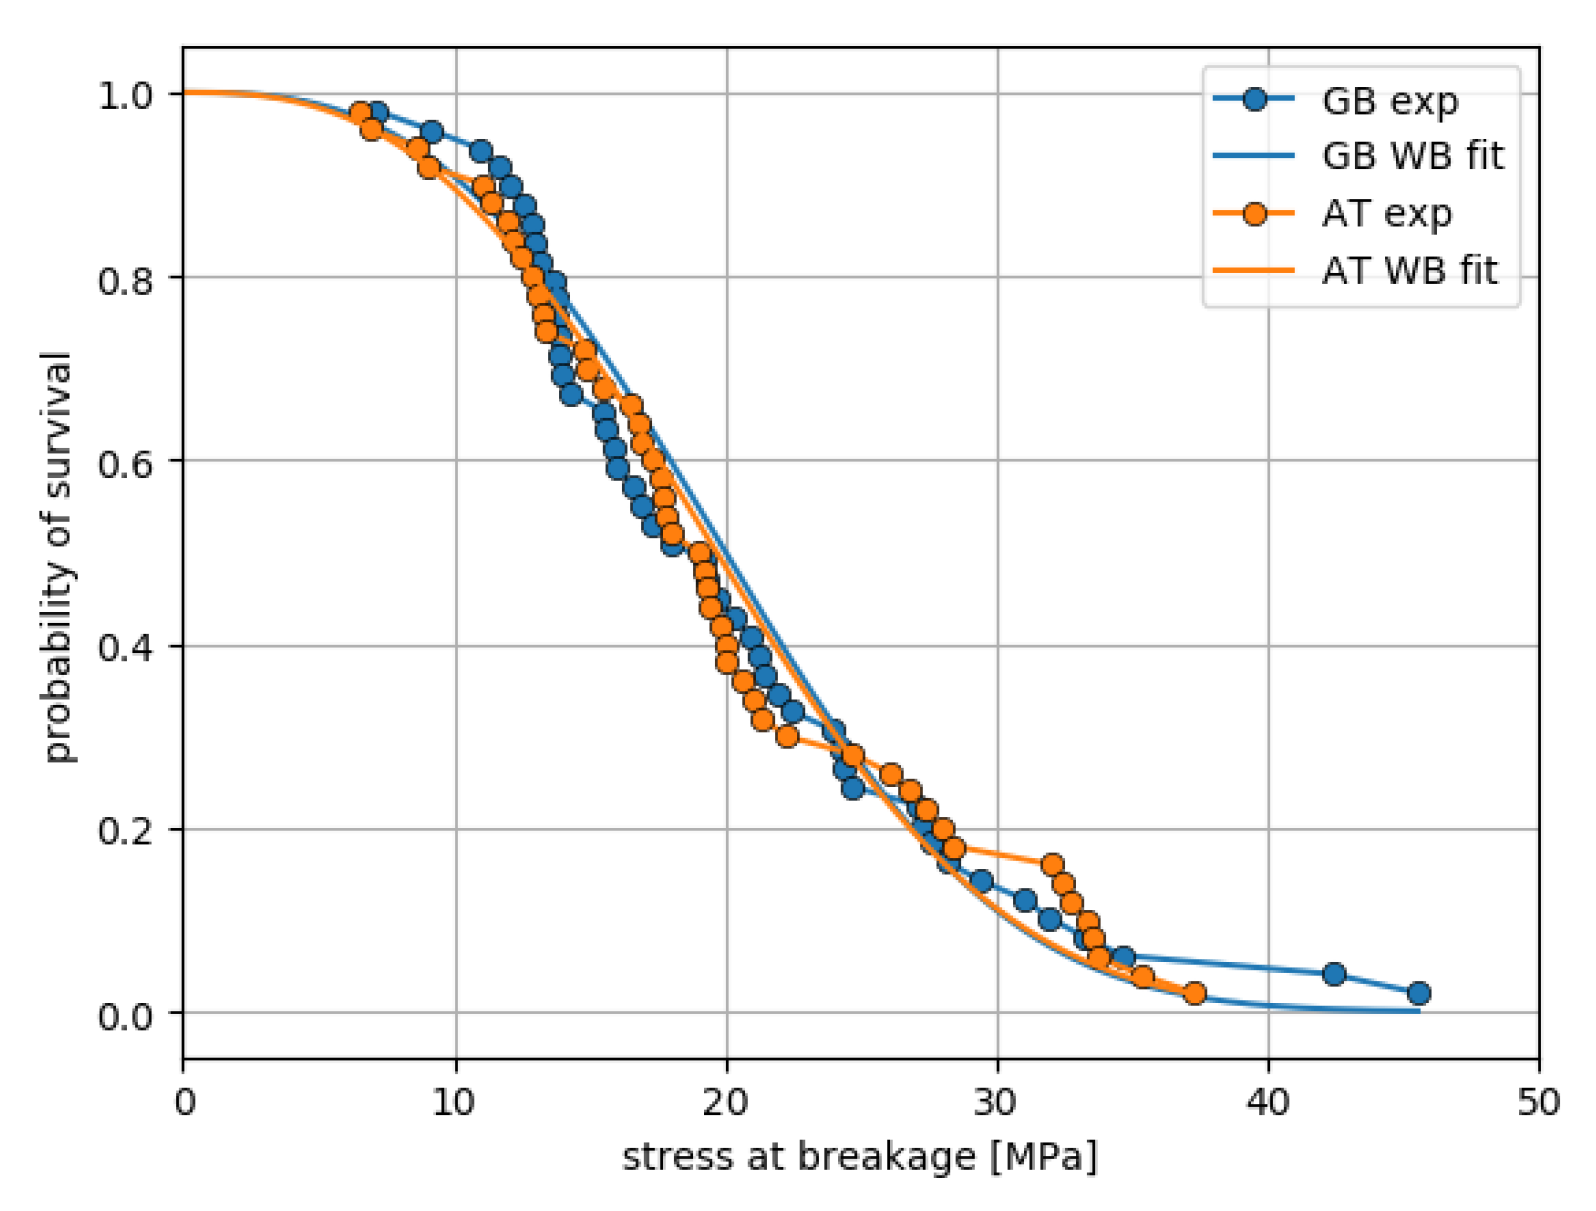
2.3. Results: Fitting of Weibull Statistics
3. Single Grain Crushing: High Loading
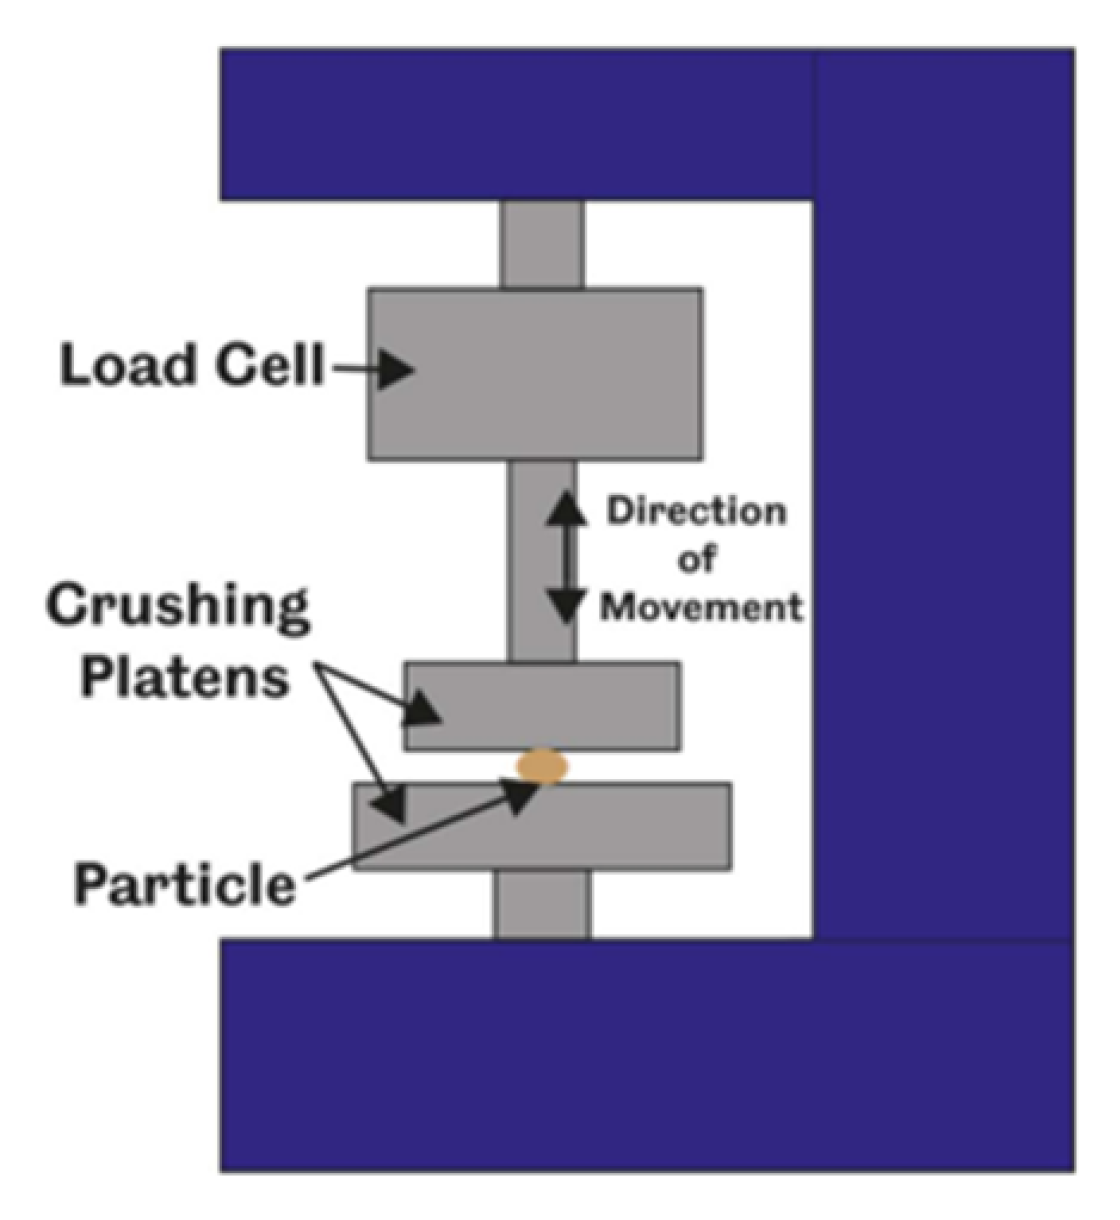
3.1. Materials and Methods
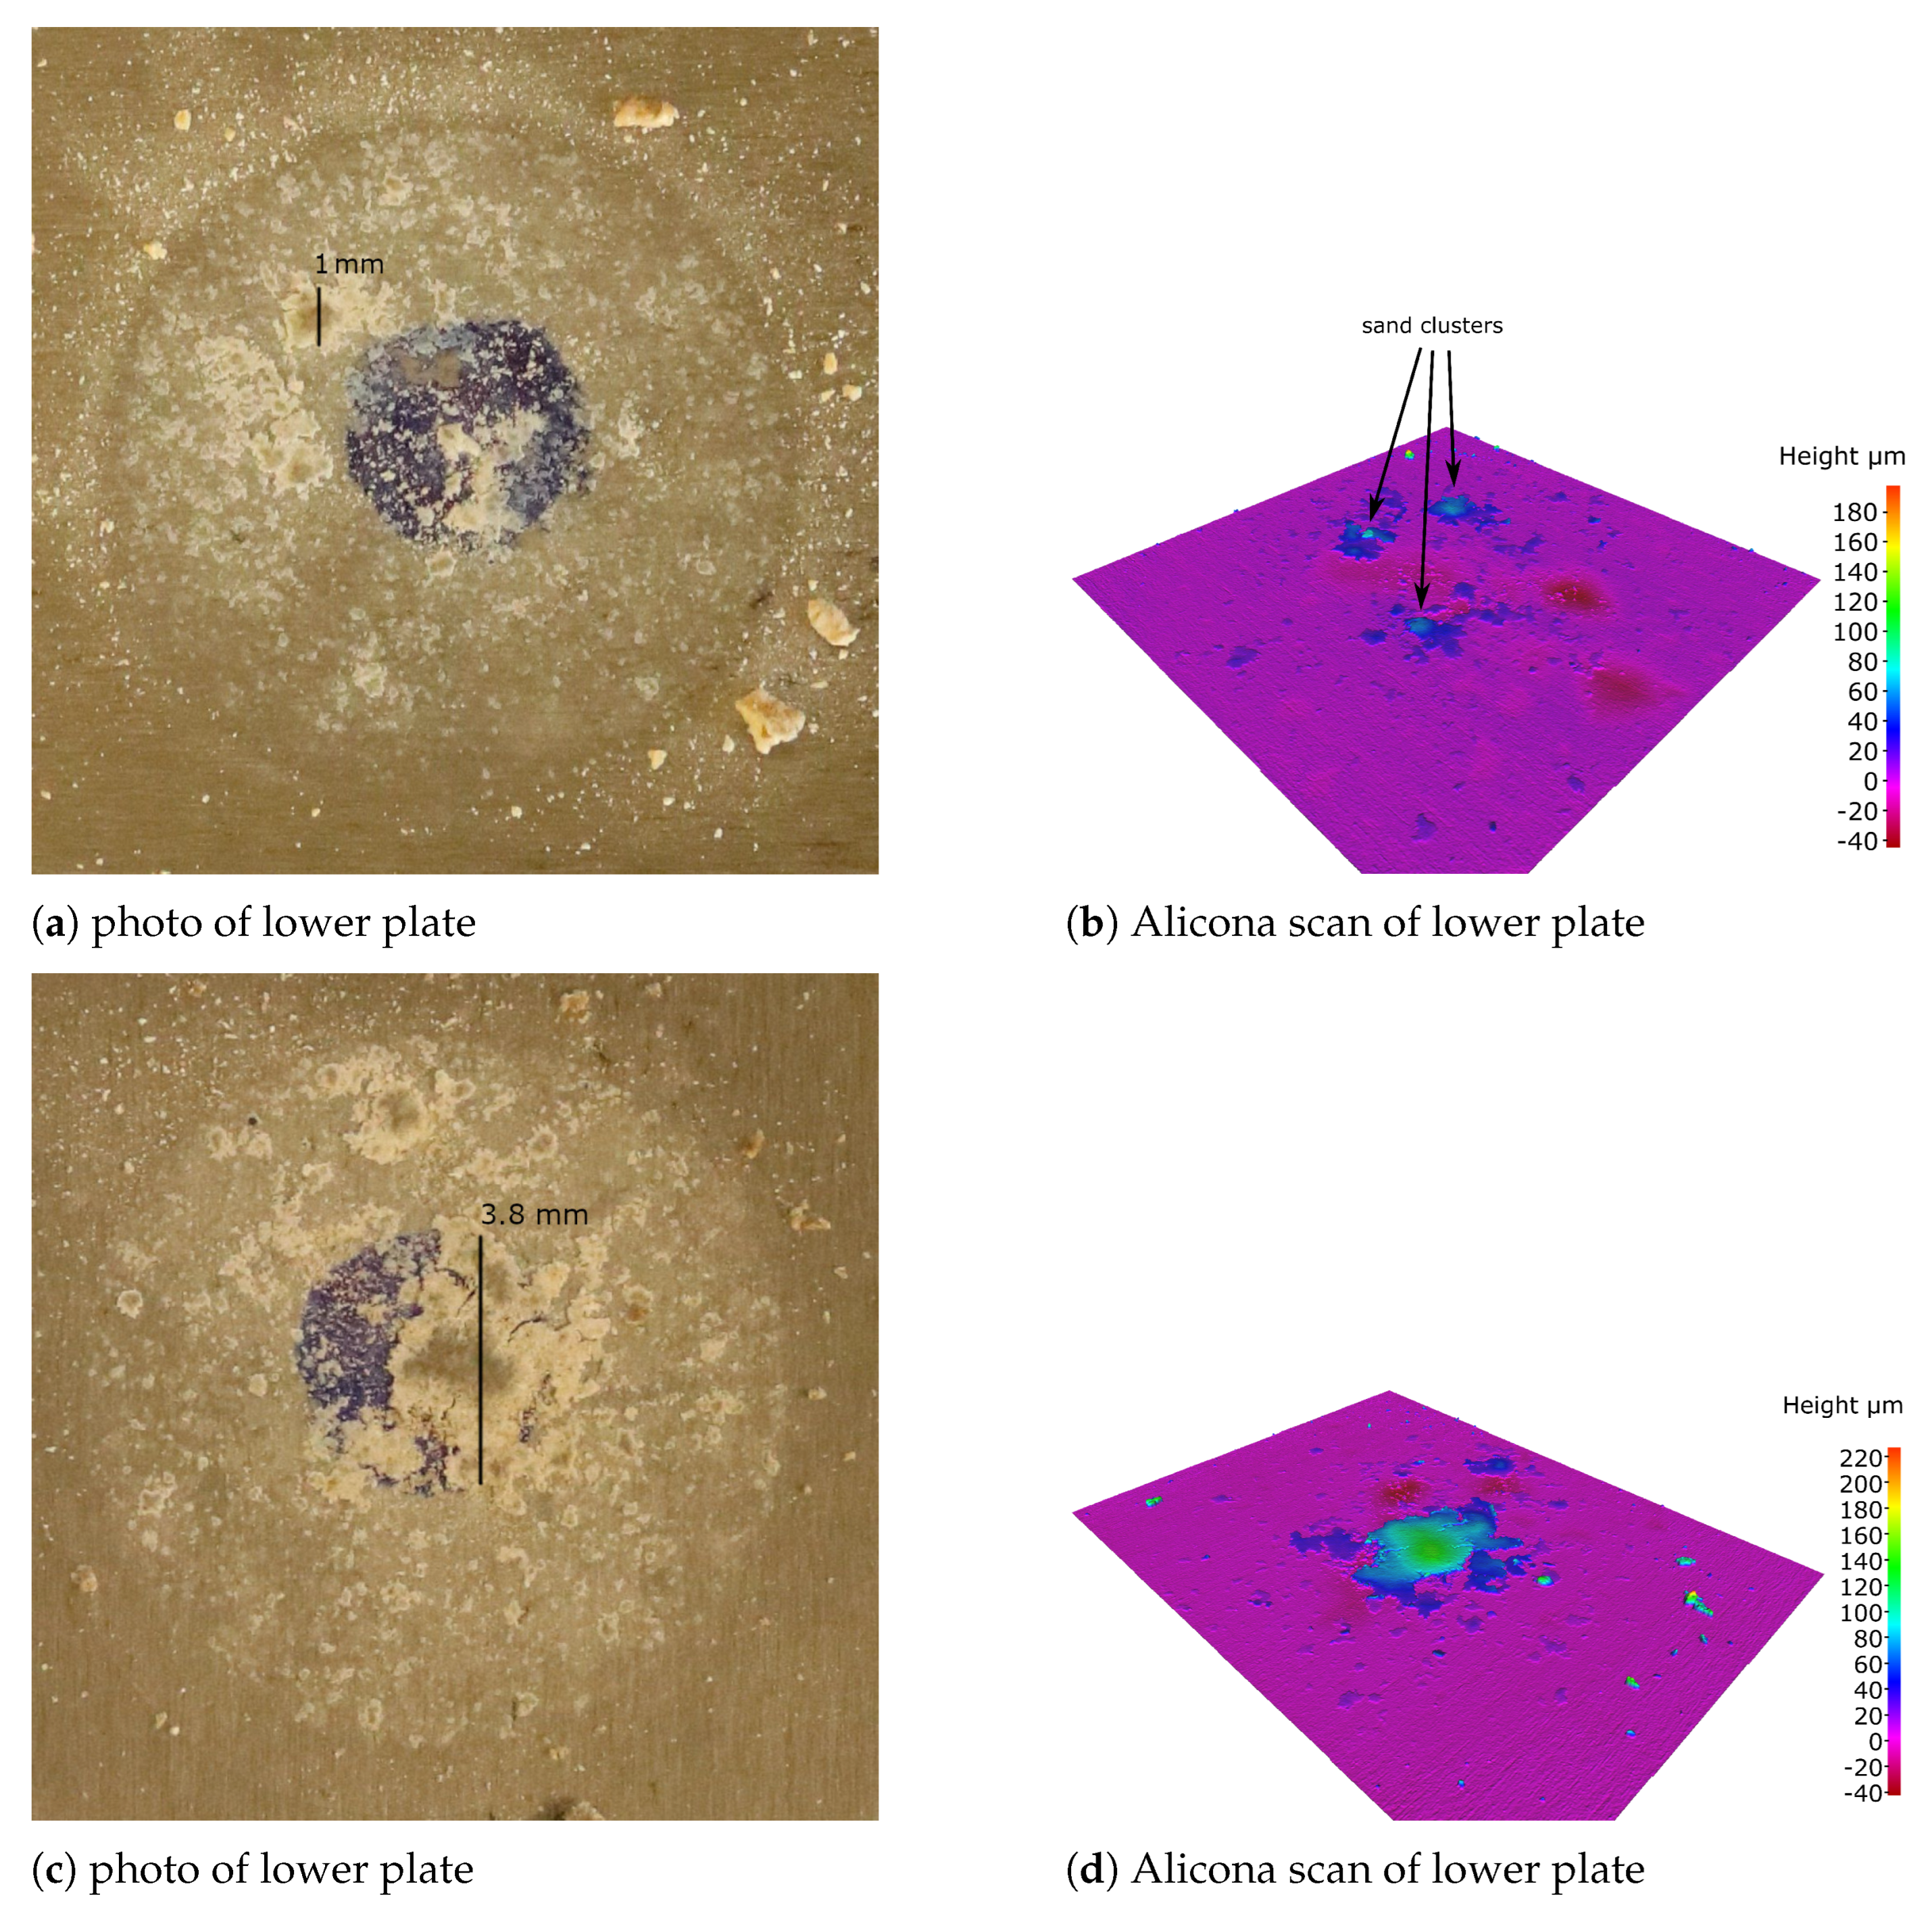
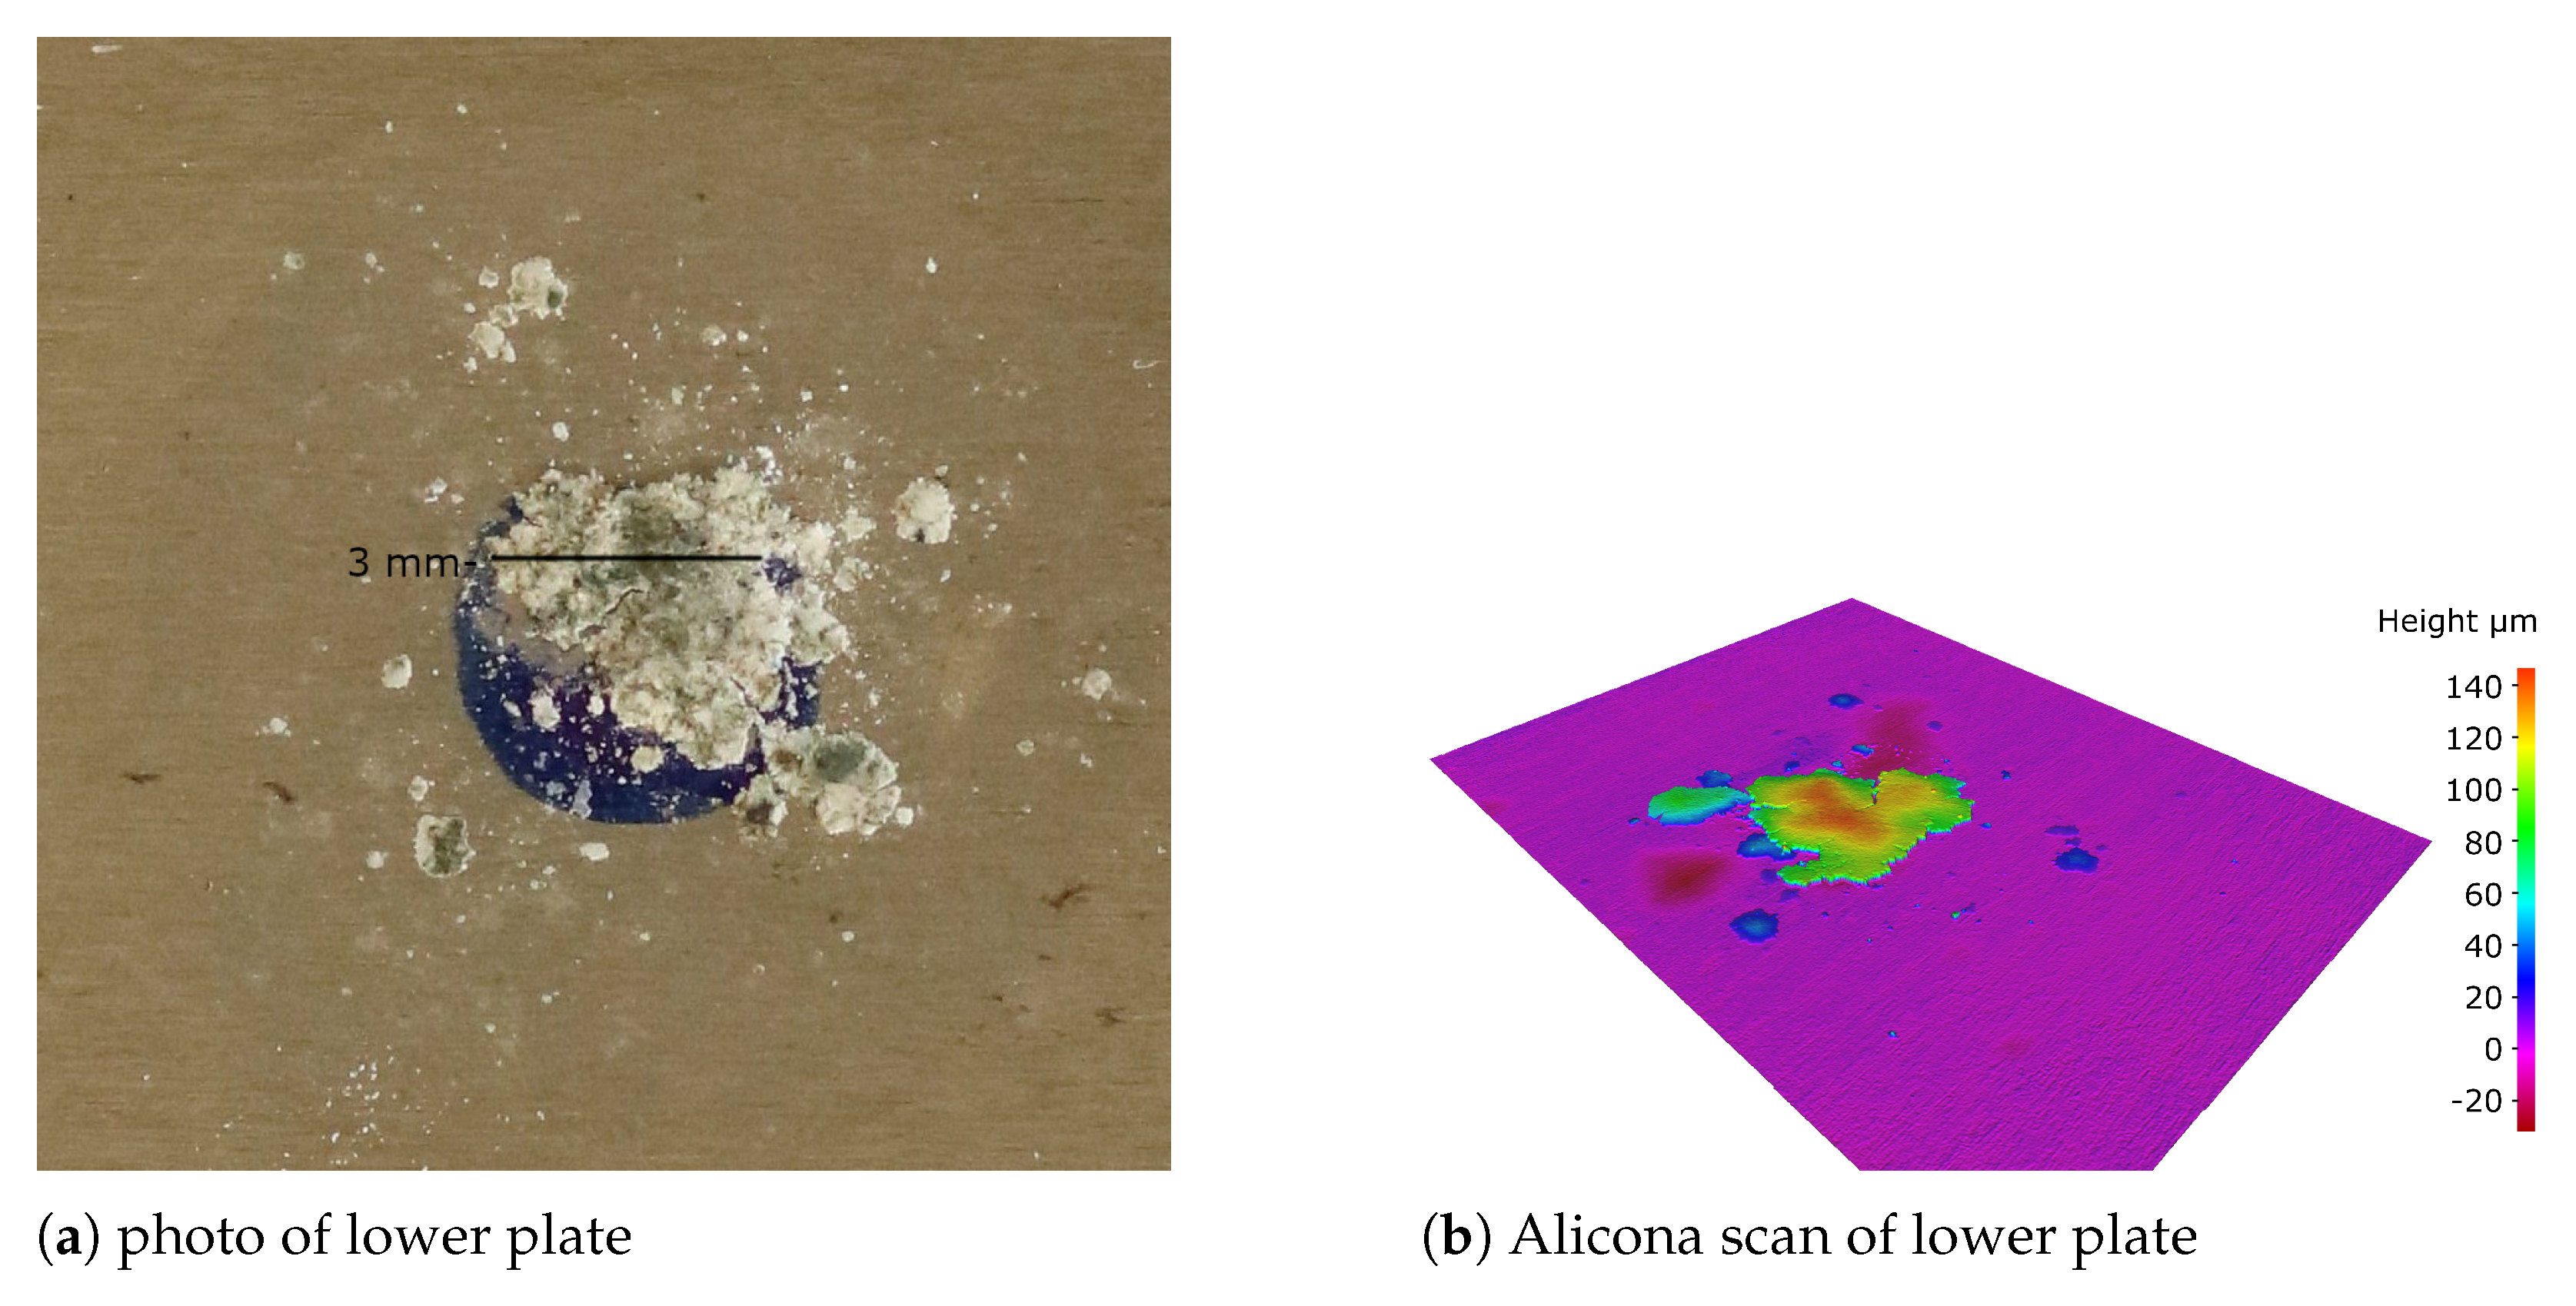
3.2. Results: Fragment Spreading under High Loading
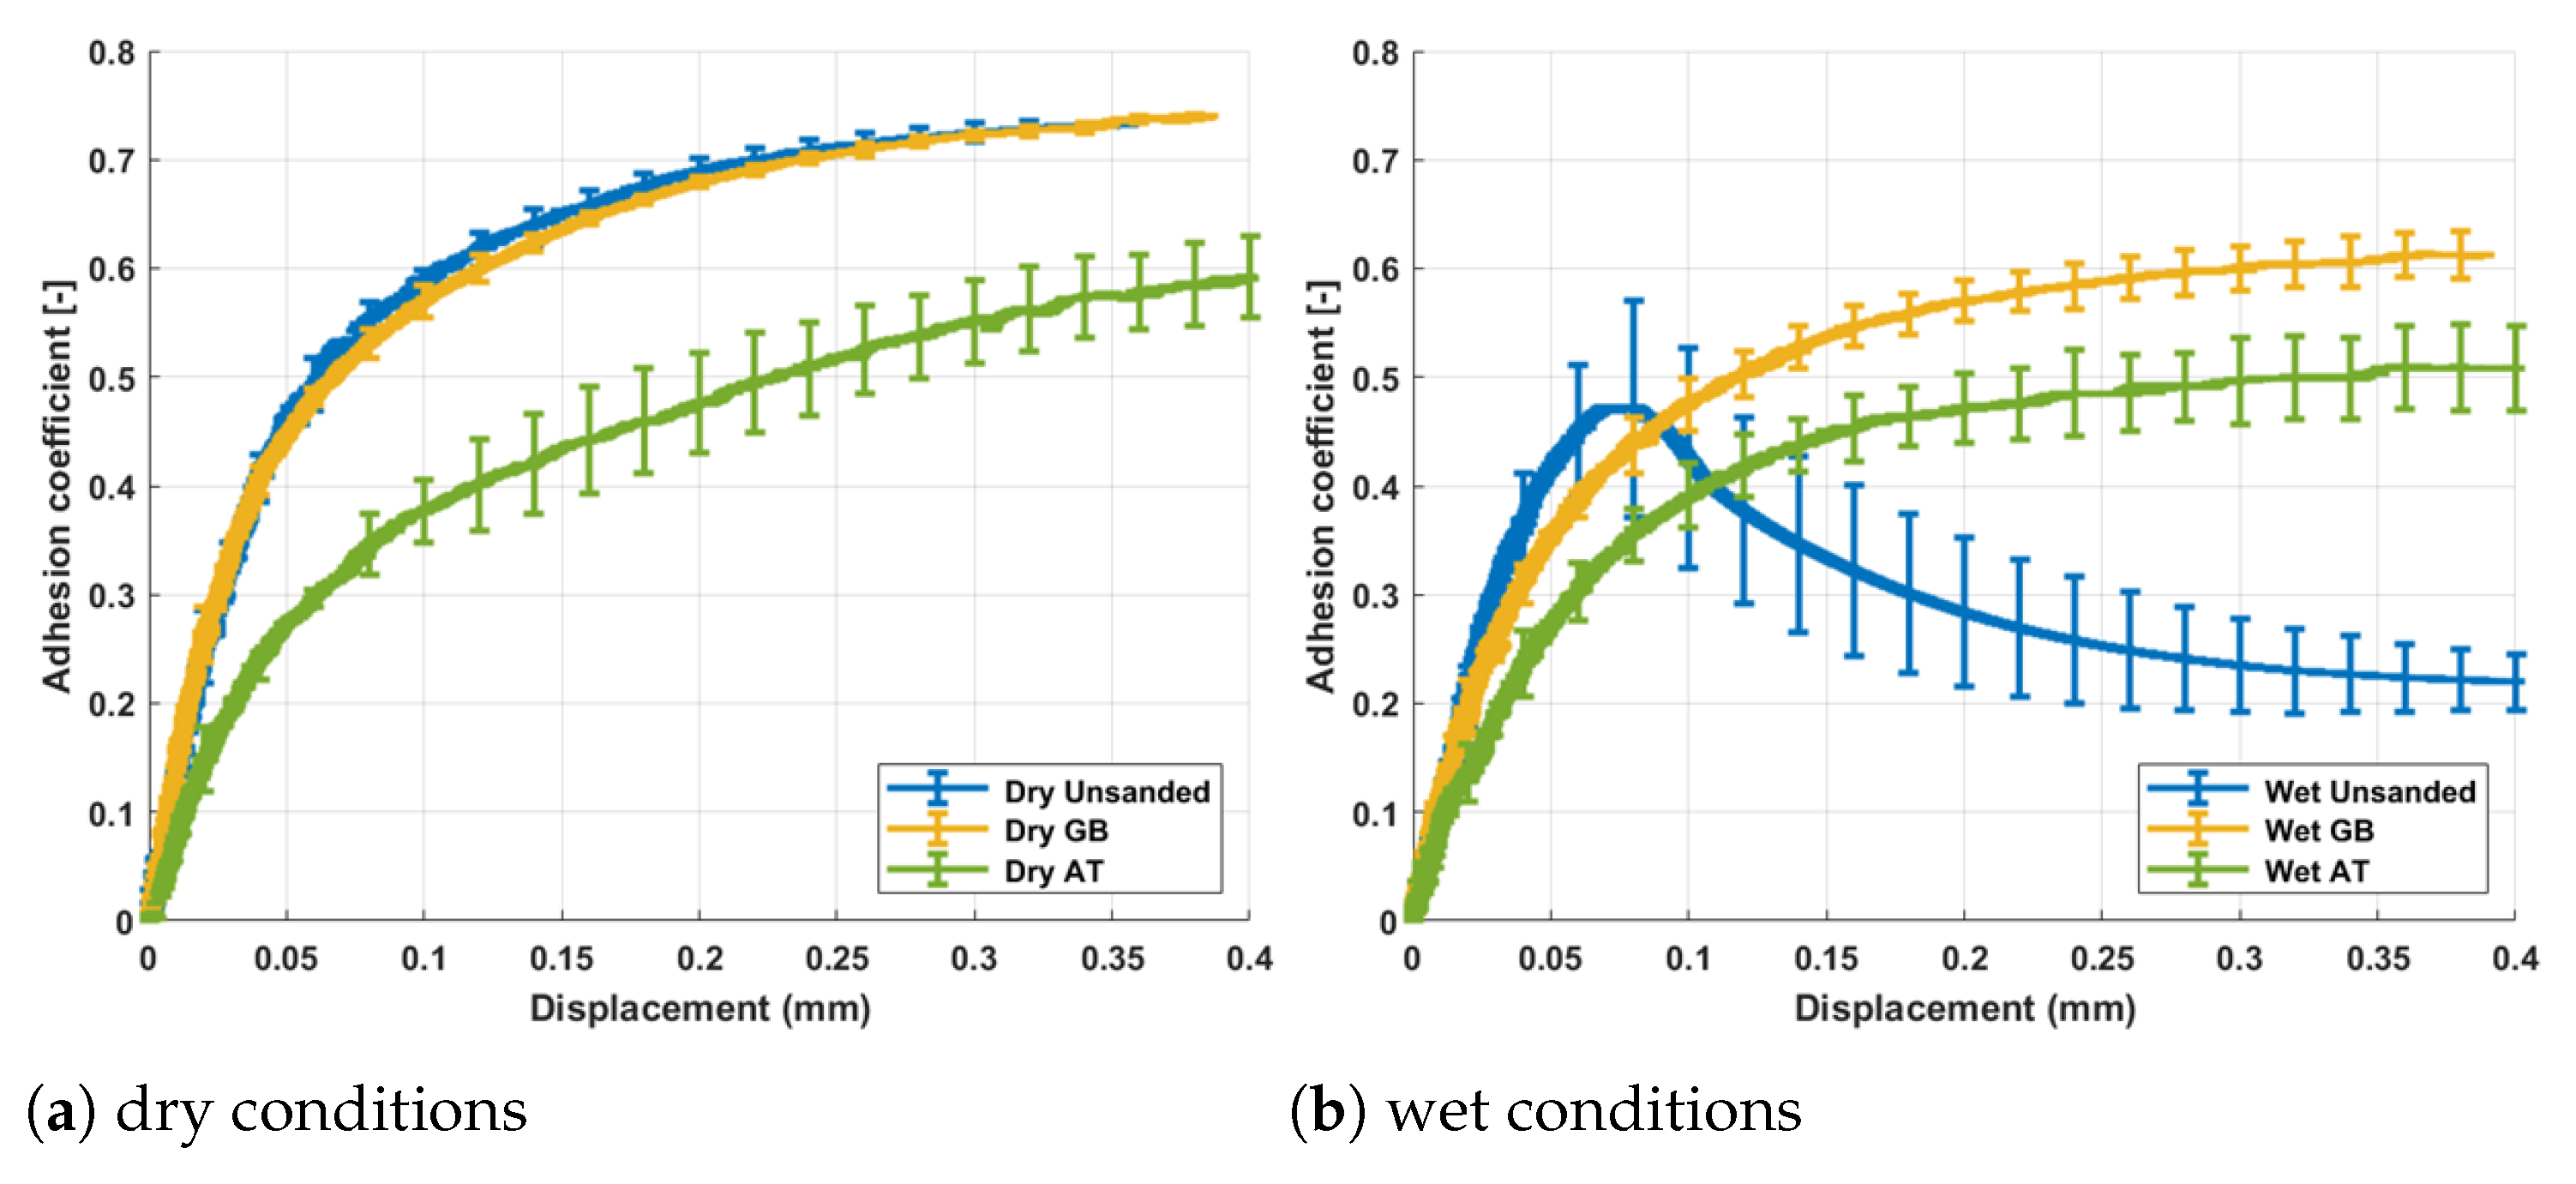
4. Discussion
Author Contributions
Funding
Data Availability Statement
Conflicts of Interest
Abbreviations
| 3BL | third body layer |
| AC | adhesion coefficient |
| HPT | high pressure torsion |
| SEM | Scanning Electron Microscope |
| UMT | universal mechanical tester |
References
- Six, K.; Meierhofer, A.; Trummer, G.; Bernsteiner, C.; Marte, C.; Müller, G.; Luber, B.; Dietmaier, P.; Rosenberger, M. Plasticity in wheel-rail contact and its implications on vehicle-track interaction. Proc. Inst. Mech. Eng. Part F J. Rail Rapid Transit 2017, 231, 558–569. [Google Scholar] [CrossRef]
- Eden, H.C.; Garnham, J.E.; Davis, C.L. Influential microstructural changes on rolling contact fatigue crack initiation in pearlitic rail steels. Mater. Sci. Technol. 2005, 21, 623–629. [Google Scholar] [CrossRef]
- Alwahdi, F.; Kapoor, A.; Franklin, F. Subsurface microstructural analysis and mechanical properties of pearlitic rail steels in service. Wear 2013, 302, 1453–1460. [Google Scholar] [CrossRef]
- Garnham, J.; Davis, C. Very early stage rolling contact fatigue crack growth in pearlitic rail steels. Wear 2011, 271, 100–112. [Google Scholar] [CrossRef]
- Trummer, G.; Marte, C.; Scheriau, S.; Dietmaier, P.; Sommitsch, C.; Six, K. Modeling wear and rolling contact fatigue: Parametric study and experimental results. Wear 2016, 366-367, 71–77. [Google Scholar] [CrossRef]
- Trummer, G.; Six, K.; Marte, C.; Dietmaier, P.; Sommitsch, C. An approximate model to predict near-surface ratcheting of rails under high traction coefficients. Wear 2014, 314, 28–35. [Google Scholar] [CrossRef]
- Trummer, G.; Six, K.; Marte, C.; Meierhofer, A.; Sommitsch, C. Automated measurement of near-surface plastic shear strain. In Proceedings of the 2nd International Conference on Railway Technology: Research, Development and Maintance, Ajaccio, Corsica, France, 8 April–11 April 2014; p. 104. [Google Scholar]
- Polach, O. Creep forces in simulations of traction vehicles running on adhesion limit. Wear 2005, 258, 992–1000. [Google Scholar] [CrossRef]
- Six, K.; Meierhofer, A.; Müller, G.; Dietmaier, P. Physical processes in wheel-rail contact and its implications on vehicle-track interaction. Veh. Syst. Dyn. Int. J. Veh. Mech. Mobil. 2015, 53, 635–650. [Google Scholar] [CrossRef]
- Meierhofer, A.; Hardwick, C.; Lewis, R.; Six, K.; Dietmaier, P. Third body layer–experimental results and a model describing its influence on the traction coefficient. Wear 2014, 314, 148–154. [Google Scholar] [CrossRef]
- Lewis, R.; Dwyer-Joyce, R.; Lewis, S.; Hardwick, C.; Gallardo-Hernandez, E. Tribology of the Wheel-Rail Contact: The Effect of Third Body Materials. Int. J. Railw. Technol. 2012, 1, 167–194. [Google Scholar] [CrossRef]
- Descartes, S.; Desrayaud, C.; Niccolini, E.; Berthier, Y. Presence and role of the third body in a wheel-rail contact. Wear 2005, 258, 1081–1090. [Google Scholar] [CrossRef]
- Niccolini, E.; Berthier, Y. Wheel-rail adhesion: Laboratory study of “natural” third body role on locomotives wheels and rails. Wear 2005, 258, 1172–1178. [Google Scholar] [CrossRef]
- Buckley-Johnstone, L.; Trummer, G.; Voltr, P.; Meierhofer, A.; Six, K.; Fletcher, D.; Lewis, R. Assessing the impact of small amounts of water and iron oxides on adhesion in the wheel/rail interface using High Pressure Torsion testing. Tribol. Int. 2019, 135, 55–64. [Google Scholar] [CrossRef]
- White, B.; Nilsson, R.; Olofsson, U.; Arnall, A.; Evans, M.; Armitage, T.; Fisk, J.; Fletcher, D.; Lewis, R. Effect of the presence of moisture at the wheel-rail interface during dew and damp conditions. Proc. Inst. Mech. Eng. Part F J. Rail Rapid Transit 2018, 232, 979–989. [Google Scholar] [CrossRef]
- White, B.; Lewis, R. Simulation and understanding the wet-rail phenomenon using twin disc testing. Tribol. Int. 2019, 136, 475–486. [Google Scholar] [CrossRef]
- Trummer, G.; Buckley-Johnstone, L.; Voltr, P.; Meierhofer, A.; Lewis, R.; Six, K. Wheel-rail creep force model for predicting water induced low adhesion phenomena. Tribol. Int. 2017, 109, 409–415. [Google Scholar] [CrossRef]
- Lewis, R.; Dwyer-Joyce, R.; Lewis, J. Disc machine study of contact isolation during railway track sanding. Proc. Inst. Mech. Eng. Part F J. Rail Rapid Transit 2003, 217, 11–24. [Google Scholar] [CrossRef]
- Lewis, R.; Dwyer-Joyce, R. Wear at the wheel/rail interface when sanding is used to increase adhesion. Proc. Inst. Mech. Eng. Part F J. Rail Rapid Transit 2006, 220, 29–41. [Google Scholar] [CrossRef]
- Skipper, W.A.; Chalisey, A.; Lewis, R. A review of railway sanding system research: Adhesion restoration and leaf layer removal. Tribol.-Mater. Surf. Interfaces 2018, 12, 237–251. [Google Scholar] [CrossRef]
- Skipper, W.; Chalisey, A.; Lewis, R. A Review of Railway Sanding System Research: Wheel/Rail Isolation, Damage, and Particle Application. Proc. Inst. Mech. Eng. Part F J. Rail Rapid Transit 2019, 234, 567–583. [Google Scholar] [CrossRef]
- Arias-Cuevas, O.; Li, Z.; Lewis, R. Investigating the Lubricity and Electrical Insulation Caused by Sanding in Dry Wheel-Rail Contacts. Tibol. Lett. 2010, 37, 623–635. [Google Scholar] [CrossRef] [Green Version]
- Wang, W.; Zhang, H.; Wang, H.; Liu, Q.; Zhu, M. Study on the adhesion behavior of wheel/rail under oil, water and sanding conditions. Wear 2011, 271, 2693–2698. [Google Scholar] [CrossRef]
- Wang, W.; Liu, T.; Wang, H.; Liu, Q.; Zhu, M.; Jin, X. Influence of friction modifiers on improving adhesion and surface damage of wheel/rail under low adhesion conditions. Tribol. Int. 2014, 75, 16–23. [Google Scholar] [CrossRef]
- Huang, W.; Cao, X.; Wen, Z.; Wang, W.; Liu, Q.; Zhu, M.; Jin, X. A Subscale Experimental Investigation on the Influence of Sanding on Adhesion and Rolling Contact Fatigue of Wheel/Rail Under Water Condition. J. Tribol. 2017, 139, 011401. [Google Scholar] [CrossRef]
- Lewis, S.R.; Riley, S.; Fletcher, D.I.; Lewis, R. Optimisation of a Railway Sanding System, Part 2: Adhesion Tests. In Proceedings of the 10th International Conference on Contact Mechanics (CM2015), Colorado Springs, CO, USA, 30 August–3 September 2015. [Google Scholar]
- Skipper, W.; Nadimi, S.; Chalisey, A.; Lewis, R. Particle characterisation of rail sands for understanding tribological behaviour. Wear 2019, 432–433, 202960. [Google Scholar] [CrossRef]
- Skipper, W. Sand Particle Entrainment and its Effects on the Wheel/Rail Interface. Ph.D. Thesis, University of Sheffield, Sheffield, UK, 2021. [Google Scholar]
- Vollebregt, E.; Six, K.; Polach, O. Challenges and progress in the understanding and modelling of the wheel–rail creep forces. Veh. Syst. Dyn. 2021, 59, 1026–1068. [Google Scholar] [CrossRef]
- Carter, F.W. On the Action of a Locomotive Driving Wheel. Proc. R. Soc. Lond. Ser. A Contain. Pap. Math. Phys. Character 1926, 112, 151–157. [Google Scholar] [CrossRef]
- Fromm, H. Berechnung des Schlupfes beim Rollen deformierbarer Scheiben. Z. Angew. Math. Mech. 1927, 7, 27–58. [Google Scholar] [CrossRef]
- Johnson, K. The effect of a tangential contact force upon the rolling motion of an elastic sphere upon a plane. J. Appl. Mech. 1958, 25, 339–346. [Google Scholar] [CrossRef]
- Johnson, K. The effect of spin upon the rolling motion of an elastic sphere upon a plane. J. Appl. Mech. 1958, 25, 332–338. [Google Scholar] [CrossRef]
- Kalker, J. The computation of three-dimensional rolling contact with dry friction. Int. J. Numer. Methods Eng. 1979, 14, 1293–1307. [Google Scholar] [CrossRef]
- Kalker, J.J. On the Rolling Contact of Two Elastic Bodies in the Prescence of Dry Friction. Ph.D. Thesis, Delft University of Technology, Delft, The Netherlands, 1967. [Google Scholar]
- Kalker, J.J. Simplified Theory of Rolling Contact. Delft Progr. Rep. Ser. C Mech. Aeronaut. Eng. Shipbuild. 1973, 1, 1–10. [Google Scholar]
- Kalker, J.J. A Fast Algorithm for the Simplified Theory of Rolling Contact. Veh. Syst. Dyn. 1982, 11, 1–13. [Google Scholar] [CrossRef]
- Kalker, J.J. Three-Dimensional Elastic Bodies in Rolling Contact; Kluwer Academic Press: Dordrecht, The Netherlands, 1990; ISBN 978-94-015-7889-9. [Google Scholar]
- Knothe, K. History of wheel/rail contact mechanics: From Redtenbacher to Kalker. Veh. Syst. Dyn. 2008, 46, 9–26. [Google Scholar] [CrossRef]
- Poritsky, H. Stresses and deflections of cylindrical bodies in contact with application to contact of gears and of locomotive wheels. J. Appl. Mech.-Trans. ASME 1950, 17, 191–201. [Google Scholar] [CrossRef]
- Meymand, S.Z.; Keylin, A.; Ahmadian, M. A survey of wheel-rail contact models for rail vehicles. Veh. Syst. Dyn. 2016, 54, 386–428. [Google Scholar] [CrossRef]
- Vollebregt, E.A.H.; van der Wekken, C.D. Advanced Modeling of Wheel–Rail Friction Phenomena; Technical Report TR19-11; VORtech: Irwindale, CA, USA, 2019. [Google Scholar]
- Van der Wekken, C.; Vollebregt, E. Local plasticity modelling and its influence on wheel-rail friction. In Proceedings of the 11th International Conference on Contact Mechanics and Wear of Rail/Wheel Systems, Delft, The Netherlands, 24–27 September 2018; pp. 1013–1018. [Google Scholar]
- Allen, T. Particle Size Measurement, 3rd ed.; Chapman & Hall: London, UK, 1981. [Google Scholar]
- BS 1377-2:1990; Methods of Test for Soils for Civil Engineering Purposes: Part 2: Classification Tests. British Standards Institute: London, UK, 1990.
- Schindelin, J.; Arganda-Carreras, I.; Frise, E.; Kaynig, V.; Longair, M.; Pietzsch, T.; Preibisch, S.; Rueden, C.; Saalfeld, S.; Schmid, B.; et al. Fiji: An open-source platform for biological-image analysis. Nat. Methods 2012, 9, 676–682. [Google Scholar] [CrossRef] [Green Version]
- The GIMP Development Team. GIMP Version 2.10.22. Available online: https://www.gimp.org (accessed on 15 December 2022).
- Bernsteiner, C.; Müller, G.; Meierhofer, A.; Six, K.; Künstner, D.; Dietmaier, P. Development of white etching layers on rails: Simulations and experiments. Wear 2016, 366–367, 116–122. [Google Scholar] [CrossRef]
- McDowell, G.R.; Bolton, M.D. On the micromechanics of crushable aggregates. Géotechnique 1998, 48, 667–679. [Google Scholar] [CrossRef] [Green Version]
- Lim, W.; McDowell, G.; Collop, A. The application of Weibull statistics to the strength of railway ballast. Granul. Matter 2004, 6, 229–237. [Google Scholar] [CrossRef]
- Laufer, I. Grain crushing and high-pressure oedometer tests simulated with the discrete element method. Granul. Matter 2015, 17, 389–412. [Google Scholar] [CrossRef]
- Weibull, W. A statistical distribution of wide applicability. J. Appl. Mech. 1951, 18, 293–297. [Google Scholar] [CrossRef]


| Sand Type | (mm) | (MPa) | m (-) |
|---|---|---|---|
| GB | 1.54 | 22.74 | 2.85 |
| AT | 1.25 | 22.49 | 2.72 |
Disclaimer/Publisher’s Note: The statements, opinions and data contained in all publications are solely those of the individual author(s) and contributor(s) and not of MDPI and/or the editor(s). MDPI and/or the editor(s) disclaim responsibility for any injury to people or property resulting from any ideas, methods, instructions or products referred to in the content. |
© 2023 by the authors. Licensee MDPI, Basel, Switzerland. This article is an open access article distributed under the terms and conditions of the Creative Commons Attribution (CC BY) license (https://creativecommons.org/licenses/by/4.0/).
Share and Cite
Suhr, B.; Skipper, W.A.; Lewis, R.; Six, K. Sanded Wheel–Rail Contacts: Experiments on Sand Crushing Behaviour. Lubricants 2023, 11, 38. https://doi.org/10.3390/lubricants11020038
Suhr B, Skipper WA, Lewis R, Six K. Sanded Wheel–Rail Contacts: Experiments on Sand Crushing Behaviour. Lubricants. 2023; 11(2):38. https://doi.org/10.3390/lubricants11020038
Chicago/Turabian StyleSuhr, Bettina, William A. Skipper, Roger Lewis, and Klaus Six. 2023. "Sanded Wheel–Rail Contacts: Experiments on Sand Crushing Behaviour" Lubricants 11, no. 2: 38. https://doi.org/10.3390/lubricants11020038