Article

Dry Sliding Wear Features of an Al-20Sn-5Zn Alloy Affected by Microstructural Length Scales

1
Department of Manufacturing and Materials Engineering, University of Campinas–UNICAMP, Campinas 13083-860, Brazil
2
Department of Production Engineering, Federal University of Ouro Preto–UFOP, João Monlevade 35931-008, Brazil
3
Institute of Technology, Federal University of Pará–UFPA, Augusto Correa Avenue 1, Belém 66075-110, Brazil
4
Department of Materials Engineering, University of São Paulo–USP, São Carlos 13563-120, Brazil
*
Author to whom correspondence should be addressed.
Lubricants 2022, 10(12), 352; https://doi.org/10.3390/lubricants10120352
Submission received: 28 October 2022 / Revised: 22 November 2022 / Accepted: 2 December 2022 / Published: 5 December 2022
(This article belongs to the Special Issue Tribological Characteristics of Bearing System)

Abstract

:
Al-Sn-Zn alloys are attractive options for use as wear-resistant materials. While Sn promotes self-lubricating characteristics, Zn strengthens the Al-rich matrix. Conventionally, the manufacturing of these alloys involves casting. However, there is still a paucity of studies that associate the solidification microstructure with the wear resistance of these alloys. Inspired by such considerations, this work aims at investigating the wear behavior of an Al-20Sn-5Zn [wt.%] alloy produced by a directional solidification technique. A set of samples with different microstructure length scales was subjected to ball cratering tests using a normal contact load of 0.25 N and six test times. The results show that the dependence of the wear behavior on the microstructure length scale becomes more expressive for longer sliding distances. It was found that coarser microstructures provide an improved wear resistance. In view of that, a possible spectrum of specific wear rates was determined as a function of the sliding distance, considering different microstructure length scales. Finally, experimental equations are proposed to represent a possible range of wear volume and wear coefficient according to the dendrite arm spacings.

Graphical Abstract

1. Introduction

Al-based alloys have a wide range of applications. Particularly, Al-Sn alloys are an attractive option for use as self-lubricant bearing materials due to their low density, non-toxicity, and suitable wear behavior [1]. In doing so, the manufactured components are commonly subjected to mechanical interactions with another sliding surface under load. Under such service conditions, Sn particles start acting naturally as solid lubricants, thus providing the benefit of reducing the wear loss and friction coefficient [2,3]. Depending on their Sn content, commercial Al-Sn alloys can be classified into three main groups: low—(5–10%), medium—(10–15%) and high-Sn (15–40%) [4]. Unfortunately, the mechanical strength and load-carrying capacity of Al-Sn alloys decreases substantially with increasing Sn content, which may limit their use. Therefore, the search for technologies to handle this issue is an important step forward the development of innovative wear-resistant alloys.
Since a common route to manufacture Al-Sn-based alloys is casting, knowing how to manipulate their solidification microstructure can be convenient to achieve superior final properties. This is especially true when it comes to wear resistance. Overall, more intense cooling conditions during solidification generate finer microstructures. Cruz et al. [5] reported that the wear performance of directionally solidified Al-Sn (15 and 20 wt.%) alloys tended to improve with the increase of the primary dendritic arm spacing. They also observed that coarser microstructures seemed to magnify the lubricating effect of the Sn-rich particles. On the other hand, Li et al. [4], analyzing an Al-Sn alloy processed through electromagnetic stirring frequency, concluded that a better distribution of Sn particles was more beneficial to the wear resistance. Therefore, the role of the microstructure length scale seems to be a controversial topic.
Despite being an excellent strategy to achieve a desirable combination of mechanical and wear features, the addition of third alloying elements to Al-Sn alloys can turn the role of microstructure even more complex [6]. Prime alloying elements chosen for such a purpose are Si, Cu, and Mg. Bertelli et al. [7] conducted pin-on-disc tests on Al-Sn-Cu alloys and observed that the worn surface is characterized by shifts from abrasive to adhesive wear. In addition, they noticed that only adhesive wear predominated in Al-Sn-Si alloys. Lu et al. [8] noticed that a proper Mg addition to Al-Sn alloys can contribute to a distribution of Sn particles and enhance mechanical and wear properties. Based on ball-cratering tests, Costa et al. [9] observed abrasive, adhesive and oxidative wear in Al-Sn-Bi alloys, with a more homogeneous distribution of Bi/Sn particles being decisive to enhance the wear behavior.
From a tribological perspective, the addition of Zn can have positive impacts. Abu-Zeid [10], for example, observed favorable frictional behavior for an Al-Zn-Sn alloy coating. The concept to take advantage of Sn as self-lubricating and Zn as a strengthener of the Al-rich matrix is indeed attractive. It is worth noting that as-solidified Al-Sn-Zn alloys are typically composed of an Al-rich matrix surrounded with Sn-rich particles, with Zn present in both Al-rich matrix and Sn-rich regions [11,12]. Although some works confirmed that alloys composed of Al, Sn, and Zn are possible candidates for use as coatings [13] and bio-degradable materials [14], there are still microstructural and wear factors that need further understanding.
Inspired by the above considerations, this study aims at investigating the influence of the microstructure length scale on the wear behavior of an Al-20Sn-5Zn [wt.%] alloy. To be more precise, the justification to study such an alloy is based on two main reasons. First, the wear behavior of the Al-20Sn alloy was previously studied by Cruz et al. [5], which may allow for a comparative analysis concerning the addition of Zn. Secondly, the alloy Zn content is intentionally chosen as 5 wt.% because such a concentration is found in Al-based alloys characterized in previous wear studies [15,16]. Figure 1 shows the Al-5Zn-Sn [wt.%] pseudo-binary phase diagram. It is worth noting that non-equilibrium conditions can promote the suppression of Zn diffusion, thus leading to a supersaturated α-Al matrix. This was observed for Al-7Si- (10, 15, 20) Zn [wt.%] alloys by Kakitani et al. [17].
To achieve the goal of this work, samples with different thermal histories during solidification will be produced using a directional solidification technique. Then, samples with quite distinct parametric microstructural features will be subjected to ball-cratering tests. Hardness tests will be conducted as well. Such a methodology is planned to allow for the analysis of processing–microstructure–wear relationships. In summary, the main contributions of the present work are as follows:
  • Experimental determination of mathematical relations permitting to describe the coarsening of dendritic arms of an Al-20Sn-5Zn [wt.%] alloy during transient solidification;
  • A better understanding of the wear features of the Al-20Sn-5Zn [wt.%] alloy, with a focus on the microstructure length scale;
  • Proposal of Multiple Linear Regression (MLR) fits for the prediction of the wear features from microstructural parameters.

2. Materials and Methods

2.1. Solidification Experiments

In order to produce Al-20Sn-5Zn [wt.%] alloy samples with different microstructure length scales, a directional solidification experiment was conducted. Chemical compositions of the commercial-purity metals used in the alloy preparation are listed in Table 1. First, 800 g of Al were melted in a SiC crucible using a muffle furnace (Brasimet, Jundiaí, Brazil). After the complete melting of Al, the required amounts of Sn and Zn were added to the molten bath. Mechanical homogenization was then conducted using an alumina-coated stick. The next step was pouring the molten alloy into a stainless-steel mold placed inside the casting chamber of a directional solidification apparatus. Such experimental apparatus was designed in such a way that heat exchange occurred only through the water-cooled bottom thus promoting vertically upward growth, as stated in previous articles [17,18]. Figure 2 provides a general overview of the sequential experimental steps.
A split cylindrical mold of 60 mm diameter and 150 mm height made of AISI 1020 stainless-steel was used in the directional solidification experiments. To prevent radial heat losses and to make demolding easier, all the lateral inner sides of the mold were coated with alumina. The only inner surface that was uncoated was the mold bottom part (3 mm-thick). At this location, the contact condition between the molten alloy and the mold was standardized with the heat-extracting surface having a 1200 grit sandpaper finishing.
Eight K-type thermocouples were connected to a Lynx data acquisition system (Lynx, São Paulo, Brazil) and inserted in strategic positions along the length of the directionally solidified (DS) casting. This allowed for the real-time monitoring of thermal history at different heights from the chill. As soon as the thermocouple closest to the bottom of the mold measured a temperature of 656 °C, which corresponds to approximately 5% above the liquidus temperature (625 °C), the electrical heaters were turned off and then the water-cooling system was activated. The temperature–time data recorded at a 5 Hz frequency allowed for the determination of the cooling and growth rates at the liquidus temperature. This was done through well-known experimental techniques [18].

2.2. Metallographic Examination and Chemical Analysis

Using an S1101 Starrett band saw (Starrett Indústria e Comércio Ltd.a, Itu, São Paulo, Brazil), the DS casting was sectioned along its vertical axis. After that, one of the half-cylindrical parts was prepared for the characterization of the solidification macrostructure. First, metallographic grinding was conducted with 100- to 1200-grit soft SiC papers. Then, chemical etching was performed using a solution of Kroll’s reagent (2 mL of HF, 10 mL of HNO3, and 88 mL of H2O). For microstructure analysis, selected cross and longitudinal sections at 10 different relative positions along the length of the DS casting were collected. These Al-20Sn-5Zn [wt.%] alloy samples were extracted from 10 different locations of the DS casting. Each corresponded to a distance from the metal/mold interface, namely: 5, 10, 15, 20, 25, 30, 40, 50, 60, and 70 mm. Their respective thermal histories could be determined from the time–temperature data collected during the directional solidification experiment. Such a procedure for sample removal allowed for the identification of various microstructure length scales and, consequently, an appropriate interpretation of the microstructure evolution considering different cooling regimes. Such samples were properly ground and polished until they had a 0.25-μm diamond paste finishing. No chemical etching was needed to reveal the microstructure.
The image processing system Olympus GX41 and the ImageJ software version 1.53k were used to measure both the primary (λ1) and secondary (λ2) dendritic arm spacings (approximately 40 independent readings for each selected position, with the average taken to be the local spacing) and their distribution range. The linear intercept method was used for measuring λ1 and λ2 on transverse and longitudinal sections, respectively. Additionally, scanning electronic microscopy (SEM TESCAN, VEGA LMU (Tescan, Brno, Czech Republic)) coupled with energy dispersive X-ray spectroscopy (EDS X-MAX 20, Oxford, UK) were used. X-ray diffraction was carried out using Panalytical X′Pert PRO MRD XL equipment (Malvern Panalytical, Cambridge, UK). Inductively coupled plasma optical emission spectrometry (Agilent 5100) was employed to trace the solutes profiles along the length of the casting.

2.3. Wear and Hardness Tests

To evaluate wear characteristics of the DS samples, ball cratering tests were conducted using a calotest type with fixed ball machine (Own manufactured equipment, Belém, Pará, Brazil). In addition, dry sliding friction conditions (in the air and without lubrication) were employed. To prevent external influence of any kind of interfacial elements other than the microstructure, no lubricant or abrasive particulate were added. The procedure was the same as that described in previous articles [5,9,19,20]. AISI 52100 steel balls (Cr: 1.45; C: 1; Mn: 0.35; Si: 0.25 Si; Fe: balance [wt.%]) with 25.4 mm in diameter and hardness of 60 HRC were used. Additionally, the ball sliding speed (W) was 370 RPM, and the applied normal contact load was 0.2 N. Six different times were considered for the wear tests: 7, 14, 21, 28, 56 and 112 min, which were equivalent to the sliding distances of 207, 415, 622, 829, 1658 and 3316 m, respectively. For reproducibly purposes, all tests were performed in triplicate.
Five transverse samples with dimensions of 0.015 × 0.015 × 0.005 m were tested. They corresponded to the positions 5, 10, 15, 25 (the region of the casting characterized by a more intense solidification kinetics) and 40 mm (the position at which solidification kinetics achieved a quasi-stationary regime) with respect to the cooled bottom of the casting. With such a procedure, it was possible to get a better understanding of the effects of the microstructure length scale on the dry sliding wear characteristics of the studied alloy. Each test produced a cap-shaped impression on the samples’ surfaces. Based on the arithmetic mean of eight diameters measured on each cap, the wear volumes (Wv) and specific wear rates (Wr) were calculated as follows:
W v = π · d 4 64 · R
W r = W v S N
where d: average diameter of the worm crater, R: radius of the sphere; S: sliding distance; and N: normal contact load.
Vickers hardness tests were performed using a Shimadzu HMV-2 model hardness measuring tester (Shimadzu, Kyoto, Japan) employing a test load of 0.5 kgf and a dwell time of 15 s, according to the ASTM E384 standard. The adopted hardness value of a representative position was the average of at least 30 measurements on each sample. For measurements of hardness below the worn surface, the load was changed to 0.01 kgf.

3. Results and Discussion

3.1. Solidification Experiments

Figure 3a displays the cooling curves collected at eight relative positions along the length of the Al-20Sn-5Zn [wt.%] alloy casting during solidification. Overall, temperature drops are more intense at regions closer to the cooled bottom of the casting. As the distance from the chill increases, such drops become attenuate. Such behavior can be explained by interpreting Figure 3b, where both the velocity of the solidification front (VL) and the cooling rate (TR) at the liquidus temperature are plotted versus the relative position in the DS casting. Higher VL and TR values are associated with regions near the chill (bottom of the DS casting), which is to be expected. At these locations, the heat exchange is facilitated due to the good surface conformity between the solidified shell and the mold surface during the initial stages of solidification. However, with the advance of solidification, VL and TR progressively decrease. Two reasons for that are: (i) the increase in the thermal resistance related to the increasing solidified shell and (ii) the development of air gaps at the metal/mold interface. Figure 3b also shows that Sn and Zn solute concentrations were kept essentially close to the designated along the entire length of the DS casting, thus indicating absence of macrosegregation. This allowed for the investigation of the microstructure and wear behavior of the studied alloy without the interference of composition variation in the examined DS samples.

3.2. Microstructure Features and Their Relationship with Solidification Thermal Parameters

Figure 4a shows that the as-solidified macrostructure of the Al-20Sn-5Sn [wt.%] alloy casting was characterized by the coexistence of columnar and equiaxed grains. Such a type of macro-morphological structure is named mixed zone. As stated by Jung et al. [21], in mixed zones, the columnar-to-equiaxed transition is not achieved. According to them, a possible reason for this is that equiaxed grains are neither solutally nor mechanically sufficient to block the growth of columnar dendrites. Thus, the columnar front grows continuously. At the same time, some equiaxed grains are trapped in the channels between the columnar dendrites and others are prone to sedimentation. This induces a competition between equiaxed nucleation and columnar growth, with the formation of new equiaxed grains in the channels of columnar dendrites. Optical micrographs, shown in Figure 4b, represent the typical cross and longitudinal views (perpendicular and parallel to the growth direction, respectively) along the entire length of the DS casting. The dendritic morphology of the Al-rich matrix resembled that previously reported for Al-Sn-(Si; Cu) alloys by Bertelli et al. [22].
SEM images with EDS analysis, shown in Figure 5, demonstrate that the Al-rich matrix is surrounded by Sn-rich particles and that Zn can be found in both the Al-rich matrix (in solid solution) and in the Sn-rich phase (as Zn particles). A possible reason for the peak of the Zn-rich phase to be less intense could be associated with the doubt whether Zn particles effectively occur in such a small fraction. It must be stressed that Zn is also contained in the Al-rich solid solution. In fact, it is likely that non-equilibrium conditions promoted the suppression of Zn diffusion in solid state, leading to a supersaturated α-Al matrix. At room temperature, the solubility of Zn in Al is below 0.1 wt.%, which is substantially lower than the verified values (~4 wt.%). It is not surprising that Sn-rich particles are all found in interdendritic areas, given that the solubility of Sn in Al is approximately 0.01 wt.% at room temperature, which is extremely low. This agrees with the XRD patterns given in Figure 6, where reflections of α-Al, Sn and β-Zn phases can be clearly identified.
XRD and SEM with EDS mapping reveal only single elements, as expected. In fact, Zn is dissolved in the primary Al-rich phase, but not entirely. Regarding Sn, it is completely found in interdendritic areas. Both observations agree with the Thermo-Calc property diagram shown in Figure 7a, where the mass fraction of all phases is plotted as a function of temperature for the Al-20Sn-5Zn [wt.%] alloy. Such a diagram provides a better understanding of the formation of phases during solidification assuming thermodynamic equilibrium. It also considers 0.01 wt.% Fe (the Fe concentration verified in the Al ingot used for the alloys’ preparation) and proves that Fe-rich phases formed during solidification results in such a small fraction. This theoretical prediction indicates that the Al-rich phase formed at 625 °C contains a high concentration of Zn when solidification proceeds. Sn becomes solid only at 232 °C, which is its melting point. The presence of Zn-rich phases in the studied alloy should occur at temperatures below 100 °C. It is more likely that non-equilibrium conditions promoted the suppression of Zn diffusion in solid state, leading to a supersaturated α-Al matrix. This consequently retained the formation of more Zn-rich particles at the interdendritic areas. Even for non-equilibrium solidification, the absence of Zn particles is expected in the final microstructure of the investigated alloy, as seen in the Scheil–Gulliver solidification path shown in Figure 7b.
Figure 8a,b associate both the primary (λ1) and secondary (λ2) dendritic arm spacings with the solidification thermal parameters. As can be seen, the proposed power-type experimental laws have a coefficient of determination (R2 > 0.9), thus indicating that the classical exponents −0.55 and −1.1 can be employed to describe the evolution of λ1 in terms of TR and VL, respectively. Furthermore, the exponents −1/3 and −2/3 satisfactorily represent the power-type experimental equations that correlate λ2 to TR and VL, respectively. All of these four exponents have been proved to be effective for binary and ternary Al-based alloys solidified under unsteady-state conditions [5,12,17,19,20,22].
Aiming at conducting a comparative analysis with the literature, some equations found in other studies were also plotted in Figure 8a,b. As can be seen, the addition of 5 wt.% Zn to the Al-20 wt.% Sn alloy induced an increase in λ1, considering a given TR value. The rise in λ1 because of the addition of a third element is also observed when the binary Al-20 wt.% Sn alloy is alloyed with 10 wt.% Cu. However, the rise in λ1 is approximately four times more intense as compared to that associated with the incorporation of 5 wt.% Zn. In a recent study, Barros et al. [12] observed that the addition of 5 wt.% Zn to an Al-10 wt.% Sn alloy also promoted higher λ1. Still, regarding Figure 8a, the experimental growth law λ1 = f(TR) proposed for the Al-20Sn-5Zn alloy remains closer to that of the Al-10Sn-5Zn alloy, indicating that the addition of 10Sn had no significant effect on λ1.
Regarding λ2 = f(TR), Figure 8b reveals that the equation determined for the Al-20Sn-5Zn alloy stays very close to that of the Al-20Sn alloy. That means the addition of 5 wt.% Zn did not make λ2 either finer or coarser.

3.3. Wear Behavior

Figure 9 shows two characteristic caps formed in the ball-cratering tests performed on the sample extracted at the relative position 40 mm of the DS Al-20Sn-5Zn [wt.%] alloy casting. Obviously, longer tests resulted in craters with higher sizes (larger volume of removed material). Both adhesive and abrasive wear can be clearly seen. In addition, Figure 10 shows that the studied alloy responded by plastic deformation, which is clearly evidenced in the transverse and longitudinal views of the surface immediately below the crater. Microstructures composed of smaller Sn-rich particles seem to be more propense to deformation during the wear tests, as compared to the coarser particles. Such plastic deformation occurred on the surface of the sample, which is expected to occur in the exposition of the constituent phases to heat that resulted from the friction process, especially Sn-rich particles [4].
Figure 11 reveals adhesive, abrasive, and oxidative wear on the surface of all analyzed samples. In fact, there was a transition of wear mechanisms from adhesive to abrasive. At the very first stages of the tests, the predominant mechanism was adhesion. Wear particles containing Sn are withdrawn by adhesion due to the initial contact between the rolling ball and the flat sample. Such wear particles covered the wear surface, thus creating a solid lubricant layer on the sliding contact area. However, the breakdown of the lubricant layer or/and its inefficient distribution along the wear crater provide effective contact between the sliding surfaces. This led to adhesion, i.e., wear was practically inevitable, which increased the material removal. As the experiment proceeded, some removed material attached to the ball, thus leading to abrasion. A continuous oxidation also occurred on the worn surfaces. As previously stated, especially Sn-rich particles, to heat resulted from the plastic deformation. Simultaneously, a reaction between oxygen and the air was experienced at the contact region, which formed a friction oxide layer. Such an oxide layer competed with the solid lubricant layers on the sliding metal contact. Fe was also detected on the sample’s surface. Apparently, it came from the steel ball during contact with the sample.
Figure 12 reveals the typical appearance of wear debris, which were composed mainly of oxides. It is worth noting that the occurrence of debris may undergo continued breakdown during the formation of transient oxides. In addition, there was a competition between the formed debris and the solid lubricant layers on the sliding metal contact of the Al-Sn-Zn alloy samples, with the formed debris acting as a third-body abrasive that magnify the wear process. Significant amounts of Al and Sn were detected, which was to be expected since both are the main elements in the alloy and in the removed material.
The above explanations allow for a better interpretation of the effects of the microstructural phases on the wear behavior. Overall, the tough Al-rich dendrites are responsible for most of the resistance to mechanical loading. It is also the main phase to be detached and to compose the wear debris along with other oxides. Zn is almost entirely present in the Al-rich matrix. Due to its higher mechanical strength, Zn reinforces the Al-rich matrix. The main role of Sn is to act as solid lubricant. During friction, the Sn particles are detached from the alloy and spread over a continuous Al-rich matrix, forming a lubricant film. It is important to recall that Sn particles are located at the interdendritic areas.

3.4. Effects of the Dendritic Arm Spacings on Wear Features

Figure 13 associates the specific wear rate (Wr) to the sliding distance (SD). Until SD = 1658 m, Wr increased progressively. After that, Wr had a slight decrease. Two parabolic equations are proposed to represent the possible range for Wr. Although the experimental points are relatively close to each other, those that correspond to finer microstructures tend to have higher Wr values. Just as this study, other works have focused on a better understanding of the relationships between microstructure and wear features of directionally solidified Al-based alloys using ball-cratering tests. This is the case of the study conducted by Cruz et al. [5], where an Al-20Sn alloy was demonstrated to have its wear resistance reduced with the microstructure refinement. It is worth mentioning that such a study was taken herein as reference to verify if the addition of 5 wt.% Zn would be able to improve the wear resistance of the Al-20Sn alloy. Recently, Botelho et al. [19] and Azevedo et al. [20] have used ball-cratering tests to investigate the dry sliding wear behavior of the Al-7Si-0.3Mg and Al-3Ni-1Bi alloys. They observed that the dry sliding wear resistance tended to improve with microstructure refinement, which is the opposite to that found by Cruz et al. [5]. A common aspect between the present study and all of these three works is the variation in the SD. More specifically, the SD of 415 and 829 m were adopted in all of them. Although each work adopted a different normal load (Cruz et al. [5] = 0.6 N; Botelho et al. [19] = 0.2 N; Azevedo et al. [20] = 0.2 N), the specific wear rate can be used as a comparison factor.
Figure 14 compares the Wr of the studied alloy to the above-mentioned studies. Only two SD values are considered because they are the only ones in common for all studies. For each SD, the respective Wr value represents the average of all points obtained, i.e., that a Wv likely to be true or likely to happen. Although the Wv values seem to be closer to each other, they allow for some interpretations. For SD = 415 m, the Al-20Sn-5Zn alloy has a lower Wv compared to the Al-20Sn alloy. When SD increases to 829 m, both alloys are characterized by an increase in Wv. However, the binary alloy achieves an Wv value even higher. That means the 5 wt.% Zn addition induced an improvement in the wear resistance. In fact, the Al-20Sn-5Zn alloy has Wv values lower than that of the Al-7Si-0.3Mg alloy. The increase in Wv is also noticed for the Al-7Si-0.3Mg alloy. The only exception is the Al-3Ni-1Bi alloy. It is worth noting that these two alloys contain harder phases in their compositions, which may strengthen the alloy, thus favoring a lower Wv.
Wr values were calculated using Equation (2), which depends on the wear volume (Wv) determined from Equation (1). That means, Wv is determinant in their calculation. Wv values are plotted against the primary and secondary dendritic arm spacings (in Hall-Petch format) in Figure 15. For the first four times (7–28 min), the wear volume presented a constant profile, with no changes in Wv being induced by the microstructure length scale. For 56 and 112 min, however, finer microstructures favored higher Wv values. For both times, the microstructure refinement had a negative impact on wear resistance. The detrimental effects are noted to increase with increasing test time. Cruz et al. [5] pointed out that larger Sn-particles seem to promote more adequate self-lubricating features. Apparently, such effect is also typical of the Al-20Sn-5Zn [wt.%] alloy but becomes observable and more pronounced for longer sliding distances. Therefore, a possible explanation for this is the interference of the oxidation process on the lubricating effect of Sn-particles. For longer test times, smaller Sn-particles are not strong enough to support such competition with the oxide layer. Two multiple linear regression (MLR) equations are proposed to represent variation of Wv with the primary (λ1) and secondary (λ2) dendritic arm spacings, one for each condition (test times of 56 and 112 min). Table 2 contains the results of all MLR analyses conducted in this work.

3.5. Inverse Relationship between Wear Resistance and Hardness

The hardness of the analyzed alloy increases with increasing refinement of dendritic arm spacings (Figure 16). An MLR expression is also shown to fit very well the experimental data. Interestingly, hardness shows an opposite behavior as compared to that of wear resistance. Overall, hardness is expected to increase as the microstructure length scale reduces (i.e., as the dendritic arm spacing becomes finer). As a matter of fact, a finer microstructure tends to provide more resistance to indentation due to the higher number of barriers to the dislocation motion, which makes plastic deformation more difficult, and the material harder. Unlike what was found in this work, wear resistance generally improves with the increase in hardness. However, it is important to explain that the wear phenomena can be more complex.
Apart from the lubricating action of Sn, there is also the occurrence of oxidation on the contact area of the tribological couple. As previously mentioned, oxidation might reduce the lubricating effect of Sn-particles. Such behavior becomes more intense for longer sliding distances, with smaller Sn-particles being not strong enough to support such competition with the oxide layer. This can be a possible reason why the wear resistance not necessarily follows the same rule as hardness, which improves with the microstructure refinement. Cruz et al. [5] observed an inverse relationship between tensile properties and wear resistance in Al-Sn alloys. According to them, soft Sn-rich particles seem to favor an improved lubrication effect for coarser microstructures. Considering that most parts of Zn is dissolved in the Al-rich matrix, Sn particles naturally tend to be the determinant interdendritic constituent for the wear response of the studied alloy.
Figure 17 shows the hardness values for different distances below the worn surfaces of the samples p = 5 and 40 mm. Such samples represent the two extremes achieved herein for the microstructure length scale. Each point in the graph represents the mean value of 4 measurements of hardness. For both samples, the region most affected by plastic deformation is approximately 100 μm below the worn surface. After such a location, the hardness remains constant. It is interesting to note the sample p = 5 mm reveals a more expressive variation in hardness. Considering their respective first points below the worn surface, the sample p = 5 mm has an increase in hardness of ~13.7%, while the sample p = 40 mm increases ~11.7% with respect to the hardness of their respective unaffected region. That means finer microstructures are more likely to undergo plastic deformation (there is more propensity) during the wear tests, which confirms the analysis of Figure 10.
Hardness (H), wear volume (Wv), the sliding distance (S), and load (L) are all considered in the classical Archard’s equation (Equation (3)) for the determination of the wear coefficient (K) [23].
W v S = K L H
where d: average diameter of the worm crater, R: radius of the sphere; S: sliding distance; and N: normal contact load.
It is important to point out that, unlike the Archard’s equation, this work reveals an inverse dependence of wear resistance on hardness, which naturally affects the K values. Thus, Figure 18 simultaneously relates the K values to the primary (λ1) and secondary (λ2) dendritic arm spacings. Two equations determined from multiple linear regression (MLR) are proposed to represent the possible range for K under the adopted conditions. One equation describes the behavior of maximum K values, while the other characterizes the minimum K values. Overall, K is lower during the initial test times (7 and 14 min). It only achieves relatively higher values for longer tests (higher sliding distances). It is worth noting that K tends to increase with microstructure refinement.
Table 2 demonstrates that the MLR equations are characterized by relatively higher R2 values. An important point to consider is that changes in any dendritic spacing are directly related to shifts in the others. Due to that, multicollinearity is inherent to the MLR analysis. This can be an explanation for the higher p-values. For prediction purposes, however, multicollinearity seems to not interfere in the usefulness of the regression equations.

4. Conclusions

From this investigation, the following conclusions can be drawn:
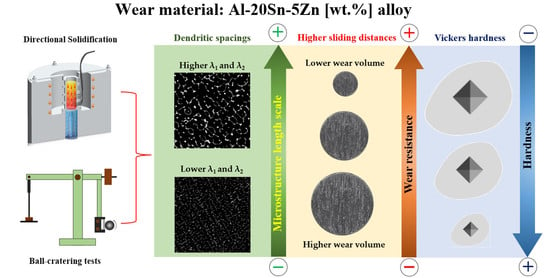
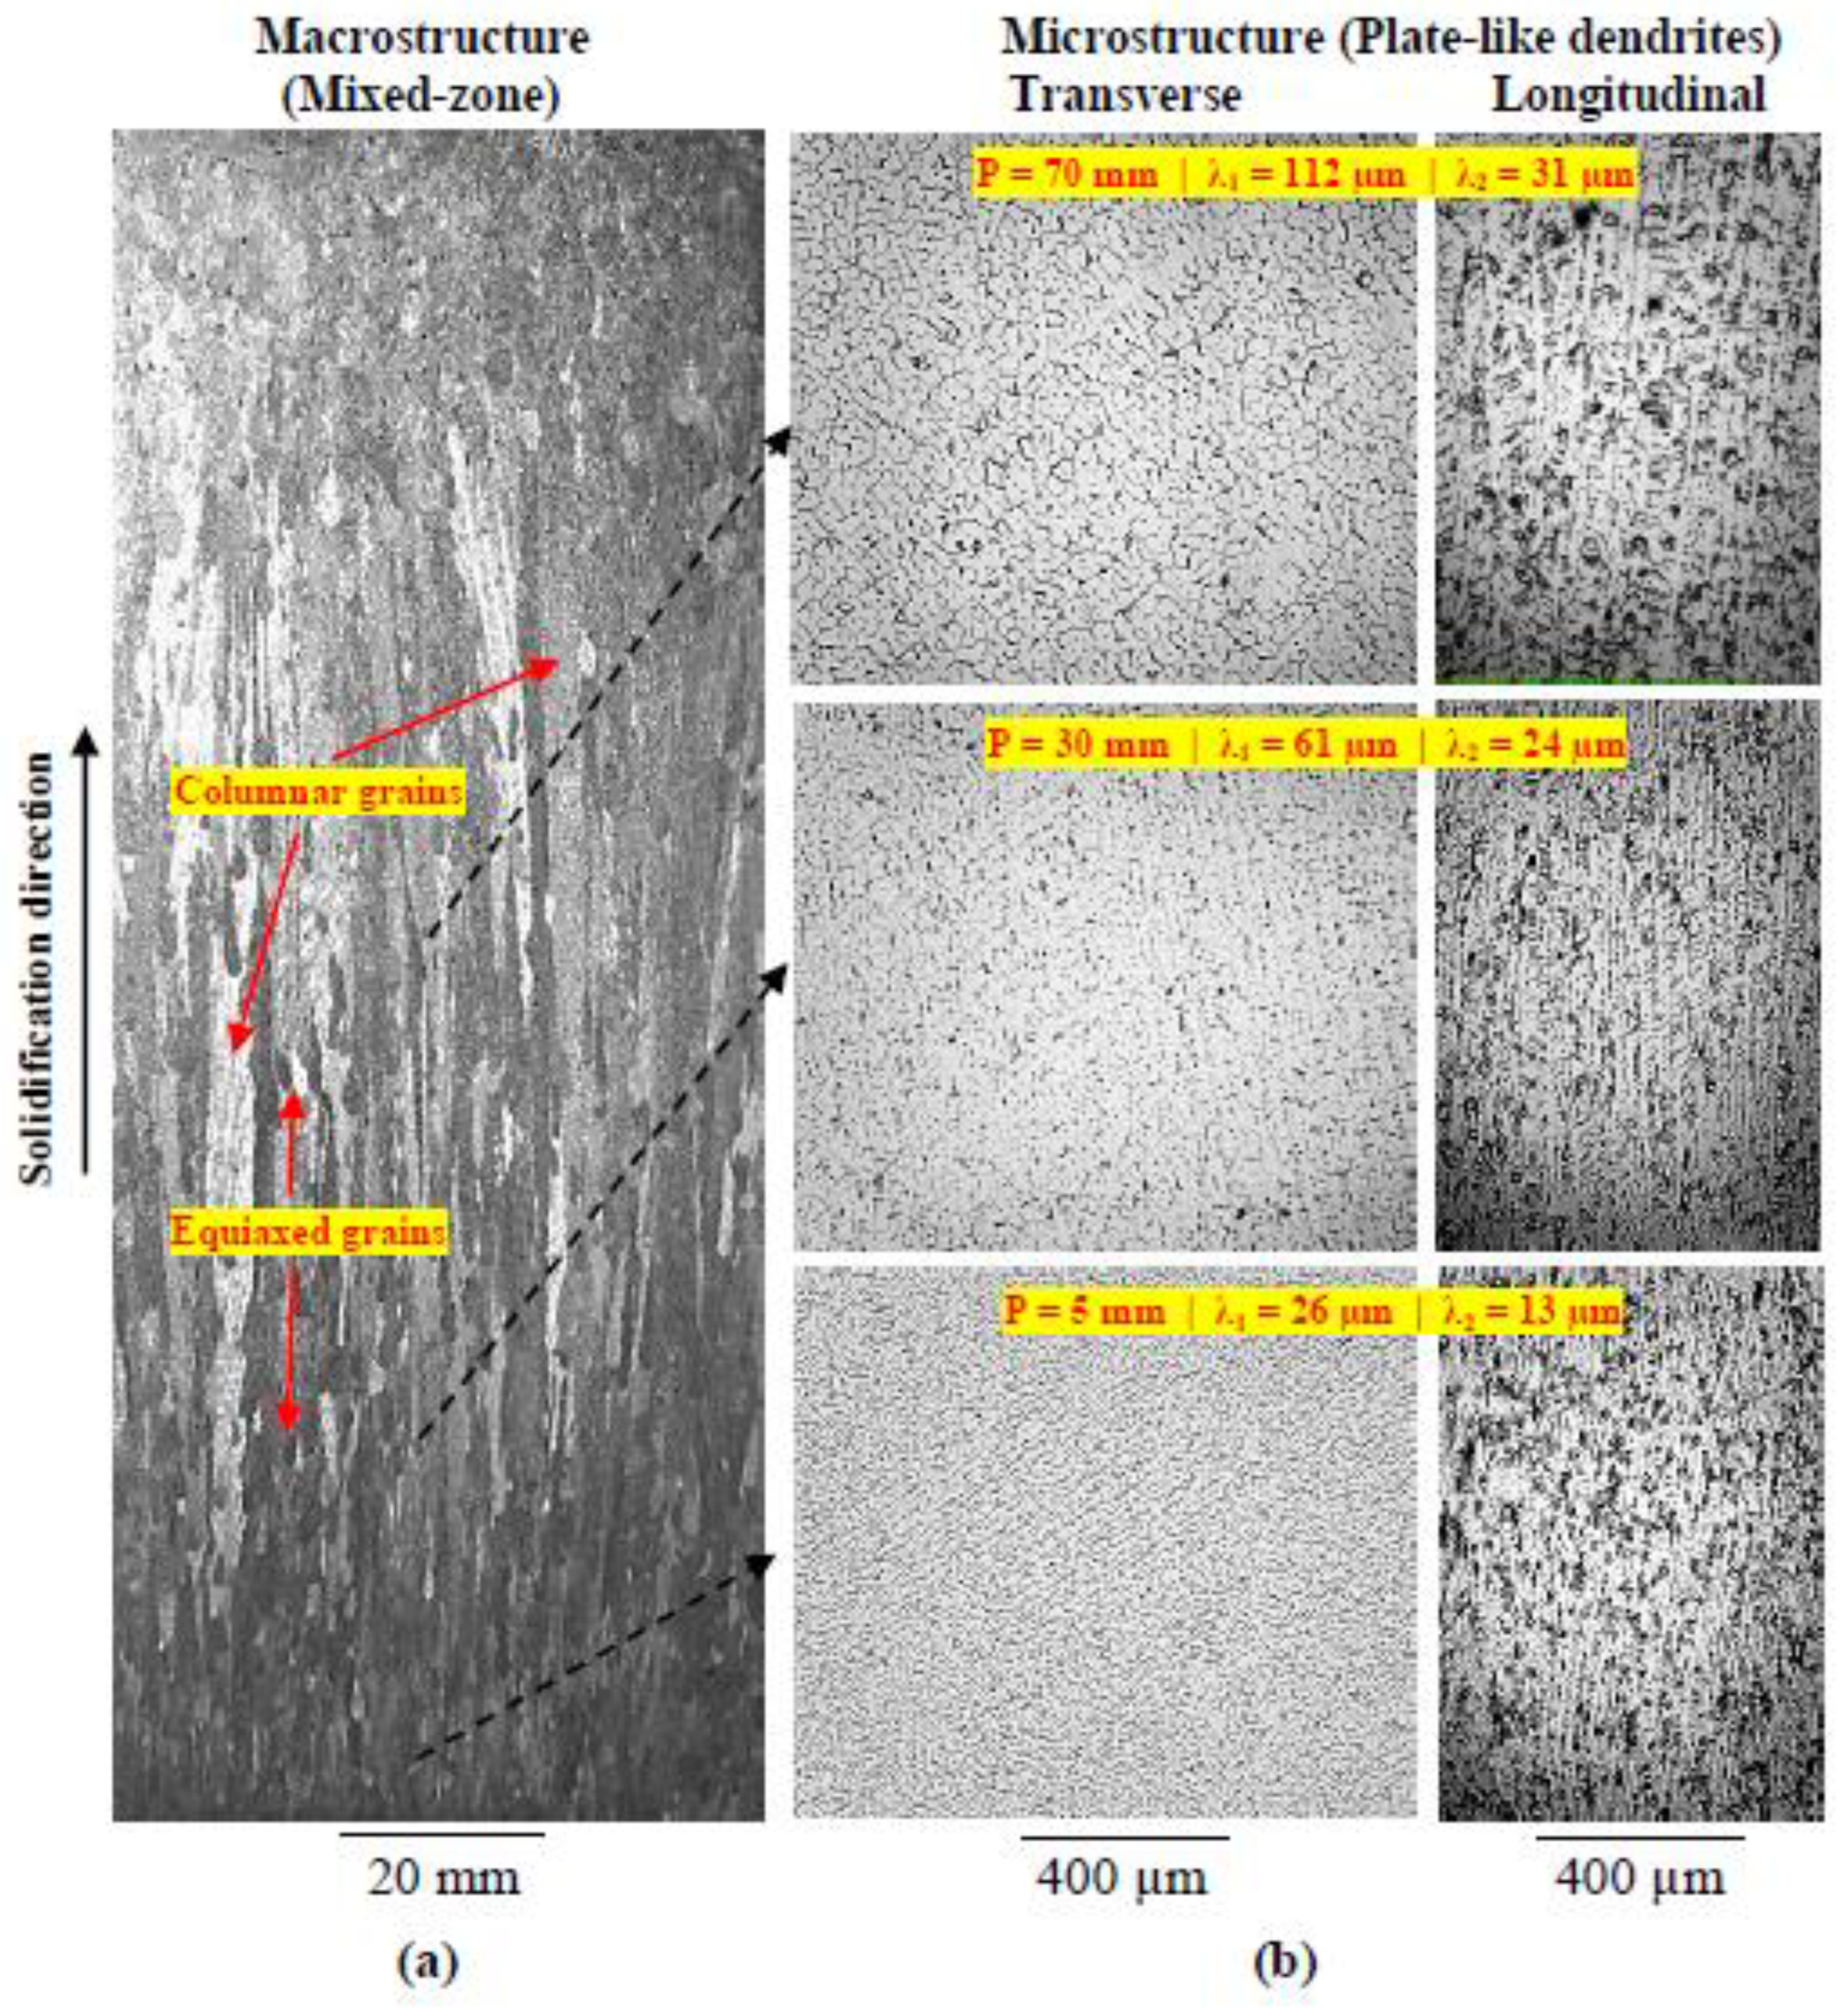
  • For solidification under transient heat flow conditions, plate-like dendrites were shown to characterize the microstructural morphology of the Al-20Sn-5Zn [wt.%] alloy. In addition, the growth of the dendritic arm spacings (λ1 and λ2) as a function of solidification thermal parameters can be represented by experimental expressions with classical exponents proposed in the literature. Furthermore, the addition of 5 wt.% Zn to the Al-20 wt.% Sn alloy induced higher λ1, while λ2 remained almost unaffected;
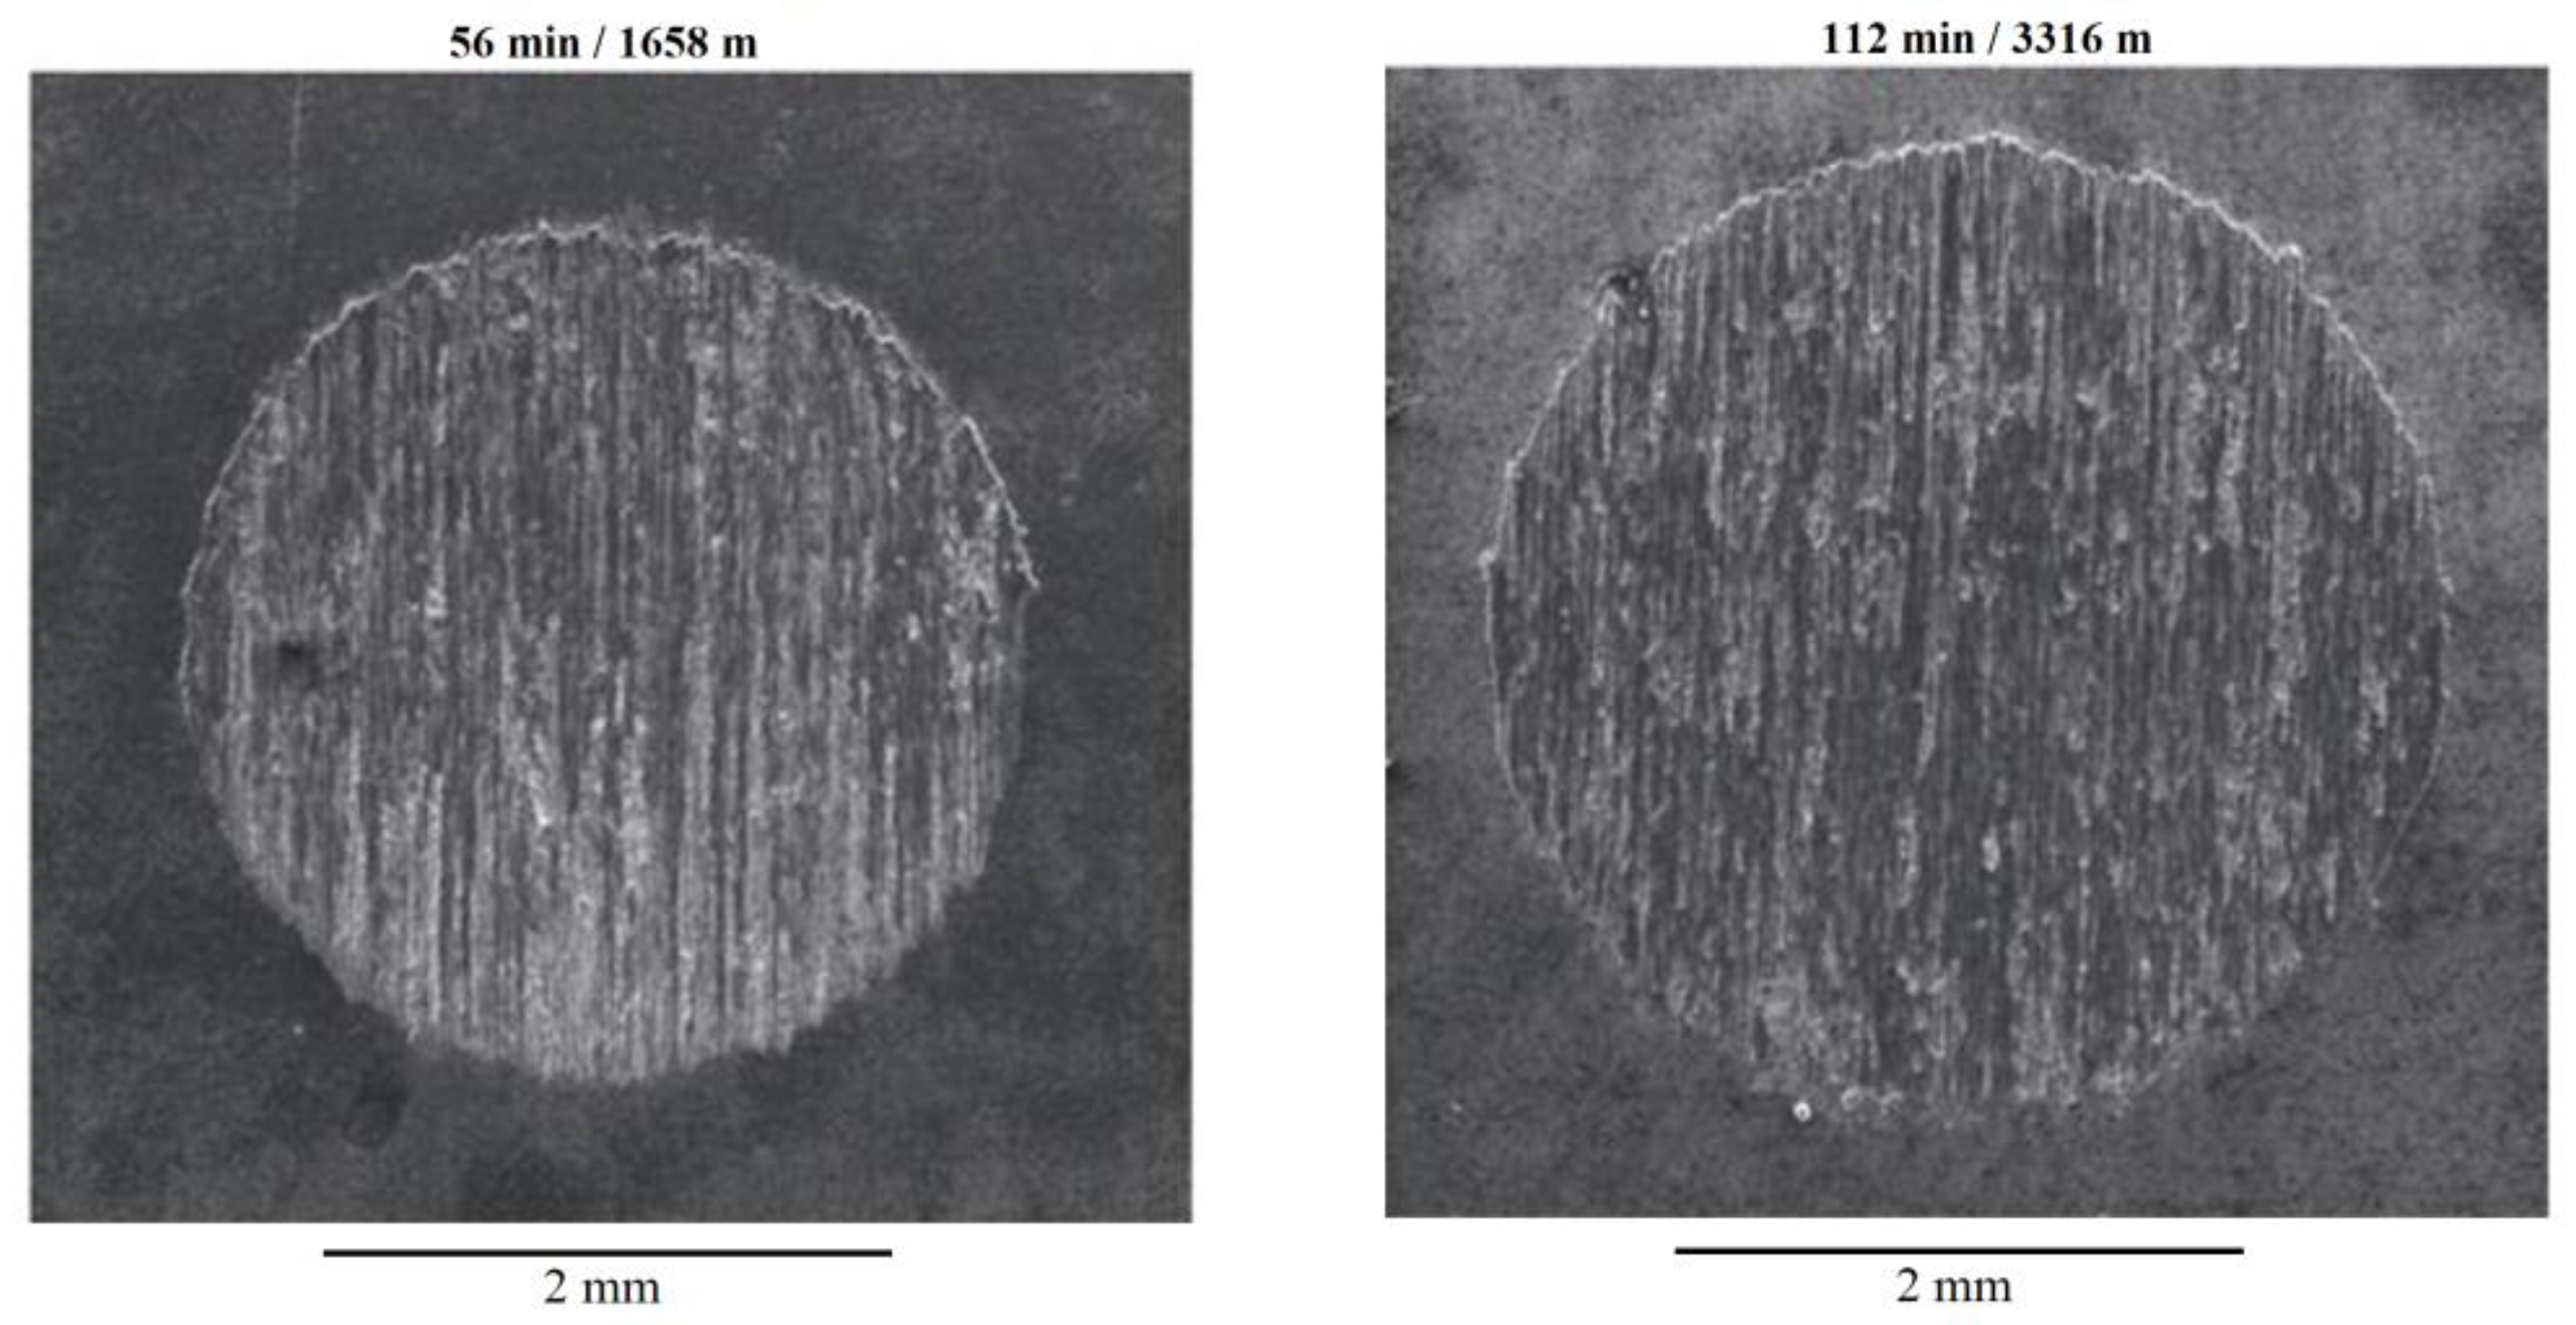
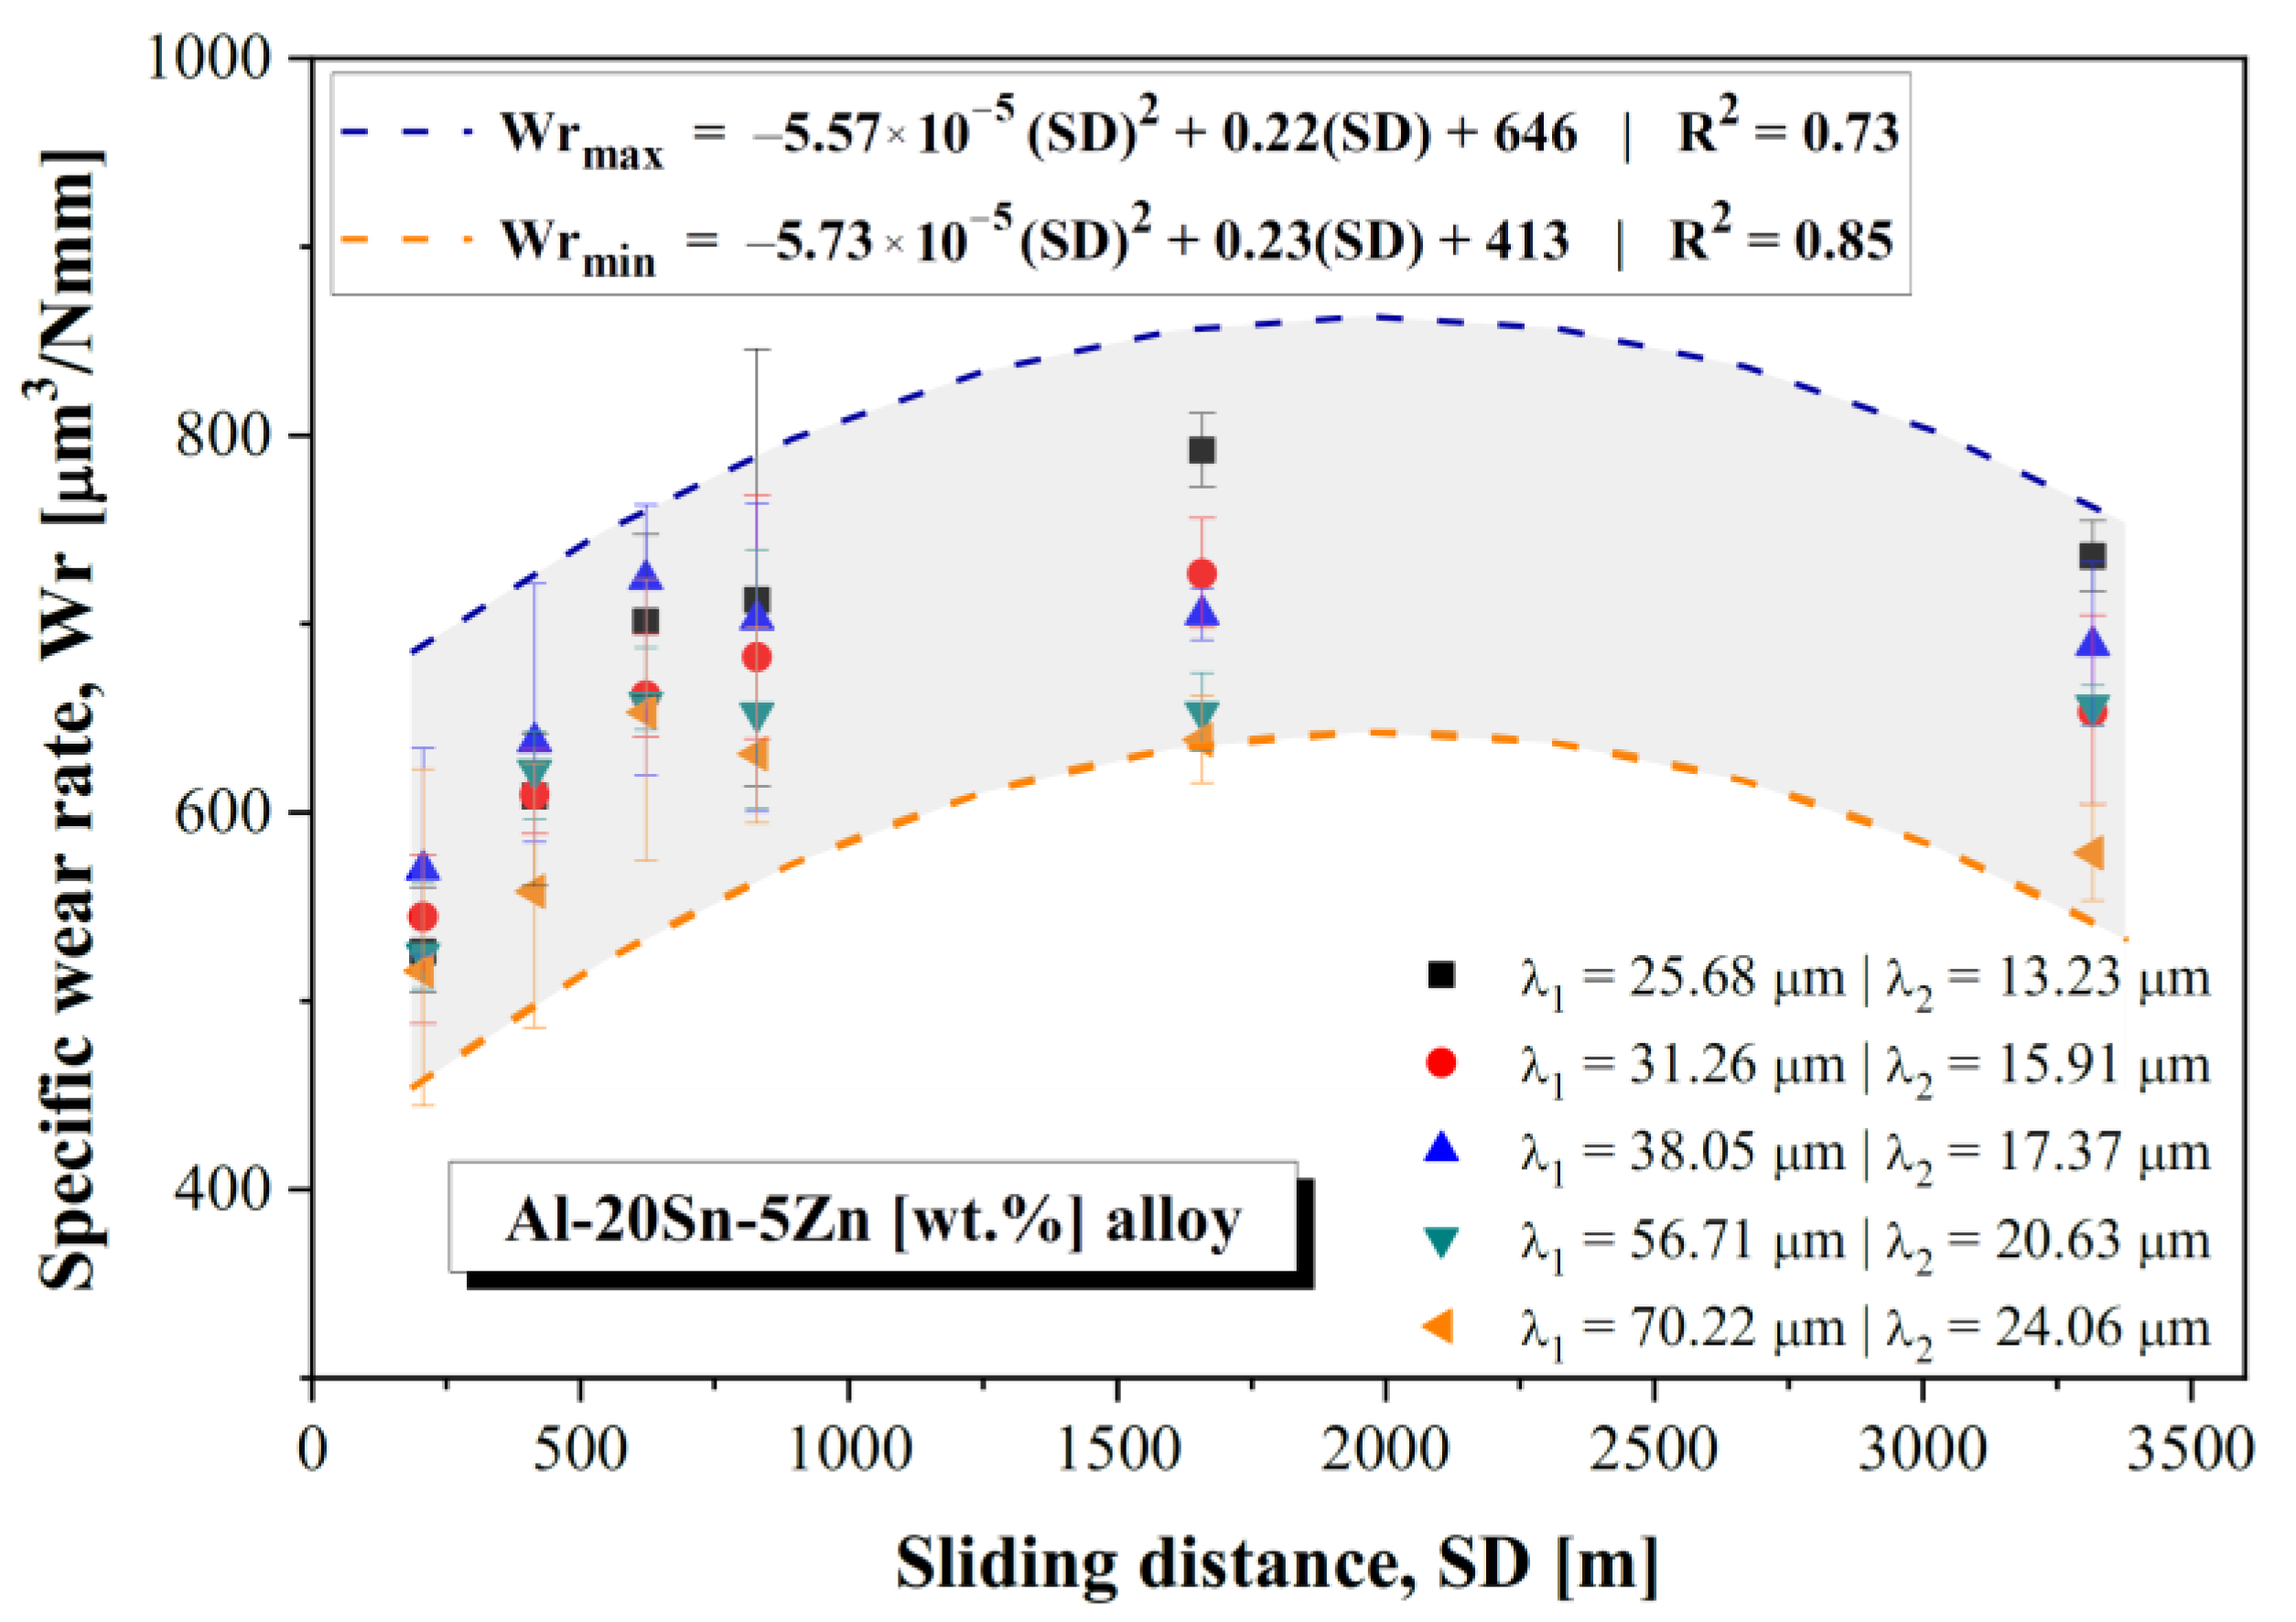
  • The microstructure length scale was shown to influence the wear performance of the studied Al-Sn-Zn alloy. Especially for longer sliding distances, finer microstructures, i.e., regions with smaller dendrite arm spacings and with a more homogenous dispersion of Sn, were shown to be associated with comparatively lower wear resistance;
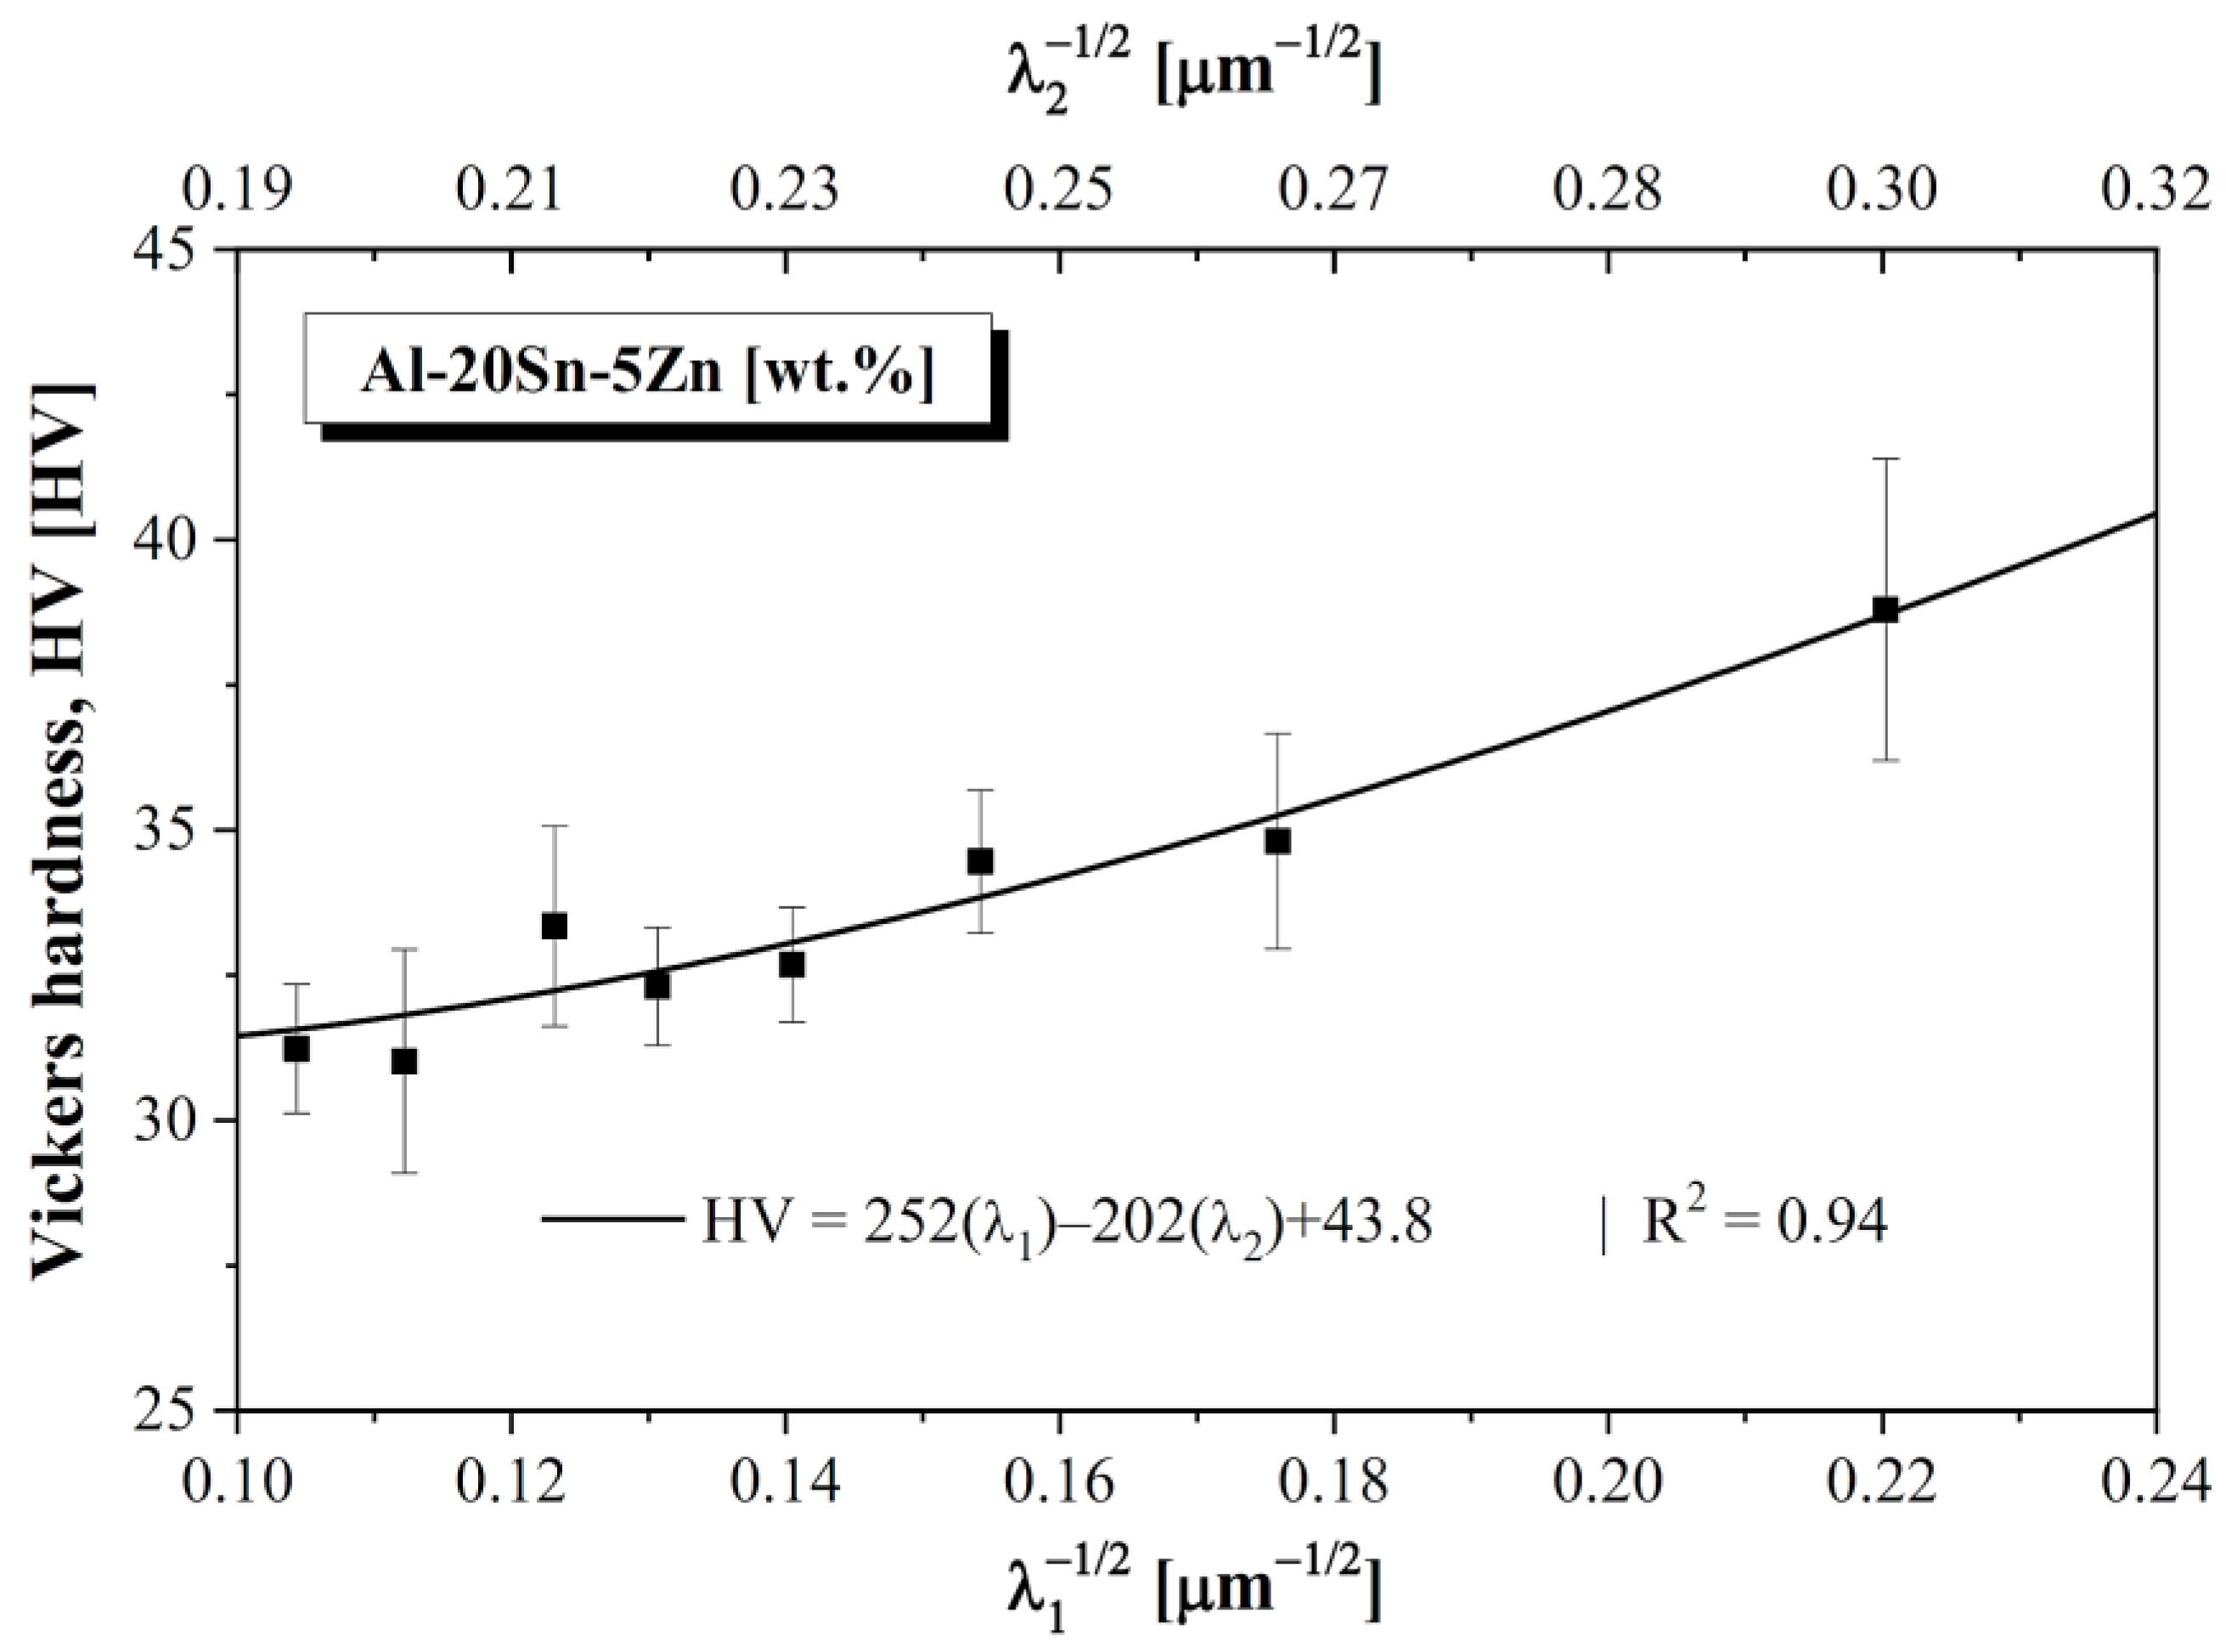
  • For the sliding dry conditions adopted in this work, the Al-20Sn-5Zn [wt.%] alloy revealed an inverse relationship between wear resistance and hardness. This is justified by the more complex phenomena involved in wear, especially the lubricant action of Sn, oxidation process, and propensity to plastic deformation during wear;
  • The addition of 5 wt.% Zn to the Al-20 wt.% Sn alloy was able to improve the wear resistance. In fact, the specific wear rates found for the studied alloy are compatible with that of other studies from the literature for other alloys, including Al-Si-Mg and Al-Bi-Ni;
  • Experimental equations were proposed, permitting determination of the possible spectrum of specific wear rates in terms of the sliding distance, considering different microstructure length scales. MLR equations were shown to be able to determine a possible range of wear volume and wear coefficient according to the dendritic arm spacings.

Author Contributions

Conceptualization, A.B. and N.C.; methodology, A.B., C.C., T.B. and A.S.; validation, A.B., C.C. and T.B.; formal analysis, A.B., A.S. and N.C.; investigation, A.B.; resources, N.C., A.S. and A.G.; data curation, A.B.; writing—original draft preparation, A.B., A.S., L.C. and N.C.; writing—review and editing, A.G., N.C. and L.C.; supervision, N.C.; project administration, N.C. and A.G.; funding acquisition, N.C. and A.G. All authors have read and agreed to the published version of the manuscript.

Funding

FAPESP-São Paulo Research Foundation, Brazil (grant 2021/11439-0); CNPq-National Council for Scientific and Technological Development, Brazil (grant 140918/2018-3 and 201337/2020-7); FAEPEX/UNICAMP-Fundo de Apoio ao Ensino, à Pesquisa e à Extensão (grants 2162/21 and 2549/22).

Data Availability Statement

Not applicable.

Acknowledgments

This research used the facilities of the Brazilian Nanotechnology National Laboratory (LNNano), part of the Brazilian Centre for Research in Energy and Materials (CNPEM), a private non-profit organization under the supervision of the Brazilian Ministry for Science, Technology, and Innovations (MCTI). The DRXP staff is acknowledged for the assistance during the experiments (DRXP–24625).

Conflicts of Interest

The authors declare no conflict of interest.

References

  1. Wu, X.; Wang, D.; De Andrade, V.; Jiang, Y.; Wang, W.; Wen, S.; Gao, K.; Huang, H.; Chen, S.; Nie, Z. Dry Sliding Wear of Microalloyed Er-containing Al–10Sn–4Si–1Cu Alloy. J. Mater. Res. Technol. 2020, 9, 14828–14840. [Google Scholar] [CrossRef]
  2. Zeng, M.Q.; Hu, R.Z.; Song, K.Q.; Dai, L.Y.; Lu, Z.C. Enhancement of Wear Properties of Ultrafine-Structured Al–Sn alloy-embedded Sn nanoparticles through in situ synthesis. Tribol. Lett. 2019, 67, 84. [Google Scholar] [CrossRef]
  3. Liu, X.; Zeng, M.Q.; Ma, Y.; Zhu, M. Wear Behavior of Al–Sn alloys With Different Distribution of Sn Dispersoids Manipulated by Mechanical Alloying and Sintering. Wear 2008, 265, 1857–1863. [Google Scholar] [CrossRef]
  4. Li, S.; Li, Y.; Guo, H.; Wen, Z.; Zhu, Z. Effect of Electromagnetic Stirring Frequency on Tribological Performance and Corrosion Resistance of Al-Sn Bearing Alloy. Mater. Today Commun. 2022, 32, 103898. [Google Scholar] [CrossRef]
  5. Cruz, K.S.; Meza, E.S.; Fernandes, F.A.; Quaresma, J.; Casteletti, L.C.; Garcia, A. Dendritic Arm Spacing Affecting Mechanical Properties and Wear Behavior of Al-Sn and Al-Si alloys Directionally Solidified Under Unsteady-State Conditions. Metall. Mater. Trans. A 2010, 41, 972–984. [Google Scholar] [CrossRef]
  6. Wang, D.; Wu, X.; Gao, K.; Wen, S.; Wu, H.; Qiu, J.; Wei, W.; Huang, H.; Zhou, D.; Nie, Z. Study on The Microstructure and Wear Behavior of Mg-containing Al–12Sn–4Si Alloys. J. Mater. Res. Technol. 2022, 18, 338–351. [Google Scholar] [CrossRef]
  7. Bertelli, F.; Freitas, E.S.; Cheung, N.; Arenas, M.A.; Conde, A.; de Damborenea, J.; Garcia, A. Microstructure, Tensile Properties and Wear Resistance Correlations on Directionally Solidified Al-Sn-(Cu; Si) Alloys. J. Alloys Compd. 2017, 695, 3621–3631. [Google Scholar] [CrossRef]
  8. Lu, Z.C.; Gao, Y.; Zeng, M.Q.; Zhu, M. Improving Wear Performance of Dual-scale Al–Sn alloys: The Role of Mg Addition in Enhancing Sn Distribution and Tribolayer Stability. Wear 2014, 309, 216–225. [Google Scholar] [CrossRef]
  9. Costa, T.A.; Dias, M.; Freitas, E.S.; Casteletti, L.C.; Garcia, A. The Effect of Microstructure Length Scale on Dry Sliding Wear Behaviour of Monotectic Al-Bi-Sn Alloys. J. Alloys Compd. 2016, 689, 767–776. [Google Scholar] [CrossRef]
  10. Abu-Zeid, O.A. Tribology and Corrosion of Al-1.5wt.% Zn-5wt.% Sn Ion Platings. Wear 1990, 139, 313–318. [Google Scholar] [CrossRef]
  11. Zhang, F.; Edalati, K.; Arita, M.; Horita, Z. Hydrolytic Hydrogen Production on Al–Sn–Zn Alloys Processed by High-Pressure Torsion. Materials 2018, 11, 1209. [Google Scholar] [CrossRef] [PubMed] [Green Version]
  12. Barros, A.; Cruz, C.; Garcia, A.; Cheung, N. Corrosion Behavior of an Al–Sn–Zn Alloy: Effects of Solidification Microstructure Characteristics. J. Mater. Res. Technol. 2021, 12, 257–263. [Google Scholar] [CrossRef]
  13. Popoola, A.P.; Fatoba, O.S.; Aigbodion, V.S.; Popoola, O.M. Tribological Evaluation of Mild Steel with Ternary Alloy of Zn-Al-Sn by Laser Deposition. Int. J. Adv. Manuf. Technol. 2017, 89, 1443–1449. [Google Scholar] [CrossRef]
  14. Shuai, C.; Xue, L.; Gao, C.; Peng, S.; Zhao, Z. Rod-like Eutectic Structure in Biodegradable Zn–Al–Sn Alloy Exhibiting Enhanced Mechanical Strength. ACS Biomater. Sci. Eng. 2020, 6, 3821–3831. [Google Scholar] [CrossRef]
  15. Manjunath, G.K.; Bhat, K.U.; Kumar, G.P. Dry Sliding Wear Behaviour of Al-5Zn-2Mg Alloy Processed by Severe Plastic Deformation. Mater. Today Proc. 2021, 46, 9232–9238. [Google Scholar] [CrossRef]
  16. Sadawy, M.; Metwally, H.; Abd El-Aziz, H.; Adbelkarim, A.; Mashaal, H.; Kandil, A. The Role of Sn on Microstructure, Wear and Corrosion Properties of Al-5Zn-2.5 Mg-1.6 Cu-xSn Alloy. Mater. Res. Express 2022, 9, 096507. [Google Scholar] [CrossRef]
  17. Kakitani, R.; Konno, C.; Garcia, A.; Cheung, N. The Effects of Solidification Cooling and Growth Rates on Microstructure and Hardness of Supersaturated Al-7% Si-x% Zn Alloys. J. Mater. Eng. Perform. 2022, 31, 1956–1970. [Google Scholar] [CrossRef]
  18. Oliveira, R.; Cruz, C.; Barros, A.; Bertelli, F.; Spinelli, J.E.; Garcia, A.; Cheung, N. Thermal Conductance at Sn-0.5 mass% Al Solder Alloy/Substrate Interface as a Factor for Tailoring Cellular/Dendritic Growth. J. Therm. Anal. Calorim. 2022, 147, 4945–4958. [Google Scholar] [CrossRef]
  19. Botelho, T.M.; Azevedo, H.M.; Machado, G.H.; Barbosa, C.R.; Rocha, F.S.; Costa, T.A.; Rocha, O.L. Effect of Solidification Process Parameters on Dry Sliding Wear Behavior of AlNiBi alloy. Trans. Nonferrous Met. Soc. 2020, 30, 582–594. [Google Scholar] [CrossRef]
  20. Azevedo, H.M.; Botelho, T.M.; Barbosa, C.R.; Sousa, A.P.; Costa, T.A.; Rocha, O.L. Study of Dry Wear Behavior and Resistance in Samples of a Horizontally Solidified and T6/Heat-Treated Automotive AlSiMg Alloy. Tribol. Lett. 2020, 68, 60. [Google Scholar] [CrossRef]
  21. Jung, H.; Mangelinck-Noël, N.; Nguyen-Thi, H.; Billia, B. Columnar to Equiaxed Transition During Directional Solidification in Refined Al-based Alloys. J. Alloys Compd. 2009, 484, 739–746. [Google Scholar] [CrossRef]
  22. Bertelli, F.; Brito, C.; Ferreira, I.L.; Reinhart, G.; Nguyen-Thi, H.; Mangelinck-Noel, N.; Cheung, N.; Garcia, A. Cooling Thermal Parameters, Microstructure, Segregation and Hardness in Directionally Solidified Al–Sn-(Si; Cu) Alloys. Mater. Des. 2015, 72, 31–42. [Google Scholar] [CrossRef]
  23. Lancaster, J.K. Material-Specific Wear Mechanisms: Relevance to Wear Modelling. Wear 1990, 141, 159–183. [Google Scholar] [CrossRef]
Figure 1. Pseudo-binary phase diagram generated by the Thermo-Calc software version 2019b (TCAL5 database) for the Al-5Zn-Sn [wt.%] alloys. Red arrow indicates the studied alloy. On the left lower corner, it is shown the Thermo-Calc software symbol.
Lubricants 10 00352 g001
Figure 2. Scheme of the experimental procedures used in this work.
Lubricants 10 00352 g002
Figure 3. (a) Cooling curves collected at different heights of the DS Al-20Sn-5Zn [wt.%] alloy casting; (b) Sn and Zn concentrations, VL, and TR profiles.
Lubricants 10 00352 g003
Figure 4. (a) As-solidified macrostructure and (b) characteristic optical micrographs of the directionally solidified Al-20Sn-5Zn [wt.%] alloy.
Lubricants 10 00352 g004
Figure 5. Typical SEM images with EDS analysis for the Al-20Sn-5Zn [wt.%] alloy.
Lubricants 10 00352 g005
Figure 6. X-ray diffraction patterns obtained for Al-20Sn-5Zn [wt.%] alloy samples solidified at three different TR values.
Lubricants 10 00352 g006
Figure 7. (a) Property diagram and (b) Scheil–Gulliver solidification path of the Al-20Sn-5Zn [wt.%] alloy. On the left lower corner, it is shown the Thermo-Calc software symbol.
Lubricants 10 00352 g007
Figure 8. Effects of (a) TR and (b) VL on λ1 and λ2 for the directionally solidified Al-20Sn-5Zn [wt.%] alloy. Experimental data are compared with the works of Cruz et al. [5], Barros et al. [12] and Bertelli et al. [22].
Lubricants 10 00352 g008
Figure 9. Typical worn craters for the two longer sliding distances (1658 and 3316 m) considered for the wear analysis of the directionally solidified Al-20Sn-5Zn [wt.%] alloy.
Lubricants 10 00352 g009
Figure 10. SEM images of the above view as well as transverse and longitudinal sections of worn craters. Samples corresponded to the relative positions 5 and 40 mm in the casting (test time = 112 min). The transverse and longitudinal craters consider the central area of the craters.
Lubricants 10 00352 g010
Figure 11. Characteristic SEM image of a worn crater, including EDS analysis for the directionally solidified Al-20Sn-5Zn [wt.%] alloy.
Lubricants 10 00352 g011
Figure 12. SEM micrograph of collected debris related to Al-20Sn-5Zn [wt.%] alloy sample with respective EDS mapping.
Lubricants 10 00352 g012
Figure 13. Specific wear rate as a function of the sliding distance for the Al-20Sn-5Zn [wt.%] alloy.
Lubricants 10 00352 g013
Figure 14. Comparison of the specific wear rate of the Al-20Sn-5Zn [wt.%] alloy with previous studies. Experimental data are compared with the works of Cruz et al. [5], Botelho et al. [19] and Azevedo et al. [20].
Lubricants 10 00352 g014
Figure 15. Influence of the dendritic arm spacings on the wear volume for the Al-20Sn-5Zn [wt.%] alloy.
Lubricants 10 00352 g015
Figure 16. Effects of the dendritic arm spacings on hardness of the Al-20Sn-5Zn [wt.%] alloy.
Lubricants 10 00352 g016
Figure 17. Measurements of hardness below the worn surface.
Lubricants 10 00352 g017
Figure 18. Wear coefficient as a function of the dendritic arm spacings on hardness of the Al-20Sn-5Zn [wt.%] alloy.
Lubricants 10 00352 g018
Table 1. Chemical compositions [wt.%] of the metals used in the preparation of the studied Al-Sn-Zn alloy.
MetalsAlZnSnFeNiCuAgPb
AlBalance0.005-0.0730.0060.01-0.006
Zn-Balance0.00100.0010.0010.115-0.002
Sn0.00060.0020Balance0.00250.00010.00040.00020.001
Table 2. Results of the MLR analysis for the studied Al-20Sn-5Zn [wt.%] alloy.
Dependent VariableStatistical TermStatistical Values
Wv
(test time = 56 min)
R20.9889
F0.01102
Interceptλ1−1/2λ2−1/2
Coefficient0.183890.491490.12120
p-value0.251270.699230.9279
Wv
(test time = 112 min)
R20.7706
F0.22942
Interceptλ1−1/2λ2−1/2
Coefficient−0.12417−3.993525.35635
p-value0.910990.712460.64975
HVR20.9369
F0.000250
Interceptλ1−1/2λ2−1/2
Coefficient43.833252.3641−202.5826
p-value0.013180.098870.185978
K
(maximum)
R20.9765
F0.02341
Interceptλ1−1/2λ2−1/2
Coefficient0.00004010.000365-0.000293
p-value0.265230.2822120.39030
K
(minimum)
R20.8377
F0.1622
Interceptλ1−1/2λ2−1/2
Coefficient−0.000023589−0.000270.0003438
p-value0.59390.52590.4679
Publisher’s Note: MDPI stays neutral with regard to jurisdictional claims in published maps and institutional affiliations.

