Article

Central Engine and Spectral Energy Distribution Properties of High Redshift Gamma Ray Blazars

by
Anilkumar Tolamatti
1,2,*,
Krishna Kumar Singh
1,2 and
Kuldeep Kumar Yadav
1,2
1
Astrophysical Sciences Division, Bhabha Atomic Research Centre, Mumbai 400085, India
2
Homi Bhabha National Institute, Anushakti Nagar, Mumbai 400094, India
*
Author to whom correspondence should be addressed.
Galaxies 2024, 12(2), 10; https://doi.org/10.3390/galaxies12020010
Submission received: 11 December 2023 / Revised: 1 March 2024 / Accepted: 7 March 2024 / Published: 11 March 2024

Abstract

:
We report on the properties of central engines in the γ -ray blazars located at high redshifts beyond z > 0.4, where the extra-galactic background light (EBL) starts affecting their γ -ray spectra. The physical engine that provides power to the blazars of very high bolometric luminosity is assumed to be a highly collimated jet of matter moving relativistically away from the supermassive black hole (SMBH), located in the central region of the host galaxy, in a direction aligned toward the Earth. Due to their peculiar geometry and special physical conditions, blazars at redshifts beyond z > 0.4 are bright enough to be detected in the γ -ray energy band. In this work, we investigate the physical properties of high-z  γ -ray blazars detected by the Large Area Telescope (LAT) on board the Fermi satellite. We also study the properties of their emission regions and the central engines and discuss cosmological and astrophysical implications.

1. Introduction

Blazars are bright beacons in the Universe. They represent a subclass of the radio-loud active galactic nuclei (AGNs) which are characterized as elliptical galaxies hosting supermassive black holes (SMBHs; M B H : 10 6 10 10 M ) at their centers and oppositely oriented powerful jets of plasma ejected from the poles of SMBH [1,2]. The accretion of gaseous matter onto the spinning SMBH is considered to be the dominant physical process for powering these sources and launching the relativistic plasma jets. However, the exact mechanism of jet formation is not completely understood and three alternative theories have been proposed. In the so-called Blandford–Znajek (BZ) mechanism, the jet extracts energy from the rotation of SMBH, and the power of the jet depends on the black hole spin and square of magnetic flux threading its event horizon [3]. In the second model, also known as the Blandford–Payne (BP) mechanism, the jet extracts energy only from the rotation of the accretion disk, and the role of SMBH is not important [4]. In the case of these two theories, the formation of jets is sustained by the accretion of matter onto the SMBHs, and a relation between jet and accretion luminosity is expected and has been confirmed in different studies [5,6,7,8]. The hybrid model, a combination of the above two mechanisms, speculates about the observed differences in different types of AGNs with jets [9]. The jets in AGNs are observed to be ultra-luminous sources of non-thermal radiation spanning over the entire electromagnetic spectrum ranging from radio waves to very high energy (VHE; E > 20 GeV) γ -rays. They are also thought to be the apparent manifestations of AGN activity during their early evolutionary stages [10]. An extreme class of such AGNs, in which one of the jets points close to the line of sight of the observer, is referred to as blazars. Due to the peculiar orientation of the blazar jets, their emission undergoes relativistic Doppler boosting and beaming [1,2]. As a consequence, the intrinsic emission from blazars is strongly enhanced and the characteristic timescales are shortened for an observer on Earth. As a result, blazars are observed to exhibit distinct observational features such as rapid and large amplitude flux variability on most timescales across the electromagnetic spectrum, spectral changes (harder-when-brighter), strong and variable optical polarization, variable high energy (HE; E > 30 MeV) γ -ray emissions, and apparent superluminal motion [11,12,13,14,15,16,17,18]. The intensity amplification effects make even faint blazars detectable in the multi-wavelength observations. Thus, blazars are the ideal laboratories to probe the physics properties of AGNs and study the growth and evolution of SMBHs using the measurements of their broadband emission [19].
The broadband spectral energy distribution (SED) of blazars typically exhibits two characteristic broad humps. The first hump, peaking at low energies in radio to UV/soft X-ray, is produced by the synchrotron emission from the population of relativistic electrons in the presence of jet magnetic field. The origin of the second hump, which peaks in the γ -ray band is not well understood. It is often attributed to inverse Compton (IC) up-scattering of low energy seed photons by the relativistic jet electrons in the emission region. The seed photons for the IC process may be the synchrotron photons produced within the jet (synchrotron self Compton or SSC [20]) or thermal photons (UV/IR) originating from various components such as accretion disk, broad line region (BLR) and dusty torus (DT) external to the jet. These processes are referred to as external Compton (EC) for HE and VHE emissions in blazars [21,22]. Alternatively, hadronic models involving the ultra-relativistic protons and higher jet magnetic field are invoked to explain the observed VHE emission through proton synchrotron, photo-hadronic interactions, and subsequent meson decay [23,24,25].
Blazars are historically classified into two categories: Flat Spectrum Radio Quasars (FSRQs) and BL Lacertae Objects (BL Lacs), on the basis of strength, visibility, and rest-frame equivalent width (EW) of the emission/absorption lines in their optical continuum [26]. FSRQs are characterized by strong and broad emission lines with EW > 5 Å while BL Lacs have typically weak or no emission lines. Another classification of blazars is also proposed on the basis of the known features of double-hump structures in their broadband SEDs. The position of the low energy hump or synchrotron peak distinguishes the blazars as Low Synchrotron Peak (LSP), Intermediate Synchrotron Peak (ISP), and High Synchrotron Peak (HSP) objects [27,28,29]. For LSP blazars, the synchrotron peak frequency of ≤ 10 14 Hz, corresponds to the radio to infrared regime. ISP blazars have synchrotron peak frequency in the range 10 14 10 15 Hz, which lies in the optical/UV regime. Finally, HSP blazars exhibit the synchrotron peak frequency above 10 15 Hz, corresponding to the X-ray regime. Further, the high-energy hump or Compton peak of BL Lacs is equally luminous as the low-energy synchrotron peak and is attributed to the SSC process. Whereas in the case of FSRQs, the Compton peak is more luminous than the synchrotron peak and is generally ascribed by the EC process. Also, the accretion disc in FSRQs is more radiatively efficient than that in BL Lacs [2,6]. This provides a more physical distinction between the blazar subclasses. The population study of a large sample of blazar SEDs indicates a so-called blazar sequence, which characterizes an empirical inverse relationship between the bolometric γ -ray luminosity and the synchrotron peak frequency [30,31]. This implies that the synchrotron peak frequency is anti-correlated with the ratio of Compton to synchrotron peak (Compton dominance), i.e., as the bolometric luminosity increases synchrotron peak frequency decreases. According to this, FSRQs exhibit the lowest synchrotron peak frequency and highest bolometric luminosity whereas HSP blazars have the lowest bolometric luminosity. It means FSRQs and BL Lacs can be quantified as high and low-power blazars, respectively. Also, this empirical observation feature suggests that accretion and blazar jet powers are related, and BL Lacs with heavier black holes and FSRQs with lighter black holes have the same γ -ray luminosity [32,33,34]. The origin of the blazar sequence has not been fully understood yet and is generally attributed to the differences in the electron cooling efficiency or Doppler boosting [35,36].
In recent years, a class of high-z blazars has acquired particular importance in the field of blazar research [37,38]. The GeV–TeV photons emitted from these sources suffer from partial attenuation during their propagation due to the interaction with low energy extragalactic background light (EBL) via γ γ pair production [39,40]. In this study, we mainly focus on the investigation of the physical properties of high-z blazars using publicly available data from broadband observations and SED modeling in the literature. The paper is organized as follows: A brief overview of the high redshift γ -ray blazars is given in Section 2. In Section 3, we describe the data sample used in this work and discuss the results in Section 4. A summary of this study and future prospects of high-z blazars are presented in Section 5.

2. High-z Blazars

We use a purely arbitrary definition of z > 0.4 , in the present work, for characterizing the high redshift γ -ray blazars in the sky. However, this definition can be supported by the phenomenological evidence that beyond z > 0.4 the imprints of EBL absorption start becoming dominant in the HE γ -ray spectra measured by the Large Area Telescope on the Fermi spacecraft (Fermi-LAT) in the energy range above few tens of GeV [41]. At these redshifts, the effects of cosmological evolution on structure formation and HE γ -ray propagation also becomes important. Thus, high-z γ -ray blazars detected by the Fermi-LAT are ideal tools to probe the early epochs in the evolution of the Universe as their bolometric luminosity is dominated by the HE emission [37,38,42,43,44,45,46]. The host galaxies of these sources are generally observed to host extremely massive black holes ( M B H > 10 9 M ) at their center. Therefore, high-z blazars can constrain the mass function at the high end of SMBHs and provide a theoretical understanding of the growth and evolution of black holes over cosmic time [47]. Thus, on account of being a bright HE γ -ray source, blazars at high redshift are ideal objects for exploring the energetics and emission mechanisms under extreme conditions, setting strong constraints on the EBL intensity, and shedding light on the formation and growth of SMBHs in the early Universe and also their connection with the powerful relativistic jets. The detection and understanding of the physical properties of a few high-z blazars in a given redshift bin enable us to infer the total density and behavior of radio-loud AGNs in that redshift bin because for each blazar with the Bulk Lorentz factor ( Γ 10–20) of the plasma within the jet, there must exist 2 Γ 2 sources sharing the same properties but appearing different due to their jet pointing elsewhere [43]. This complements the independent estimation based on AGNs with misaligned jets. Therefore, it is important to identify and study the high redshift blazars to understand the cosmic evolution of SMBHs. Recent radio observations have reported the discovery of the most distant blazar P S O J 0309 + 27 located at a redshift of z 6.1 when the age of the Universe was less than ≈1 billion years [48]. Its central engine is found to be a black hole of mass 1.45 0.89 + 1.89 × 10 9   M with a bolometric luminosity of 8 × 10 46 erg s 1 . This corresponds to a seed black hole mass of 10 6 M at z = 30 (when the first stars and galaxies are thought to have formed ≈ 15 million years after the Big Bang) [46]. Such a rapid growth of SMBHs from the early stars has serious implications on various evolution models for the SMBHs in the jetted AGNs across cosmic time [43,49,50,51,52,53].

3. Data Set

In this study, we have used publicly available data in the literature. A brief description of the data set, obtained mainly from 3 sources, is given below:
  • 4LAC-DR3 Blazars Catalog: The fourth catalog of AGNs detected by the Fermi-LAT (4LAC), derived from the third data release (DR3) of the 4FGL catalog based on 12 years of γ -ray data in the energy range above 50 MeV, provides measurements of spectral parameters, SEDs, yearly light curves, and associations for all sources [54,55]. We consider both low and high Galactic latitude sources of blazar type (i.e., BL Lacs, FSRQs, and Blazar Candidates of Uncertain types (BCUs)). Out of 3743 blazar-type sources, only 1811 have redshift measurements. Among 1811 blazars with known z, there are 875 BL Lacs, 792 FSRQs and 144 BCUs.
  • Blazar Central Engines Catalog: The central engine properties like black hole mass ( M B H ) and accretion disk luminosity ( L d i s k ) have been reported in literature [56] for 674 emission line blazars and 346 absorption line blazars observed with the Fermi-LAT. For these 1030 blazars, the values of M B H and L d i s k are derived using optical spectroscopic line features reported either in the 16th data release of the Sloan Digital Sky Survey (SDSS-DR16) [57]) or from the NASA/IPAC Extragalactic Database (NED) (https://ned.ipac.caltech.edu/, accessed on 6 March 2024) and SIMBAD Astronomical Databases (http://simbad.cfa.harvard.edu/simbad/, accessed on 6 March 2024). It is important to note that since M B H values are derived from the scaling relations with line features, high correlations are expected between M B H and L d i s k . In our present study, we have ignored 4 blazars whose L d i s k values are unusually low ( < 10 10 erg s 1 ).
  • Blazar Emission Regions Catalog: Recently, Fan et al. (2023) [58] have studied the properties of emission zones using the SED fitting results of more than 2700 blazars reported in [59]. This large sample contains 1791 sources with known z (750 FSRQs, 843 BL Lacs and 198 BCUs). The catalog reports derived values of the magnetic field (B) in the emission region, energy density of electrons ( U e ) and magnetic field energy density ( U B ) from the SED fitting. For such blazars, we have collected the luminosities of γ -ray at 1 GeV (log L γ ), X-ray at 1 keV (log L X ), optical at 2.43 × 10 14 Hz (log L O ) and radio at 1.4 GHz (log L R ) from [60].
The blazar central engines catalog is a subset of the blazar emission regions catalog. And, both catalogs are subsets of the 4LAC-DR3 blazars catalog as they only include 4LAC-DR3 catalog sources with known redshift. Therefore, blazar central engines catalog (1026 sources) ⊆ blazar emission regions catalog (1791 sources) ⊆ 4LAC-DR3 blazars catalog (1811 sources).

4. Results and Discussion

4.1. Redshift Distribution

The measured z-distribution of blazars listed in the 4LAC-DR3 blazars catalog is shown in the left panel of Figure 1. The two blazar-subclasses, BL Lacs and FSRQs, show different z-distributions. The distribution of BL Lacs typically peaks around a median redshift value of z 0.31 and is relatively narrow with a standard deviation of σ 0.39 . Whereas, the distribution of FSRQs peaks around a median of z 1.11 and is broader with σ = 0.66 . The BCUs with relatively flatter distribution occupy the space between BL Lacs and FSRQs. The z-values play an important role in the classification of BCUs in the two subclasses of blazars [61]. The right panel of Figure 1 shows the populations of BL Lacs, FSRQs, and BCUs in different redshift regions. It is observed that in the low-z region, the blazar population is mostly dominated by BL Lacs (∼80%) and few FSRQs (13%) and BCUs (7%). In the high-z regime, FSRQs dominate the blazar population with 62% contribution whereas BL Lacs (30%) and BCUs (8%) correspond to the remaining 38% population. Thus, BL Lacs are typically located in the nearby universe, within a physical distance of about 2–3 billion light-years, whereas FSRQs are found at longer distances than BL Lacs, and may be associated with more distant and younger galaxies. The exact cause of these redshift distributions is not well understood, yet many explanations have been proposed in the literature. The first explanation is the selection bias in observations, i.e., BL Lacs are low luminous sources and it is very difficult to detect them at high redshifts. Even if they are detected, measurement of their redshift is challenging due to their line-less optical spectra [29,62]. Thus, the population of BL Lacs is less numerous at higher redshifts. As only strongly luminous sources can be detected in the high-z regime, FSRQs being intrinsically more luminous than BL Lacs dominate the high redshift Universe. The second explanation is that FSRQs evolve into BL Lacs over cosmological timescales. Therefore, high-z sources (early and young sources) are FSRQs and they evolve into BL Lacs, which are found at lower redshifts [6,42,63]. The highest redshift BL Lacs and FSRQ, detected by the Fermi-LAT, are 4FGL J1219.0+3653 and 4FGL J1510.1+5702 (with radio association of NVSS J151002+570243) located at z 3.59 and z ≈ 4.31, respectively [64,65]. They correspond to a population of blazars existing just a few billion years after the Big Bang.

4.2. γ -ray Spectral Features

For the spectral study, we consider sources reported in the 4LAC-DR3 blazars catalog with a detection significance (’Signif_Avg’ in the Fermi catalog) of more than 10 σ in the energy range 100 MeV–1 TeV. There are 1111 such sources comprising 535 BL Lacs, 521 FSRQs, and 55 BCUs. In this catalog, the observed γ -ray flux points (i.e., without taking EBL attenuation into account) have been fitted with both Power-Law (PL)
d N d E = K E E o Γ
and Log Parabola (LP)
d N d E = K E E o α β ln ( E / E o )
spectral models. Here, K is the flux density (erg cm 2 s 1 ), E o is the pivot energy (in MeV) at which the error in differential flux is minimal, Γ is PL spectral index, α is LP index and β is the LP curvature parameter. For a fair comparison, we have calculated the modified LP index ( α ) by computing the slope of the LP spectrum at energy 1 GeV/(1 + z). This energy corresponds to the photon energy of 1 GeV in the source rest frame. Therefore, α represents the slope of the observed spectrum at the energy corresponding to 1 GeV in the source frame. Left panels in Figure 2 show distributions of Γ , α and β for high and low-z blazars. The two sample Kolmogorov–Smirnov (K-S) test results in p-values of ≈0 for all three parameters. This suggests that distributions of Γ , α , and β parameters are intrinsically different for high and low-z blazars. A Gaussian fit to these distributions gives mean and standard deviation, μ ± σ , values of 2.33 ± 0.25 (2.02 ± 0.23), 2.10 ± 0.39 (1.84 ± 0.38), and 0.11 ± 0.07 (0.07 ± 0.7) for Γ , α and β , respectively, in case of high-z (low-z) blazars. The right panels in Figure 2 depict variations of these parameters as a function of (log (1 + z)). Pearson correlation analysis shows that Γ , α and β parameters are positively correlated with (log (1 + z)) with the correlation coefficient ( ρ ) values of 0.6, 0.33, and 0.34, respectively, and p-values of ≈0. Therefore, blazars at higher redshifts will have softer γ -ray spectra (higher values of Γ and α ) and with more curvature (higher values of β ) than low-z blazars. Similar correlations have also been obtained between BL Lacs and FSRQs in the literature [54,66]. This may be the manifestation of the underlying particle spectrum involved in the HE emission (detail discussion in Section 4.7) and absorption of HE γ -ray photons by EBL via γ - γ pair production during their propagation from source to the observer [67,68]. The absorption probability of HE photons traveling over cosmological distances is characterized by optical depth ( τ ) or opacity, which strongly depends on z, γ -ray photon energy (E) and density of EBL photons [39,69]. The EBL absorption effects start dominating at energies above 30 GeV for redshifts beyond z > 0.4 [41]. Therefore, the intrinsic (emitted) γ -ray spectrum of the source gets modified and the observed spectrum is given as
d N d E o b s = d N d E i n t e τ ( E , z ) .
For high-z blazars, τ will be large due to strong EBL absorption. Therefore, the observed photon spectrum will be soft with more curvature [70,71]. Hence, the detection and accurate measurements of HE and VHE spectra of high-z blazars are important (as they will have an imprint of EBL absorption effects) in constraining the EBL energy density in extragalactic space [39,72].

4.3. Luminosity Features

For luminosity studies, we have selected sources from the blazar emission regions catalog. Out of 1791 sources in the catalog, 1789 have γ -ray luminosities ( L γ ) at 1 GeV, 1030 have X-ray luminosities ( L X ) at 1 keV, 1059 have optical luminosities ( L O ) at 2.43 × 10 14 Hz and 1581 have radio luminosities ( L R ) at 1.4 GHz. The left panels in Figure 3 show distributions of log L γ , log L X , log L O and log L R for high and low-z blazars [60]. The right panels represent variations of these parameters as a function of luminosity distance ( D L ) measured in Mega-parsec (Mpc). Note that, D L is a function of z. A Gaussian fit to the distributions of log L γ , log L X , log L O , and log L R gives μ ± σ values of 45.80 ± 0.89 (43.78 ± 0.86), 45.20 ± 0.72 (44.01 ± 0.88), 45.65 ± 0.67 (44.41 ± 0.52), and 42.91± 0.89 (41.0 ± 0.92) for high-z (low-z) blazars, respectively. We observe that, in all the wavebands considered above, high-z blazars are at least an order of magnitude more luminous than low-z blazars. All the luminosities log L γ , log L X , log L O , and log L R show strong positive correlations with log D L having corresponding ρ values of 0.90, 0.77, 0.85, and 0.85, respectively. We also perform a linear regression analysis of the scatter plots of these luminosities vs log D L . The slopes of linear regression indicate that observed L γ , L X , L O and L R vary as ∼ D L 2.27 , D L 1.47 , D L 1.51 and D L 2.14 , respectively. As mentioned in Section 4.1, these observed features are consistent with the fact that high-z sources with strong luminosity can only be detected due to selection bias. The high-z regime is dominated by FSRQs, which are intrinsically more luminous than BL Lacs, which are mostly observed at lower redshifts. Thus, high-z blazars (mostly FSRQs) are the most luminous sources observed in the sky across all wavebands.

4.4. Broadband SED Properties

We investigate the broadband SED properties using the sources in blazars central engines catalog. This catalog contains typical SED characteristics like synchrotron peak frequency ( ν s y n ), inverse Compton (IC) peak frequency ( ν I C ), energy fluxes at synchrotron ( ν F ν , s y n ) and IC ( ν F ν , I C ) peak frequencies and Compton-Dominance parameter ( C D = ν F ν , I C / ν F ν , s y n ). For fair comparisons, we estimated ν s y n and ν I C in the source frame by multiplying them with a factor (1 + z). The left panels in Figure 4 show the histogram distributions of ν s y n , ν I C , ν F ν , s y n , ν F ν , I C and C D for high and low-z blazars. The right panels in Figure 4 depict variations of these parameters with redshift (log (1 + z)). The two sample K-S test between high and low-z blazars results in p-values of ≈0 for all the parameters. This suggests that the histogram distributions of these parameters are intrinsically different for high and low-z blazars. A Gaussian function fit to the distributions of ν s y n , ν I C , ν F ν , s y n , ν F ν , I C and C D gives μ ± σ values of 13.42 ± 1.04 (15.32 ± 1.46), 22.00 ± 1.07 (23.53 ± 1.68), −11.90 ± 0.45 (−11.65 ± 0.46), −11.42 ± 0.55 (−12.05 ± 0.60) and 0.48 ± 0.50 (−0.4 ± 0.40) for high-z (low-z) blazars, respectively. The Pearson correlation analysis indicates that ν s y n and ν I C are anti-correlated with log (1 + z). Whereas, ν F ν , I C is positively correlated with log (1 + z) with ρ =0.46. However, a weak anti-correlation is observed between ν F ν , s y n and log (1 + z) with ρ = −0.34. C D has a strong positive correlation with log (1 + z). This is broadly consistent with the blazar sequence since at high-z only the higher luminosity objects can be detected, and their peak frequencies are shifted to lower values with increasing C D . Therefore, high-z blazars are mostly LSP blazars, and their HE hump typically peaks at MeV energies just below the energy range covered by the Fermi-LAT. Their X-ray spectrum is harder and it usually corresponds to the rising part of the HE hump. Being strong and bright X-ray emitters, they are sometimes called MeV blazars [50,73]. The observations in the hard-X-ray band are ideal to detect the high-z blazars. Also, due to the low synchrotron peak frequency (typically in radio/IR waveband), the accretion disk emission is visible in the optical-UV region for most of the high-z blazars. Therefore, disk luminosity and black hole mass can be estimated by modeling the accretion disk emission [74]. It is interesting to notice the variation of ν s y n with respect to log (1 + z) in the top right panel of Figure 4. The low-z blazars show large variation in ν s y n (from 10 12 Hz to 10 19 Hz) making a vertical branch, whereas high-z blazars show little variation in ν s y n (from 10 12 to 10 14 Hz) making a horizontal branch in the scatter plot. Consequently, we have a bimodality in the top left panel of Figure 4. This is in agreement with a recent blazar sequence study [31] in which it has been observed that the synchrotron peak variation is mostly observed in BL Lacs and is insignificant in FSRQs. Since we mostly have BL Lacs at low-z and FSRQs at high-z in the data sample, a bimodality is obtained in the distributions of ν s y n and two branch feature in the variation of ν s y n with log (1 + z) in Figure 4.

4.5. Central Engine Properties

The blazar central engine consists of an SMBH at the center and an accretion disk surrounding it. It is characterized by the mass of SMBH ( M B H ), accretion efficiency ( η ), and accretion disk luminosity ( L D i s k ). The sources in the blazar central engines catalog are considered for this study. The left panel in Figure 5 shows distribution of M B H values for high and low-z blazars. In both the cases, M B H values range from ∼2.5 × 10 6 M to ∼1.75 × 10 10 M . The average M B H values for high and low-z blazars are similar with 〈log M B H , Low - z log M B H , High - z 8.6 and standard deviations are 0.54 and 0.68, respectively, when fitted with a Gaussian function. A two sample Kolmogorov–Smirnov (K-S) test is performed to see whether the two populations of M B H values are derived from the same parent population. The obtained p-value of 0.11 suggests that there is a high probability both samples belong to the same parent source population. However, their correlations with z are different as discussed below.
The right panel in Figure 5 shows the scatter plot of log M B H and log (1 + z) for high and low-z blazar populations. Overall, for the total blazar population, there is a very weak correlation between log M B H and log (1 + z) as indicated by ρ = 0.16 with p-value of 2.88 ×   10 7 . However, by considering only high-z blazars, the correlation becomes relatively strong with ρ = 0.41 and p-value of 3.89 × 10 28 . It suggests that more massive central black holes are associated with high-z blazars. This is likely due to selection bias in observations, as at high redshift only the most luminous (blazars with more massive black holes) sources can be detected. However, for low-z blazars, there is very weak anti-correlation between log M B H and log (1 + z) with ρ = −0.23 and p-value of 1.75 × 10 5 . Although the K-S test suggests that there is a high probability that M B H values of low and high-z blazars belong to the same parent population, their correlations with z are different in low and high-z regimes. Therefore, M B H values of low and high-z blazars may not belong to the same source population.
To study the accretion disk properties, we consider the sources in the blazar central engines catalog. We have excluded 342 sources from this catalog as only upper limit values for L D i s k are reported. The upper left panel in Figure 6 shows the histogram distributions of L D i s k for blazars included in this study. p-value of 2.08 ×   10 26 obtained from the two sample K-S test indicates that the distributions for low and high-z blazars are significantly different and belong to different parent distributions. A Gaussian function fitting to the distributions gives the mean values of log L D i s k (〈 log L D i s k ) as 45.75 and 44.48 with standard deviations of 0.67 and 0.86 for high and low-z blazars, respectively. Therefore, in general, high-z blazars (〈 L D i s k , High - z 5.6   ×   10 45 erg s 1 ) have one order of magnitude higher accretion disk luminosity than low-z blazars (〈 L D i s k , Low z 3.0   ×   10 44 erg s 1 ). The upper right panel in Figure 6 shows the variation of log L d i s k as a function of log (1 + z). The Pearson correlation analysis suggests a strong positive correlation between the two parameters with ρ = 0.67 and p-value of 1.28 × 10 82 . Also, the linear regression analysis of the scatter plot gives the slope of line m = 3.3 ± 0.15. Thus, the observed L D i s k broadly varies as ∼ ( 1 + z ) 3.3 .
We also calculate the Eddington ratio ( λ E d d = L D i s k / L E d d ) using the definition of Eddington luminosity as L E d d = 1.26 × 10 38 ( M B H / M ) erg s 1 . The corresponding distributions for high and low-z blazars and their variations as a function of redshift are shown in the lower left and lower right panels of Figure 6, respectively. The λ E d d distributions for high and low-z blazars are intrinsically different as indicated by the K-S test p-value of 8.74 × 10 13 . The Gaussian function fitting to the distributions with mean and standard deviation ( μ , σ ) gives (−0.92,0.46) and (−1.53,0.66) for high and low-z blazars, respectively. This implies that high-z blazars accrete the surrounding matter with a high Eddington ratio of 〈 λ E d d , High - z = 0.12 compared to the low-z blazars with 〈 λ E d d , Low - z = 0.03 . Therefore, high-z blazars have radiatively more efficient accretion disks than low-z blazars. This is also confirmed by the mild positive correlation obtained between λ E d d and log (1 + z) with ρ = 0.37 and p-value of 2.46 × 10 4 . The linear regression line in the scatter plot with m = 0.37 ± 0.10 suggests that observed λ E d d varies as ∼(1 + z) ( 1 + z ) 0.37 .
Observation of blazars with strong luminosity, radiatively efficient accretion disk, and located at high redshift is likely connected with the cosmic evolution of blazars [6,42,63]. As discussed in Section 4.1, BL Lacs dominate the blazar population at low redshifts and FSRQs at high redshifts. According to the hypothesized evolutionary scenario, the FSRQs (likely high-z blazars) evolve into BL Lacs (likely low-z blazar) over cosmological time scales. At high-z, there is likely a gaseous matter-rich environment surrounding the central black hole for accretion, hence the higher values of λ E d d . As they evolve into low-z blazars, the environment gradually gets depleted by accretion onto a black hole, the accretion disk becomes radiantly inefficient and accretion proceeds via advection-dominated flow [75]. Alternatively, the observed features can also be attributed to the selection bias effects in observations as it is difficult to detect blazars having low λ E d d and low L D i s k at high redshifts.

4.6. Dynamics of Growth of SMBHs

High-z blazars provide a unique opportunity to explore the evolution of SMBHs and the role of relativistic jets in them [51,76]. Following the detailed calculations given in [46,77], we estimate the mass of black hole seed ( M B H , s e e d ) required to produce currently observed SMBHs at a given z, assuming that it evolves with constant λ E d d and constant accretion efficiency defined as η = L D i s k / M ˙ B H c 2 during the entire evolutionary process. Accounting for the loss of accretion mass energy in the form of outgoing disk luminosity, the rate of M B H growth is given by
d M B H d t = ( 1 η ) M ˙ B H = ( 1 η ) λ E d d L E d d η c 2 = ( 1 η ) λ E d d η M B H t s
where t s is the characteristic accretion timescale (also known as Salpeter time) independent of M B H . It is given as
t s = σ T c 4 π G m p 0.45 Gyr
Therefore, required black hole seed mass ( M B H , s e e d ) for the formation of SMBH of mass M B H is given by
M B H , s e e d = M B H × exp t τ
where t is the total time available during which the seed black hole accretes and grows, τ is the characteristic e f o l d i n g timescale defined as
τ = 0.45 η λ E d d ( 1 η ) Gyr
The accretion efficiency parameter η , believed to depend on the black hole spin, can vary between 0.1–0.3 or 0.4 for slowly to rapidly spinning black holes [77,78]. We consider the sources in blazar central engines catalog for whom the classes (i.e., FSRQs, BL Lacs, or BCUs) are defined in the 4LAC-DR3 blazar catalog. For such blazars (558 FSRQs,53 BL Lacs, and 50 BCUs), we have calculated M B H , s e e d using Equation (6) by evolving them back to z = 30 (corresponding to the Universe with age less than the first 100 million years when the first stars and galaxies are assumed to have formed) [79,80]. In our calculations, we use currently observed λ E d d throughout their evolution to see if such a scenario explains the observed SMBHs. The calculations are performed for two constant accretion efficiencies of η = 0.1 and η = 0.3 [77]. For calculating t in Equation (6), we use the standard flat Λ CDM model of the Universe with parameters H 0 = 70 km s 1   Mpc 1 , Ω M = 0.30 and Ω Λ = 0.70. The final results depend on the assumptions made regarding various parameters like redshift of the seed formation, η and λ E d d .
Figure 7 shows the variations of the estimated values of M B H , s e e d as a function of log (1 + z) for η = 0.1 (left panel) and η = 0.3 (right panel). In these plots, we also show the expected mass ranges of different astrophysical objects present at z = 30 , which could have been the seeds for the formation of observed SMBHs in the centers of galaxies. They are (i) population III star black hole remnants: 10– 10 3 M (cyan color) [81,82], (ii) seeds from stellar dynamical processes: 10 3 10 4 M (gray color) [83,84,85,86,87], and (iii) direct collapse black holes: 10 4 10 6 M (green color) [88,89]. The presence of SMBHs in blazars corresponding to M B H , s e e d values lying below the horizontal line l o g M B H , s e e d = 6 in Figure 7 can be explained by the evolution of one of the 3 astrophysical seed objects mentioned above. However, a significant number of blazars lie above the line l o g M B H , s e e d = 6 , and plausible explanations for this are given below.
The left panel in Figure 7 indicates that, for η = 0.1 , about 26% of the blazar population requires more massive progenitors than what direct collapse models or stellar dynamical processes predict. This fraction goes up to ∼69% when we consider η = 0.3 (right panel of Figure 7). Therefore, high values of accretion efficiencies, i.e., high conversion rate of rest mass energy to luminous energy, are not realistic to explain the observed SMBHs. This is consistent with the similar conclusions derived in the literature [77]. Alternatively, these blazars must accrete the matter with a higher Eddington ratio than the currently observed λ E d d for a significant time during their evolution to explain the growth of observed SMBHs. Thus, the higher the η , the higher the λ E d d we need to explain the growth of the SMBHs. A major fraction of the SMBHs in BL Lacs (∼75% and ∼92% of the total BL Lacs corresponding to η = 0.1 and 0.3, respectively) require seed mass more than the expected seed mass from direct collapse models. This can be due to their observed low accretion disk luminosity and hence low Eddington ratio ( λ E d d ). Therefore, these objects must have accreted the matter with higher λ E d d during their evolution to explain the observed SMBHs. This implies that there was a conducive gas-rich environment around the central engines in their earlier growth time (high-z). These objects would have radiatively efficient accretion disks in their adulthood, meaning they were in the FSRQ phase (high λ E d d phase) and as their gas-rich environment became depleted, their accretion disk became radiatively inefficient and they evolved into BL Lacs at relatively low-z. It is evident from the figure that a significant number of high-z blazars (or radio-loud AGN) require higher mass progenitors than the currently hypothesized seed populations. Therefore, we need higher λ E d d or sometimes the occurrence of super-Eddington episodes to explain the growth of SMBHs. Such scenarios are invoked to explain the growth of SMBHs in the recently discovered high redshift AGNs J1205-0000 (z = 6.699) [90] and PSO J006+39 (z = 6.621) [91]. Although there are possibilities for super Eddington accretion episodes in gas-rich or dusty strong wind environments near the central engines [92,93], whether such episodes are sustainable or not for a significant time is an open question in the study of the growth of SMBHs at high redshifts. Another possible scenario has been proposed in the literature, where in the presence of a jet, not all the gravitation potential energy of in-falling matter is converted into luminous energy but some part of it can go to increase the magnetic field energy inside the jet, which is necessary for jet launching processes [3]. Therefore, for a given accretion efficiency, there will be fewer luminous disks and hence lower ( λ E d d ) compared to the normal accretion scenario. This implies that, in the presence of a jet, black holes grow faster with a large accretion rate without increasing the disk luminosity [73,94,95]. Cosmological simulations were also been explored to investigate the growth of seed black holes through processes other than accretion such as merger and AGN feedback [96,97]. Similar calculations and conclusions have also been reported in a recent study [46]. Hence, detection and detailed study of high-z blazars are important to understand the growth of SMBHs and their connection with relativistic jets. It is important to note that the conclusions drawn here rely on the reported values of Λ E d d , L D i s k , and M B H in the blazar central engines catalog. These values were derived from scaling relations using single-epoch optical spectra. They are indirect methods and have inherent assumptions and limitations which may lead to significant bias [98]. Therefore, the estimation of M B H from different approaches like reverberation mapping, etc., are crucial [19,99].

4.7. Properties of Emission Region

In the one-zone leptonic emission model, the emission region is mainly characterized by its magnetic field B and relativistic electron energy distribution having peak Lorentz factor γ p . We use log B and log γ p parameters reported in the blazar emission regions catalog for this study. For some sources, ranges of log B and log γ p are reported in the catalog, and we take the midpoint of the range as the value for log B and log γ p for them. The left panels in Figure 8 show the histograms of log B and log γ p for high and low-z blazars. The right panels show the variations of these parameters as a function of log (1 + z). p-values of two sample K-S tests for high and low-z distributions of log B and log γ p parameters are close to 0. This suggests that the distributions of B and γ p for high and low-z blazars are intrinsically different and belong to the same parent distribution. A Gaussian function fitting to the histograms of log B gives μ ± σ of 0.65 ± 1.68 (B = 4.46 G) and 0.04 ± 1.53 (B = 1.09 G) for high and low-z blazars, respectively. Also, there exists a mild positive correlation between B values and log (1 + z) with ρ = 0.26 and the P value of 1.24 × 10 28 . Therefore, high-z blazars require emission zones with higher magnetic fields compared to low-z blazars. The histogram distribution of log γ p for high-z blazars shows a clear double hump structure with peaks around log γ p values of 2 and 4. Similarly, the scatter plot of log γ p and log (1 + z) shows two horizontal branches around these peak values. A careful analysis suggests that these peak values actually correspond to the peak values of distributions of log γ p for all FSRQs and BL Lacs. Overall, two peaks in the histogram distributions and two branches in the scatter plots actually correspond to the FSRQs and BL Lacs, respectively. Instead of fitting the Gaussian profile to the histograms of log γ p , we calculated the arithmetic mean ( μ ) and standard deviation ( σ ) for the distributions. The μ values for high and low-z blazars are found to be 2.90 and 3.79 corresponding to peak Lorentz factors of 7.94 × 10 2 and 6.17 × 10 3 , respectively. The scatter plot shows two distinct branches corresponding to the FSRQs and BL Lacs, and there is also a mild anti-correlation between log γ p and log (1 + z) with ρ = −0.47. These results are consistent with the blazar emission models. At high redshifts, most of the sources are FSRQs and BL Lacs dominate the population at low redshifts. FSRQs contain photon-rich environments like BLR and DT owing to radiatively efficient accretion disk, and relativistic electrons quickly lose their energy by interacting with ambient photons via the IC process. Therefore, these blazars have high Compton dominance, and the electron population has low γ p . Consequently, we observe blazars with low synchrotron frequency peaked SEDs. On the other hand, BL Lacs have a photon-starved environment surrounding them. Relativistic electrons can attain high γ p in the absence of target photon fields. Therefore, their SED peak lies at higher frequencies with very low Compton dominance [6,56,58,63]. The variation of log γ p as a function of log (1 + z) also contributes to the observed behavior of spectral parameters measured by the Fermi-LAT. The higher the z, the higher the efficiency of the disk, and the higher the density of external photon fields, resulting in the electron energy distributions with lower γ p . Therefore, this can also contribute to the observed soft photon spectral indices and higher curvatures for high-z blazars.

5. Summary

In this work, we studied the properties of high-z (z > 0.4) blazars using the data available in the literature. We compared the observed properties of SEDs and derived properties of the central engines and emission zones of high and low redshift blazars. A summary of the main results obtained in this study is given below:
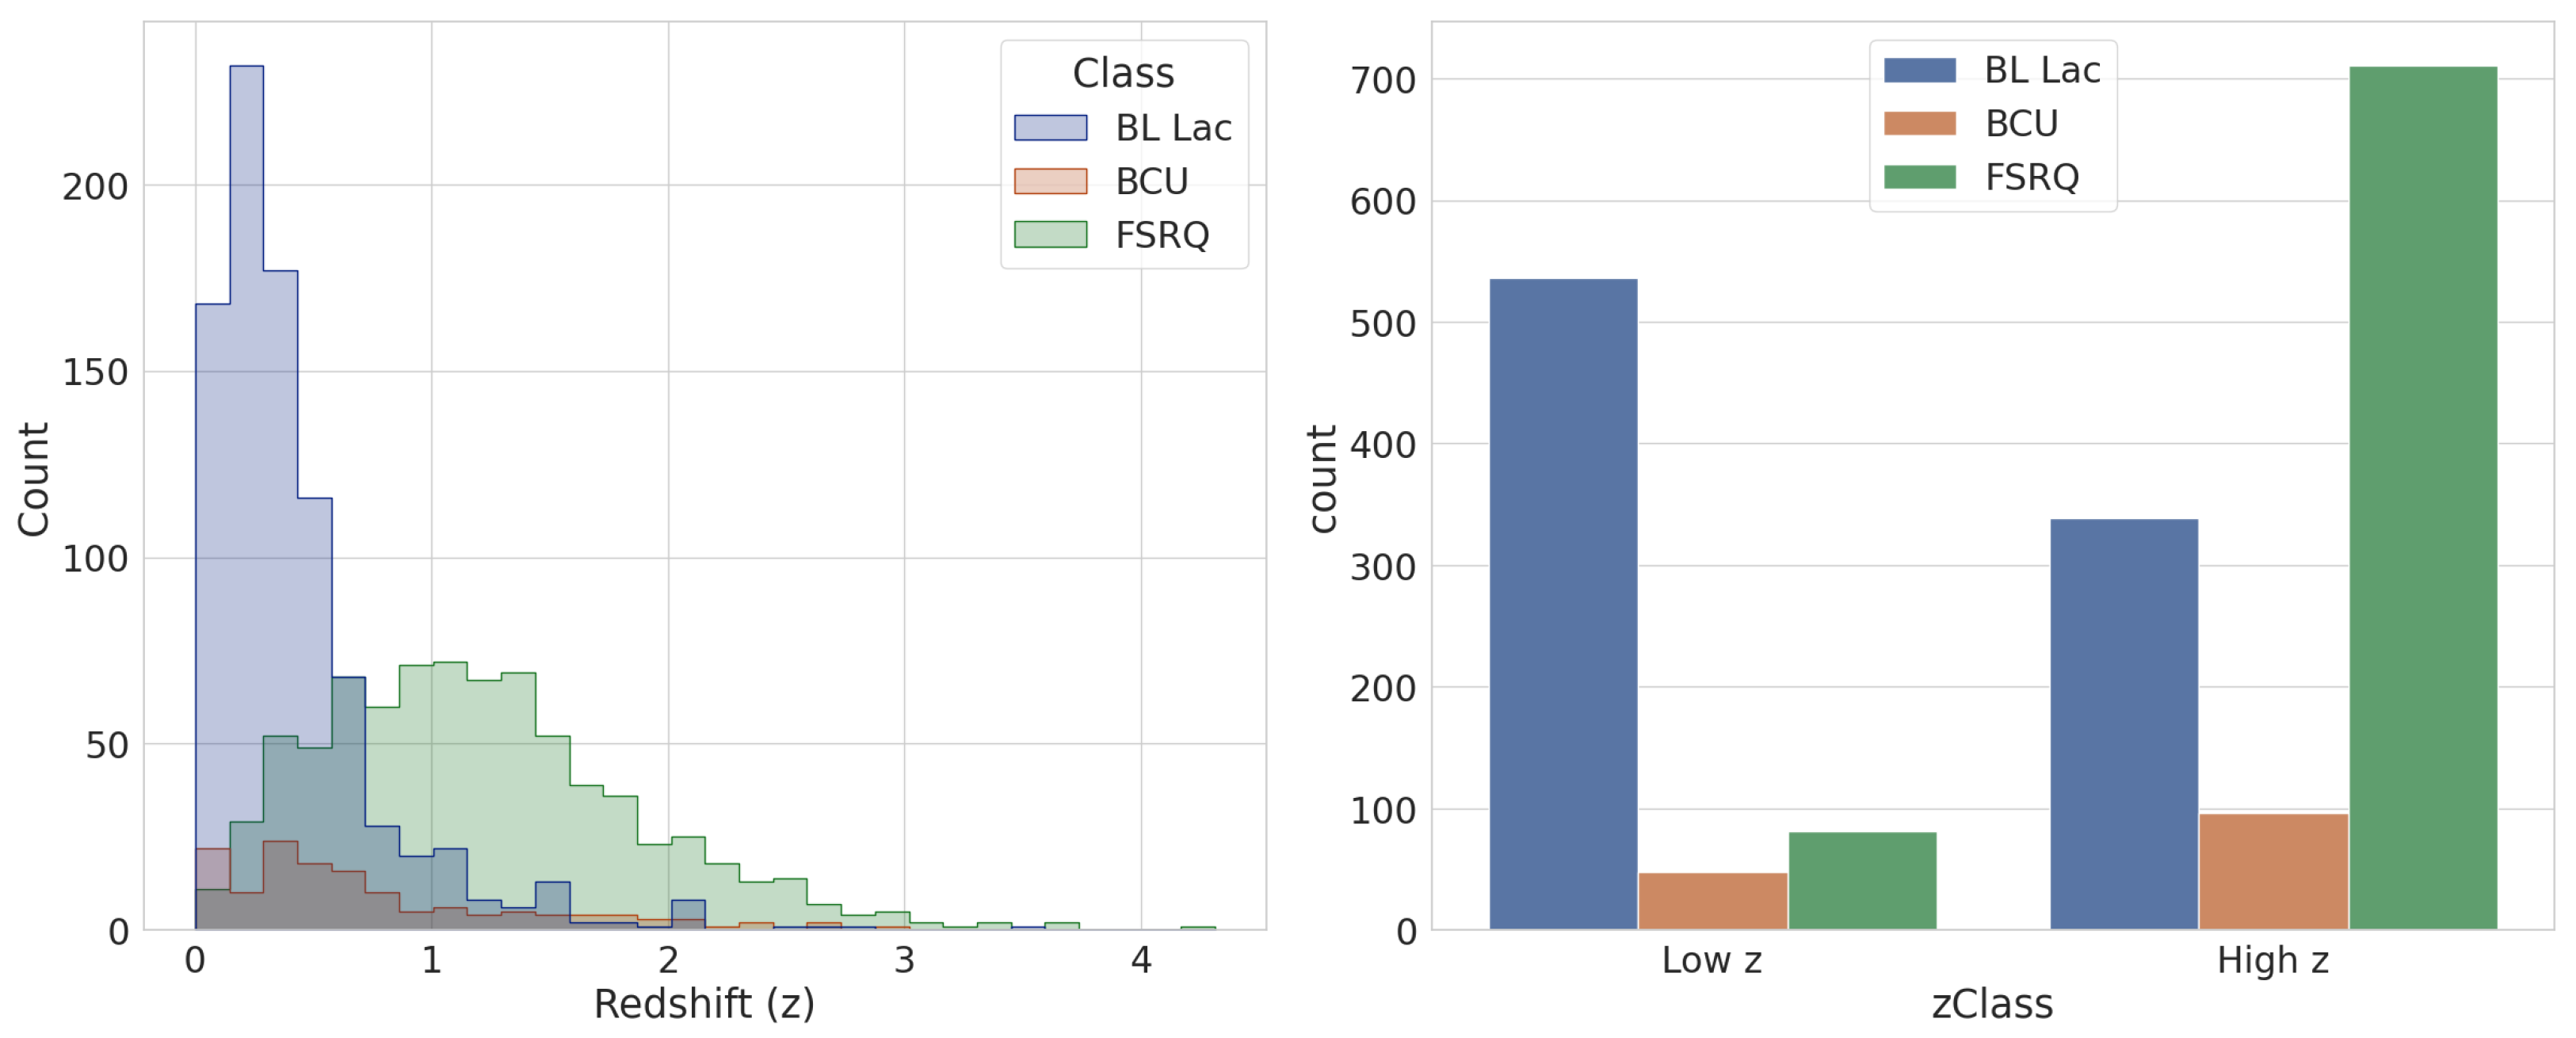
  • Redshift distribution study of 4 LAC-DR3 blazars catalog suggests that the FSRQs dominate the high-z blazar population with 62% composition followed by BL Lacs and BCUs with 30% and 8% compositions, respectively. However, in the low-z regime, BL Lacs dominate the total blazar population with 80% composition and FSRQs (13%) along with BCUs (7%) being the minority. The reasons for these anomalies are likely due to observational biases and/or due to hypothesized cosmic blazar evolution theories.
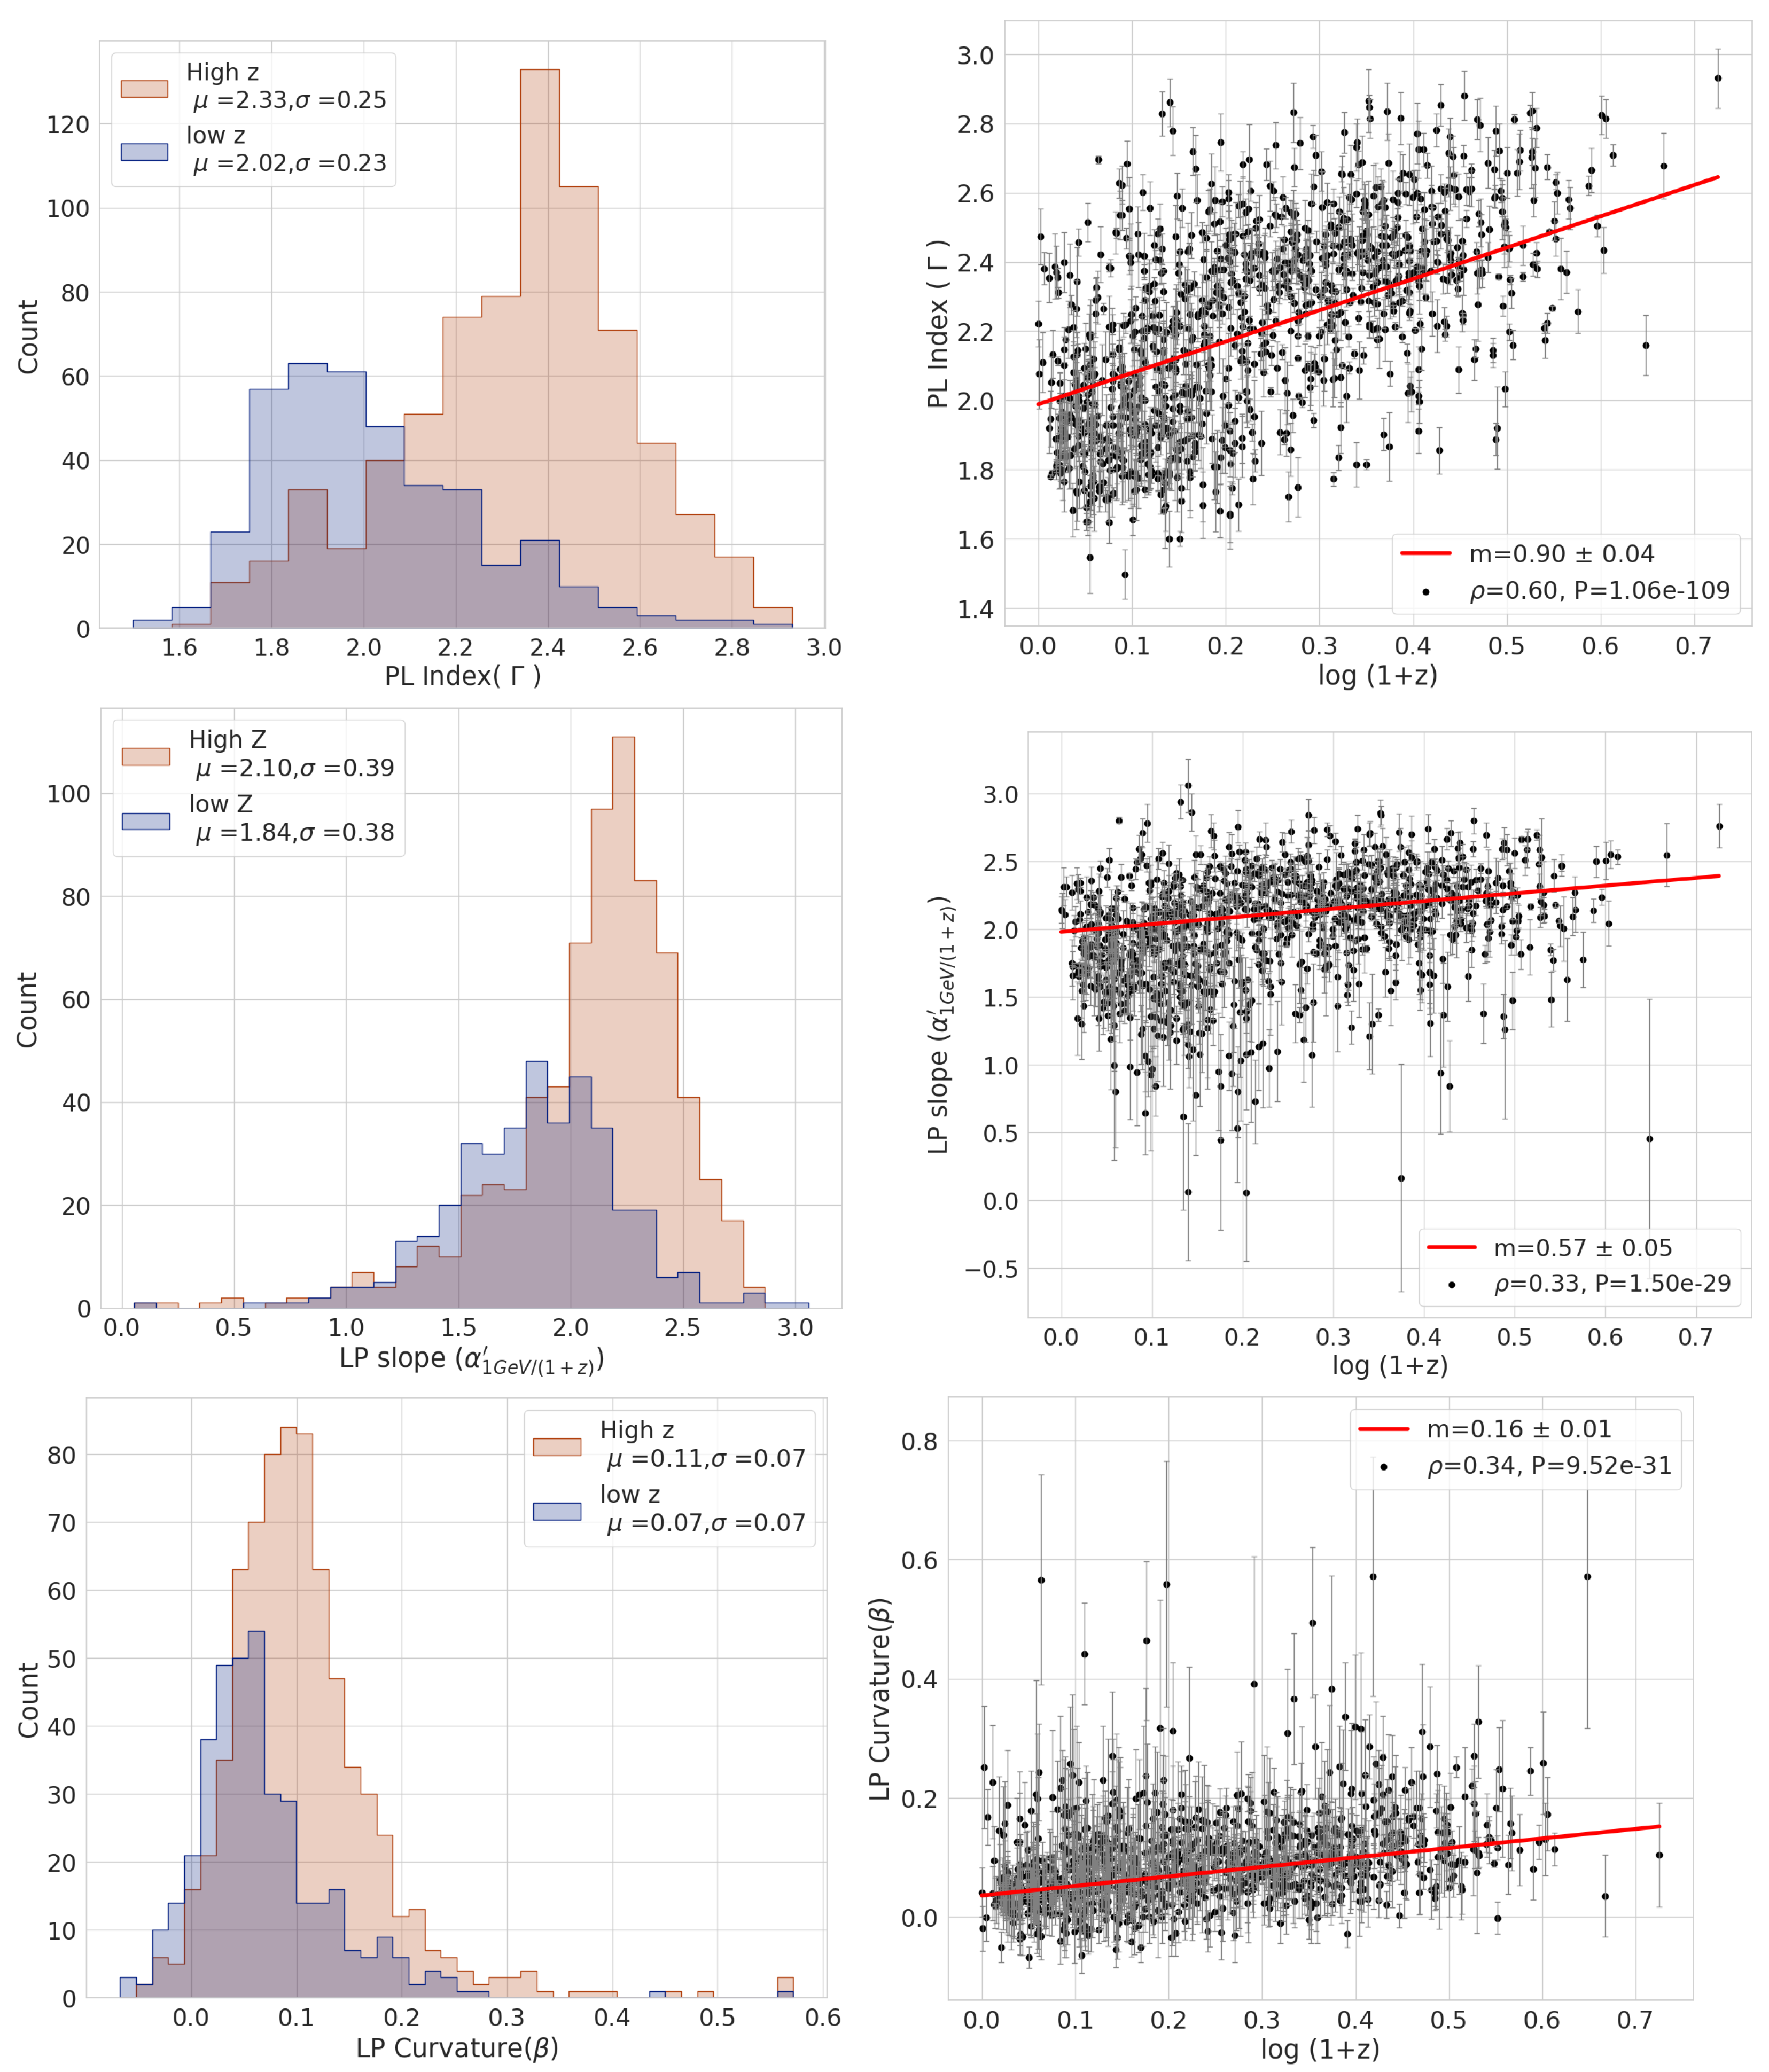
  • Observed Fermi-LAT photon spectra for the high redshift blazars are found to be softer with higher curvature compared to low redshift blazars. The histograms of PL index ( Γ ), LP slope at 1 GeV/(1 + z) ( α ) and LP curvature ( β ) roughly follow Gaussian distributions with μ ± σ values of Γ = 2.33 ± 0.25 ( 2.02 ± 0.23 ) , α = 2.10 ± 0.39 ( 1.84 ± 0.38 ) and β = 0.11 ± 0.07 ( 0.07 ± 0.07 ) for high (low) redshift blazars. Also, Γ , α and β exhibit a positive correlation with log (1 + z). This is likely due to the fact that high-z blazars suffer more EBL attenuation of HE and VHE γ photons, leading to softer γ -ray spectra than low-z blazars. Also, different spectral shapes of the underlying energy distribution of emitting particles in low and high-z blazars contribute to the observed Fermi-LAT γ -ray spectral features.
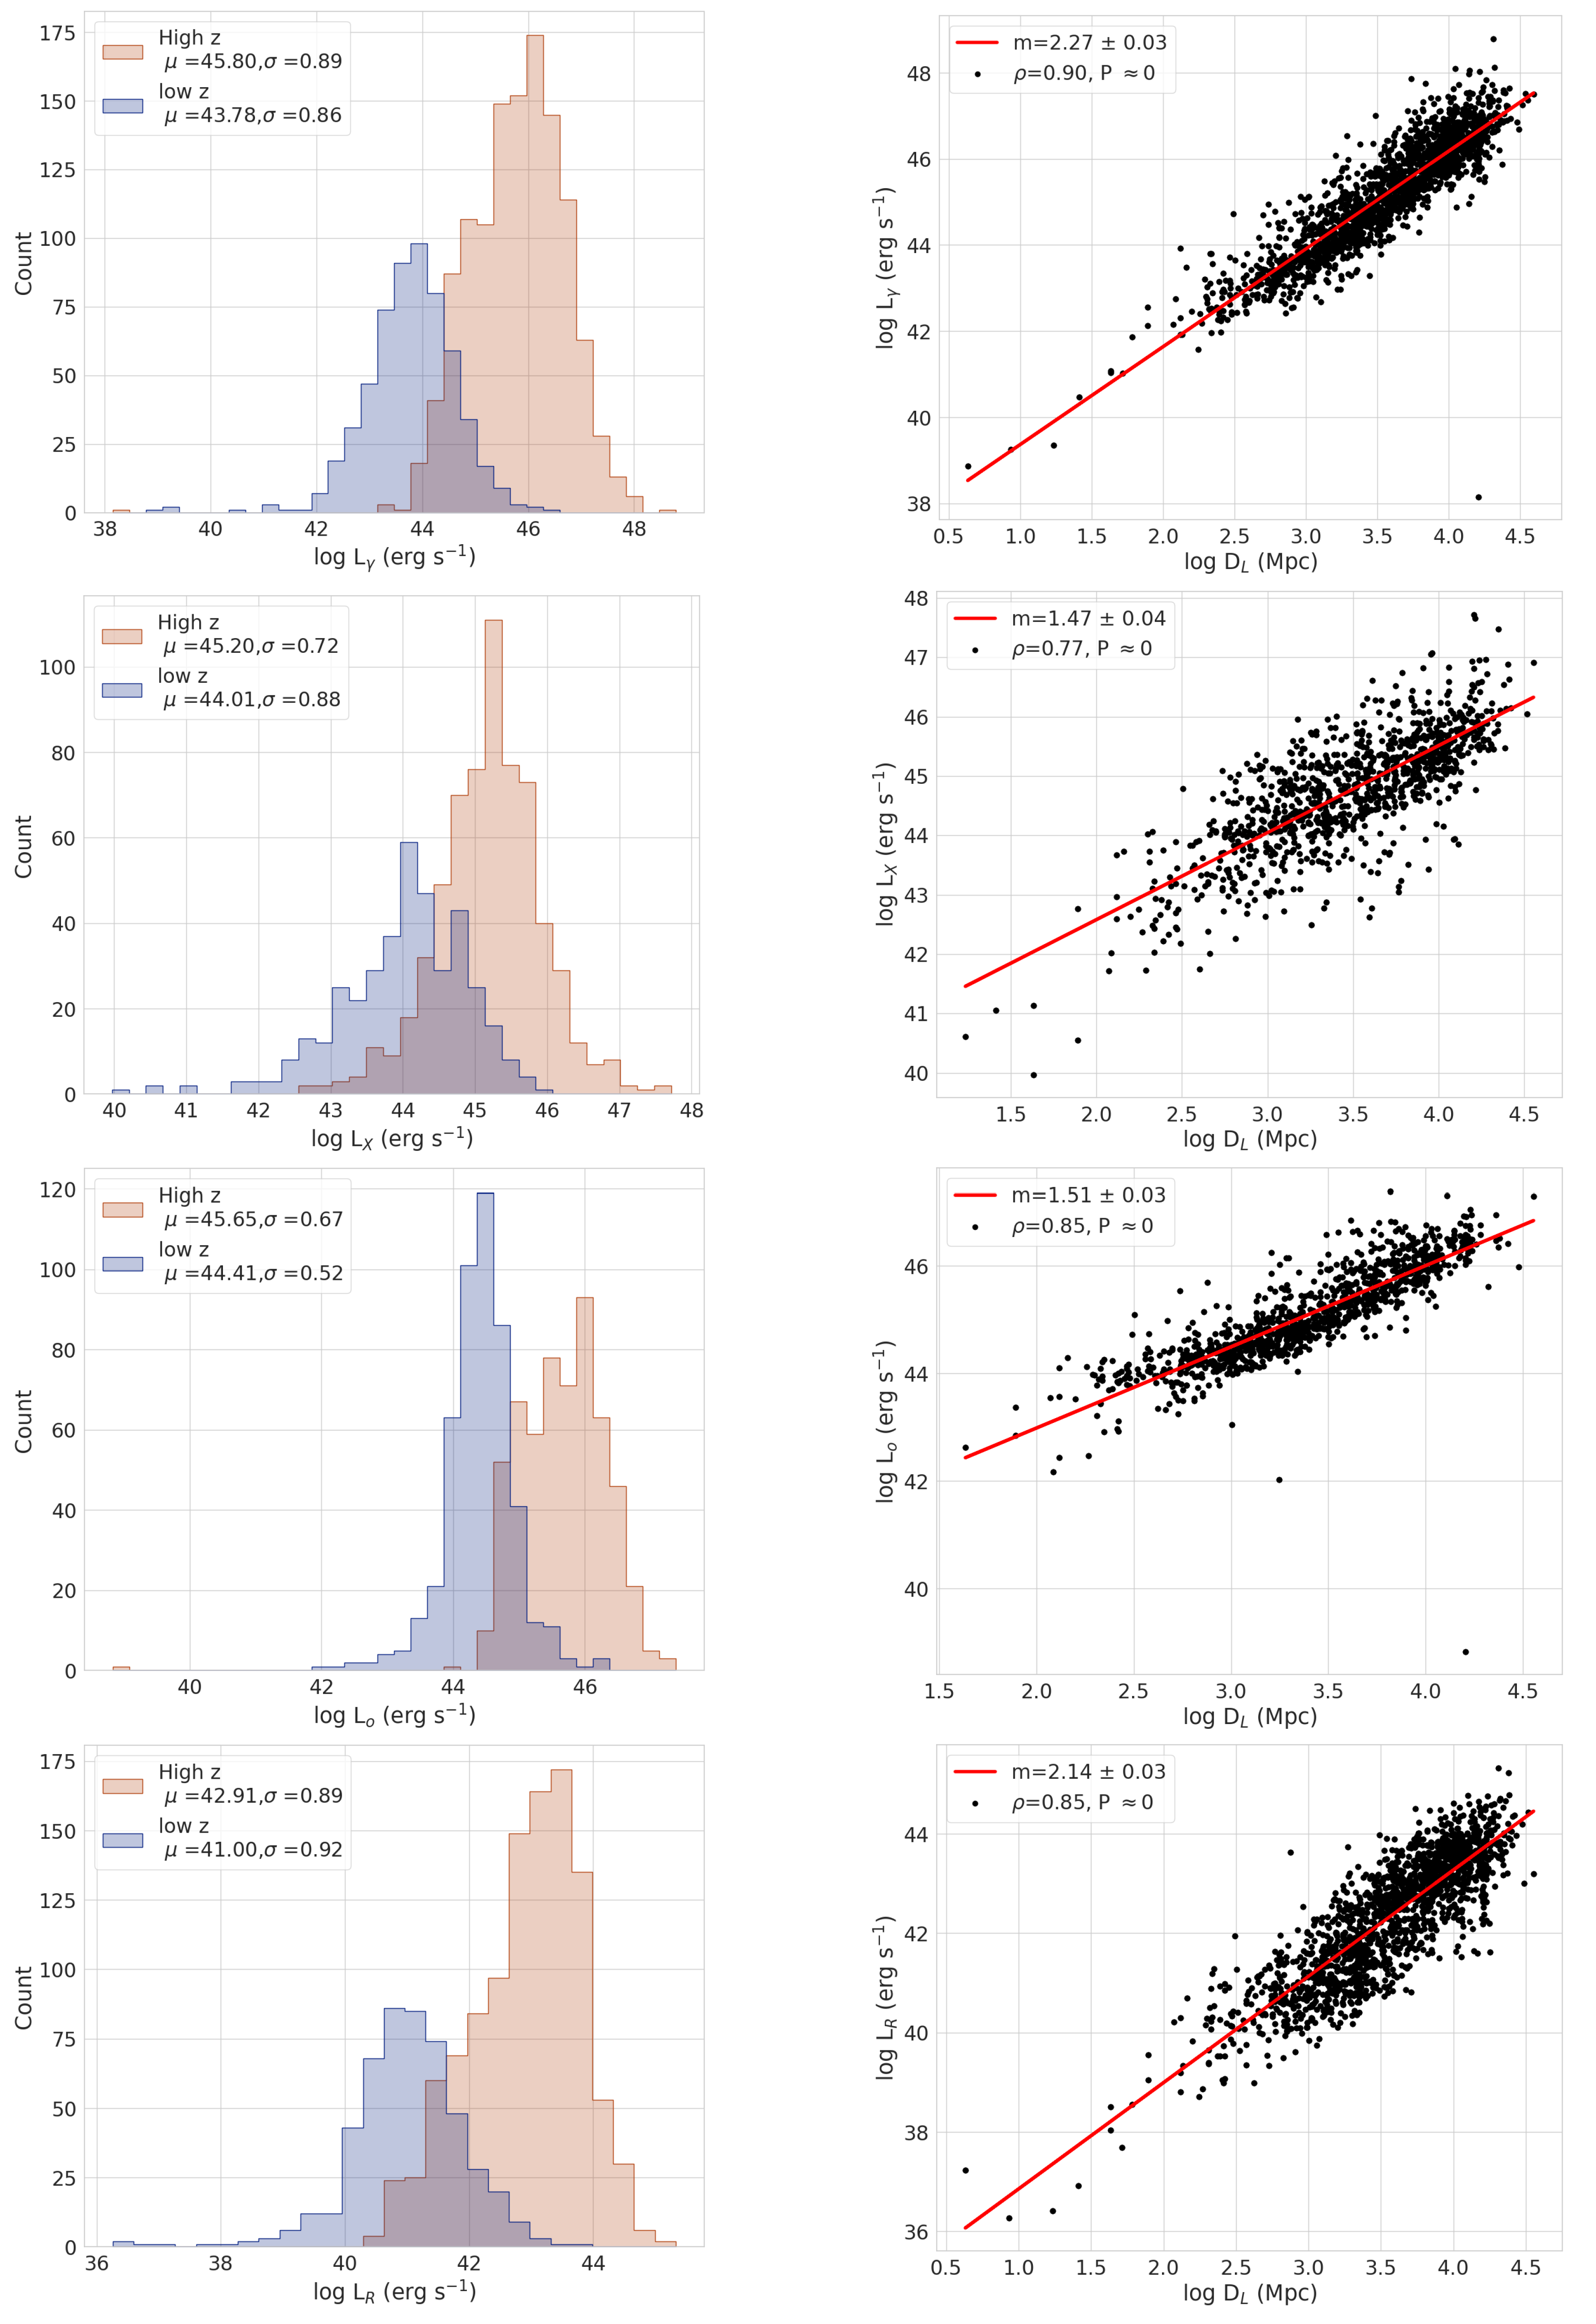
  • Observationally, high-z blazars are the most luminous objects in the γ -ray Universe. The mean γ ray, X-ray, optical and radio luminosities (in e r g s 1 ) of high (low) redshift blazars are estimated as L γ = 6.31 × 10 45 ( 6.03 × 10 43 ) , L X = 1.58 × 10 45 ( 1.02 × 10 44 ) , L O = 4.46 × 10 45 ( 2.57 × 10 44 ) and L R = 8.13 × 10 42 ( 1.0 × 10 41 ) , respectively. These luminosities have a strong positive correlation with the luminosity distance ( D L ) with functional dependencies of L γ D L 2.27 , L X D L 1.47 , L O D L 1.51 and L R D L 2.14 .
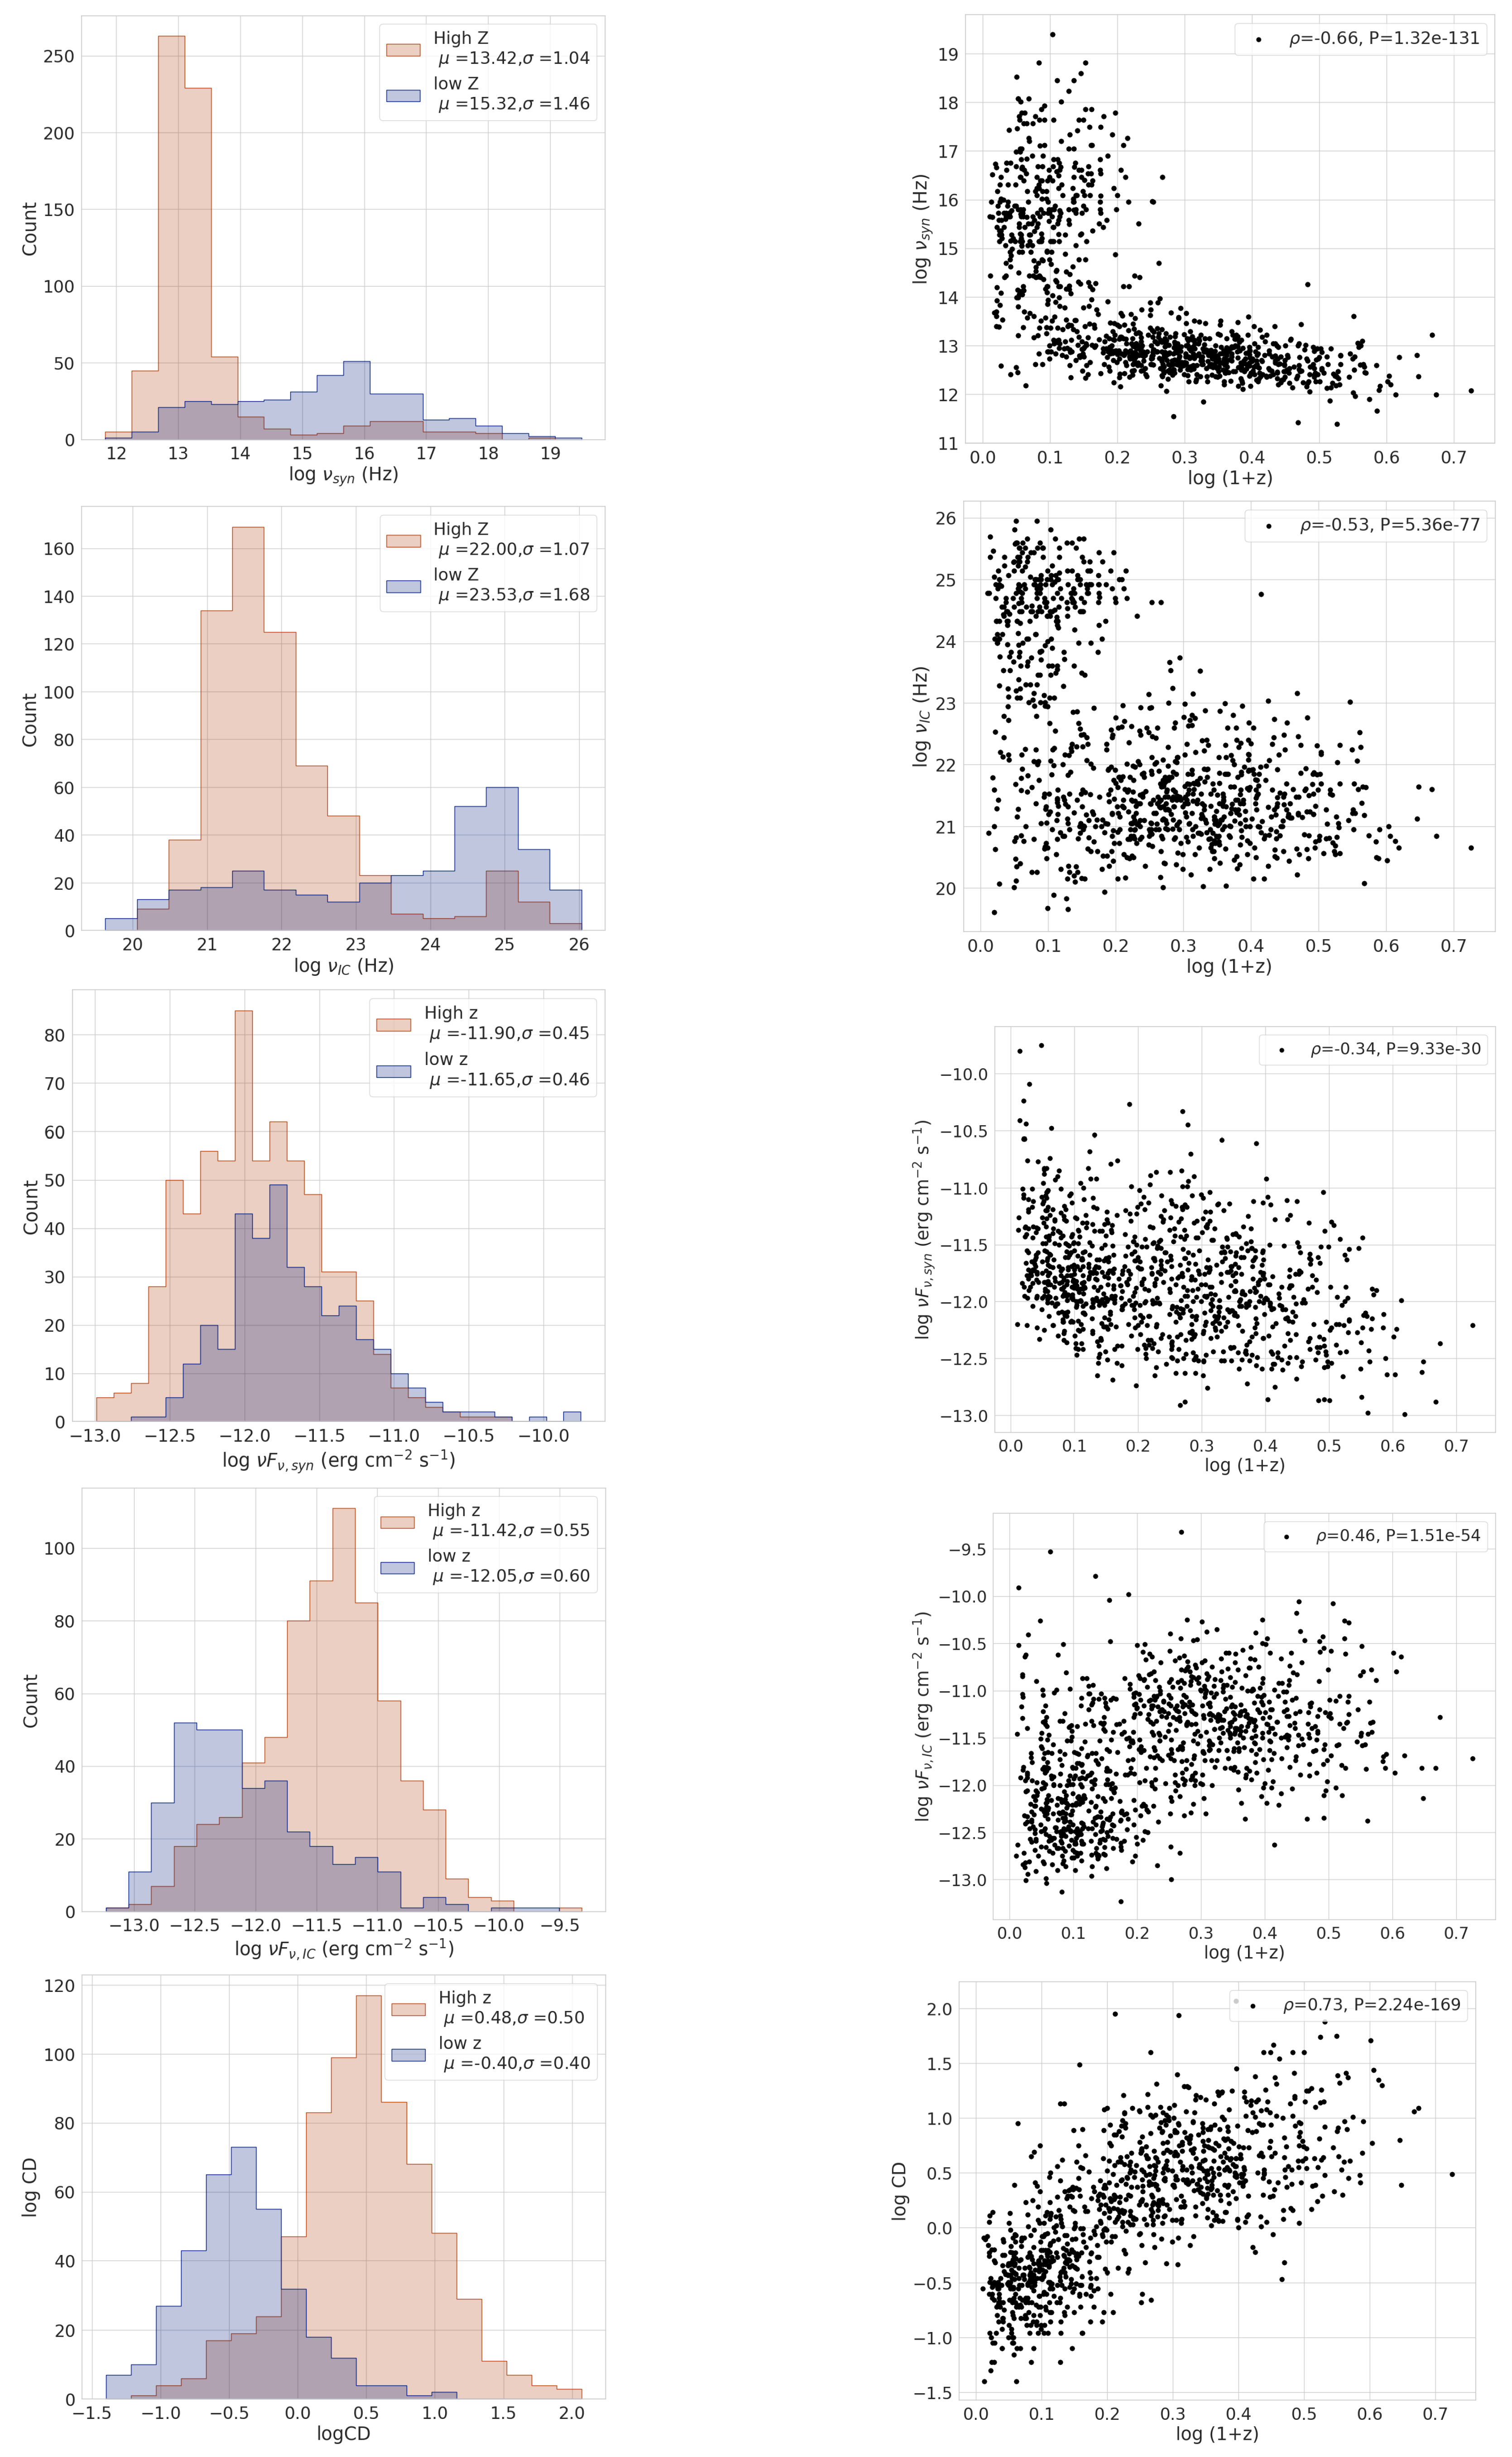
  • The investigation of broadband SED properties reveals that a major fraction of high-z blazars are LSP objects. Their HE hump peaks at MeV energies and they have higher Compton dominance than low-z blazars. The logarithmic histogram distributions of rest frame synchrotron peak frequency ( ν s y n ), rest frame IC peak frequency ( ν I C ), and Compton dominance (CD) roughly follow a Gaussian profile with μ ± σ values of log ν s y n = 13.42 ± 1.04 ( 15.32 ± 1.46 ) , log ν I C = 22.00 ± 1.07 ( 23.53 ± 1.68 ) and log C D = 0.48 ± 0.50 ± ( 0.4 ± 0.40 ) for high (low) redshift blazars. Also, the Pearson correlation study indicates that log ν s y n and log ν I C are in anti-correlation with with log (1 + z). log CD shows a strong positive correlation with log (1 + z). This is in accordance with the blazar sequence. High-z blazars, mostly being FSRQs, are intrinsically more luminous and therefore have high Compton dominance.
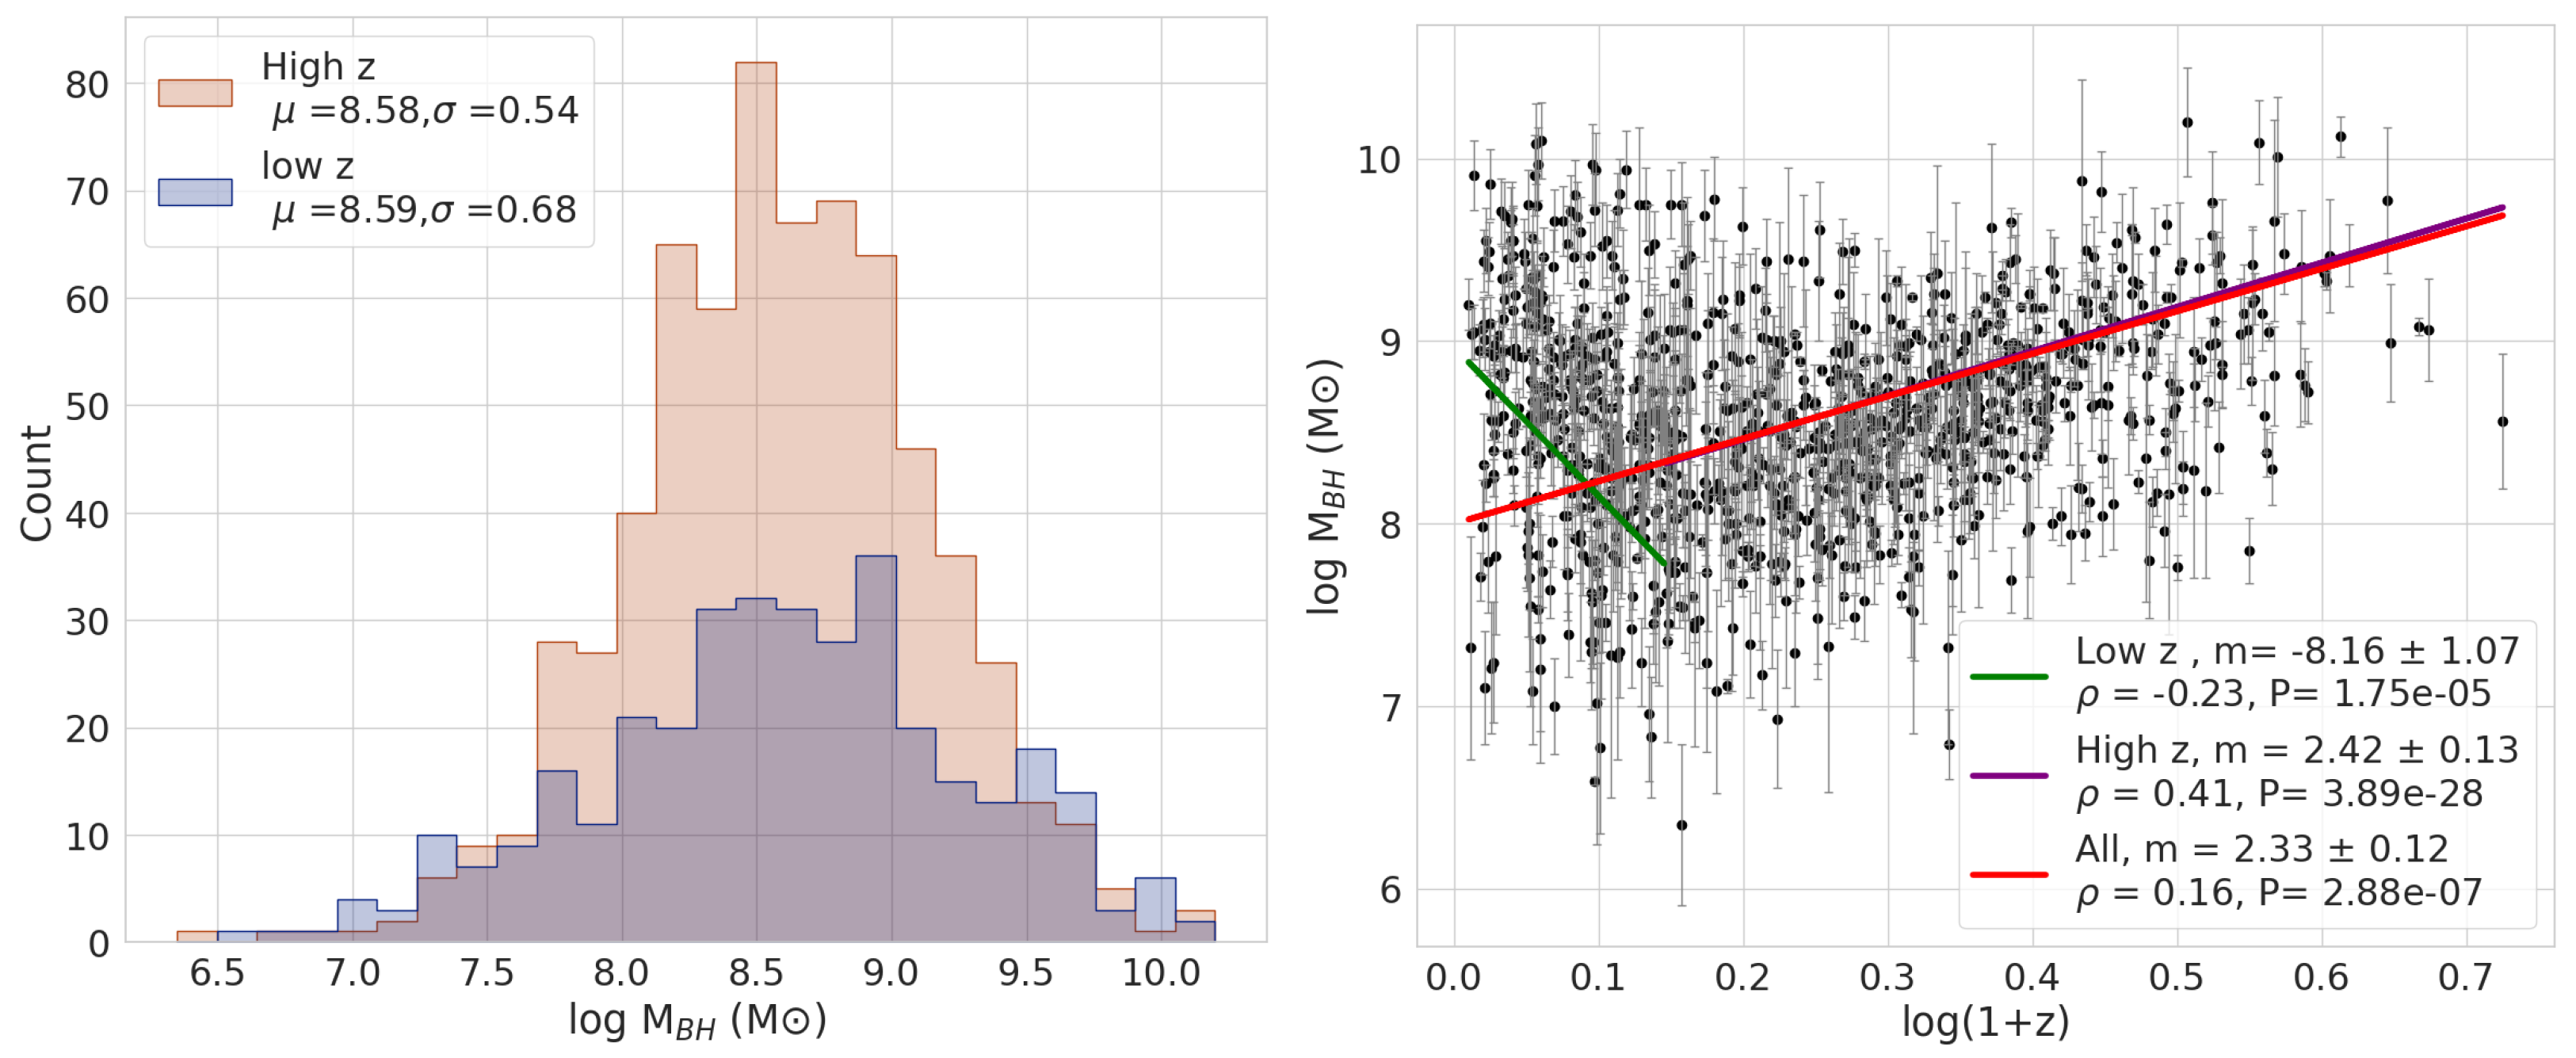
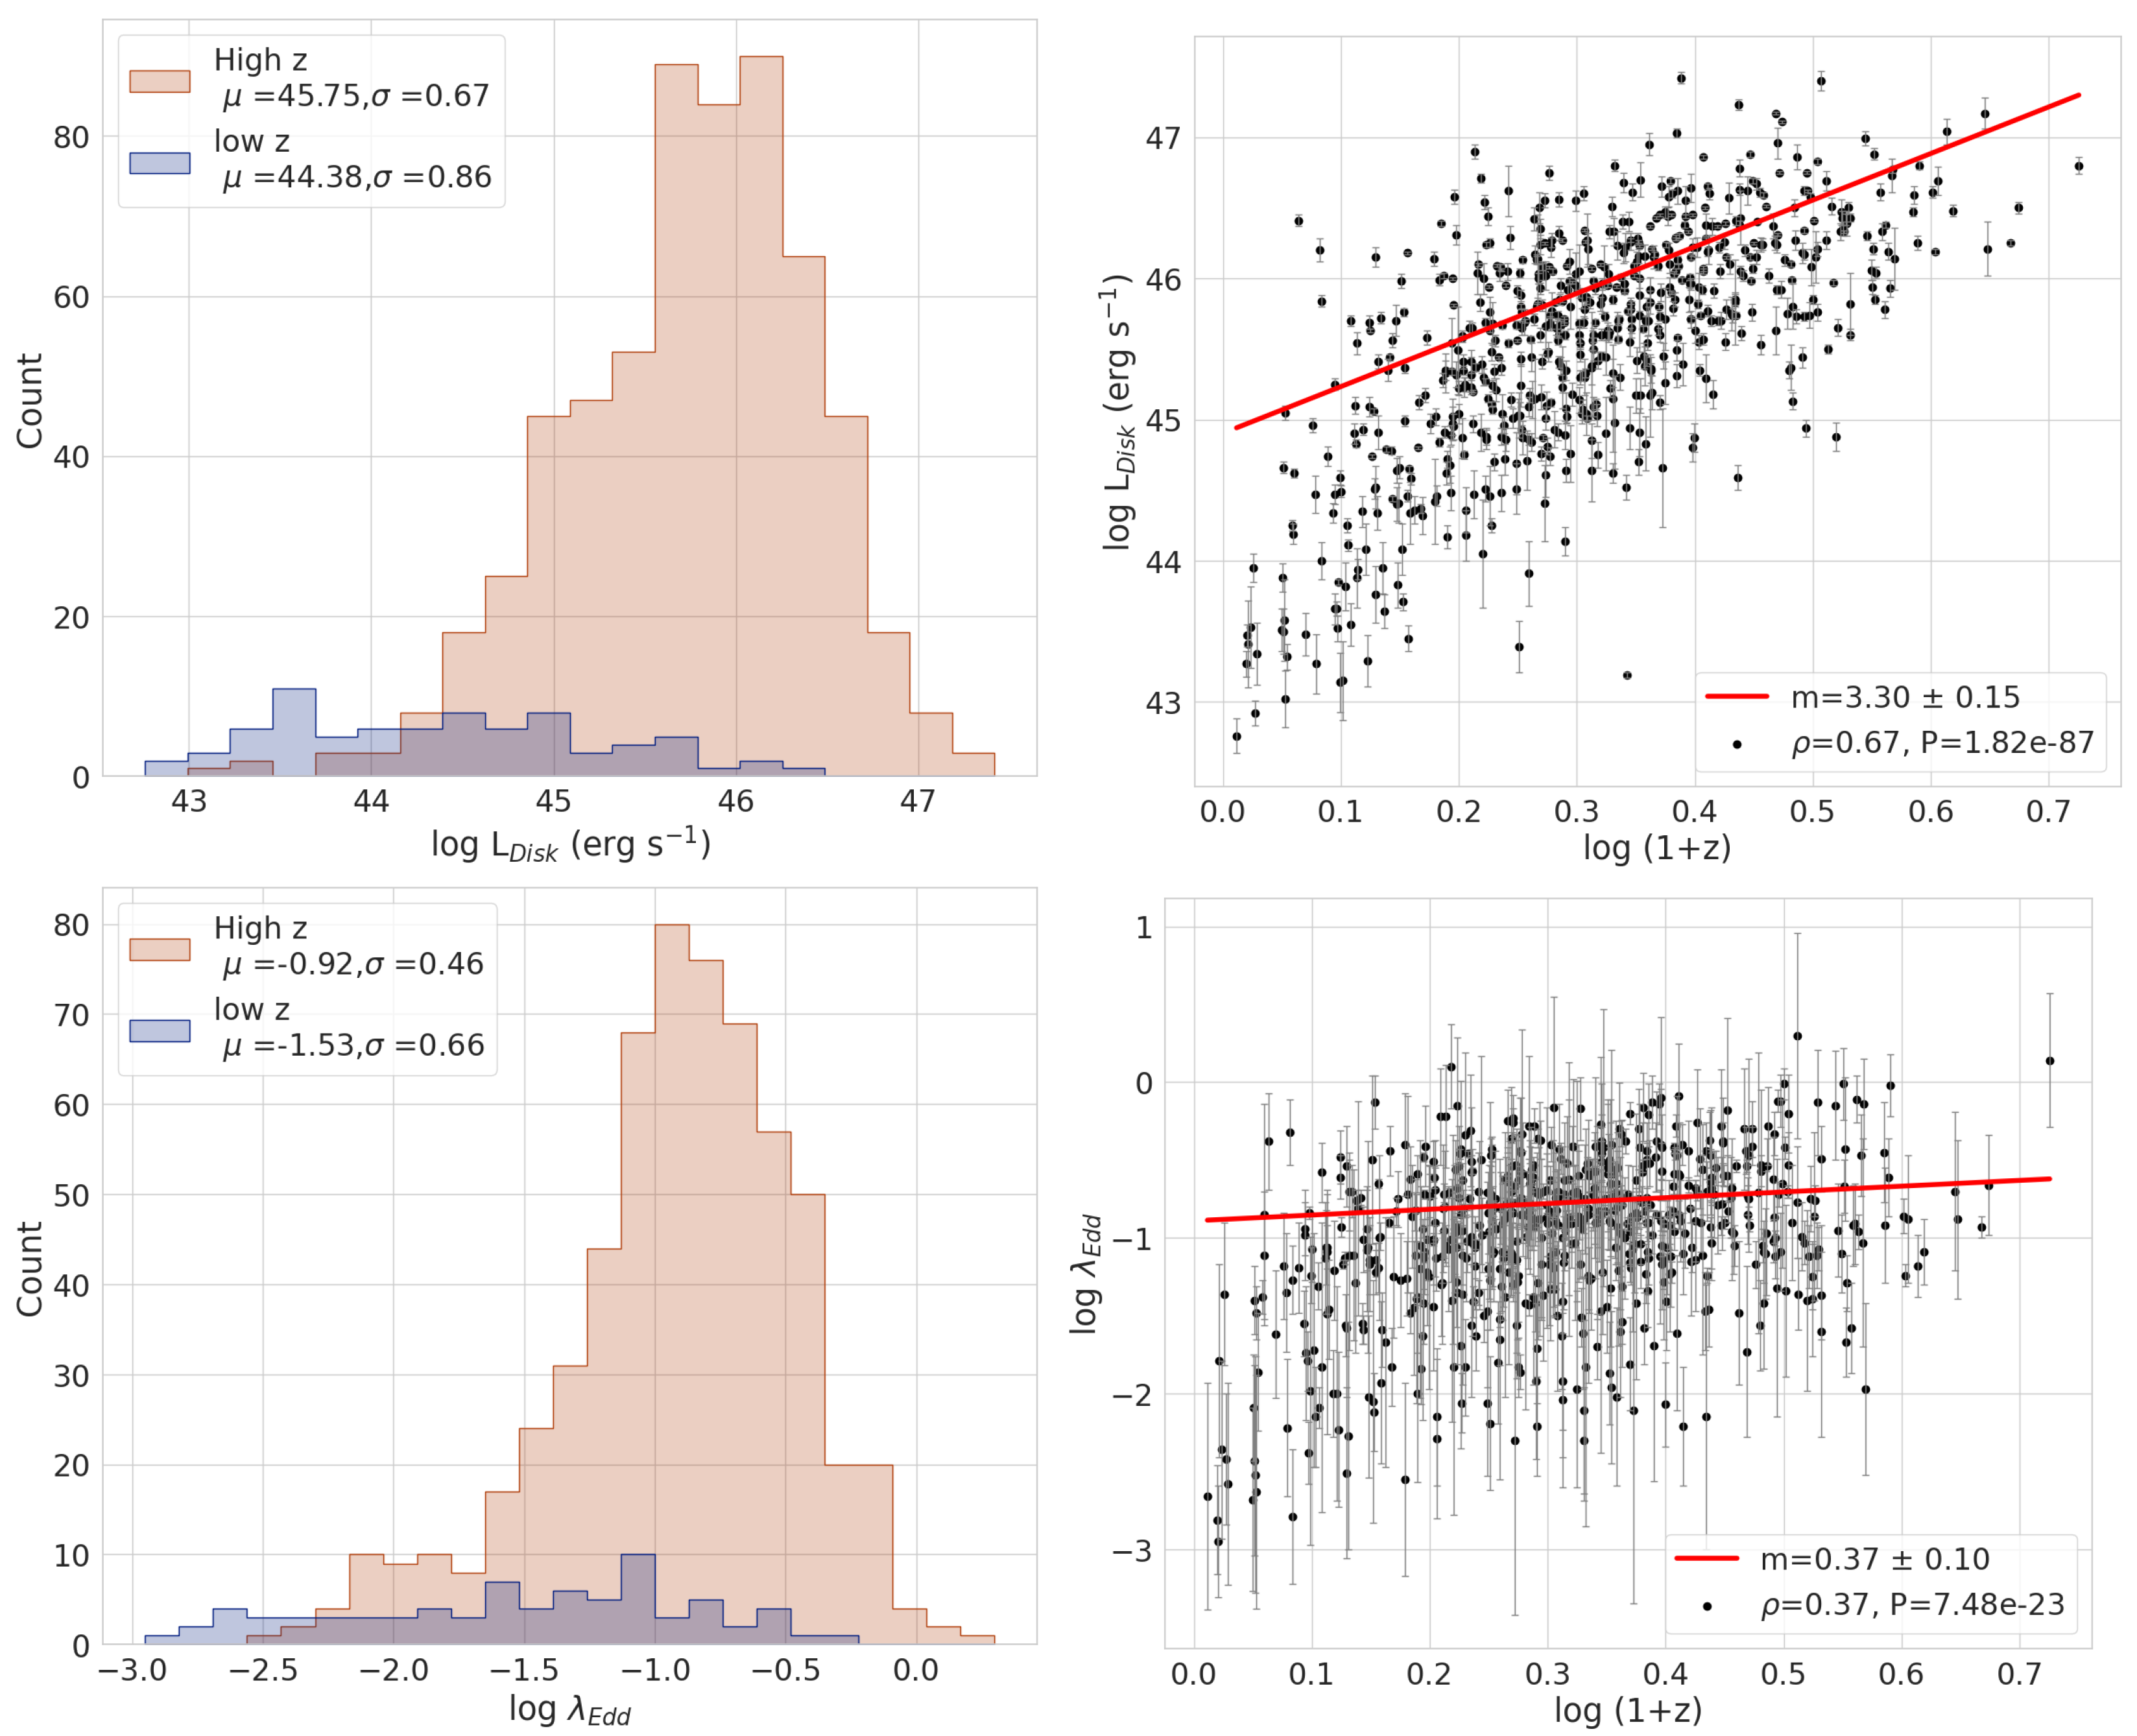
  • The SMBH mass distribution study of the blazar central black holes suggests that the average mass of SMBHs for high and low-z blazars is the same with log M B H = 8.6 . Low-z blazars show a weak anti-correlation with log (1 + z) whereas high-z blazars have a mild positive correlation with log (1 + z). Also, the average accretion disk luminosity and Eddington ratio of high (low) redshift blazars are L D i s k = 5.62 × 10 45 erg s 1 ( 2.4 × 10 44 erg s 1 ) , λ E d d = 0.12 ( 0.03 ) with both the parameters showing a positive correlation with log (1 + z).
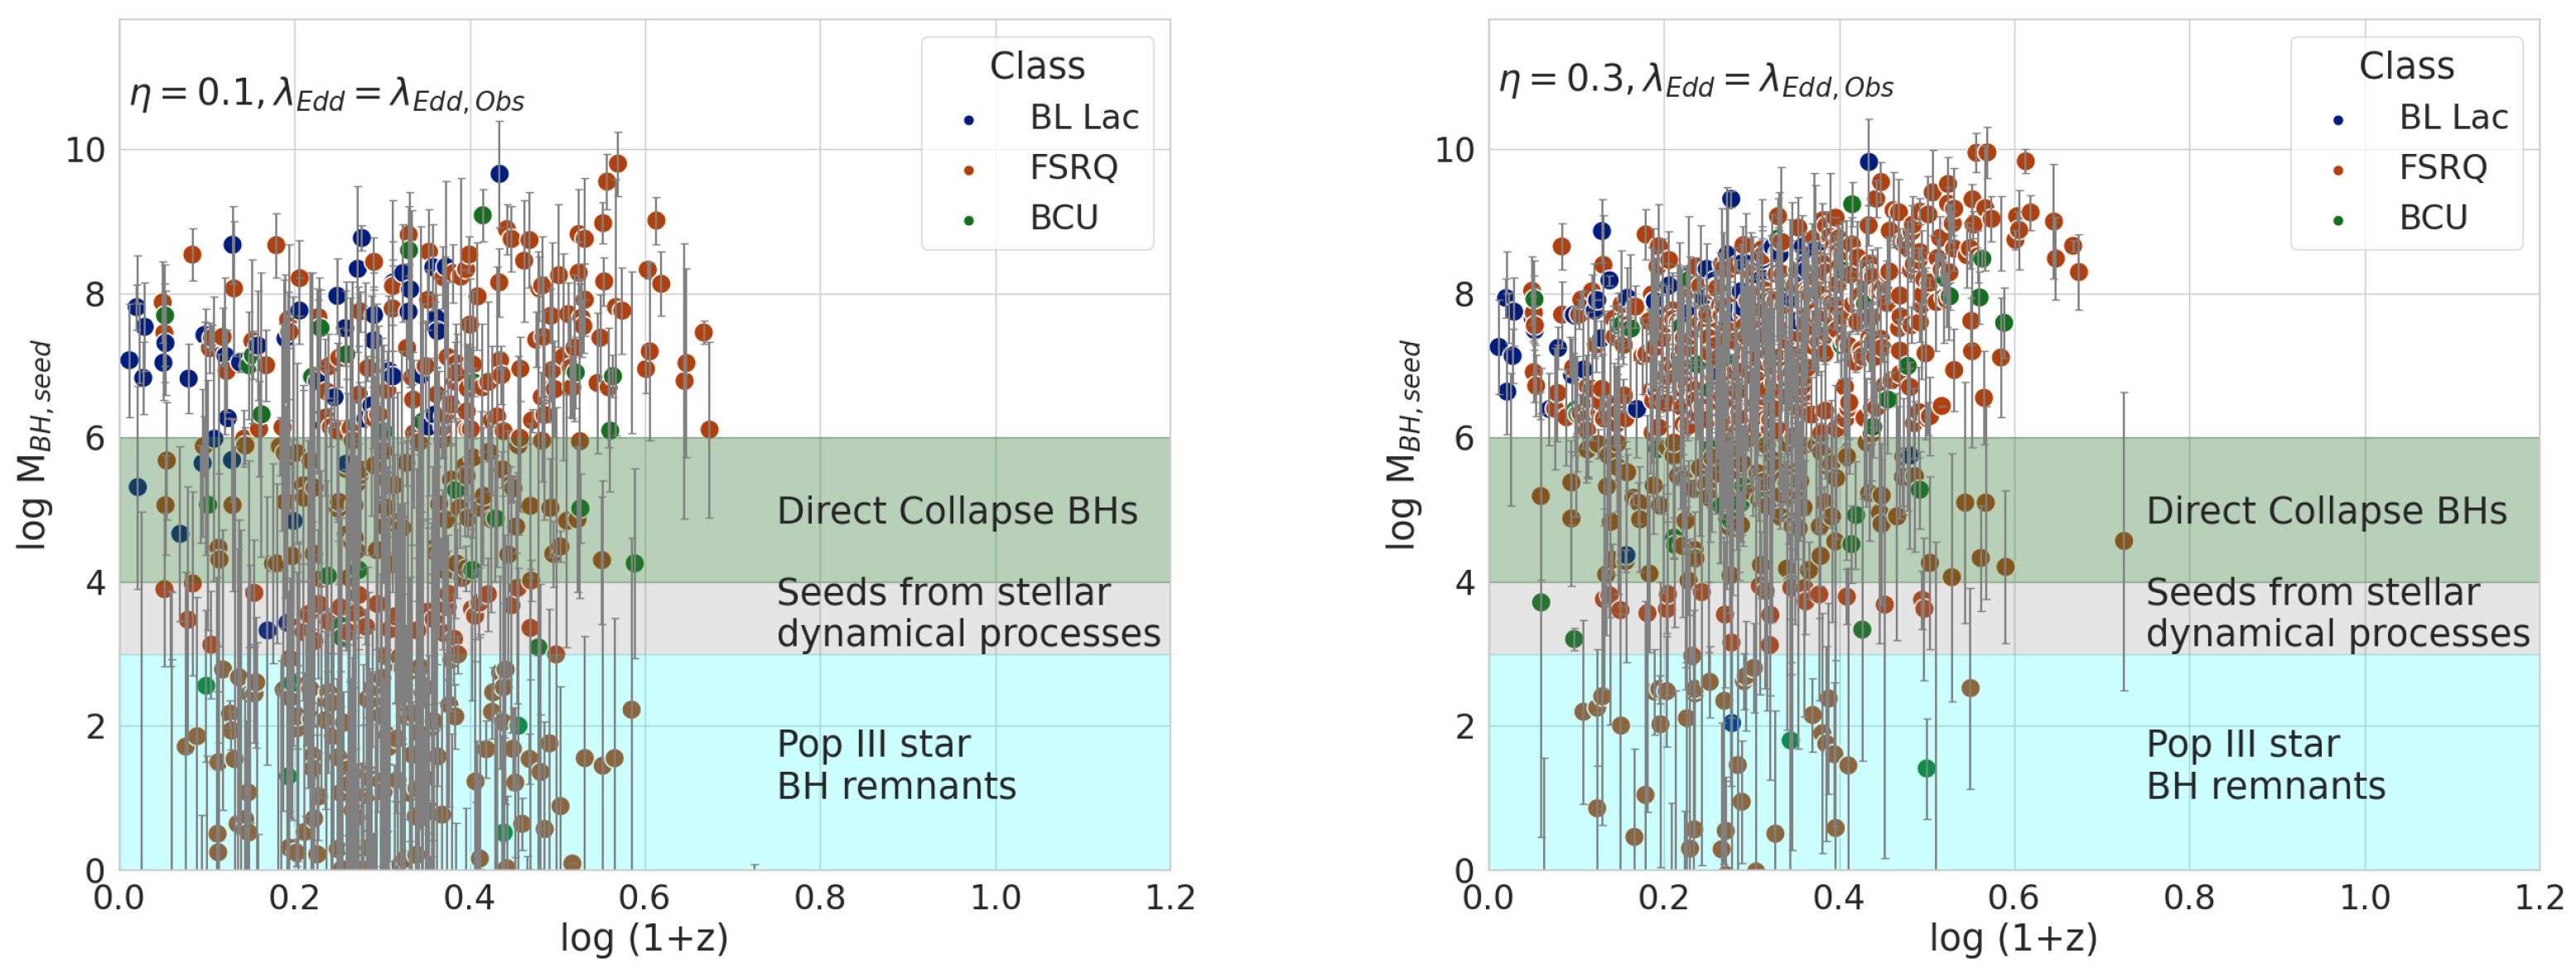
  • We also estimated the masses of black hole seed ( M B H , s e e d ) required for the formation of currently observed SMBHs in blazars using simple exponential growth theory for the formation of SMBHs from the black hole seed via the accretion process. With η = 0.1 ( 0.3 ) and currently observed constant λ E d d , it is found that 26% (69%) of the total blazar population requires more massive seed progenitors than what the direct collapse models or stellar dynamical processes predict. This implies that low accretion efficiencies and high λ E d d (sometimes super Eddington) episodes are required to explain the growth of observed SMBHs. It is also noticed that most of the BL Lacs (75% and 92% for η = 0.1 and 0.3, respectively) are required to have higher λ E d d than currently observed λ E d d to explain the growth of their SMBHs. Therefore, BL Lacs should have had radiatively efficient accretion disk (FSRQ phase) during their lifetime before evolving into BL Lacs having radiatively inefficient accretion disk.
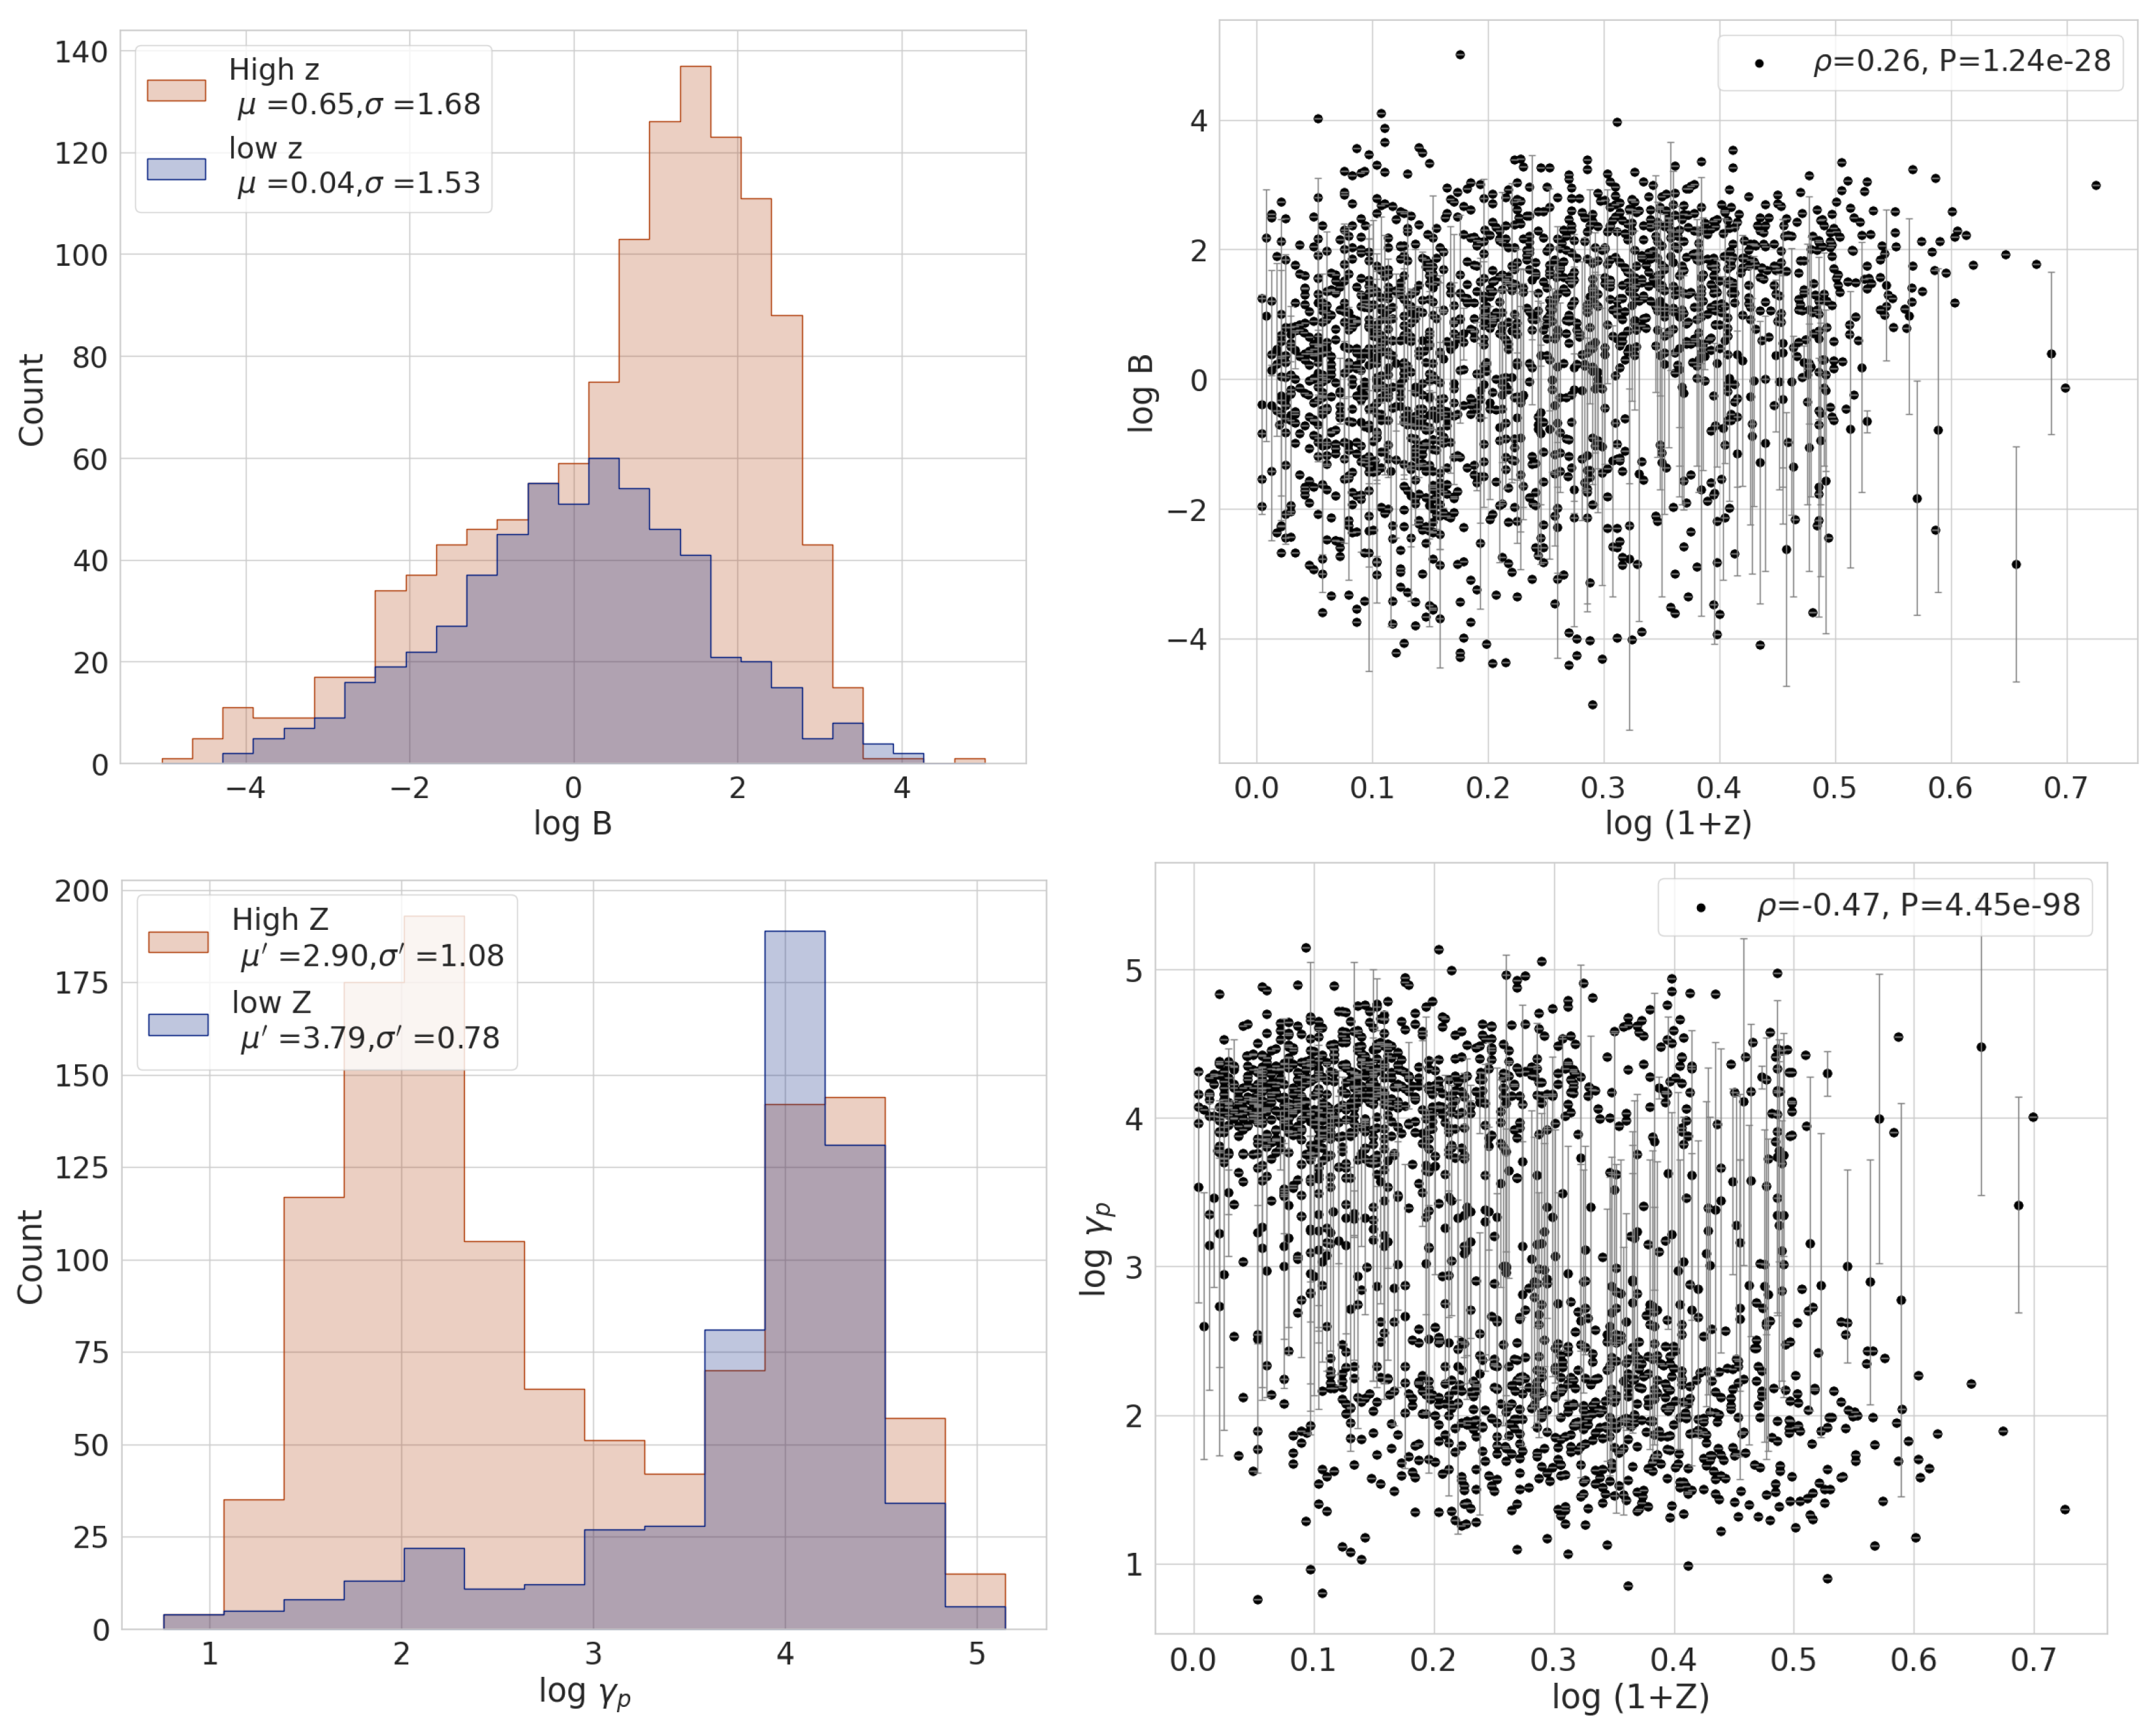
  • According to the single zone leptonic emission model, emission zones of high (low) redshift blazars are required to have magnetic fields B = 4.46 G ( 1.09 ) G and electron energy distributions with γ p values γ p = 7.94 × 10 2 (6.17 ×   10 2 ) to explain their broadband SEDs. They are broadly in agreement with the widely used blazar emission models. High-z blazars (mostly FSRQs) contain low-energy photon-rich environments and relativistic electrons quickly lose their energies through IC scattering. Therefore, their distribution has low γ p . On the other hand, low-z blazars (mostly BL Lacs) have a low-energy photon-starved environment surrounding them and relativistic electrons can attain higher γ p . This also contributes to the observed distribution of synchrotron and IC peak frequencies in blazar SEDs.
Therefore, high-z blazars are a unique class of objects in the distant Universe. Their further detection and detailed broadband emission study will shed more light on radiative and particle acceleration mechanisms under extreme conditions, cosmic evolution of SMBHs and relativistic jets, and intensity of EBL. Deep X-ray and γ -ray surveys are required to have an unbiased large population of blazars for further study of high-z blazars. In the coming decade, the extended ROentgen Survey with an Imaging Telescope Array (eROSITA [100]), the Large High Altitude Air Shower Observatory (LHAASO [101]), the Southern Wide-field Gamma-ray Observatory (SWGO [102]), and the Cherenkov Telescope Array (CTA [103]) are expected to detect large number of high redshift blazars.

Author Contributions

A.T.—Conceptualization, data curation, software and original draft preparation; K.K.S.—Conceptualization, review and editing; K.K.Y.—review and editing. All authors have read and agreed to the published version of the manuscript.

Funding

This research received no external funding.

Data Availability Statement

The data set used in this work is derived from the literature and can be shared on reasonable request.

Acknowledgments

Authors thank all three anonymous reviewers for their important comments and suggestions. We also thank Hubing Xiao A. for sharing the blazar emission region data used in this study.

Conflicts of Interest

The authors declare no conflicts of interest.

References

  1. Urry, C.M.; Padovani, P. Unified Schemes for Radio-Loud Active Galactic Nuclei. Publ. Astron. Soc. Pac. 1995, 107, 803. [Google Scholar] [CrossRef]
  2. Padovani, P.; Alexander, D.M.; Assef, R.J.; Marco, B.D.; Giommi, P.; Hickox, R.C.; Richards, G.T.; Smolcic, V.; Hatziminaoglou, E.; Mainieri, V.; et al. Active galactic nuclei: What’s in a name? Annu. Rev. Astron. Astrophys. 2017, 25, 2. [Google Scholar] [CrossRef]
  3. Blandford, R.D.; Znajek, R.L. Electromagnetic extraction of energy from Kerr black holes. Mon. Not. R. Astron. Soc. 1977, 179, 433–456. [Google Scholar] [CrossRef]
  4. Blandford, R.D.; Payne, D.G. Hydromagnetic flows from accretion disks and the production of radio jets. Mon. Not. R. Astron. Soc. 1982, 199, 883–903. [Google Scholar] [CrossRef]
  5. Maraschi, L.; Tavecchio, F. The Jet-Disk Connection and Blazar Unification. Astrophys. J. 2003, 594, 667–675. [Google Scholar] [CrossRef]
  6. Ghisellini, G.; Tavecchio, F.; Foschini, L.; Ghirlanda, G. The transition between BL Lac objects and flat spectrum radio quasars. Mon. Not. R. Astron. Soc. 2011, 414, 2674–2689. [Google Scholar] [CrossRef]
  7. Chen, Y.Y.; Zhang, X.; Zhang, H.J.; Yu, X.L. Core-dominance parameter, black hole mass and jet-disc connection for Fermi blazars. Mon. Not. R. Astron. Soc. 2015, 451, 4193–4206. [Google Scholar] [CrossRef]
  8. Zhang, L.; Liu, Y.; Fan, J. Classification and Jet Power of Fermi Blazars. Astrophys. J. 2003, 594, 667–675. [Google Scholar] [CrossRef]
  9. Meier, D.L. A Magnetically Switched, Rotating Black Hole Model for the Production of Extragalactic Radio Jets and the Fanaroff and Riley Class Division. Astrophys. J. 1999, 522, 753–766. [Google Scholar] [CrossRef]
  10. Komissarov, S.; Porth, O. Numerical simulations of jets. New Astron. Rev. 2021, 92, 101610. [Google Scholar] [CrossRef]
  11. Wagner, S.J.; Witzel, A. Intraday Variability In Quasars and BL Lac Objects. Annu. Rev. Astron. Astrophys. 1995, 33, 163–198. [Google Scholar] [CrossRef]
  12. Giommi, P.; Perri, M.; Capalbi, M.; D’Elia, V.; de Almeida, U.B.; Brandt, C.H.; Pollock, A.M.T.; Arneodo, F.; Giovanni, A.D.; Chang, Y.L.; et al. X-ray spectra, light curves and SEDs of blazars frequently observed by Swift. Mon. Not. R. Astron. Soc. 2021, 507, 5690–5702. [Google Scholar] [CrossRef]
  13. Lister, M.L.; Homan, D.C.; Hovatta, T.; Kellermann, K.I.; Kiehlmann, S.; Max-Moerbeck, W.; Pushkarev, A.B.; Readhead, A.C.S.; Ros, E.; Kovalev, Y.Y.; et al. MOJAVE. XVII. Jet Kinematics and Parent Population Properties of Relativistically Beamed Radio-loud Blazars. Astrophys. J. 2019, 874, 43. [Google Scholar] [CrossRef]
  14. Weaver, Z.R.; Williamson, K.E.; Jorstad, S.G.; Marscher, A.P.; Larionov, V.M.; Raiteri, C.M.; Villata, M.; Acosta-Pulido, J.A.; Bachev, R.; Baida, G.V.; et al. Multiwavelength Variability of BL Lacertae Measured with High Time Resolution. Astrophys. J. 2020, 900, 137. [Google Scholar] [CrossRef]
  15. Shukla, A.; Mannheim, K. Gamma-ray flares from relativistic magnetic reconnection in the jet of the quasar 3C 279. Nat. Commun. 2020, 11, 4176. [Google Scholar] [CrossRef]
  16. Singh, K.K.; Meintjes, P.J. Characterization of variability in blazar light curves. Astron. Not. 2020, 341, 713–725. [Google Scholar] [CrossRef]
  17. Singh, K.K.; Meintjes, P.J.; Bisschoff, B.; Ramamonjisoa, F.A.; van Soelen, B. Gamma-ray and optical properties of the flat spectrum radio quasar 3C 279 flare in June 2015. J. High Energy Astrophys. 2020, 26, 65–76. [Google Scholar] [CrossRef]
  18. Tolamatti, A.; Ghosal, B.; Singh, K.K.; Bhattacharyya, S.; Bhatt, N.; Yadav, K.K.; Chandra, P.; Das, M.P.; Tickoo, A.K.; Rannot, R.C.; et al. Long-term multi-wavelength study of temporal and spectral properties of 3C 279. Astropart. Phys. 2022, 139, 102687. [Google Scholar] [CrossRef]
  19. Singh, K.K.; Tolamatti, A.; Godiyal, S.; Pathania, A.; Yadav, K.K. A Machine Learning Approach for Predicting Black Hole Mass in Blazars Using Broadband Emission Model Parameters. Universe 2022, 8, 539. [Google Scholar] [CrossRef]
  20. Marscher, A.P.; Gear, W.K. Models for high-frequency radio outbursts in extragalactic sources, with application to the early 1983 millimeter-to-infrared flare of 3C 273. Astrophys. J. 1985, 298, 114–127. [Google Scholar] [CrossRef]
  21. Sikora, M.; Begelman, M.C.; Rees, M.J. Comptonization of Diffuse Ambient Radiation by a Relativistic Jet: The Source of Gamma Rays from Blazars? Astrophys. J. 1994, 421, 153. [Google Scholar] [CrossRef]
  22. Ghisellini, G.; Tavecchio, F. Canonical high-power blazars. Mon. Not. R. Astron. Soc. 2009, 397, 985–1002. [Google Scholar] [CrossRef]
  23. Aharonian, F.A. TeV gamma rays from BL Lac objects due to synchrotron radiation of extremely high energy protons. New Astron. 2000, 5, 377–395. [Google Scholar] [CrossRef]
  24. Bottcher, M.; Reimer, A.; Sweeney, K.; Prakash, A. Leptonic and Hadronic Modeling of Fermi-detected Blazars. Astrophys. J. 2013, 768, 54. [Google Scholar] [CrossRef]
  25. Petropoulou, M.; Dimitrakoudis, S. Constraints of flat spectrum radio quasars in the hadronic model: The case of 3C 273. Mon. Not. R. Astron. Soc. 2015, 452, 1303–1315. [Google Scholar] [CrossRef]
  26. Stickel, M.; Padovani, P.; Urry, C.M.; Fried, J.W.; Kuehr, H. The Complete Sample of 1 Jansky BL Lacertae Objects. I. Summary Properties. Astrophys. J. 1991, 374, 431. [Google Scholar] [CrossRef]
  27. Abdo, A.A.; Ackermann, M.; Agudo, I.; Axelsson, M.; Baldini, L.; Ballet, J.; Barbiellini, G.; Bastieri, D.; Baughman, B.M.; Bechtol, K.; et al. The Spectral Energy Distribution of Fermi Bright Blazars. Astrophys. J. 2010, 716, 30–70. [Google Scholar] [CrossRef]
  28. Padovani, P.; Giommi, P.; Rau, A. The discovery of high-power high synchrotron peak blazars. Mon. Not. R. Astron. Soc. 2012, 422, L48–L52. [Google Scholar] [CrossRef]
  29. Giommi, P.; Padovani, P.; Polenta, G.; Turriziani, S.; D’Elia, V.; Piranomonte, S. A simplified view of blazars: Clearing the fog around long-standing selection effects. Mon. Not. R. Astron. Soc. 2012, 420, 2899–2911. [Google Scholar] [CrossRef]
  30. Fossati, G.; Maraschi, L.; Celotti, A.; Comastri, A.; Ghisellini, G. A unifying view of the spectral energy distributions of blazars. Mon. Not. R. Astron. Soc. 1998, 299, 433–448. [Google Scholar] [CrossRef]
  31. Prandini, E.; Ghisellini, G. The Blazar Sequence and Its Physical Understanding. Galaxies 2022, 10, 35. [Google Scholar] [CrossRef]
  32. Ghisellini, G. The Blazar Sequence 2.0. Galaxies 2016, 4, 36. [Google Scholar] [CrossRef]
  33. Ghisellini, G.; Righi, C.; Costamante, L.; Tavecchio, F. The Fermi blazar sequence. Mon. Not. R. Astron. Soc. 2017, 469, 255–266. [Google Scholar] [CrossRef]
  34. Singh, K.K.; Meintjes, P.J.; Ramamonjisoa, F.A.; Tolamatti, A. Extremely High energy peaked BL Lac nature of the TeV blazar Mrk 501. New Astron. 2019, 73, 101278. [Google Scholar] [CrossRef]
  35. Ghisellini, G.; Celotti, A.; Fossati, G.; Maraschi, L.; Comastri, A. A theoretical unifying scheme for gamma-ray bright blazars. Mon. Not. R. Astron. Soc. 1998, 301, 451–468. [Google Scholar] [CrossRef]
  36. Fan, J.H.; Yang, J.H.; Xiao, H.B.; Lin, C.; Constantin, D.; Luo, G.Y.; Pei, Z.Y.; Hao, J.M.; Mao, Y.W. Intrinsic Correlations for Flaring Blazars Detected by Fermi. Astrophys. J. Lett. 2017, 835, L38. [Google Scholar] [CrossRef]
  37. Paliya, V.S.; Ajello, M.; Cao, H.M.; Giroletti, M.; Kaur, A.; Madejski, G.; Lott, B.; Hartmann, D. Blazars at the Cosmic Dawn. Astrophys. J. 2020, 897, 177. [Google Scholar] [CrossRef]
  38. Sahakyan, N.; Israyelyan, D.; Harutyunyan, G.; Khachatryan, M.; Gasparyan, S. Multiwavelength study of high-redshift blazars. Mon. Not. R. Astron. Soc. 2020, 498, 2594–2613. [Google Scholar] [CrossRef]
  39. Stecker, F.W.; Malkan, M.A.; Scully, S.T. Intergalactic Photon Spectra from the Far-IR to the UV Lyman Limit for 0 < z < 6 and the Optical Depth of the Universe to High-Energy Gamma Rays. Astrophys. J. 2006, 648, 774–783. [Google Scholar]
  40. Singh, K.K.; Meintjes, P.J. Extragalactic background light models and GeV-TeV observation of blazars. NRIAG J. Astron. Geophys. 2020, 9, 309–320. [Google Scholar] [CrossRef]
  41. Tolamatti, A.; Singh, K.K.; Yadav, K.K. Feasibility study of observing γ-ray emission from high redshift blazars using the MACE telescope. J. Astrophys. Astr. 2022, 43, 49. [Google Scholar] [CrossRef]
  42. Ajello, M.; Romani, R.W.; Gasparrini, D.; Shaw, M.S.; Bolmer, J.; Cotter, G.; Finke, J.; Greiner, J.; Healey, S.E.; King, O.; et al. The Cosmic Evolution of Fermi BL Lacertae Objects. Astrophys. J. 2014, 780, 73. [Google Scholar] [CrossRef]
  43. Ghisellini, G. High redshift blazars. Mem. Soc. Astron. Ital. 2013, 84, 719. [Google Scholar]
  44. Ackermann, M.; Ajello, M.; Atwood, W.B.; Baldini, L.; Ballet, J.; Barbiellini, G.; Bastieri, D.; Gonzalez, J.B.; Bellazzini, R.; Bissaldi, E.; et al. The Third Catalog of Active Galactic Nuclei Detected by the Fermi Large Area Telescope. Astrophys. J. 2015, 810, 14. [Google Scholar] [CrossRef]
  45. Inayoshi, K.; Visbal, E.; Haiman, Z. The Assembly of the First Massive Black Holes. Annu. Rev. Astron. Astrophys. 2020, 58, 27–97. [Google Scholar] [CrossRef]
  46. Belladitta, S.; Caccianiga, A.; Diana, A.; Moretti, A.; Severgnini, P.; Pedani, M.; Cassarà, L.P.; Spingola, C.; Ighina, L.; Rossi, A.; et al. Central engine of the highest redshift blazar. Astron. Astrophys. 2022, 660, A74. [Google Scholar] [CrossRef]
  47. Johnson, J.L.; Haardt, F. The Early Growth of the First Black Holes. Publ. Astron. Soc. Astra. 2016, 33, e007. [Google Scholar] [CrossRef]
  48. Belladitta, S.; Moretti, A.; Caccianiga, A.; Spingola, C.; Severgnini, P.; Ceca, R.D.; Ghisellini, G.; Dallacasa, D.; Sbarrato, T.; Cicone, C.; et al. The first blazar observed at z>6. Astron. Astrophys. 2020, 635, L7. [Google Scholar] [CrossRef]
  49. Ajello, M.; Costamante, L.; Sambruna, R.M.; Gehrels, N.; Chiang, J.; Rau, A.; Escala, A.; Greiner, J.; Tueller, J.; Wall, J.V.; et al. The Evolution of Swift/BAT Blazars and the Origin of the MeV Background. Astrophys. J. 2009, 699, 603–625. [Google Scholar] [CrossRef]
  50. Ghisellini, G.; Della Ceca, R.; Volonteri, M.; Ghirlanda, G.; Tavecchio, F.; Foschini, L.; Tagliaferri, G.; Haardt, F.; Pareschi, G.; Grindlay, J. Chasing the heaviest black holes of jetted active galactic nuclei. Mon. Not. R. Astron. Soc. 2010, 405, 387–400. [Google Scholar] [CrossRef]
  51. Volonteri, M. Formation of supermassive black holes. Annu. Rev. Astron. Astrophys. 2010, 18, 279–315. [Google Scholar] [CrossRef]
  52. Volonteri, M.; Haardt, F.; Ghisellini, G.; Della Ceca, R. Blazars in the early Universe. Mon. Not. R. Astron. Soc. 2011, 416, 216–224. [Google Scholar] [CrossRef]
  53. Sbarrato, T.; Ghisellini, G.; Tagliaferri, G.; Foschini, L.; Nardini, M.; Tavecchio, F.; Gehrels, N. Blazar candidates beyond redshift 4 observed by Swift. Mon. Not. R. Astron. Soc. 2015, 446, 2483–2489. [Google Scholar] [CrossRef]
  54. Ajello, M.; Baldini, L.; Ballet, J.; Bastieri, D.; Gonzalez, J.B.; Bellazzini, R.; Berretta, A.; Bissaldi, E.; Bonino, R.; Brill, A.; et al. The Fourth Catalog of Active Galactic Nuclei Detected by the Fermi Large Area Telescope: Data Release 3. Astrophys. J. Suppl. 2022, 263, 24. [Google Scholar] [CrossRef]
  55. Abdollahi, S.; Acero, F.; Baldini, L.; Ballet, J.; Bastieri, D.; Bellazzini, R.; Berenji, B.; Berretta, A.; Bissaldi, E.; Blandford, R.D.; et al. Incremental Fermi Large Area Telescope Fourth Source Catalog. Astrophys. J. Suppl. 2022, 260, 53. [Google Scholar] [CrossRef]
  56. Paliya, V.S.; Domínguez, A.; Ajello, M.; Olmo-García, A.; Hartmann, D. The Central Engines of Fermi Blazars. Astrophys. J. Suppl. 2021, 253, 46. [Google Scholar] [CrossRef]
  57. Ahumada, R.; Allende, P.C.; Almeida, A.; Anders, F.; Anderson, S.F.; Andrews, B.H.; Anguiano, B.; Arcodia, R.; Armengaud, E.; Aubert, M.; et al. The 16th Data Release of the Sloan Digital Sky Surveys: First Release from the APOGEE-2 Southern Survey and Full Release of eBOSS Spectra. Astrophys. J. Suppl. 2020, 249, 3. [Google Scholar] [CrossRef]
  58. Fan, J.; Xiao, H.; Yang, W.; Zhang, L.; Strigachev, A.A.; Bachev, R.S.; Yang, J. Characterizing the Emission Region Properties of Blazars. Astrophys. J. Suppl. 2023, 268, 23. [Google Scholar] [CrossRef]
  59. Yang, J.; Fan, J.; Liu, Y.; Tuo, M.; Pei, Z.; Yang, W.; Yuan, Y.; He, S.; Wang, S.; Qu, X.; et al. Estimation of inverse Compton peak frequency for 4FGL Blazars. Sci. China Phys. Mech. Astron. 2023, 66, 249511. [Google Scholar] [CrossRef]
  60. Yang, J.H.; Fan, J.H.; Liu, Y.; Tuo, M.X.; Pei, Z.Y.; Yang, W.X.; Yuan, Y.H.; He, S.L.; Wang, S.H.; Wang, X.C.; et al. The Spectral Energy Distributions for 4FGL Blazars. Astrophys. J. Suppl. 2022, 262, 18. [Google Scholar] [CrossRef]
  61. Tolamatti, A.; Singh, K.K.; Yadav, K.K. Classification of the Fermi-LAT blazar candidates of uncertain type using extreme gradient boosting. Mon. Not. R. Astron. Soc. 2023, 523, 5341–5352. [Google Scholar] [CrossRef]
  62. Abdo, A.A.; Ackermann, M.; Ajello, M.; Atwood, W.B.; Axelsson, M.; Baldini, L.; Ballet, J.; Barbiellini, G.; Bastieri, D.; Baughman, B.M.; et al. Bright Active Galactic Nuclei Source List from the First Three Months of the Fermi Large Area Telescope All-Sky Survey. Astrophys. J. 2009, 700, 597–622. [Google Scholar] [CrossRef]
  63. Bottcher, M.; Dermer, C.D. An Evolutionary Scenario for Blazar Unification. Astrophys. J. 2002, 564, 86–91. [Google Scholar] [CrossRef]
  64. Paliya, V.S.; Domínguez, A.; Cabello, C.; Cardiel, N.; Gallego, J.; Siana, B.; Ajello, M.; Hartmann, D.; de Paz, A.G.; Stalin, C.S. The First Gamma-Ray Emitting BL Lacertae Object at the Cosmic Dawn. Astrophys. J. Lett. 2020, 903, L8. [Google Scholar] [CrossRef]
  65. Ackermann, M.; Ajello, M.; Baldini, L.; Ballet, J.; Barbiellini, G.; Bastieri, D.; Gonzalez, J.B.; Bellazzini, R.; Bissaldi1, E.; Blandford, R.D.; et al. Gamma-Ray Blazars within the First 2 Billion Years. Astrophys. J. Lett. 2017, 837, L5. [Google Scholar] [CrossRef]
  66. Iyida, E.U.; Odo, F.C.; Chukwude, A.E.; Ubachukwu, A.A. Multi-frequency study of spectral indices of BL Lacertae objects and flat-spectrum radio quasars. New Astron. 2022, 90, 101666. [Google Scholar] [CrossRef]
  67. Gould, R.J.; Schréder, G. Opacity of the Universe to High-Energy Photons. Phys. Rev. Lett. 1966, 16, 252–254. [Google Scholar] [CrossRef]
  68. Gould, R.J.; Schréder, G.P. Opacity of the Universe to High-Energy Photons. Phys. Rev. 1967, 155, 1408–1411. [Google Scholar] [CrossRef]
  69. Singh, K.K.; Sahayanathan, S.; Tickoo, A.K.; Bhatt, N. Intrinsic VHE gamma-ray spectra of blazars as a probe for extragalactic background light. New Astron. 2014, 27, 34–40. [Google Scholar] [CrossRef]
  70. Finke, J.D.; Razzaque, S.; Dermer, C.D. Modeling the Extragalactic Background Light from Stars and Dust. Astrophys. J. 2010, 712, 238–249. [Google Scholar] [CrossRef]
  71. Dominguez, A.; Primack, J.R.; Rosario, D.J.; Prada, F.; Gilmore, R.C.; Faber, S.M.; Koo, D.C.; Somerville, R.S.; Perez-Torres, M.A.; Perez-Gonzalez, P.; et al. Extragalactic background light inferred from AEGIS galaxy-SED-type fractions. Mon. Not. R. Astron. Soc. 2011, 410, 2556–2578. [Google Scholar] [CrossRef]
  72. Mankuzhiyil, N.; Persic, M.; Franceschini, A. Prospects of additional contribution at Optical-NIR band of EBL in the light of VHE spectra. Mon. Not. R. Astron. Soc. 2023, 524, 133–142. [Google Scholar]
  73. Ghisellini, G.; Tavecchio, F.; Foschini, L.; Ghirlanda, G.; Maraschi, L.; Celotti, A. General physical properties of bright Fermi blazars. Mon. Not. R. Astron. Soc. 2010, 402, 497–518. [Google Scholar] [CrossRef]
  74. Shakura, N.I.; Sunyaev, R.A. Black holes in binary systems. Observational appearance. Astron. Astrophys. 1973, 24, 337–355. [Google Scholar]
  75. Narayan, R.; Garcia, M.R.; McClintock, J.E. Advection-dominated Accretion and Black Hole Event Horizons. Astrophys. J. Lett. 1997, 478, L79–L82. [Google Scholar] [CrossRef]
  76. Volonteri, M.; Silk, J.; Dubus, G. The Case for Supercritical Accretion onto Massive Black Holes at High Redshift. Astrophys. J. 2015, 804, 148. [Google Scholar] [CrossRef]
  77. Shapiro, S.L. Spin, Accretion, and the Cosmological Growth of Supermassive Black Holes. Astrophys. J. 2005, 620, 59–68. [Google Scholar] [CrossRef]
  78. Thorne, K.S.; Disk-Accretion onto a Black Hole. II. Evolution of the Hole. Astrophys. J. 1974, 191, 507–520. [Google Scholar] [CrossRef]
  79. Bromm, V.; Larson, R.B. The First Stars. Annu. Rev. Astron. Astrophys. 2004, 42, 79–118. [Google Scholar] [CrossRef]
  80. Bromm, V.; Yoshida, N. The First Galaxies. Annu. Rev. Astron. Astrophys. 2011, 49, 373–407. [Google Scholar] [CrossRef]
  81. Abel, T.; Bryan, G.L.; Norman, M.L. The Formation and Fragmentation of Primordial Molecular Clouds. Astrophys. J. 2000, 540, 39–44. [Google Scholar] [CrossRef]
  82. Bond, J.R.; Arnett, W.D.; Carr, B.J. The evolution and fate of Very Massive Objects. Astrophys. J. 1984, 280, 825–847. [Google Scholar] [CrossRef]
  83. Devecchi, B.; Volonteri, M. Formation of the First Nuclear Clusters and Massive Black Holes at High Redshift. Astrophys. J. 2009, 694, 302–313. [Google Scholar] [CrossRef]
  84. Lupi, A.; Colpi, M.; Devecchi, B.; Galanti, G.; Volonteri, M. Constraining the high-redshift formation of black hole seeds in nuclear star clusters with gas inflows. Mon. Not. R. Astron. Soc. 2014, 442, 3616–3626. [Google Scholar] [CrossRef]
  85. Alexander, T.; Natarajan, P. Rapid growth of seed black holes in the early universe by supra-exponential accretion. Science 2014, 345, 1330–1333. [Google Scholar] [CrossRef] [PubMed]
  86. Volonteri, M.; Dubois, Y.; Pichon, C.; Devriendt, J. The cosmic evolution of massive black holes in the Horizon-AGN simulation. Mon. Not. R. Astron. Soc. 2016, 460, 2979–2996. [Google Scholar] [CrossRef]
  87. Lupi, A.; Haardt, F.; Dotti, M.; Fiacconi, D.; Mayer, L.; Madau, P. Growing massive black holes through supercritical accretion of stellar-mass seeds. Mon. Not. R. Astron. Soc. 2016, 456, 2993–3003. [Google Scholar] [CrossRef]
  88. Haehnelt, M.G.; Rees, M.J. The formation of nuclei in newly formed galaxies and the evolution of the quasar population. Mon. Not. R. Astron. Soc. 1993, 263, 168–178. [Google Scholar] [CrossRef]
  89. Begelman, M.C.; Volonteri, M.; Rees, M.J. Formation of supermassive black holes by direct collapse in pre-galactic haloes. Mon. Not. R. Astron. Soc. 2006, 370, 289–298. [Google Scholar] [CrossRef]
  90. Onoue, M.; Kashikawa, N.; Matsuoka, Y.; Kato, N.; Izumi, T.; Nagao, T.; Strauss, M.A.; Harikane, Y.; Imanishi, M.; Ito, K.; et al. Subaru High-z Exploration of Low-luminosity Quasars (SHELLQs). VI. Black Hole Mass Measurements of Six Quasars at 6.1 ≤ z ≤ 6.7. Astrophys. J. 2019, 880, 77. [Google Scholar] [CrossRef]
  91. Tang, J.-J.; Goto, T.; Ohyama, Y.; Jin, C.; Done, C.; Lu, T.; Hashimoto, T.; Eser, E.K.; Chiang, C.; Kim, S. Rapid black hole growth at the dawn of the Universe: A super-Eddington quasar at z = 6.6. Mon. Not. R. Astron. Soc. 2019, 484, 2575–2586. [Google Scholar] [CrossRef]
  92. Kim, Y.; Im, M.; Jeon, Y.; Kim, M.; Choi, C.; Hong, J.; Hyun, M.; Jun, H.D.; Karouzos, M.; Kim, D.; et al. Discovery of a Faint Quasar at z ∼ 6 and Implications for Cosmic Reionization. Astrophys. J. Lett. 2015, 813, L35. [Google Scholar]
  93. Kubota, A.; Done, C. Modelling the spectral energy distribution of super-Eddington quasars. Mon. Not. R. Astron. Soc. 2019, 489, 524–533. [Google Scholar] [CrossRef]
  94. Jolley, E.J.D.; Kuncic, Z. Jet-enhanced accretion growth of supermassive black holes. Mon. Not. R. Astron. Soc. 2008, 386, 989–994. [Google Scholar] [CrossRef]
  95. Jolley, E.J.D.; Kuncic, Z.; Bicknell, G.V.; Wagner, S. Accretion discs in blazars. Mon. Not. R. Astron. Soc. 2009, 400, 1521–1526. [Google Scholar] [CrossRef]
  96. Alexander, D.M.; Hickox, R.C. What drives the growth of black holes? New Astron. Rev 2012, 56, 93–121. [Google Scholar] [CrossRef]
  97. Feng, Y.; Di Matteo, T.; Croft, R.; Khandai, N. High-redshift supermassive black holes: Accretion through cold flows. Mon. Not. R. Astron. Soc. 2014, 440, 1865–1879. [Google Scholar] [CrossRef]
  98. Shen, Y.; Richards, G.T.; Strauss, M.A.; Hall, P.B.; Schneider, D.P.; Snedden, S.; Bizyaev, D.; Brewington, H.; Malanushenko, V.; Malanushenko, E.; et al. A Catalog of Quasar Properties from Sloan Digital Sky Survey Data Release 7. Astrophys. J. Suppl. Ser. 2011, 194, 45. [Google Scholar] [CrossRef]
  99. Peterson, B.M. Reverberation Mapping of Active Galactic Nuclei. Publ. Astron. Soc. Pac. 1993, 105, 247. [Google Scholar] [CrossRef]
  100. Merloni, A.; Predehl, P.; Becker, W.; Böhringer, H.; Boller, T.; Brunner, H.; Brusa, M.; Dennerl, K.; Freyberg, M.; Friedrich, P.; et al. eROSITA Science Book: Mapping the Structure of the Energetic Universe. arXiv 2012, arXiv:1209.3114. [Google Scholar]
  101. Bai, X.; Bi, B.Y.; Bi, X.J.; Cao, Z.; Chen, S.Z.; Chen, Y.; Chiavassa, A.; Cui, X.H.; Dai, Z.G.; della Volpe, D.; et al. The Large High Altitude Air Shower Observatory (LHAASO) Science White Paper—2021 Edition. arXiv 2019, arXiv:1905.02773. [Google Scholar]
  102. Albert, A.; Alfaro, R.; Ashkar, H.; Alvarez, C.; Álvarez, J.; Arteaga-Velázquez, J.C.; Solares, H.A.; Arceo, R.; Bellido, J.A.; BenZvi, S.; et al. Science Case for a Wide Field-of-View Very-High-Energy Gamma-Ray Observatory in the Southern Hemisphere. arXiv 2019, arXiv:1902.08429. [Google Scholar]
  103. Cherenkov Telescope Array Consortium. Science with the Cherenkov Telescope Array. World Scientific. 2019. Available online: https://www.worldscientific.com/doi/pdf/10.1142/10986 (accessed on 5 December 2021).
Figure 1. (Left) Histograms of the redshifts for FSRQs, BL Lacs and BCUs taken from 4LAC-DR3 catalog [54,55]. (Right) The number distributions of FSRQs, BL Lacs and BCUs in the high redshift ( z > 0.4 ) and low redshift ( z 0.4 ) regimes.
Galaxies 12 00010 g001
Figure 2. (Left) Histograms of the Power-Law (PL) spectral index ( Γ ), Log Parabola (LP) index ( α ) and curvature parameter ( β ) of blazars measured by the Fermi-LAT. (Right) Variations of Γ , α and β parameters as a function of redshift (log (1 + z)).
Galaxies 12 00010 g002
Figure 3. (Left) Histograms of the luminosities of γ -ray at 1 GeV (log L γ ), X-ray at 1 keV (log L X ), optical at 2.43 ×   10 14 Hz (log L o ) and radio at 1.4 GHz (log L R ) for sample high and low-z blazars. (Right) Variations of log L γ , log L X , log L o and log L R as a function of luminosity distance (log D L ).
Galaxies 12 00010 g003
Figure 4. (Left) Histograms of synchrotron peak frequency ( ν s y n ), IC peak frequency ( ν I C ), energy fluxes at synchrotron ( ν F ν , s y n ) and IC ( ν F ν , I C ) peak frequencies, and Compton dominance parameter ( C D ). (Right) Variations of log ν s y n , log ν I C , log ν F ν , s y n , log ν F ν , I C and log C D as a function of log (1 + z).
Galaxies 12 00010 g004
Figure 5. (Left) Histograms of log M B H values for high and low-z blazars. (Right) Scatterplot of log M B H and log (1 + z).
Galaxies 12 00010 g005
Figure 6. (Upper Left) Histograms of L D i s k for high and low redshift blazars. (Upper Right) Scatter plot of log L D i s k vs log (1 + z). (Lower Left) Histograms of the Eddington ratios ( λ E d d ) for high and low redshift blazars. (Lower Right) Scatter plot of log λ E d d as function of log (1 + z).
Galaxies 12 00010 g006
Figure 7. Variations of the estimated seed M B H , s e e d values at z = 30, required for the formation of observed SMBHs in blazars, as a function of log (1 + z), assuming the BH accretes with observed λ E d d , o b s and with η = 0.1 (left panel) and 0.3 (right panel). The shaded regions correspond to expected mass ranges of Population III star BH remnants (10– 10 3 M ; cyan color), seed black holes from stellar dynamical processes (≥ 10 3 M ; gray color) and black holes from direct collapse ( 10 4 10 6 M ; green color).
Galaxies 12 00010 g007
Figure 8. (Left) Histograms of log B and log γ p for high and low redshift blazars. (Right) Variation of log B and log γ p values with log (1 + z).
Galaxies 12 00010 g008
Disclaimer/Publisher’s Note: The statements, opinions and data contained in all publications are solely those of the individual author(s) and contributor(s) and not of MDPI and/or the editor(s). MDPI and/or the editor(s) disclaim responsibility for any injury to people or property resulting from any ideas, methods, instructions or products referred to in the content.

