
S0 Galaxies: Outer Gas Accretion through Tidal Interaction and Minor Merging

Abstract
:1. Introduction
2. The Sample


| Galaxy and Its Distance | Type (NED ) | (LEDA ) | (LEDA) | , (NED) | , | , kpc (NED) |
|---|---|---|---|---|---|---|
| UGC 8671, D = 101 Mpc | ||||||
| UGC 8671 | S0 (LEDA) | −24.6 | −21.35 | 7443 | 0 | |
| NGC 5278 | SA(s)b pec | −24.8 | −21.96 | 7569 | 80 | |
| NGC 5279 | SB(s)a pec | −23.7 | −22.06 | 7580 | 98 | |
| NGC 3921, D = 81 Mpc | ||||||
| NGC 3921 | (R’)SA(s)0/a pec | −24.7 | −21.82 | 5896 | 0 | |
| PGC 2489542 | E? S0? (LEDA) | −21.56 | −18.00 | 5707 | 9.82 | 28 |
| SDSS J115059.3 + 550310 | S? (LEDA) | −16.52 | 5865 | 9.03 | 45 | |
| NGC 3916 | SAb | −24.1 | −21.0 | 5786 | 10.84 | 106 |
| PGC 37013 | Sa | −23.1 | −19.4 | 5494 | 10.58 | 120 |
| UGC 1020, D= 33.8 Mpc | ||||||
| UGC 1020 | Sab | −21.3 | −19.20 | 2589 | 9.63 e | 0 |
| PGC 212760 | Irr | −16.17 | 2437 | 8.37 e | 34 | |
| UGC 7020A, D = 23.2 Mpc | ||||||
| UGC 7020A | S0 | −20.7 | −17.63 | 1515 | 9.08 | 0 |
| NGC 4081 | Sa | −21.7 | −18.42 | 1408 | 9.75 | 85 |
3. Observations
4. Results
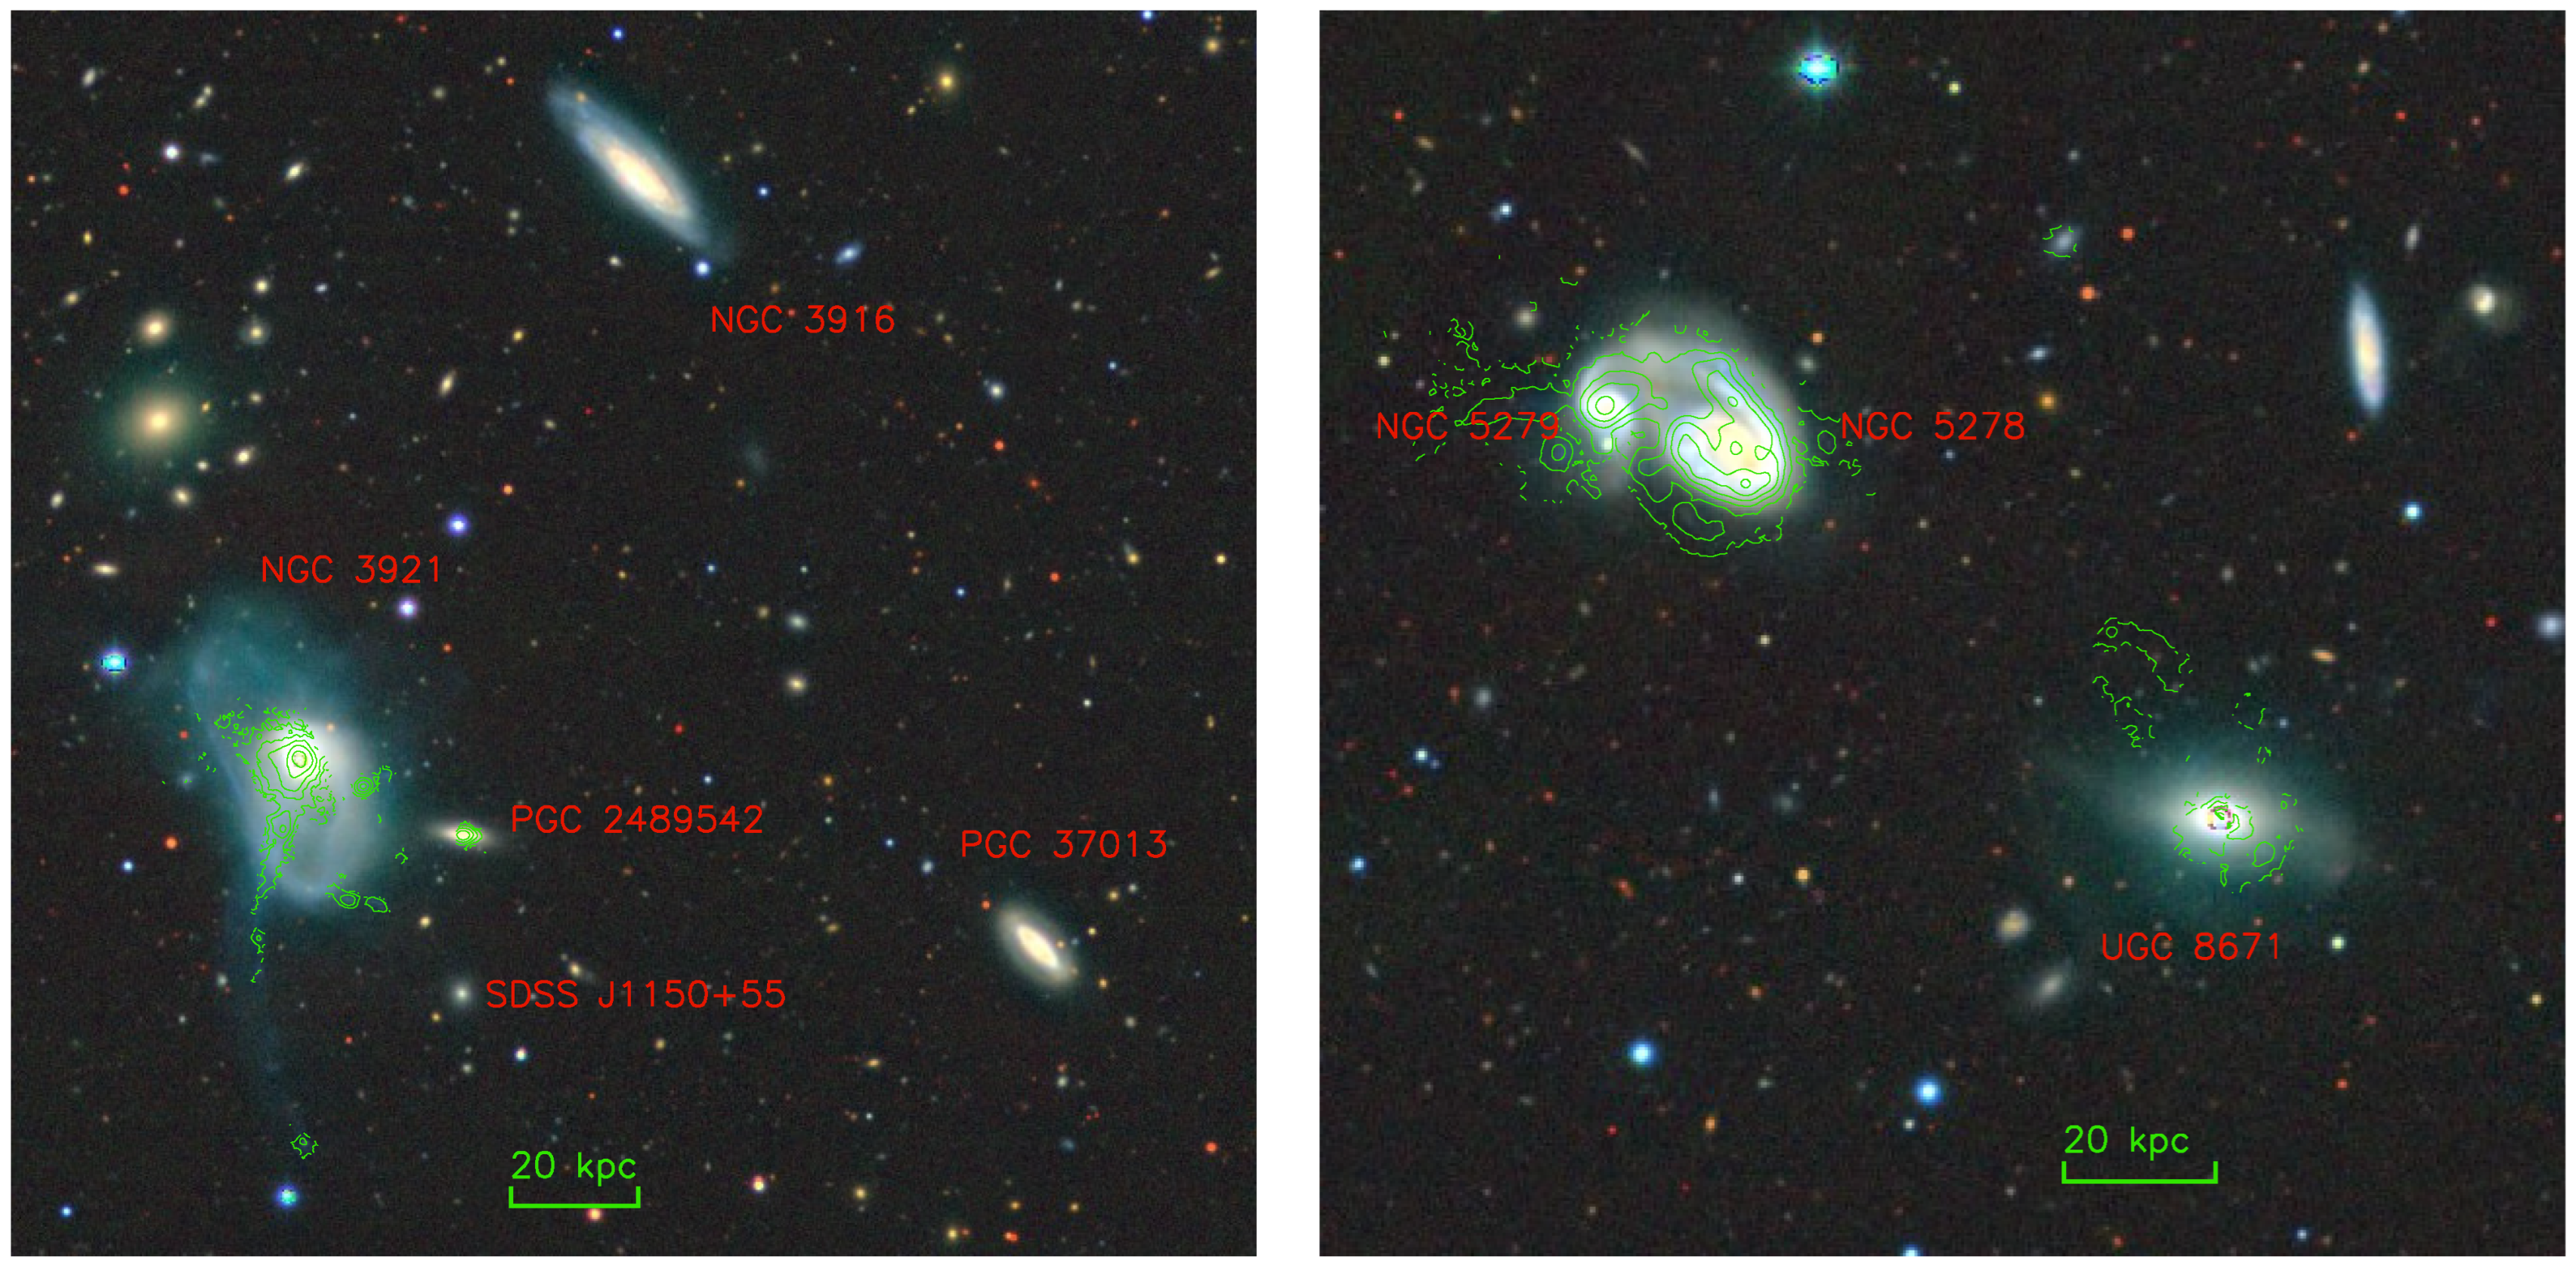
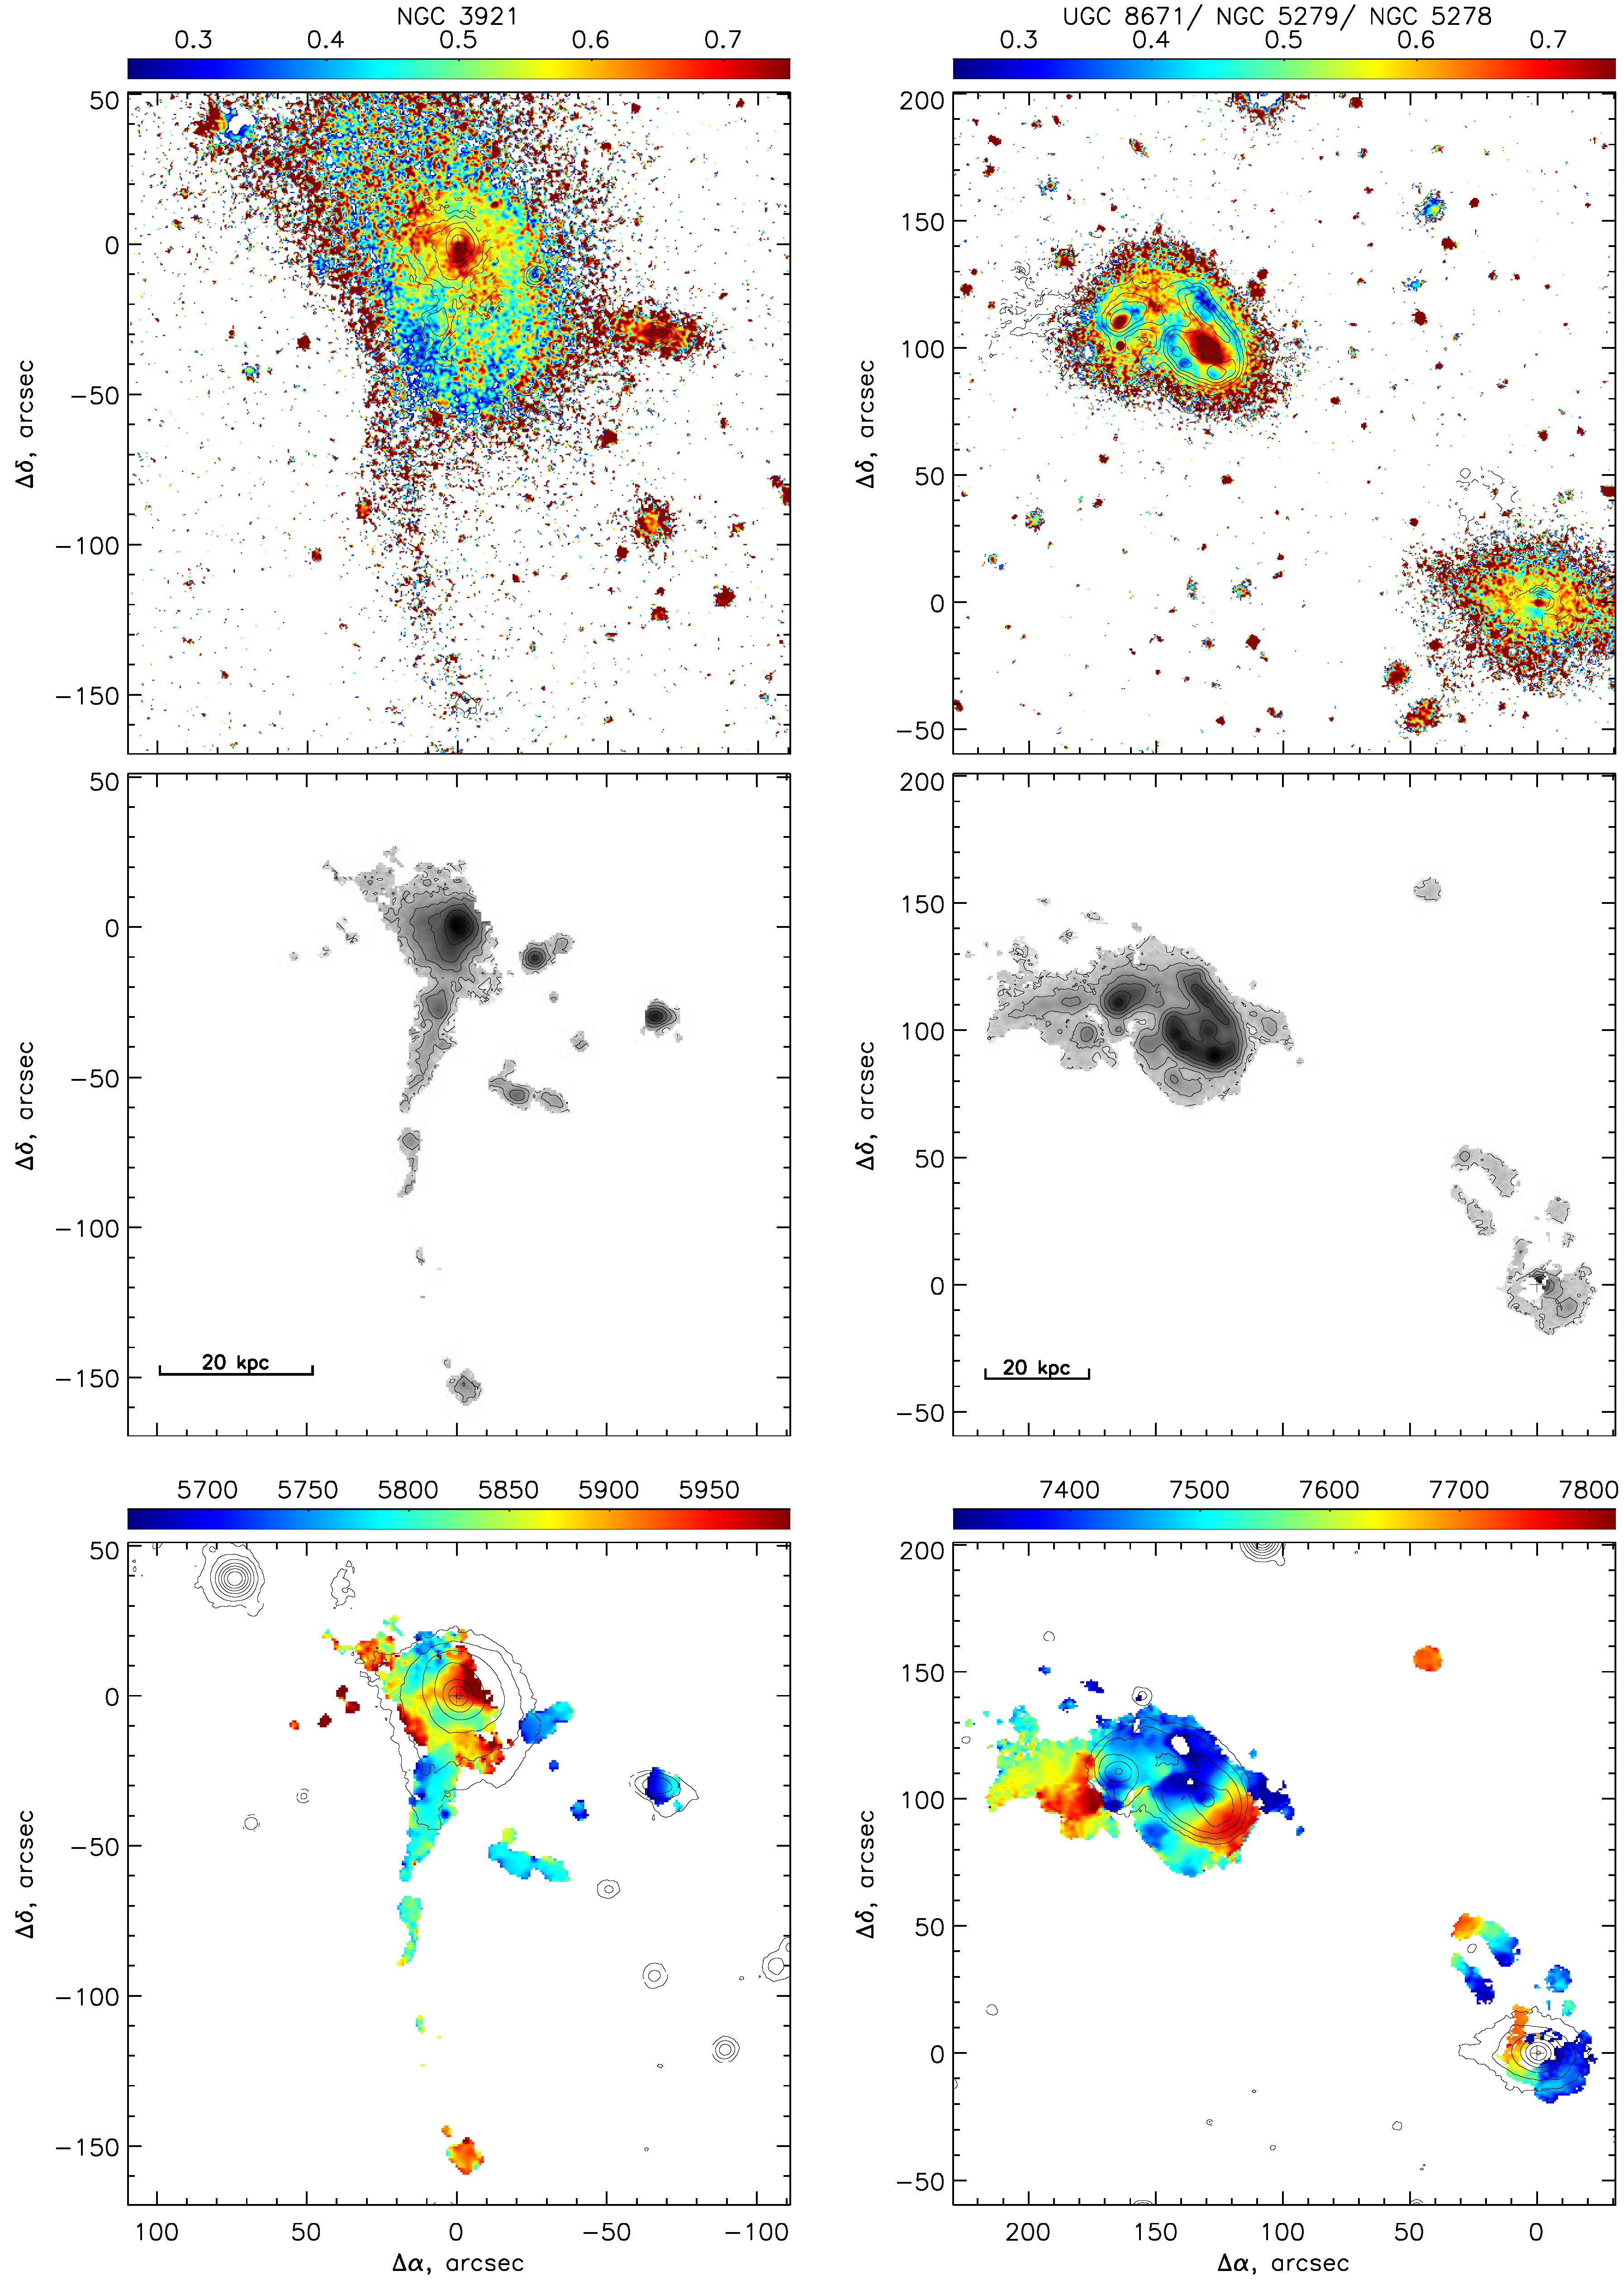
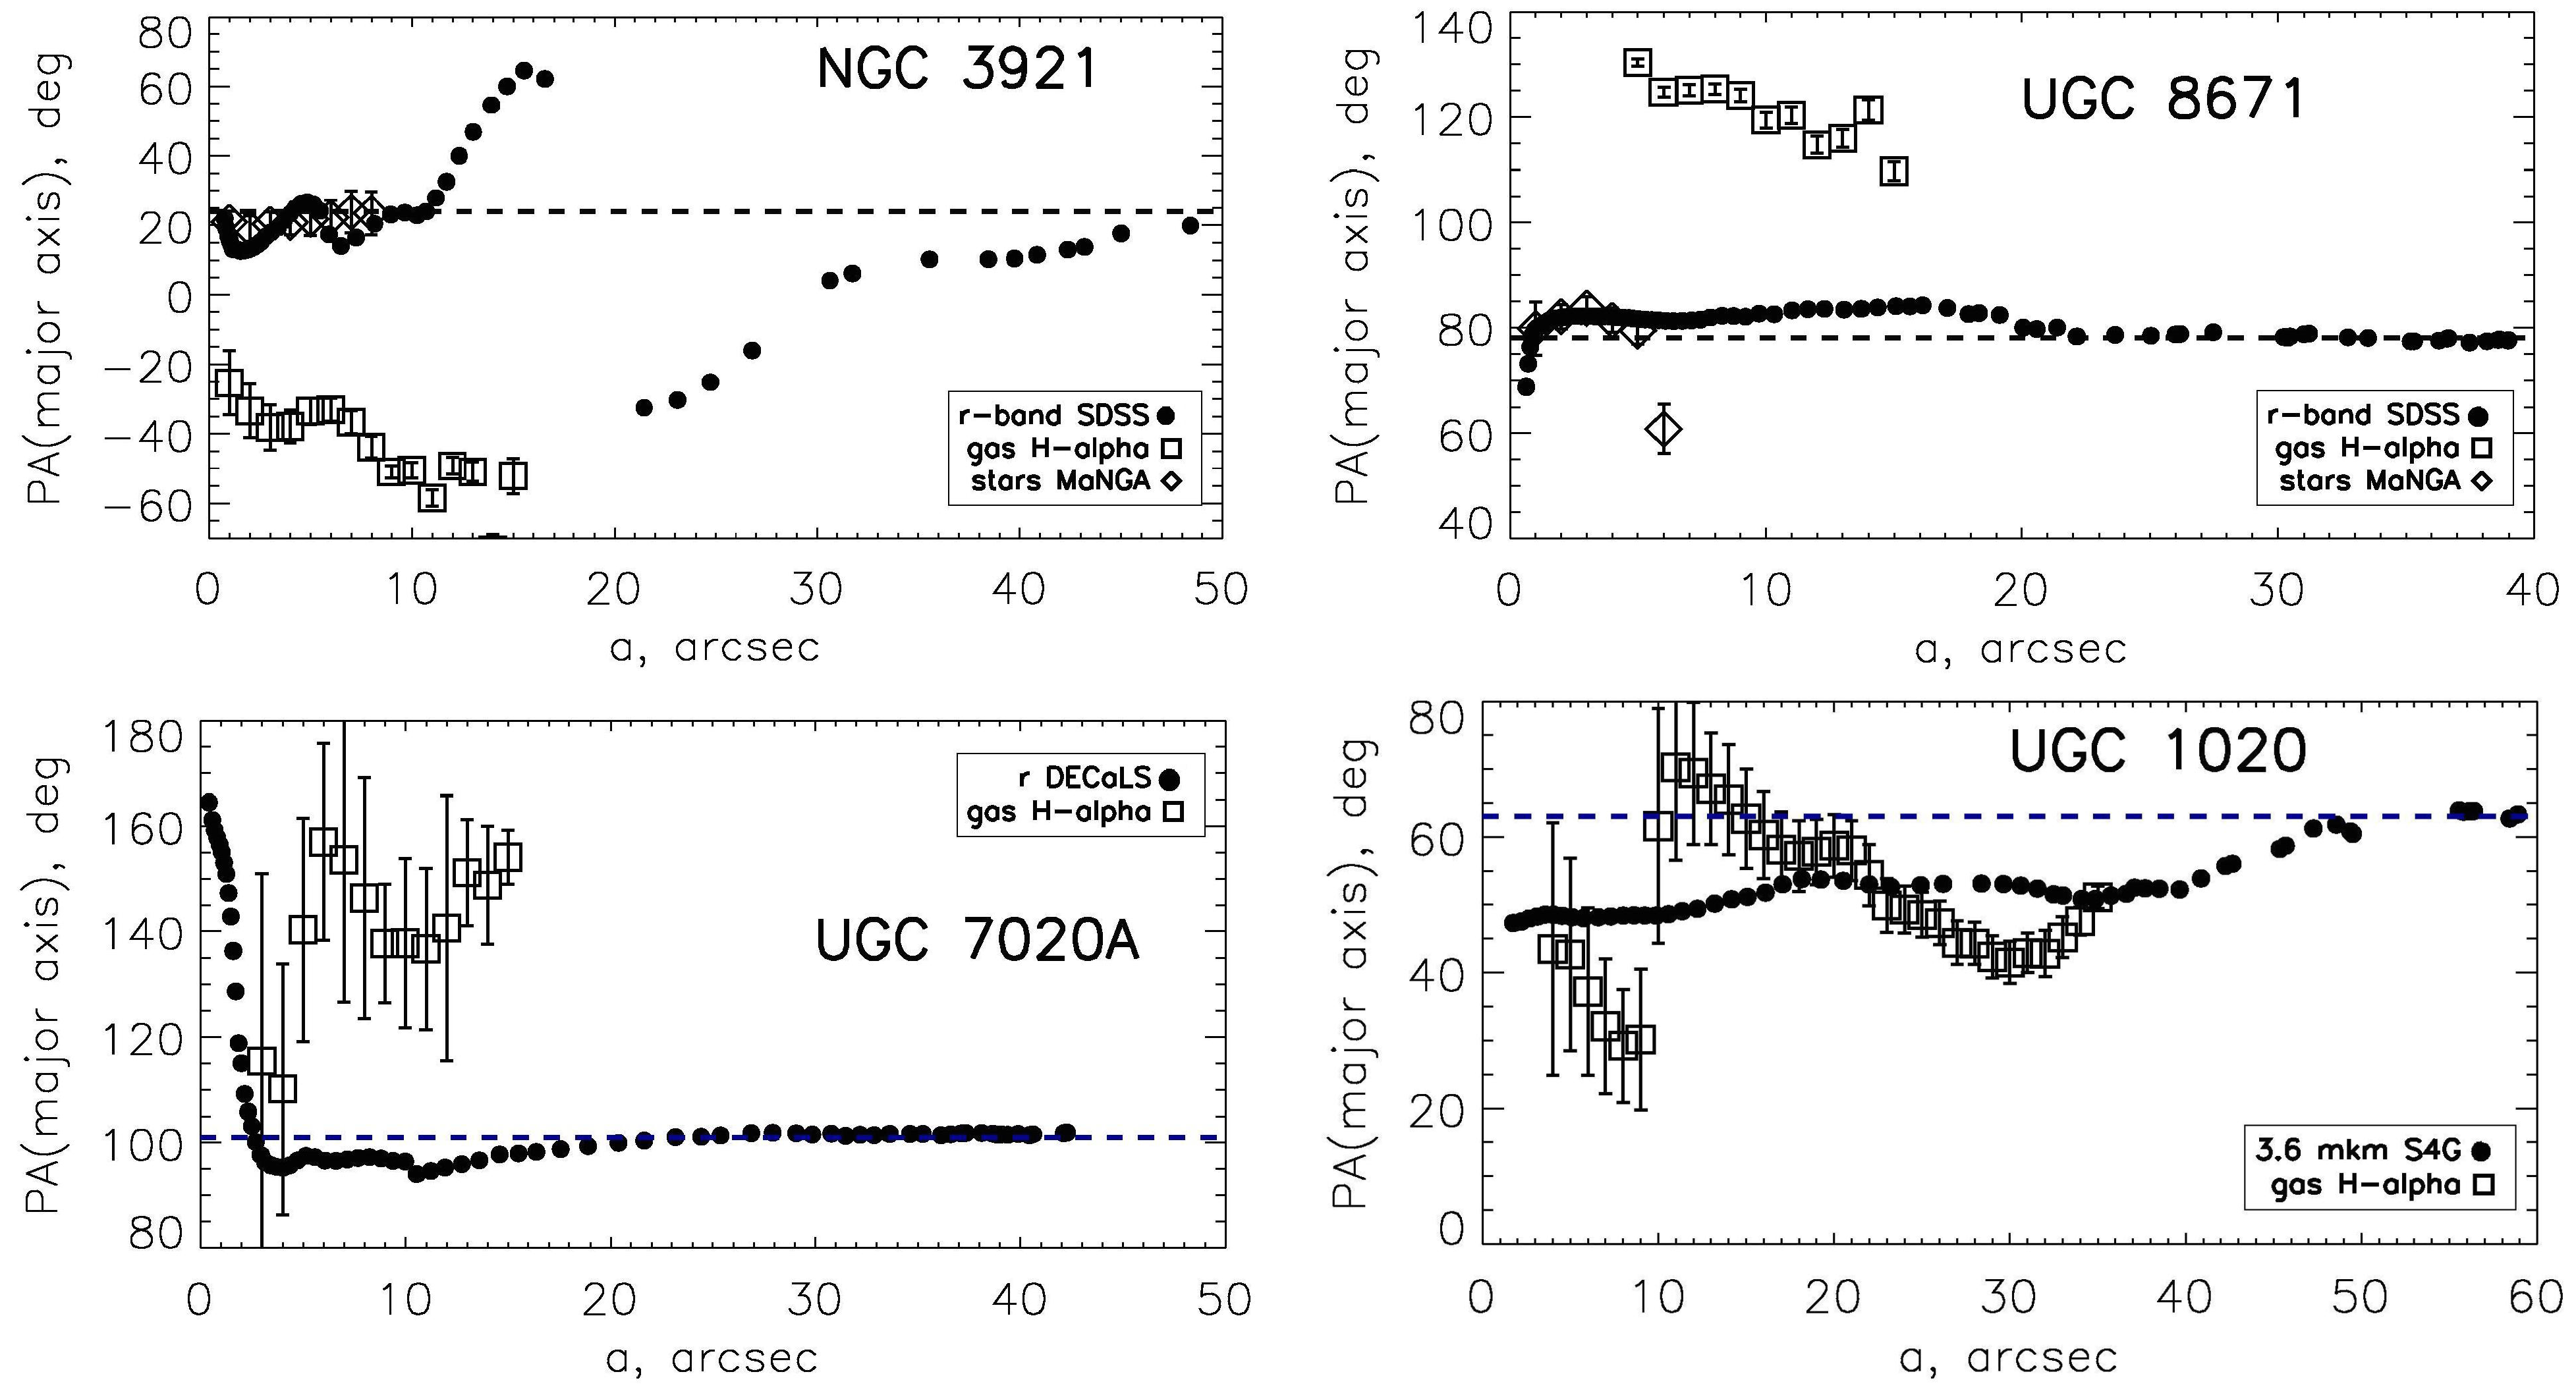
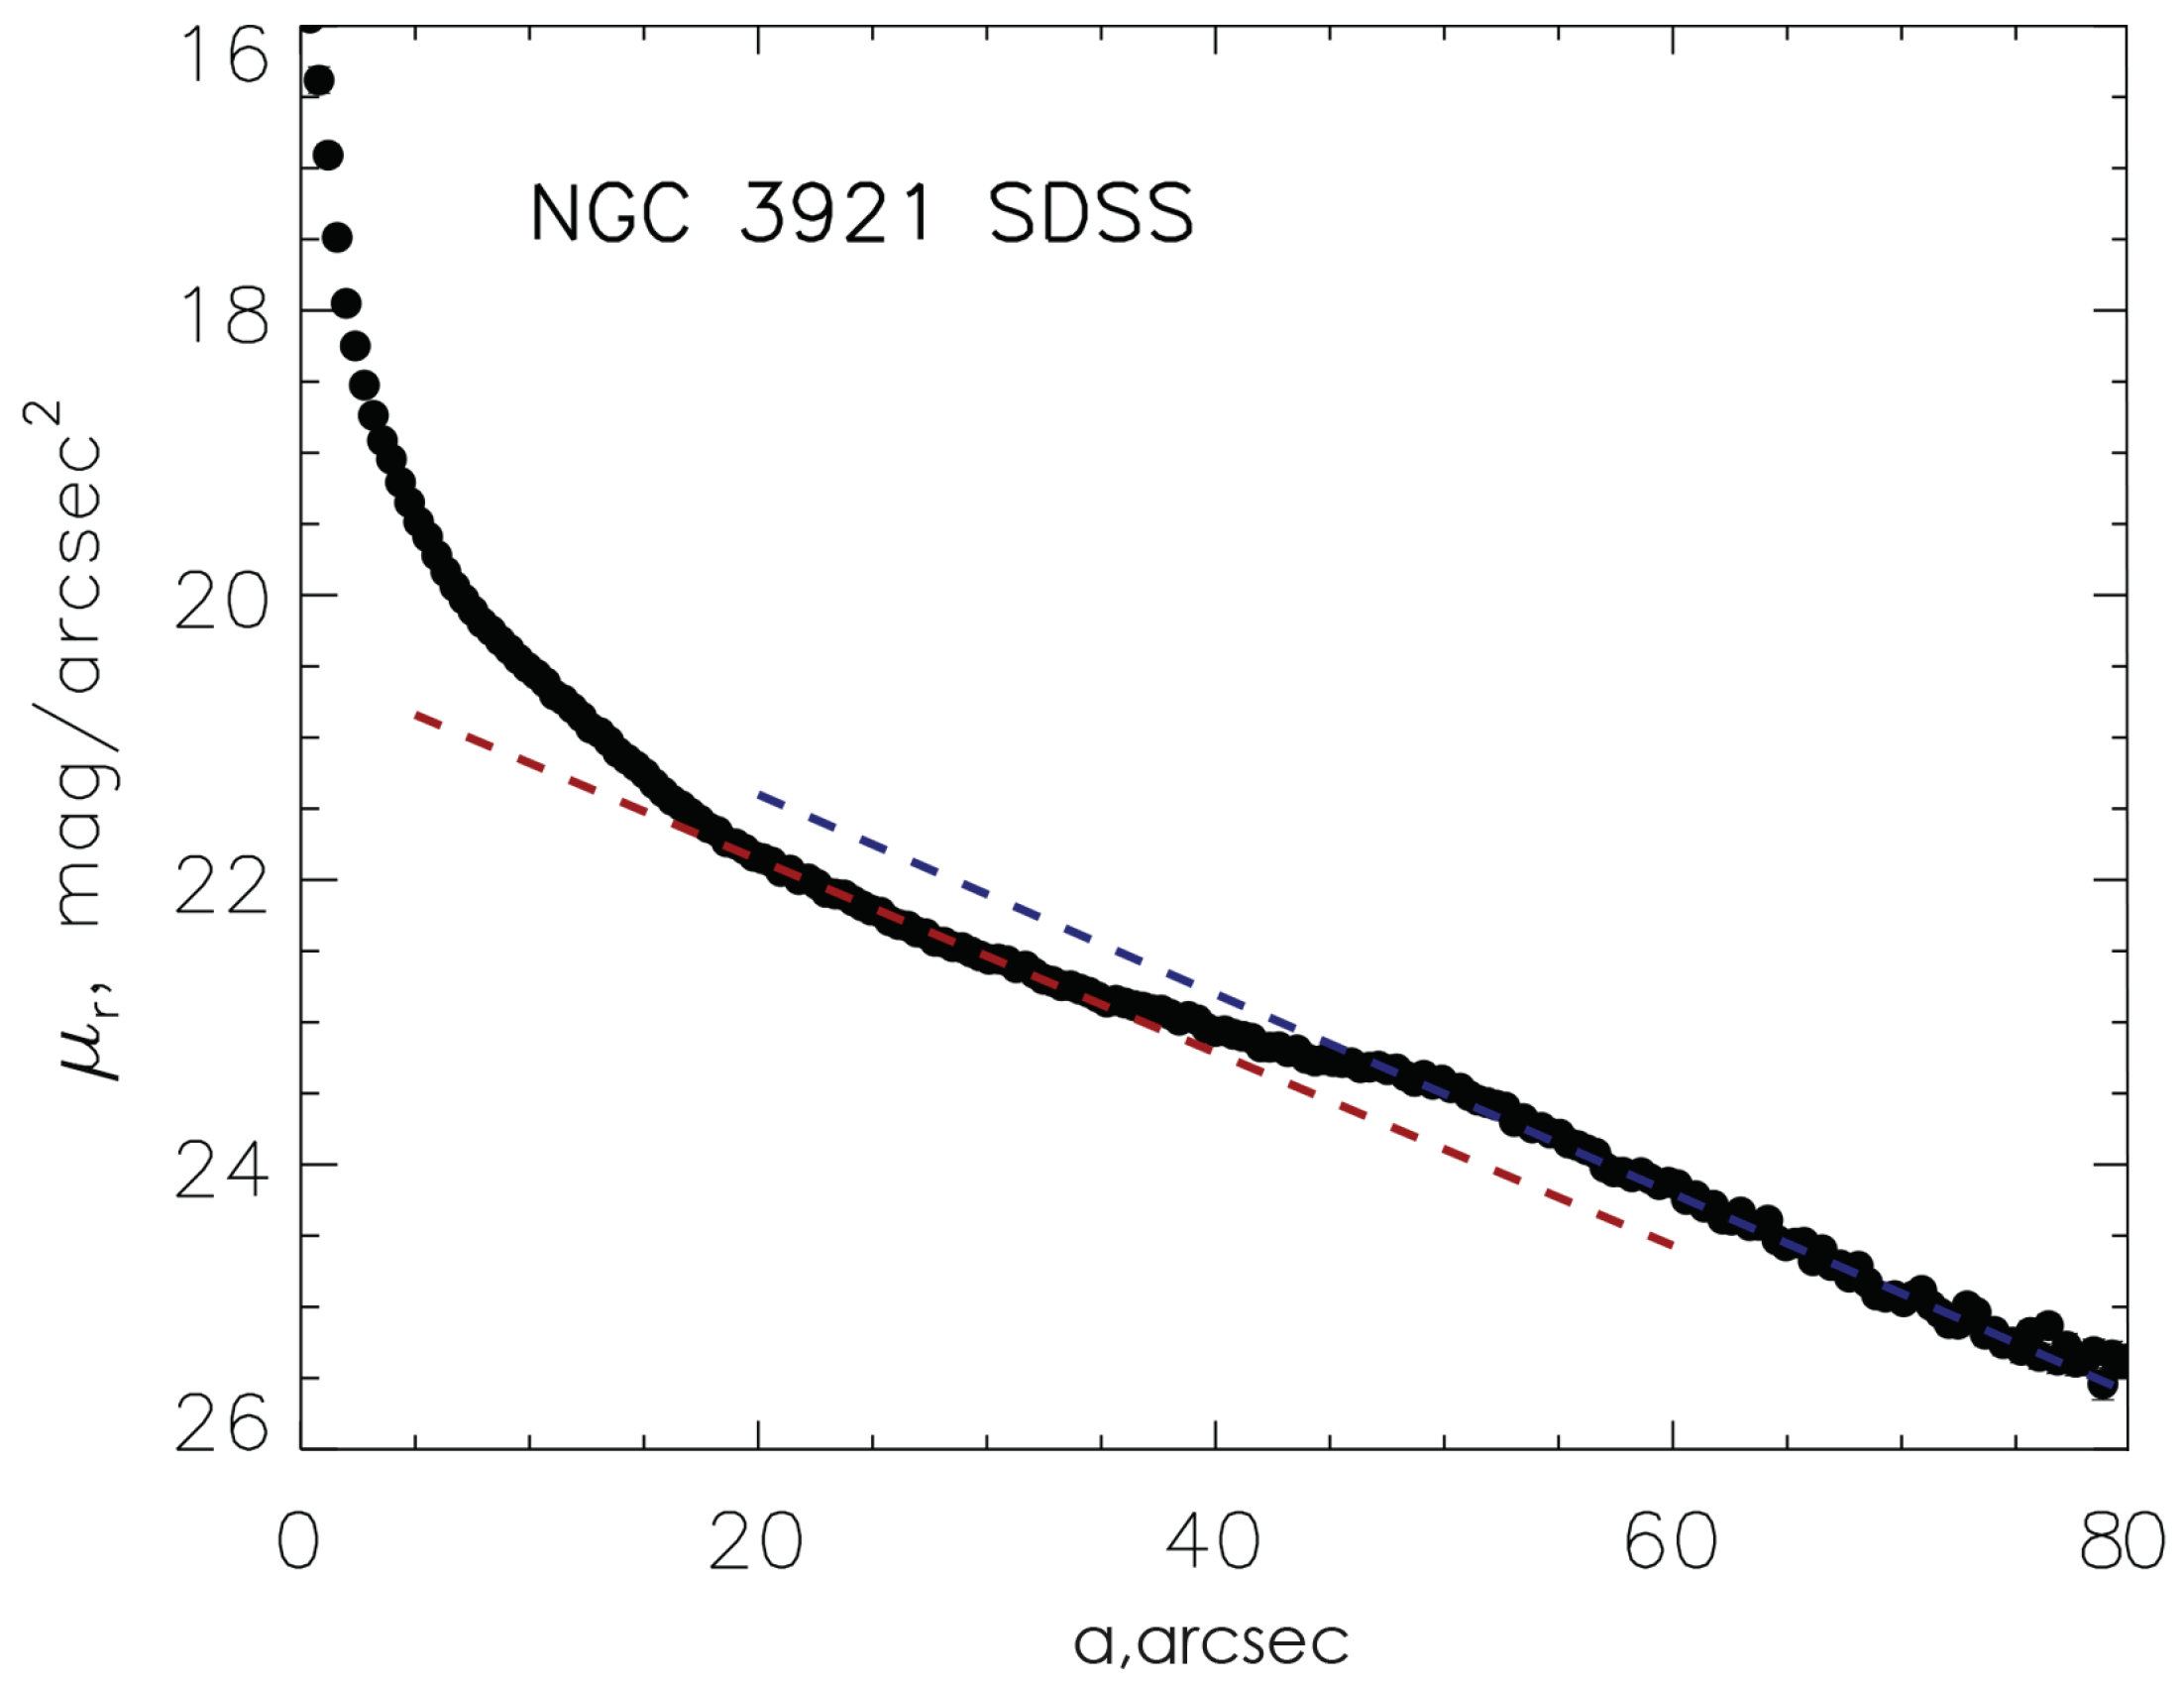
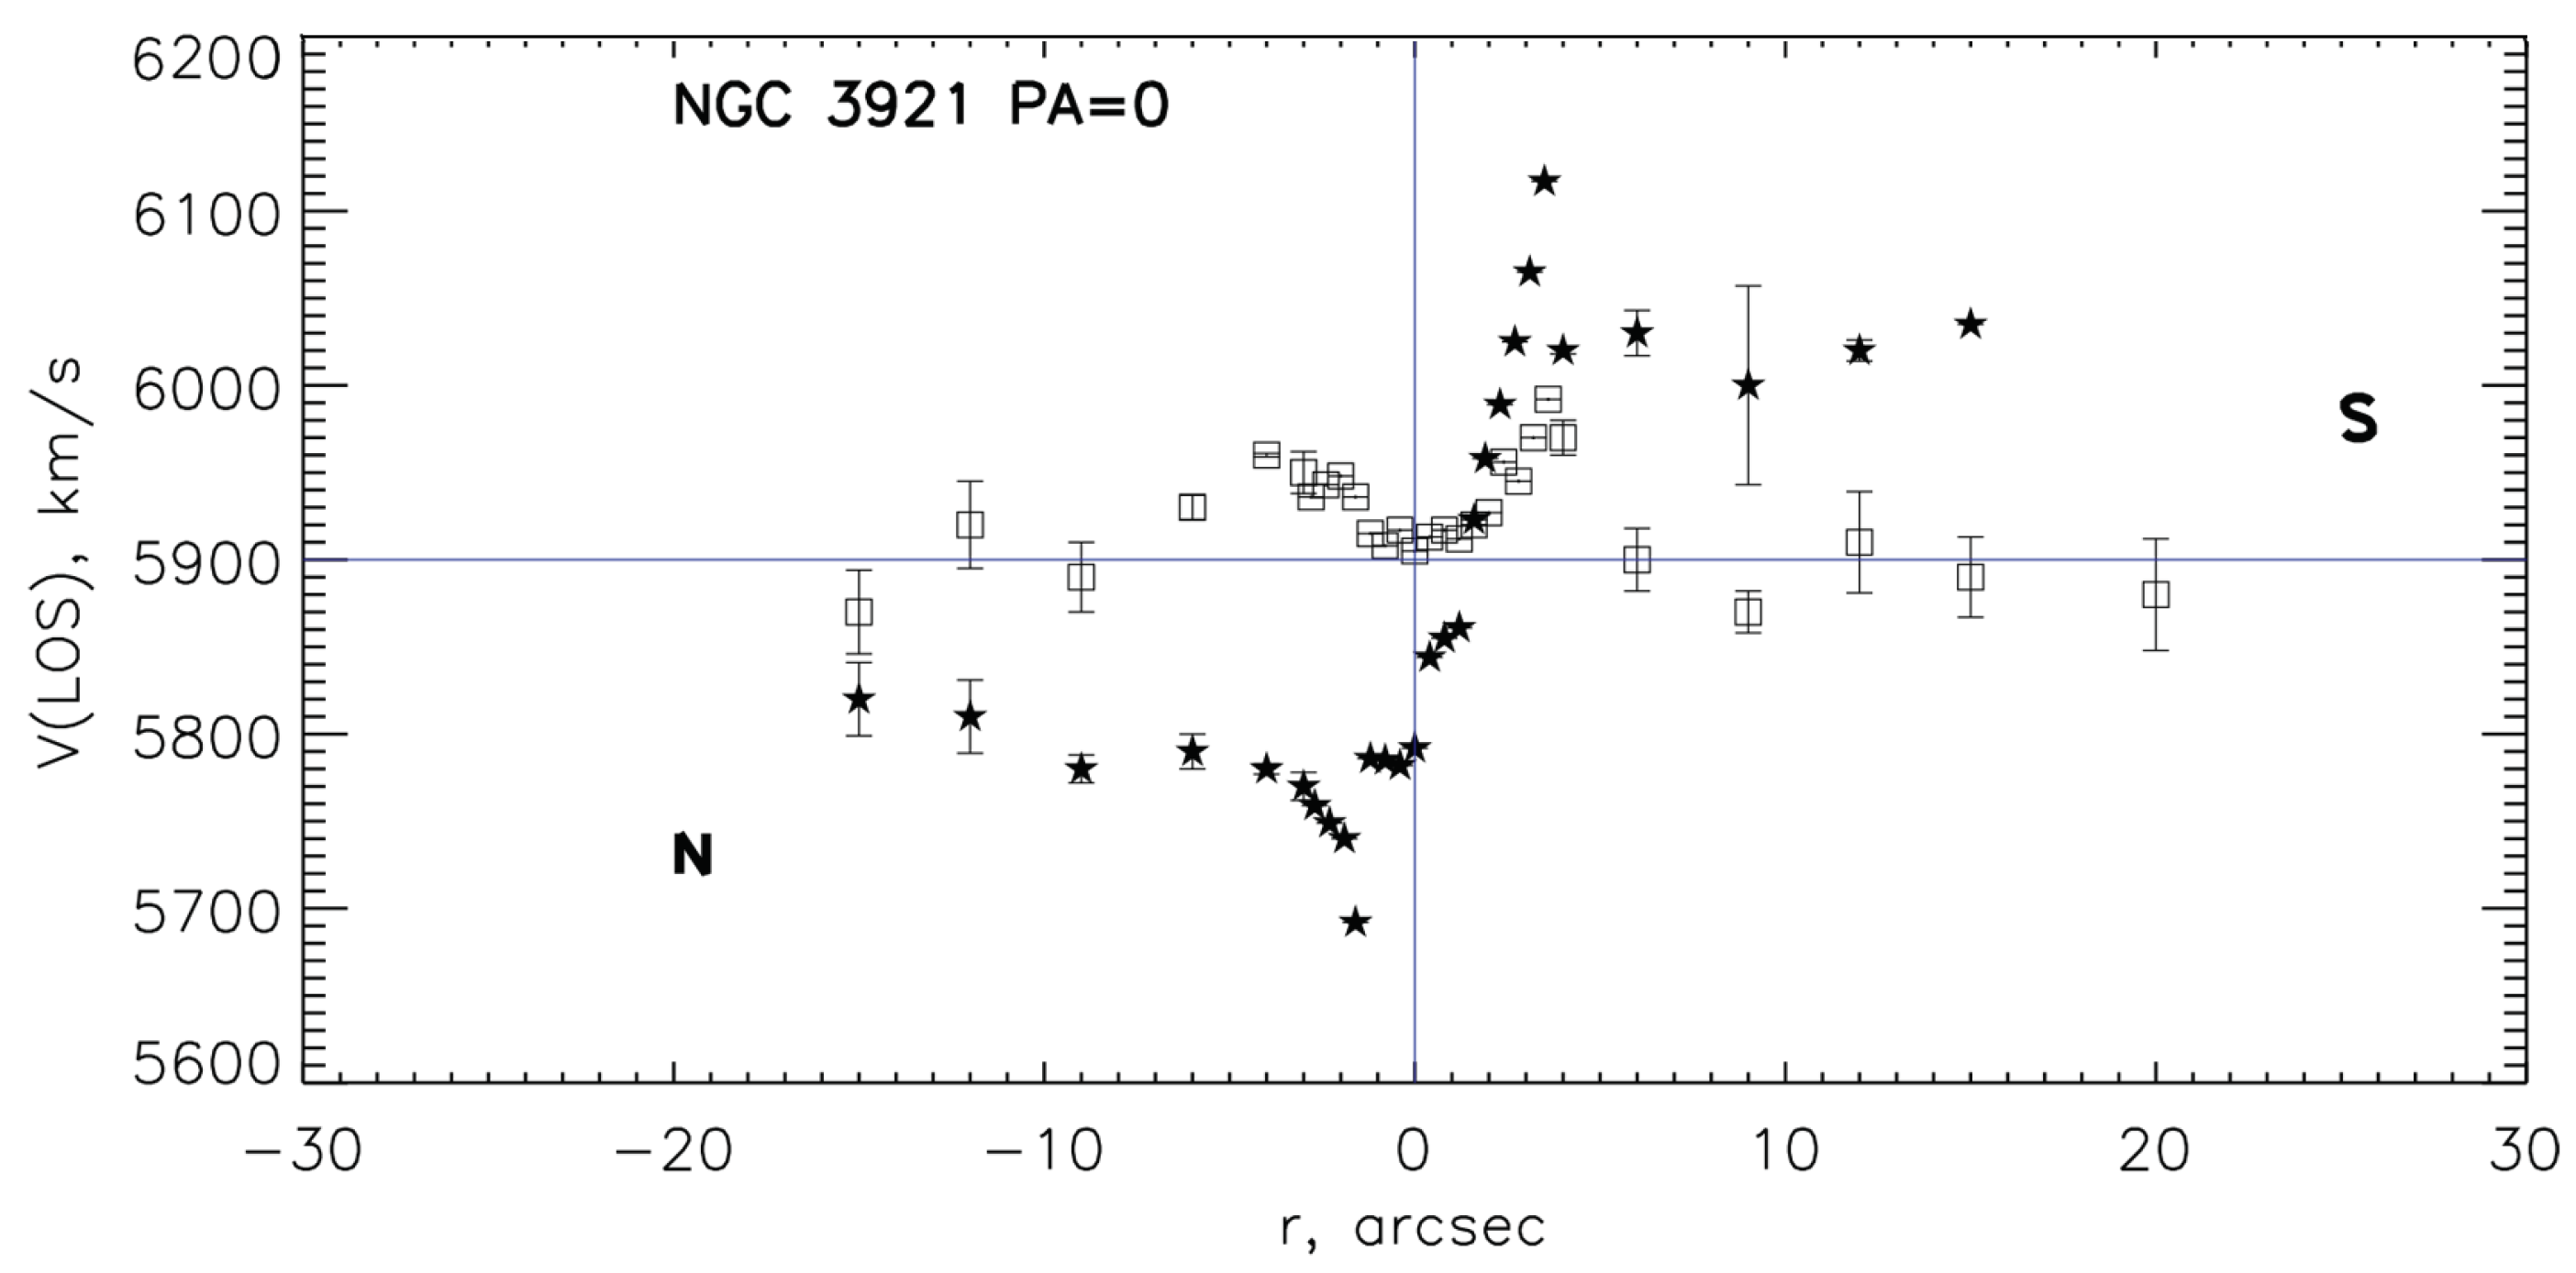
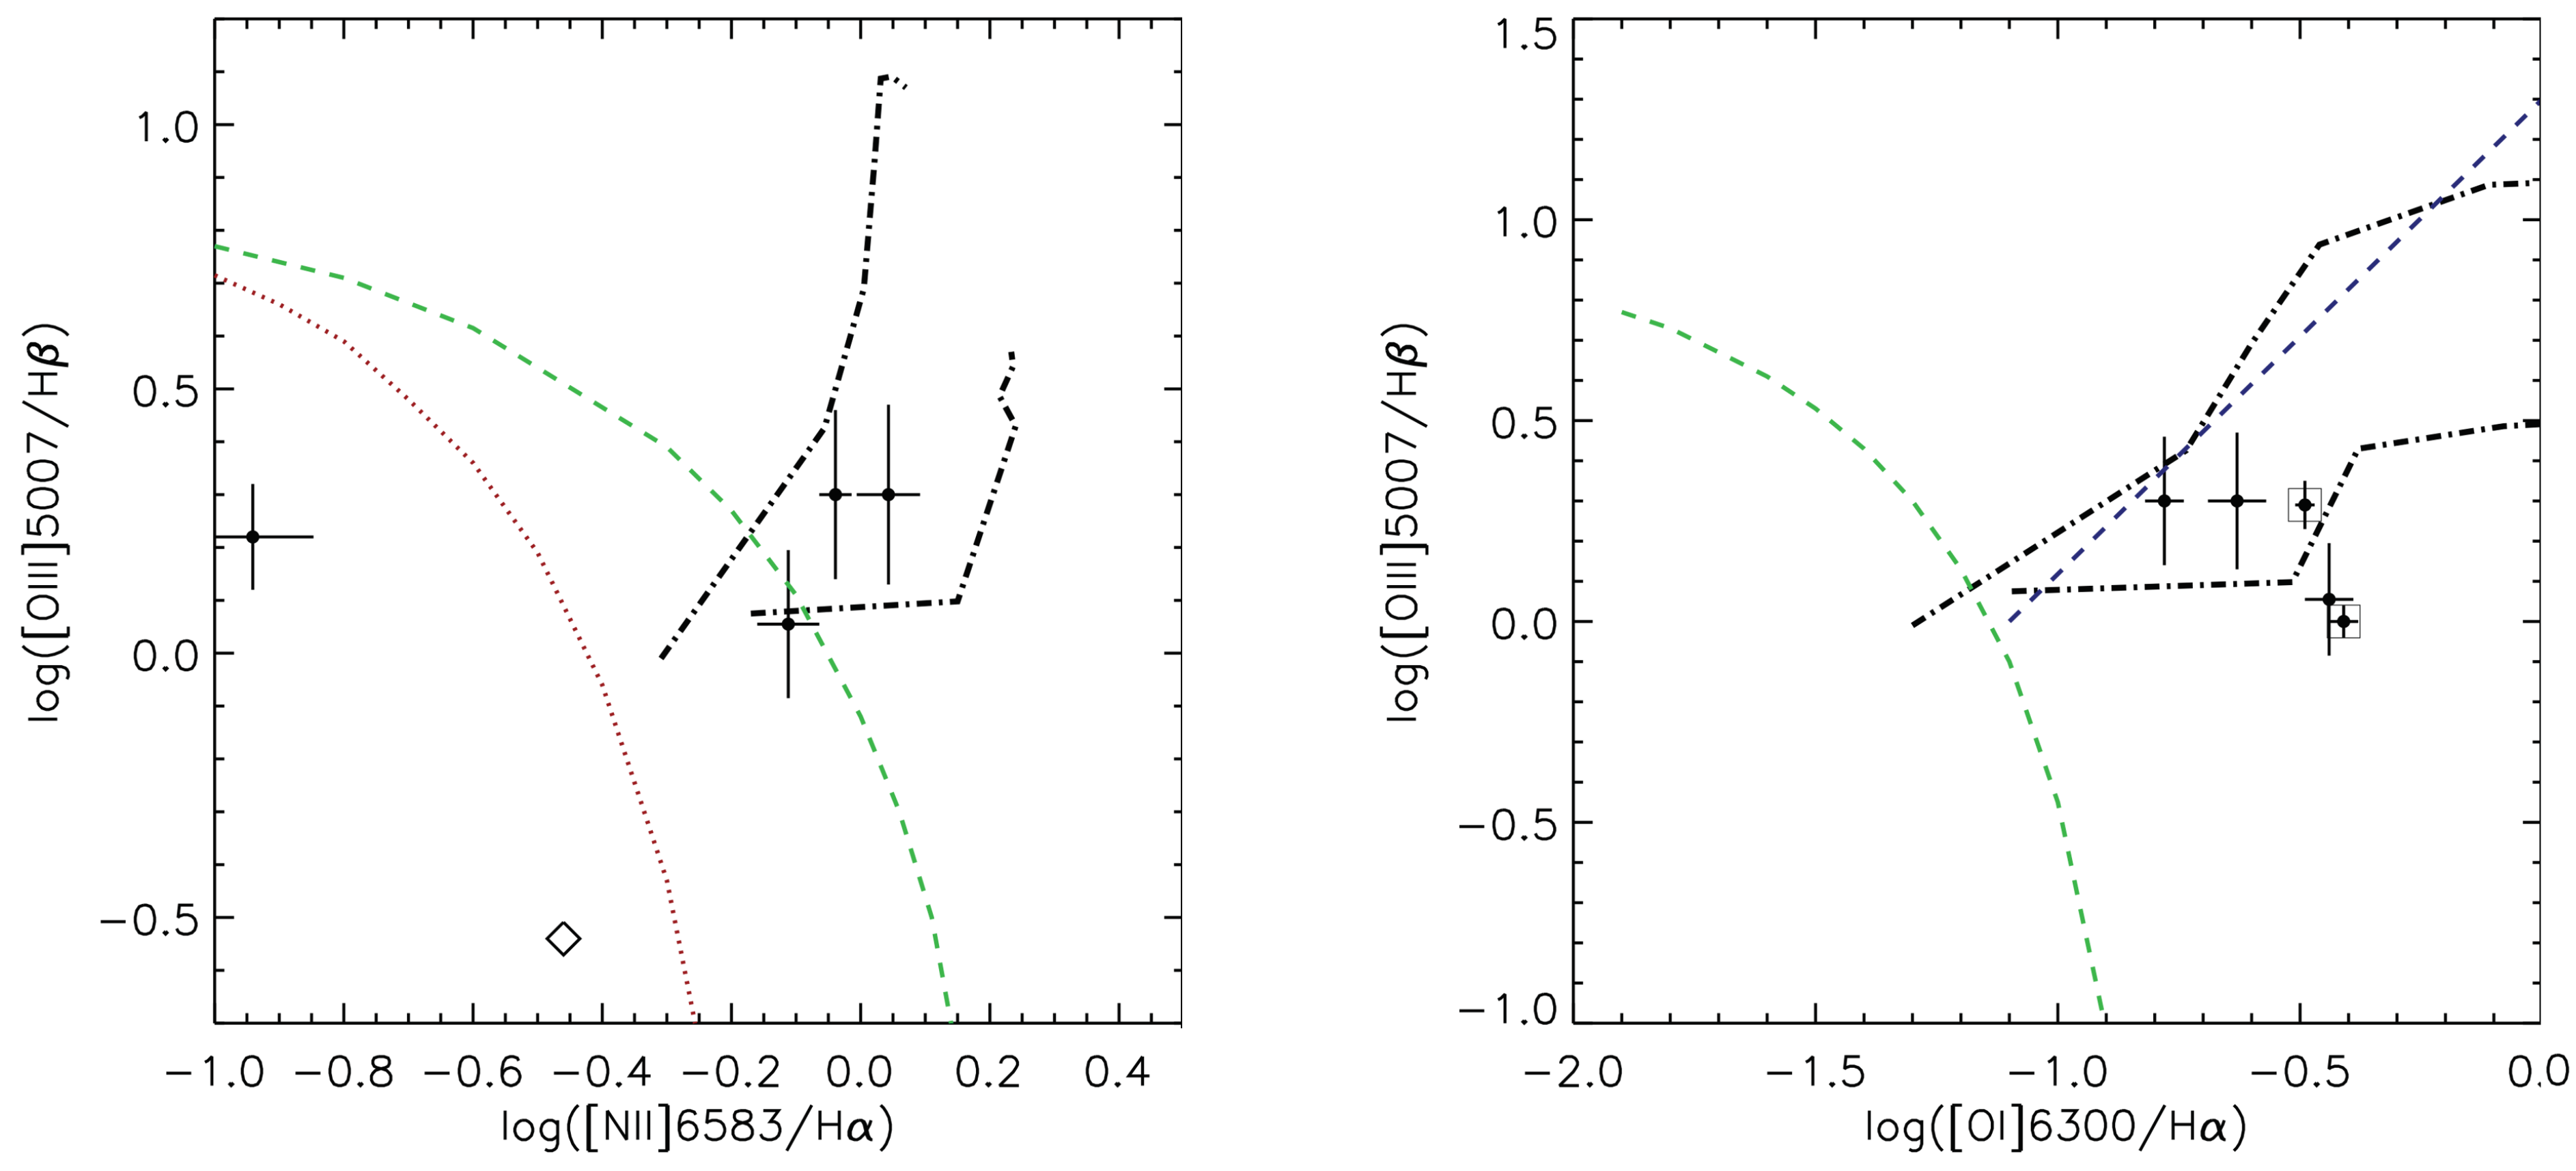
4.1. NGC 3921
4.2. UGC 8671
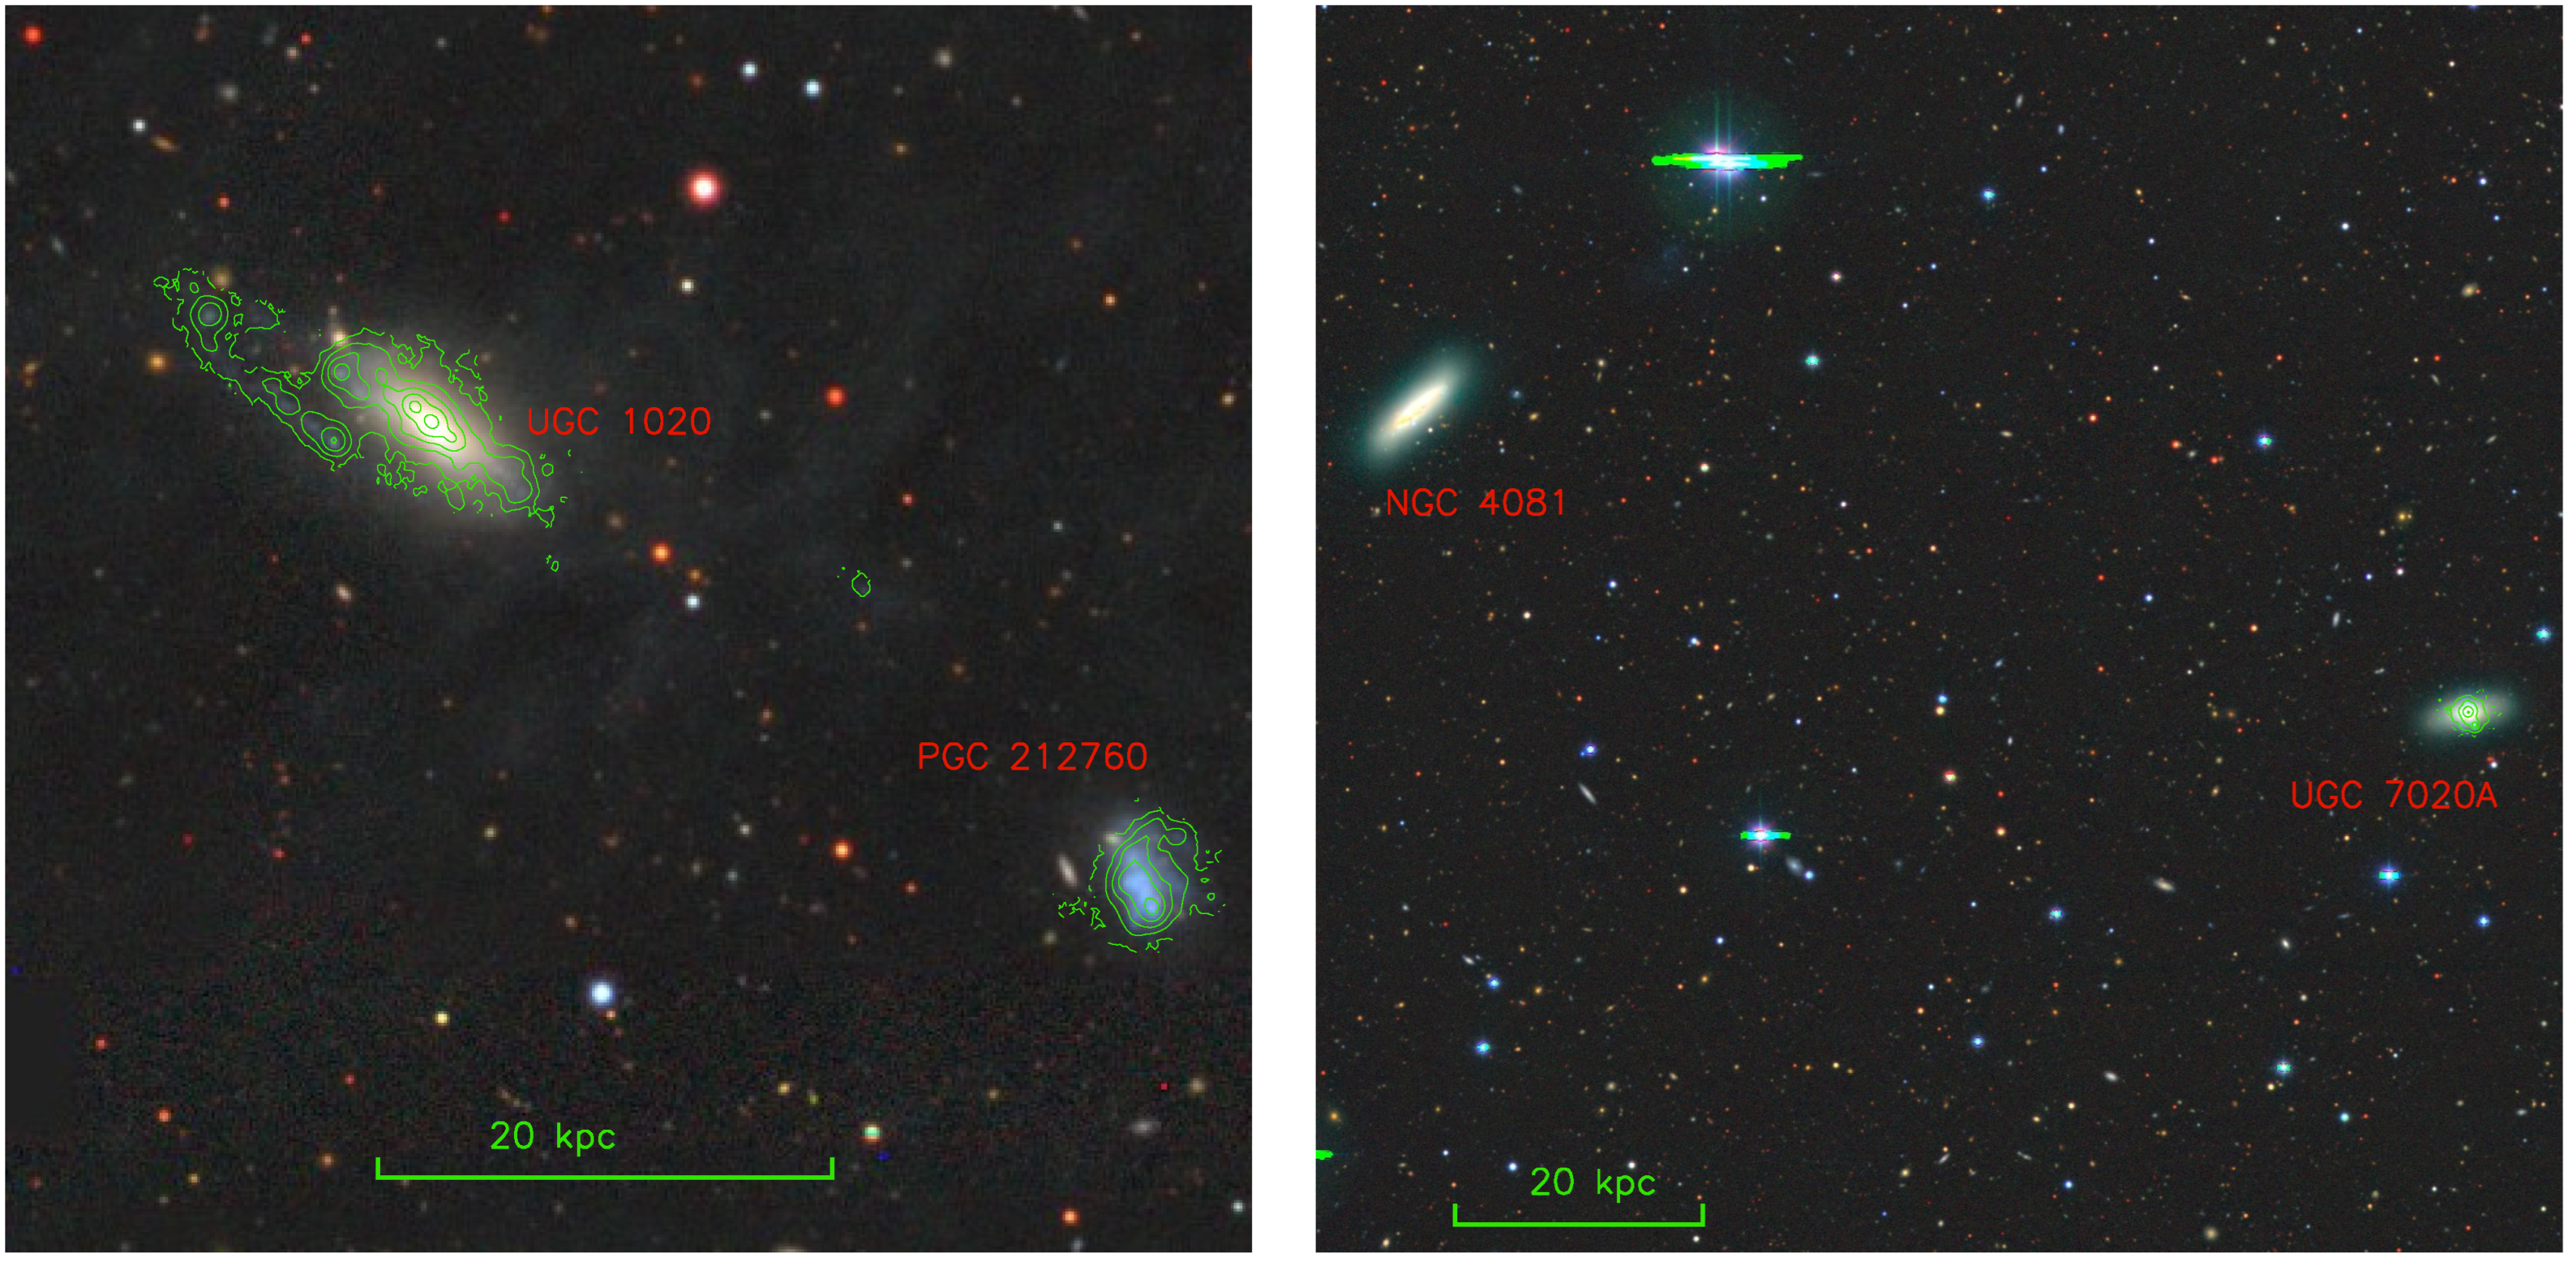
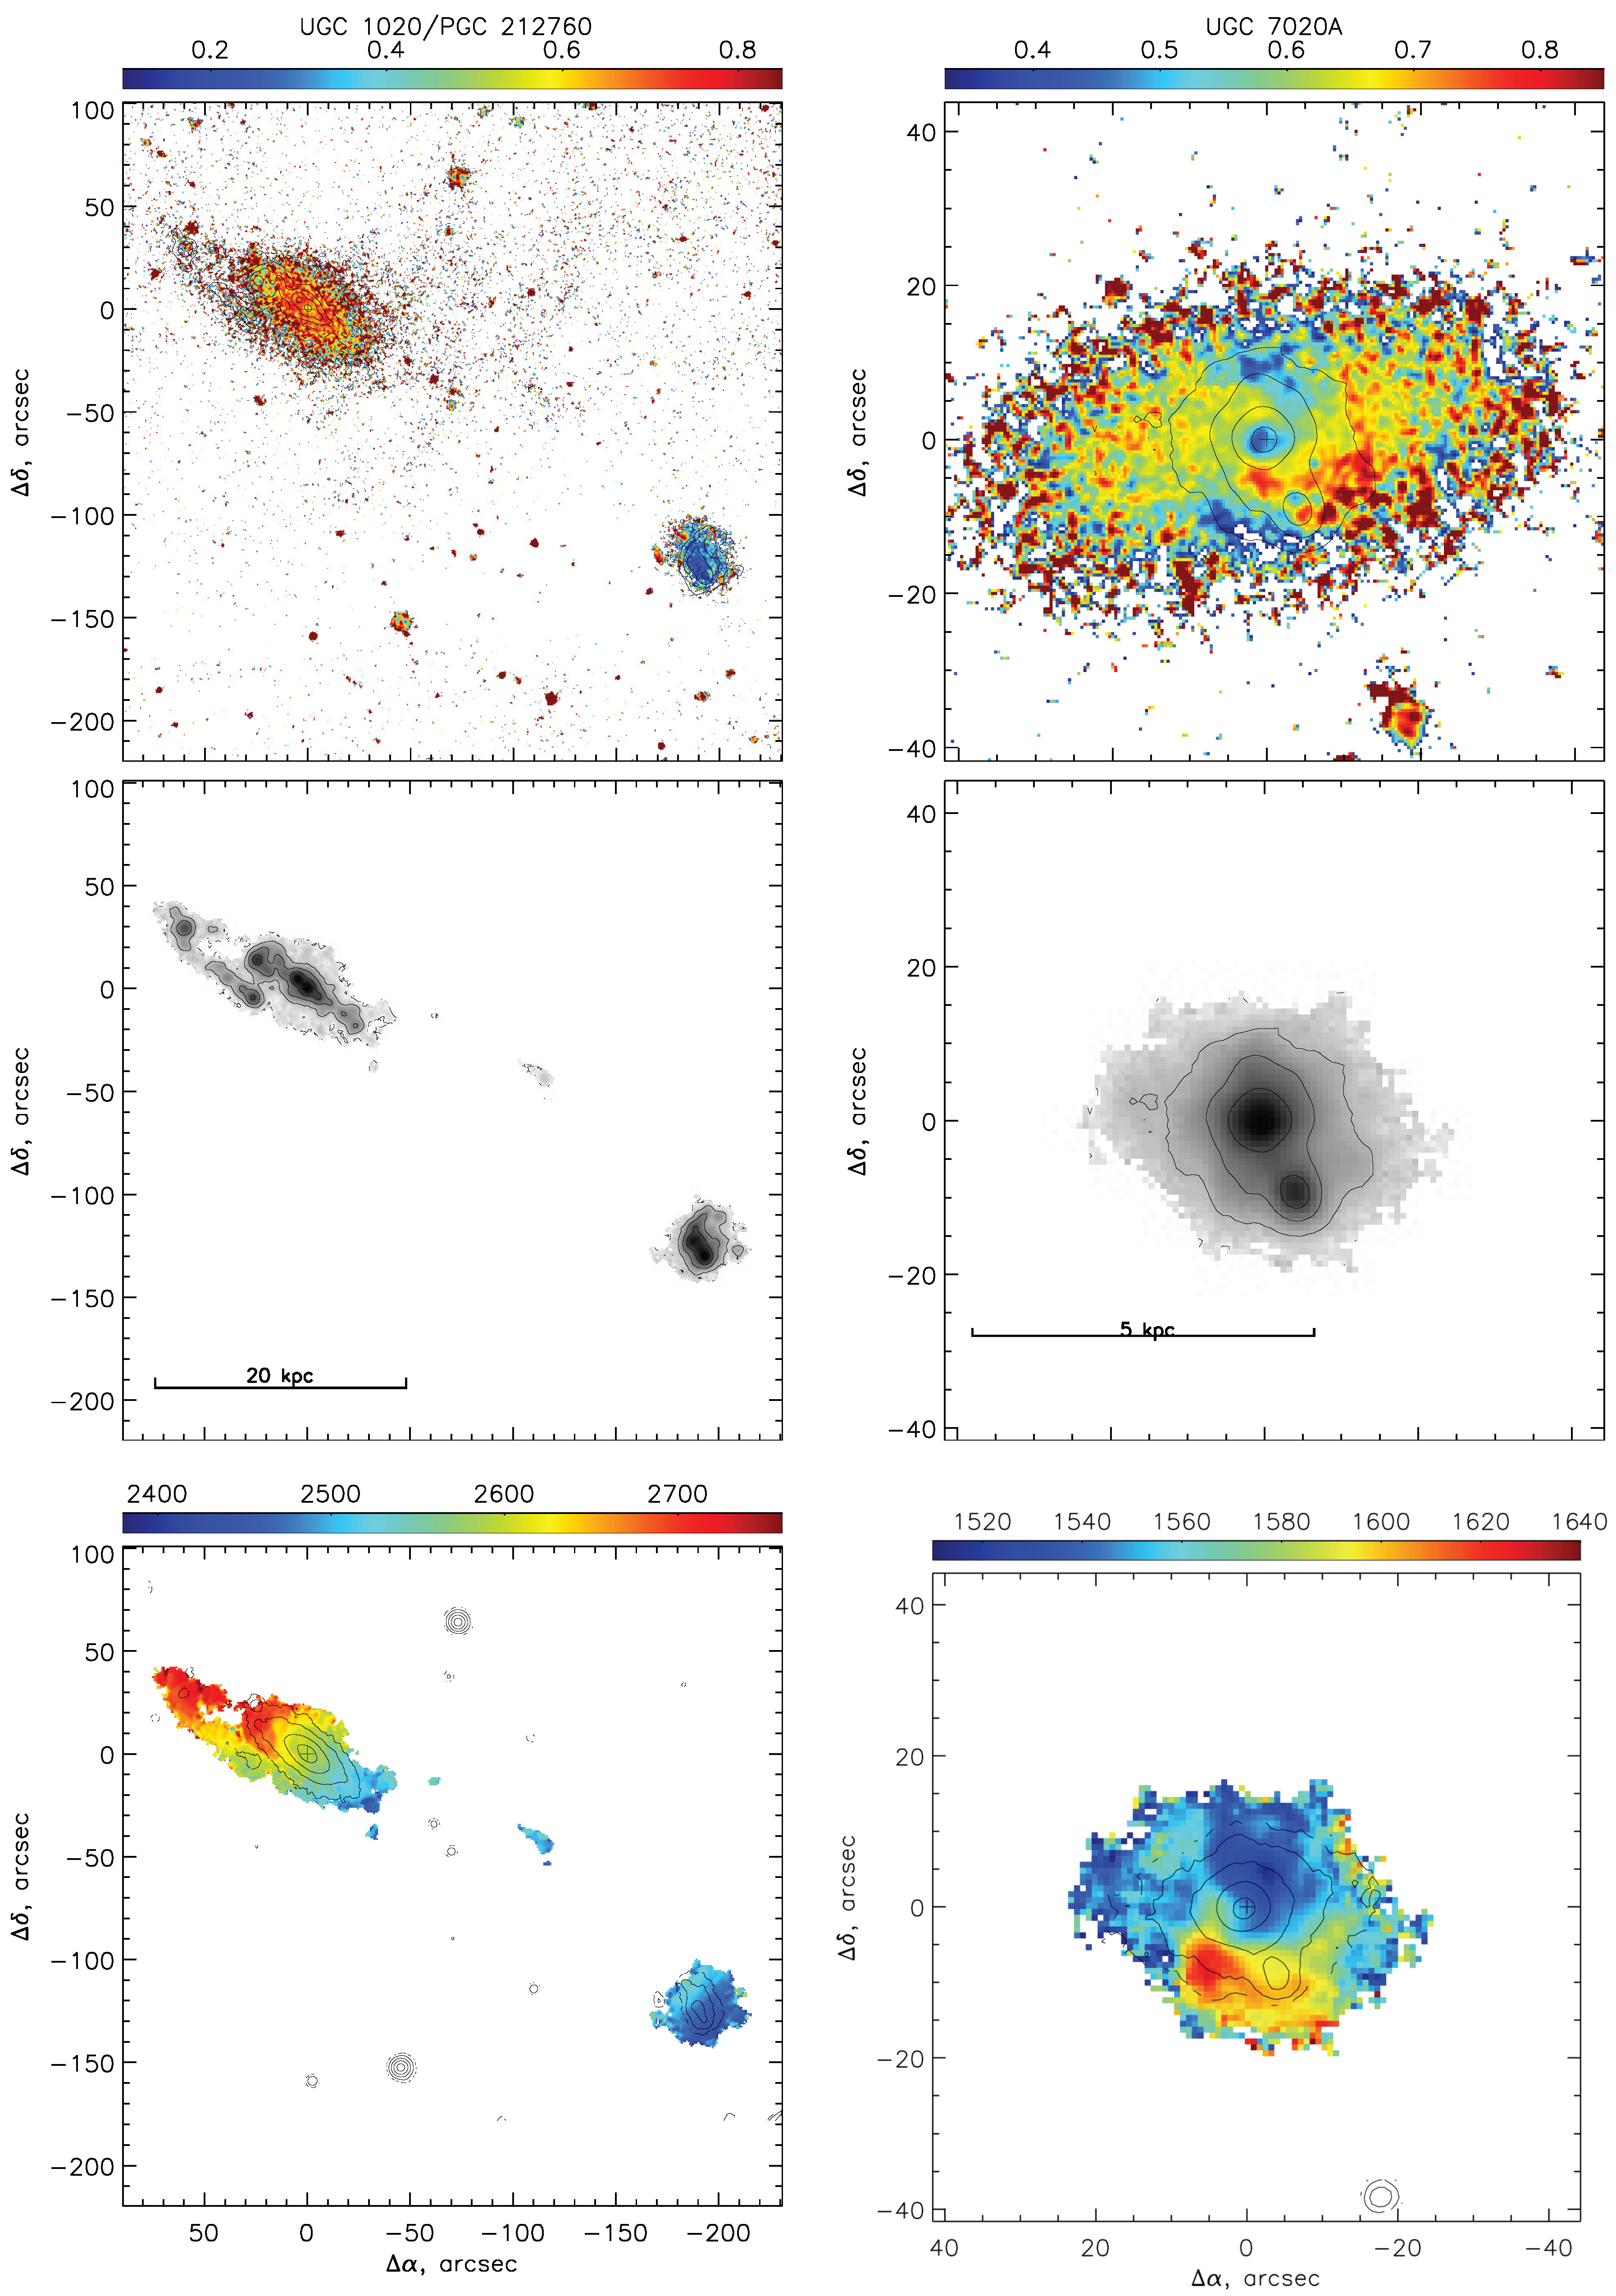
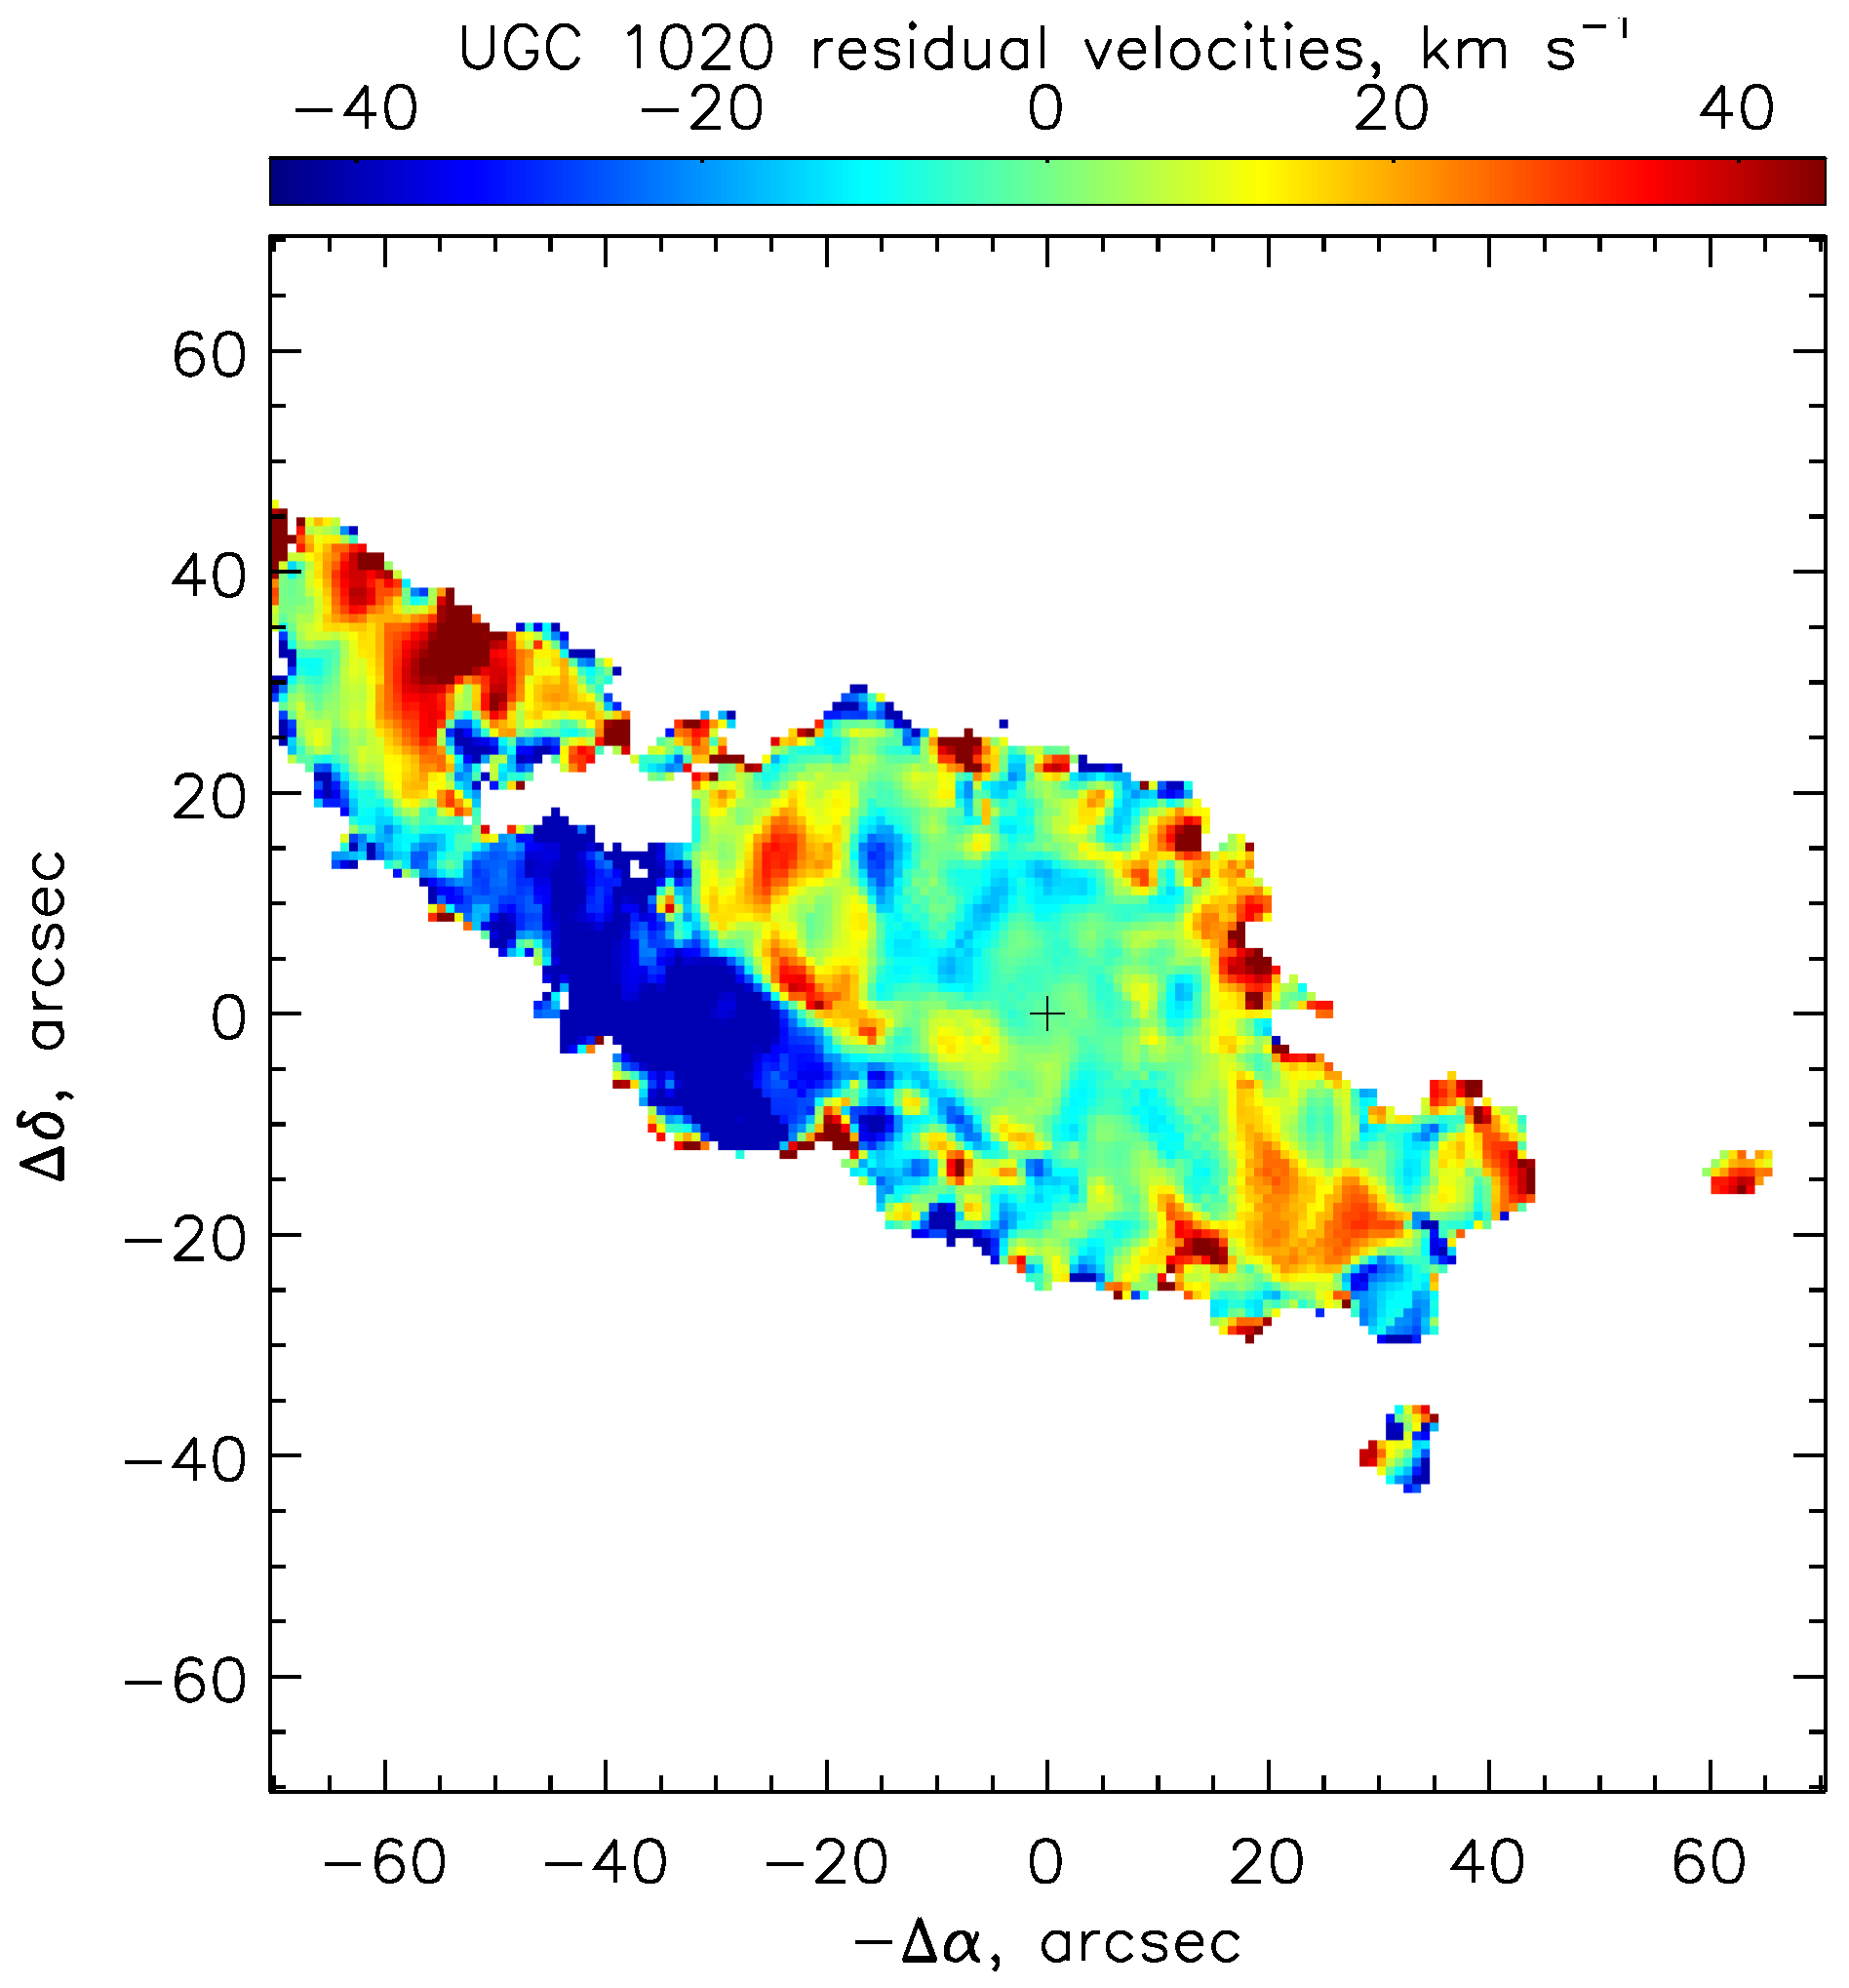
4.3. UGC 1020
4.4. UGC 7020A
5. Discussion
6. Conclusions
Author Contributions
Funding
Institutional Review Board Statement
Informed Consent Statement
Data Availability Statement
Acknowledgments
Conflicts of Interest
Abbreviations
| SAO RAS | Special Astrophysical Observatory of the Russian Academy of Sciences |
| FPI | Fabry–Perot Interferometer |
| SFR | Star Formation Rate |
| LOS | Line-of-Sight (Velocities) |
| BPT | Baldwin–Phillips–Terlevich (diagram) |
| SDSS | Sloan Digital Sky Survey |
| 2MASS | Two-Micron All Sky Survey |
| xGASS | GALEX Arecibo SDSS Survey |
| WHISP | Westerbork survey of H I in Irregular and Spiral galaxies |
References
- Sánchez Almeida, J.; Elmegreen, B.G.; Muñoz-Tuñón, C.; Elmegreen, D.M. Star formation sustained by gas accretion. Astron. Astrophys. Rev. 2014, 22, 71. [Google Scholar] [CrossRef]
- Fox, A.; Davé, R. (Eds.) Gas Accretion onto Galaxies; Astrophysics and Space Science Library; SpringerLink: Berlin/Heidelberg, Germany, 2017; Volume 430. [Google Scholar] [CrossRef]
- Tacconi, L.J.; Genzel, R.; Sternberg, A. The Evolution of the Star-Forming Interstellar Medium Across Cosmic Time. Astron. Astrophys. Rev. 2020, 58, 157–203. [Google Scholar] [CrossRef]
- Larson, R.B. Infall of Matter in Galaxies. Nature 1972, 236, 21–23. [Google Scholar] [CrossRef]
- Chiosi, C. Chemical evolution of the galactic disk—The inflow problem. Astron. Astrophys. 1980, 83, 206–216. [Google Scholar]
- Tosi, M. The effect of metal-rich infall on galactic chemical evolution. Astron. Astrophys. 1988, 197, 47–51. [Google Scholar]
- Schiminovich, D.; Catinella, B.; Kauffmann, G.; Fabello, S.; Wang, J.; Hummels, C.; Lemonias, J.; Moran, S.M.; Wu, R.; Giovanelli, R.; et al. The GALEX Arecibo SDSS Survey—II. The star formation efficiency of massive galaxies. Mon. Not. R. Astron. Soc. 2010, 408, 919–934. [Google Scholar] [CrossRef]
- Bigiel, F.; Leroy, A.K.; Walter, F.; Brinks, E.; de Blok, W.J.G.; Kramer, C.; Rix, H.W.; Schruba, A.; Schuster, K.F.; Usero, A.; et al. A Constant Molecular Gas Depletion Time in Nearby Disk Galaxies. Astrophys. J. Lett. 2011, 730, L13. [Google Scholar] [CrossRef]
- Leroy, A.K.; Walter, F.; Sandstrom, K.; Schruba, A.; Munoz-Mateos, J.C.; Bigiel, F.; Bolatto, A.; Brinks, E.; de Blok, W.J.G.; Meidt, S.; et al. Molecular Gas and Star Formation in nearby Disk Galaxies. Astron. J. 2013, 146, 19. [Google Scholar] [CrossRef]
- Kereš, D.; Katz, N.; Weinberg, D.H.; Davé, R. How do galaxies get their gas? Mon. Not. R. Astron. Soc. 2005, 363, 2–28. [Google Scholar] [CrossRef]
- Brooks, A.M.; Governato, F.; Quinn, T.; Brook, C.B.; Wadsley, J. The Role of Cold Flows in the Assembly of Galaxy Disks. Astrophys. J. 2009, 694, 396–410. [Google Scholar] [CrossRef]
- Joung, M.R.; Bryan, G.L.; Putman, M.E. Gas Condensation in the Galactic Halo. Astrophys. J. 2012, 745, 148. [Google Scholar] [CrossRef]
- Marinacci, F.; Binney, J.; Fraternali, F.; Nipoti, C.; Ciotti, L.; Londrillo, P. The mode of gas accretion on to star-forming galaxies. Mon. Not. R. Astron. Soc. 2010, 404, 1464–1474. [Google Scholar] [CrossRef]
- Armillotta, L.; Fraternali, F.; Marinacci, F. Efficiency of gas cooling and accretion at the disc-corona interface. Mon. Not. R. Astron. Soc. 2016, 462, 4157–4170. [Google Scholar] [CrossRef]
- Sancisi, R.; Fraternali, F.; Oosterloo, T.; van der Hulst, T. Cold gas accretion in galaxies. Astron. Astrophys. Rev. 2008, 15, 189–223. [Google Scholar] [CrossRef]
- Vorontsov-Velyaminov, B.A. Atlas i Katalog Vzaimodejstvuûših Galakatik I. Atlas i Katalog Vzaimodejstvuûših Galakatik I. Atlas and Catalog of Interacting Galaxies; Sternberg Institute, Moscow State University: Moscow, Russia, 1959. [Google Scholar]
- Toomre, A.; Toomre, J. Galactic Bridges and Tails. Astrophys. J. 1972, 178, 623–666. [Google Scholar] [CrossRef]
- Salo, H.; Laurikainen, E. The Interacting System NGC 7753–7752 (Arp 86). II. N-Body Modeling. Astrophys. J. 1993, 410, 586. [Google Scholar] [CrossRef]
- Barrabés, E.; Cors, J.M.; Garcia-Taberner, L.; Ollé, M. Tails and bridges in the parabolic restricted three-body problem. Mon. Not. R. Astron. Soc. 2017, 472, 2554–2568. [Google Scholar] [CrossRef]
- Struck, C. Simulations of Collisions between Two Gas-rich Galaxy Disks with Heating and Cooling. Astrophys. J. Suppl. Ser. 1997, 113, 269–309. [Google Scholar] [CrossRef]
- Chilingarian, I.V.; Di Matteo, P.; Combes, F.; Melchior, A.L.; Semelin, B. The GalMer database: Galaxy mergers in the virtual observatory. Astron. Astrophys. 2010, 518, A61. [Google Scholar] [CrossRef]
- Pettitt, A.R.; Tasker, E.J.; Wadsley, J.W.; Keller, B.W.; Benincasa, S.M. Star formation and ISM morphology in tidally induced spiral structures. Mon. Not. R. Astron. Soc. 2017, 468, 4189–4204. [Google Scholar] [CrossRef]
- Vergani, D.; Pizzella, A.; Corsini, E.M.; van Driel, W.; Buson, L.M.; Dettmar, R.J.; Bertola, F. NGC 5719/13: Interacting spirals forming a counter-rotating stellar disc. Astron. Astrophys. 2007, 463, 883–892. [Google Scholar] [CrossRef]
- Wu, G.; Martínez-Delgado, D.; Henkel, C.; Kroupa, P.; Walter, F.; Krieger, N.; Bolatto, A.D.; Robishaw, T.; Simon, J.D.; Ibáñez Pérez, Á.; et al. H I mapping of the Leo Triplet. Morphologies and kinematics of tails and bridges. Astron. Astrophys. 2022, 658, A25. [Google Scholar] [CrossRef]
- Garcia-Barreto, J.A.; Momjian, E. H I 21 cm Extended Structures to the Northeast and Southwest of NGC 5595: VLA Observations of the Disk Galaxy Pair NGC 5595 and NGC 5597. Astron. J. 2023, 165, 240. [Google Scholar] [CrossRef]
- Smith, B.J.; Giroux, M.L.; Struck, C.; Hancock, M. Spirals, Bridges, and Tails: A Galaxy Evolution Explorer Ultraviolet Atlas of Interacting Galaxies. Astron. J. 2010, 139, 1212–1241. [Google Scholar] [CrossRef]
- Fuentes-Carrera, I.; Rosado, M.; Amram, P.; Dultzin-Hacyan, D.; Cruz-González, I.; Salo, H.; Laurikainen, E.; Bernal, A.; Ambrocio-Cruz, P.; Le Coarer, E. The isolated interacting galaxy pair NGC 5426/27 (Arp 271). Astron. Astrophys. 2004, 415, 451–469. [Google Scholar] [CrossRef]
- Duarte Puertas, S.; Iglesias-Páramo, J.; Vilchez, J.M.; Drissen, L.; Kehrig, C.; Martin, T. Searching for intergalactic star forming regions in Stephan’s Quintet with SITELLE. I. Ionised gas structures and kinematics. Astron. Astrophys. 2019, 629, A102. [Google Scholar] [CrossRef]
- Zasov, A.; Saburova, A.; Katkov, I.; Egorov, O.; Afanasiev, V. Outer regions of the merging system Arp 270. Mon. Not. R. Astron. Soc. 2015, 449, 1605–1613. [Google Scholar] [CrossRef]
- Zasov, A.V.; Saburova, A.S.; Egorov, O.V.; Afanasiev, V.L. Young stellar clumps in the interacting system Arp 305. Mon. Not. R. Astron. Soc. 2018, 477, 4908–4914. [Google Scholar] [CrossRef]
- Repetto, P.; Rosado, M.; Gabbasov, R.; Fuentes-Carrera, I. The Interacting Galaxy Pair KPG 390: Hα Kinematics. Astron. J. 2010, 139, 1600–1613. [Google Scholar] [CrossRef]
- Dey, A.; Schlegel, D.J.; Lang, D.; Blum, R.; Burleigh, K.; Fan, X.; Findlay, J.R.; Finkbeiner, D.; Herrera, D.; Juneau, S.; et al. Overview of the DESI Legacy Imaging Surveys. Astron. J. 2019, 157, 168. [Google Scholar] [CrossRef]
- Leroy, A.K.; Sandstrom, K.M.; Lang, D.; Lewis, A.; Salim, S.; Behrens, E.A.; Chastenet, J.; Chiang, I.D.; Gallagher, M.J.; Kessler, S.; et al. A z = 0 Multiwavelength Galaxy Synthesis. I. A WISE and GALEX Atlas of Local Galaxies. Astrophys. J. Suppl. Ser. 2019, 244, 24. [Google Scholar] [CrossRef]
- Durbala, A.; Finn, R.A.; Crone Odekon, M.; Haynes, M.P.; Koopmann, R.A.; O’Donoghue, A.A. The ALFALFA-SDSS Galaxy Catalog. Astron. J. 2020, 160, 271. [Google Scholar] [CrossRef]
- Chang, Y.Y.; van der Wel, A.; da Cunha, E.; Rix, H.W. Stellar Masses and Star Formation Rates for 1M Galaxies from SDSS + WISE. Astrophys. J. Suppl. Ser. 2015, 219, 8. [Google Scholar] [CrossRef]
- Moiseev, A.V. Scanning Fabry–Perot Interferometer of the 6-m SAO RAS Telescope. Astrophys. Bull. 2021, 76, 316–339. [Google Scholar] [CrossRef]
- Afanasiev, V.L.; Moiseev, A.V. Scorpio on the 6 m Telescope: Current State and Perspectives for Spectroscopy of Galactic and Extragalactic Objects. Balt. Astron. 2011, 20, 363–370. [Google Scholar] [CrossRef]
- Moiseev, A.V.; Egorov, O.V. Reduction of CCD observations made with the Fabry-Perot scanning interferometer. II. Additional procedures. Astrophys. Bull. 2008, 63, 181–192. [Google Scholar] [CrossRef]
- Afanasieva, I.; Murzin, V.; Ardilanov, V.; Ivaschenko, N.; Pritychenko, M.; Moiseev, A.; Shablovinskaya, E.; Malygin, E. Astronomical Camera Based on a CCD261-84 Detector with Increased Sensitivity in the Near-Infrared. Photonics Sol. Energy Syst. 2023, 10, 774. [Google Scholar] [CrossRef]
- Alam, S.; Albareti, F.D.; Allende Prieto, C.; Anders, F.; Anderson, S.F.; Anderton, T.; Andrews, B.H.; Armengaud, E.; Aubourg, É.; Bailey, S.; et al. The Eleventh and Twelfth Data Releases of the Sloan Digital Sky Survey: Final Data from SDSS-III. Astrophys. J. Suppl. Ser. 2015, 219, 12. [Google Scholar] [CrossRef]
- Moiseev, A.V.; Valdés, J.R.; Chavushyan, V.H. Structure and kinematics of candidatedouble-barred galaxies. Astron. Astrophys. 2004, 421, 433–453. [Google Scholar] [CrossRef]
- Schweizer, F. Colliding and Merging Galaxies. III. The Dynamically Young Merger Remnant NGC 3921. Astron. J. 1996, 111, 109. [Google Scholar] [CrossRef]
- Arp, H. Atlas of Peculiar Galaxies. Astrophys. J. Suppl. 1966, 14, 1. [Google Scholar] [CrossRef]
- Jog, C.J.; Chitre, A. Spiral-like light profiles but elliptical-like kinematics in mergers of galaxies. Astron. Astrophys. 2002, 393, L89–L93. [Google Scholar] [CrossRef]
- Hibbard, J.E.; van Gorkom, J.H. HI, HII, and R-Band Observations of a Galactic Merger Sequence. Astron. J. 1996, 111, 655. [Google Scholar] [CrossRef]
- Simien, F.; Prugniel, P. Kinematical data on early-type galaxies. II. Astron. Astrophys. Suppl. Ser. 1997, 126, 15–19. [Google Scholar] [CrossRef]
- Bundy, K.; Bershady, M.A.; Law, D.R.; Yan, R.; Drory, N.; MacDonald, N.; Wake, D.A.; Cherinka, B.; Sánchez-Gallego, J.R.; Weijmans, A.M.; et al. Overview of the SDSS-IV MaNGA Survey: Mapping nearby Galaxies at Apache Point Observatory. Astrophys. J. 2015, 798, 7. [Google Scholar] [CrossRef]
- Abdurro’uf; Accetta, K.; Aerts, C.; Silva Aguirre, V.; Ahumada, R.; Ajgaonkar, N.; Filiz Ak, N.; Alam, S.; Allende Prieto, C.; Almeida, A.; et al. The Seventeenth Data Release of the Sloan Digital Sky Surveys: Complete Release of MaNGA, MaStar, and APOGEE-2 Data. Astrophys. J. Suppl. Ser. 2022, 259, 35. [Google Scholar] [CrossRef]
- Baldwin, J.A.; Phillips, M.M.; Terlevich, R. Classification parameters for the emission-line spectra of extragalactic objects. Publ. Astron. Soc. Pac. 1981, 93, 5–19. [Google Scholar] [CrossRef]
- Kewley, L.J.; Dopita, M.A.; Sutherland, R.S.; Heisler, C.A.; Trevena, J. Theoretical Modeling of Starburst Galaxies. Astrophys. J. 2001, 556, 121–140. [Google Scholar] [CrossRef]
- Kauffmann, G.; Heckman, T.M.; Tremonti, C.; Brinchmann, J.; Charlot, S.; White, S.D.M.; Ridgway, S.E.; Brinkmann, J.; Fukugita, M.; Hall, P.B.; et al. The host galaxies of active galactic nuclei. Mon. Not. R. Astron. Soc. 2003, 346, 1055–1077. [Google Scholar] [CrossRef]
- Allen, M.G.; Groves, B.A.; Dopita, M.A.; Sutherland, R.S.; Kewley, L.J. The MAPPINGS III Library of Fast Radiative Shock Models. Astrophys. J. Suppl. Ser. 2008, 178, 20–55. [Google Scholar] [CrossRef]
- Knierman, K.A.; Gallagher, S.C.; Charlton, J.C.; Hunsberger, S.D.; Whitmore, B.; Kundu, A.; Hibbard, J.E.; Zaritsky, D. From Globular Clusters to Tidal Dwarfs: Structure Formation in the Tidal Tails of Merging Galaxies. Astron. J. 2003, 126, 1227–1244. [Google Scholar] [CrossRef]
- Kewley, L.J.; Groves, B.; Kauffmann, G.; Heckman, T. The host galaxies and classification of active galactic nuclei. Mon. Not. R. Astron. Soc. 2006, 372, 961–976. [Google Scholar] [CrossRef]
- Pettini, M.; Pagel, B.E.J. [OIII]/[NII] as an abundance indicator at high redshift. Mon. Not. R. Astron. Soc. 2004, 348, L59–L63. [Google Scholar] [CrossRef]
- Yates, R.M.; Schady, P.; Chen, T.W.; Schweyer, T.; Wiseman, P. Present-day mass-metallicity relation for galaxies using a new electron temperature method. Astron. Astrophys. 2020, 634, A107. [Google Scholar] [CrossRef]
- Kewley, L.J.; Ellison, S.L. Metallicity Calibrations and the Mass-Metallicity Relation for Star-forming Galaxies. Astrophys. J. 2008, 681, 1183–1204. [Google Scholar] [CrossRef]
- Klimanov, S.A.; Reshetnikov, V.P.; Burenkov, A.N. A kinematic study of M51-type galaxies. Astron. Lett. 2002, 28, 579–588. [Google Scholar] [CrossRef]
- Skrutskie, M.F.; Cutri, R.M.; Stiening, R.; Weinberg, M.D.; Schneider, S.; Carpenter, J.M.; Beichman, C.; Capps, R.; Chester, T.; Elias, J.; et al. The Two Micron All Sky Survey (2MASS). Astron. J. 2006, 131, 1163–1183. [Google Scholar] [CrossRef]
- Kormendy, J.; Fisher, D.B.; Cornell, M.E.; Bender, R. Structure and Formation of Elliptical and Spheroidal Galaxies. Astrophys. J. Suppl. Ser. 2009, 182, 216–309. [Google Scholar] [CrossRef]
- Haynes, M.P.; Giovanelli, R.; Kent, B.R.; Adams, E.A.K.; Balonek, T.J.; Craig, D.W.; Fertig, D.; Finn, R.; Giovanardi, C.; Hallenbeck, G.; et al. The Arecibo Legacy Fast ALFA Survey: The ALFALFA Extragalactic H I Source Catalog. Astrophys. J. 2018, 861, 49. [Google Scholar] [CrossRef]
- Rampazzo, R.; Plana, H.; Amram, P.; Bagarotto, S.; Boulesteix, J.; Rosado, M. Two-dimensional warm gas kinematics in interacting galaxy systems. Mon. Not. R. Astron. Soc. 2005, 356, 1177–1190. [Google Scholar] [CrossRef]
- Naluminsa, E.; Elson, E.C.; Jarrett, T.H. H I global scaling relations in the WISE-WHISP survey. Mon. Not. R. Astron. Soc. 2021, 502, 5711–5725. [Google Scholar] [CrossRef]
- Catinella, B.; Saintonge, A.; Janowiecki, S.; Cortese, L.; Davé, R.; Lemonias, J.J.; Cooper, A.P.; Schiminovich, D.; Hummels, C.B.; Fabello, S.; et al. xGASS: Total cold gas scaling relations and molecular-to-atomic gas ratios of galaxies in the local Universe. Mon. Not. R. Astron. Soc. 2018, 476, 875–895. [Google Scholar] [CrossRef]
- Grossi, M.; di Serego Alighieri, S.; Giovanardi, C.; Gavazzi, G.; Giovanelli, R.; Haynes, M.P.; Kent, B.R.; Pellegrini, S.; Stierwalt, S.; Trinchieri, G. The Hi content of early-type galaxies from the ALFALFA survey. II. The case of low density environments. Astron. Astrophys. 2009, 498, 407–417. [Google Scholar] [CrossRef]
- Katkov, I.Y.; Sil’chenko, O.K.; Afanasiev, V.L. Lenticular Galaxy IC 719: Current Building of the Counterrotating Large-scale Stellar Disk. Astrophys. J. 2013, 769, 105. [Google Scholar] [CrossRef]
- Young, L.M.; Krajnović, D.; Duc, P.A.; Serra, P. Atomic hydrogen clues to the formation of counterrotating stellar discs. Mon. Not. R. Astron. Soc. 2020, 495, 1433–1444. [Google Scholar] [CrossRef]
- Chen, Z.; Gu, Q.S.; García-Benito, R.; Zhang, Z.Y.; Ge, X.; Xiao, M.; Yu, X. PGC 38025: A Star-forming Lenticular Galaxy with an Off-nuclear Star-forming Core. Astrophys. J. 2021, 915, 1. [Google Scholar] [CrossRef]
- Chung, A.; Bureau, M.; van Gorkom, J.H.; Koribalski, B. The H I environment of counter-rotating gas hosts: Gas accretion from cold gas blobs. Mon. Not. R. Astron. Soc. 2012, 422, 1083–1091. [Google Scholar] [CrossRef]
- Janowiecki, S.; Catinella, B.; Cortese, L.; Saintonge, A.; Wang, J. xGASS: Cold gas content and quenching in galaxies below the star-forming main sequence. Mon. Not. R. Astron. Soc. 2020, 493, 1982–1995. [Google Scholar] [CrossRef]
- Chilingarian, I.; Sil’Chenko, O.; Afanasiev, V.; Prugniel, P. Low Luminosity Early-type Galaxies in the NGC 128 Group. In Proceedings of the Pathways through an Eclectic Universe, Tenerife, Spain, 23–27 April 2008; Astronomical Society of the Pacific Conference Series. Knapen, J.H., Mahoney, T.J., Vazdekis, A., Eds.; Volume 390, p. 296. Available online: https://arxiv.org/abs/0711.2100 (accessed on 11 October 2023).
- Davis, T.A.; Alatalo, K.; Sarzi, M.; Bureau, M.; Young, L.M.; Blitz, L.; Serra, P.; Crocker, A.F.; Krajnović, D.; McDermid, R.M.; et al. The ATLAS3D project—X. On the origin of the molecular and ionized gas in early-type galaxies. Mon. Not. R. Astron. Soc. 2011, 417, 882–899. [Google Scholar] [CrossRef]
- Katkov, I.Y.; Sil’chenko, O.K.; Afanasiev, V.L. Decoupled gas kinematics in isolated S0 galaxies. Mon. Not. R. Astron. Soc. 2014, 438, 2798–2803. [Google Scholar] [CrossRef]
- Katkov, I.Y.; Kniazev, A.Y.; Sil’chenko, O.K. Kinematics and Stellar Populations in Isolated Lenticular Galaxies. Astron. J. 2015, 150, 24. [Google Scholar] [CrossRef]
- Sil’chenko, O.K.; Moiseev, A.V.; Egorov, O.V. The Gas Kinematics, Excitation, and Chemistry, in Connection with Star Formation, in Lenticular Galaxies. Astrophys. J. Suppl. Ser. 2019, 244, 6. [Google Scholar] [CrossRef]


| Galaxy | Date | Emission Line | Exposure, s | Seeing, ″ |
|---|---|---|---|---|
| UGC 1020 | 6/7 October 2021 | H | 3.0 | |
| UGC 7020A | 20/21 May 2021 | H | 2.7 | |
| NGC 3921 | 27/28 March 2023 | H | 4.2 | |
| UGC 8671 | 27/28 March 2023 | H | 4.4 |
| Galaxy | Type (NED ) | , | , | , per Year |
|---|---|---|---|---|
| NGC 5713 | SAB(rs)bc pec | 9.99 | 10.00 | |
| NGC 5719 | SAB(s)ab pec | 9.92 | 10.32 | |
| IC 719 | S0? | 9.01 | 10.10 | |
| IC 718 | Im? | 9.08 | 9.01 | |
| NGC 127 | SA0 | 7.98 e | 9.94 | |
| NGC 128 | S0 pec | 11.22 |
Disclaimer/Publisher’s Note: The statements, opinions and data contained in all publications are solely those of the individual author(s) and contributor(s) and not of MDPI and/or the editor(s). MDPI and/or the editor(s) disclaim responsibility for any injury to people or property resulting from any ideas, methods, instructions or products referred to in the content. |
© 2023 by the authors. Licensee MDPI, Basel, Switzerland. This article is an open access article distributed under the terms and conditions of the Creative Commons Attribution (CC BY) license (https://creativecommons.org/licenses/by/4.0/).
Share and Cite
Sil’chenko, O.; Moiseev, A.V.; Smirnova, A.; Uklein, R. S0 Galaxies: Outer Gas Accretion through Tidal Interaction and Minor Merging. Galaxies 2023, 11, 119. https://doi.org/10.3390/galaxies11060119
Sil’chenko O, Moiseev AV, Smirnova A, Uklein R. S0 Galaxies: Outer Gas Accretion through Tidal Interaction and Minor Merging. Galaxies. 2023; 11(6):119. https://doi.org/10.3390/galaxies11060119
Chicago/Turabian StyleSil’chenko, Olga, Alexei V. Moiseev, Alexandrina Smirnova, and Roman Uklein. 2023. "S0 Galaxies: Outer Gas Accretion through Tidal Interaction and Minor Merging" Galaxies 11, no. 6: 119. https://doi.org/10.3390/galaxies11060119