Article

Testing a Lepto-Hadronic Two-Zone Model with Extreme High-Synchrotron Peaked BL Lacs and Track-like High-Energy Neutrinos

by
Edilberto Aguilar-Ruiz
*,
Antonio Galván-Gámez
and
Nissim Fraija
Instituto de Astronomía, Universidad Nacional Autónoma de México, Ciudad de México 04510, Mexico
*
Author to whom correspondence should be addressed.
Galaxies 2023, 11(6), 117; https://doi.org/10.3390/galaxies11060117
Submission received: 20 October 2023 / Revised: 27 November 2023 / Accepted: 28 November 2023 / Published: 6 December 2023

Abstract

:
Numerous studies suggest that high-energy (HE) neutrinos and ultra-high-energy (UHE) cosmic rays could originate from extremely high-synchrotron peaked (EHSP) BL Lacs, which have been identified as effective particle accelerators. Due to the discovery of HE-neutrinos by the IceCube telescope, these hypotheses may shortly have the opportunity to be tested. In this work, we use a two-zone leptohadronic model to explain the spatial coincidence of three EHSP BL Lac: 1RXS J09462.5+010459, 1ES 1101-232, and 3HSP J095507.9+355101 with the arrival of track-like neutrinos. Our results for 1RXS J09462.5+010459 and 1ES 1101-232 indicate that the model accurately describes the electromagnetic emission and neutrino events without increasing the fluxes in the measured bands. In addition, the X-ray flaring state of 3HSP J095507.9+355101 can be explained by our model, but the measured ultraviolet flux during the neutrino arrival time window cannot be explained. For all cases, the broadband emission and neutrino arrival are better described by hard proton distributions ≈1.5. Finally, the proton luminosity required to explain the neutrino fluxes is slightly higher than the Eddington limit with a photopion efficiency of ≈0.1 for non-flaring state cases. On the other hand, for the flaring state of 3HSP J095507.9+355101, the proton luminosity must be higher than the Eddington limit at least by one order of magnitude, even if the photopion efficiency reaches unity.

1. Introduction

A subset of Active galactic nuclei (AGN) known as blazars have relativistic jets that point to our direction of sight [1]. They are divided into the Flat-spectrum radio quasars (FSRQ) and BL Lac objects sub-classes [2,3,4]. These sources include those for which neutrinos have been observed ([5,6]). When one of the two jets is aligned with our line of sight, its emission is strongly beamed and Doppler boosted, making it visible from radio up to very-high-energy (VHE) gamma-ray wavelengths [7,8] and exhibiting a wide range of variability. In both their quiescent and flaring phases, these objects display striking differences in distinct bands across the electromagnetic spectrum.
Two peaks can be seen in the spectral energy distribution (SED) of blazars, each one at a different frequency [9,10,11]. The first peak is typically well-fit assuming synchrotron emission, and is used to classify blazars as low-synchrotron peaked (LSP), intermediate-synchrotron peaked (ISP), or high-synchrotron peaked (HSP). Using these criteria, FSRQ objects are categorized as LSP blazars since the broadband SED shows a peak at infrared wavelengths. While BL Lac sources can be classified as LSP, ISP, or HSP [12]. The synchrotron peak is detected in LSP blazars at frequencies of log ( ν peak ) < 14; in ISP blazars, this occurs at frequencies between 14 < log ( ν peak ) < 15; and in HSP blazars, this occurs at frequencies of log ( ν peak ) > 15.
Furthermore, BL Lacs with a synchrotron peak at log ( ν peak ) > 17, are often referred to as extreme high-synchrotron peaked (EHSP) [13]. Moreover, Refs. [14,15] have identified a novel category of BL Lacs, depending on the location of the second peak with a HE peak at E peak > 1 TeV; these objects are known as hard-TeV BL Lacs (TBL) or extreme-TeV BL Lacs. There is evidence to suggest that extreme behaviors are not permanent states and that they do not always coexist. For instance, such characteristics have been observed in Markarian 501, 1ES 1727+502, and 1ES 1741+196 [16,17,18,19]. Extreme BL Lacs present a significant challenge to the presently understood acceleration and emission processes in blazar jets [20]. The mechanism of VHE emission may be better understood if it is considered in conjunction with HE neutrinos.
A total of 102 HE-neutrino events have been added to the so-called High-Energy Starting Events (HESE) catalog [21,22,23,24,25], confirming the detection of astrophysical neutrinos by the IceCube project. At the same time, the so-called Extremely High Energy (EHE) catalog has recorded 36 events [26,27,28]. According to the latest publication [29], the most recent release catalog reported a total of 275 neutrino events, encompassing both HESE and events. Measurements of neutrino fluxes follow single power-law (SPL) distributions with a spectral index of γ SPL = 2.37 ± 0.09 and a normalization constant at 100 TeV of ϕ ν μ + ν ¯ μ = 1 . 44 0.27 + 0.25 × 10 18 GeV 1 s 1 cm 2 sr 1 in the energy range of 15 TeV to 5 PeV [30].
To date, only two HE-neutrino sources have been found (i.e, TXS 0506 +056 and NGC 1068; [5,6,31]), however several astronomical objects were suggested as possible sources (for a review see [32,33]). The particular mechanism by which the HE neutrinos are created in such environments is not yet known, however several possibilities have been investigated (e.g., [34,35,36,37,38,39,40,41]). According to some research, BL Lacs are major contributors to the HE-neutrinos observed by IceCube. For instance, Ref. [42] found that BL Lacs can account for roughly 10% of IceCube’s neutrino background at energies above 0.5 PeV when using the blazar simplified view approach. At lower energies, they estimated that BL Lacs may generate a level of ≈20 percent. Alternatively, more recently, Buson’s research shows that blazars are definitely linked to HE astrophysical neutrinos, with an unprecedented chance probability [43]. Furthermore, the results reported by [44] pointed out the evidence for IceCube neutrinos connection with HSP and ISP blazars. However, Ref. [45] point out that Buson’s result may potentially be attributed to a statistical fluctuation, as well as the presence of spatial and flux non-uniformities within the blazar sample. Additionally, the utilization of the updated catalog yields alternative outcomes that also indicate reduced statistical significance [46].
In addition, Ref. [47] discovered a correlation between the neutrino catalog and EHSP accounting for roughly (1–20)% of the neutrino signal up to that time, and the most plausible neutrino candidates were also found to be ≈6 EHSP. It is interesting to note that [48] had already suggested H2356-309 as a candidate for the IC10 event’s emitter source. This finding led [49] to propose a leptohadronic model with realistic parameter values to characterize the SED of the neutrino candidates, which they found to be consistent with the IceCube data for some of the sources.
Moreover, an EHSP was recently discovered coincident with the identification of the HE-neutrino IceCube 200107A; however, there is insufficient evidence to conclusively link the flaring activity of 3HSPJ095507.1+355100 to the neutrino alert [50]. Ref. [51] studied the predicted multifrequency emission during the X-ray flare and the neutrino event, focusing on the one-zone leptohadronic model, the proton synchrotron, and the intergalactic cascade scenarios, to explain the neutrino connection with the flaring activity of the EHSP BL Lac 3HSPJ095507.1+355100. On the other hand, this link has also been explained using different models including two zones (e.g., [35]). Moreover, a recent study by [52] reported the temporal and spatial coincidence, within a 2-degree range, between the neutrino event IceCube-211208A and the high-flux phase of the blazar PKS 0735+178. This alignment was seen across many electromagnetic bands, including optical, ultraviolet, X-ray, and GeV gamma-ray.
A new model has been developed by Aguilar-Ruiz (hereafter AR2022 [53]), which explain the multiwavelength observations of the six well-known extreme BL Lacs by a lepto-hadronic two-zone model. The model includes an inner blob of photo-hadronic activity and an outer blob of SSC processes to describe the VHE gamma-ray observations. When protons in the inner blob are accelerated, they collide with photons from the annihilation line in a sub-relativistic pair plasma, producing photo-hadronic interactions. Furthermore, the authors extrapolate their findings to the remaining TBLs and determine the neutrino flux generated by the present TBL population under the Aguilar-Ruiz scenario (herafter AR2023 [54]). Taking into account the gamma-ray luminosity function, they found that if protons are accelerated to energies less than ε p 1 PeV , the estimated neutrino flux of the TBL population is consistent with the estimated neutrino diffuse flux. However, they noted that the inner blob might boost proton velocities by as much as ∼300 PeV.
The findings from a recent study on X-ray polarization (e.g., [55,56]), indicate a discrepancy between the degree value of X-ray polarization and the corresponding radio-to-optical value for Mrk 501 and Mrk 421. These results provide further evidence for the validity of blazar’s jet models that extend beyond the one-zone framework.Therefore, by considering those track-like neutrino events with temporal and spatially association with EHSP BL Lacs, we apply this novel scenario (AR2022 and AR2023) to EHSP BL Lac type, i.e., those where the hard-TeV-gamma-rays spectrum is missing, to investigate the link with HE neutrinos.
The structure of this paper is as follows: in Section 2, we provide a comprehensive summary of our model. In Section 3, we present and model our sample, and finally, Section 4 discusses the results and conclusions are presented. The Λ -CDM cosmology was used throughout this entire study, where H 0 = ( 67.4 ± 0.5 ) km s 1 Mpc 1 , matter energy density Ω m = 0.315 ± 0.007 , and dark energy density Ω Λ = 1 Ω m [57].

2. The Model

AR2022 proposes a model in which two emission zones are used to represent the complete SED of six TBLs in their quiescent state. In order to reduce the tension in the parameter required by the one-zone SSC model, the authors posited the need for two dissipation regions, which they dubbed “inner” and “outer”. The inner blob is located close to the jet’s base, while the outer blob is located distant from the engine. The formation of a pair plasma which arises and is launched above the accretion disc was also utilized by the author. This pair plasma produces a spectrum with a sharp peak at an energy of around ε pl = 511 keV .
Electrons and protons moving at relativistic speeds in the inner blob scatter photons from the pair plasma. Electrons interact via the Compton scattering mechanism, whereas protons engage in photohadronic processes (photopion and photopair). The inner blob’s maximal proton energy in AR2022 is chosen to be ε p , max < 100 TeV , hence, the photopion process yields neutral pions, which decay into gamma rays with energy approximately ∼1–30 TeV. Electrons in the inner blob may also have a MeV signature caused by external Compton scattering, while secondary electrons cool down via synchrotron radiation with a signal at the radio-to-optical and MeV bands. The pair-plasma radiation greatly attenuates contributions below the GeV band (see Figure 2b in [53] ), hence MeV-band fluxes are not very prominent. In addition, the outer blob formed by relativistic electrons is explained by a SSC model; proton emission is unimportant in this blob.
Nonetheless, AR2023 notes that maximal proton energies inside the inner blob might reach values of ε p , max 100 PeV, if this is the case, we should see a peak in gamma-ray and neutrino emission at energies over ∼5 PeV. The authors note, however, that in order for the estimates of neutrino diffuse flux and the total flux predicted by the existing population of TBLs to be compatible, the maximum proton energy cannot be greater than ε p , max 1 PeV (see Figure 3 in AR2023 [54] ). Based on this finding, TBL is incapable of producing neutrinos with energy greater than E ν , max 150 TeV ( D i / 3 ) . It is worth noting that this criterion does not apply if an EHSP does not have a VHE hard-spectrum peaking at 1 TeV; hence, in certain EHSP, the neutrino spectrum may extend even to E ν 5 PeV .
The observed, pair plasma, and blob (inner or outer) frames used here are the same as those used in AR2022. For observed quantities, we use Latin capital letters followed by the superscript “ob” but the AGN frame will use only the letters themselves. In Greek, the plasma, inner, and outer blobs are represented by the lowercase letters (unprimed), (prime), and (two-prime), respectively. We also take into account the on-axis case for relativistic blobs, where the viewing angle is θ obs 1 / Γ and the Doppler factor defined by D = Γ ( 1 β cos θ obs ) 1 , with Γ the Lorentz factor in the blob.

2.1. The Inner Blob

VHE gamma rays are thought to be generated in an inner blob by a photohadronic process in the AR2022 model. Here, we suppose that there is one electron for every proton, n e = n p and the spectral indexes of electrons and protons in their distributions are identical α e = α p .
The radiation field of the pair-plasma only affects locations within a few to dozens of Schwarzschild radii, R g , from the center of the engine, with R g = G M / c 2 10 14 cm the Schwarzschild radius for a SMBH mass of M = 10 9 M ; hence the location r i must be closer to the central engine than the outer blob. The photopion efficiency and the peak of the blob’s VHE band emission are both determined by its Lorentz factor, which is favourable to mildly relativistic speeds. If two regions are inside the acceleration and collimation zone, then our scenario is possible, as the Lorentz factor in the inner region is smaller than in the outer region ( Γ i < Γ o ). Lorentz factors of Γ i 1.5 3 are preferred for producing VHE-band gamma rays with high photopion efficiency f π 0.1 , as shown in works AR2022 and AR2023.
The magnetic field strength is a crucial factor; we made an estimate of it by assuming that the magnetic luminosity is constant along the jet, L B , i L B , o . As a result, there is a relationship between the values in the inner and outer blobs, as follows: B i = ( D o / D i ) ( R o / R i ) B o , then, our model’s typical values allow us to write it as
B i 132 G B o 0.1 G R o 2 × 10 16 cm R i 2 × 10 14 cm 1 D o 10 2 D i 3 2 ,
the magnetic field strength, however, is greater when the equipartition requirement, L B = L p , is applied,
B i , eq 1.6 × 10 3 G L p 10 46 erg s 1 1 / 2 D i 3 2 R i 2 × 10 14 cm 1 ,
thus, we choose these two numbers to be the limits.

2.1.1. Proton Distribution

It is assumed that the Fermi mechanism is responsible for the acceleration of protons in this blob, leading to a spectrum with a spectral index of α p 1.5 [58]. We assume the proton distribution is a single PL distribution, with the form given by
N p ( ε p ) = K p ε p GeV α p ε p , min ε p ε p , max ,
where the K p is the normalization constant in units of [ GeV 1 cm 3 ] , α p is the spectral index and ε p , min = m p c 2 GeV and ε p , max represent the lowest and highest possible proton energies, respectively. The normalization constant may be determined by integrating the proton distribution to produce the apparent bolometric proton luminosity, L p = 4 π R i 2 D i 4 ε p ε p N p ( ε p ) , then for α p 2 , we obtain the expression
K p 5.8 × 10 6 cm 3 GeV 1 ( 2 α p ) ε p , max GeV 2 α p 1 D i 3 4 R i 2 × 10 14 cm 2 L p 10 46 erg s 1 .
The competition between the acceleration and loss processes is used to estimate the maximal energy that protons achieve via the Fermi acceleration process. Therefore, by comparing t acc = ε p / ( η e B c ) with the dynamical timescale t ad = R / c , we obtain that the maximum proton energy reached by Fermi mechanism is
ε p , max 280 PeV η 0.1 B i 100 G R i 10 14 cm ,
where e is electron’s charge and η is the acceleration efficiency, here we take a value of η 0.1 [59]. This value is three orders of magnitude larger than the one needed to describe the TBL spectrum in AR2022. However, in this study we suppose the maximum proton energy is dictated by E ν ob ,
ε p , max ( 1 + z ) D i χ p ν E ν ob ,
where χ p ν 0.05 is mean the fraction of energy transfer from parent proton to the neutrino, and z is the redshift of the source. Note that the above expression indicates that the value of ε p , max may be lower than the aforementioned value given by Equation (5).
It is important to mention that, due to the neutrino’s energies for the events used in this work only represent the reconstructed energy, then Equation (6) only provides the minimum value that ε p , max can take in order to explain that events (The reconstructed energy for through-going muon neutrinos events represents the lower limit of the neutrino energy. This is because there are events initiated outside the detector where neutrino signals cannot be recollected [29]).

2.1.2. Seed Photons by the Pair-Plasma

An essential component of the AR2022 model is the existence of a pair plasma that produces an annihilation line with a peak at ε pl = 511 keV (e.g., [60,61,62,63]). It is assumed that the shape of the photon distribution is extremely narrow, to the point that it may be expressed in the delta approximation as [37]
n pl ( ε ) = u pl ε pl δ ( ε ε pl ) ,
where u pl = L keV / ( Ω pl R pl 2 β ph c ) is the photon energy density of the pair-plasma. At the photosphere zone, photons escape from the pair-plasma, which moves with velocity β pl 0.3 0.5 [60], and radius of the R ph R g .
For the pair plasma, the most crucial assumptions are: (i) at the photosphere, it moves at a mildly relativistic speed β pl = 0.5 ( Γ pl = 1.15 ), (ii) it is generated when the luminosity of the disc above 511 keV exceeds L keV 3 × 10 3 L E in compact regions around ∼ R g [60,63], where L E 4 × 10 46 erg s 1 is the Eddington luminosity equivalent to the typical SMBH’s mass of BL Lacs M 3 × 10 8 M (i.e., [64,65]), hereafter we assume this value for our EHSP sample, this agrees with the value reported for 3HSP J095507.9+355101 [66].
When seen in the inner blob, photons from the pair-plasma undergo a redshift. Consequently, the inner blob’s measured energy and energy density are [67]
ε pl ε pl / ( 2 Γ rel ) and u pl = u pl Γ rel 2 ( 1 + β 2 / 3 ) ,
respectively, where Γ rel is the Lorentz factor between the pair plasma and the inner blob, denoted by Γ rel , may be written as
Γ rel = Γ i Γ pl 1 β i β pl ,
where β i is the velocity of the inner blob and Γ i is the Lorentz factor for that blob. In this case, we may express the relationship between the Doppler effect and the Lorentz factor as D i 2 Γ i .

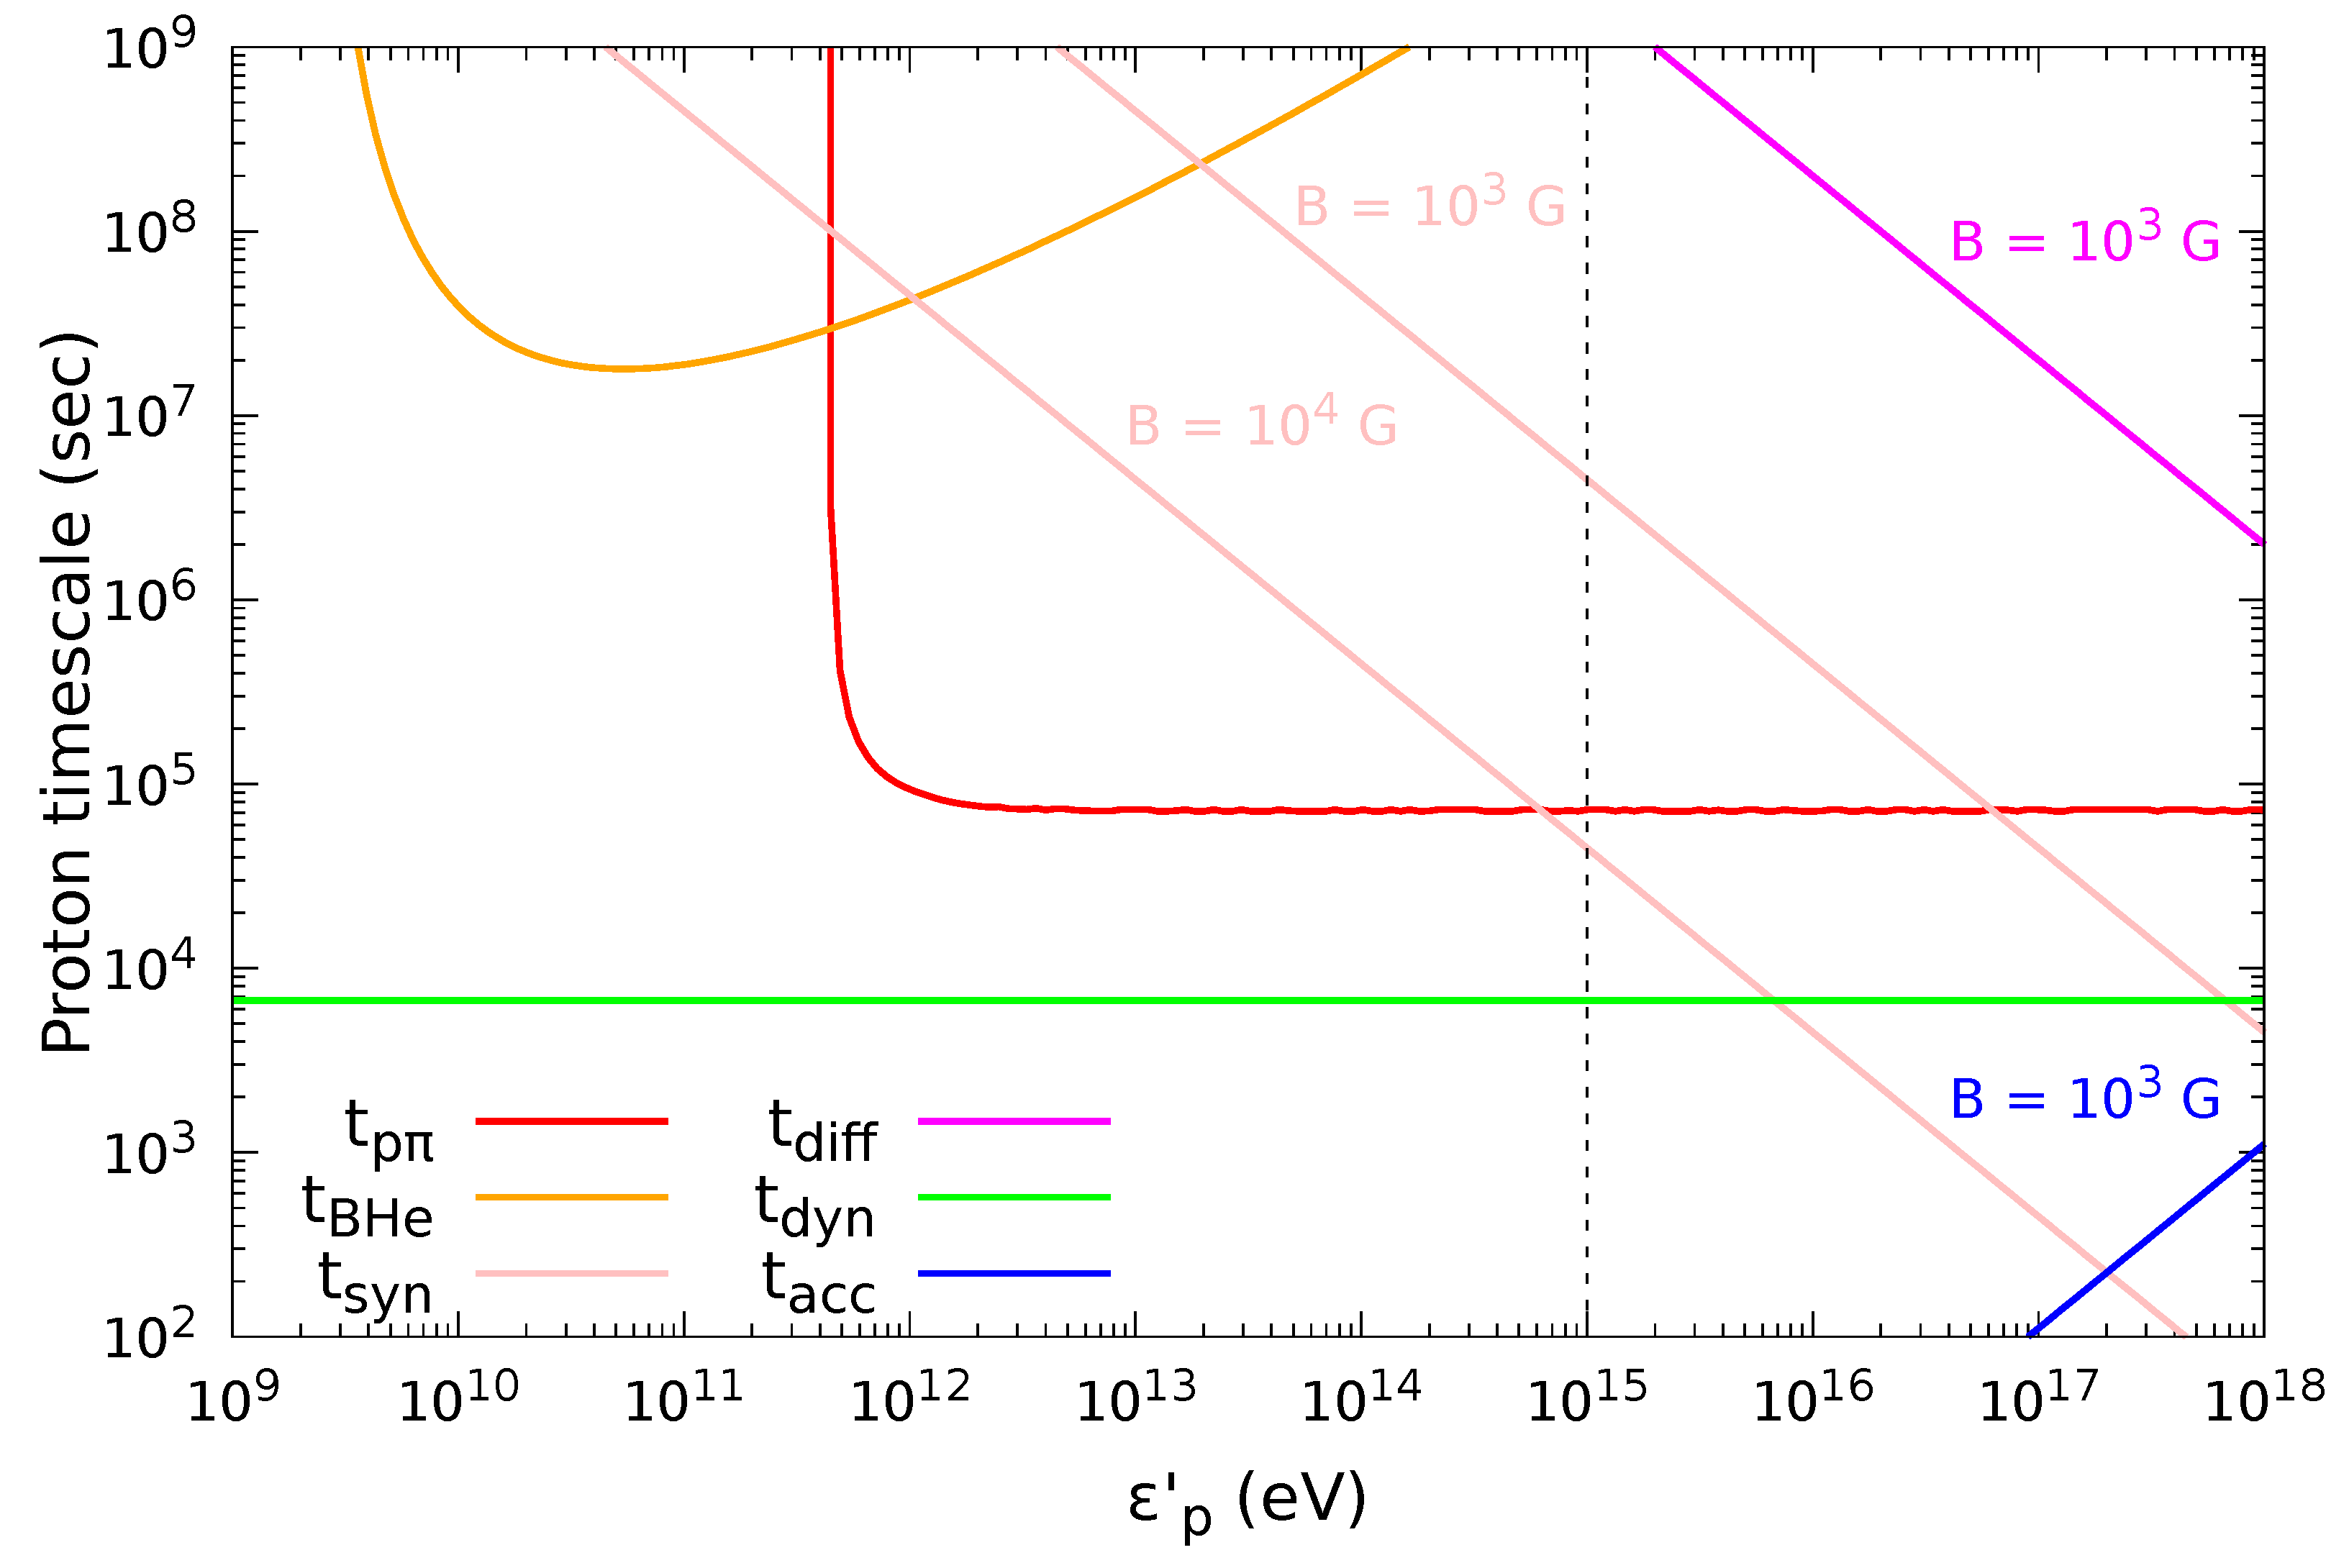
2.1.3. Photopion Process

The photopion process results in the production of nonstable secondary products, i.e., π 0 and π ± mesons [68]:
p + γ n 0 π 0 + n + π + + n π + . . . ,
where n 0 , n , n + are the multiplicities of neutral, negative and positive charged pions, respectively. Pions decays into final stable particles as
π 0 γ + γ ,
π + e + + ν e + ν ¯ μ + ν μ , and
π e + ν ¯ e + ν μ + ν ¯ μ .
If we consider the photons of the pair-plasma in the inner blob frame, we can calculate the minimum proton energy required to produce a single rest mass pion by photopion interaction,
ε p , th p π 0.75 TeV Γ rel ε pl 511 keV 1 .
Moreover, efficiency of photopion process is determined by the expression [69]
f p π = R i 2 γ p 2 ε th 2 γ p d ε n pl ( ε ) ε 2 ε th 2 γ p ε d ε r ε r σ p π ( ε r ) K p π ( ε r ) ,
where ε th 150 MeV is the threshold energy, ε r is the photon energy in the proton rest-frame, σ p π is the photopion cross-section and K p π is the inelasticity coefficient. We use the two-step approximation, given by σ p π K p π = 68 - barn for 199 MeV ε r 500 MeV and σ p π K p π = 72 - barn for ε r > 500 MeV .

High-Energy Neutrinos

Neutrino generation rates at HE energies are estimated using the approach of [70], then the observed spectrum is given by
E ν 2 Q ν ( E ν ) 3 8 f π D i 4 ε p 2 Q p ( ε p ) ,
the proton source is related with proton distribution as Q p 4 π R i 2 c N p , and the observed neutrino energy is related with the proton energy as ε p E ν ( 1 + z ) / ( χ p ν D i ) .

Gamma-Rays

Relativistic kinematics is used to obtain a rough approximation of the energy of gamma-rays for the decay of neutral pions. Then, gamma-rays are produced with energies above
E γ ob 75 GeV Γ rel D i 1 + z ε pl 511 keV 1 .
whereas the maximum energy of gamma-rays is determined by the greatest proton energy and hence by the observed neutrino energy, E γ ob 2 E ν obs . This last assumptions differ with the AR2022 work because they were assume ε p , max 100 TeV and therefore gamma-rays with energies higher than E γ ob 10 TeV D i hardly can be produced. Finally, the following equation is used to derive the gamma-ray spectra [70]
E γ 2 Q γ ( E γ ) 1 2 f π D i 4 ε p 2 Q p ( ε p ) × C abs ,
where C abs is the absorption coefficient from either pair-plasma photons or the light from the cosmos in general (EBL).

Secondary Electrons/Positrons

The electron-positron production rate by photopion process is given by
Q e p π ( ε e ) = f p π 8 χ p e p π 2 Q p ε p ,
where χ p e p π 0.05 is mean the fraction of energy transferred from parent proton to positrons/electrons.
The photopion proton threshold may be used as a rough approximation of the lowest Lorentz factor of the electrons
γ e , p π th 6.4 × 10 4 Γ rel ε pl 511 keV 1 .
As the photopion efficiency is flat above the threshold (see Figure 1 in [54]), the form of the electron spectrum must be adequately tracked by the proton spectrum, and the maximum value of photopion electrons is therefore dictated by the maximum proton energy γ e , p π max χ p e ε p , max / ( m e c 2 ) , therefore this value must be linked to the observed neutrino energy.

2.1.4. Photopair Process

Similarly, the efficiency due to photopair (pe) or Bethe-Heitler (BH) process, p + γ p + e + e + , is calculated as [71,72]
f BH = 3 σ T α f m e 3 c 4 32 π m p R i γ p 3 ε th d ε n pl ( ε ) ε 2 φ 2 γ p ε m e c 2 ,
where ε th 2 m e c 2 / γ p is the threshold energy, α f the fine structure constant, the function φ is given and parametrized by [72], and σ T is the Thompson cross-section. Therefore, in our scenario electrons are created with Lorentz factor
γ e , BH th 4 Γ rel ε pl 511 keV 1 ,
however, the maximum value is much larger by an order of magnitude.
The electron-positron production rate by Bethe-Heitler processes is given by
Q e BH ( ε e ) = f BH χ p e BH 2 Q p ε p ,
where χ p e BH m e / m p is mean the fraction of energy transfer from parent proton to positrons/electrons [73].

2.1.5. Synchrotron Emission of Secondary Pairs

We investigate in depth the emission of secondary pairs (from now on referred to as secondary electrons); such emission must span from near the MeV band to the GeV band. At those energy, pair-plasma photons significantly decrease the flux of MeV-to-GeV gamma-rays. Yet, as previously explained, the observed flux below MeV energies is only partly absorbed. On the other hands, gamma-rays with energies greater than hundreds of GeV can escape from the inner blob without attenuation. The emission of secondary pairs is discussed more below.
Since synchrotron and adiabatic losses dominate electron cooling, the distribution of secondary pairs formed by photohadronic processes (photopion and photopair) is computed as
N e p π ( BH ) ( γ e ) 1 γ ˙ e , syn + γ ˙ e , ad γ e γ e , max d ε e Q e p π ( BH ) ( ε e ) ,
where γ ˙ e , syn and γ ˙ e , ad are the rates of synchroton and adiabatic losses.
Additionally, by taking into account the typical magnetic field in the inner blob, we may calculate the energy of synchrotron photons
E syn , p π ob 36 keV Γ rel 2 B i 100 G D i 3 ε pl 511 keV 2 .
The maximum energy of synchrotron photons is defined by the maximum proton energy, and applying the condition of χ p e p π χ p ν , we get
E syn , p π ob 66.5 GeV B i 100 G E ν obs 100 TeV 2 D i 3 1 ,
because this number is outside of the energy range where gamma-rays are optically thick to γ γ absorption, GeV-gamma-rays should aid in constraining our model.
On the other hand, photopair pairs produce synchrotron photons with energies
E syn , BH ob 8 × 10 5 eV Γ rel 2 B i 100 G D i 3 ε pl 511 keV 2 .
In a condition of strong flare, when the fluxes of VHE gamma rays and HE neutrinos are both high, it may be possible to measure the flux of synchrotron secondary pairs. Produced fluxes from photopion and photopair might be connected to proton luminosity as L γ , syn p π ( 1 / 8 ) f p π L p and L γ , syn BH f BH L p , respectively (see [37,74]) in an environment like the inner blob, where electrons are effectively cooled down by the synchrotron process.
It is important to note that the cross-sections for photopion and photopair processes lead to a flux ratio of L γ , p π / L γ , pe σ p π pk / ( 8 σ pe pk ) 10 2 . Our model predicts that the photopair process may only lead to a signature during extremely powerful flare states.
Gamma-ray and secondary-pair fluxes are connected in the photopion scenario as L γ p π ( 4 / 3 ) L ν and L γ , syn p π ( 1 / 3 ) L ν [70]. This suggests that gamma rays and the synchrotron flux of secondary pairs may leave a signature when the HE-neutrino flux is high enough to be detected.

2.1.6. Proton Synchrotron

Accelerated protons inside a dissipation region with a very high magnetic field must radiate via synchrotron, using the Equation (6) the characteristic photon energy produced by proton-synchrotron is given by
E p , syn 3.2 keV ( 1 + z ) 2 D i 3 1 B i 100 G E ν ob 100 TeV 2 ,
furthermore, the loss timescale is calculated by the following equation
t p , syn 8.5 × 10 9 s ( 1 + z ) 1 D i 3 B i 100 G 2 E ν ob 100 TeV 1 ,
which is larger than the dynamical timescale, t dyn R i / c 6.7 × 10 3 s . However, note that proton synchrotron efficiency must be about t p , syn / t dyn 10 2 if the magnetic field intensity is higher, for instance, ∼ 10 4 G (as the predicted by the equipartion condition indicated by Equation (2). This efficiency is similar to that for gamma-ray luminosity produced by secondary electrons is L γ , syn p π / L p ( 1 / 8 ) f p π 10 2 for f p π 0.1 .

2.2. The Outer Blob

Although the outer blob of the AR2022 model is irrelevant to neutrino generation, it does create the remainder of the SED’s emission, which we explain below along with the other important aspects considered and applied in this work:
(i)
As the electron population is larger than the proton population ( n e n p ), only leptonic processes are taken into account.
(ii)
The blob travels at relativistic speeds, thus we use Γ o = 5 and D o 10 as Lorentz and Doppler boost factors, respectively. Our choice agrees with the average value, D 13 , reported by [75] who conducted a study with a sample of 217 blazars and utilized a one-zone leptonic model. Even though if D o take greater values, our model could perform the same fitting, but at the cost of needs smaller emission regions or stronger magnetic field. And and interesting consequence is the reduce of the value for the equipartition parameter U B / U e .
(iii)
Using the assumption that the blob’s variability timescales is R o D o t var c with t var one day and D o 10 , we find that the blob’s distance from the SMBH is r o = 2 Γ o R o 2.6 × 10 17 cm , this is equivalent to around 10 3 R g for a SMBH mass of M = 3 × 10 8 M . This separation is in close proximity to the hypothesized acceleration and collimation zone (e.g., [76,77]) suggesting that Γ o may be close to the terminal Lorentz factor of the jet.
(iv)
It was possible to determine the magnetic field by looking at the peak of the synchrotron bump, which was around ν syn 10 17 Hz . Now when the timescales of the synchrotron and the adiabatic losses are equivalent, we have the electron energy break, which is written as
γ e , br = 6 π m e c 2 σ T B 2 R o ,
hence, this blob’s magnetic field strength is
B o 0.28 G ν syn ob 10 17 Hz 1 / 3 D o 10 1 / 3 R o 2 × 10 16 cm 2 / 3 .

Electron Distribution

A broken PL describes the electron distribution
N e ( γ e ) = K e γ e α e , 1 , γ e , min γ e γ e , br γ e , br α e , 2 α e , 1 γ e α e , 2 , γ e , br γ e γ e , max ,
with γ e , min , γ e , br , γ e , max are the minimum, break and maximum Lorentz factors of ultrarelativisc electrons, respectively.
Using the blob’s properties as constraints, we may estimate the parameters that defined the electron distribution. If we use approximation Equation (30) to calculate the break Lorentz factor, we obtain
γ e , br 1.6 × 10 5 B o 0.3 G 2 R o 2 × 10 16 cm 1 .
Nevertheless, the spectral indices and minimum and maximum Lorentz factors are calculated by fitting the broadband SEDs.

3. Cases of Study and Results

3.1. High-Energy Neutrinos Coincident with Extreme High Synchrotron Peaked BL Lacs

This work focuses on the study of track-like astrophysical neutrinos that have the potential to be linked to an EHSP BL Lac object. Two of the events, namely IC190819A and IC190922A, are included in the latest IceCube’s catalog [29]. However, the third event, i.e., IC200107A, is not listed, we took it into consideration in view of the sequence of publications published by many authors examining the potential correlation [35,51,78]. The Table 1 contains information regarding neutrino events and the EHSP BL Lac associated with them that are considered in this study.

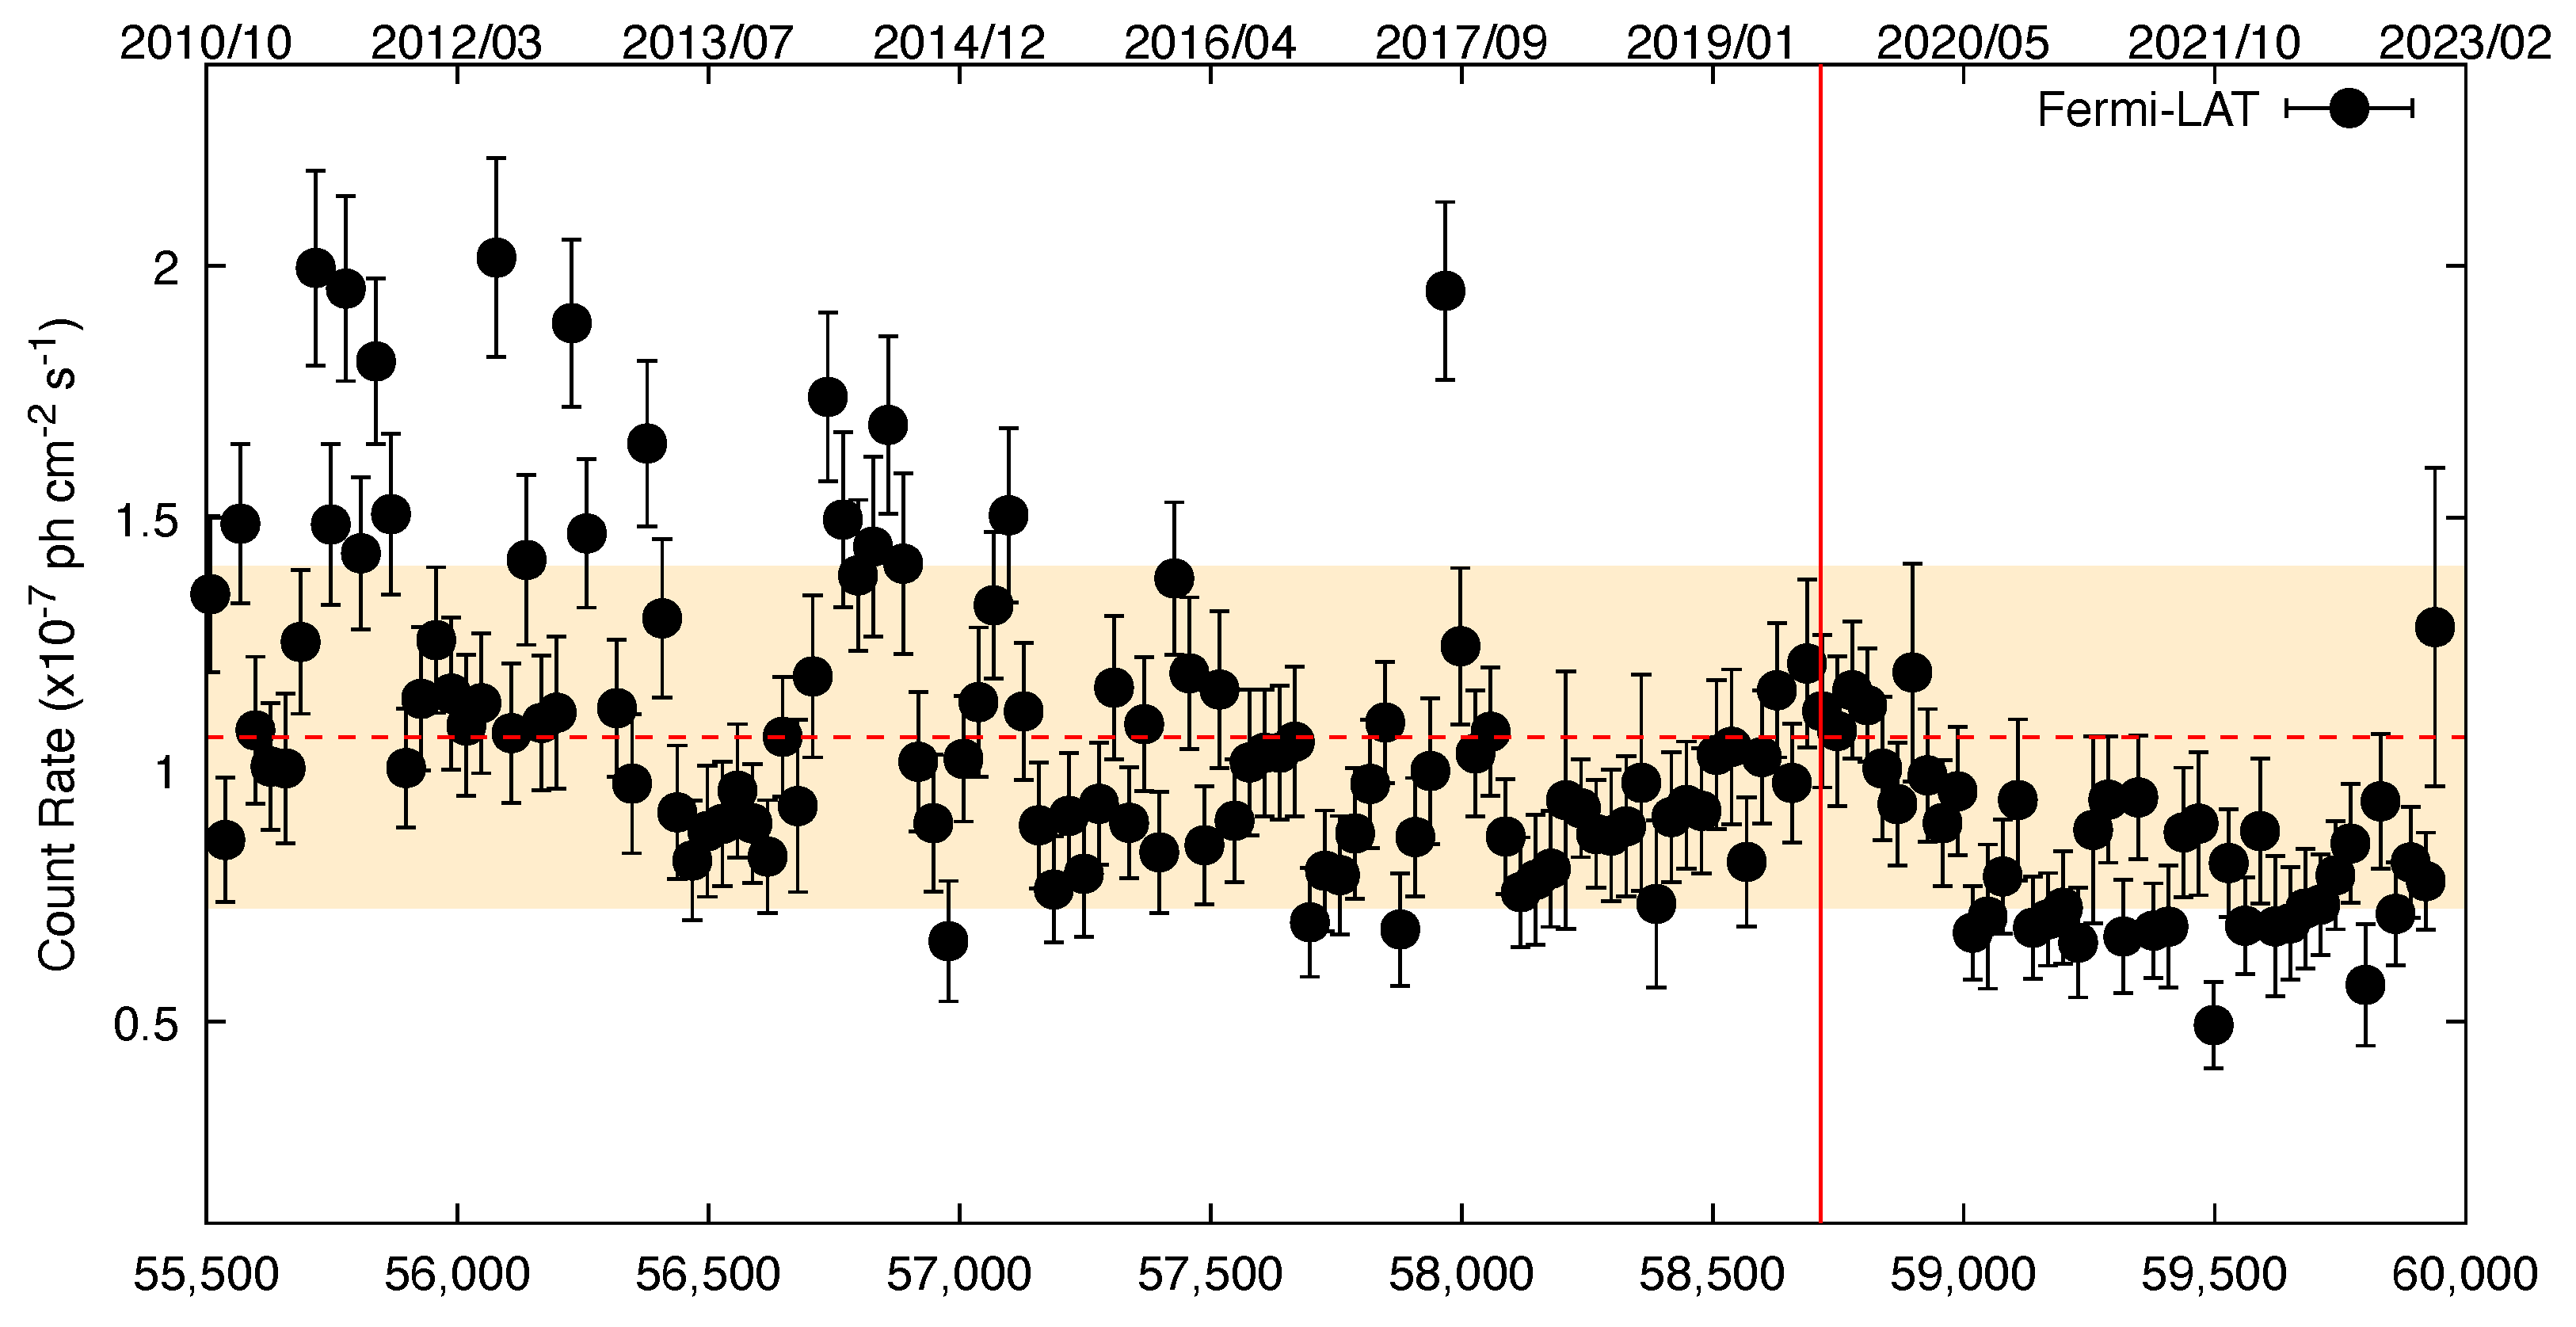
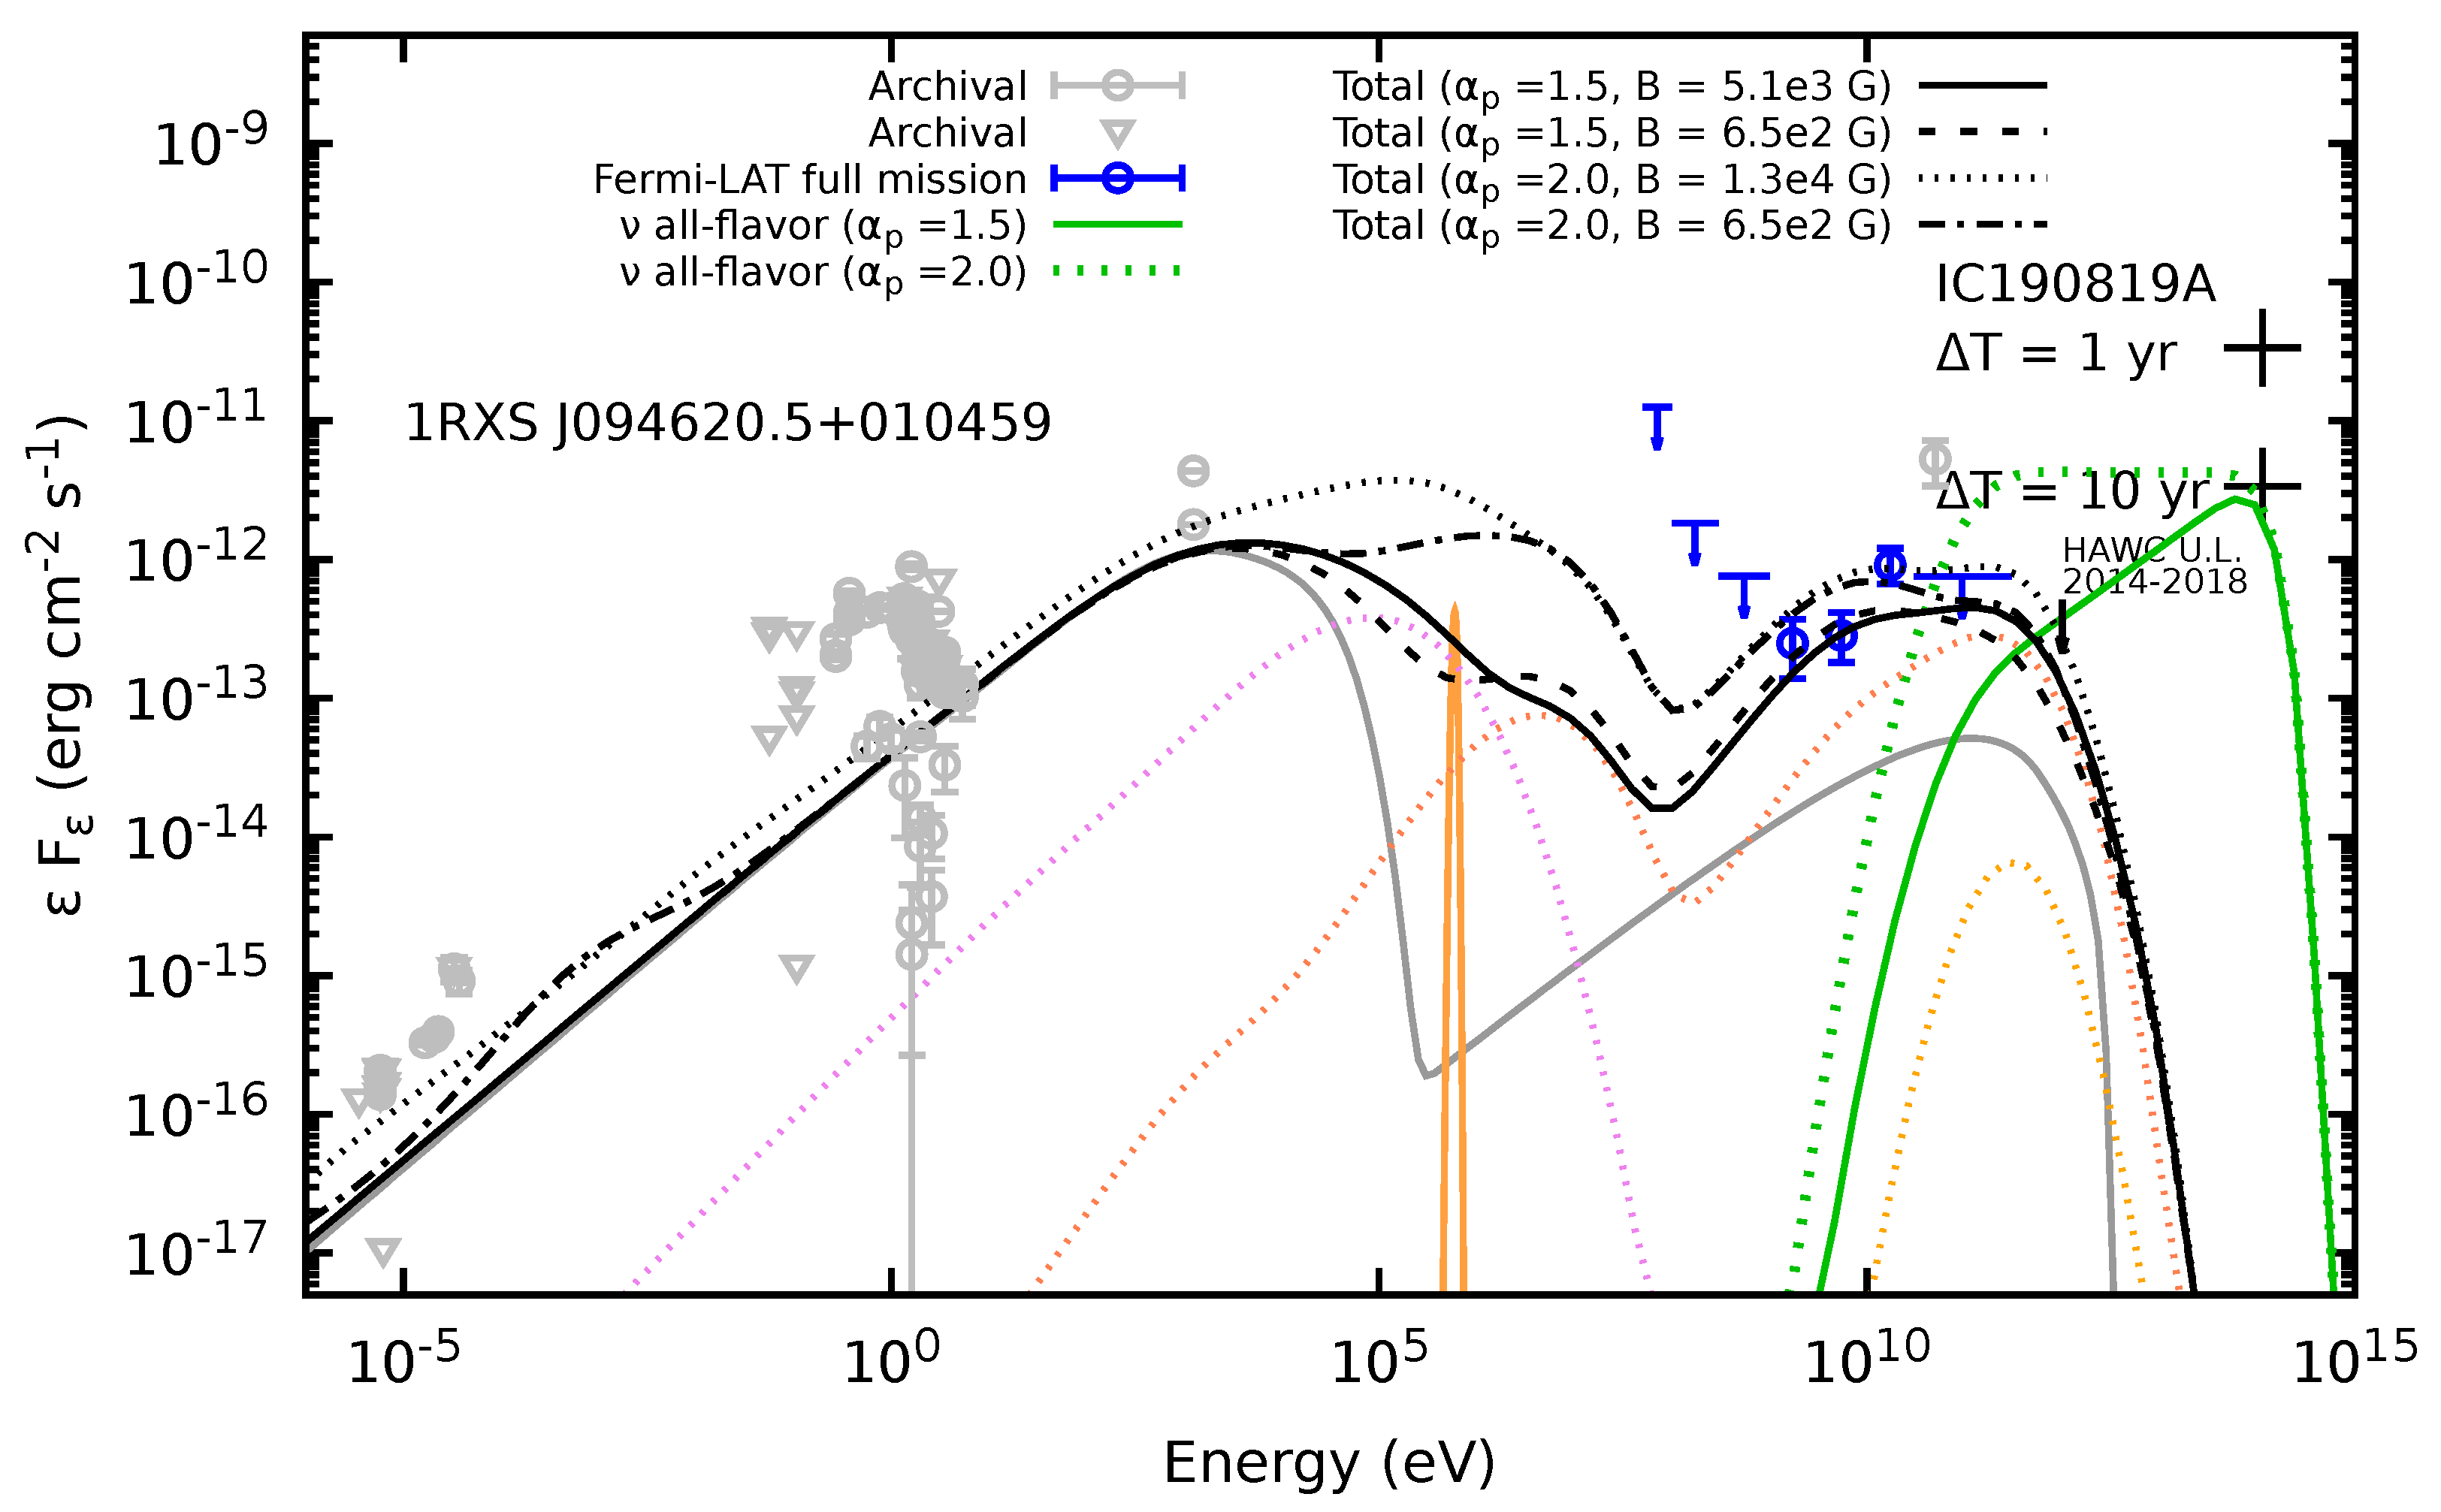
3.1.1. IC190819A and 1RXS J09462.5+010459

At 17:34:24.24 UT on 2019 August 19, bronze alert stream selected the track-like event identified by IceCube [80] with coordinates of R . A . = 148 . 54 3.30 + 2.29 and Dec = 1 . 45 0.75 + 0.93 , and reconstructed energy E ν ob = 113.16 TeV .
This neutrino event was discovered at the same location (within 2.01 degrees) as the object 4FGL J0946.2+0104 in the Large Area Telescope (LAT) (This instrument is onboard Fermi Satellite) catalog, which is linked to the EHSP BL Lac 1RXS J09462.5+010459. Analysis of the Fermi-LAT data on one-day, one-month, and months-to-years timescales revealed that this object did not exhibit an increase in the gamma-rays flux during the neutrino detection [81]. In addition, the High-Altitude Water Cerenkov (HAWC) observatory looked for both steady and transient sources near the neutrino alert site. Steady source searches in records from November 2014 to May 2018 yielded a 95 percent confidence level upper limit of E 2 d N / d E = 3.2 × 10 13 TeV cm 2 s 1 at 1 TeV for a spectral index of 2.3 [82]. Additionally, the INTErnational Gamma-Ray Astrophysics Laboratory (INTEGRAL) multi-MESSENGER collaboration reports that this neutrino event has no counterpart [83]. Finally, Figure 1 shows the light curve of 1RXS J09462.5+010459 for Fermi-LAT observations between October 2019 and February 2023. This figure also shows the time of neutrino IC190819A’s arrival. It is essential to observe that there is not notably strong flux variation of gamma rays over around the neutrino arrival.

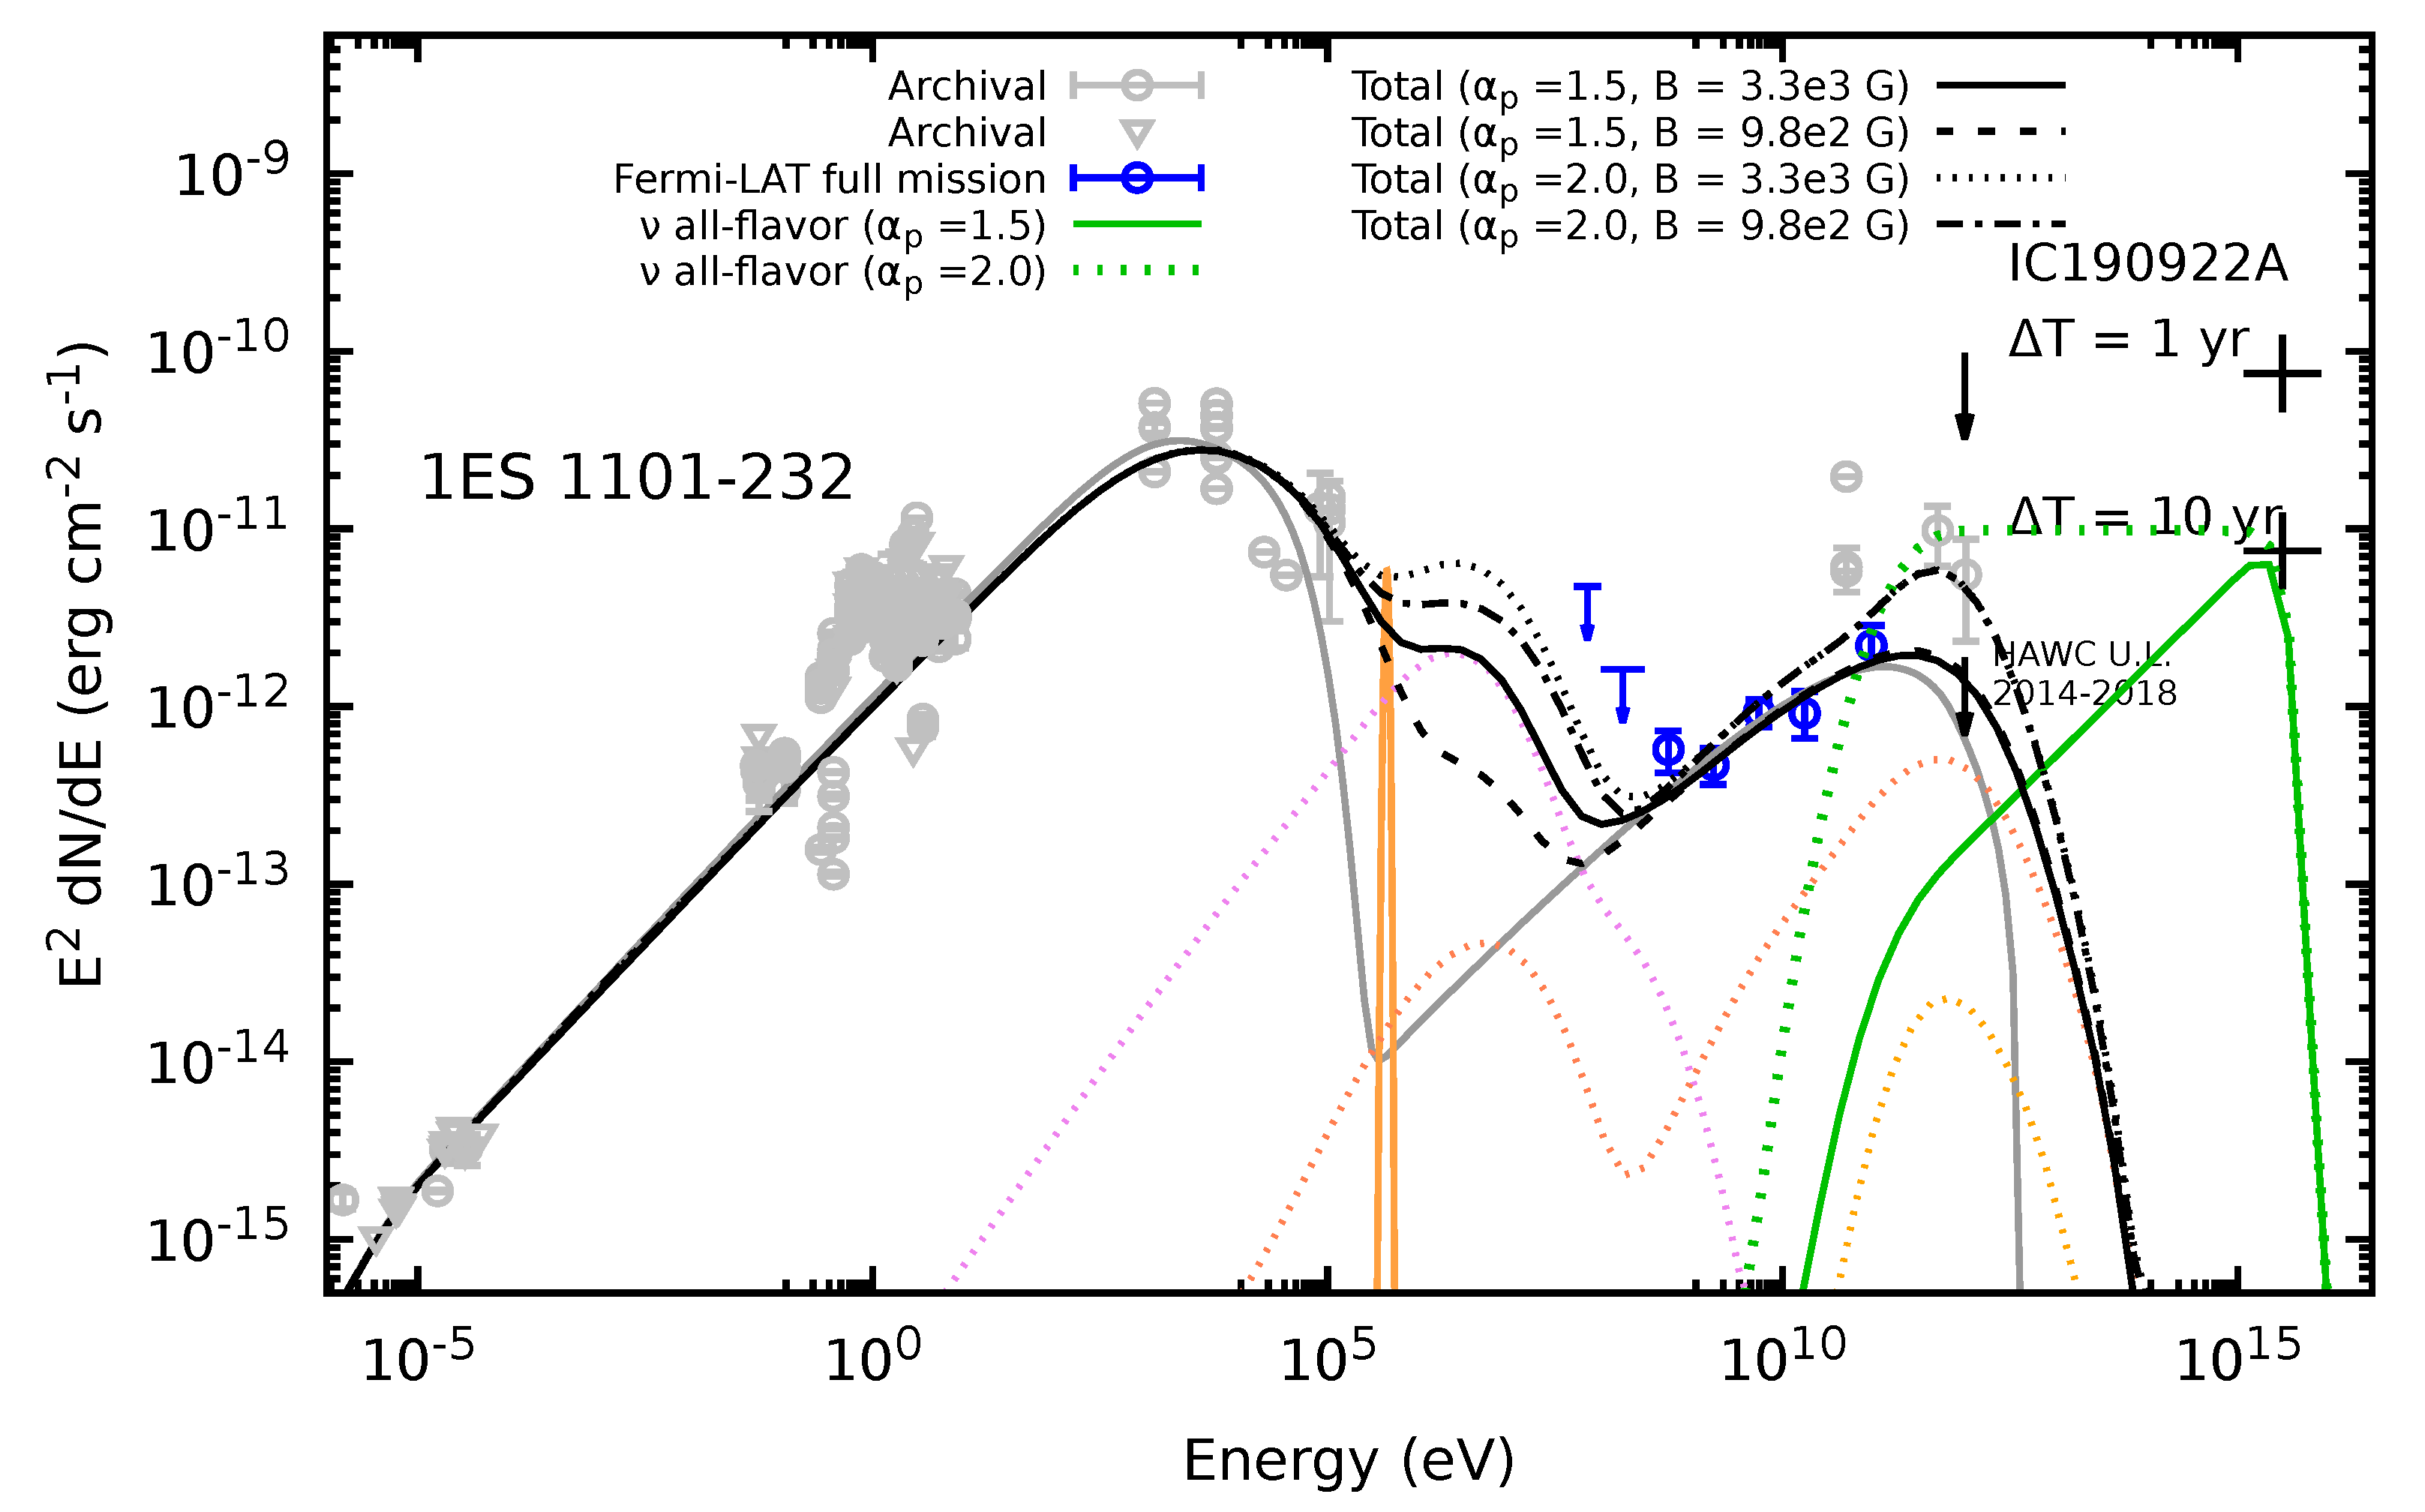
3.1.2. IC190922A and 1ES 1101-232

At 09:42:45.63 UT on 2019 September 22, IceCube detected a track-like event [84], which was chosen by the Gold alert stream, with position at R . A . = 167 . 30 2.72 + 2.81 and D e c = 22 . 27 3.31 + 3.39 and reconstructed energy E ν ob = 3.1 PeV . There are three gamma-ray sources in the 4FGL Fermi-LAT catalog that are within the 90% uncertainty region of the event. The distances from the best-fit location to the sources are 2.4 degrees for 4FGL J1120.0-2204, 2.8 degrees for 4FGL J1100.0-2044, and 1.77 degrees for 4FGL J1103.6-2329. The first two are unknown sources, while third is the EHPS BL Lac tagged as 1ES 1101-232 is the only known source among the three.
During the neutrino detection, these object did not show an increase in the flux of gamma rays, as shown by an analysis of the Fermi-LAT data on 1-day, 1-month, and months-to-years timescales [85]. In a similar vein, the HAWC observatory looked for both steady and transient sources around the neutrino alert location. Even though this neutrino was not inside HAWC’s field of view, the collaboration nonetheless searched for it in archival data from November 2014 to May 2018 and established a 95 confidence level of E 2 d N / d E = 1.2 × 10 12 TeV cm 2 s 1 at 1 TeV for a spectral index of 2.3 [86]. It has also been reported by the INTEGRAL multi-MESSENGER collaboration that this neutrino event has no counterpart. [87].
Finally, Figure 2 shows the light curve of 1ES 1101-232 for Fermi-LAT observatory observations between October 2010 and February 2023. This figure also shows the time of neutrino IC190922A’s arrival. It is essential to observe the flux variations of gamma rays over a period of ten years not notably strong.

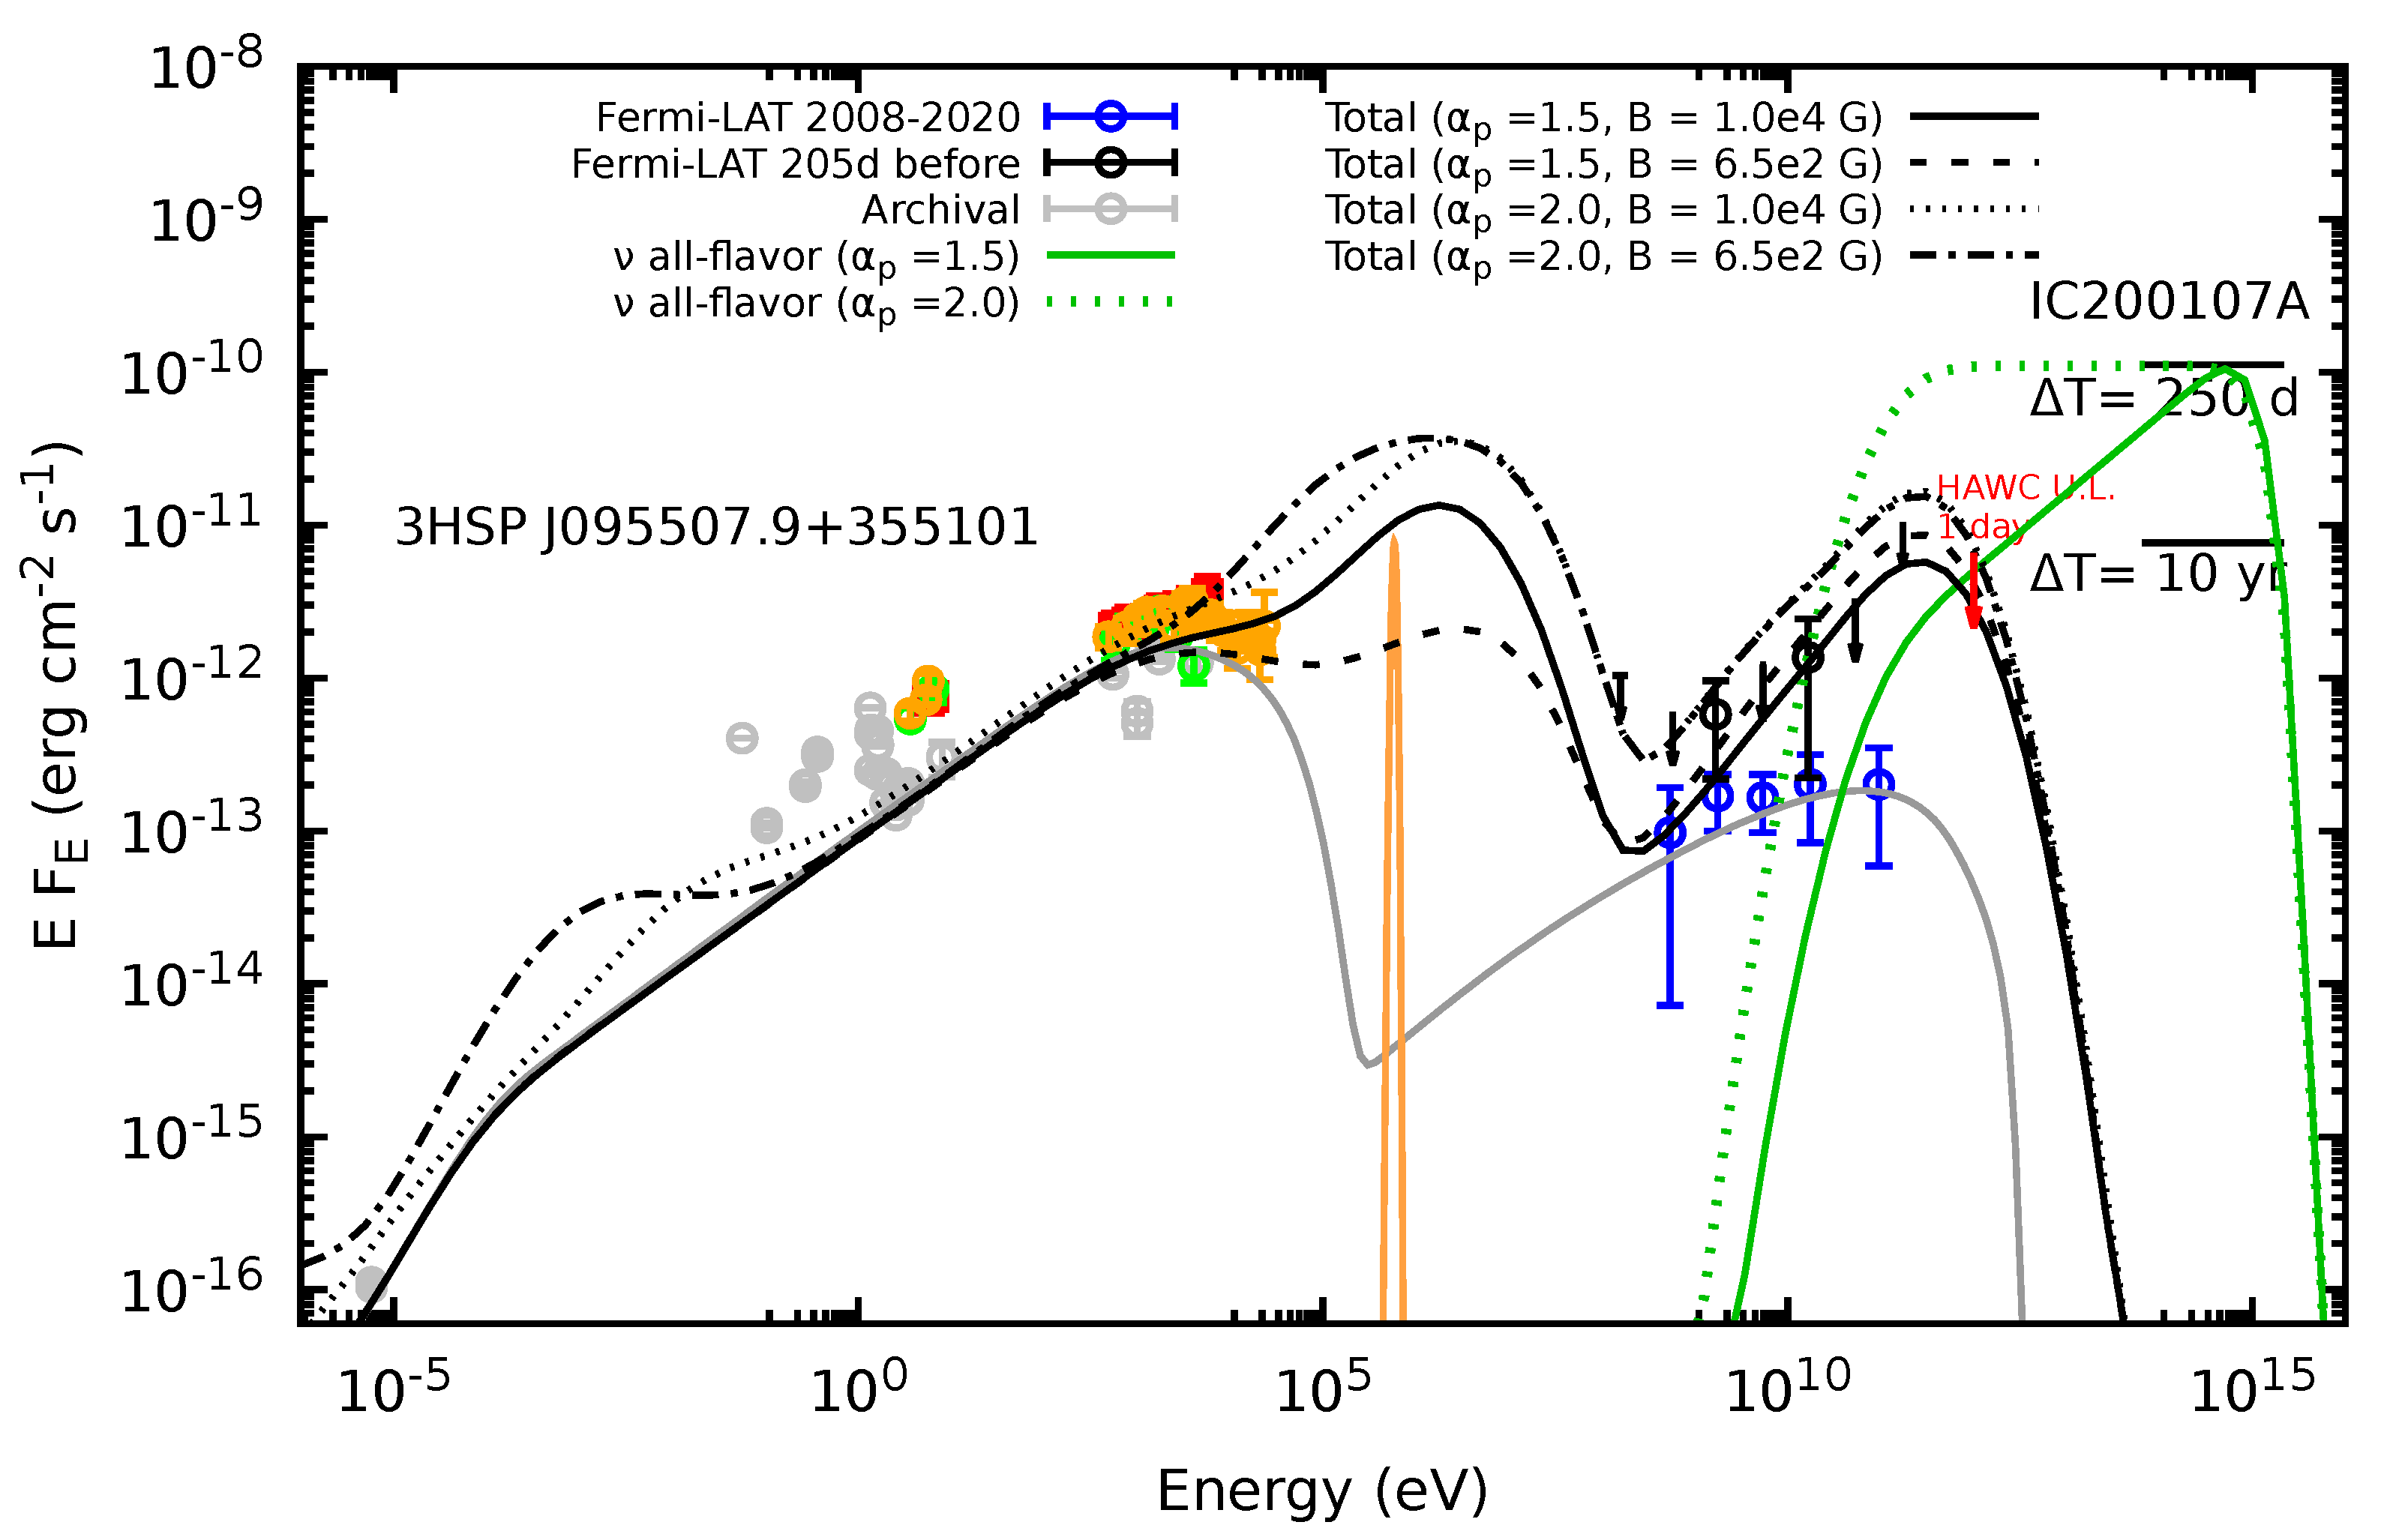
3.1.3. IC200107A and 3HSP J095507.9+355101

The new neural network classifier confirmed that a high-energy starting event detected by IceCube on 2020 January 07 at 09:42:18.36 UT, in fact, belong to the starting track event category, despite not matching the Bronze or Gold starting track classification [88]. R . A . = 1489 . 18 1.83 + 2.20 and D e c = 35 . 46 1.22 + 1.10 are the coordinates of the reconstructed arrival direction, and for a neutrino spectrum of E ν 2 , E ν ob = 333 TeV is the expected energy.
There are two Fermi 4FGL sources inside the 90% C.L. reconstructed arrival localization region: The nearest gamma-ray source is 4FGL J0955.1+3551 (3HSP J095507.9+355101), which is 0.63 deg from the best-fit event position. 4FGL J0957.8+3423 is a second source that is only 1.50 degrees from the best location of the event. Neither object showed any significant flux increases in subsequent observations with HAWC, Fermi-LAT, or INTEGRAL. Between 2020 January 07 06:02:39 UTC and 2020 January 07 12:24:01 UTC (∼ 6 h), HAWC reported an upper limit of 4.108 × 10 12 TeV cm 2 s 1 at 1 TeV [89]. Despite this, Swift observations show that 4FGL J0957.8+3423 had higher X-rays emission (observed 2−10 keV flux) during the neutrino observation than the archival data from 2012–2013 by a factor of 2.6 , indicating that the source was behaving in flaring state during the neutrino detection [90]. Nevertheless, the second source could not be identified, and only an upper limit was set.
Moreover, Ref. [91] highlights potential evidence for hour-scale flux variability in the X-ray band using NuSTAR and NICER light curves. This limits the size of the emission zone to less than R 3.5 × 10 14 cm D . Furthermore, as shown by the soft X-ray data the maximal intensity value is obtained after the neutrino detection and remains constant for nearly 30 days [78].

3.2. Modeling the SED of EHSP

In this section, for each EHSP, we use the model outlined in Section 2. The SSC model is used to describe the outer blob’s emission [92]. For the emission of the inner blob (where neutrinos are produced in our model), the following considerations are taken into account as a consequence of the earlier research works performed by [53,54]: the Doppler boost for a jet aligned with the line of sight is D i = 2.6 for Γ i = 1.5 , and the blob’s size is R i = 2 × 10 14 cm . Figure 3 shows the proton timescales for photopion, photopair, synchrotron, adiabatic, escape and acceleration processes. We calculate the photopion and photopair timescales by considering an annihilation line luminosity L keV = 3 × 10 44 erg s 1 and Γ i = 1.5 . The escape timescale was calculated considering a diffusion process, i.e., t esc R i 2 / ( 2 D diff ) where D diff 1 3 c η r L is the diffusion coefficient in the Bohm regime and r L = ε p / e B is the Larmor radius. As Figure 3 indicates photopion process is the most relevant below ∼1 PeV and ∼100 PeV when we consider a value of magnetic field B = 10 4 G and B = 10 3 G , respectively, while for higher energies synchrotron losses become the dominant process and suppressing photopion process. Using Equation (6), the maximal proton energy is calculated as a function of the observed neutrino’s energy,
ε p , max 0.67 PeV ( 1 + z ) E ν ob 100 TeV D i 3 1 .
By considering the monochromatic spectrum of the 511 keV annihilation line (see Equation (7)) and the photopion processes efficiency equation given in Equation (15), the photopion efficiency is determined to be
f p π ( ε p ) 0.06 Γ rel 1 R b 3 × 10 14 cm L keV 1 × 10 44 erg s 1 1 + ε p 427 GeV Γ rel 2 .
The proton luminosity is estimated using the relationship ε p L ε p ( 8 / 3 ) f p π 1 ε ν L ν , where luminosity of all-flavor neutrino for each event is estimated using the relationship E ν L E ν 12 π d L 2 E ν / ( Δ T ob A μ , eff ) , where Δ T ob is the observation time window, and A μ , eff is the effective area for muon neutrinos dependent of the neutrino energy and the neutrino declination and is given in [31].
Furthermore, the bolometric proton luminosity is estimated using the expresion,
L p 8 E ν obs L E ν obs 3 f p π D i 2 1 ( ε p , max / GeV ) α p 2 ( 2 α p ) α p 2 , log ( ε p , max / GeV ) α p = 2 .
We consider two different scenarios to model the SED, and we describe each one in the following.
  • Scenario A:
We use it to describe the steady state of EHSP BL Lacs where no significative electromagnetic signature was observed during the detection of the neutrino events (i.e., 1RXS J09462.5+010459 and 1ES 1101-232). For this scenario we consider the minimum requirement necessary to produce the annihilation line by the pair-plasma, L keV = 3 × 10 3 L Edd 1 × 10 44 erg s 1 [60]; It is important to note that in these circumstances, the photopion process has a value of f p π 0.1 . For these EHSP BL Lacs we take into account the available archival multifrequecy data in taken from https://tools.ssdc.asi.it/SED/ accessed on 1 May 2023.
  • Scenario B:
We use it to describe the multifrequency observations of 3HSP J095507.9+355101 during the detection of the neutrino event. We take into account the X-ray flaring state during the arrival of IC200107A to constrain the parameters of the inner blob; meanwhile the archival data is described by SSC emission in the outer blob. In this scenario, we assume the pair-plasma luminosity grows, L keV > 3 × 10 3 L Edd , and therefore the photopion efficiency improves to the point where it equals the unity, which happens for L keV 3 × 10 2 L Edd .
Finally we calculate the SED applying our model, and taking into account the magnetic field strength in the range of values suggested by the Equations (1) and (2). Furthermore, the distribution of stable particles will be broken if B i has a very large value, as secondary unstable charged particles created by photopion process may be cooled down by the synchrotron process before they decay. However, if the value of B i is very strong, secondary unstable charged particles produced by photopion processes, might cool down by synchrotron process before they decay into other particles; therefore, this must be reflected in a break in the stable particle distribution. The cooling timescale for muons and charged pions through synchrotron is comparable, however muons decay slower than charged pions, with a mean lifetime of τ μ = 2.197 × 10 6 s and a lifetime of τ π ± = 2.6 × 10 8 s , respectively [93]. As a result, we focus solely on muons, and the energy break can be roughly estimated by comparing the synchrotron loss timescale, t μ , syn 1 m e 2 σ T B i 2 ε μ / ( 6 π c m μ 4 ) , with the muon lifetime in the inner blob frame t l t , μ ε μ / ( m μ c 2 ) τ μ . Taking into account the fact that neutrinos only carry around a third of the energy of the parent muon [94], we predict that an energy break must occur in the observed all-flavor neutrino spectrum at
E ν , br ob 2 PeV ( 1 + z ) D i 3 B i 10 4 G 1 ,
as a result, this effect is only significant for PeV neutrinos and extremely strong magnetic fields. Furthermore, Figure 3 indicates that for such intense magnetic fields synchrotron losses becomes more relevant than photopion above ε p 1 PeV making hard the production of neutrinos with energies greater than
E ν , br obs 150 TeV 1 ( 1 + z ) D i 3 ,
therefore, PeV neutrinos (as the case of IC190922A) are produced more efficiently in environments with magnetic fields that no exceed B i 10 3 G .

3.2.1. 1RXS J09462.5+010459

1RXS J09462.5+010459 is located at a redshift z = 0.577 which corresponds to a luminosity distance of d L 3.48 Gpc . Using Equation (6), the maximum proton energy must be ε p , max 1.2 PeV 1 + z 1.577 E ν ob 113 TeV D i 3 1 , then we use 10 PeV. We model this EHSP BL Lac using historical data and use the scenario A, as it did not show any significant flux increases in any electromagnetic band. Using the effective area at the neutrino event’s energy, we calculate the all-flavor neutrino flux to be E ν F ν 5.9 × 10 12 erg cm 2 s 1 for Δ T ob = 10 yrs . This is equivalent to a neutrino luminosity E ν L E ν 8.52 × 10 45 erg s 1 . Then the proton luminosity at ε p , max 1.2 PeV is ε p L ε p | ε p , max 2.37 × 10 47 erg s 1 D i 4 with photopion efficiency equal to f p π 0.1 . Likewise, using Equation (36) and taking into account proton spectrum with α p 2 , the bolometric proton luminosities for α p = 1.5 and α p = 2 are L p 5 × 10 46 erg s 1 and L p 3.5 × 10 47 erg s 1 , respectively.
Using the parameters that describe the emission of the outer blob and Equation (1), the strength of magnetic field is B i 683 G ; But, if we use the equipartition condition given by Equation (2) and the proton luminosities above calculated, we obtain B i , eq 1.1 × 10 4 G and B i , eq 2.8 × 10 4 G for α p = 1.5 and α p = 2 , respectively. Observe that these values are one or two orders of magnitude greater than those derived from Equation (1). It is essential to note that with the larger value of B i predicted by the equipartition condition, the neutrino break must appear at ∼100 TeV energies (see Figure 3) then we adopt B i , max 1 × 10 4 G to explain the IC190819A. In this work, we use as limit values of our model in the SED of 1RXS J09462.5+010459: α p = 1.5 2 . and B i = 683 G to B i , max = 1 × 10 4 G for each case. Our results are plotted in Figure 4 and the parameters used to described the outer blob and the inner blob are listed in Table 2 and Table 3, respectively. Figure 4 shows our resulting SED for each case considered for this EHSP BL Lac. Our results indicate differences between each other especially in hard X-rays to MeV gamma-rays, where the model with α p = 2 and B i = 1 × 10 4 G produces the hardest X-ray spectrum, making it the most distinctive signature.

3.2.2. 1ES 1101-232

The redshift of 1ES 1101-232, which is spatially coincident with the neutrino event IC190922A, is z = 0.186 , which corresponds to a luminosity distance of d L 879 Mpc . Using Equation (6), the maximum proton energy is ε p , max 38.61 PeV 1 + z 1.186 E ν ob 3.114 PeV D i 3 1 , then we use 100 PeV. We model 1ES 1101-232 using the archival data as it did not show significant flux increases in any electromagnetic band. The associated all-flavor neutrino flux is E ν F ν 5.9 × 10 11 erg cm 2 s 1 and the corresponding neutrino luminosity is E ν L E ν 5.5 × 10 45 erg s 1 taking into account for a window time of 10 yrs. Applying the scenario A, the photopion efficiency is f p π 0.1 , hence the proton luminosity at ε p , max 38 PeV is ε p L ε p | ε p , max 1.4 × 10 47 D i 4 ergs 1 . Therefore the bolometric proton luminosities for α p = 1.5 and α p = 2 . are L p 2 × 10 46 erg s 1 and L p 1.6 × 10 47 erg s 1 , respectively.
Using the parameters that describe the emission of the outer blob and Equation (1), the strength of magnetic field is B i 986 G ; But, if we use the equipartition condition given by Equation (2) and the proton luminosities above calculated, we obtain B i , eq 8.6 × 10 3 G and B i , eq 2.5 × 10 4 G for α p = 1.5 and α p = 2 , respectively. It is important to be noted that the magnetic field cannot exceed B i , 1 × 10 3 G in order to successfully explain the energy of the neutrino event IC190922A and prevent the neutrino break (see Equation (37) and Figure 3).
Finally, similar to the case of 1RXS J09462.5+010459, we model the SED of 1ES 1101-232 using spectral indexes of α p = 1.5 2 . and magnetic field value of B i = 1 × 10 3 G . Figure 5 shows our results, and Table 2 and Table 3 enumerate the parameters used to describe the outer blob and the inner blob, respectively.
Our results are plotted in Figure 5 and the parameter used to described the outer blob and the inner blob are listed in Table 2 and Table 3, respectively. The results shown in Figure 5 indicate that for the cases considered, there are electromagnetic differences, particularly in the MeV and GeV energy bands, where cases with α p = 2 produce higher fluxes than those with α p = 1.5 . Hence, models with α p = 2 may be ruled out because the resulting flux exceeds of HAWC’s upper limit (UL) set between November 2014 and May 2018.

3.2.3. 3HSP J095507.9+355101

In the third high-synchrotron peaked catalog [95], the BL Lac 3HSP J095507.9+355101 is classified as a HSP BL Lac. It is located at a redshift z = 0.557 [66,91], corresponding to a luminosity distance d L 3.33 Gpc .
The maximum proton energy assumed for the rationale of IC200107A is ε p , max 3.4 PeV 1 + z 1.557 E ν ob 333 TeV D i 3 1 , then we use 10 PeV.
In contrast to the two other EHSP, this one exhibits an increase in X-ray flux during neutrino detection, and the light curves indicate that it remains constant for at least thirty days after neutrino arrival [78]. The fact that neutrinos were produced during flaring implies that the luminosity of neutrinos must be significantly greater than that required for a window time of 10 yrs. In our analysis, we therefore consider a time window of Δ T = 250 days , hence the all-flavor neutrino luminosity is E ν L E ν 4.7 × 10 47 erg s 1 (Our approximate values are comparable to those reported by [78], they calculate the bolometric neutrino luminosity for 30 days, 250 days and 10 yrs obtaining L ν 4 × 10 48 erg s 1 , 5 × 10 47 erg s 1 , 3 × 10 46 erg s 1 , respectively). Hence, in the context of scenario B and the previously mentioned neutrino luminosity, the bolometric proton luminosities for α p = 1.5 and α p = 2 are L p 2.7 × 10 47 erg s 1 and L p 2.1 × 10 48 erg s 1 , respectively.
During this flaring state, the equipartion magnetic field is in the range B i , eq ( 2.5 7.0 ) × 10 4 G . However, such an intense magnetic field prohibits the production of neutrinos as energetic as the IC200107A event. To avoid muons cooled by synchrotron losses, the magnetic field’s maximal value must be less than B i , max 1 × 10 4 G (see Equation (37)). On the other hand, using the Equation (1), the strength of magnetic field is B i 655 G .
We use the following values to model the SED of 3HSP J095507.9+355101: α p = 1.5 2 and B i = ( 0.66 10 ) × 10 3 G . Finally, our results are shown in Figure 6, and Table 2 and Table 3 list the parameter used to describe the outer blob and inner blob, respectively.
Figure 6 demonstrates that our model produces different results depending on the selection of the set of parameters, with the most significant differences occurring in the radio/IR, MeV, and VHE gamma-rays bands, where models with α p = 2 predict higher fluxes than those with α p = 1.5 . Therefore, during future observations of blazar flares and neutrino events, the radio/infrared signature produced by the photopair process could be utilized to test our model. It is important to note that our results indicate that the evolution of X-rays can be explained by varying the magnetic field strength from B i 655 G to ≈ 2 × 10 4 G while keeping α p = 1.5 constant. In addition, our results indicate that none of our hypotheses can account for the ultraviolet (UV) emission observed during neutrino detection, indicating that this phenomenon may result from a different mechanism.

4. Discussion and Conclusions

This work proposes a two-zone model to describe the probable relationship between EHSP BL Lacs and track-neutrino detection. We have demonstrated that a recent model proposed by AR2022 and AR2023 may adequately characterize the SED of these objects. In contrast to AR2022, we have considered the emission of secondary pairs produced by photohadronic processes (photopion and photopair). This emission peaks in the hard X-ray band and extends to GeV gamma rays for ε p , max 10 100 PeV .
Such emission could generate a signature in the MeV band that could be detected by future telescopes such as AMEGO or eASTROGAM, mainly either during electromagnetic flare episodes in BL Lacs or intense HE-neutrino flares. In general, our results indicate that our model provides a reasonable explanation for the SED of EHSP from X-rays to gamma-rays and its connection with HE-neutrino observations under the assumption of a prolonged steady state lasting 10 yr . However, in the case of 1RXS J09462.5+010459, our model fails to adequately explain the data in the radio to optical wavelength range. Important to mention that in this work, we do not consider the emission produced by the host-galaxy, which can remove part of the discrepancy between our model and optical data [15].
During flare states, such as 3HSP J095507.9+35510, our model can explain the X-ray spectrum’s hardening due to proton-synchrotron and synchrotron emission of photopion secondary pairs. However, our model cannot explain the UV-to-soft-X-ray flux observed during the neutrino arrival, which may indicate that it is produced by a mechanism not discussed here.
The bolometric proton luminosities required to explain the broadband emission of 1RXS J09462.5+010459 and 1ES 1101-232 are a factor of ∼2 greater and less than the Eddington limit, respectively (∼0.4 × 10 47 erg s 1 assuming a SMBH mass M = 3 × 10 8 M ) considering f p π 0.1 and α p = 1.5 . However, the situation changes when we attempt to correlate the neutrino event IC200107A with 3HSP J095507.9+355101 within a 250 days time window, i.e., the required luminosity is L p ( 3.7 26.6 ) × 10 47 erg s 1 even with the maximum process efficiency f p π 1 . In general, a harder proton distribution provides a better explanation for the SED considered in this work demanding lower jet power than softer cases. Hadronic models requiring proton luminosities greater than Eddington limit have been pointed out as unavoidable implications for modeling blazar’s SED, especially for proton-synchrotron scenario [96], although leptohadronic models offer moderate jet’s power for EHSP (e.g., [97]), TeV emission and neutrinos events association demands higher power than Eddington limit (e.g., [51,52,98]). Despite Eddington luminosity provides an estimation of the maximum jet’s power, it may not be a strict limit, and its violation might occur as a result of non-spherical geometry or the presence of various types of instabilities (i.e., [99]). Therefore our results of HE-neutrino production in EHSP’s jets under our scenario may suggest another type of accretion in such environments.
A crucial and essential aspect of our model is the existence of a 511 keV annihilation line, which is the source of the seed photons for photohadronic interactions. This emission has been observed in micro-quasars and may also exist in SMBH phenomena. In fact, for two EHSPs modeled as steady state, no signature in any electromagnetic frequency can be distinguished from the SSC contribution. The annihilation line is the only characteristic that can be used to test our model. However, this feature is not always observable, especially during intense flare states when masked by the synchrotron emission of protons and secondary pairs, as in 3HSP J095507.9+35510.
In this study, we have considered the minimum luminosity required to generate an optical depth environment that leads to the formation of the annihilation ∼ 1 × 10 44 erg s 1 . During the flaring state, however, we have supposed this value should be higher, ≳ 3 × 10 45 erg s 1 , to achieve the maximum photopion efficiency, f p π 1 .
The increase in the luminosity of the annihilation line implies an increase in the optical depth to pair-creation via photon-photon collision in the MeV-to-GeV energy range. Out of this band, gamma-rays led to a signature that is not entirely attenuated and can be used to constrain our model with future observations; see Figure 5 and Figure 6. However, we have not considered the effect of the broad-line region, which could reduce the flux at VHE energies. Unfortunately, observations do not reveal evidence of the existence of such region, and only for 3HSP J095507.9+35510 an upper limit, L BLR < 3 × 10 3 L Edd , is determined. In 3HSP J095507.9+35510, the tentative evidence of rapid variability timescales suggests an emitting region size of R 3.5 × 10 14 cm lends support to our model because our proposed inner blob has comparable typical sizes.
We have estimated the value of the magnetic field based on the magnetic field conservation and the equipartition value. However, this has only provided an approximation, and there is no way to know the exact value. In addition, we have determined the maximum value so that secondary muons do not lose energy via the synchrotron mechanism to decay into lesser neutrino energies. The set of suggested magnetic field values for 1RXS J09462.5+010459 and 1ES 1101-232 does not significantly affect our results. However, the situation for 3HSP J095507.9+355101 needs to be clarified because our model generates diverse signatures depending on the chosen option. Nevertheless, for cases with α p = 1.5 , the X-ray evolution flux can be interpreted as variations in the values of B i .

Author Contributions

Conceptualization, visualization, and investigation, E.A.-R. and A.G.-G.; writing—original draft preparation, methodology and software, E.A.-R.; data curation, A.G.-G.; validation, supervision, resources, N.F.; All authors have read and agreed to the published version of the manuscript.

Funding

This research was funded by UNAM-DGAPA-PAPIIT through grant IN106521.

Data Availability Statement

No new data were created or analyzed in this study. Data sharing is not applicable to this article. Data is contained within the article.

Acknowledgments

We express our gratitude to the anonymous referee for their meticulous examination of the paper and insightful recommendations, which greatly enhanced the excellence and lucidity of our manuscript. We also thank to Markus Adler, Antonio Marinelli, Francis Halzen and Ignacio Taboada for useful discussions.

Conflicts of Interest

The authors declare no conflict of interest.

References

  1. Blandford, R.D.; Königl, A. Relativistic jets as compact radio sources. Astrophys. J. 1979, 232, 34–48. [Google Scholar] [CrossRef]
  2. Marcha, M.J.M.; Browne, I.W.A.; Impey, C.D.; Smith, P.S. Optical spectroscopy and polarization of a new sample of optically bright flat radio spectrum sources. Mon. Not. RAS 1996, 281, 425–448. [Google Scholar] [CrossRef]
  3. Ghisellini, G.; Maraschi, L.; Tavecchio, F. The Fermi blazars’ divide. Mon. Not. RAS 2009, 396, L105–L109. [Google Scholar] [CrossRef]
  4. Abdo, A.A.; Ackermann, M.; Ajello, M.; Atwood, W.B.; Axelsson, M.; Baldini, L.; Ballet, J.; Barbiellini, G.; Bastieri, D.; Baughman, B.M.; et al. Bright Active Galactic Nuclei Source List from the First Three Months of the Fermi Large Area Telescope All-Sky Survey. Astrophys. J. 2009, 700, 597–622. [Google Scholar] [CrossRef]
  5. Aartsen, M.G.; et al. [IceCube Collaboration] Neutrino emission from the direction of the blazar TXS 0506+056 prior to the IceCube-170922A alert. Science 2018, 361, 147–151. [Google Scholar] [CrossRef]
  6. Aartsen, M.G.; et al. [IceCube Collaboration] Multimessenger observations of a flaring blazar coincident with high-energy neutrino IceCube-170922A. Science 2018, 361, eaat1378. [Google Scholar] [CrossRef]
  7. Wagner, S.J.; Witzel, A. Intraday Variability In Quasars and BL Lac Objects. Annu. Rev. Astron Astrophys. 1995, 33, 163–198. [Google Scholar] [CrossRef]
  8. Ulrich, M.H.; Maraschi, L.; Urry, C.M. Variability of Active Galactic Nuclei. Annu. Rev. Astron Astrophys. 1997, 35, 445–502. [Google Scholar] [CrossRef]
  9. Padovani, P.; Giommi, P. The connection between x-ray- and radio-selected BL Lacertae objects. Astrophys. J. 1995, 444, 567–581. [Google Scholar] [CrossRef]
  10. Ghisellini, G.; Celotti, A.; Costamante, L. Low power BL Lacertae objects and the blazar sequence. Clues on the particle acceleration process. Astron. Astrophys. 2002, 386, 833–842. [Google Scholar] [CrossRef]
  11. Sambruna, R.M.; Maraschi, L.; Urry, C.M. On the Spectral Energy Distributions of Blazars. Astrophys. J. 1996, 463, 444. [Google Scholar] [CrossRef]
  12. Abdo, A.A.; Ackermann, M.; Agudo, I.; Ajello, M.; Aller, H.D.; Aller, M.F.; Angelakis, E.; Arkharov, A.A.; Axelsson, M.; Bach, U.; et al. The spectral energy distribution of Fermi bright blazars. Astrophys. J. 2010, 716, 30–70. [Google Scholar] [CrossRef]
  13. Costamante, L.; Ghisellini, G.; Giommi, P.; Tagliaferri, G.; Celotti, A.; Chiaberge, M.; Fossati, G.; Maraschi, L.; Tavecchio, F.; Treves, A.; et al. Extreme synchrotron BL Lac objects. Stretching the blazar sequence. Astron. Astrophys. 2001, 371, 512–526. [Google Scholar] [CrossRef]
  14. Tavecchio, F.; Ghisellini, G.; Bonnoli, G.; Foschini, L. Extreme TeV blazars and the intergalactic magnetic field. Mon. Not. RAS 2011, 414, 3566–3576. [Google Scholar] [CrossRef]
  15. Costamante, L.; Bonnoli, G.; Tavecchio, F.; Ghisellini, G.; Tagliaferri, G.; Khangulyan, D. The NuSTAR view on hard-TeV BL Lacs. Mon. Not. RAS 2018, 477, 4257–4268. [Google Scholar] [CrossRef]
  16. Ahnen, M.L.; et al. [MAGIC Collaboration] Extreme HBL behavior of Markarian 501 during 2012. Astron. Astrophys. 2018, 620, A181. [Google Scholar] [CrossRef]
  17. Aharonian, F.A. The time averaged TeV energy spectrum of MKN 501 of the extraordinary 1997 outburst as measured with the stereoscopic Cherenkov telescope system of HEGRA. Astron. Astrophys. 1999, 349, 11–28. [Google Scholar] [CrossRef]
  18. Archambault, S.; Archer, A.; Beilicke, M.; Benbow, W.; Bird, R.; Biteau, J.; Bouvier, A.; Bugaev, V.; Cardenzana, J.V.; Cerruti, M.; et al. VERITAS Detection of γ-Ray Flaring Activity from the BL Lac Object 1ES 1727+502 during Bright Moonlight Observations. Astrophys. J. 2015, 808, 110. [Google Scholar] [CrossRef]
  19. Ahnen, T.M.L. MAGIC detection of very high energy γ-ray emission from the low-luminosity blazar 1ES 1741+196. Mon. Not. RAS 2017, 468, 1534–1541. [Google Scholar] [CrossRef]
  20. Biteau, J.; Prandini, E.; Costamante, L.; Lemoine, M.; Padovani, P.; Pueschel, E.; Resconi, E.; Tavecchio, F.; Taylor, A.; Zech, A. Progress in unveiling extreme particle acceleration in persistent astrophysical jets. Nat. Astron. 2020, 4, 124–131. [Google Scholar] [CrossRef]
  21. Vraeghe, M.; Aartsen, M.G.; Walck, C.; Abbasi, R.; Waldenmaier, T.; Abdou, Y.; Wallraff, M.; Ackermann, M.; Wasserman, R.; Adams, J.; et al. First Observation of PeV-Energy Neutrinos with IceCube. Phys. Rev. Lett. 2013, 111, 021103. [Google Scholar] [CrossRef]
  22. Aartsen, M.G.; et al. [IceCube Collaboration] Evidence for High-Energy Extraterrestrial Neutrinos at the IceCube Detector. Science 2013, 342, 1242856. [Google Scholar] [CrossRef]
  23. Aartsen, M.G.; et al. [IceCube Collaboration] The IceCube Neutrino Observatory—Contributions to ICRC 2017 Part II: Properties of the Atmospheric and Astrophysical Neutrino Flux. arXiv 2017, arXiv:1710.01191. [Google Scholar]
  24. Aartsen, M.G.; Ackermann, M.; Adams, J.; Aguilar, J.A.; Ahlers, M.; Ahrens, M.; Alispach, C.; Andeen, K.; Anderson, T.; Ansseau, I.; et al. Characteristics of the diffuse astrophysical electron and tau neutrino flux with six years of IceCube high energy cascade data. arXiv 2020, arXiv:2001.09520. [Google Scholar] [CrossRef]
  25. Abbasi, R.; Ackermann, M.; Adams, J.; Aguilar, J.A.; Ahlers, M.; Ahrens, M.; Alispach, C.; Alves, A.A., Jr.; Amin, N.M.; Andeen, K.; et al. IceCube high-energy starting event sample: Description and flux characterization with 7.5 years of data. Phys. Rev. D 2021, 104, 022002. [Google Scholar] [CrossRef]
  26. Aartsen, M.G.; Abraham, K.; Ackermann, M.; Adams, J.; Aguilar, J.A.; Ahlers, M.; Ahrens, M.; Altmann, D.; Andeen, K.; Anderson, T.; et al. Observation and Characterization of a Cosmic Muon Neutrino Flux from the Northern Hemisphere Using Six Years of IceCube Data. Astrophys. J. 2016, 833, 3. [Google Scholar] [CrossRef]
  27. Haack, C.; et al. [IceCube Collaboration] A measurement of the diffuse astrophysical muon neutrino flux using eight years of IceCube data. In Proceedings of the 35th International Cosmic Ray Conference (ICRC2017), Busan, Republic of Korea, 12–20 July 2017; Volume 301, p. 1005. [Google Scholar]
  28. Stettner, J. Measurement of the diffuse astrophysical muon-neutrino spectrum with ten years of IceCube data. In Proceedings of the 36th International Cosmic Ray Conference (ICRC2019), Madison, WA, USA, 24 July–1 August 2019; Volume 36, p. 1017. [Google Scholar] [CrossRef]
  29. Abbasi, R.; Ackermann, M.; Adams, J.; Agarwalla, S.K.; Aguilar, J.A.; Ahlers, M.; Alameddine, J.M.; Amin, N.M.; Andeen, K.; Anton, G.; et al. IceCat-1: The IceCube Event Catalog of Alert Tracks. Astrophys. J. Suppl. 2023, 269, 25. [Google Scholar] [CrossRef]
  30. Abbasi, R.; et al. [IceCube Collaboration] Improved Characterization of the Astrophysical Muon-neutrino Flux with 9.5 Years of IceCube Data. Astrophys. J. 2022, 928, 50. [Google Scholar] [CrossRef]
  31. Abbasi, R.; et al. [IceCube Collaboration] Evidence for neutrino emission from the nearby active galaxy NGC 1068. Science 2022, 378, 538–543. [Google Scholar] [CrossRef]
  32. Becker, J.K. High-energy neutrinos in the context of multimessenger astrophysics. Phys. Rep. 2008, 458, 173–246. [Google Scholar] [CrossRef]
  33. Ahlers, M.; Halzen, F. High-energy cosmic neutrino puzzle: A review. Rep. Prog. Phys. 2015, 78, 126901. [Google Scholar] [CrossRef]
  34. Gao, S.; Fedynitch, A.; Winter, W.; Pohl, M. Modelling the coincident observation of a high-energy neutrino and a bright blazar flare. Nat. Astron. 2019, 3, 88–92. [Google Scholar] [CrossRef]
  35. Xue, R.; Liu, R.Y.; Wang, Z.R.; Ding, N.; Wang, X.Y. A Two-zone Blazar Radiation Model for “Orphan” Neutrino Flares. Astrophys. J. 2021, 906, 51. [Google Scholar] [CrossRef]
  36. Liu, R.Y.; Wang, K.; Xue, R.; Taylor, A.M.; Wang, X.Y.; Li, Z.; Yan, H. Hadronuclear interpretation of a high-energy neutrino event coincident with a blazar flare. Phys. Rev. D 2019, 99, 063008. [Google Scholar] [CrossRef]
  37. Fraija, N.; Aguilar-Ruiz, E.; Galván-Gámez, A. Electron-positron pair plasma in TXS 0506+056 and the ’neutrino flare’ in 2014–2015. Mon. Not. RAS 2020, 497, 5318–5325. [Google Scholar] [CrossRef]
  38. Halzen, F.; Kheirandish, A.; Weisgarber, T.; Wakely, S.P. On the Neutrino Flares from the Direction of TXS 0506+056. Astrophys. J. Lett. 2019, 874, L9. [Google Scholar] [CrossRef]
  39. Keivani, A.; Murase, K.; Petropoulou, M.; Fox, D.B.; Cenko, S.B.; Chaty, S.; Coleiro, A.; DeLaunay, J.J.; Dimitrakoudis, S.; Evans, P.A.; et al. A Multimessenger Picture of the Flaring Blazar TXS 0506+056: Implications for High-energy Neutrino Emission and Cosmic-Ray Acceleration. Astrophys. J. 2018, 864, 84. [Google Scholar] [CrossRef]
  40. Reimer, A.; Böttcher, M.; Buson, S. Cascading Constraints from Neutrino-emitting Blazars: The Case of TXS 0506+056. Astrophys. J. 2019, 881, 46. [Google Scholar] [CrossRef]
  41. Rodrigues, X.; Gao, S.; Fedynitch, A.; Palladino, A.; Winter, W. Leptohadronic Blazar Models Applied to the 2014–2015 Flare of TXS 0506+056. Astrophys. J. Lett. 2019, 874, L29. [Google Scholar] [CrossRef]
  42. Padovani, P.; Petropoulou, M.; Giommi, P.; Resconi, E. A simplified view of blazars: The neutrino background. Mon. Not. RAS 2015, 452, 1877–1887. [Google Scholar] [CrossRef]
  43. Buson, S.; Tramacere, A.; Pfeiffer, L.; Oswald, L.; de Menezes, R.; Azzollini, A.; Ajello, M. Beginning a Journey Across the Universe: The Discovery of Extragalactic Neutrino Factories. Astrophys. J. Lett. 2022, 933, L43. [Google Scholar] [CrossRef]
  44. Giommi, P.; Glauch, T.; Padovani, P.; Resconi, E.; Turcati, A.; Chang, Y.L. Dissecting the regions around IceCube high-energy neutrinos: Growing evidence for the blazar connection. arXiv 2020, arXiv:2001.09355. [Google Scholar] [CrossRef]
  45. Bellenghi, C.; Padovani, P.; Resconi, E.; Giommi, P. Correlating High-energy IceCube Neutrinos with 5BZCAT Blazars and RFC Sources. Astrophys. J. Lett. 2023, 955, L32. [Google Scholar] [CrossRef]
  46. Abbasi, R.; et al. [IceCube Collaboration] Search for Correlations of High-energy Neutrinos Detected in IceCube with Radio-bright AGN and Gamma-Ray Emission from Blazars. Astrophys. J. 2023, 954, 75. [Google Scholar] [CrossRef]
  47. Padovani, P.; Resconi, E.; Giommi, P.; Arsioli, B.; Chang, Y.L. Extreme blazars as counterparts of IceCube astrophysical neutrinos. Mon. Not. RAS 2016, 457, 3582–3592. [Google Scholar] [CrossRef]
  48. Padovani, P.; Resconi, E. Are both BL Lacs and pulsar wind nebulae the astrophysical counterparts of IceCube neutrino events? Mon. Not. RAS 2014, 443, 474–484. [Google Scholar] [CrossRef]
  49. Petropoulou, M.; Dimitrakoudis, S.; Padovani, P.; Mastichiadis, A.; Resconi, E. Photohadronic origin of γ-ray BL Lac emission: Implications for IceCube neutrinos. Mon. Not. RAS 2015, 448, 2412–2429. [Google Scholar] [CrossRef]
  50. Giommi, P.; Glauch, T.; Resconi, E. Swift observation of a flaring very extreme blazar in the error region of the high-energy neutrino Ice-Cube 200107A. Astron. Telegr. 2020, 13394, 1. [Google Scholar]
  51. Petropoulou, M.; Oikonomou, F.; Mastichiadis, A.; Murase, K.; Padovani, P.; Vasilopoulos, G.; Giommi, P. Comprehensive Multimessenger Modeling of the Extreme Blazar 3HSP J095507.9+355101 and Predictions for IceCube. Astrophys. J. 2020, 899, 113. [Google Scholar] [CrossRef]
  52. Acharyya, A.; et al. [The VERITAS Collaboration] Multiwavelength Observations of the Blazar PKS 0735+178 in Spatial and Temporal Coincidence with an Astrophysical Neutrino Candidate IceCube-211208A. Astrophys. J. 2023, 954, 70. [Google Scholar] [CrossRef]
  53. Aguilar-Ruiz, E.; Fraija, N.; Galván-Gámez, A.; Benítez, E. A two-zone model as origin of hard TeV spectrum in extreme BL lacs. Mon. Not. RAS 2022, 512, 1557–1566. [Google Scholar] [CrossRef]
  54. Aguilar-Ruiz, E.; Fraija, N.; Galván-Gámez, A. High-energy neutrino fluxes from hard-TeV BL Lacs. J. High Energy Astrophys. 2023, 38, 1–11. [Google Scholar] [CrossRef]
  55. Di Gesu, L.; Marshall, H.L.; Ehlert, S.R.; Kim, D.E.; Donnarumma, I.; Tavecchio, F.; Liodakis, I.; Kiehlmann, S.; Agudo, I.; Jorstad, S.G.; et al. Discovery of X-ray polarization angle rotation in the jet from blazar Mrk 421. Nat. Astron. 2023, 7, 1245–1258. [Google Scholar] [CrossRef]
  56. Liodakis, I.; Marscher, A.P.; Agudo, I.; Berdyugin, A.V.; Bernardos, M.I.; Bonnoli, G.; Borman, G.A.; Casadio, C.; Casanova, V.; Cavazzuti, E.; et al. Polarized blazar X-rays imply particle acceleration in shocks. Nature 2022, 611, 677–681. [Google Scholar] [CrossRef]
  57. Aghanim, N.; et al. [Planck Collaboration] Planck 2018 results. VI. Cosmological parameters. Astron. Astrophys. 2020, 641, A6. [Google Scholar] [CrossRef]
  58. Stecker, F.W.; Baring, M.G.; Summerlin, E.J. Blazar γ-rays, Shock Acceleration, and the Extragalactic Background Light. Astrophys. J. Lett. 2007, 667, L29–L32. [Google Scholar] [CrossRef]
  59. Caprioli, D. Cosmic-ray acceleration in supernova remnants: Non-linear theory revised. J. Cosmol. Astropart. Phys. 2012, 2012, 038. [Google Scholar] [CrossRef]
  60. Beloborodov, A.M. Electron-positron outflows from gamma-ray emitting accretion discs. Mon. Not. RAS 1999, 305, 181–189. [Google Scholar] [CrossRef]
  61. Svensson, R. The pair annihilation process in relativistic plasmas. Astrophys. J. 1982, 258, 321–334. [Google Scholar] [CrossRef]
  62. Sarkar, S.; Chattopadhyay, I. Pair production and annihilation in advective accretion disks around black holes. J. Phys. Conf. Ser. 2020, 1640, 012022. [Google Scholar] [CrossRef]
  63. Boettcher, M.; Schlickeiser, R. Pair annihilation radiation from relativistic jets in γ-ray blazars. Astron. Astrophys. 1996, 306, 86. [Google Scholar]
  64. Plotkin, R.M.; Markoff, S.; Trager, S.C.; Anderson, S.F. Dynamical black hole masses of BL Lac objects from the Sloan Digital Sky Survey. Mon. Not. RAS 2011, 413, 805–812. [Google Scholar] [CrossRef]
  65. León-Tavares, J.; Valtaoja, E.; Chavushyan, V.H.; Tornikoski, M.; Añorve, C.; Nieppola, E.; Lähteenmäki, A. The connection between black hole mass and Doppler boosted emission in BL Lacertae type objects. Mon. Not. RAS 2011, 411, 1127–1136. [Google Scholar] [CrossRef]
  66. Paiano, S.; Falomo, R.; Padovani, P.; Giommi, P.; Gargiulo, A.; Uslenghi, M.; Rossi, A.; Treves, A. The redshift and the host galaxy of the neutrino candidate 4FGL J0955.1+3551 (3HSP J095507.9+355101). Mon. Not. RAS 2020, 495, L108–L111. [Google Scholar] [CrossRef]
  67. Dermer, C.D.; Menon, G. High Energy Radiation from Black Holes: Gamma Rays, Cosmic Rays, and Neutrinos; Princeton University Press: Princeton, NJ, USA, 2009; p. 568. [Google Scholar]
  68. Kelner, S.R.; Aharonian, F.A. Energy spectra of gamma rays, electrons, and neutrinos produced at interactions of relativistic protons with low energy radiation. Phys. Rev. D 2008, 78, 034013. [Google Scholar] [CrossRef]
  69. Stecker, F.W. Effect of Photomeson Production by the Universal Radiation Field on High-Energy Cosmic Rays. Phys. Rev. Lett. 1968, 21, 1016–1018. [Google Scholar] [CrossRef]
  70. Ahlers, M.; Halzen, F. IceCube: Neutrinos and multimessenger astronomy. Prog. Theor. Exp. Phys. 2017, 2017, 12A105. [Google Scholar] [CrossRef]
  71. Blumenthal, G.R. Energy Loss of High-Energy Cosmic Rays in Pair-Producing Collisions with Ambient Photons. Phys. Rev. D 1970, 1, 1596–1602. [Google Scholar] [CrossRef]
  72. Chodorowski, M.J.; Zdziarski, A.A.; Sikora, M. Reaction Rate and Energy-Loss Rate for Photopair Production by Relativistic Nuclei. Astrophys. J. 1992, 400, 181. [Google Scholar] [CrossRef]
  73. Mastichiadis, A.; Protheroe, R.J.; Kirk, J.G. Spectral and temporal signatures of ultrarelativistic protons in compact sources. I. Effects of Bethe-Heitler pair production. Astron. Astrophys. 2005, 433, 765–776. [Google Scholar] [CrossRef]
  74. Petropoulou, M.; Mastichiadis, A. Bethe-Heitler emission in BL Lacs: Filling the gap between X-rays and γ-rays. Mon. Not. RAS 2015, 447, 36–48. [Google Scholar] [CrossRef]
  75. Ghisellini, G.; Tavecchio, F.; Maraschi, L.; Celotti, A.; Sbarrato, T. The power of relativistic jets is larger than the luminosity of their accretion disks. Nature 2014, 515, 376–378. [Google Scholar] [CrossRef] [PubMed]
  76. Marscher, A.P.; Jorstad, S.G.; D’Arcangelo, F.D.; Smith, P.S.; Williams, G.G.; Larionov, V.M.; Oh, H.; Olmstead, A.R.; Aller, M.F.; Aller, H.D.; et al. The inner jet of an active galactic nucleus as revealed by a radio-to-gamma-ray outburst. Nature 2008, 452, 966–969. [Google Scholar] [CrossRef] [PubMed]
  77. Walker, R.C.; Hardee, P.E.; Davies, F.B.; Ly, C.; Junor, W. The Structure and Dynamics of the Subparsec Jet in M87 Based on 50 VLBA Observations over 17 Years at 43 GHz. Astrophys. J. 2018, 855, 128. [Google Scholar] [CrossRef]
  78. Giommi, P.; Padovani, P.; Oikonomou, F.; Glauch, T.; Paiano, S.; Resconi, E. 3HSP J095507.9+355101: A flaring extreme blazar coincident in space and time with IceCube-200107A. Astron. Astrophys. 2020, 640, L4. [Google Scholar] [CrossRef]
  79. Blaufuss, E.; Kintscher, T.; Lu, L.; Tung, C.F. The Next Generation of IceCube Real-time Neutrino Alerts. In Proceedings of the 36th International Cosmic Ray Conference (ICRC2019), Madison, WA, USA, 24 July–1 August 2019; Volume 36, p. 1021. [Google Scholar]
  80. Abbasi, R.; et al. [IceCube Collaboration] IceCube-190819A—IceCube Observation of a High-Energy Neutrino Candidate Event; GRB Coordinates Network: Washington, DC, USA, 2019; Volume 25402, p. 1. [Google Scholar]
  81. Garrappa, S.; et al. [Fermi-LAT Collaboration] Fermi-LAT Gamma-ray Observations of IceCube-190819A; GRB Coordinates Network: Washington, DC, USA, 2019; Volume 25420, p. 1. [Google Scholar]
  82. Galvan, A.; et al. [HAWC Collaboration] IceCube-190819A—HAWC Follow-Up; GRB Coordinates Network: Washington, DC, USA, 2019; Volume 25411, p. 1. [Google Scholar]
  83. Molkov, S.; et al. [INTEGRAL Multi-MESSENGER Collaboration] IceCube-190819A: No Counterpart Candidates in INTEGRAL SPI-ACS Prompt Observation; GRB Coordinates Network: Washington, DC, USA, 2019; Volume 25403, p. 1. [Google Scholar]
  84. Abbasi, R.; et al. [IceCube Collaboration] IceCube-190922A—IceCube Observation of a High-Energy Neutrino Candidate Event; GRB Coordinates Network: Washington, DC, USA, 2019; Volume 25802, p. 1. [Google Scholar]
  85. Garrappa, S.; et al. [Fermi-LAT Collaboration] Fermi-LAT Gamma-ray Observations of IceCube-190922B; GRB Coordinates Network: Washington, DC, USA, 2019; Volume 25838, p. 1. [Google Scholar]
  86. Galvan, A.; et al. [HAWC Collaboration] IceCube-190922A—HAWC Follow-Up; GRB Coordinates Network: Washington, DC, USA, 2019; Volume 25805, p. 1. [Google Scholar]
  87. Onori, F.; et al. [INTEGRAL Multi-MESSENGER Collaboration] IceCube-190922A: No Counterpart Candidates in INTEGRAL SPI-ACS Prompt Observation; GRB Coordinates Network: Washington, DC, USA, 2019; Volume 25803, p. 1. [Google Scholar]
  88. Abbasi, R.; et al. [IceCube Collaboration] IceCube-200107A: IceCube Observation of a High-Energy Neutrino Candidate Event; GRB Coordinates Network: Washington, DC, USA, 2020; Volume 26655, p. 1. [Google Scholar]
  89. Ayala, H.; et al. [HAWC Collaboration] IceCube-200107A: No Significant Detection in HAWC; GRB Coordinates Network: Washington, DC, USA, 2020; Volume 26668, p. 1. [Google Scholar]
  90. Krauss, F.; Gregoire, T.; Fox, D.B.; Kennea, J.; Evans, P. Swift Follow-Up Observations of IceCube-200107A: Identification of X-ray High State for 4FGL J0955.1+3551; GRB Coordinates Network: Washington, DC, USA, 2020; Volume 26691, p. 1. [Google Scholar]
  91. Paliya, V.S.; Böttcher, M.; Olmo-García, A.; Domínguez, A.; Gil de Paz, A.; Franckowiak, A.; Garrappa, S.; Stein, R. Multifrequency Observations of the Candidate Neutrino-emitting Blazar BZB J0955+3551. Astrophys. J. 2020, 902, 29. [Google Scholar] [CrossRef]
  92. Finke, J.D.; Dermer, C.D.; Böttcher, M. Synchrotron Self-Compton Analysis of TeV X-ray-Selected BL Lacertae Objects. Astrophys. J. 2008, 686, 181–194. [Google Scholar] [CrossRef]
  93. Zyla, P.A.; et al. [Particle Data Group] Review of Particle Physics. Prog. Theor. Exp. Phys. 2020, 2020, 083C01. [Google Scholar] [CrossRef]
  94. Lipari, P.; Lusignoli, M.; Meloni, D. Flavor composition and energy spectrum of astrophysical neutrinos. Phys. Rev. D 2007, 75, 123005. [Google Scholar] [CrossRef]
  95. Chang, Y.L.; Arsioli, B.; Giommi, P.; Padovani, P.; Brandt, C.H. The 3HSP catalogue of extreme and high-synchrotron peaked blazars. Astron. Astrophys. 2019, 632, A77. [Google Scholar] [CrossRef]
  96. Liodakis, I.; Petropoulou, M. Proton Synchrotron Gamma-Rays and the Energy Crisis in Blazars. Astrophys. J. Lett. 2020, 893, L20. [Google Scholar] [CrossRef]
  97. Cerruti, M.; Zech, A.; Boisson, C.; Inoue, S. A hadronic origin for ultra-high-frequency-peaked BL Lac objects. Mon. Not. RAS 2015, 448, 910–927. [Google Scholar] [CrossRef]
  98. Cao, G.; Wang, J. The Hadronic Origin of the Hard Gamma-ray Spectrum from Blazar 1ES 1101-232. Astrophys. J. 2014, 783, 108. [Google Scholar] [CrossRef]
  99. Brightman, M.; Bachetti, M.; Earnshaw, H.P.; Fürst, F.; García, J.; Grefenstette, B.; Heida, M.; Kara, E.; Madsen, K.K.; Middleton, M.J.; et al. Breaking the limit: Super-Eddington accretion onto black holes and neutron stars. Bull. AAS 2019, 51, 352. [Google Scholar] [CrossRef]
Figure 1. Two light curves for 1RXS J094620.5+010459, obtained with the Fermi−LAT and the ASAS−SN Telescopes, are displayed, covering the time period from October 2010 to February 2023. An illustration of neutrino event IC190819A is shown in red. The yellow shadow zone represents average count rate with a significance level of 1 σ over 10 year of observation.
Galaxies 11 00117 g001
Figure 2. The 1ES 1101-232 light curves for the Fermi−LAT, Swift−BAT, and ASAS−SN Telescopes are displayed from October 2010 to February 2023. An illustration of neutrino event IC190922A is shown in red. The yellow shadow zone represents average count rate with a significance level of 1 σ over 10 year of observation.
Galaxies 11 00117 g002
Figure 3. Proton timescales in the comoving frame for photopion (red line), photopair (orange line), synchrotron (pink lines), adiabatic (green line), escape via diffusion (magenta line) and acceleration (blue line) processes. For photopion and photopair processes we consider the seed photons from the pair-plasma with an annihilation line luminosity L keV = 3 × 10 3 L Edd , and boost Lorentz factor of the blob Γ i = 1.5 . The vertical dashed line indicates the proton energy at 1 PeV.
Galaxies 11 00117 g003
Figure 4. The neutrino fluxes for spectral indexes of 1.5 and 2 is displayed in web-green color with solid and dotted line, respectively. The results of modeling the SED of 1RXS 094620.5+010459 for various spectral indexes and magnetic fields are presented with black lines (solid, dashed, dotted, and dotted-dashed). Moreover, an orange line designates the annihilation line. In addition, we illustrate the contribution of SSC in the outer blob (gray line), the gamma-rays after correction for the EBL attenuation effects (orange dotted line), the synchrotron of photohadronic pairs (salmon dotted line), and the synchrotron of protons (violet dotted line) for the model with α p = 1.5 and B i = 1 × 10 4 G .
Galaxies 11 00117 g004
Figure 5. The black lines (solid, dashed, dotted, and dotted-dashed) represent the results of modeling the SED of 1ES 1101-232 for different spectral index and magnetic fields; the corresponding neutrino fluxes for spectral indices of 1.5 and 2 are shown in web-green color (solid and dotted line). In addition, the annihilation line emission is drawn in orange. The contribution of the SSC in the outer blob (grey line), the resultant gamma rays after EBL attenuation (orange dotted line), the synchrotron of photohadronic pairs (salmon dotted line), and proton synchrotron (violet dotted line) are all illustrated for the model with α p = 1.5 .
Galaxies 11 00117 g005
Figure 6. Neutrino fluxes for spectral indices of 1.5 and 2 are shown in web-green color (solid and dotted lines), and the results of modeling the SED of 3HSPJ095507.9+355101 assuming a time window for the neutrino event of 250 days are presented with black lines (solid, dashed, dotted, and dotted−dashed). Also, an orange line represents the annihilation line, and a grey solid line represents the SSC’s contribution from the outer blob.
Galaxies 11 00117 g006
Table 1. This table shows the neutrino events utilized for this study. The neutrino event appears in column (1). The value in column (2) represents the reconstructed neutrino energy. The coordinates for the best fit given for right ascension and declination are displayed in columns (3) and (4). Column (5) is the effective area of muon neutrinos at the neutrino energy event [29,79]. The EHSP BL Lac associated with each neutrino event is shown in column (6). Column (7) is the synchrotron peak frequency. Column (8) is the redshift. Column (9) is the luminosity distance and column (10) is the all-favor neutrino luminosity level at the observed neutrino energy, which is calculated using 10 yrs of window time.
HE-Neutrino E ν R.A.Dec A μ , eff Coincident EHSP BL Lac ν syn pk z d L E ν L E | E ν ob
(PeV) (deg) (deg) ( m 2 ) ( 10 17 Hz) (Gpc) ( 10 45 erg s 1 )
(1) (2) (3) (4) (5) (6) (7) (8) (9) (10)
IC190819A0.113 148 . 54 3.30 + 2.29 1 . 45 0.75 + 0.93 29.261RXS J09462.5+010459 6.16 0.5773.476 8.52
IC190922A 3.114 167 . 30 2.72 + 2.81 22 . 27 3.31 + 3.39 128.861ES 1101-232 3.40 0.1860.879 5.48
IC200107A0.330 a 1480 . 18 1.83 + 2.20 35 . 46 1.22 + 1.10 20.853HSP J095507.9+3551015 (≳20 b )0.5573.332 32.28
a This values was calculated assuming a E 2 neutrino spectrum, however if the spectrum is taken as E 1 and E 2.7 then neutrinos have energies of 1 . 40 1.22 + 5.75 PeV and 0 . 16 0.12 + 0.83 PeV , respectively [78]. b The blazar was discovered to be in a very hard and flaring state at the time of the neutrino detection, moving the peak to extremely high levels [78].
Table 2. Parameters used to model the outer blob during the steady state of EHSP BL Lac coincident with track-like neutrino events.
Outer Blob
1RXS J09462.5+0104591ES 1101-2323HSP J095507.9+355101
Γ o 55 5.0
D o 101010
R [ 10 16 cm ] 6.5 6.5 3.2
B [ G ] 0.23 0.23 0.31
K e [ cm 3 ] 0.9 × 10 1 1.7 × 10 1 5.8 × 10 2
γ e , min 11050
γ e , br [ 10 5 ] 222
γ e , max [ 10 6 ] 111
α e , 1 1.8 1.9 2.1
α e , 2 3.2 3.2 3.2
L e ob [ 10 45 erg s 1 ] 3.6 5.51 7.62
L B ob [ 10 46 erg s 1 ] 1.62 3.35 1.47
U B / U e 4.56.081.93
Table 3. Parameters used to model the inner blob of EHSP BL Lac coincident with track-like neutrino events.
Inner Blob
1RXS J09462.5+010459
(Scenario A)
1ES 1101-232
(Scenario A)
3HSP J095507.9+355101
(Scenario B)
Γ i 1.5 1.5 1.5
D i 2.6 2.6 2.6
R [ 10 14 cm ] 333
ε p , min [ GeV ] 111
ε p , max [ PeV ] 1010010
α p 1.5 2 1.5 2 1.5 2
K p [ 10 5 cm 3 GeV 1 ] 2.4 2.7 × 10 3 0.26 1.3 × 10 3 1.8 3.5 × 10 3
L p [ 10 47 erg s 1 ] 0.68 5.3 0.26 2.3 3.7 26.6
B i [ 10 3 G ] 0.65 10.0 0.65 10.0 0.5 11 0.66 10 0.66 10
L B [ 10 46 erg s 1 ] 0.31 7.1 0.31 7.1 0.0 . 17 0.69 0.69 0.31 7.1 0.31 7.1
U B / U p 4.5 × 10 2 10.4 5.8 × 10 3 1.3 6 × 10 2 0.26 3 × 10 2 8 × 10 3 1.9 1.1 × 10 3 1.9
Disclaimer/Publisher’s Note: The statements, opinions and data contained in all publications are solely those of the individual author(s) and contributor(s) and not of MDPI and/or the editor(s). MDPI and/or the editor(s) disclaim responsibility for any injury to people or property resulting from any ideas, methods, instructions or products referred to in the content.

